stock enhancement program for black sea bream
TRANSCRIPT

Stock enhancement program for black sea bream (Acanthopagrus schlegelii) in
Hiroshima Bay: monitoring the genetic effects
Enrique Blanco Gonzalez, Kazuya Nagasawa, Tetsuya Umino*
Laboratory of Aquaculture, Graduate School of Biosphere Science, Hiroshima University,
1-4-4 Kagamiyama, Higashi-Hiroshima 739-8528, Japan
*Corresponding author: Tel & fax: +81-824-24-7944; E-mail: [email protected]

Abstract
Black sea bream have been intensively stocked in Hiroshima Bay since 1982.
However, no information regarding the long-term effects resulting from the release of
large numbers of juveniles on the wild population has been reported. We investigated the
fate of black sea bream juveniles released at the sampling site from 2000 to 2001 using
six microsatellite DNA markers. In 2003 and 2004 respectively, 12.5 and 13.5% of
captured black sea bream were identified as hatchery reared. Variation in total length by
age between the released and native stocks was not statistically significant. Low FST
values confirmed high genetic similarity between wild and hatchery stocks. Pedigree
reconstruction confirmed a small loss of genetic variability, with a final inbreeding rate
for recaptured fish of around 3% per year, rising to 4% when both years were combined.
There was high survival of released black sea bream juveniles. Some of these specimens
reached maturity and may have hybridized with their wild counterparts, highlighting the
need to monitor the genetic effects of releasing large number of juveniles.
Keywords: black sea bream, Acanthopagrus schlegelii, stock enhancement, genetic
diversity, pedigree, microsatellite DNA
1. Introduction
Enhancement programs have been proposed as a means to increase the biomass of
depleted fishery stocks (Tringali and Bert, 1998; Liao, 1999). The contribution of
releasing fingerlings into natural environments has been widely examined through
external tagging studies. However, the loss of such tags and the slower growth rates of
released individuals compared to their wild counterparts often limits the usefulness of
such studies for long term population assessments (Blankenship and Leber, 1995;
Støttrup et al., 2002; Sánchez-Lamadrid, 2004).
Recently, concerns about the possible genetic effects of released have become a
focal point when evaluating the effectiveness of enhancement programs. Of particular
concern is the possibility of genetic drift derived from releasing hatchery reared fish
(Tringali and Berth, 1998; Pérez-Enriquez et al., 1999; Ortega-Villaizán et al., 2006). The
necessity of using large numbers of non-related wild individuals, with a proximate
genetic composition to the wild stock, as breeders has been also emphasized (Taniguchi,
2004). Long-term monitoring was also proposed as a routine practice (Blankenship and
Leber, 1995; Liao, 1999). Araki et al. (2007) reconstructed a three-generation pedigree
for steelhead trout reared in captivity and subsequently bred in the wild. They reported a
significant reduction in fitness, and warned of the risk of using multiple generations of
hatchery reared broodstock to supplement natural populations.
Microsatellite DNA markers are acknowledged as very powerful genetic markers
for studies of population genetics, evolutionary relationships, and gene mapping
(Goldstein and Schlötterer, 1999). They are also suitable for monitoring changes in
genetic diversity and tracing the pedigree in aquaculture operations (O’Connell and

Wright, 1997; Norris et al., 1999). The minute quantities of biological material needed,
which minimizes trauma to the fish (Garcia de León et al., 1997), and their permanence
as “tags”, means that the analysis of microsatellite DNA is a very useful tool for genetic
studies.
Parentage assignment has been widely applied to high value commercial species
under hatchery conditions by screening a small number of microsatellite DNA markers
(Pérez-Enriquez et al., 1999; Norris et al., 2000; Sekino et al., 2003; Borrell et al., 2004;
Jeong et al., 2007). However, the number of studies that have examined recaptured
specimens is very limited. Low recapture rates have been attributed to fish mortality and
dispersion (Ortega-Villaizán et al., 2005, 2006).
Black sea bream, Acanthopagrus schlegelii, are one of the main fishery resources
in Hiroshima Bay, an area intensively subjected to intensive stocking since 1982. The
effectiveness of the stock enhancement program for black sea bream in Hiroshima Bay is
traditionally evaluated by measuring the increment in landings or by using external tags
(Yamashita et al., 1997; Umino et al., 1999). DNA markers have been used to assess the
genetic variability between wild and hatchery-stocked black sea bream (Jeong et al., 2002,
2003). Recently, after tracing the pedigree of the juveniles used in stocking, Jeong et al.
(2007) evaluated their survival rate during the critical period following the release.
However, no information regarding the long-term genetic impacts of releasing large
numbers of fingerlings into the natural stock is available. Therefore, further studies are
required in order to clarify growth and maturation rates of hatchery reared juveniles as
well as their contributions to the future generations.
This paper represents the first study monitoring the effects of the stock
enhancement program conducted in a sparid species by using microsatellite DNA
markers. Moreover, considering that black sea bream in Hiroshima Bay become mature at
3 years of age (Kinoshita, 1936, 1939), these results suggest that some of the previously
released juveniles may have become part of the spawning stock. This experience may be
of high relevance for fishery management as it provides an insight of the possible genetic
impact of released fish on future generations of wild stocks.
2. Materials and methods
2.1. Fish rearing and recapture
The broodstock comprised 29 dams and 22 sires (Br, n=51) originated from wild
captives and hatchery strains reared at the Hiroshima City Marine Products Promotion
Center (HCMPPC). Since the beginning of the enhancement program in 1982, the
broodstock at the HCMPPC has been changed every three to four years.
Each year, fertilized eggs were collected on one night during the spawning peak
in May, and reared in indoor tanks. The larvae were then transferred to net cages for
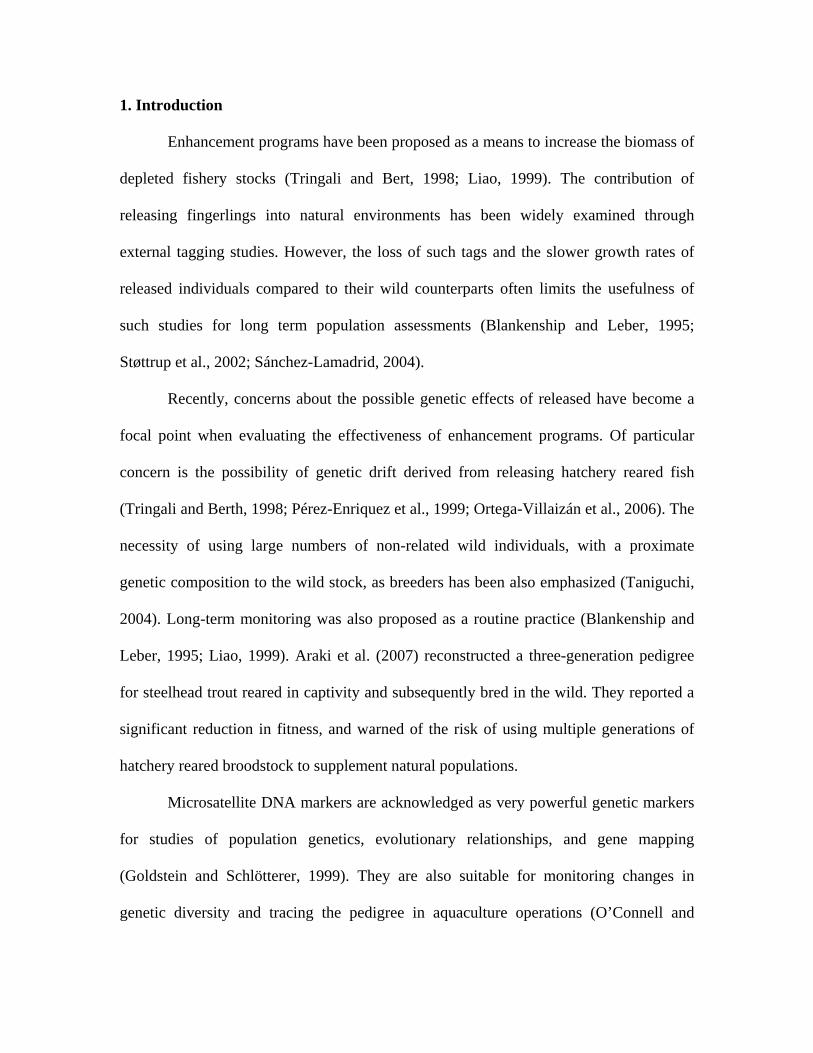
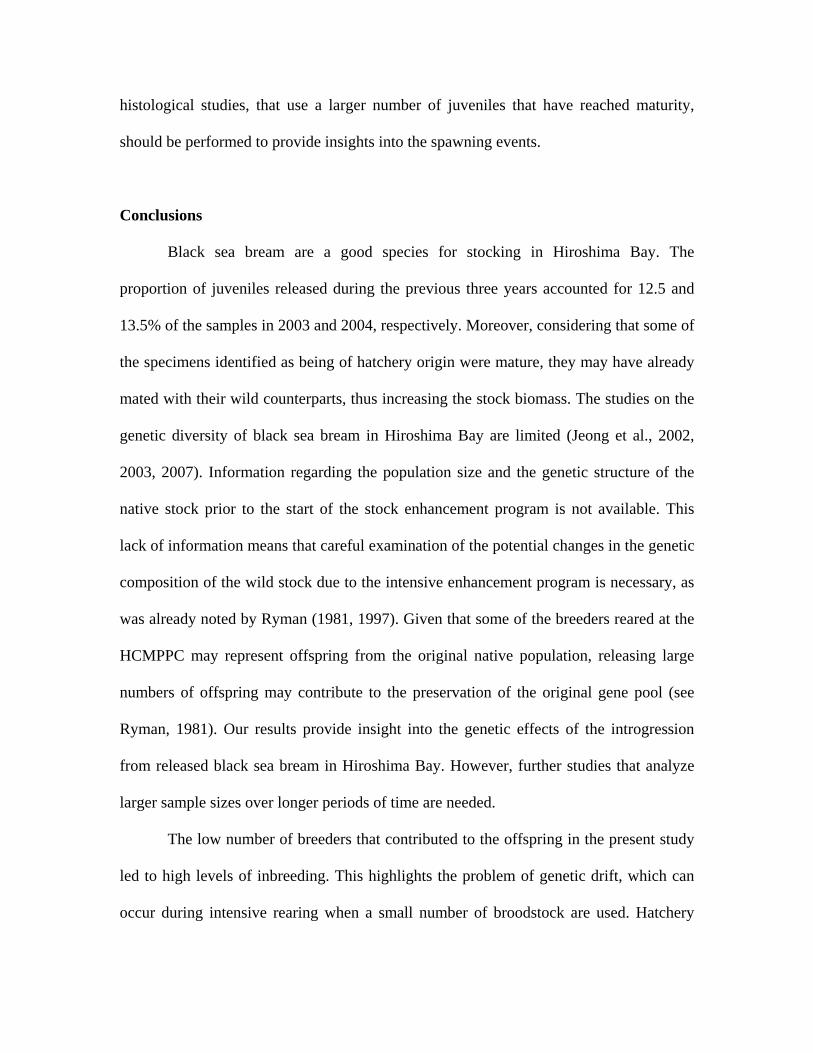
intermediate culture at Daio Bay, a small cove off Ninoshima Island in the Seto Inland
Sea of Japan (Fig. 1). Afterwards, a total of 20,000 juveniles, averaging 4 cm in total
length (TL), were randomly selected for release at Daio Bay each year over a three year
period (2000-2002).
During the spawning season, a total of 90 specimens in 2003 and 117 in 2004
were collected at the release site by angling (Table 1). Considering the release period,
only individuals aged 1-3 years in the 2003 sample and 2-4 years in the 2004 sample

could be the previously released offspring. After aging the samples (scale-reading), the
total number of potential hatchery reared offspring was adjusted to 80 and 104 for the
2003 and 2004 samples respectively. TL, body weight (BW), sex and gonadal weight
(GW) were recorded for each specimen.
2.2. DNA extraction and microsatellite PCR
Muscle tissue from the specimens collected in 2003 and 2004 was prepared for
DNA extraction by immersion in 95% ethanol and storage at 4ºC. DNA was obtained
following the standard SDS-phenol/chloroform procedure described by Taggart et al.
(1992). The amplification was performed by the PCR using six loci (ACS3, ACS4, ACS6,
ACS9, ACS16, ACS17) isolated for the same species. The total reaction volume was 10 µl,
according to the TaKaRa Ex Taq™ kit (TaKaRa BIO INC). The reaction was carried out
at primer-specific annealing temperatures (see Jeong et al., 2007).
2.3. Fluorescent genotyping
Fragment separation of amplified DNA was performed on an ABI PRISM® 377
DNA Sequencer (Applied Biosystems) by adding 1 µl of PCR product to 2.25 µl of
loading buffer GeneScanTM 400HD [ROXTM DYE] internal lane size standard (Applied
Biosystems). The mixture was denatured for 3 min at 95ºC prior to electrophoresis for 3
hours onto a 36-lane 8% polyacrylamide gel. The fragments were analyzed with
GeneScanTM Analysis Software v.3.1 (Applied Biosystems) following the Local Southern
Method.

2.4. Genetic diversity
The number of alleles per locus (A), unique alleles (A*), and expected and
observed heterozygosity (He and Ho, respectively) were calculated as means for genetic
variation between the breeders, and hatchery and wild populations of black sea bream at
each locus in 2003 and 2004 using the Excel Microsatellite Toolkit and GENEPOP v3.3
software (Raymond and Rousset, 1995). The allelic richness (Ar) was also calculated in
order to correct the variation in sample sizes by FSTAT (Goudet, 2001). The inbreeding
coefficient FIS (Weir and Cockerham, 1984) was also determined with this software.
Departures from Hardy-Weinberg equilibrium (HWE) at each locus were checked using a
test analogous to Fisher’s exact test, with a modified version of the Markov chain method
(105 steps and 104 dememorisations) (Guo and Thompson, 1992). The analysis was
performed with the ARLEQUIN v3.0 package (Excoffier et al., 2006). Using the same
program we assessed the genetic differentiation among all possible population
combinations, comparing the significance of pairwise FST values (Reynolds et al., 1983;
Slatkin, 1995) under the null hypothesis of no differences between the populations and
random allelic permutation procedures. A Bonferroni adjustments to the P-values were
applied whenever multiple tests were performed (Rice, 1989). The frequency of null
alleles (fn) described by Summers and Amos (1997) was calculated with Cervus 2.0
software (Marshall et al., 1998).
The discrimination effectiveness of the microsatellite was assessed by the
polymorphic information content (PIC) by using Cervus 2.0 software (Marshall et al.,
1998). The probability of a multilocus genotype shared by two specimens was estimated

by the probability of identity index (I) (Paetkau and Strobeck, 1994). In addition, the
exclusion probability (Q) (Villanueva et al., 2002) was also calculated.
2.5. Stock separation and pedigree analysis
Wild and hatchery origin individuals in 2003 and 2004 (W2003, W2004, H2003,
H2004) were identified by comparing the allele sizes at a given locus between each
specimen with all the 51 breeders using PAPA software (Duchesne et al., 2002). True
parental couples were assigned whenever the couple crossing genotype coincided with
that of the offspring at all loci. The same process was performed with all 184 samples
selected as potential hatchery reared offspring.
The number of effective parents contributing to the mating process (Ne) was
estimated. Corrections due to unequal sex ratio (Crow and Kimura, 1970) and family size
differences (Ne*) (Hill, 1979) were applied. Finally, the rate of inbreeding expressed by
the inbreeding coefficient (F) was estimated as a function of its inbreeding effective
population size F=1/2Ne*.
3. Results
3.1. Genetic diversity
The results of the genotype analysis showed high levels of polymorphism, ranging
from 5 alleles presented at loci ACS4 and ACS6 in H2003 to 20 alleles at locus ACS9 in
W2003 (Table 2). The Br had the highest number of alleles at all loci (83 alleles, mean =
13.8). Ar evidenced the differences in sample size among groups. A* were found at the
most polymorphic loci, being absent at ACS4 and ACS6 except in the Br.

High levels of heterozygosity were observed, with mean Ho ranging from 0.80 to
0.93. Deviations from HWE were detected at most loci in W2004, with a final
heterozygosity excess deduced from the mean negative value of FIS. The presence of null
alleles that produce departures from HWE was not detected (Table 3).
A statistically significant loss of Ar was observed in the recaptured offspring
when compared to the breeders (15.5% and 14.5% in 2003 and 2004, respectively).
However, the reduction in 2003 occurred primarily at the ACS4, ACS6 and ACS9 loci,
while it was more pronounced at the ACS3, ACS16 and ACS17 loci in 2004. In contrast, a
slight loss of Ho was detected in H2003. In 2004, the excess of heterozygosity observed
in the offspring was statistically significant.
Low FST values were observed among the samples of black sea bream, suggesting
that there was high homogeneity between the different groups (Table 4). W2004 had the
highest FST values, which were significantly different from the offspring. The differences
were also significant between wild and hatchery groups and among years. However, the
differences between W2003 and the other samples were not statistically significant.
The highly polymorphic nature of the loci employed is essential for successful
offspring-breeder assignment. In this regard, the mean PIC score (0.848) reflects the high
discrimination power of the loci (Table 5). In addition, the proper assignment of the
offspring to their true parents evidenced by the exclusion probability (Q=1) and the low
probability of identity index (I=2.79E-05 in 2003 and I=2.82E-06 in 2004) confirm the
strength of the microsatellites used.
3.2. Pedigree analysis

Stocked fish accounted for 12.5% and 13.5% of the samples in 2003 and 2004
respectively (Table 6). A total of 10 families from 26% of the breeders were observed in
2003, while 28% of the breeders contributed to 11 families in 2004. The proportion of
breeders contributing over the two year period was 33%.
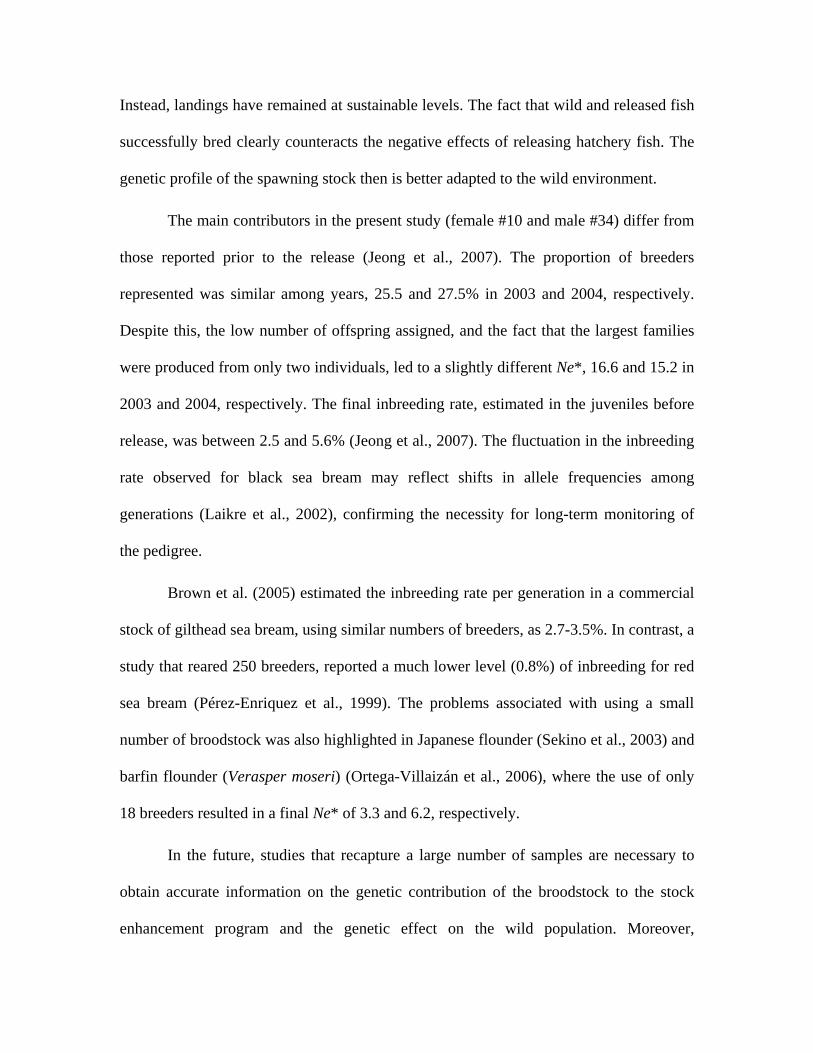
The largest family, female #10-male #34, comprised three offspring, one caught
in 2003 and two more caught in 2004 (Table 7). In 2003, all families were represented in
the wild sample by a single offspring. Female #10 mated with three males and was
assigned to five offspring. Male #34 was the main contributor with eight offspring from
five different females.
The low number of offspring that were assigned to their parents, combined with
the differences in size between families resulted in an effective population size of 16.6
and 15.2 for 2003 and 2004, respectively. However, for the entire period it is reduced to
11.8. The final inbreeding rate was approximately 3% for each year, rising to 4% when
both years were combined.
3.3. Growth
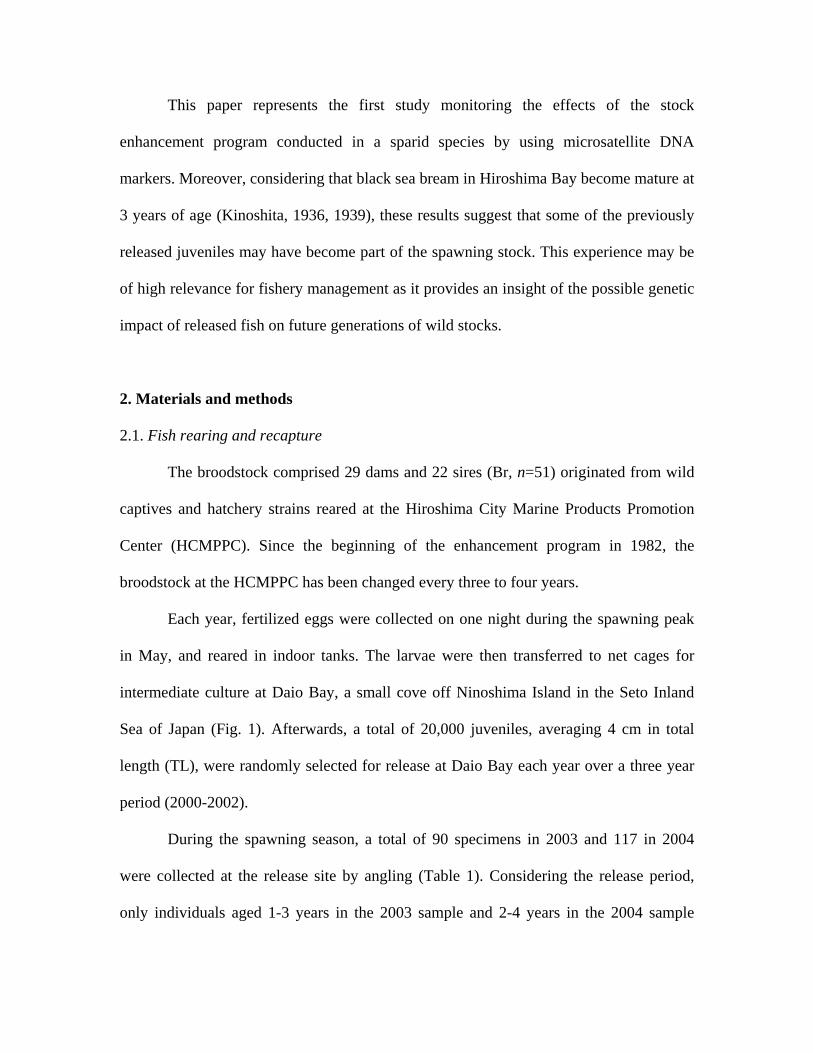
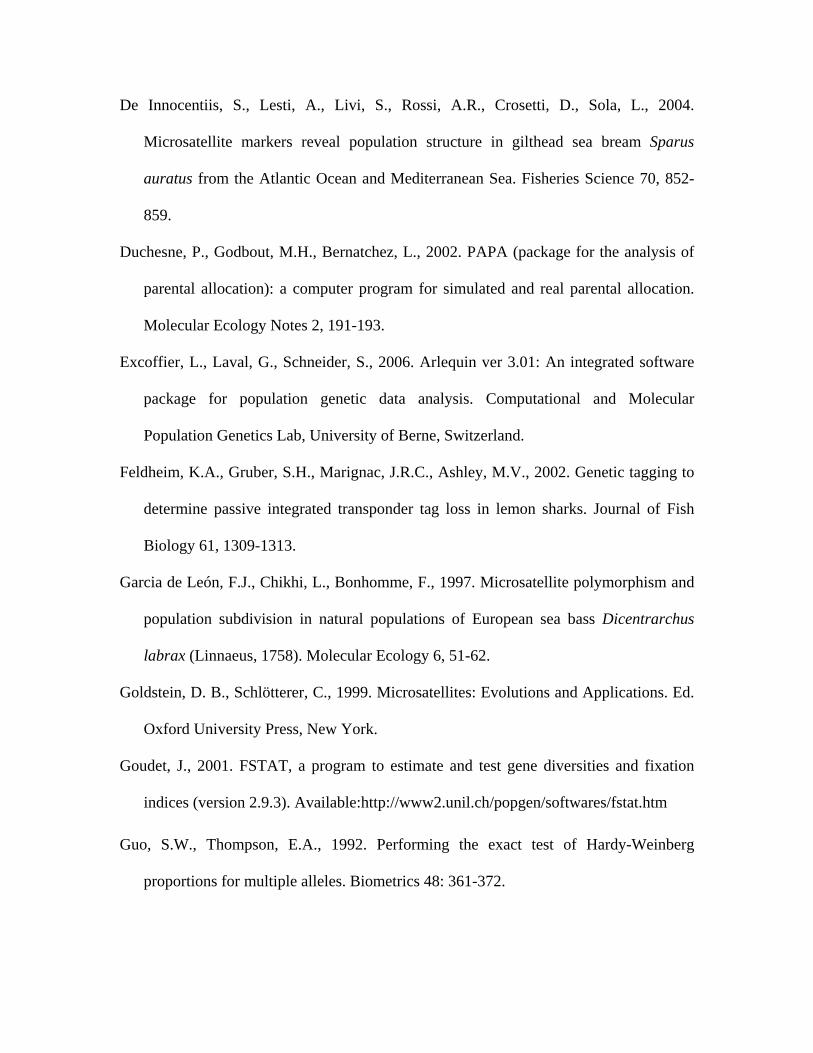
Most of the black sea bream identified as hatchery reared belonged to the
youngest group of each year analyzed (Fig. 2). Excluding the absence of 3-year-old fish
in 2004, the released specimens represented 10-17% of the samples caught for each age
class.
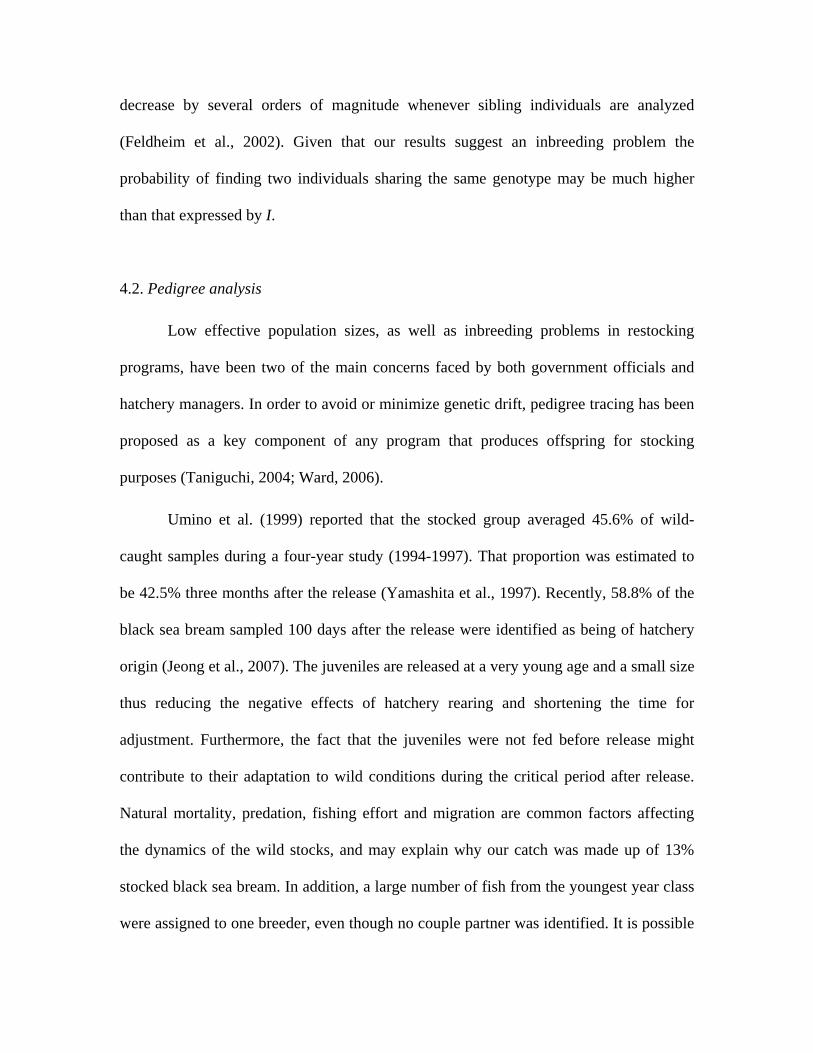
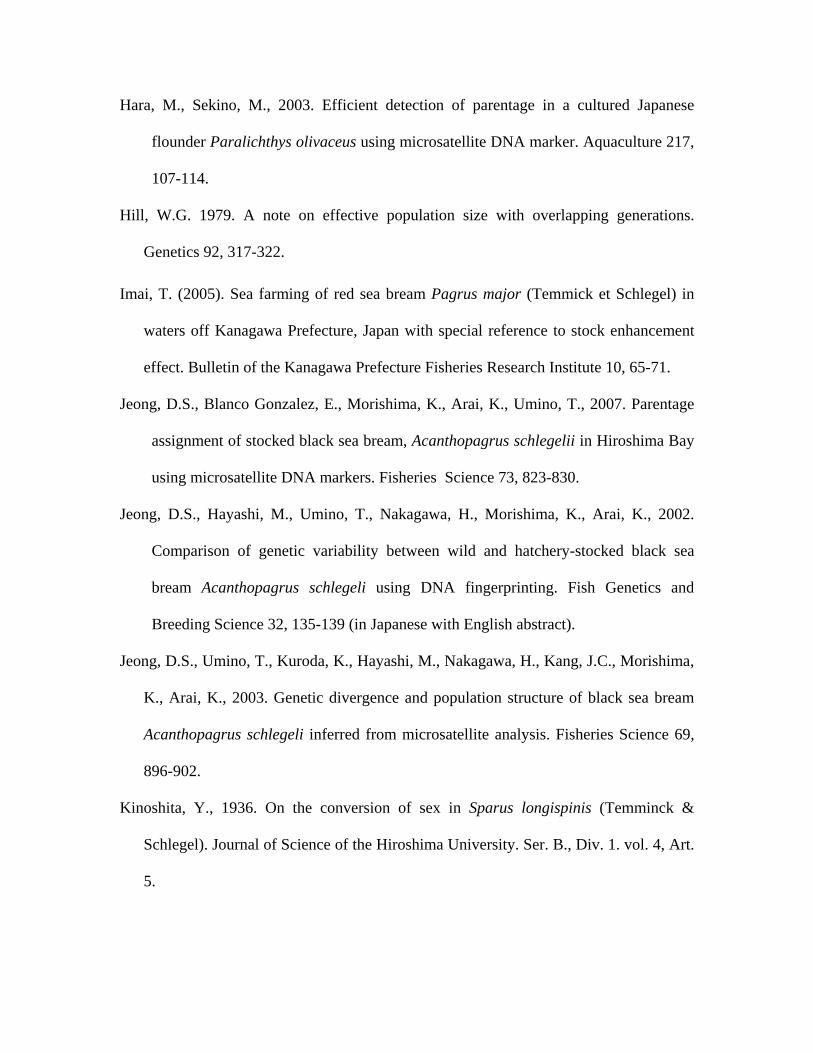
The variation in TL by age for released and wild black sea bream is shown in Fig.
3. No statistically significant differences between the wild and hatchery stocks were
observed.

4. Discussion
The primary fishing area for black sea bream in Japan is located in Hiroshima Bay,
accounting for 10% of the landings. Black sea bream have been released intensively into
Hiroshima Bay since 1982. Support for the effectiveness of the stock enhancement
program is based on an increase in landings (Jeong et al., 2007). However, the potential
harmful effects on the genetic diversity of the wild fish derived from releasing large
numbers of hatchery reared juveniles have not been monitored to date.
4.1. Genetic diversity
This study revealed high levels of heterozygosity among groups, similar to that
measured in our previous study (see Jeong at al., 2007), and in other marine teleost
species (Bentzen et al., 1996; Hara and Sekino, 2003; De Innocentiis et al., 2004). In
contrast to the stocked samples, the Br and each of the wild samples had similar numbers
of alleles. The reduction of Ar in the offspring (15.5% and 14.5% in 2003 and 2004,
respectively) was similar to the 17% reduction reported for juveniles before release in
2000 and 2001 (Jeong et al., 2007). The low pairwise FST values are in agreement with
those previously reported in Hiroshima Bay (Jeong et al., 2003) and confirm the
similarity between the groups. The deviations from HWE were not attributed to the
presence of null alleles, but may be related to the rate of inbreeding and/or the presence
of large numbers of alleles with a small sample size (Castro et al., 2006).
In spite of the theoretical strength of the low I score, a study carried out on lemon
sharks using dual tagging (microsatellite and external tag) showed that this value may
decrease by several orders of magnitude whenever sibling individuals are analyzed
(Feldheim et al., 2002). Given that our results suggest an inbreeding problem the
probability of finding two individuals sharing the same genotype may be much higher
than that expressed by I.
4.2. Pedigree analysis
Low effective population sizes, as well as inbreeding problems in restocking
programs, have been two of the main concerns faced by both government officials and
hatchery managers. In order to avoid or minimize genetic drift, pedigree tracing has been
proposed as a key component of any program that produces offspring for stocking
purposes (Taniguchi, 2004; Ward, 2006).
Umino et al. (1999) reported that the stocked group averaged 45.6% of wild-
caught samples during a four-year study (1994-1997). That proportion was estimated to
be 42.5% three months after the release (Yamashita et al., 1997). Recently, 58.8% of the
black sea bream sampled 100 days after the release were identified as being of hatchery
origin (Jeong et al., 2007). The juveniles are released at a very young age and a small size
thus reducing the negative effects of hatchery rearing and shortening the time for
adjustment. Furthermore, the fact that the juveniles were not fed before release might
contribute to their adaptation to wild conditions during the critical period after release.
Natural mortality, predation, fishing effort and migration are common factors affecting
the dynamics of the wild stocks, and may explain why our catch was made up of 13%
stocked black sea bream. In addition, a large number of fish from the youngest year class
were assigned to one breeder, even though no couple partner was identified. It is possible

that these fish might be of wild origin; spawned by the first generation of hatchery reared
fish that had matured and mated with wild mates. The unknown genotype of the wild
counterpart would explain the absence of an identifiable parent.
The recapture rate of this study similar to that reported for black bream
(Acanthopagrus butcheri) released at 14 months of age in Australia (Lenanton et al.,
1999). In contrast, only 0.3% of released gilthead sea bream (Sparus aurata) were
recaptured in Spain (Sánchez-Lamadrid, 2004). In Kagoshima Bay (Japan), market
surveys assessing the specific external features of hatchery reared specimens of the two
main marine species stocked in the country (see Kitada, 1999), estimated the recovery
rates at 9% for red sea bream (Pagrus major) (Imai, 2005) and 1.5-3.5% for Japanese
flounder (Paralichthys olivaceus) (Atsuchi and Masuda, 2004). However, none of the
stocked red sea bream were identified following genotyping at 5 microsatellites loci
(Pérez-Enriquez and Taniguchi, 1999). Recently, the contribution of the stock
enhancement program to the total landings for red sea bream and Japanese flounder was
estimated as 36-41% and 19-26%, respectively (Kitada and Kishino, 2006). Kitada and
Kishino (2006) concluded that there is no link between stocking practices and the
fluctuations observed in wild fish populations. Information on the contribution of stocked
black sea bream to the total landings is not available. Nevertheless, the large number of
juveniles released since the early 1980s, in combination with the high survival rates of
stocked juveniles, and the fast growth rates found in the present study, suggest a similar
pattern.
The fact that wild and recent reduction in the number of black sea bream released
yearly into Hiroshima Bay has not been accompanied with a reduction in landings.
Instead, landings have remained at sustainable levels. The fact that wild and released fish
successfully bred clearly counteracts the negative effects of releasing hatchery fish. The
genetic profile of the spawning stock then is better adapted to the wild environment.
The main contributors in the present study (female #10 and male #34) differ from
those reported prior to the release (Jeong et al., 2007). The proportion of breeders
represented was similar among years, 25.5 and 27.5% in 2003 and 2004, respectively.
Despite this, the low number of offspring assigned, and the fact that the largest families
were produced from only two individuals, led to a slightly different Ne*, 16.6 and 15.2 in
2003 and 2004, respectively. The final inbreeding rate, estimated in the juveniles before
release, was between 2.5 and 5.6% (Jeong et al., 2007). The fluctuation in the inbreeding
rate observed for black sea bream may reflect shifts in allele frequencies among
generations (Laikre et al., 2002), confirming the necessity for long-term monitoring of
the pedigree.
Brown et al. (2005) estimated the inbreeding rate per generation in a commercial
stock of gilthead sea bream, using similar numbers of breeders, as 2.7-3.5%. In contrast, a
study that reared 250 breeders, reported a much lower level (0.8%) of inbreeding for red
sea bream (Pérez-Enriquez et al., 1999). The problems associated with using a small
number of broodstock was also highlighted in Japanese flounder (Sekino et al., 2003) and
barfin flounder (Verasper moseri) (Ortega-Villaizán et al., 2006), where the use of only
18 breeders resulted in a final Ne* of 3.3 and 6.2, respectively.
In the future, studies that recapture a large number of samples are necessary to
obtain accurate information on the genetic contribution of the broodstock to the stock
enhancement program and the genetic effect on the wild population. Moreover,
histological studies, that use a larger number of juveniles that have reached maturity,
should be performed to provide insights into the spawning events.
Conclusions
Black sea bream are a good species for stocking in Hiroshima Bay. The
proportion of juveniles released during the previous three years accounted for 12.5 and
13.5% of the samples in 2003 and 2004, respectively. Moreover, considering that some of
the specimens identified as being of hatchery origin were mature, they may have already
mated with their wild counterparts, thus increasing the stock biomass. The studies on the
genetic diversity of black sea bream in Hiroshima Bay are limited (Jeong et al., 2002,
2003, 2007). Information regarding the population size and the genetic structure of the
native stock prior to the start of the stock enhancement program is not available. This
lack of information means that careful examination of the potential changes in the genetic
composition of the wild stock due to the intensive enhancement program is necessary, as
was already noted by Ryman (1981, 1997). Given that some of the breeders reared at the
HCMPPC may represent offspring from the original native population, releasing large
numbers of offspring may contribute to the preservation of the original gene pool (see
Ryman, 1981). Our results provide insight into the genetic effects of the introgression
from released black sea bream in Hiroshima Bay. However, further studies that analyze
larger sample sizes over longer periods of time are needed.
The low number of breeders that contributed to the offspring in the present study
led to high levels of inbreeding. This highlights the problem of genetic drift, which can
occur during intensive rearing when a small number of broodstock are used. Hatchery

practices should avoid changes in allele frequencies and conserve the genetic
composition of the wild populations (Allendorf, 1993; Taniguchi, 2003). Without this, a
reduction of fitness and disease resistance may be observed (Allendorf and Phelps, 1980).
Our results suggest that released black sea bream juveniles have high survival
rates, reach maturity and become part of the spawning stock. Nevertheless, the small
sample size of fish identified as hatchery reared, and the potential harmful effects on the
genetic composition of the wild stock inhabiting Hiroshima Bay make it necessary to
routinely monitor the genetic effects of the stock enhancement program.
Acknowledgement
We wish to thank Jason Blackburn for his advice and technical assistance during
the preparation of the manuscript. We are very grateful to Masami Oda, Eddy Jones and
three anonymous reviewers for their constructive comments on the manuscript. We also
express special thanks to the staff of the Hiroshima City Marine Products Promotion
Association for providing specimens used in the present study. The present study was
supported by a Grant-in-Aid for Scientific Research (C) from Japan Society for the
Promotion of Science (JSPS) to T.U. (No.14560152).
References
Allendorf, F., 1993. Delay of adaptation to captive breeding by equalizing family size.
Conservation Biology 7, 416-419.
Allendorf, F.W., Phelps, S.R., 1980. Loss of genetic variation in a hatchery stock of
cutthroat trout. Transactions of the American Fisheries Society 109, 537-543.

Araki, H., Cooper, B., Blouin, M.S., 2007. Genetic effects of captive breeding cause a
rapid, cumulative fitness decline in the wild. Science 318, 100-103.
Atsuchi, S., Masuda, Y., 2004. Effectiveness of the releases of hatchery-produced stock
of Japanese flounder Paralichthys olivaceus in Kagoshima Bay, southern Japan.
Nippon Suisan Gakkaishi 70, 910-921 (in Japanese with English abstract).
Bentzen, P., Taggart, C.T., Ruzzante, D.E., Cook, D., 1996. Microsatellite polymorphism
and the population structure of Atlantic cod (Gadus morhua) in the northwest Atlantic.
Canadian Journal of Fisheries and Aquatic Science 53, 2706-2721.
Blankenship, H.L., Leber, K.M., 1995. A responsible approach to marine stock
enhancement. American Fisheries Society Symposium 15, 167-175.
Borrell, Y.J., Alvarez, J., Vazquez, E., Fernandez Pato, C., Martinez Tapia, C., Sanchez,
J.A., Blanco, G., 2004. Applying microsatellites to the management of farmed turbot
stocks (Scophthalmus maximus L.) in hatcheries. Aquaculture 241, 133-150.
Brown, R.C., Woolliams, J.A., McAndrews, B.J., 2005. Factors influencing the effective
population size in commercial populations of gilthead seabream, Sparus aurata.
Aquaculture 247, 219-225.
Castro, J., Pino, A., Hermida, M., Bouza, C., Riaza, A., Ferreiro, I., Sanchez, L.,
Martinez, P., 2006. A microsatellite marker tool for parentage analysis in Senegal
sole (Solea senegalensis): Genotyping errors, null alleles and conformance to
theoretical assumptions. Aquaculture 261, 1194-1203.
Crow, J.F., Kimura, M.A, 1970. An introduction to population genetics theory, Harper &
Row, London.
De Innocentiis, S., Lesti, A., Livi, S., Rossi, A.R., Crosetti, D., Sola, L., 2004.
Microsatellite markers reveal population structure in gilthead sea bream Sparus
auratus from the Atlantic Ocean and Mediterranean Sea. Fisheries Science 70, 852-
859.
Duchesne, P., Godbout, M.H., Bernatchez, L., 2002. PAPA (package for the analysis of
parental allocation): a computer program for simulated and real parental allocation.
Molecular Ecology Notes 2, 191-193.
Excoffier, L., Laval, G., Schneider, S., 2006. Arlequin ver 3.01: An integrated software
package for population genetic data analysis. Computational and Molecular
Population Genetics Lab, University of Berne, Switzerland.
Feldheim, K.A., Gruber, S.H., Marignac, J.R.C., Ashley, M.V., 2002. Genetic tagging to
determine passive integrated transponder tag loss in lemon sharks. Journal of Fish
Biology 61, 1309-1313.
Garcia de León, F.J., Chikhi, L., Bonhomme, F., 1997. Microsatellite polymorphism and
population subdivision in natural populations of European sea bass Dicentrarchus
labrax (Linnaeus, 1758). Molecular Ecology 6, 51-62.
Goldstein, D. B., Schlötterer, C., 1999. Microsatellites: Evolutions and Applications. Ed.
Oxford University Press, New York.
Goudet, J., 2001. FSTAT, a program to estimate and test gene diversities and fixation
indices (version 2.9.3). Available:http://www2.unil.ch/popgen/softwares/fstat.htm
Guo, S.W., Thompson, E.A., 1992. Performing the exact test of Hardy-Weinberg
proportions for multiple alleles. Biometrics 48: 361-372.
Hara, M., Sekino, M., 2003. Efficient detection of parentage in a cultured Japanese
flounder Paralichthys olivaceus using microsatellite DNA marker. Aquaculture 217,
107-114.
Hill, W.G. 1979. A note on effective population size with overlapping generations.
Genetics 92, 317-322.
Imai, T. (2005). Sea farming of red sea bream Pagrus major (Temmick et Schlegel) in
waters off Kanagawa Prefecture, Japan with special reference to stock enhancement
effect. Bulletin of the Kanagawa Prefecture Fisheries Research Institute 10, 65-71.
Jeong, D.S., Blanco Gonzalez, E., Morishima, K., Arai, K., Umino, T., 2007. Parentage
assignment of stocked black sea bream, Acanthopagrus schlegelii in Hiroshima Bay
using microsatellite DNA markers. Fisheries Science 73, 823-830.
Jeong, D.S., Hayashi, M., Umino, T., Nakagawa, H., Morishima, K., Arai, K., 2002.
Comparison of genetic variability between wild and hatchery-stocked black sea
bream Acanthopagrus schlegeli using DNA fingerprinting. Fish Genetics and
Breeding Science 32, 135-139 (in Japanese with English abstract).
Jeong, D.S., Umino, T., Kuroda, K., Hayashi, M., Nakagawa, H., Kang, J.C., Morishima,
K., Arai, K., 2003. Genetic divergence and population structure of black sea bream
Acanthopagrus schlegeli inferred from microsatellite analysis. Fisheries Science 69,
896-902.
Kinoshita, Y., 1936. On the conversion of sex in Sparus longispinis (Temminck &
Schlegel). Journal of Science of the Hiroshima University. Ser. B., Div. 1. vol. 4, Art.
5.

Kinoshita, Y., 1939. Studies on the sexuality of genus Sparus. Journal of Science of the
Hiroshima University Ser. B., Div. 1. vol. 7, Art. 2.
Kitada, S., 1999. Effectiveness of Japan’s stock enhancement programs: current
perspectives. In: Howell, B.R., Mokness, E., Svasand, T. (Eds.), Stock Enhancement
and Sea Ranching. Fishing New Books, Oxford, pp. 103-131.
Kitada, S., Kishino, H., 2006. Lessons learned from Japanese marine finfish stock
enhancement programmes. Fisheries Research 80, 101-112.
Laikre, L., Jarvi, T., Johansson, L., Palm, S., Rubin, J.F., Glimsater, C.E., Landergren, P.,
Ryman,N., 2002. Spatial and temporal population structure of sea trout at the Island
of Gotland, Sweden, delineated from mitochondrial DNA. Journal of Fish Biology 60,
49-71.
Lenanton, R.C., Ayvazian, S.G., Dibden, C., Jenkins, G., Sarre G., 1999. The use of stock
enhancement to improve he catch rates of black bream, Acanthopagrus butcheri
(Munro) from western Australian recreational fishers. In: Howell, B.R., Mokness, E.,
Svasand, T. (Eds.), Stock Enhancement and Sea Ranching. Fishing New Books,
Oxford, pp. 219-230.
Liao, 1999. How can stock enhancement and sea ranching help sustain and increase
coastal fisheries. In: Howell, B.R., Mokness, E., Svasand, T. (Eds.), Stock
Enhancement and Sea Ranching. Fishing New Books, Oxford, pp. 132-149.
Marshall, T.C., Slate, J., Kruuk, L.E., Pemberton, J.M., 1998. Statistical confidence for
likelihood-based paternity inference in natural populations. Molecular Ecology 7,
639-655.

Norris, A.T., Bradley, D.G., Cunningham, E.P., 1999. Microsatellite genetic variation
between and within farmed and wild Atlantic salmon (Salmo salar) populations.
Aquaculture 180, 247-264.
Norris, A.T., Bradley, D.G., Cunningham, E.P., 2000. Parentage and relatedness
determination in farmed Atlantic salmon (Salmo salar) using microsatellite markers.
Aquaculture 182, 73-83.
O'Connell, M., Wright, J.M., 1997. Microsatellite DNA in fishes. Reviews in Fish
Biology and Fisheries 7, 331-363.
Ortega-Villaizán Romo, M.M., Aritaki, M., Taniguchi, N., 2006. Pedigree analysis of
recaptured fish in the stock enhancement program of spotted halibut Verasper
variegatus. Fisheries Science 72, 48-52.
Ortega-Villaizán Romo, M.M., Suzuki, S., Ikeda, M., Nakajima, M., Taniguchi, N., 2005.
Monitoring of the genetic variability of the hatchery and recaptured fish in the stock
enhancement program of the rare species barfin flounder Verasper moseri. Fisheries
Science 71, 1120-1130.
Paetkau, D., Strobeck, C., 1994. Microsatellite analysis of genetic variation in black bear
populations. Molecular Ecology 3, 489-495.
Pérez-Enriquez, R., Taniguchi, N., 1999. Use of microsatellite DNA as genetic tags for
the assessment of a stock enhancement program of red sea bream. Fisheries Science
65, 374-379.
Pérez-Enriquez, R., Takagi, M., Taniguchi, N., 1999. Genetic variability and pedigree
tracing of a hatchery-reared stock of red sea bream (Pagrus major) used for stock
enhancement, based on microsatellite DNA markers. Aquaculture 173, 413-423.

Raymond, M., Rousset, F., 1995. GENEPOP (version 3.4): population genetics software
for exact tests and ecumenicism. Journal of Heredity 86, 248-249.
Reynolds, J., Weir, B.S., Cockerman, C.C., 1983. Estimation for the coancestory
coefficient: basis for a short term genetic distance. Genetics 105, 767-779.
Rice, W.R., 1989. Analyzing tables of statistical tests. Evolution 43, 223-225.
Ryman, N., 1981. Conservation of genetic resources: experiences from the brown trout
(Salmo trutta). In: Ryman, N. (Eds.), Fish gene pools. Ecological Bulletins
(Stockholm) 34, 61-74.
Ryman, N., 1997. Minimizing adverse effects of fish culture: understanding the genetics
of populations with overlapping generations. ICES Journal of Marine Science
54:1149-1159.
Sánchez-Lamadrid, A., 2004. Effectiveness of releasing gilthead sea bream (Sparus
aurata, L.) for stock enhancement in the Bay of Cádiz. Aquaculture 231, 135-148.
Sekino, M., Saitoh, K., Yamada, T., Atsushi, K., Motoyuki, H., Yamashita, Y., 2003.
Microsatellite-based pedigree tracing in a Japanese flounder Paralichthys olivaceus
hatchery strain: implications for hatchery management related to stock enhancement
program. Aquaculture 221, 255-263.
Slatkin, M., 1995. A measure of population subdivision based on microsatellite allele
frequencies. Genetics 139, 457-462.
Støttrup, J. G., Sparrevohn, C.R., Modin, J., Lehmann, K., 2002. The use of releases of
reared fish to enhance natural populations: A case study on turbot Psetta maxima
(Linne, 1758). Fisheries Research 59, 161-180.

Summers, K., Amos, W., 1997. Behavioral, ecological, and molecular genetic analyses of
reproductive strategies in the Amazonian dart-poison frog, Dendrobates
ventrimaculatus. Behavioral Ecology 8, 260-267.
Taggart, J.B., Hynes, R.A., Prodohl, P.A., Ferguson, A., 1992. A simplified protocol for
routine total DNA isolation from salmonid fishes. Journal of Fish Biology 40, 963-
965.
Taniguchi, N., 2003. Genetic factors in broodstock management for seed production.
Reviews in Fish Biology and Fisheries 13, 177-185.
Taniguchi, N., 2004. Broodstock management for stock enhancement programs of marine
fish with assistance of DNA marker (a review). In Leber, K.M., Kitada, S.,
Blankenship, H.L., Svasand, T. (Eds.), Stock Enhancement and Sea Ranching.
Developments, Pitfalls and Opportunities. Blackwell Publishing, Oxford, pp. 329-338.
Tringali, M.D., Bert, T.M., 1998. Risk to genetic effective population size should be an
important consideration in fish stock-enhancement programs. Bulletin of Marine
Science 62, 641-659.
Umino, T., Hayashi, M., Miyatake, J., Nakayama, K., Sasaki, T., Okada, K., Nakagawa,
H., 1999. Significance of release of black sea bream at 20-mm size on stock
enhancement in Daiô Bay, Hiroshima. Suisanzoshoku 47, 337-342.
Villanueva, B., Verspoor, E., Visscher, P.M., 2002. Parental assignment in fish using
microsatellite genetic markers with finite numbers of parents and offspring. Animal
Genetics 33, 33-41.
Ward, R.D., 2006. The importance of identifying spatial population structure in
restocking and stock enhancement programmes. Fisheries Research 80, 9-18.

Weir, B.S., Cockerham, C.C., 1984. Estimating F-statistics for the analysis of population
structure. Evolution 38, 1358-1370.
Yamashita, H., Umino, T., Nakahara, S., Okada, K., Nakagawa, H., 1997. Changes in
some properties of black sea bream released into the Daio Bay. Fisheries Science 63,
267-271.

Figure Captions
Fig. 1. Map showing the location of the release and sampling site.
Fig. 2. Distribution of wild and hatchery specimens in 2003 and 2004.
Fig. 3. Variation in total length (TL) by age in wild and hatchery black sea bream.

Tables
Table 1. Sampling date, number of samples (n), age, total length (TL), body weight (BW)
and number of potential offspring.
Table 2. Genetic variability of breeders (Br), offspring 2003 (H2003), offspring 2004
(H2004), wild 2003 (W2003), wild 2004 (W2004).at 6 microsatellite loci.
Table 3. Estimated frequency of null alleles (fn) at six loci. Br=breeders,
H2003=offspring 2003, H2004=offspring 2004, W20003=wild 2003, W2004=wild 2004.
NS=Not significant.
Table 4. FST values between breeders (Br), offspring 2003 (H2003), offspring 2004
(H2004), wild 2003 (W2003), wild 2004 (W2004). H=H2003+H2004,
W=W2003+W2004, 2003=H2003+W2003, 2004=H2004+W2004 and ALL=
H2003+H2004+ W2003+W2004.
Table 5. Exclusion probability (Q) and polymorphic information content (PIC) of the
broodstock and probability of identity index (I) of the offspring in 2003 and 2004.
Table 6. Pedigree analysis results for the offspring of 2003 and 2004.

Table 7. Families composition in 2003 and 2004. A = Offspring of 2003, B = Offpring of
2004. Each letter represents one offspring assigned to their male and female parent.

Fig. 1

Fig. 2
2003
0
10
20
30
40
50
60
1 2 3Age (year)
Num
ber o
f ind
ivid
uals
HatcheryWild
2004
0
10
2030
40
5060
70
80
90
2 3 4Age (year)
Num
ber o
f ind
ivid
uals Hatchery
Wild

Fig. 3

Table 1.
Date n Age (years) TL (mm) BW (g) Pot. offspring 2003 90 80
05/21 10 1-6 125-370 35-829 6 05/23 44 1-4 74-348 7-715 40 06/01 6 1-4 120-310 29-816 4 06/18 10 1-3 108-240 34-385 10 06/25 11 1-3 70-240 14-425 11 07/12 9 1-2 104-159 43-110 9
2004 117 104 04/24 2 3-4 216-305 174-460 2 05/19 34 1-4 137-318 32-511 32 05/25 28 2-9 177-403 89-1100 21 06/02 9 2-6 190-345 117-595 7 06/18 26 1-5 150-345 47-550 24 06/23 18 2-3 180-254 92-222 18
Total 207 1-9 70-403 7-1100 184

Table 2.
Hatchery Wild
Br H2003 H2004 W2003 W2004 Locus
n=51 n=10 n=14 n=70 n=90 A 17 9 8 17 17 Ar 9.3 9 7.0 8.8 9.5 A* 3 7 3 3 4 Ho 0.88 0.90 0.86 0.91 0.90
ACS3
Fis -0.027 -0.218 -0.040 -0.068 -0.015*
A 9 5 6 9 9 Ar 6.7 5 5.9 7.3 6.9 A* 1 0 0 0 0 Ho 0.74 0.80 0.93 0.81 0.82
ACS4
Fis 0.097 0.007 -0.130 0.053 0.034*
A 9 5 6 8 7 Ar 6.8 5 6.7 5.9 6.2 A* 2 0 0 0 0 Ho 0.74 0.70 0.93 0.67 0.83
ACS6
Fis 0.107 0.131 -0.154 0.127 0.006
A 18 8 10 20 16 Ar 10.5 8 8.8 10.8 9.6 A* 3 5 3 3 1 Ho 0.92 0.60 0.93 0.86 0.97
ACS9
Fis -0.011 0.200 -0.101 0.063* -0.070*
A 15 8 8 14 13 Ar 9.1 8 7.5 8.9 8.2 A* 4 3 1 2 2 Ho 0.82 0.90 0.93 0.89 0.96
ACS16
Fis 0.079 -0.032 -0.094* 0.002* -0.092*
A 15 9 9 14 16 Ar 9.2 9 7.8 8.9 9.0 A* 5 5 4 1 5 Ho 0.90 0.90 1.00 0.87 0.90
ACS17
Fis -0.003 -0.038 -0.193 0.017 -0.007*
Mean A 13.8 7.3 7.8 13.7 13.0 Ar 8.6 7.3 7.4 8.4 8.2 A* 3 3.3 1.8 1.5 2 Ho 0.83±0.08 0.80±0.13 0.93±0.04 0.84±0.09 0.90±0.06 Fis 0.039 0.008 -0.119 0.030 -0.025*
*Departure from HWE at P < 0.05

Table 3.
Locus Br H2003 H2004 W2003 W2004
ACS3 -0.017 -0.159 -0.048 -0.036 -0.010
ACS4 0.051 -0.025 -0.077 0.023 0.016
ACS6 0.044 0.052 -0.090 0.070 0.001
ACS9 -0.009 0.089 -0.070 0.030 -0.037
ACS16 0.035 -0.044 -0.078 -0.003 -0.049
ACS17 -0.006 -0.053 -0.110 0.005 -0.007
6 LOCI NS NS NS NS NS

Table 4.
Br H2003 H2004 W2003 W2004 H W 2003 2004 ALL
n=51 n=10 n=14 n=70 n=90 n=24 n=160 n=80 n=104 n=184
Br 0.003 -0.002 0.000 0.005 0.005 0.002 0.000 0.003 0.000
H2003 -0.007 0.007 0.015*
H2004 0.003 0.014*
W2003 0.006
H 0.011**
2003 0.004** *P < 0.005 after Bonferroni correction, k=10
**P < 0.017 after Bonferroni correction, k=3

Table 5.
Broodstock Offspring
Locus Q PIC I (2003) I (2004)
ACS3 0.893 0.839 0.357 0.125
ACS4 0.823 0.793 0.167 0.123
ACS6 0.836 0.804 0.175 0.152
ACS9 0.948 0.895 0.363 0.118
ACS16 0.963 0.873 0.080 0.099
ACS17 0.922 0.881 0.092 0.103
2 loci 0.9812
3 loci 0.9970
4 loci 0.9998
5 loci 1
6 loci 1
Mean 0.848 2.79E-05 2.82E-06

Table 6.
Offspring
Matching to 2003 2004 Combined
n 80 104 184 Released 10 (12.5%) 14 (13.5%) 24 (13.0%)
Wild 70 (87.5%) 90 (86.5%) 160 (87%)
Number of contributors 13 (25.5%) 14 (27.5%) 17 (33.3%) Female (Nf) 8 (27.6%) 8 (27.6%) 10 (34.5%) Male(Nm) 5 (22.7%) 6 (27.3%) 7 (31.8%)
Total number of families 10 11 19
Ne (unequal sex proportion) = 4NfNm/(Nf+Nm) 12.3 13.7 16.5
Variance of offspring per parent
Per female(Vkf) 0.21 1.36 1.60 Per male(Vkm) 1.7 1.87 5.62
Ne* (unbalance family size)
= 8Ne/(4+Vkf+Vkm) 16.6 15.2 11.8
Inbreeding coefficient (F = 1/2Ne*) 0.030 0.033 0.042

Table 7.
Male Female #32 #34 #35 #39 #40 #47 #51
#1 A B A #6 B A #8 A #9 B #10 ABB B B #13 A #14 AB #25 A B A #27 A BB #28 B BB