sterilizable miniature bioreactor platform for …
TRANSCRIPT

Malaysian Journal Of Science 40(1): 22-33 (February 2021)
22
STERILIZABLE MINIATURE BIOREACTOR PLATFORM FOR
ANAEROBIC FERMENTATION PROCESS
Muhammad Zainuddin Arriafdi1a, Arvind Ramachendrin2b, Muhd Nazrul Hisham
Zainal Alam3a*
aDepartment of Bioprocess and Polymer Engineering, School of Chemical and Energy Engineering, Faculty of
Engineering, Universiti Teknologi Malaysia, 81310 UTM Johor Bahru, Johor, MALAYSIA. Email:
[email protected]; [email protected] bProduction Drug Substance, Biocon Sdn Bhd, Kawasan Perindustrian SILC, 79200 Iskandar Puteri, Johor,
MALAYSIA. Email: [email protected]
Corresponding author: [email protected]
Received: 5th Sep 2019 Accepted: 6th Oct 2020 Published: 28th Feb 2021
DOI: https://doi.org/10.22452/mjs.vol40no1.2
ABSTRACT This paper presents the establishment of a miniature bioreactor platform
for anaerobic microbial fermentation processes. It is made from a universal glass bottle and has
a working volume of 16 mL. Reactor features included mixing via magnetic stirrer, temperature
control via electrical heater and cells optical density (OD) sensing. All sensors and actuators
integrated into the reactor were operated using LabVIEWTM (National Instrument, TX, US).
The top lid of the bottle was modified to include a 3mm poly(methylmethacrylate) (PMMA)
polymer layer where it was machined to provide spaces for fluidic ports and integration of
sensors. Each reactor components were sterilized prior to conducting fermentation
experiments. Main body of the reactor was made of glass and it was sterilized using the
standard heat sterilization method (121oC for 15 minutes) where else other components were
sterilized by exposure to UV light for 2 hours. A series of anaerobic fermentation experiments
were conducted in batch mode using S.cerevisiae to evaluate the workability of the system.
Fermentation experiments were conducted using inoculum concentration of 2 g∙L-1 and starting
glucose concentration between 10 g∙L-1 and 20 g∙L-1. In every experiment, mixing was set to
operate at 400 rpm and temperature was adjusted to 30 ± 2oC. Experiments were carried out
until stationary phase was attained. Under these conditions, the best fermentation profile was
obtained with glucose concentration of 20 /L where cell specific growth rate was found to be
about 0.28 h-1. Bench marking step was also performed where results attained in a miniature
bioreactor platform were comparable with the one attained using a 50 mL flask.
ABSTRAK Kertas ini mempersembahkan sebuah prototaip bioreaktor berskala
miniatur bagi proses fermentasi mikrorganisma anarobik. Ia dihasilkan daripada sebuah botol
kaca universal dan mempunyai isipadu operasi sebanyak 16 mL. Reka bentuk bioreaktor ini
mengandungi sebuah alat pemanas, penderia suhu, pembaca ketumpatan (OD) sel dan
pengadukan melalui ‘stirrer bar’ magnetik. Kesemua sensor dan prob yang diintegrasi dalam
bioreaktor boleh dikawal dengan perisian LabVIEWTM (National Instrument, TX, US).
Penutup botol universal telah dimodifikasi untuk meletakkan lapisan polimer
poly(methylmethacrylate) (PMMA) tambahan di mana ia digunakan bagi perletakkan laluan
bendalir dan kemasukan penderia-penderia. Setiap komponen bioreaktor disteril sebelum
eksperimen fermentasi anarobik dilakukan. Badan bioreaktor disterilisasi dengan kaedah
sterilisasi haba (121oC untuk 15 minit) manakala komponen yang lain disterilisasi dengan
pendedahan kepada cahaya UV selama 2 jam. Eksperimen fermentasi anarobik dijalankan
dalam mod sistem tertutup dengan mengunakan sel S. cerevisiae sebagai piawai untuk uji

Malaysian Journal Of Science 40(1): 22-33 (February 2021)
23
keberkesanan bioreaktor miniatur bagi fermentasi anarobik. Eksperimen dijalankan pada saiz
inokulum 2 g∙L-1 dengan kepekatan media glukosa antara 10 g∙L-1 hingga 20 g∙L-1. Dalam setiap
eksperimen pengadukan dikawal pada kelajuan 400rpm dan suhu bioreaktor diselaraskan pada
30 ± 2oC. Reaksi dijalankan sehingga fermentasi mencapai fasa pengun. Profil fermentasi yang
terbaik diperolehi pada kepekatan glukosa 20 g∙L-1 dimana kadar pertumbuhan sel adalah 0.28
hr-1. Ekperimen perbandingan juga dijalankan dan keputusan yang diperolehi bioreaktor
miniatur adalah yang sama dengan ekperimen mengunakan 50 mL kelalang.
Keywords: Miniature bioreactor, anaerobic fermentation, scale down, miniaturization,
S.cerevisiae
1. INTRODUCTION
Bioreactors are main unit
operations in many biochemical processes
in which enzymes, microbial, mammalian,
or plant cell systems are used for
manufacture of a wide range of useful
products (Najafpour, 2007; Blose et al.,
2014). At laboratory settings, fermentation
experiments are often conducted by using
shake flasks and the bench-top bioreactors.
Shake flasks in general are useful but are
usually not integrated with sensors and
actuators. Therefore, experiments
performed generate limited amount of
process information. Bench scale
bioreactor on the other hand consist of
various sensors and actuators however
experimentation are rather costly as larger
amounts of raw materials are needed per
experiment. Moreover, it is laborious to
work with because heavy lifting is required
for sterilization of medium within the
reactor, and post-operation would require
thorough cleaning and another round of
sterilization. Moreover, sampling is needed
for both experimental setup and this may
risk broth contamination and troublesome
for extended fermentation experiments.
Miniature bioreactors (MiBR) are
potential scaled down bioreactor device for
conducting biological experiments. It is
regarded as a bioreactor system with
working volume usually less than 20 mL
(Kirk and Szita, 2013; Bolic, 2018). They
can be fabricated to have the similar
features as the typical bench scale
bioreactor setup. These include integrated
sensors for measurement of fermentation
physical data and inclusion of miniature
pumps to transport liquid to or from the
reactor for nutrient supply or for harvesting
purposes. Development of MiBRs have
received increasing attention from
acedemia and industry. To date, MiBRs
have been applied in various research areas
particularly on process development of
biotechnology fermentation processes
(Kheradmandnia et al, 2014). Clearly,
MiBRs have the advantage in reducing the
fermentation development time offer a less
laborious operations, inexpensive to work
with and enables in situ evaluation of
process change for an existing operation
(Schmideder et al., 2015).
In this work, we report the
establishment of a sterilizable miniature
bioreactor platform. The reactor has a
working volume of 16 mL. The idea was to
design a sterilizable bioreactor system at
the milliliter scale that can be fabricated
inexpensively. The reactor also should be
easy to operate i.e. plug ‘n’ play reactor
platform. The concept of simple-to-use is
referred to the handling of the reactor where
it should be easy to use with fast installation
similar to a typical shake flask operation. In
the process of making the reactor
economical, the essential components of
the miniature bioreactor were built on a
discrete platform so that it can be re-used.
The reactor was designed to include

Malaysian Journal Of Science 40(1): 22-33 (February 2021)
24
necessary features for carrying out
fermentation experiments. These include
mixing, temperature control, and online
optical sensing for cells density. The latter
would allow one to utilize the reactor for
lengthly fermentation experiment without
the need for sampling.
In order to test the workability of
the proposed MiBR system, anaerobic
yeast fermentation experiments were
carried out. Anaerobic fermentation is a
metabolic process that occurs under the
conditions where oxygen is not present and
it has a long history of industrial
applications for the production of food and
chemicals. In addition, anaerobic
fermentation in recent years has seen a
steep rise especially in the bioremediation,
brewery and biofuel industries (Panatto et
al., 2015). The effect of substrate (glucose)
concentration was caried and cells OD was
monitored until cells came to stationary
phase. In making the MiBR suitable for
microbial fermentation, several tests were
performed to study the workability of the
MiBR system for anaerobic fermentation
i.e. mixing efficiency and quality was
tested via the decolorization-tracer method
using bromothymol blue (BTB) tracer
solution. Meanwhile, effectiveness of
temperature control in the MiBR were
tested with control efficiency and response
time test, to ensure optimum temperature is
maintained during the fermentation
reactions. Optical fibers were used for cell
density measurement which allowed for the
observation of cell growth in real time
without the need for sampling. Moreover,
sterility testing (media hold study) was
performed to determine the effectiveness of
the sterilization technique used to control
contamination. Anaerobic fermentation
experiments were performed with
S.cerevisiae cells at various glucose
concentration and the cell doubling time
and growth rate were calculated at the end
of each reaction.
2. MATERIALS AND METHODS
2.1 Design and Fabrication of the
Miniature Bioreactor
A small universal sampling glass
bottle was modified to create the miniature
bioreactor prototype. It has a diameter and
height of about 28 mm and 67 mm,
respectively. This gives a total volume of
about 28 mL. In each experiment, only 16
mL of volume was utilized to provide room
for headspace. Headspace is necessary for
gas exchange or for removal of bubbles.
The top lid of the bottle was modified to
include a 3 mm poly(methylmethacrylate)
(PMMA) polymer layer with similar
diameter. Holes were created on the
polymer layer for establishment of fluidic
ports and for insertion of electrical heater
and the Pt100 temperature sensor. Fluidic
ports were realized using a stainless steel
tube (outer diameter ~ 3mm and inner
diameter ~ 2 mm). Two ports were created
and the ports are reserved for delivery of
liquid into/from the reactor and releasing of
gas. Gas outlet port is connected to a small
0.2µm NALGENETM nylon syringe filter to
prevent any contamination from the
surroundings. A 24V 150W stainless steel
electrical heater with diameter of 6 mm was
integrated through the middle part of the
lid. Epoxy was used to glue all fluidics
ports and the electrical heater in place. In
addition, a poly(dimethylsiloxane)
(PDMS) gasket was customized for sealing
of the cap. This would also ensures a water
tight connection and prevent any leakages.
The PDMS liquid solution was prepared by
mixing 10 parts silicone and 1 part curing
agent (Sylgard 184, Dow Corning). After
degassing, the pre-polymer solution was
poured into the bottle cap and left to
solidify in room temperature. A small
magnetic stirrer (10 mm [length] × 2 mm
[width]) was placed on the reactor floor to
provide necessary mixing for the miniature
bioreactor operation. During operation, the

Malaysian Journal Of Science 40(1): 22-33 (February 2021)
25
reactor is placed on an operating platform
consisting of a mechanical PC fan. The PC
fan was operated using a 5V DC power
supply and small magnets were glued on
the PC fan to create the necessary magnetic
coupling with the magnetic stirrer bar.
Stirring is achieved based on the rotating
speed of the PC fan. Pt-100 temperature
sensor (CLS 181-2012 Correge, France) is
used to measure the temperature of the
reactor content during operation. The
sensor is attached on the outer wall and at
the bottom of the reactor for easier
temperature measurement. Monitoring of
cells optical density was based on cells
optical sensing methodology applied in
microbioreactors prototype (Alam,
Schäpper & Gernaey, 2010, Halimoon,
Hussain, Kouzani & Alam, 2016). The
optical components were placed on a probe
holder on each end of the miniature
bioreactor. A low-cost plastic transmitter
(SFH756, Avago Technologies, US) was
used to transmit a bright yellow LED light
(modulated square wave) from the
reference probe at 47 Hz (5v current signal)
through the chamber of the miniature
bioreactor and is then collected by the
receiver photodetector probe (PD)
(SFH250, Avago Technologies, US) with
similar configuration as the transmitter
probe (Zainal Alam et al., 2018). Schematic
of the miniature bioreactor platform is
illustrated in Figure 1.
Figure 1. Schematic diagram of the miniature bioreactor platform (left) and the details of the
reactor geometry (right). The miniature bioreactor was placed on an operating platform which
consist of a 5V DC mechanical fan for stirring. Other sensors (Pt100 and OD sensors) and the
electrical heater are linked directly to the NI USB 6343 DAQ for input and output of signals.
2.2 Process Control and Automation
of the Miniature Bioreactor
Temperature was the only
parameter controlled where else cells
optical density were measured using optical
fibers and stirring is set through open loop
step. Temperature control was achieved via
on-/off controller technique developed by
Zainal Alam et al. (2010). First,
temperature readings (Tm) were attained
from the Pt100 temperature sensor. Analog
voltage signals from the sensor was first
linearized and converted to temperature
values (oC) via a transmitter (JUMO dTRA
NS T04, JUMO GmbH &
Co., Fulda, Germany) before connected to t
he NI USB 6343 DAQ for futher

Malaysian Journal Of Science 40(1): 22-33 (February 2021)
26
processing. Then, the controller (written in
LABVIEW) will compute the differences
between the measured values (Tm) and the
desired set point values, Tsp. If Tsp is more
than Tm, the heater is turned on until Tsp is
achieved; otherwise it will remained in an
off state. Heating was achieved by passing
electric current at 7V DC to the stainless
steel electrical heater. Heats created by the
electrical heater was distributed constantly
by the rotating magnetic stirrer. The
effectiveness of the temperature control
algorithm applied was assessed based on
control accuracy and Pt100 sensor response
time. Evaluation were done by assessing
the parameters at different heater on-/off
pulse duties and voltage supply. The speed
of the magnetic stirrer bar was determined
using a hall effect sensor when connected
to 5V DC power supply. Throughout the
reactor operation, rotating speed of the
magnetic stirrer bar was not controlled and
operated at the same power supply.
Cells optical density was calculated
using Beers Lambert law based on
tranmittance data collected from the PD. A
calibration curve was generated using yeast
cells suspended in distilled water at
concentration range between 5 g∙L-1 and 25
g∙L-1. Each sample was loaded into the
miniature bioreactor for OD measurement.
OD values was attained based on the
correlation between the ratio of transmitted
and collected analog voltage signals
attained (Vs/VT) and different yeast sample
concentration (Zainal Alam et al., 2018). A
program for automation of the reactor was
written in LabVIEWTM Academic Premium
Suite software. The program was executed
by interfacing the reactor with NI USB
6343 DAQ for in- and output of signals.
2.3 Mixing Quality and Method to
Determine pH Change in the Miniature
Bioreactor
Mixing quality of the reactor was
assessed through colourization-tracer
method with the use of 0.5% (w/v)
bromothymol blue (BTB) tracer. BTB was
prepared by dissolving 0.5 g of BTB
powder (QreC) into 15 mL of 0.02N
sodium hydroxide, NaOH solution (QreC).
The final pH of the solution was adjusted to
7.0 ± 0.2 with 1M NaOH solution.
Experiment was conducted by using a
distilled water. The time taken for tracer to
completely mix with the contents of the
miniature bioreactor were recorded and
observed using APPLE® Iphone 7 camera.
There is no pH probe installed in the
current miniatue bioreactor setup due to
limited spaces. On this reason, a
qualitative tool of using colourimetric pH
indicator was applied to predict the pH of
the reactor content. 0.5% (w/v) BTB
indicator was again utilized where it was
added into the media. The solution was
prepared by mixing 0.5 g of QReC® BTB
powder into 10 mL of 0.02 N NaOH
solution and 90 mL of distilled water.
Changes of pH can be detected by
observing the color change of the reactor
content for increasing and decreasing of
pH. If the pH of the solution is within the
acidic region (pH < 7), a yellow colored
solution is to be expected. On contrary, if
the pH of the solution is greater than pH 7,
the color of the solution will be in blue
indicating the solution is within the alkaline
region.
2.4 Anaerobic Fermentation in
Miniature Bioreactor
S. cerevisiae batch anaerobic
fermentation experiments were performed
to demonstrate the workability of the
miniature bioreactor platform. The
inoculum concentration of yeast cells used
in anaerobic fermentation experiments
were kept constant at 2 g∙L-1 by weighing
equal amounts of wet yeast cells (Mauri-
pan, UK) and mixed with 500 µL of fresh
and sterilized glucose medium. The final
volume of inoculum was prepared at 1.6
mL and was used for the experiments (10%
(v/v) of the total working volume). A Yeast

Malaysian Journal Of Science 40(1): 22-33 (February 2021)
27
Extract-Peptone-Dextrose (YPD) medium
was used to carry out all experiments.
Glucose concentration in fermentation
media was varied in each experiment i.e.
between 10 g∙L-1 and 20 g∙L-1. During
media preparation, pH of solution was
adjusted to 7.0 ± 0.2 using 1M sodium
hydroxide, NaOH solution and 1M of
hydrochloric acid, HCL. The media was
heat sterilized at 121oC for 15 minutes.
Once cooled, 15 mL of freshly prepared
glucose media was aseptically transferred
into the miniature bioreactor which then
followed with the addition of 1.6 mL
inoculum culture.
Before addition of the medium, the
miniature bioreactor was first sterilized.
The main body of the reactor was subjected
to heat sterilization for 15 minutes at 121oC
meanwhile the cap together with its fluidic
ports were first sprayed with 70% (v/v)
ethanol solution followed by rinsing with
distilled water. The cap was then exposed
to ultraviolet (UV) light in a NUAIRE®
class (II) biosafety cabinet for 2 hours.
They were then re-assembled under
laminar air flow prior to begin the
fermentation experiment. Medium and
inoculum transfer were all done in a
NUAIRE® class (II) biosafety cabinet
under laminar air flow. Finally, two mL of
vegetable oil was added to create a thin
hydrophobic layer on the surface of the
liquid layer. This is essential to prevent the
entry of oxygen molecules into the media
and also to ensure an anaerobic reaction
condition. All fermentation reaction was
carried out at 30oC and at stirring rate of
about 400 rpm. The progress of the
fermentation was monitored until cells
growth reach the stationary growth phase.
Cells were monitored online whilst glucose
level were estimated using DNS method
from 0.4 mL sample taken from the reactor.
For comparison purposes,
anaerobic yeast fermentation was also
carried out using a shake flask. Similar
media was used with working volume of 50
mL. In the shake flask operation, 1 mL of
samples were taken aseptically every hour
to monitor the cells growth. For this
purpose, cells OD was measured at 600nm
using a spectrometer where the cell-free
media was used as blank.
3. RESULTS AND DISCUSSION
3.1 Mixing capacity of the reactor
One of the important design aspect
in miniature bioreactor system is its mixing
capacity. The mixing method employed for
the reactor should uniformly mix the
reactor content whilst ensuring very
minimal dead zones (stagnant area). This is
indeed a challenge because in small scale
bioreactor system especially the ones with
few milliliters working volume, turbulence
mixing conditions often could not be met
(Schäpper et al., 2009). Small reactor
system also does not offer much room for
installation of baffles and/or sophisticated
impeller design. Moreover, miniature size
impeller system is not so easy to design and
it usually involved many fabrication steps
(Bolic et al., 2016). In the miniature
bioreactor system presented in the work, a
miniature size magnetic stirrer bar was
applied for mixing of the reactor content.
The stirrer bar sits at the floor of the reactor
and actuated using a rotating magnet placed
underneath the reactor. The performance of
the mixing strategy employed was
evaluated using a dye decolorization
technique. Dye decolorization method
proved to be sufficient in observing
the mixing flow pattern and to determine
the magnetic stirrer bar mixing times at
different rotational speed (Bolic et al., 201
6; Halimoon et al.,2016). Figure 2a depicts
series of images taken at the point where
the tracer was injected from the top liquid
surface until a complete mixing condition
was achieved within the period of two
seconds. System was operated at mixing
speed of 400 rpm using a distilled water (no
microbial activity) at room temperature and
Malaysian Journal Of Science 40(1): 22-33 (February 2021)
28
without any aeration.
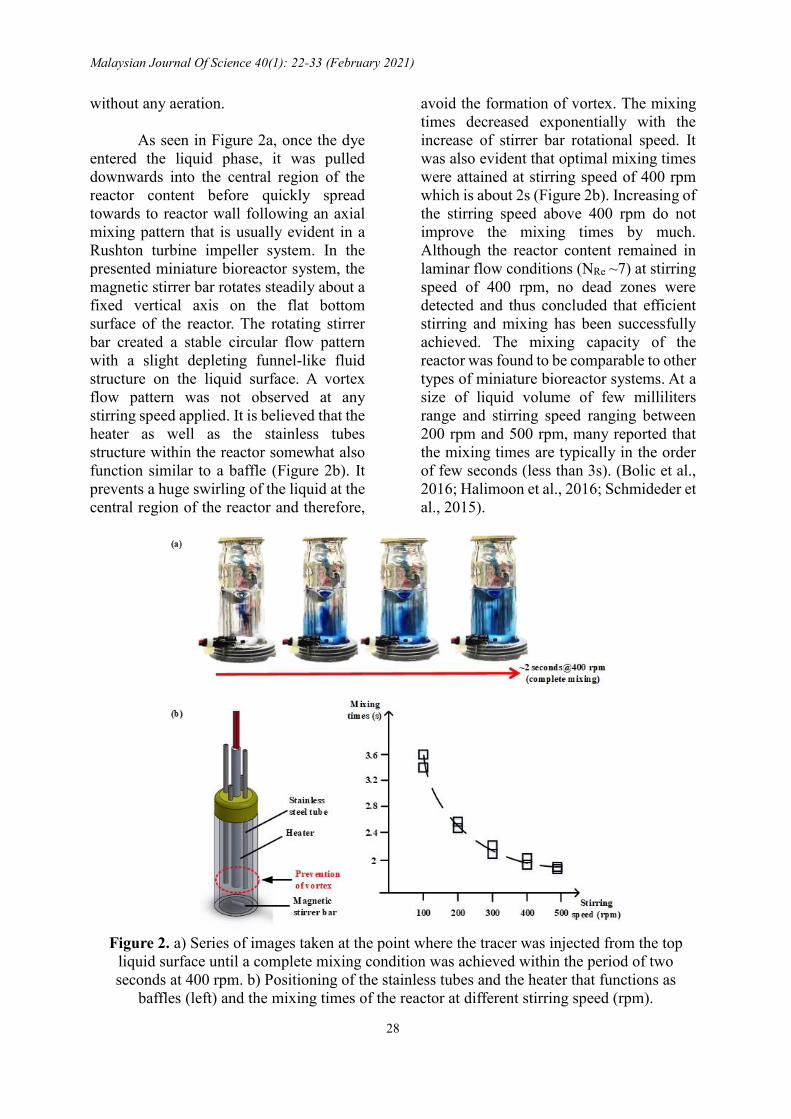
As seen in Figure 2a, once the dye
entered the liquid phase, it was pulled
downwards into the central region of the
reactor content before quickly spread
towards to reactor wall following an axial
mixing pattern that is usually evident in a
Rushton turbine impeller system. In the
presented miniature bioreactor system, the
magnetic stirrer bar rotates steadily about a
fixed vertical axis on the flat bottom
surface of the reactor. The rotating stirrer
bar created a stable circular flow pattern
with a slight depleting funnel-like fluid
structure on the liquid surface. A vortex
flow pattern was not observed at any
stirring speed applied. It is believed that the
heater as well as the stainless tubes
structure within the reactor somewhat also
function similar to a baffle (Figure 2b). It
prevents a huge swirling of the liquid at the
central region of the reactor and therefore,
avoid the formation of vortex. The mixing
times decreased exponentially with the
increase of stirrer bar rotational speed. It
was also evident that optimal mixing times
were attained at stirring speed of 400 rpm
which is about 2s (Figure 2b). Increasing of
the stirring speed above 400 rpm do not
improve the mixing times by much.
Although the reactor content remained in
laminar flow conditions (NRe ~7) at stirring
speed of 400 rpm, no dead zones were
detected and thus concluded that efficient
stirring and mixing has been successfully
achieved. The mixing capacity of the
reactor was found to be comparable to other
types of miniature bioreactor systems. At a
size of liquid volume of few milliliters
range and stirring speed ranging between
200 rpm and 500 rpm, many reported that
the mixing times are typically in the order
of few seconds (less than 3s). (Bolic et al.,
2016; Halimoon et al., 2016; Schmideder et
al., 2015).
Figure 2. a) Series of images taken at the point where the tracer was injected from the top
liquid surface until a complete mixing condition was achieved within the period of two
seconds at 400 rpm. b) Positioning of the stainless tubes and the heater that functions as
baffles (left) and the mixing times of the reactor at different stirring speed (rpm).

Malaysian Journal Of Science 40(1): 22-33 (February 2021)
29
3.2 Temperature control capability of
the reactor
The performance of the on/off
temperature controller capacity employed
in the proposed miniature bioreactor
prototype was evaluated using the set-
point tracking experiments. The
experiment was carried out by increasing
the temperature of the reactor content at
two different set-point values and the
response and accuracy of the controller
was assessed. Figure 3 shows the results of
the temperature control set-point tracking
experiments. Based on the results in Figure
3, every time the temperature set-point
values were adjusted, the heater
immediately heat-up the system, and the
temperature of the reactor content
increases almost instantaneously. No delay
was evident and the response time is less
than a second. However, at higher
temperature set-point values (i.e. when
temperature was adjusted from 30oC to
37oC), it was seen that the temperature
response was a couple of seconds slower.
It also took much longer time to reach the
desired set-point value of 37oC. This was
expected as the driving force the heat
transfer was the temperature difference
(ΔT) between the temperature of the
reactor and the ambient. If one would like
to accelerate the heating step, higher heat
load is required and this is not possible for
on/off control algorithm. In on/off
temperature control algorithm, the same
amount of heat was being transferred into
the reactor content every time during the
heating step. Moreover, an overshoot by
nearly 2oC above the set-point values was
also evident. This could have been due to
the fact that the heater is still warm due to
continuous heating before switching off
and heat transfer from the heater to the
reactor content still occurring.
Nevertheless, once the heater was turned
off, the temperature of the reactor content
slowly reduces reaching the desired
temperature set-point values. No cooling
element was installed in the presented
miniature bioreactor setup and cooling was
entirely depending on the heat loss to the
surroundings. Overall, a satisfactory
degree of control was achieved for the
temperature parameter. The temperature
controller accuracy was about 0.1-0.2ºC
from the temperature set point values.
Surrounding temperatures do not have any
significant effect on the stability of the
temperature controller operation and the
system are usable for temperature set-point
values ranging between 25oC and 40oC.
Figure 3. Results of the temperature set-point tracking experiments for the proposed
miniature bioreactor system. The controller accuracy was in the range of 0.1-0.2oC from the
set-point values and the temperature controller functionality was tested for temperature range
between 25oC and 40oC.

Malaysian Journal Of Science 40(1): 22-33 (February 2021)
30
3.3 Anaerobic fermentation study
using the miniature bioreactor
In order to further evaluate the
functionality of the proposed miniature
bioreactor platform, series of anaerobic
fermentation experiments using
Saccharomyces cerevisae strain were
carried out. The reactor was utilized to
study the effect of substrate concentration
(in this case glucose) on the cell growth.
The industrial relevance of S. cerevisiae
strain in wine making and in beer
production through anaerobic
fermentation route justified the selection
of S. cerevisiae strain for this work. As it
can be observed in Figure 4, the cells grew
instantaneously without any noticeable lag
phase. A high cell concentration during
inoculum stage might have allowed the
yeast cells to quickly adapt to new
environmental conditions in the miniature
bioreactor and replicates. Another reason
probably because the composition and
conditions of the media in the reactor is
very similar to the one in the inoculum and
thus, shortened the acclimation period.
Concurrently to the decrease of the
glucose level in the reactor (Figure 4), it is
presumed that the cells exponential
growth phase began just after an hour
mark. As seen in Figure 4, glucose was
rapidly consumed especially in the first
10-12 hours of fermentation. Cells grew
at its maximum rate between 1 hour and 4
hours of fermentation time. After 4
hours, growth started to slow down and
eventually came to a stationary growth
phase after 22 hours of fermentation. The
specific growth rate of cells at different
initial substrates concentration is
distinguishable by the slope of the cells
growth profiles. Clearly, deceleration of
cells growth was caused by the substantial
reduction of the main substrates which in
this case is the glucose level.
Figure 4. Cell growth (top) and glucose consumption (bottom) profiles of the S.cereviase
batch fermentation experiments carried out at different substrates concentration in the
proposed miniature bioreactor system.
Despite the differences in initial
substrates concentration used, growth
profiles attained were comparable for each
of the fermentation processes performed.
Highest yield recorded was for yeast
fermentation with starting substrate
concentration of 20 g/L where the cell
growth rate, was calculated to be about

Malaysian Journal Of Science 40(1): 22-33 (February 2021)
31
0.37 hr-1. It seemed that as substrates
concentration increases, cell growth rates
increases as well – only not linearly. In
order to further clarify the relation
attained, Monod equation was applied.
Growth parameters namely cell specific
growth rates, and substrate
concentrations, [S] for all fermentation
experiments performed were used to
estimate the growth constants max and Ks
based on the Monod equation. According
to the calculations performed, values for
max and Ks achieved were
0.62 hr-1 and 23.5 g/L, respectively. These
values were comparable to the values
attained in the literature for S.cerevisae
fermentation grown on a single limiting
substrate (Zelenev et al., 2005).
Moreover, during each experiments, small
bubbles (Ø ~ 1-2 mm) started to appear
during exponential cell growth phase at
the gas-liquid (oil layer) interfaces. This
was expected because theoretically, in
anaerobic yeast fermentation the carbon
source (glucose) will be consumed by
cells and converted into ethanol and
carbon dioxide gas. Bubbles formed did
not perturb with the magnetic stirrer bar
mixing efficiency or interrupt the optical
cells density readings. No significant
volume loss due to evaporation was
evident throughout the experiment. This is
contrary to microbioreactor systems with
working volume less than 1 mL where
water evaporation often an issue during
reactor operation (Schäpper et al., 2009).
The presence of oil layer at the gas- liquid
interface might have prevented (or
significantly reduced) the water
evaporation effect apart from preventing
the diffusion of oxygen into the
fermentation broth.
Whilst running numbers of
reproducible batch cultivations in the
proposed miniature bioreactor system is
important to demonstrate its usefulness, it
is also equally important to compare the
results attained with cultivations
performed using shake flask under the
same conditions (i.e. same temperature,
agitation rate and medium). Shake flask
was chosen for the benchmarking
experiments because shake flask are still
the most preferred experimental tools in
bioprocessing especially for screening and
/or optimization purposes. The correspond
ing yeast cultivation as in the miniature
reactor was repeated using shake flask
and the representative time course for the
cell growth is shown in Figure 5. As it can
be seen, although biomass yield for the
cultivation performed in the flask was slig
htly higher but cell growth profiles for
both experiments were indeed similar.
The specific cell growth rates for both
cultivations were also comparable i.e. at
about 0.2 hr-1. In additional experiment, a
small amount of bromothymol blue
solution (a pH indicator) was added into
the medium of the miniature bioreactor
system. The reason was simply to observe
pH changes throughout the fermentation
process. As evident in Figure 5, the color
of the broth changed from green which
indicated pH close to neutral (~pH 7) to
bright yellow that showed a mild acidic
region at about pH 5.5. The color change
also confirmed the fact that carbon
dioxide gas was indeed being produced an
d part of could have dissolved in water.
When CO2 dissolves in water, it instantly
reacts with OH- ions from the water to
produce hydrogen ions, H+ and forms
carbonic acid, H2CO3 which then rapidly
dissociates into bicarbonate, HCO3- (pKa1
at 25oC = 6.36) and also into carbonate,
CO32- (pKa2 at 25oC = 10.32). This
lowers the solution pH (Zainal Alam
et al., 2012).

Malaysian Journal Of Science 40(1): 22-33 (February 2021)
32
Figure 5. Comparison of cell growth profiles for S.cerevisae batch fermentation between
experiments performed in the proposed miniature bioreactor system (working volume = 16
mL) and shake flask (working volume = 50 mL). Inset shows the image of the reactor content
as pH changes during the fermentation process
4. CONCLUSION
The paper presents the design of a
miniature bioreactor system with working
volume of approximately 16 mL. Main
features of the reactor included integrated
optical density (OD) measurement,
independent on/off temperature control,
mixing and mixing via small magnetic
stirrer bar. The workability of the device
was assessed based on the device capacity
to carry out series of batch fermentation
experiments. As it turns out, the growth
profiles of S.cerevisae batch fermentation
processes attained in this study were
comparable to those described in
published works and industrial processes.
This indicated that the proposed miniature
bioreactor setup adequately mimics the
results and/or profiles of a typical
anaerobic yeast fermentation and thus,
demonstrated that such miniature bioreact
or system are indeed suitable to be used
as alternative experimental tool in
bioprocessing. Moreover, the device
was designed with in mind that it will be a
better alternative than shake flask (no
integrated optical density measurement)
and bench scale bioreactors (excessive
workload before and after cultivation and
requires large volume of medium).
5. ACKNOWLEDGEMENT
We would like to express our
gratitude to the Ministry of Higher
Education (MOHE), Malaysia and
Universiti Teknologi Malaysia for funding
the project. The project was funded by
UTM Research University Prototype
Grant Scheme (vote number, 00L49) and
Fundamental Research Grant Scheme
(vote number, 5F230).
6. REFERENCES
Blose, K. J., Krawiec, J. T., Weinbaum, J.
S., and Vorp, D. A. (2014). Bioreactors
for tissue engineering purposes A2—
Orlando: pp177–185.
Bolic, A. (2018). Development and
application of a milliliter-scale
bioreactor for continuous microbial

Malaysian Journal Of Science 40(1): 22-33 (February 2021)
33
cultivations. Thesis of Doctoral
Degree, Denmark Technical University.
Bolic, A., Larsson, H., Hugelier, S., Lantz,
A.E., Krühne, U., and Gernaey, K.V. (
2016). A flexible well-mixed millili
ter-scale reactor with high oxygen tran
sfer rate for microbial cultivation
s. Chemical Engineering Journal. 303,
655–666.
Halimoon, H., Hussain, A., Kouzani, A., &
Alam, M. (2016). Aerobic fermentation
of Saccharomeyes cerevisae in a
miniature bioreactor made of low cost
poly(methylmethacrylate) (PMMA)
and poly(dimethylsiloxane) (PDMS)
polymers. Sains Malaysiana, 45(6),
969-976.
Kheradmandnia, S., Hashemi-Najafabadi,
S., Shojaosadati, S., Mousavi, S., and
Malek Khosravi, K. (2014).
Development of parallel miniature
bubble column bioreactors for
fermentation process. Journal of
Chemical Technology &
Biotechnology, 90(6), 1051-1061.
Kirk, T. and Szita, N. (2013). Oxygen
transfer characteristics of miniaturized
bioreactor systems. Biotechnology and
Bioengineering, 110(4), 1005-1019.
Krakau, K. (2016). Standard Operating
Procedures for a Single-Use Fermenter.
Thesis of Bachelor Degree, Technical
University of Denmark.
Najafpour, G. (2007). Bioreactor
Design. Biochemical Engineering and
Biotechnology, pp.142-169.
Panatto, D., Amicizia, D., Bragazzi, N.,
Rizzitelli, E., Tramalloni, D., Valle, I.
and Gasparini,R. (2015) ‘Human
Papillomavirus Vaccine. Advances in
Protein Chemistry and Structural
Biology’, 231-322.
Schäpper, D., Zainal Alam, M.N.H., Szita,
N., Lantz, A.E. & Gernaey, K.V. 2009.
Application of microbioreactors in
fermentation process development: A
review. Analytical and Bioanalytical
Chemistry 395(3): 679-695.
Schmideder, A., Severin, T., Cremer, J.
and Weuster-Botz, D. (2015). A novel
milliliter-scale chemostat system for
parallel cultivation of microorganisms
in stirred-tank bioreactors. Journal of
Biotechnology, 210, .19-24.
Zainal Alam, M., Jaya Kumar, J., John
Whyte, D., Doeven, E., & Kouzani, A.
(2018). A portable sensor for cell
optical density measurement in
microfluidic chips. Measurement and
Control, 51(7-8), 213-222.
Zainal Alam, M., Schäpper, D. and
Gernaey, K. (2010). Embedded
resistance wire as a heating element for
temperature control in
microbioreactors. Journal of
Micromechanics and
Microengineering, 20(5): 055014.
Zainal Alam, M. N. H., Schäpper, D., and
Gernaey, K. V. (2012). ‘Establishment
of a Gaseous pH concept in
microbioreactors’. International
Conference on Food Engineering &
Biotechnology (3rd ICFEB), Sepang,
Malaysia. ISSN: 2010-4618. Vol3: pg
228-234.
Zelenev, V.V., van Bruggen, A.H.C., and
Semenov, A.M. (2005). Modeling
wave-like dynamics of oligotrophic and
copiotrophic bacteria along wheat roots
in response to nutrient input from a
growing root tip. Ecological
Modelling. 188, 404 – 417.