state and private schools in england and wales alice · pdf filestate and private schools in...
TRANSCRIPT

1
State and Private Schools in England and Wales
Alice Sullivan
and Anthony F Heath
Paper Number 2002-02
Nuffield College, Oxford and Department of Sociology, University of Oxford August 2002 Sociology Working Papers Editors: Diego Gambetta and Michelle Jackson Electronic Editor: Edmund Chattoe http://www.sociology.ox.ac.uk/swps/2002-02.html

2
State and Private Schools in England and Wales
Abstract
This paper investigates the educational success of students at different types of state and private school in England and Wales. The investigation is based on a large-scale panel study which includes prior measures of students’ social backgrounds and cognitive skills. After controlling for intake to the schools, it is found that students at state grammar schools and private schools achieved superior educational outcomes to students at comprehensive schools. Significant differences persist after taking account of various school characteristics. The private school advantage in attainment compared to state comprehensives is not found to be significantly greater than the state grammar school advantage. This has important implications for the explanation of these ‘school effects’.

3
Introduction The question whether private education is superior to state education has been fiercely debated in Britain and elsewhere. School examination results and figures on entry to elite universities suggest that pupils at private schools in Britain perform considerably better educationally than do those in the state sector. For example, whereas less than 10% of the age group attend private schools, nearly half the student entry into Oxford and Cambridge Universities comes from the private sector. Advocates of private schooling have claimed that, since the British private sector is a highly competitive market-based system, and since private schools must respond to parental demands in order to survive, private schools will be better-run and more effective than state schools. Opponents of private schooling sometimes seem torn between the view that private schools give an unfair advantage to the children of the rich, and the claim that the academic success of these schools is entirely due to their intake of able students from affluent backgrounds (Griggs 1985). Yet there is surprisingly little research in Britain to answer the question whether the private schools actually achieve better results than the state sector once students’ individual and family characteristics have been taken into account.
There has been much more work on this topic in the USA. The major U.S.
study carried out by Coleman, Hoffer and Kilgore (1982a) found that students in private schools, particularly in Catholic private schools, achieved higher test scores than those in public schools. They put forward a ‘social capital’ explanation in terms of intergenerational social closure. This generated much debate at the time (see for example Goldberger and Cain 1982; Noell 1982; Coleman et al. 1982b and c; Cain and Goldberger 1983; Alexander and Pallas 1983; Alexander and Pallas 1985). The case for the educational benefit of Catholic schooling has been given recent support (Gamoran 1996; Lee et al. 1998) although debate on Coleman’s findings and their interpretation has continued (Witte 1992; Morgan and Sorensen 1999 a & b; Sampson et al. 1999; Carbanaro 1999; Hallinan and Kubitschek 1999). The issue remains largely unresolved.
American evidence on private schooling cannot be applied directly to other
countries, and the status of private schools in Britain is quite different from that of private schools in either the US or continental Europe. Whereas in the USA, and in most other developed countries, private schools are primarily religious and often highly subsidised (by church or state), British private schools are in the main socially and (often) academically exclusive institutions, which, being unsubsidised, are far too expensive for the bulk of the population1. Because Britain managed to incorporate most denominational schools within the state sector, its private sector is relatively small. As Hillman (1994: 403) puts it:
1 According to the Independent Schools Council Information Service (figures for September 2000), fees range from £1,700 per term for the cheapest private day school place to over £5000 a term at an elite boarding school. (There are three terms in a British school year). A place at Eton College costs £5868 per term.

4
“In most countries private schools provide for religious, ethnic and cultural diversity. In Britain they provide an often high-powered preparation for a significant proportion of the future members of high-status occupations.”
The domination of elite occupations by alumni of the top private schools (often, for historical reasons, termed ‘public schools’) has long been apparent (Boyd 1973). This makes the British case particularly interesting. It provides a test case of the operation of market forces on educational outcomes. British private schools operate within a competitive market place where parents pay considerable fees, presumably in the expectation that they will be achieving some benefits that would not be available to them in the rival free state schools.
Despite the level of public interest in this question, the last systematic study of the effectiveness of different types of school in Britain was carried out by Halsey, Heath and Ridge (1980) using the 1972 Oxford Mobility Study (see also Heath et al. 1984). This study related to a period when British state education was still organised along selective lines: that is to say, within the state sector pupils were allocated, on the basis of a competitive examination at age eleven, either to a grammar school (with a strong academic curriculum preparing students for entry to university), to a technical school (with a more vocational curriculum) or to a secondary modern school (with a much less academic curriculum and preparing students for early entry into the labour market). This was often referred to as the ‘tripartite’ system. Many private schools at this time catered for pupils who had failed the ‘eleven plus’ examination and were destined for secondary modern schools if they remained within the state sector. Halsey, Heath and Ridge suggested that boys at the major private schools fared little better than those from similar backgrounds at the grammar schools, but that the minor private schools provided much better chances to less able boys than did the secondary moderns. However, Halsey and his colleagues were unable to control for pupils’ ability on entry to the schools and their results must therefore be regarded as, at best, provisional.
Moreover, there have been important changes in the nature of the British
educational system since the time of Halsey and his colleagues’ work. In particular in 1965 the Labour government began a process of abolishing selection at age eleven and of replacing the tripartite system of grammar, technical and secondary modern schools with neighbourhood comprehensive schools on the American model. The process was never fully completed; two local educational authorities (and the whole of Northern Ireland) preserved the selective system. In addition, a number of grammar schools were also retained by local educational authorities that adopted comprehensive schools for the bulk of their students. However, by the late 1970s the majority of British state secondary education was organised along comprehensive lines.
There has been a great deal of analysis of this reform (Steedman 1980, 1983a
and b; Cox and Marks 1980; Marks et al. 1983; Clifford and Heath 1984; Kerckhoff and Trott 1993; Kerckhoff et al. 1996; Heath and Jacobs 1999). Analyses have focused on whether the selective ‘tripartite’ system was superior or inferior to the comprehensive system that was replacing it. However, these studies have not examined
5
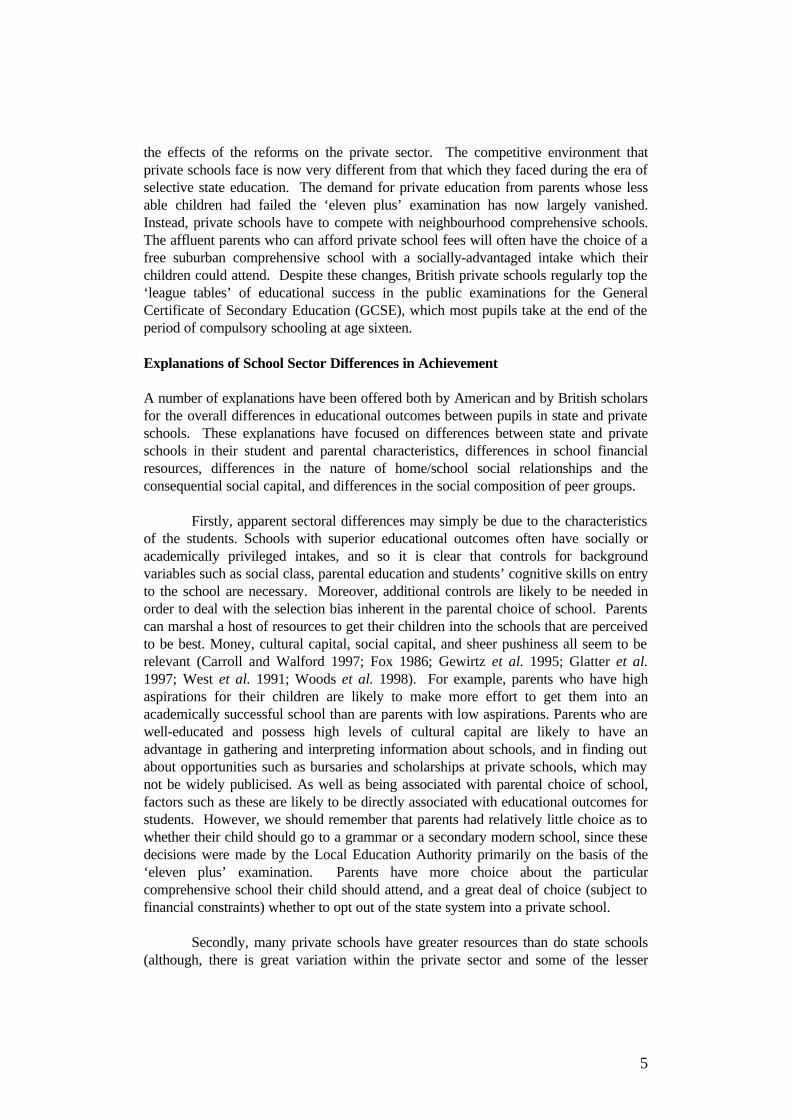
the effects of the reforms on the private sector. The competitive environment that private schools face is now very different from that which they faced during the era of selective state education. The demand for private education from parents whose less able children had failed the ‘eleven plus’ examination has now largely vanished. Instead, private schools have to compete with neighbourhood comprehensive schools. The affluent parents who can afford private school fees will often have the choice of a free suburban comprehensive school with a socially-advantaged intake which their children could attend. Despite these changes, British private schools regularly top the ‘league tables’ of educational success in the public examinations for the General Certificate of Secondary Education (GCSE), which most pupils take at the end of the period of compulsory schooling at age sixteen. Explanations of School Sector Differences in Achievement A number of explanations have been offered both by American and by British scholars for the overall differences in educational outcomes between pupils in state and private schools. These explanations have focused on differences between state and private schools in their student and parental characteristics, differences in school financial resources, differences in the nature of home/school social relationships and the consequential social capital, and differences in the social composition of peer groups.
Firstly, apparent sectoral differences may simply be due to the characteristics of the students. Schools with superior educational outcomes often have socially or academically privileged intakes, and so it is clear that controls for background variables such as social class, parental education and students’ cognitive skills on entry to the school are necessary. Moreover, additional controls are likely to be needed in order to deal with the selection bias inherent in the parental choice of school. Parents can marshal a host of resources to get their children into the schools that are perceived to be best. Money, cultural capital, social capital, and sheer pushiness all seem to be relevant (Carroll and Walford 1997; Fox 1986; Gewirtz et al. 1995; Glatter et al. 1997; West et al. 1991; Woods et al. 1998). For example, parents who have high aspirations for their children are likely to make more effort to get them into an academically successful school than are parents with low aspirations. Parents who are well-educated and possess high levels of cultural capital are likely to have an advantage in gathering and interpreting information about schools, and in finding out about opportunities such as bursaries and scholarships at private schools, which may not be widely publicised. As well as being associated with parental choice of school, factors such as these are likely to be directly associated with educational outcomes for students. However, we should remember that parents had relatively little choice as to whether their child should go to a grammar or a secondary modern school, since these decisions were made by the Local Education Authority primarily on the basis of the ‘eleven plus’ examination. Parents have more choice about the particular comprehensive school their child should attend, and a great deal of choice (subject to financial constraints) whether to opt out of the state system into a private school.
Secondly, many private schools have greater resources than do state schools
(although, there is great variation within the private sector and some of the lesser

6
private schools may even have poorer resources than some state schools). In general, the high fees charged by private schools allow them to provide relatively well-maintained buildings, smaller classes, better equipment and facilities. Walford (1984) argues that the private schools are also advantaged in the teachers they attract, as they are better paid and more highly qualified than teachers at state schools, and are encouraged by their schools to pursue their academic subject. However, it is not clear that financial resources do actually make a difference to schools’ performance. Coleman et al. (1966) found no impact of school resources on academic performance. Debate on this question has continued in the US (for a good summary see Burtless 1996). Studies using school-level data have tended to find only small effects, if any (Betts 1995; Grogger 1996) and, in general, studies examining overall school resources have not found large, significant effects on outcomes for students (Hanushek 1986, 1989)2. Whether specific types of expenditure, such as expenditure directed at classroom teaching and class sizes, can make a difference is also debatable (Hoxby 2000; Wenglinsky 1997). Experimental evidence on class sizes suggests that only large cuts in class size in the earliest years of school make a difference (Hanushek 1999; Prais 1996). One positive finding from this literature is that teachers’ characteristics seem to matter. There is evidence that teachers’ assessed verbal abilities (Ehrenberg and Brewer 1995), their knowledge of the subject (Rowan et al. 1997) and the selectiveness of the institution where teachers obtained their degree (Ehrenberg and Brewer 1994) have an effect on students’ performance.
Thirdly, Coleman and his colleagues (1982a) accounted for the success of Catholic schools in terms of social capital, which they understood as intergenerational social closure. For Coleman, social capital consists of social norms and networks. It exists in the community surrounding a school where parents know each other (and possibly also know the teachers). “A child’s friends and associates in school are sons and daughters of friends and associates of the child’s parents”. (Coleman 1990: 318). This, it is claimed, affects the relationship of parents to the school. Parents are able to get more information about what is going on in the school, and about the behaviour of their own child. Parents who talk to each other can establish strong norms of behaviour for their children. According to Coleman, this enables private schools to place high demands on students, both in terms of discipline and academic attainment. Coleman argues that the community around Catholic schools, which is created by the church, fosters and enforces strong norms against dropping out of high school, and that this explains the lower drop out rate in Catholic schools than in other private schools. Interaction and communication between parents and teachers can be seen as a further aspect of social capital. Schools that maintain close personal links with parents may be able to exert more effective control over students. However, children often travel long distances to attend private schools in Britain (and some private schools are
2 Some researchers have examined school resources at the state or district level, rather than the level of the individual school (Card and Krueger 1992, 1996; Sander 1999). Although these studies show significant effects of school resources on students’ outcomes, it can be argued that these results reflect other state and district level factors, rather than just school resources.

7
residential establishments3), so it may be that there is less intergenerational social closure among parents and pupils at these schools than at state schools, which are more likely to take the majority of their pupils from the local area.
Fourthly, there is a consensus that peer group processes are important and that schools with a high proportion of students of low social status or low academic ability are at a disadvantage (Coleman et al. 1966; Summers and Wolfe 1977; Henderson et al. 1978; Rutter et al. 1979; Willms 1986; Mortimore et al. 1988; Smith and Tomlinson 1989). The desire for a peer group that will have a positive effect on the child seems to be an important factor in school choice (Carroll and Walford 1997), and may be a partial explanation for any ‘private school effect’. However, Evans, Oates and Schwab (1992) strike a note of caution, pointing out that since peer groups are chosen to some degree, apparent peer group effects may be due to unmeasured family characteristics and should not therefore be regarded simply as exogenous explanations of school success.
Peer group processes may account for the belief that private schools provide a
better ‘ethos’ or ‘atmosphere’ than state schools. This is often given as a reason for why parents choose private education for their children (Gewirtz et al. 1995; Walford 1994). For instance, Elgin (1984: 94) quotes a head teacher who explains the appeal of the private sector as follows: “This is a place where a sensitive boy can flourish. A boy can walk here carrying a violin without ridicule.” The fear that comprehensive schools sometimes provide socially problematic environments for able children may be justified. For example, Power, Whitty, Edwards and Wigfall (1998) find that, whereas academically able pupils at a grammar school were likely to worry about not being able to keep up with the work, academically able pupils at a comprehensive school were much more likely to worry about other pupils thinking they were too clever. One could argue that, in this sense, the social norms among school students may vary according to the social and academic composition of the school.
The aim of this paper is to investigate these explanations for the overall
differences in educational outcomes between state and private schools in Britain. Because of the importance of using longitudinal data with prior measures of students’ ability and other characteristics, we use the National Child Development Study (NCDS). This has data on students and their families at ages 7, 11, 16 and 23. It contains measures that enable us to control for prior characteristics of students and their parents before the children entered their secondary schools; it also contains measures of various school characteristics, of some variables that proxy for social capital, and for measures of school composition that proxy for peer group processes. The NCDS data also enable us to compare impacts on two different educational outcomes. Much of the American research, such as that of Coleman et al. (1982) focuses on test scores, and in the NCDS we do have data on test scores at age 16. However, the British educational system is also geared to performance in public examinations such as the GCSE which have crucial roles to play in subsequent
3 At the time the NCDS data were collected, around 30% of independent schools were residential.

8
academic and occupational careers. Performance in these public examinations has real-world consequences for pupils in gaining access to higher education and for success in the labour market (see for example Heath and Cheung 1998). We aim therefore to answer the following questions:
• How did the various types of school attended by the NCDS children vary in terms of student intake, in school resources and other school characteristics, and in students’ test scores and examination performance?
• To what extent are differences in academic outcomes for students at the different types of school explained by differences in the characteristics of the children who attended the schools? Are parents right to believe that, by paying fees for private education, they achieve better results for their children than they would have obtained in a state school?
• Are the better results, if any, obtained at private schools to be explained by the schools’ financial resources, social capital or peer group processes?
We recognize that, even with longitudinal data, it is never possible to control fully for selection biases. Furthermore, more direct measures of social capital and peer group processes would be preferable to the proxies that we have available. The interpretation of any remaining ‘school effects’ after controls for intake and school characteristics will always be problematic: we can never be sure that such ‘school effects’ are not simply a product of unmeasured selection processes. Our focus instead is on whether there are any measurable school characteristics that account for the sectoral differences in students’ educational outcomes after the most rigorous possible controls for student characteristics. Moreover, the NCDS is by far the richest British dataset currently available for exploring these questions, and it enables us to study in some depth an important example of private schooling. We should, however, emphasize that the NCDS data are now quite old and cannot tell us about the current situation in Britain. They are, however, still highly relevant for testing possible explanations of private school outcomes. Data and Measures
• The National Child Development Survey (NCDS) is a longitudinal study of a single cohort born in England and Wales in the week of 3-9 March 1958. Data were collected at six time points: 1958 (shortly after birth),
• sweep 1 - the first follow-up in 1965 when the studied children were aged 7, • sweep 2 in 1969 at age 11, • sweep 3 in 1974 at age 16, • sweep 4 in 1981 at age 23 and • sweep 5 in 1991 at aged 33.
The initial sample was designed to be nationally representative of all children in Britain (that is in England, Wales and Scotland) and achieved a sample size of 17,414 (Shepherd 1995). By the third follow up (sweep 3), when the children were aged 16,

9
14,761 respondents remained in the study. In the present paper we draw on sweeps 1, 2 and 3. We also limit our analysis to England and Wales, omitting Scotland. The Scottish educational system has a number of long-standing differences from that of England and Wales. Most importantly for the present research, Scotland has its own system of public examinations and these are not comparable with the English examinations taken at age 16, which are one of our key dependent variables. The exclusion of Scotland reduces our sample size by 2703. Our effective sample size is further reduced since data on type of secondary school attended was missing for 1,472 respondents. We also exclude the small number of students who attended technical schools (N=65) from our analyses, along with those students who attended schools classified as ‘other’ (N=284). This leaves us with a sample of 10,237 respondents.
The NCDS cohort experienced a state secondary education system that was in transition from the tripartite system to the comprehensive system. However, as the reorganization had not been completed (and indeed was never fully completed), some of the NCDS respondents attended comprehensive schools, while others attended grammar, technical or secondary modern schools.
Private schools at the time were quite diverse, varying in their social and
academic prestige; some had demanding entrance examinations taken at age 13 (the ‘common entrance’ examination) while others were essentially non-selective. We distinguish two types of private school: independent schools, which were funded solely by fees (supplemented sometimes by private endowments) and direct grant schools, which were a kind of hybrid. The direct grant schools charged fees to some students but also received state funding in return for accepting other pupils selected on the basis of the same ‘eleven-plus’ examination as was used for grammar school recruitment. The direct grant schools were therefore highly selective academically and had a lot in common with the grammar schools. In 1975, the Labour government required the direct grant schools either to join the state sector or to become fully independent. However, at the time when the NCDS cohort were completing their secondary education, they remained a significant force. We therefore retain this category in our analysis.
Table 1 shows the distribution of students according to type of secondary
school attended at sweep 3. We distinguish between the three main types of state school (grammar, secondary modern and comprehensive) and the two main types of private school (independent and direct grant). As we can see from table 1, the private sector accounted for only 7% of the sample respondents at age 16. The majority of the cohort attended comprehensive schools. About twice as many students attended secondary modern schools as grammar schools.

10
Table 1: Type of Secondary School Attended Frequency Percent Direct Grant 250 2.4
Independent 438 4.3
Grammar 1285 12.6
Secondary Modern 2556 25.0
Comprehensive 5708 55.8
Total 10237 100.0
The major public examinations open to the NCDS cohort were the General
Certificate of Education at Ordinary level (GCE O-level) and the Certificate of Secondary Education (CSE). These examinations took place at the end of compulsory schooling, at age 16. O-levels were more academically demanding than CSEs. Originally, the O-level curriculum was designed with grammar school students in mind, while CSEs were designed for the students at secondary modern schools. A top CSE pass (grade 1) was deemed to be equivalent to an O-level pass. These two examinations were subsequently merged to form the General Certificate of Secondary Education (GCSE) but at the time the NCDS data were collected they were still distinct.
The NCDS gives exceptionally rich information on various characteristics of
the respondents and their parents. The parents were interviewed at the first three data collection exercises of the study, providing information on social background, age when parents left full-time education, spare-time activities of the parents, parents’ interest in the child’s education and so on. Data were also collected directly from the children through tests and questionnaires administered at school at the ages of 7, 11 and 16. In addition, teachers were asked for information, for example, on whether the parents of the NCDS child had visited the school, and how interested they seemed to be in their child’s education. Extensive information on examination results was also collected directly from the schools in 1978. From the age of 16 onwards, the respondents themselves were also interviewed. For a descriptive report on the test results and examination results achieved by the NCDS students see Steedman (1980, 1983a and b). The variables (and the sweeps in which they were measured) that we have selected for analysis from this vast dataset are as follows: Student characteristics
Sex Test scores at age 11 (sweep 2). The children were given multiple-choice tests
in reading comprehension, mathematics and ‘general ability’ (both verbal and non-verbal). The reading comprehension test was a sentence completion test,

11
designed to be parallel to the Watts-Vernon test of reading ability (see Stark and Wells, 1972). All the tests were compiled by the National Foundation for Educational Research (NFER). Steedman (1980, 1983a and b) gives technical details. Following the standard practice of other researchers who have used these data we have constructed a single scale from these tests. We have standardized this scale with mean of zero and standard deviation of one.
Primary school teacher’s assessment of student’s ability (sweep 2). Teachers gave ratings from 1 (exceptional) to 5 (very limited) for the student’s use of books, number work, general knowledge and oral ability. Although this measure is associated with the student’s test score at age 11 (Pearson’s correlation coefficient 0.80, significant at the 0.01 level), it nevertheless explains additional variance in age-16 outcomes and we have therefore retained it in the analysis.
Family background
Father’s social class (sweep 3). Father’s class is used as mother’s employment was less common at the time the data were collected. The official government measure of socio-economic group (SEG) is used. Following previous British research on social class, we have grouped the sixteen categories of SEG into seven classes: employers and managers in large establishments, employers and managers in small establishments, professionals, own account (non-professional) workers, other non-manual workers, skilled manual workers and manual foremen, and semi and unskilled manual workers. We retain a category for missing data, since (as is not uncommon with data on social origins) substantial numbers did not report their father’s class (for example because they had no contact with their father at the time).
Family structure (sweep 3). NCDS records whether the respondents had two original parents throughout their childhood. Single and step-parent families have consistently been found to be associated with lower levels of educational performance for children than ‘intact’ two parent families, although the reasons for this association are debated (Painter and Levine 2000; Biblarz and Gottainer 2000; Boggess 1998; Downey 1995; Elliott and Richards 1991; Kiernan 1992). We simply distinguish those who had lived with their two original parents throughout from all other family types (the latter consisting of a number of small and somewhat heterogeneous groups).
Number of children under age 21 in the household (sweep 3). Research has consistently found a negative effect of larger family size on children’s educational attainment and test scores (Nisbet 1953; Blake 1981, 1985, 1989; Powell and Steelman 1990). This is likely to be because both parental attention and economic resources are spread more thinly in larger families (Downey 2001; Van Eijck and de Graaf 1995). NCDS presents family size as a categorical variable, which we collapse into three categories: respondents in households with one or two children, those with three or four children, and those with five or more. The data refer to numbers of children living in the household at the time of the survey rather than to completed family size (which is less relevant to our present concerns).

12
Age at which parents left full time education (mother’s or father’s age, whichever was higher) (sweep 3). We distinguish three categories: 15 or less, 16-18, and 19 or over. The minimum legal school-leaving age for the parents would have been age 15. We can think of this as elementary education only. Parents who stayed on until age 16, 17 or 18 would have had some schooling beyond the minimum. Those who stayed on in full-time education beyond the age of 18 would typically have received some tertiary education.
Mother’s book reading (self-reported at sweep 1). Reading can be seen as a measure of ‘cultural capital’ (Bourdieu and Passeron 1977), and parents’ reading behaviour has been shown to be associated with children’s educational success (Crook 1997; de Graaf et al. 2000; Sullivan 2001). The NCDS distinguished whether mothers read ‘most weeks’, ‘occasionally’ or ‘hardly ever’. The NCDS also asked a similar question about father’s book reading, but there is a high degree of collinearity between the two sets of answers and we have found that including a control for father’s book reading as well as mother’s adds very little to the variance explained. We therefore restrict ourselves to mother’s book reading.
Mother’s interest in the child’s education (reported by primary school teacher at sweep 2). Parental interest has been shown to be a major factor in children’s success in the ‘eleven plus’ examination, and may well have influence at later ages too (Douglas 1964). The NCDS distinguished whether mothers were ‘very interested’, had ‘some interest’ or ‘little interest’ in the child’s education. As with book reading, we have not included father’s interest in the models.
School resources
Student-teacher ratio (collected from the school at sweep 3). This measure serves as a proxy for class size. It is likely to reflect a school’s level of funding and may be one of the crucial ways in which funding can affect student outcomes.
Teacher turnover (collected from the school at sweep 3). This is measured by the proportion of teachers who left the school in the previous year. This can be seen as a proxy for teacher quality, but teaching stability may also be beneficial in its own right. Again it may reflect funding.
Parent/school social capital
Whether the school has a parent-teacher association (PTA) (collected from the school at sweep 3). This is simply a binary variable distinguishing schools that had a PTA from those that did not.
Frequency of meetings between parents and teachers (collected from the school at sweep 3). We distinguish schools which had meetings at least yearly from those that had ‘ad hoc’ meetings or none at all.
These variables reflect parent-teacher interaction, which may be thought of as one aspect of a school’s social capital. Unfortunately, no data on relationships between the parents of students attending the same schools, which would provide a better test of Coleman’s hypothesis, are available in the NCDS.

13
Peer group processes Proportion of students from non-manual backgrounds at the school
(collected from the school at sweep 3). We treat this as a proxy for the social character of the individual student’s peer group.
Student outcomes
Number of O-level passes or passes at CSE grade 1 (collected from the school at sweep 3). At the time these data were collected, O level examination boards did not have consistent grading policies (some giving only informal grades and some giving percentage scores rather than grades) so the O level results are analysed in terms of numbers of passes, rather than grades.
Test scores at age 16 (sweep 3). The NCDS administered the same test of reading comprehension at age 16 as was administered at age 11. This probably led to ceiling effects in measuring the improvement of those students who scored highly at age 11. However the students also took a test of mathematics attainment which was designed to be appropriate for the full ability range of 16 year olds. It is the latter measure therefore which we use. The range for this variable was 0-31. For the regression analysis we have standardized scores on this measure, with mean zero and standard deviation of one.
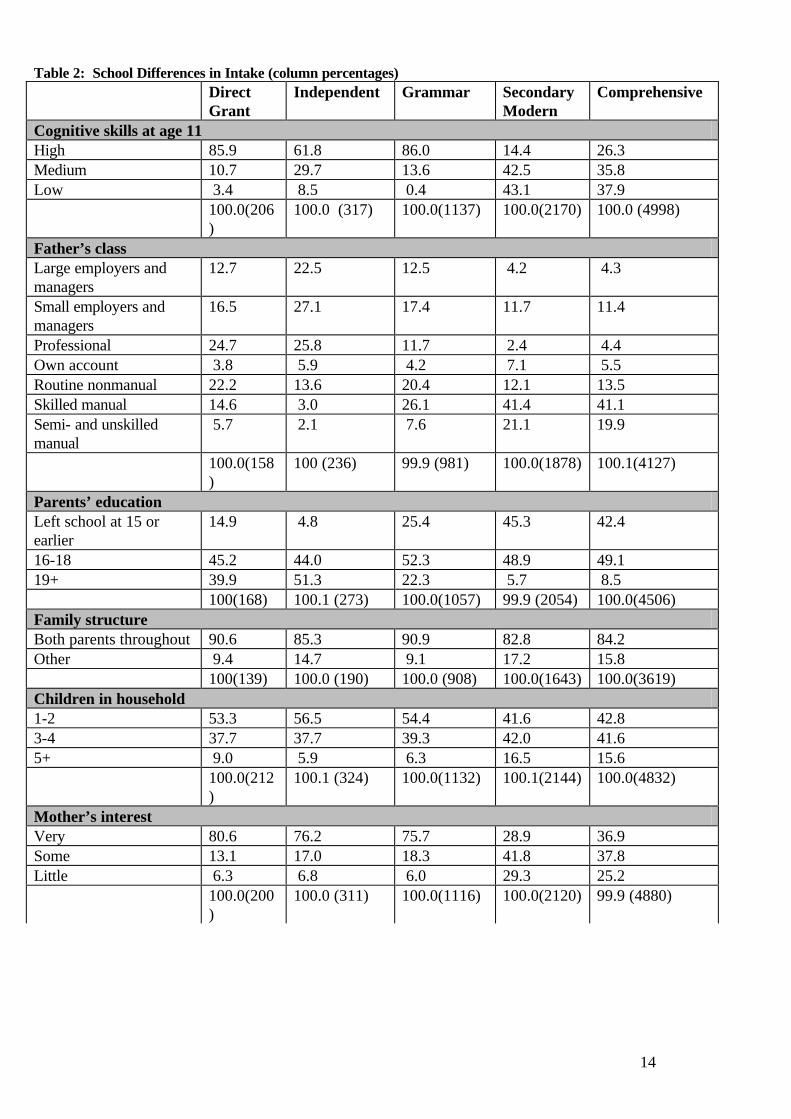
Since there were quite high levels of missing data for some variables collected from the parents, especially the social background variables, we have throughout included additional categories for missing data. In the case of the continuous variables (which were collected through schools) we have set missing values to the mean score for the relevant school type. It should also be noted that, although we have both individual-level and school-level data, we are not able to identify whether students attended the same school as other members of the sample. It is not therefore possible to employ a multilevel statistical model to analyse these data4. School and Student Characteristics We begin our account of the data with a description of the characteristics of the students at the different types of school, the characteristics of the schools, and the educational outcomes. We then turn to a multivariate analysis of the outcomes. Table 2 shows descriptive frequencies for the characteristics of the student intake to each of our main types of school.
4 A further complication is that the sample is not a clustered one with students sampled within schools. Instead, the sample consists of all children born in Britain in the relevant week. It is very likely therefore that many schools would be represented by a single sample member.
14
Table 2: School Differences in Intake (column percentages) Direct
Grant Independent Grammar Secondary
Modern Comprehensive
Cognitive skills at age 11 High 85.9 61.8 86.0 14.4 26.3 Medium 10.7 29.7 13.6 42.5 35.8 Low 3.4 8.5 0.4 43.1 37.9 100.0(206
) 100.0 (317) 100.0(1137) 100.0(2170) 100.0 (4998)
Father’s class Large employers and managers
12.7 22.5 12.5 4.2 4.3
Small employers and managers
16.5 27.1 17.4 11.7 11.4
Professional 24.7 25.8 11.7 2.4 4.4 Own account 3.8 5.9 4.2 7.1 5.5 Routine nonmanual 22.2 13.6 20.4 12.1 13.5 Skilled manual 14.6 3.0 26.1 41.4 41.1 Semi- and unskilled manual
5.7 2.1 7.6 21.1 19.9
100.0(158)
100 (236) 99.9 (981) 100.0(1878) 100.1(4127)
Parents’ education Left school at 15 or earlier
14.9 4.8 25.4 45.3 42.4
16-18 45.2 44.0 52.3 48.9 49.1 19+ 39.9 51.3 22.3 5.7 8.5 100(168) 100.1 (273) 100.0(1057) 99.9 (2054) 100.0(4506) Family structure Both parents throughout 90.6 85.3 90.9 82.8 84.2 Other 9.4 14.7 9.1 17.2 15.8 100(139) 100.0 (190) 100.0 (908) 100.0(1643) 100.0(3619) Children in household 1-2 53.3 56.5 54.4 41.6 42.8 3-4 37.7 37.7 39.3 42.0 41.6 5+ 9.0 5.9 6.3 16.5 15.6 100.0(212
) 100.1 (324) 100.0(1132) 100.1(2144) 100.0(4832)
Mother’s interest Very 80.6 76.2 75.7 28.9 36.9 Some 13.1 17.0 18.3 41.8 37.8 Little 6.3 6.8 6.0 29.3 25.2 100.0(200
) 100.0 (311) 100.0(1116) 100.0(2120) 99.9 (4880)
15
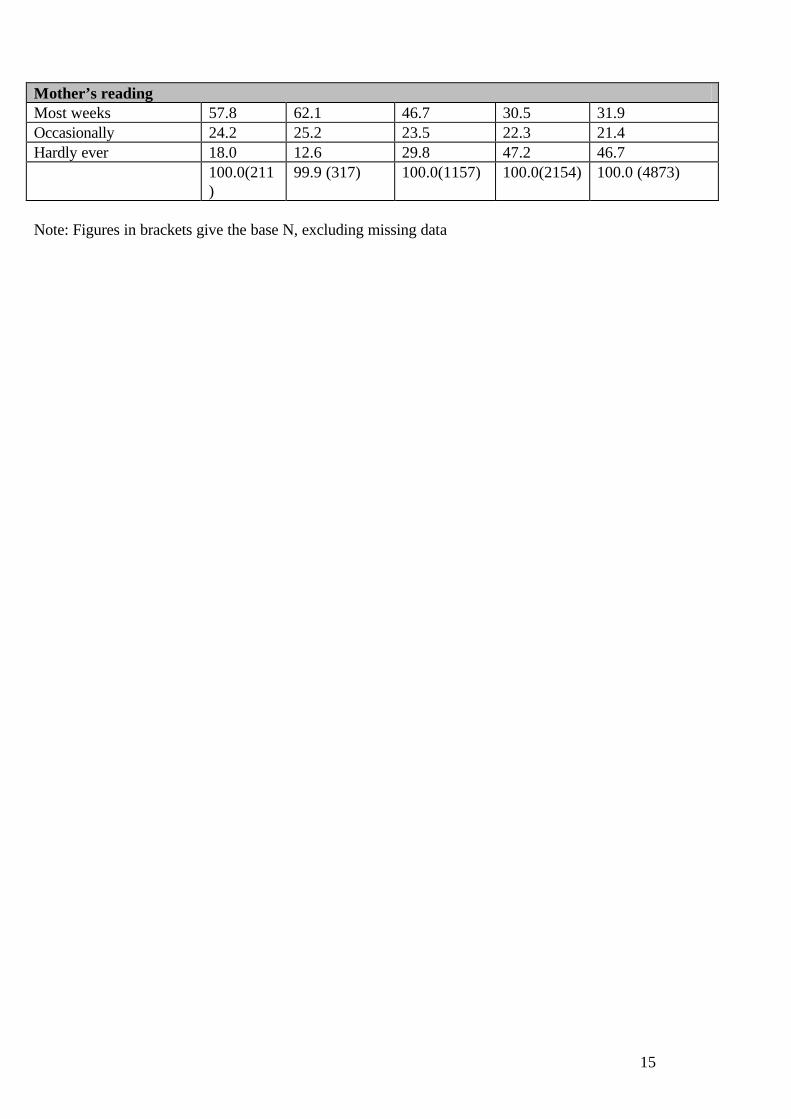
Mother’s reading Most weeks 57.8 62.1 46.7 30.5 31.9 Occasionally 24.2 25.2 23.5 22.3 21.4 Hardly ever 18.0 12.6 29.8 47.2 46.7 100.0(211
) 99.9 (317) 100.0(1157) 100.0(2154) 100.0 (4873)
Note: Figures in brackets give the base N, excluding missing data

16
The different types of school clearly varied in terms of the cognitive skills of their intake. Table 2 shows the percentage of students who fell into the bottom, middle and top thirds of the distribution of test scores at age 11. As we described earlier, entry to the grammar schools was by examination (the ‘eleven plus’), and this is reflected in the performance of the grammar school students in the NCDS tests administered at age 11. Less than 1% of the grammar school students fell into the bottom third of the distribution, while 86% were in the top third. The distribution for the direct grant schools was close to that of the grammar schools, but the independent schools had a considerably less able intake (although a majority were nonetheless in the top third of the distribution). The comprehensive schools had a fairly even distribution, but with highly able pupils slightly under-represented. As one would expect, the secondary moderns had the least able students, but a significant minority who were in the top third on the NCDS tests were consigned to these schools.
Table 2 also shows summary statistics of the social backgrounds of the students at the different types of school. In general, students at the independent schools had the most advantaged social origins both in material and cultural terms. Thus they had the highest proportion of fathers in managerial and professional occupations, the highest proportion with one or other parent leaving full-time education at age nineteen or later, and the highest proportion of mothers reading books regularly. Direct grant schools came close behind the independent schools on all these measures.
At the other extreme were the comprehensive and secondary modern schools.
These two types of school were very similar on average, although we must remember that there would have been considerable diversity between individual comprehensive schools given their geographically diverse catchment areas. Both these types of school scored relatively poorly on the measures of parents’ material and cultural circumstances.
In general, then, we can say that the grammar schools were more academically
selective than the independent schools, while the independent schools were more selective in social and cultural terms than the grammar schools. The direct grant schools in a sense had the best of both worlds, matching the grammar schools with respect to the cognitive skills of their intake and coming close to the independent schools on many of the socio-cultural measures. All three outstripped the comprehensive school students on every single measure. Finally, secondary modern school students were the most disadvantaged on both academic and socio-cultural criteria.
We turn next to the characteristics of the schools. In general, the fees charged by private schools allowed them to provide relatively good resources. In addition, grammar schools received greater funding per student than secondary moderns. Table 3 shows that student-teacher ratios were highest at the secondary moderns, which had the lowest levels of funding. Comprehensive schools had rather more favourable

17
pupil-teacher ratios, reflecting their higher level of state funding5. Grammar schools had even more favourable pupil-teacher ratios, while the direct grant schools’ ratio was very similar to that of the grammar schools (reflecting the fact that the funding formula for pupils funded by the state would have been the same as that for grammar schools). However, independent schools had substantially more favourable pupil-teacher ratios than did any other type of school. Table 3: Differences in School Characteristics Direct
Grant Independent Grammar Secondary
Modern Comprehensive
Parent-Teacher Association Yes 70.3 35.0 77.5 53.1 73.7 No 29.7 65.0 22.5 46.9 26.3 100.0(249) 100.0 (432) 100.0(1278) 100.0(2539) 100.0 (5656) Parent-teacher meetings At least yearly 98.8 85.0 96.6 90.7 96.7 None or adhoc 1.2 15.0 3.4 9.3 3.3 100.0(249) 100 (434) 100.0(1278) 100.0(2540) 100.0(5664) Student-teacher ratio Mean ratio 15.6 12.9 16.0 18.1 17.2 (229) (386) (1207) (2238) (4812) Teacher turnover Mean annual rate
11.2 13.4 13.8 15.6 14.9
(248) (414) (1264) (2458) (5492) Social class composition (% nonmanual) 0-9 4.6 2.4 1.2 15.5 8.8 10-19 0.5 0.2 5.8 27.9 21.9 20-29 5.1 0.5 7.0 21.7 24.7 30-39 1.4 0.5 7.8 13.6 16.1 40-49 2.3 0.7 10.3 7.0 9.3 50-59 13.8 2.7 16.8 7.7 8.4 60-69 9.2 2.9 17.9 3.5 7.1 70-79 11.5 6.1 9.9 2.7 2.5 80+ 51.6 84.0 23.4 0.4 1.2 100.0(217) 100.0 (414) 100.0(1074) 100.0(2198) 100.0 (4812) Note: Figures in brackets give the base N, excluding missing data.
5 In essence, there was higher funding for students staying on to take advanced courses after age 16, and comprehensive schools had higher proportions of such students than did secondary modern schools. However, it is likely that the benefits of such funding would have been spread to some extent among all students at the school and not restricted solely to those taking the advanced courses.
18
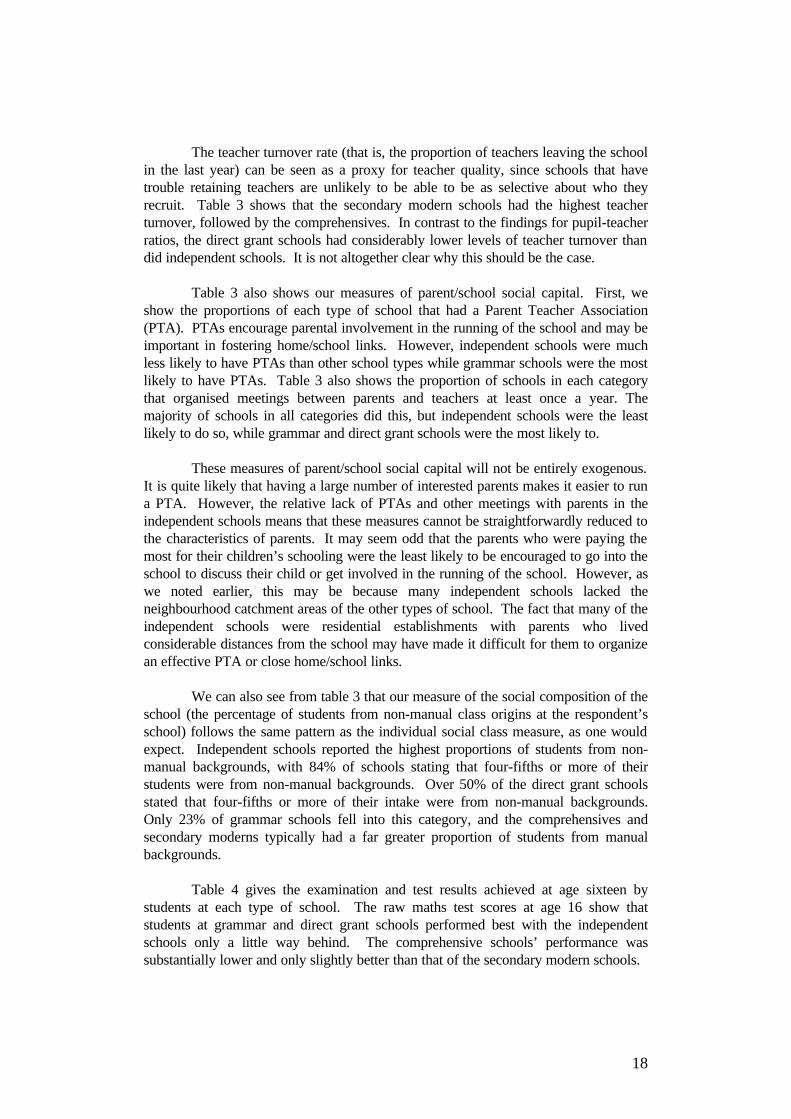
The teacher turnover rate (that is, the proportion of teachers leaving the school in the last year) can be seen as a proxy for teacher quality, since schools that have trouble retaining teachers are unlikely to be able to be as selective about who they recruit. Table 3 shows that the secondary modern schools had the highest teacher turnover, followed by the comprehensives. In contrast to the findings for pupil-teacher ratios, the direct grant schools had considerably lower levels of teacher turnover than did independent schools. It is not altogether clear why this should be the case.
Table 3 also shows our measures of parent/school social capital. First, we
show the proportions of each type of school that had a Parent Teacher Association (PTA). PTAs encourage parental involvement in the running of the school and may be important in fostering home/school links. However, independent schools were much less likely to have PTAs than other school types while grammar schools were the most likely to have PTAs. Table 3 also shows the proportion of schools in each category that organised meetings between parents and teachers at least once a year. The majority of schools in all categories did this, but independent schools were the least likely to do so, while grammar and direct grant schools were the most likely to.
These measures of parent/school social capital will not be entirely exogenous.
It is quite likely that having a large number of interested parents makes it easier to run a PTA. However, the relative lack of PTAs and other meetings with parents in the independent schools means that these measures cannot be straightforwardly reduced to the characteristics of parents. It may seem odd that the parents who were paying the most for their children’s schooling were the least likely to be encouraged to go into the school to discuss their child or get involved in the running of the school. However, as we noted earlier, this may be because many independent schools lacked the neighbourhood catchment areas of the other types of school. The fact that many of the independent schools were residential establishments with parents who lived considerable distances from the school may have made it difficult for them to organize an effective PTA or close home/school links.
We can also see from table 3 that our measure of the social composition of the
school (the percentage of students from non-manual class origins at the respondent’s school) follows the same pattern as the individual social class measure, as one would expect. Independent schools reported the highest proportions of students from non-manual backgrounds, with 84% of schools stating that four-fifths or more of their students were from non-manual backgrounds. Over 50% of the direct grant schools stated that four-fifths or more of their intake were from non-manual backgrounds. Only 23% of grammar schools fell into this category, and the comprehensives and secondary moderns typically had a far greater proportion of students from manual backgrounds.
Table 4 gives the examination and test results achieved at age sixteen by students at each type of school. The raw maths test scores at age 16 show that students at grammar and direct grant schools performed best with the independent schools only a little way behind. The comprehensive schools’ performance was substantially lower and only slightly better than that of the secondary modern schools.

19
Table 4 School Differences in Outcomes
Direct
Grant Independent Grammar Secondary
Modern Comprehensive
Number of examination passes None 3.6 8.4 4.6 20.0 14.7 Lower grades of CSE only
6.0 7.5 5.3 46.0 39.7
1-4 O levels or CSE grade 1
15.3 23.8 26.3 25.7 26.6
5-7 O levels or CSE grade 1
27.0 24.3 27.4 5.8 10.8
8+ O levels of CSE grade 1
48.0 36.0 36.5 2.5 8.2
N 248 428 1268 2499 5610 Mean number of passes at O level or CSE grade 1 Mean (St dev) 6.5 (2.7) 5.5 (3.1) 5.7 (2.9) 1.0 (1.8) 1.8 (2.7) N 248 428 1268 2499 5610 Maths score at age 16 Mean score () 20.6 (6.0) 18.0 (6.6) 20.4 (5.3) 10.1 (5.2) 11.7 (6.3) N 250 427 1271 2518 5605 Reading score at age 16 Mean score () 31.7 (3.4) 30.0 (4.1) 31.2 (3.0) 23.5 (6.8) 24.7 (6.9) N 250 427 1274 2529 5627
Turning next to the number of passes obtained at GCE O level (or at CSE grade 1), we see that the grammar, independent and direct grant schools had very similar success rates. All three types of school had over 60% of their students gaining five or more O levels or CSE grade 1s. (Recall that CSE grade 1 was seen as equivalent to an O level pass). The direct grant schools had the highest proportion of students achieving eight or more O levels or equivalent. The secondary moderns were the least successful in securing any passes at all for their pupils, followed by the comprehensives. Overall, table 4 shows that the academically-selective schools all achieved an average of over five passes, while the comprehensive students gained 1.8 passes and the secondary modern students gained 1 pass on average.

20
Analysis of Age-Sixteen Outcomes
American studies commonly use test scores as a measure of outcomes for students, while British studies typically use public examination results. As we noted earlier, the NCDS contains data both on the results of tests administered to students at age sixteen and on examination results at the same age. We provide analyses of both outcomes. We begin with the test scores.
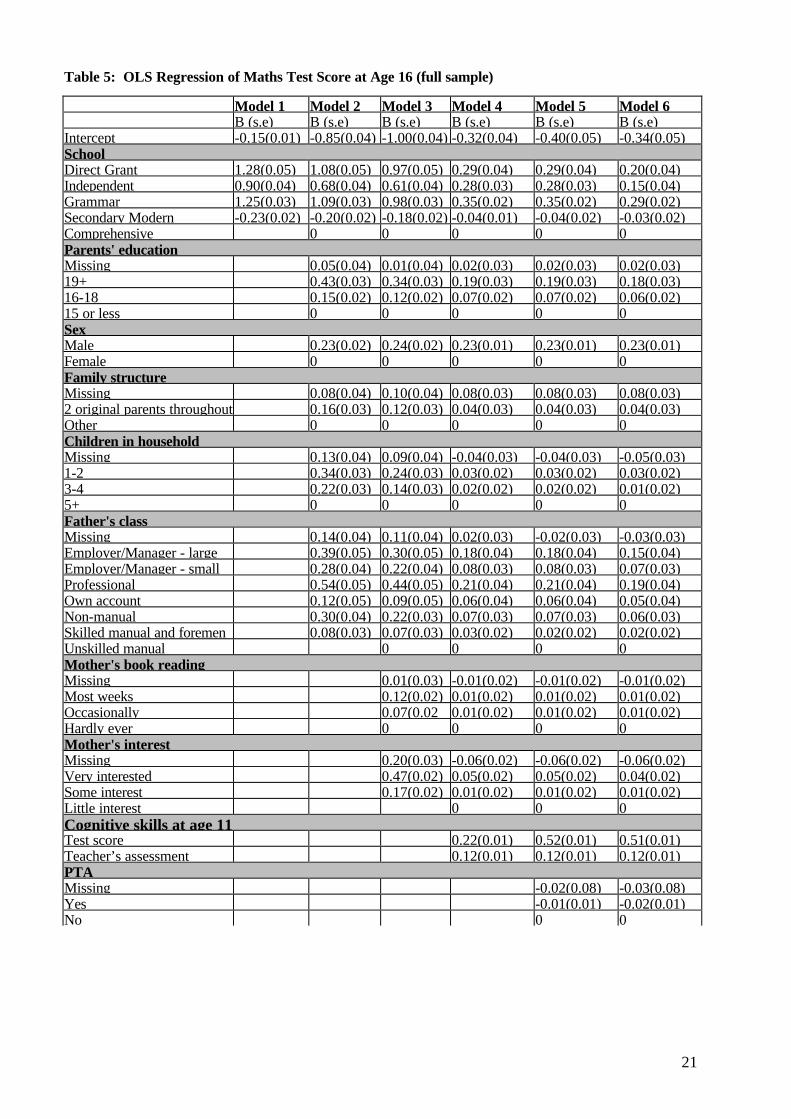
The age sixteen NCDS tests were multiple-choice tests of maths and English. As we noted earlier, because of the probable ceiling effects involved in the English test, we focus here solely on the maths scores. Table 5 shows the results of a series of linear regression models with these scores as the outcome variable. Model 1 simply includes school type and thus in effect repeats the information about the overall differences between the five types of school shown in table 4. Students at comprehensive schools provide the reference category. As we can see, students at direct grant and grammar schools achieved the highest test results, followed by those at independent schools. Secondary modern students scored significantly lower than students at comprehensive schools.
21
Table 5: OLS Regression of Maths Test Score at Age 16 (full sample)
Model 1 Model 2 Model 3 Model 4 Model 5 Model 6 B (s.e) B (s.e) B (s.e) B (s.e) B (s.e) B (s.e) Intercept -0.15(0.01) -0.85(0.04) -1.00(0.04) -0.32(0.04) -0.40(0.05) -0.34(0.05) School Direct Grant 1.28(0.05) 1.08(0.05) 0.97(0.05) 0.29(0.04) 0.29(0.04) 0.20(0.04) Independent 0.90(0.04) 0.68(0.04) 0.61(0.04) 0.28(0.03) 0.28(0.03) 0.15(0.04) Grammar 1.25(0.03) 1.09(0.03) 0.98(0.03) 0.35(0.02) 0.35(0.02) 0.29(0.02) Secondary Modern -0.23(0.02) -0.20(0.02) -0.18(0.02) -0.04(0.01) -0.04(0.02) -0.03(0.02) Comprehensive 0 0 0 0 0 Parents' education Missing 0.05(0.04) 0.01(0.04) 0.02(0.03) 0.02(0.03) 0.02(0.03) 19+ 0.43(0.03) 0.34(0.03) 0.19(0.03) 0.19(0.03) 0.18(0.03) 16-18 0.15(0.02) 0.12(0.02) 0.07(0.02) 0.07(0.02) 0.06(0.02) 15 or less 0 0 0 0 0 Sex Male 0.23(0.02) 0.24(0.02) 0.23(0.01) 0.23(0.01) 0.23(0.01) Female 0 0 0 0 0 Family structure Missing 0.08(0.04) 0.10(0.04) 0.08(0.03) 0.08(0.03) 0.08(0.03) 2 original parents throughout 0.16(0.03) 0.12(0.03) 0.04(0.03) 0.04(0.03) 0.04(0.03) Other 0 0 0 0 0 Children in household Missing 0.13(0.04) 0.09(0.04) -0.04(0.03) -0.04(0.03) -0.05(0.03) 1-2 0.34(0.03) 0.24(0.03) 0.03(0.02) 0.03(0.02) 0.03(0.02) 3-4 0.22(0.03) 0.14(0.03) 0.02(0.02) 0.02(0.02) 0.01(0.02) 5+ 0 0 0 0 0 Father's class Missing 0.14(0.04) 0.11(0.04) 0.02(0.03) -0.02(0.03) -0.03(0.03) Employer/Manager - large 0.39(0.05) 0.30(0.05) 0.18(0.04) 0.18(0.04) 0.15(0.04) Employer/Manager - small 0.28(0.04) 0.22(0.04) 0.08(0.03) 0.08(0.03) 0.07(0.03) Professional 0.54(0.05) 0.44(0.05) 0.21(0.04) 0.21(0.04) 0.19(0.04) Own account 0.12(0.05) 0.09(0.05) 0.06(0.04) 0.06(0.04) 0.05(0.04) Non-manual 0.30(0.04) 0.22(0.03) 0.07(0.03) 0.07(0.03) 0.06(0.03) Skilled manual and foremen 0.08(0.03) 0.07(0.03) 0.03(0.02) 0.02(0.02) 0.02(0.02) Unskilled manual 0 0 0 0 Mother's book reading Missing 0.01(0.03) -0.01(0.02) -0.01(0.02) -0.01(0.02) Most weeks 0.12(0.02) 0.01(0.02) 0.01(0.02) 0.01(0.02) Occasionally 0.07(0.02 0.01(0.02) 0.01(0.02) 0.01(0.02) Hardly ever 0 0 0 0 Mother's interest Missing 0.20(0.03) -0.06(0.02) -0.06(0.02) -0.06(0.02) Very interested 0.47(0.02) 0.05(0.02) 0.05(0.02) 0.04(0.02) Some interest 0.17(0.02) 0.01(0.02) 0.01(0.02) 0.01(0.02) Little interest 0 0 0 Cognitive skills at age 11 Test score 0.22(0.01) 0.52(0.01) 0.51(0.01) Teacher’s assessment 0.12(0.01) 0.12(0.01) 0.12(0.01) PTA Missing -0.02(0.08) -0.03(0.08) Yes -0.01(0.01) -0.02(0.01) No 0 0

22
Parent-teacher meetings Missing 0.08(0.09) 0.07(0.09) At least yearly 0.09(0.03) 0.07(0.03) None or ad hoc 0 0 School resources student-teacher ratio -0.01(0.01) -0.01(0.01) Teacher turnover 0.001(0.01) 0.02(0.01) School composition % nonmanual 0.07(0.01) N 10071 10071 10071 10071 10071 10071 R2 0.260 0.337 0.368 0.579 0.579 0.582
23
Our primary concern is how far these gross differences can be explained by our various measures of the characteristics of the students and their families and by the characteristics of the schools. We therefore introduce successive blocks of predictors, corresponding to the theoretical ideas sketched above, and check to see by how much each block reduces the estimated coefficients associated with school type. Broadly speaking, we introduce blocks of factors according to their temporal order in the life cycle. Thus we begin with a block of ascribed characteristics and characteristics of the parents. We then move on to the respondents’ test scores at age 11 before finally turning to the characteristics of the schools that the students attended after the age of 11.
Model 2 includes the family background variables (namely father’s class,
parental education, family structure and number of children in the household, together with gender). All of these are significant and all of them operate in the direction expected. Thus higher social classes are associated with higher test scores than the reference category of students from unskilled manual backgrounds; higher levels of parental education are associated with higher student test scores; boys performed significantly better than girls in maths; students from an ‘intact’ family, and those with fewer siblings scored significantly higher than those in larger families. The introduction of this block of measures somewhat reduces the parameter estimates associated with the different types of schools. The biggest reductions occur in the case of direct grant and independent schools, which were as we saw earlier the two types of school with the most socially-advantaged intakes. However, these parameter estimates continue to be significantly different from the reference category of comprehensive school.
We saw earlier that schools’ intakes varied not just in terms of the standard
social background measures such as social class and parental education, but also in terms of parental interest and reading. Since these factors may influence the students’ educational success, and may also be associated with parents’ choice of school, it is crucial to control for them if we are to minimize selection biases. As we can see from model 3, mother’s interest in the child’s education as reported by primary school teachers at sweep 2, and mothers’ reading behaviour as reported by the mothers themselves at sweep 1 are both significantly associated with the age-16 test scores. The introduction of these factors brings a further, albeit modest, reduction in the estimates associated with school type.
Model 4 then adds measured ability at age 11 and teacher’s assessment of the
child’s performance at primary school. As might be expected, measured ability at age 11 has a particularly strong association with test scores at age 16. (The parameter estimate is over thirty times its standard error, making this by far the most significant association in the analysis). The estimates associated with school type are very substantially reduced in this model, and are now less than one third of the original gross differences found in model 1. In particular, the estimates for grammar and direct grant schooling fall most after controlling for ability on entry to the school, while the estimate for independent schooling fall somewhat less (as we would have expected from the data on intake). The negative estimate for secondary modern schooling is also

24
very substantially reduced. However, all the school-type parameters continue to be statistically significant in this model.
These school-type estimates in model 4 give us an idea of the maximum effect
that schools might be having on their students’ progress while they are at secondary school. Since we have measures of test scores both at age 11 and at age 16, the school estimates are in essence now measures of progress6. While there are almost certainly additional controls for social background and parental attributes that it would be desirable to include, it is unlikely that any background measures which are constant over time could successfully explain the estimated school differences in student progress that we see in model 4.
The estimates in model 4 also suggest that independent, direct grant and
grammar schools are associated with rather similar gains in their students’ progress (their estimates not being significantly different from each other). This strongly suggests that the processes involved are not ones limited to private schools but apply to the state-funded grammar schools as well. We now turn to consider whether any of our measures of school characteristics can explain these estimates of progress.
School-level characteristics are included in models 5 and 6. In model 5 neither
pupil-teacher ratio nor teacher turnover has a significant association with age-16 test scores. Hence, although private schools were strongly advantaged in these respects, this cannot explain their success. Model 5 also includes our two proxies for parent/school social capital. We see that the existence of a PTA does not have a significant association with age 16 test scores, but the frequency of meetings between parents and teachers does. However, this has no impact on the school estimates: as we saw in table 3, school types did not vary very much in their frequency of parent/teacher meetings and hence it is not surprising that the inclusion of parent/teacher meetings in the model fails to account for the outcome differences between schools.
Finally, in model 6, we include the measure of the social-class composition of
the school. This has a highly significant association with student outcomes (nearly ten times its standard error). As expected, the higher the proportion of students in the school from non-manual backgrounds, the higher the test scores at age 16, even after controlling for the individual student’s social background. Given the marked differences between school types in their scores on this variable, it is not surprising that our estimates of school effects are somewhat reduced in this model. The biggest reduction occurs among the independent schools (which had the most favourable social class composition) and there is a lesser reduction for grammar schools. The upshot of this is that the estimates for all three types - independent, direct grant, and grammar - are of broadly similar magnitude in model 6 with the grammar schools showing the
6 Strictly speaking, to be a measure of progress since age 11 we should include maths score at age 11 as a control instead of the composite measure actually used in the analysis. However, when we include separate measures of age 11 reading score, maths score and general ability, our conclusions remain essentially unchanged.

25
largest estimate and the independent schools the smallest estimate of the three school types.
We now turn to consider examination results at GCE O level (and its
equivalent). As we noted earlier, these examination results have real-world consequences and it is likely to be these, rather than test scores, that the parents of private school students are particularly concerned about. It is likely that private schools placed particular emphasis on preparing their pupils for these examinations.
However, the GCE O-level was an examination that was designed for students
of higher ability, such as students at grammar schools, and few students at secondary modern schools would have been entered for these examinations. Accordingly in the sample as a whole the distribution of O-level passes is very highly skewed. It is therefore appropriate to restrict our sample, when analysing success at O level, to students of high ability (measured at age 11). This corresponds to educational practice at the time these NCDS data were collected. In the analyses reported in table 6, therefore, the sample is restricted to the top third of the ability distribution (measured at age 11). In order to compare school effects on examination passes with those on test scores, we have replicated the previous analyses of test scores restricting the sample in the same way. These results for the restricted sample are shown in the Appendix.

26
Table 6: OLS Regression of Number of O Level Passes (top third of sample)
Model 1 Model 2 Model 3 Model 4 Model 5 Model 6 B (s.e) B (s.e) B (s.e) B (s.e) B (s.e) B (s.e) Intercept 4.58(0.08) 2.22(0.36) 1.57(0.40) -0.32(0.38) -0.32(0.44) 0.11(0.45)
Direct Grant 2.35(0.24) 1.94(0.23) 1.80(0.23) 0.94(0.22) 0.94(0.22) 0.65(0.23) Independent 2.09(0.23) 1.53(0.23) 1.43(0.23) 1.22(0.21) 1.22(0.21) 0.70(0.26) Grammar 1.46(0.12) 1.24(0.12) 1.16(0.12) 0.65(0.12) 0.65(0.12) 0.43(0.13) Secondary Modern -1.56(0.19) -1.43(0.19) -1.33(0.19) -0.76(0.17) -0.76(0.17) -0.72(0.18) Comprehensive 0 0 0 0 0 0 Parents' education Missing 0.12(0.30) -0.00(0.31) -0.10(0.29) -0.10(0.29) -0.13(0.29) 19+ 1.39(0.19) 1.24(0.19) 0.84(0.18) 0.84(0.18) 0.81(0.18) 16-18 0.28(0.14) 0.25(0.14) 0.12(0.13) 0.13(0.13) 0.12(0.13) 15 or less 0 0 0 0 0 Sex Male -0.10(0.10) -0.05(0.10) -0.14(0.10) -0.14(0.10) -0.14(0.10) Female 0 0 0 0 0 Family structure Missing 0.77(0.27) 0.85(0.31) 0.85(0.29) 0.87(0.29) 0.85(0.29) 2 original parents 0.73(0.22) 0.70(0.22) 0.60(0.21) 0.62(0.21) 0.60(0.21) Other 0 0 0 0 0 Children in household Missing 0.06(0.32) -0.05(0.32) -0.17(0.30) -0.17(0.30) -0.19(0.30) 1-2 0.88(0.22) 0.74(0.22) 0.49(0.20) 0.50(0.20) 0.45(0.20) 3-4 0.75(0.23) 0.62(0.23) 0.36(0.21) 0.37(0.21) 0.33(0.21) 5+ 0 0 0 0 0
Missing 0.70(0.30) 0.67(0.29) 0.45(0.27) 0.46(0.27) 0.40(0.27) Employer/Manager - large 1.27(0.27) 1.17(0.27) 1.04(0.25) 1.04(0.25) 0.94(0.25) Employer/Manager - small 0.67(0.24) 0.59(0.24) 0.47(0.22) 0.47(0.22) 0.40(0.22) Professional 1.63(0.28) 1.54(0.27) 1.20(0.25) 1.19(0.25) 1.11(0.25) Own account 0.77(0.35) 0.70(0.35) 0.57(0.32) 0.55(0.32) 0.51(0.32) Non-manual 1.05(0.24) 0.96(0.24) 0.75(0.22) 0.75(0.22) 0.69(0.22) Skilled manual & foremen 0.32(0.22) 0.35(0.22) 0.28(0.20) 0.27(0.20) 0.26(0.20) Unskilled manual 0 0 0 0 0 Mother's book reading Missing -0.06(0.24) -0.12(0.22) -0.14(0.22) -0.17(0.22) Most weeks 0.22(0.14) 0.12(0.12) 0.11(0.12) 0.09(0.12) Occasionally 0.06(0.15) 0.02(0.14) 0.01(0.14) -0.01(0.14) Hardly ever 0 0 0 0 Mother's interest Missing 0.72(0.37) 0.56(0.34) 0.58(0.34) 0.61(0.34) Very interested 1.01(0.19) 0.66(0.18) 0.66(0.18) 0.66(0.18) Some interest 0.38(0.21) 0.35(0.19) 0.35(0.19) 0.35(0.19) Little interest 0 0 0
Test score 2.06(0.13) 2.05(0.13) 2.02(0.13) Teacher’s assessment 0.57(0.08) 0.57(0.08) 0.56(0.08)

27
PTA Missing -1.11(0.64) -1.11(0.64) Yes -0.04(0.11) -0.08(0.11) No 0 0
Missing 0.59(0.89) 0.61(0.89) At least yearly -0.15(0.25) -0.20(0.25) None or ad hoc 0 0 School resources Student-teacher ratio -0.25(0.18) -0.22(0.18) Teacher turnover 0.02(0.06) 0.02(0.06)
% nonmanual 0.19(0.06) N 2721 2721 2721 2721 2721 2721 R2 0.129 0.201 0.215 0.332 0.334 0.337
We follow the same basic procedure in analysing examination results as with
the models for test scores at age 16, and in our report in this section of the paper we will focus on the main differences between the results for the two outcomes. Thus in model 1 of table 6 note that independent and direct grant schools have superior gross examination outcomes to grammar schools, whereas in test scores independent schools were more than matched by the grammar schools.
Model 2 includes the family background measures. All of these measures are
significant, and the main school effects are reduced. In contrast to the analyses of test scores (both those in the full and the restricted samples), boys do not outperform girls in their examination results. Although girls’ examination success is often treated as a recent phenomenon, the girls in the NCDS sample gained as many O level passes as the boys. The contrast with the gender effect on the test scores illustrates the importance of the type of test used. The test scores are entirely based on multiple-choice questions, whereas O levels were largely based on essay questions. Boys generally have a comparative advantage in mathematics, and perform better than girls in multiple choice tests but not in tests requiring longer written answers (Gipps and Murphy 1994).
Model 3 includes our proxies for cultural capital, and once again we see some significant parameter estimates but only modest reductions in the size of the school effects. Model 4 then includes test scores at age 11 and primary school teacher’s assessment of students’ ability. These are both highly significant and the school effects are reduced further. Since we have restricted the sample to the top third of the ability range, the reduction in the size of the school parameters is not quite as dramatic as was the case for test scores in the full sample.

28
The school characteristics are included in model 5. None of these characteristics has a significant effect and the school parameters remain effectively unchanged. However, in model 6 the percentage of non-manual children does have a significant positive association with examination success and there is a further reduction in the school parameter estimates. As with the analysis of test scores, in this final model the independent, direct grant and grammar schools have broadly similar estimates7. The estimates are all highly significant relative to the reference category of comprehensive school, but formal tests indicate that the wholly private independent schools do not perform significantly better than the hybrid direct grant schools or than the wholly state-funded grammar schools. Conclusions This paper has provided an exploration of some of the key differences between British private schools (both the independent and the hybrid direct grant) and state schools (comprehensive, grammar and secondary modern) in terms of intake, school resources, and outcomes. As expected we found clear differences in the schools’ intakes: private schools had privileged intakes in terms of students’ cognitive skills and parents’ social class, education, reading behaviour and interest in their child’s education. However, there were some differences between the independent and direct grant schools. The academically-selective direct grant schools had a lower proportion of parents from the employer and managerial classes but a greater proportion of very able students than the independent schools. This may reflect a trade-off between high fees and high entrance requirements; schools which set fees very high may not have been able to afford to make the entrance examination too demanding. The grammar schools’ intake was similar to that of the direct grant schools in terms of the cognitive skills of the students, but the grammar schools had a broader social class distribution, with a lower proportion of professional parents and a higher proportion of manual workers. The comprehensives, and especially the secondary moderns, had a relatively deprived intake in terms of both students’ cognitive skills and family characteristics.
As one would expect, private schools were also privileged in terms of their resources. Independent schools had the lowest average student-teacher ratios, while direct grant schools had similar student-teacher ratios to grammar schools. This almost certainly reflects a higher level of financial resources at the independent schools. However, there was no sign that the independent schools had higher levels of parent/school social capital; they were the least likely to encourage parent-teacher interaction through meetings and a PTA. At the other extreme from the independent and direct grant schools were the secondary modern schools; these had the highest teacher turnover and highest pupil-teacher ratios, unsurprisingly as they were the least
7 Note, however, that when we restrict analysis of maths test scores to the top third of the ability distribution, the estimates for direct grant and independent schools are no longer significant. This suggests that there may be an interaction between school type, test score at 16 and measured ability at 11, with the direct grant and independent schools producing larger gains for less able students.

29
well-funded schools. The secondary moderns were also less likely than other state schools to have PTAs and regular parent-teacher meetings.
The results of the analyses of age-16 test scores (based on the full sample) and
examination results (based on the top third of the ability distribution) were largely in agreement. In both cases, test score at age 11 was the most powerful predictor of educational success at age 16, and the inclusion of measures of cognitive skills at age 11 and of students’ social backgrounds accounted for a substantial proportion of the school differences.
One important finding is that the student-teacher ratio, on which independent
schools were especially advantaged, appeared to have no effect on either test scores or examination results. This is in line with the growing body of literature suggesting that schools’ financial resources do not have major impacts on school outcomes. To be sure, our results apply only to differences between types of school, and it is possible that variations in school resources between individual schools might have a significant impact8. However, given the financial advantages that independent schools have on average over the other types of school, it is noteworthy that neither student-teacher ratios nor teacher turnover could account for independent school educational success.
It is also noteworthy that our measures of home/school social capital failed to
account for the differences in outcome. While our measures are far from ideal, there are also good practical reasons for suspecting that home/school social capital will not account for the success of the independent schools in Britain since these schools do not tend to have locally-based catchment areas. It is in fact likely that independent schools have the most geographically diverse catchments, while the selective grammar and direct grant schools will also have drawn on pupils from quite a large geographical area. It is likely that home/school social capital, if it can account for variation in school outcomes, will largely do so within the comprehensive school sector since these schools typically have local catchment areas giving more scope for frequent social interaction between parents and the school.
The sole school-level factor that appeared to explain sectoral differences in
educational outcomes was the social class composition of the school. This might operate through peer group processes, for example through norms regarding the social
8 In supplementary analysis we tested for interactions between type of school and student-teacher ratio. In the case of comprehensive schools we found that higher ratios were associated with superior outcomes whereas in the other types of school there appeared to be no significant association between staff-student ratios and educational outcomes. This probably reflects the fact that popular and successful comprehensive schools tend to be oversubscribed, and hence have less favourable staff-student ratios while less popular comprehensives would have falling school roles and less favourable ratios. These processes would not however apply to the other types of school. In the case of grammar and secondary modern schools, students were simply allocated by the Local Education Authority on the basis of the eleven plus examination, whereas in the case of independent schools market mechanisms would tend to prevent overcrowding.

30
acceptability of academic effort and success as suggested earlier, although other mechanisms, such as teachers’ expectations, are also possible.
The superiority, therefore, of the independent, direct grant and grammar schools as compared to the comprehensives is partially but not entirely, explained in our analyses. It may be that our controls for individual and family characteristics are inadequate, although they are more thorough than the controls used in many analyses of school effects. We should also note that rather different mechanisms are involved in recruiting students to the different types of school. Parental choice (albeit constrained by financial resources) is clearly of most importance in the case of the independent schools, and it is here that we might expect to find the largest unmeasured selection processes. In contrast, there was little scope for parental choice of a grammar school, since the decision whether a particular child could go to a grammar school was not made by the parent but by the local education authority9. The hybrid direct grant schools have elements of both recruitment processes. If unmeasured parental characteristics were the primary explanation for the remaining school differences, therefore, we would have expected to see the largest unexplained school effect for the independent schools and the smallest for the grammar schools. While there is a hint that this pattern may have obtained with respect to examination passes, it certainly did not with respect to maths test scores. We do not feel, therefore, that unmeasured parental characteristics are the most likely explanation for the remaining school differences.
It could also be that our measures of school resources were excessively limited and that unmeasured differences in specific resources could explain the school differences. However, the grammar schools were not nearly as financially advantaged as the independent schools. We cannot rule out the possibility that certain school resources, such as teachers who have high levels of educational attainment or ability, and a tendency to make high academic demands on students, would help to explain the school sector effects. While private schools could attract teachers with particularly good pay and working conditions, teachers may also have perceived grammar schools as more attractive working environments than comprehensives or secondary moderns, due to the ability level of the intake, and also the correspondingly higher level of 6th form work at grammar schools10. In addition, teacher recruitment at the selective schools may have been more strongly based on academic credentials.
Another possibility is that the need to attract fee-paying parents has acted as a
pressure on private schools to achieve good exam results. Once again, however, given
9 To be sure there would have been some scope for parents to decline a grammar school place if offered one for their child, although this was probably rather rare. Parents would also have been able to exercise some influence on their child’s likelihood of success in the eleven plus examination, for example by their choice of primary school (Douglas 1964; Halsey et al. 1980). We do not claim therefore that there would have been no unmeasured selection effects in the case of grammar and secondary modern schools, but only that there was much less scope for these effects than in the case of independent schools. 10 The ‘6th form’ comprised those students who had stayed on beyond the minimum school leaving age of 16, to study for ‘A’ (Advanced) levels.
31
that the success of the independent schools was shared by the academically selective but non fee-paying grammar schools and by the hybrid direct grant schools, we suspect that explanations relying on market forces are unlikely to be successful.
We need instead to look for explanations that might in principle apply to all
three of these types of school but not to the comprehensive and secondary modern schools. The obvious feature these schools have in common is that they are all academically selective, (although the independent schools were less so than the grammar and direct grant schools). One possibility is that a direct measure of the academic composition of the school would help to explain the remaining school differences.
Another possibility is that these three types of school may have some shared
educational practices. For example, students at these schools would routinely be required to undertake homework in the evenings in addition to their regular school-work during the day. This would have been less common in comprehensive schools, and unusual in secondary modern schools, with their less academic orientations. Regular homework might also be expected to be accompanied by other less tangible aspects of school culture, such as an academic ethos and high teacher expectations. The effective implementation of homework also implies a degree of teacher authority and discipline.
Grammar, direct grant and independent schools also probably shared an emphasis on extra-curricular activities that would have been less widespread in the comprehensive or secondary modern schools. Extra-curricular activities such as school sports teams, school orchestras or drama productions were standard features of the former three types of school, and might well have indirect effects on student’s academic performance by fostering a degree of social solidarity and an ethos integrating students with teachers and developing a sense of shared purpose between staff and students. In that sense it would be an aspect of school social capital of the sort that Coleman described. Unlike Coleman, however, we see this as being largely internal to the school rather than involving parents closely. Of course, high academic demands, the regular use of homework and an extensive extra-curricular programme depend on the willingness of both teachers and students to participate, so the composition of the school in terms of both student and staff characteristics, and the interaction between these, is likely to be relevant. While at present we have only anecdotal evidence in favour of this interpretation, we believe it is a plausible explanation for the similarity of parameter estimates in the fee-paying independent schools, the hybrid direct grant schools, and the state-funded grammar schools.

32
Appendix: OLS Regression of Maths Test Score at Age 16 (top third of the sample)
Model 1 Model 2 Model 3 Model 4 Model 5 Model 6 B (s.e) B (s.e) B (s.e) B (s.e) B (s.e) B (s.e) Intercept 0.80(0.02) 0.21(0.09) 0.05(0.10) -0.56(0.09) -0.69(0.11) -0.61(0.11) School Direct Grant 0.56(0.06) 0.48(0.06) 0.45(0.06) 0.17(0.05) 0.16(0.05) 0.07(0.06) Independent 0.40(0.06) 0.28(0.06) 0.26(0.06) 0.20(0.05) 0.18(0.06) 0.05(0.06) Grammar 0.42(0.03) 0.40(0.03) 0.38(0.03) 0.22(0.03) 0.22(0.03) 0.15(0.03) Secondary Modern -0.35(0.05) -0.34(0.05) -0.31(0.05) -0.14(0.04) -0.14(0.04) -0.13(0.04) Comprehensive 0 0 0 0 0 0 Parents' education Missing 0.08(0.08) 0.09(0.08) 0.07(0.07) 0.06(0.07) 0.065(0.07) 19+ 0.29(0.05) 0.26(0.05) 0.15(0.04) 0.15(0.04) 0.14(0.04) 16-18 0.06(0.04) 0.06(0.04) 0.03(0.03) 0.03(0.03) 0.02(0.03) 15 or less 0 0 0 0 0 Sex Male 0.34(0.03) 0.35(0.03) 0.31(0.02) 0.31(0.02) 0.31(0.02) Female 0 0 0 0 0 Family structure Missing 0.07(0.07) 0.03(0.08) 0.03(0.07) 0.03(0.07) 0.03(0.07) 2 original parents throughout 0.09(0.06) 0.09(0.06) 0.06(0.05) 0.06(0.05) 0.05(0.05) Other 0 0 0 0 0 Children in household Missing 0.06(0.08) 0.06(0.08) 0.02(0.08) 0.01(0.08) 0.00(0.07) 1-2 0.13(0.06) 0.10(0.06) 0.04(0.05) 0.04(0.05) 0.02(0.05) 3-4 0.14(0.06) 0.11(0.06) 0.04(0.05) 0.04(0.05) 0.02(0.05) 5+ 0 0 0 0 0 Father's class Missing 0.10(0.08) 0.11(0.08) 0.03(0.07) 0.04(0.07) 0.02(0.07) Employer/Manager - large 0.30(0.07) 0.28(0.07) 0.25(0.06) 0.25(0.06) 0.22(0.06) Employer/Manager - small 0.15(0.06) 0.14(0.06) 0.10(0.06) 0.10(0.06) 0.08(0.06) Professional 0.35(0.07) 0.33(0.07) 0.21(0.06) 0.21(0.06) 0.18(0.06) Own account 0.22(0.09) 0.20(0.09) 0.16(0.08) 0.16(0.08) 0.15(0.08) Non-manual 0.18(0.06) 0.16(0.06) 0.09(0.05) 0.09(0.05) 0.07(0.05) Skilled manual and foremen 0.10(0.06) 0.11(0.06) 0.09(0.05) 0.10(0.05) 0.09(0.05) Unskilled manual 0 0 0 0 Mother's book reading Missing 0.05(0.06) 0.03(0.06) 0.02(0.06) 0.01(0.06) Most weeks 0.01(0.04) -0.03(0.03) -0.03(0.03) -0.04(0.03) Occasionally -0.00(0.04) -0.02(0.04) -0.02(0.04) -0.03(0.04) Hardly ever 0 0 0 0 Mother's interest Missing 0.24(0.10) 0.19(0.09) 0.18(0.09) 0.20(0.09) Very interested 0.24(0.05) 0.13(0.04) 0.12(0.05) 0.13(0.04) Some interest 0.09(0.05) 0.08(0.05) 0.08(0.05) 0.08(0.05) Little interest 0 0 0
Test score 0.69(0.03) 0.69(0.03) 0.68(0.03) Teacher’s assessment 0.15(0.02) 0.15(0.02) 0.15(0.02)

33
PTA Missing -0.11(0.15) -0.13(0.15) Yes -0.05(0.03) -0.07(0.03) No 0 0 Parent-teacher meetings Missing 0.08(0.19) 0.10(0.19) At least yearly 0.19(0.06) 0.17(0.06) None or ad hoc 0 0
student-teacher ratio -0.04(0.04) -0.03(0.04) teacher turnover 0.003(0.01) 0.003(0.01) School composition % nonmanual 0.07(0.01) N 2944 2944 2944 2944 2944 2944 R2 0.112 0.193 0.203 0.368 0.371 0.377

34
Bibliography
ALEXANDER, K.L. and PALLAS, A.M. 1983. ‘Private Schools and Public Policy: New Evidence on Cognitive Achievement in Public and Private Schools’, Sociology of Education 56: 170-182. ALEXANDER, K.L. and PALLAS, A.M. 1985. ‘School Sector and Cognitive Performance: When is a Little a Little?’, Sociology of Education 58: 115-28. BETTS, J.R. 1995. ‘Does School Quality Matter? Evidence from the National Longitudinal Survey of Youth’, The Review of Economics and Statistics 77: 231-250. BIBLARZ, T.J. and GOTTAINER, G. 2000. ‘Family Structure and Children's Success: A Comparison of Widowed and Divorced Single-Mother Families’, Journal of Marriage and the Family 62: 533-48. BLAKE, J. 1981. ‘Family Size and the Quality of Children’, Demography 18:421-42. BLAKE, J. 1985. ‘Number of Siblings and Educational Mobility’, American Sociological Review 50:84-94. BLAKE, J. 1989. Family Size and Achievement. Los Angeles: University of California Press. BOGGESS, S. 1998. ‘Family Structure, Economic Status, and Educational Attainment’, Journal of Population Economics 11:205-222. BOYD, D. 1973. Elites and Their Education. Slough: NFER. BURTLESS, G. (ed.) 1996. Does Money Matter? The Effect of School Resources on Student Achievement and Adult Success. Washington, DC: Brookings Institution Press. CAIN, G.G. and GOLDBERGER, A.S. 1983. ‘Public and Private Schools Revisited’, Sociology of Education 56: 208-218. CARBANARO, W.J. 1999. ‘Opening the Debate on Closure and Schooling Outcomes: Comment on Morgan and Sorenson’, American Sociological Review 64: 682-686. CARD, D. and KRUEGER, A.B. 1996. ‘School Resources and Student Outcomes: An Overview of the Literature and New Evidence from North and South Carolina’, Journal of Economic Perspectives 10: 31-50. CARD, D. and KRUEGER, A.B. 1992. ‘Does School Quality Matter? Returns to Education and the Characteristics of Public Schools in the United States’ The Journal of Political Economy 100: 1-40. CARROLL, S. and WALFORD, G. 1997. ‘Parents’ Responses to the School Quasi-Market’, Research Papers in Education 12:3-26.

35
CLIFFORD, P. and HEATH, A. 1984. ‘Selection Does Make a Difference’, Oxford Review of Education 10: 85-97. COLEMAN, J.S. 1990. Equality and Achievement in Education. Boulder, CO: Westview Press. COLEMAN, J.S., CAMPBELL, E.Q., HOBSON, C.J., McPARTLAND, J., MOOD, A.M., WEINFELD, F.D. and YORK, R.L. 1966. Equality of Educational Opportunity. Washington D.C.: Government Printing Office. COLEMAN, J.S., HOFFER, T. and KILGORE, S. 1982a. High School Achievement: Public, Catholic, and Private Schools Compared. New York: Basic Books. COLEMAN, J.S., HOFFER, T. and KILGORE, S. 1982b. ‘Cognitive Outcomes in Public and Private Schools’, Sociology of Education 55: 65-76. COLEMAN, J.S., HOFFER, T. and KILGORE, S. 1982c. ‘Achievement and Segregation in Secondary Schools: A Further Look at Public and Private School Differences’ Sociology of Education 55: 162-182. COX, C. and MARKS, J. 1980. Real Concern: An Appraisal of the National Children’s Bureau Report on Progress in Secondary Schools. London: Centre for Policy Studies. CROOK C.J. 1997. Cultural Practices and Socioeconomic Attainment: The Australian Experience. Westport, Connecticut: Greenwood Press. De GRAAF, N.D., De GRAAF, P.M. and KRAAYKAMP, G. 2000. ‘Parental Cultural Capital and Educational Attainment in the Netherlands: A Refinement of the Cultural Capital Perspective’, Sociology of Education 73: 92-111. DOUGLAS, J.W.B. 1964. The Home and the School. London: MacGibbon and Kee. DOWNEY, D.B. 2001. ‘Number of Siblings and Intellectual Development – The Resource Dilution Explanation’, American Psychologist 56:497-504. DOWNEY, D.B. 1995. ‘Understanding Academic Achievement Among Children in Step-Households – The Role of Parental Resources, Sex of Step-Parent and Sex of Child’, Social Forces 73: 875-894. EHRENBERG, R.G. and BREWER, D.J. 1994. ‘Do School and Teacher Characteristics Matter? Evidence from High School and Beyond’, Economics of Education Review 13: 1-17. EHRENBERD, R.G. and BREWER, D.J. 1995. ‘Did Teachers’ Verbal Ability and Race Matter in the 1960s? Coleman Revisited’, Economics of Education Review 14: 1-21. ELGIN, G. 1984. ‘Public Schools and the Choice at 18+’,in British Public Schools: Policy and Practice, edited by G Walford. Lewes, East Sussex: The Falmer Press, pp. 87-110 ELLIOTT, J. and RICHARDS, M. 1991. ‘Children and Divorce: Educational Performance and Behaviour before and after Parental Separation’, International Journal of Law and the Family 5:258-76.
36
EVANS, W.N., OATES, W.E., SCHWAB, R.M. 1992. ‘Measuring Peer Group Effects: A Study of Teenage Behaviour’, Journal of Political Economy 100: 966-991. FOX, I. 1986. Private Schools and Public Issues. London: Macmillan. GAMORAN, A. 1996. ‘Student Achievement in Public Magnet, Public Comprehensive and Private City High Schools’, Educational Evaluation and Policy Analysis 18: 1-18. GEWIRTZ, S., BALL, S.J., and BOWE, R. 1995. Markets, Choice and Equity in Education. Buckingham: Open University Press. GIPPS, C. and MURPHY, P. 1994. A Fair Test? Assessment, Achievement and Equity. Buckingham: Open University Press. GLATTER, R., WOODS, P.A. and BAGLEY, C. (eds.) 1997. Choice and Diversity in Schooling: Perspectives and Prospects. London: Routledge. GOLDBERGER, A.S. and CAIN, G.G. 1982. ‘The Causal Analysis of Cognitive Outcomes in the Coleman, Hoffer and Kilgore Report’, Sociology of Education 55: 103-122. GRIGGS, C. 1985. Private Education in Britain. Lewes: Falmer Press. GROGGER, J. 1996. ‘School Expenditures and Post-Schooling Earnings: Evidence from High School and Beyond’, Review of Economics and Statistics 78: 628-637. HALLINAN, M.T. and KUBITSCHEK, W.N. 1999. ‘Conceptualising and Measuring School Social Networks: Comment on Morgan and Sorensen’, American Sociological Review 64: 687-693. HALSEY, A. H, HEATH, A. F. and RIDGE, J.M. 1980. Origins and Destinations: Family, Class and Education in Modern Britain. Oxford: OUP.
HANUSHEK, E. 1986. ‘The Economics of Schooling: Production and Efficiency in Public Schools’, Journal of Economic Literature 24: 1141-1177. HANUSHEK, E. 1989. ‘The Impact of Differential Expenditures on School Performance’, Educational Researcher 18: 45-65. HANUSHEK, E. 1999. ‘Some Findings from an Independent Investigation of the Tennessee STAR Experiment and from Other Investigations of Class Size Effects’, Educational Evaluation and Policy Analysis 21: 143-163. HEATH, A.F., HALSEY, A. H. and RIDGE, J. M. 1984. ‘The Political Arithmetic of Public Schools’, in British Public Schools: Policy and Practice, edited by G. Walford. Lewes, East Sussex: The Falmer Press, pp. 9-44. HEATH, A. F. and CHEUNG, S. Y. 1998. ‘Education and Occupation in Britain’, in From School to Work: A Comparative Study of Educational Qualifications and Occupational Destinations, edited by Y. Shavit and W. Mueller. Oxford: Oxford University Press, pp 71-101.

37
HEATH, A. F. and JACOBS, S. 1999. ‘Comprehensive Reform in Britain’, in The Comprehensive School Experiment Revisited: Evidence from Western Europe, 2nd edition, edited by A. Leschinsky and K. U. Mayer. Frankfurt am Main: Peter Lang, pp 101-130. HENDERSON, V., MIESZKOWSKI, P., SAUVAGEAU, Y. 1978. ‘Peer Group Effects and Educational Production Functions’, Journal of Public Economics 10: 97-106. HILLMAN, J. 1994. ‘Independent schools’, in Insights into Education and Training, papers selected by the Paul Hamlyn Foundation, National Commission on Education. London: Heinemann, pp.403–444. HOXBY, C. M. 2000. ‘The Effects of Class Size on Student Achievement: New Evidence from Population Variation’, Quarterly Journal of Economics 115: 1239-1285. KERCKHOFF, A.C. and TROTT, J. 1993. ‘Educational Attainment in a Changing Educational System: The Case of England and Wales’, in Persistent Inequality: changing educational attainment in thirteen countries edited by Y. Shavit and H-P. Blossfeld . Westview, Boulder, CO: Westview, pp. 133-154. KERCKHOFF, A.C., FOGELMAN, K., CROOK, D. and REEDER, D. 1996. Going Comprehensive in England and Wales: A Study of Uneven Change. London: Woburn Press. KIERNAN, K. 1992. ‘The Impact of Family Disruption in Childhood on Transitions Made in Young Adult Life’, Population Studies 46:213-34. LEE, V. E, CHOW-HOY, T. K, BURKAM, D. T, GEVERDT, D., SMERDON, B. A. 1998. ‘Sector Differences in High School Course Taking: A Private School or Catholic School Effect?’, Sociology of Education 71: 314-335. MARKS, J., COX, C. and POMIAN-SRZEDNICKI, M. 1983. Standards in English Schools. London: National Council for Educational Standards. MORGAN, S.L. and SORENSEN, A.B. 1999a. ‘Parental Networks, Social Closure, and Mathematics Learning: A Test of Coleman’s Social Capital Explanation of School Effects’, American Sociological Review 64: 661-681. MORGAN, S.L. and SORENSEN, A.B. 1999b. ‘Theory, Measurement and Specification Issues in Models of Network Effects on Learning: Reply to Carbanaro and Hallinan and Kubitschek’, American Sociological Review 64: 694-700.
MORTIMORE, P., SAMMONS, P., STOLL, L., LEWIS, D. and ECOB, R. 1988. School Matters. London: Open Books. NISBET, J. 1953. ‘Family Environment and Intelligence’, Eugenics Review. XLV:31-42. NOELL, J. 1982. ‘Public and Catholic Schools: A Reanalysis of ‘Public and Private Schools’’, Sociology of Education 55: 123-132. PAINTERG., LEVINE D.I. 2000. ‘Family Structure and Youths’ Outcomes - Which Correlations are Causal?’, Journal of Human Resources 35: 524-549.

38
POWELL, B, and STEELMAN, L.C. 1990. ‘Beyond Sibship Size: Sibling Density, Sex Composition, and Educational Outcomes’, Social Forces 69: 181-206. POWER, S., WHITTY, G. EDWARDS, T. and WIGFALL, V. 1998. ‘Schools, Families and Academically Able Students: Contrasting Modes of Involvement in Secondary Education’, British Journal of Sociology of Education 19: 157-76. PRAIS, S. 1996. ‘Class-Size and Learning: The Tennessee Experiment - What follows?’, Oxford Review of Education 22: 399-414. ROWAN, B., CHIANG, F.-S., and MILLER, R.J. 1997. ‘Using Research on Employees’ Performance to Study the Effects of Teachers on Students’ Achievement’, Sociology of Education 70: 256-284. RUTTER, M., MAUGHAN, B. MORTIMORE, P., OUSTON, J. 1979. Fifteen Thousand Hours. Cambridge, Mass: Harvard University Press. SAMPSON, R.J., MORENHOFF, J.D. and EARLS, F. 1999. ‘Beyond Social Capital: Spatial Dynamics of Collective Efficacy for Children’, American Sociological Review 64: 633-660. SANDER, W. 1999. ‘Endogenous expenditures and student achievement’, Economics Letters 62: 223-231.
SHEPHERD, P. 1995. ‘The National Child Development Study: An introduction to its origins and the methods of data collection’, NCDS User Support Group, Working Paper 1. SMITH, D. and TOMLINSON, S. 1989. The School Effect: A Study of Multi-Racial Comprehensives. London: Policy Studies Institute. STARK, K.B. and WELLS, B.K. 1972. The Trend of Reading Standards. Slough: NFER. STEEDMAN, J. 1980. Progress in Secondary Schools. London: National Children’s Bureau. STEEDMAN, J. 1983a. Examination Results in Selective and Non-Selective Schools. London: National Children’s Bureau. STEEDMAN, J. 1983b. Examination Results in Selective and Non-Selective Schools. Volume 2 – Appendices. London: National Children’s Bureau. SULLIVAN, A. 2001. ‘Cultural Capital and Educational Attainment’, Sociology 35: 893-912. SUMMERS, A.A. and WOLFE, B.L. 1977. ‘Do Schools Make a Difference?’, American Economic Review 67: 639-52. VAN EIJCK, K. and De GRAAF, P.M. 1995. ‘The Effects of Family Structure on the Educational Attainment of Siblings in Hungary’, European Sociological Review 11 : 273-292. WALFORD, G. (ed.) 1984. British Public Schools: Policy and Practice. Lewes: Falmer Press. WALFORD, G. 1994. Choice and Equity in Education. London: Cassell.

39
WENGLINKSY, H. 1997. ‘How Money Matters: The Effect of School District Spending on Academic Achievement’, Sociology of Education 70: 221-237. WEST, A. VARLAAM, A. and SCOTT, G. 1991. ‘Choosing a Secondary School’, Educational Research 33: 22-30. WILLMS, J.D. 1986. ‘Social Class Segregation and Its Relationship to Pupils' Examination Results in Scotland’, American Sociological Review 51: 224-241. WITTE, J.F. 1992. ‘Private School Versus Public School Achievement’, Economics of Education Review 11: 371-394. WOODS P.A., BAGLEY, C. and GLATTER, R. 1998. School Choice and Competition: Markets in the public interest? London: Routledge.