stable isotopes and hydrogeology in irelandstable isotopes and hydrogeology in ireland shane regan...
TRANSCRIPT

Stable Isotopes and Hydrogeology in Ireland
Shane Regan1,2, Robbie Goodhue3 and Paul Hynds4
1National Parks and Wildlife Service
2Department of Civil, Structural and Environmental Engineering, University of Dublin Trinity College 3Department of Geology, University of Dublin Trinity College,
4Environmental Sustainability & Health Institute (ESHI), Dublin Institute of Technology, Dublin
December 4th 2018
Outline
1. Stable isotope hydrology and “isoscapes”
2. Pathogens and subsurface transport
3. O18 isoscape for Ireland and geospatial drivers
4. Pathogen ingress mechanisms
5. Work to complete and direction

Stable Isotopes
Stable isotopes
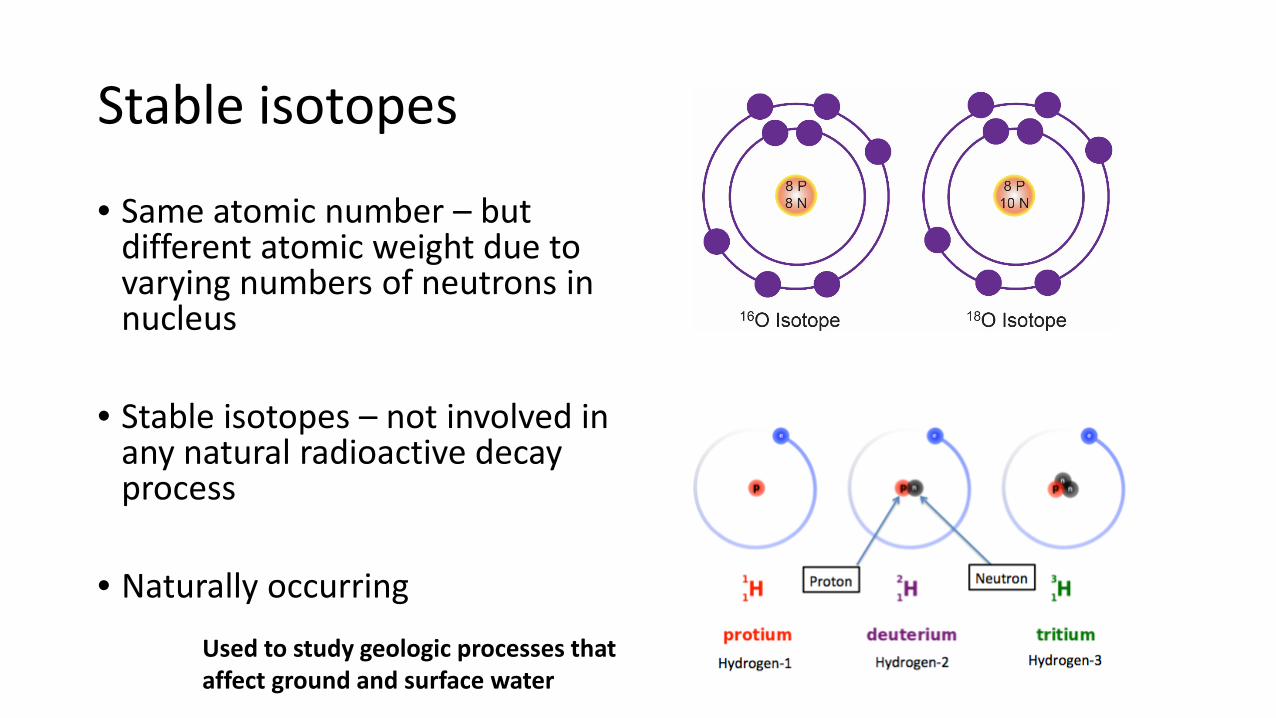
• Same atomic number – but different atomic weight due to varying numbers of neutrons in nucleus
• Stable isotopes – not involved in any natural radioactive decay process
• Naturally occurring
Used to study geologic processes that affect ground and surface water
Stable isotopes
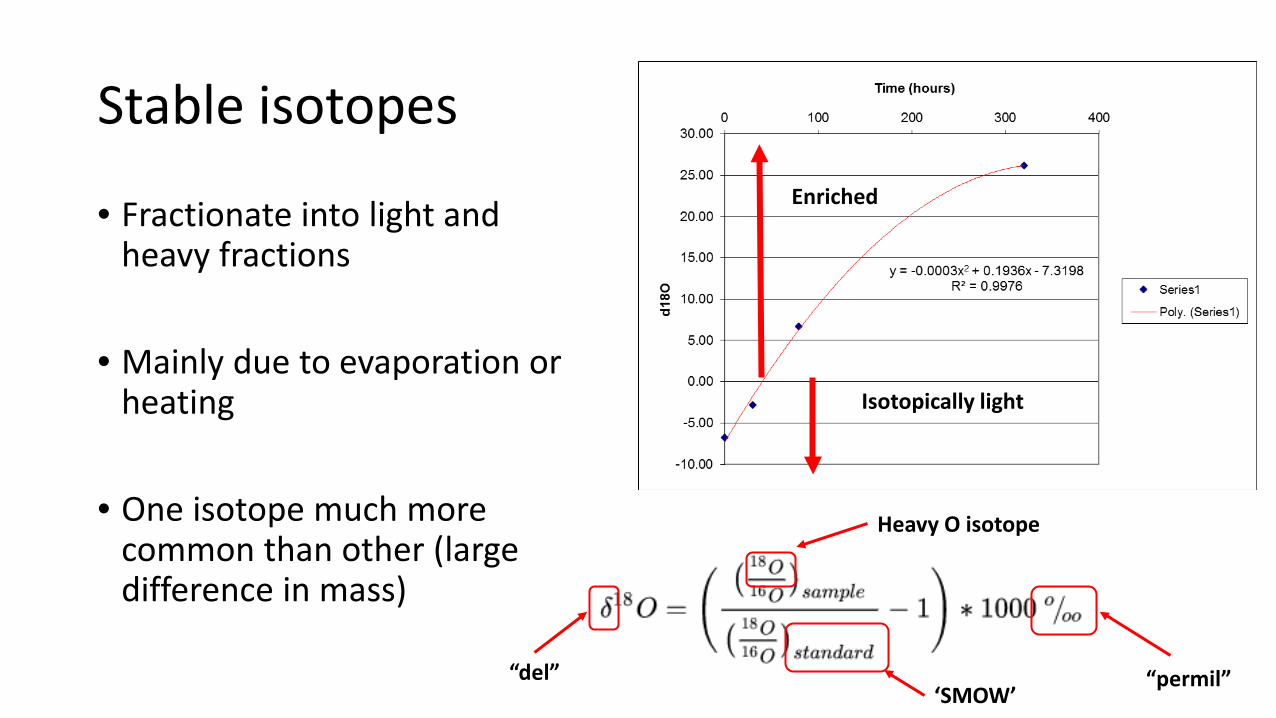
• Fractionate into light and heavy fractions
• Mainly due to evaporation or heating
• One isotope much more common than other (large difference in mass)
Isotopically light
Enriched
“del”
Heavy O isotope
“permil” ‘SMOW’

Stable isotopes
Isotopically lighter than water left behind in ocean
Precipitation Isotopically heavier (more H2 and O18)

Stable isotopes
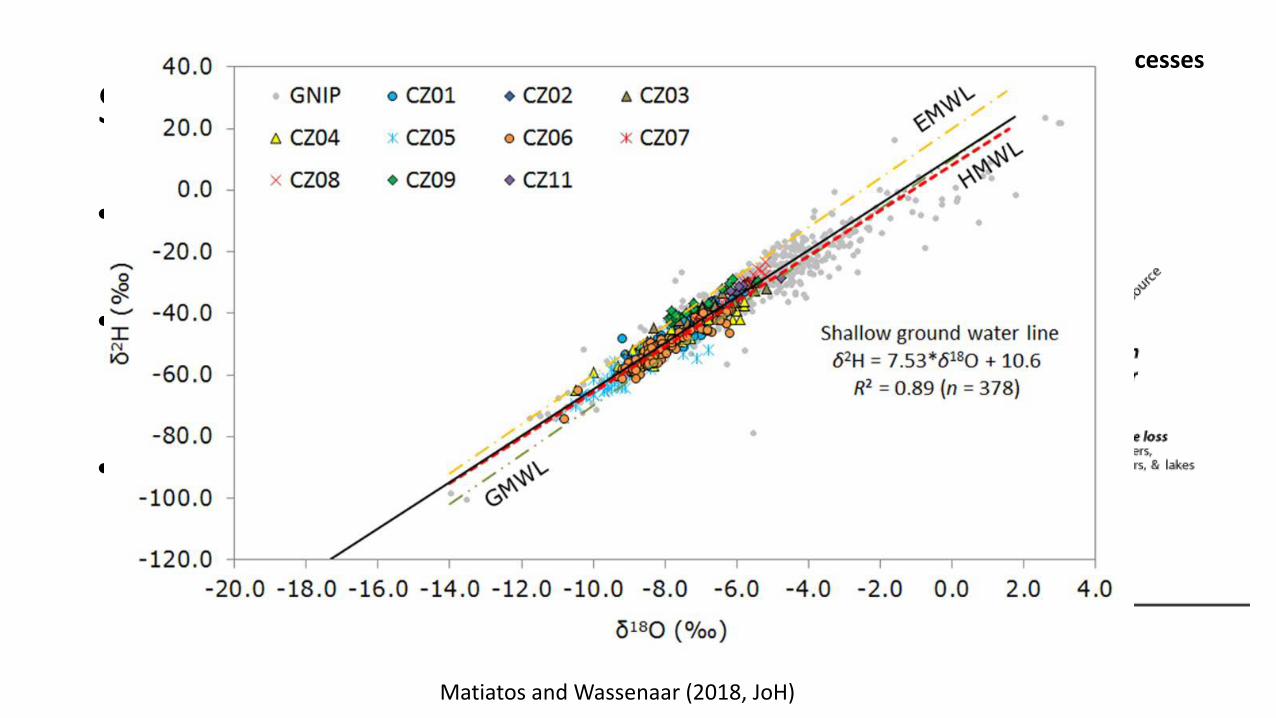
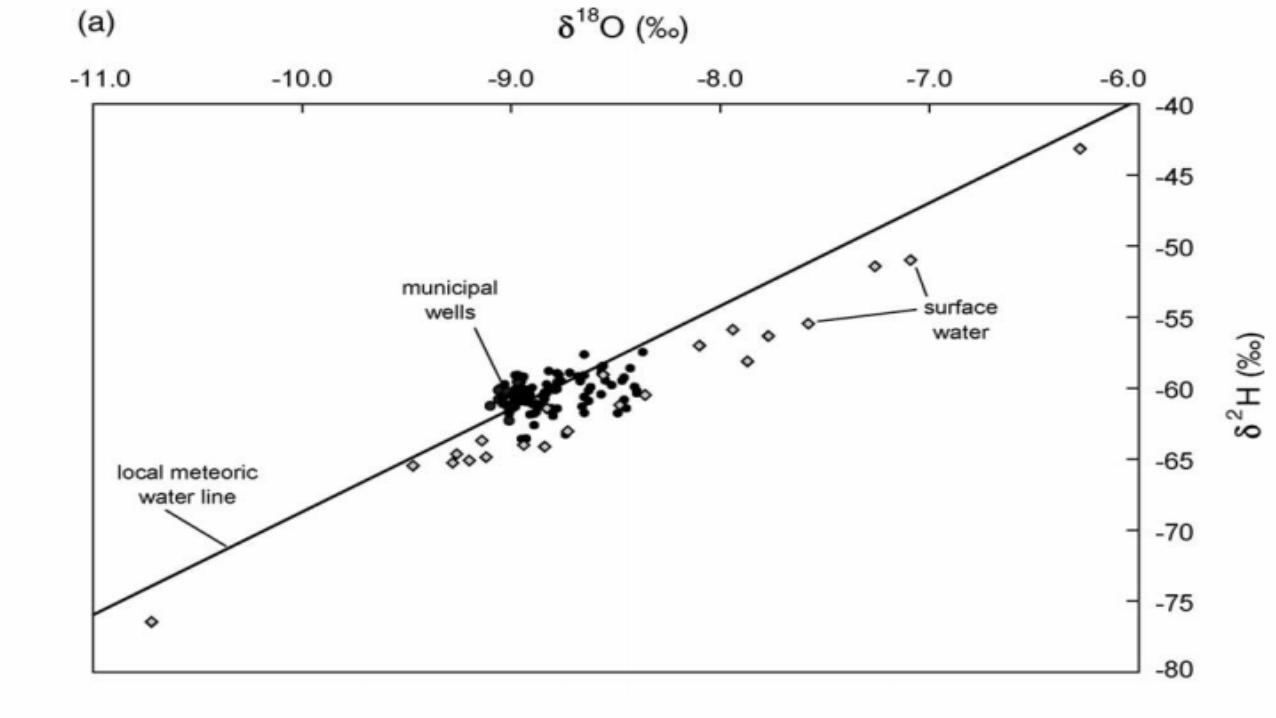
• Global meteoric water line
• Ocean water falls below line – isotopically enriched
• Deviations from MWL – changes in precipitation in warmer or colder climate or geochemical (geothermal water)
Composition affected only by physical processes Temperature dependence – history
Stable isotopes
• Global meteoric water line
• Ocean water falls below line – isotopically enriched
• Deviations from MWL – changes in precipitation in warmer or colder climate or geochemical (geothermal water)
Composition affected only by physical processes Temperature dependence – history
Matiatos and Wassenaar (2018, JoH)
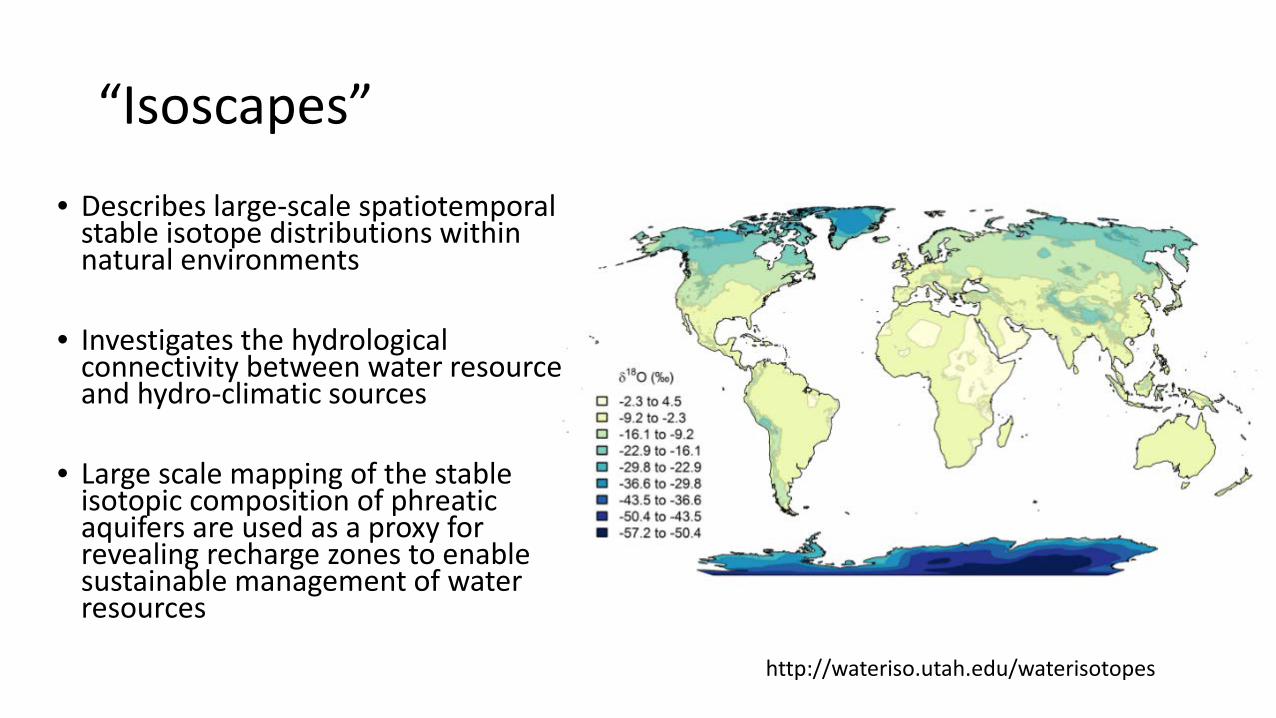
“Isoscapes” • Describes large-scale spatiotemporal
stable isotope distributions within natural environments
• Investigates the hydrological connectivity between water resources and hydro-climatic sources
• Large scale mapping of the stable isotopic composition of phreatic aquifers are used as a proxy for revealing recharge zones to enable sustainable management of water resources
http://wateriso.utah.edu/waterisotopes

ISO-MECH
• First temporal O18 and D groundwater isoscapes for Ireland
• Sampled EPA groundwater monitoring network (> 290 sites) – 2 periods (plus 2013 study)
• Plus domestic well study areas utilised in on-going pathogen studies
ISO-MECH
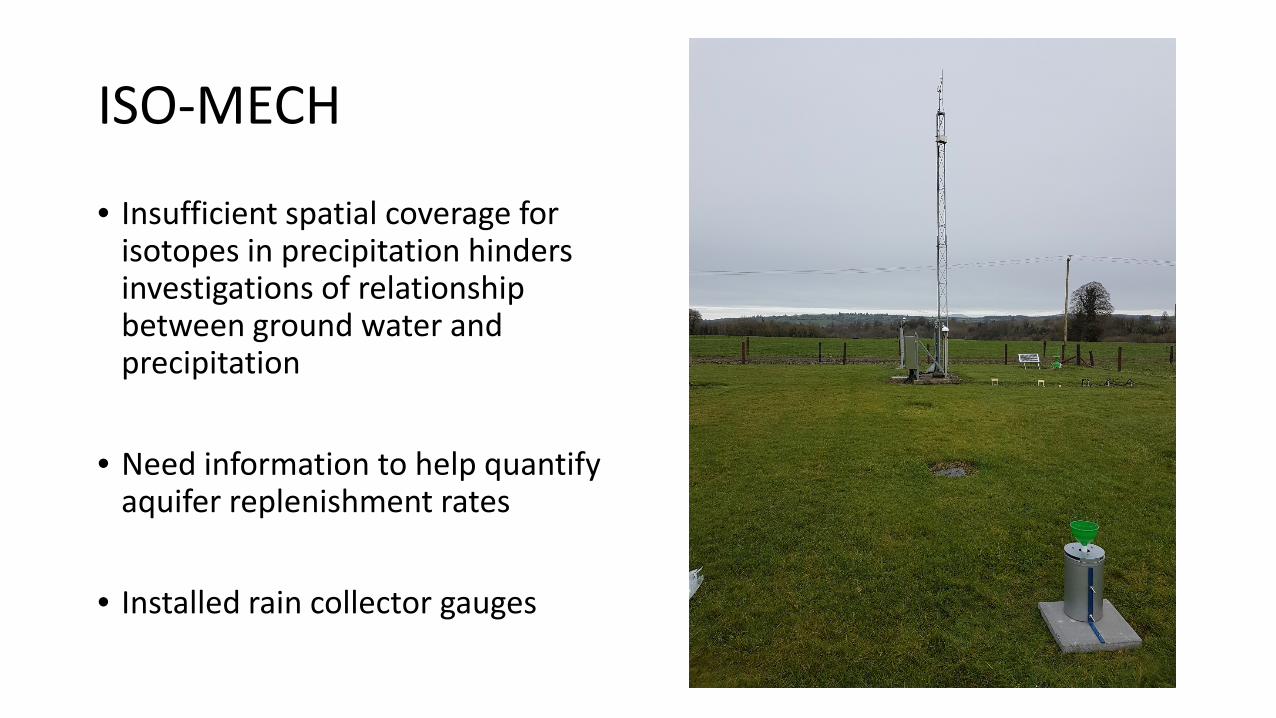
• Insufficient spatial coverage for isotopes in precipitation hinders investigations of relationship between ground water and precipitation
• Need information to help quantify aquifer replenishment rates
• Installed rain collector gauges
ISO-MECH
• Insufficient spatial coverage for isotopes in precipitation hinders investigations of relationship between ground water and precipitation
• Need information to help quantify aquifer replenishment rates
• Installed rain collector gauges
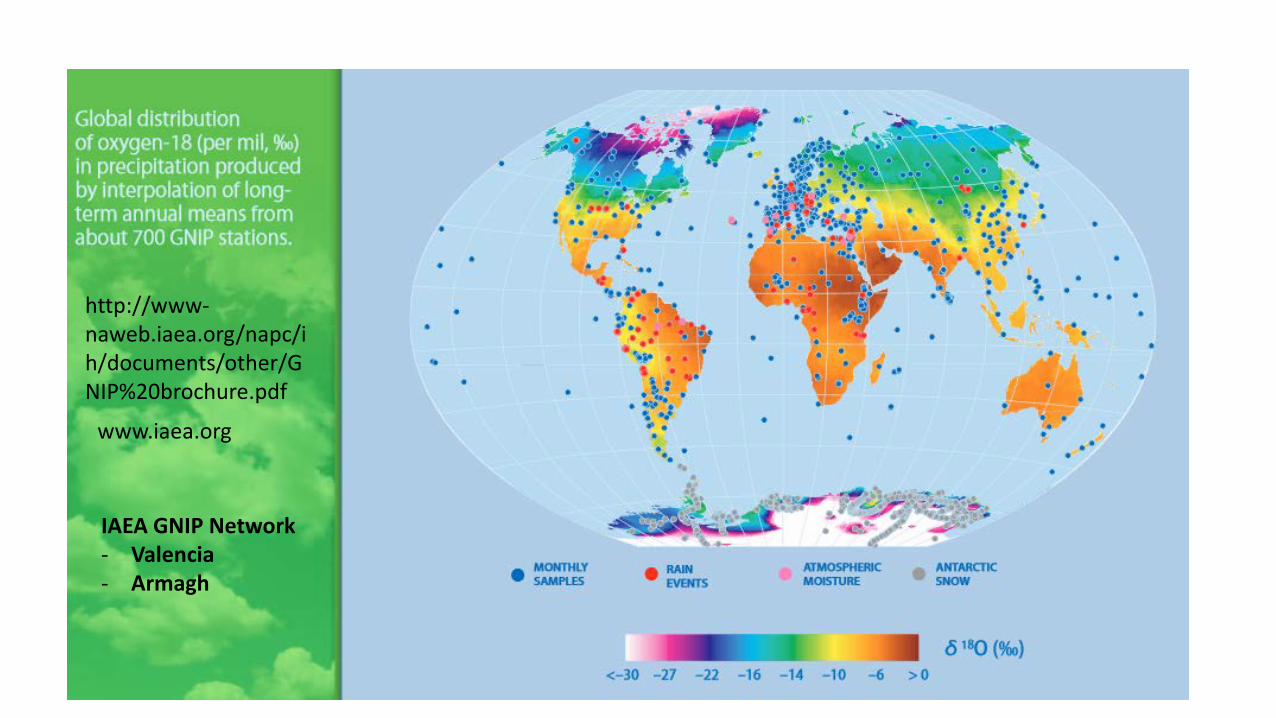
http://www-naweb.iaea.org/napc/ih/documents/other/GNIP%20brochure.pdf
IAEA GNIP Network - Valencia - Armagh
www.iaea.org

ISO-MECH
• Insufficient spatial coverage for isotopes in precipitation hinders investigations of relationship between ground water and precipitation
• Need information to help quantify aquifer replenishment rates
• Installed rain collector gauges
http://www-naweb.iaea.org/napc/ih/documents/other/GNIP%20brochure.pdf
IAEA GNIP Network - Valencia - Armagh
www.iaea.org

ISO-MECH

ISO-MECH
• P/GW ratios
• Used to identify dominant groundwater recharge processes
• E.g. rapid recharge/ preferential flow versus slower soil matrix processes
Sanchez et al (2016, GRL)

ISO-MECH
• Groundwater isoscapes driven by precipitation – shallow groundwater typically considered to represent annual precipitation
• Shallow regional groundwater - indicator for long-term seasonally weighted precipitation inputs
• Can hydrogeological factors also effect concentration?
• Ground water systems can differ from mean annual precipitation due to seasonally biased recharge, infiltration evaporative processes, event-driven recharge, or by mixing with older ground water (Jasechko et al., 2014)
ISO-MECH
• Seasonal monitoring of δ18O and δD variations from spatially distributed groundwater and rainfall stations across Ireland
• Aims: i) improve the understanding of precipitation origin, evaporative effects and estimated recharge rates, and ii) use results to conservatively trace bacterial (E. coli) ingress mechanisms
• Will improve knowledge of recharge mechanisms in the Irish subsurface environment and pilot a novel method for microbial source attribution and transport in the aquatic environment

Microbial Subsurface
Transport
Objectives
• Investigate the presence/absence of thermo-tolerant coliforms (>90% E. coli) with respect to all potential risk factors and develop multivariate “well susceptibility models for Republic of Ireland;
• Develop machine learning models for a very large integrated Ontarian dataset (940,000 groundwater samples);
• Infer subsurface microbial incidence and transport
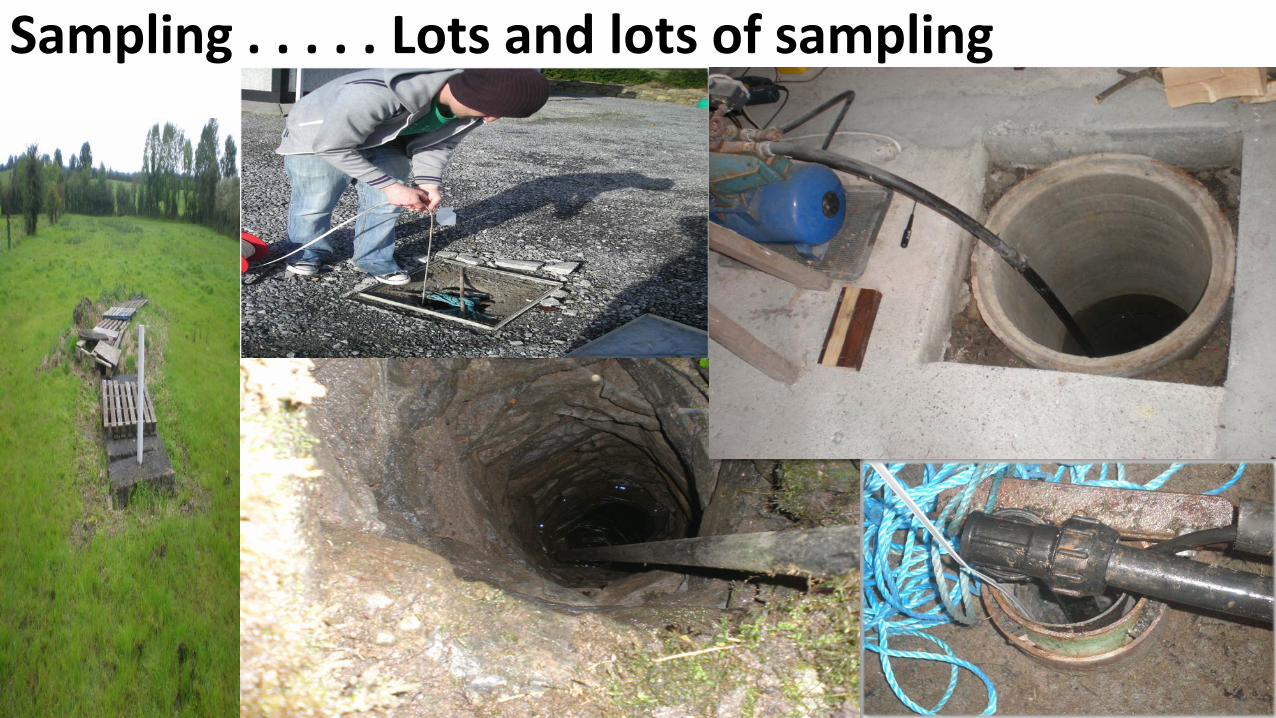
Sampling . . . . . Lots and lots of sampling
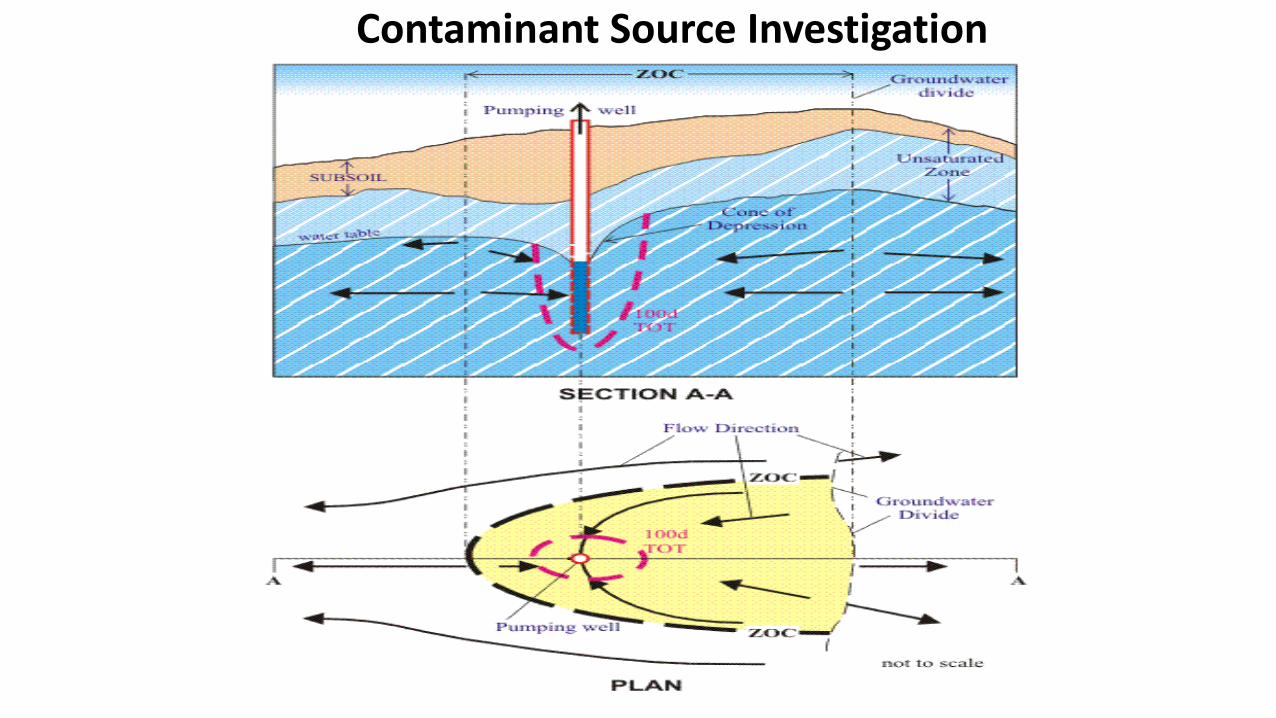
Contaminant Source Investigation

Aquifer vulnerability
P a t h w a y
( S o u r c e ) H a z a r d
W a t e r T a b l e
U n s a t u r a t e d Z o n e
T o p s o i l
B e d r o c k
S u b s o i l
P o i n t o f R e l e a s e
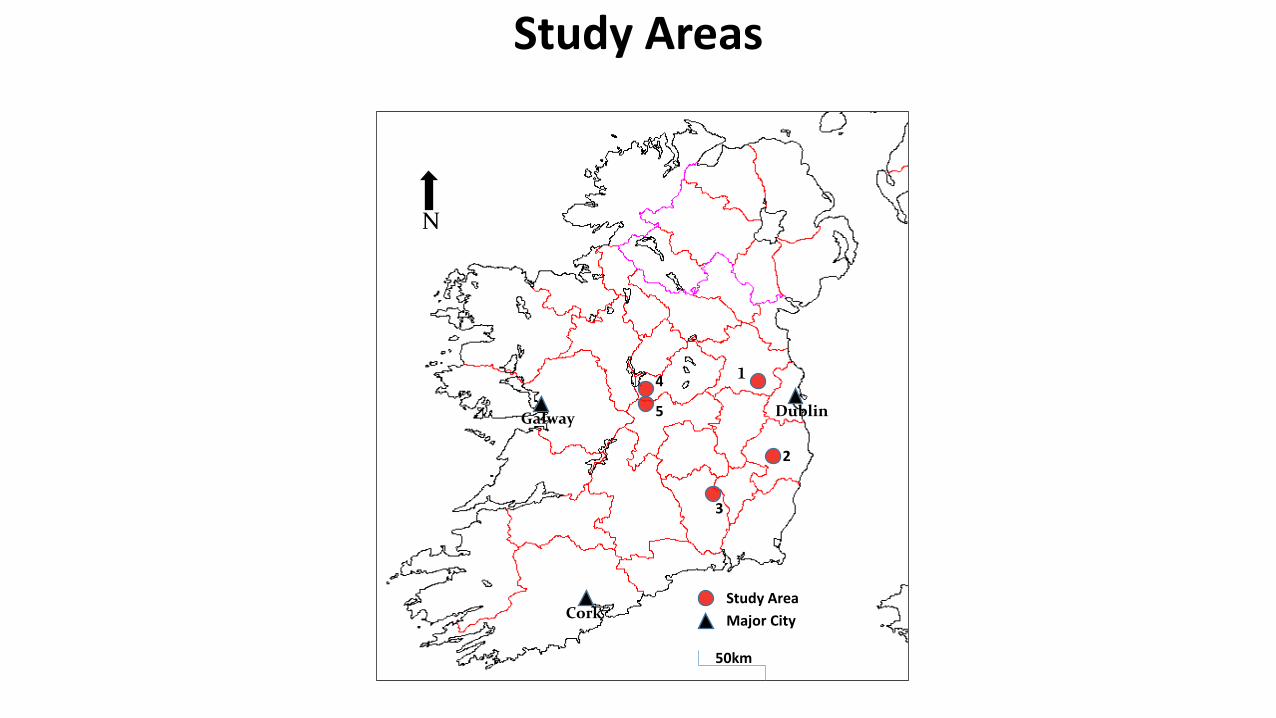
Study Areas
N
Dublin
Cork
Galway
1
2
3
4
5
Study Area Major City
50km
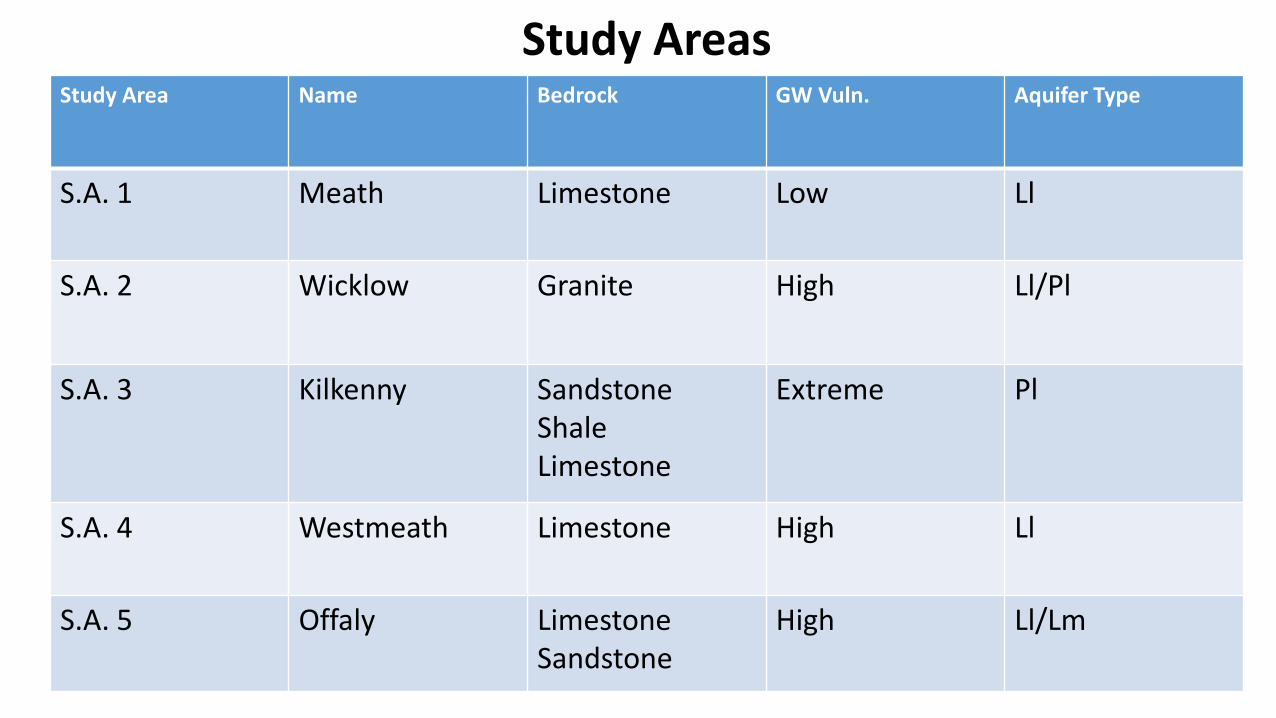
Study Areas Study Area Name Bedrock GW Vuln. Aquifer Type
S.A. 1 Meath Limestone Low Ll
S.A. 2 Wicklow Granite High Ll/Pl
S.A. 3 Kilkenny Sandstone Shale Limestone
Extreme Pl
S.A. 4 Westmeath Limestone High Ll
S.A. 5 Offaly Limestone Sandstone
High Ll/Lm
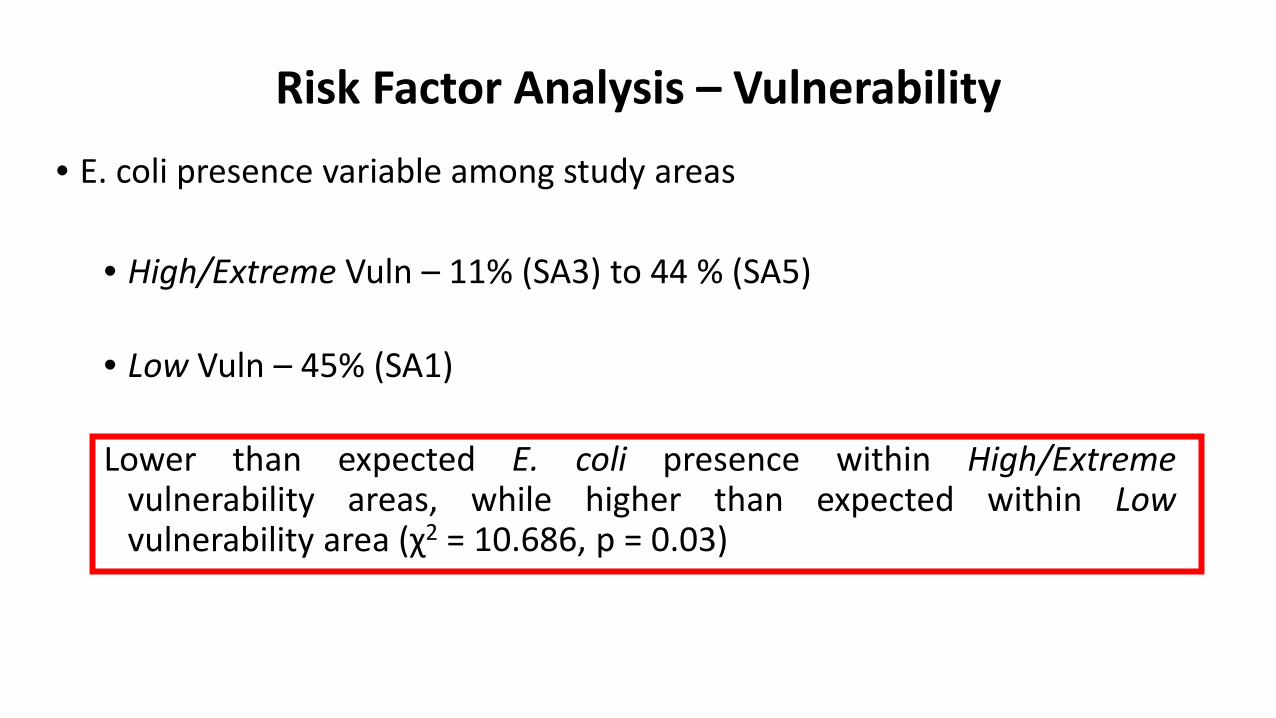
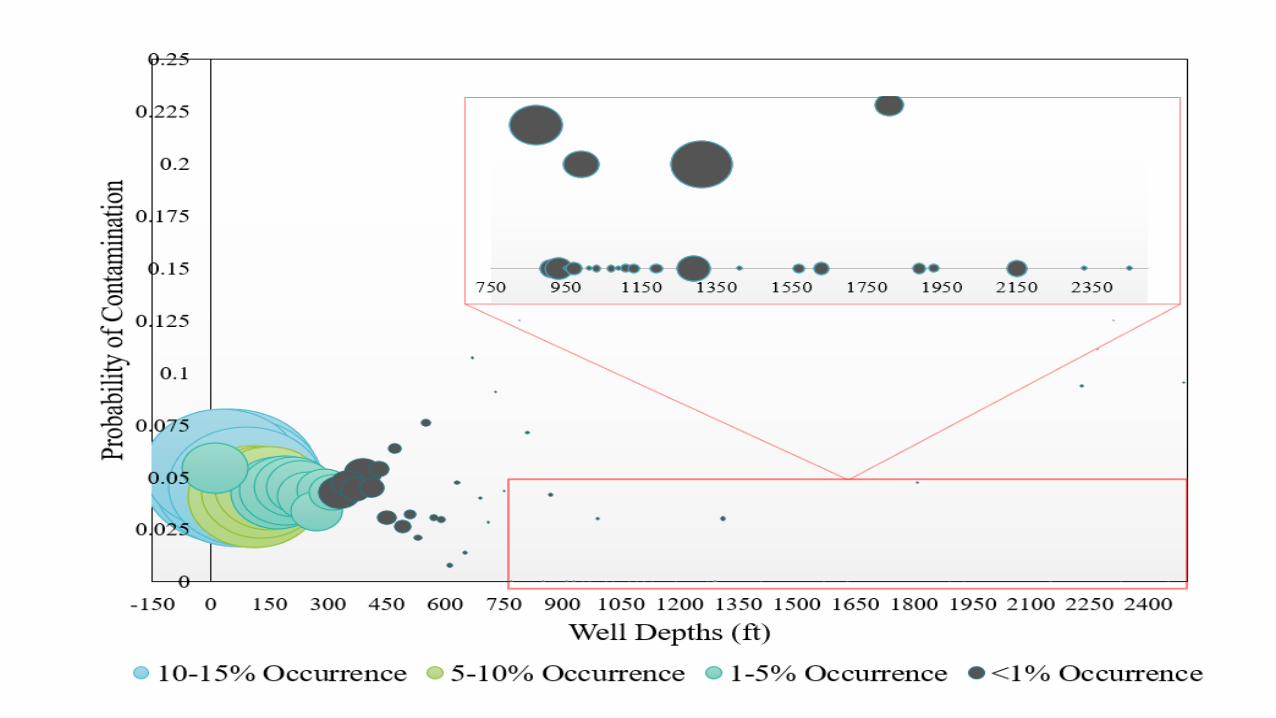
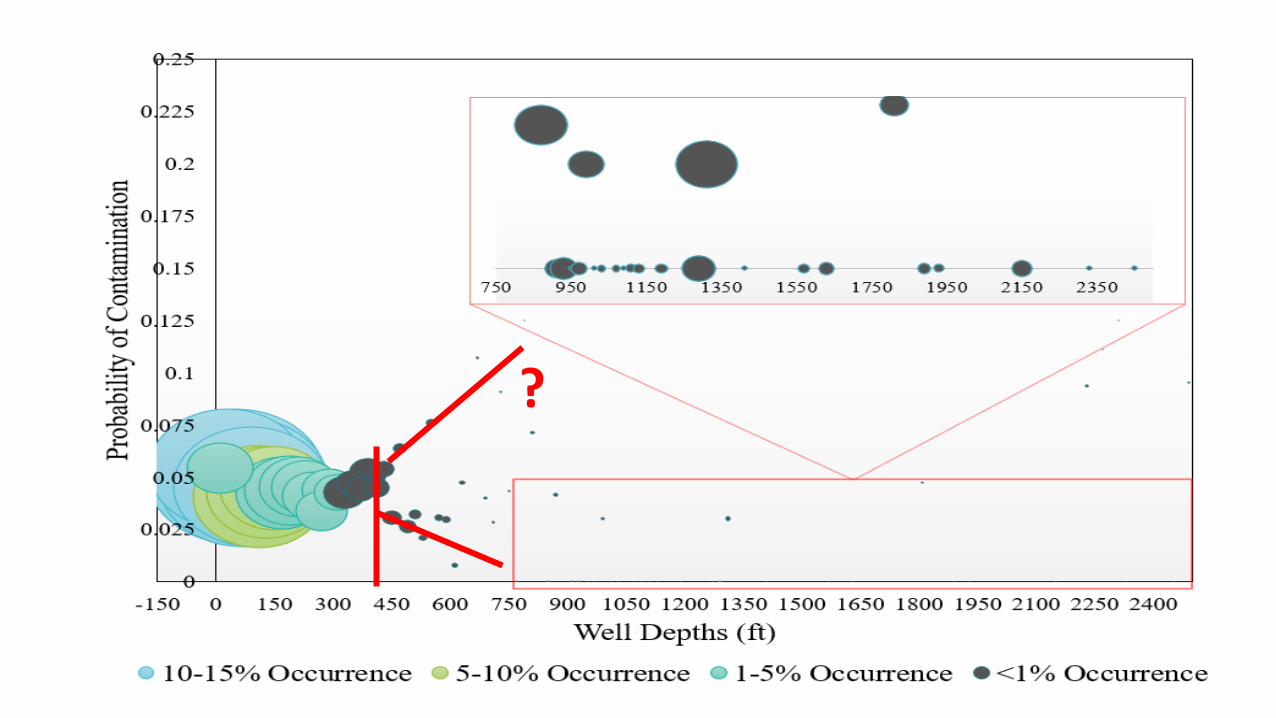
Risk Factor Analysis – Vulnerability • E. coli presence variable among study areas
• High/Extreme Vuln – 11% (SA3) to 44 % (SA5) • Low Vuln – 45% (SA1) Lower than expected E. coli presence within High/Extreme
vulnerability areas, while higher than expected within Low vulnerability area (χ2 = 10.686, p = 0.03)
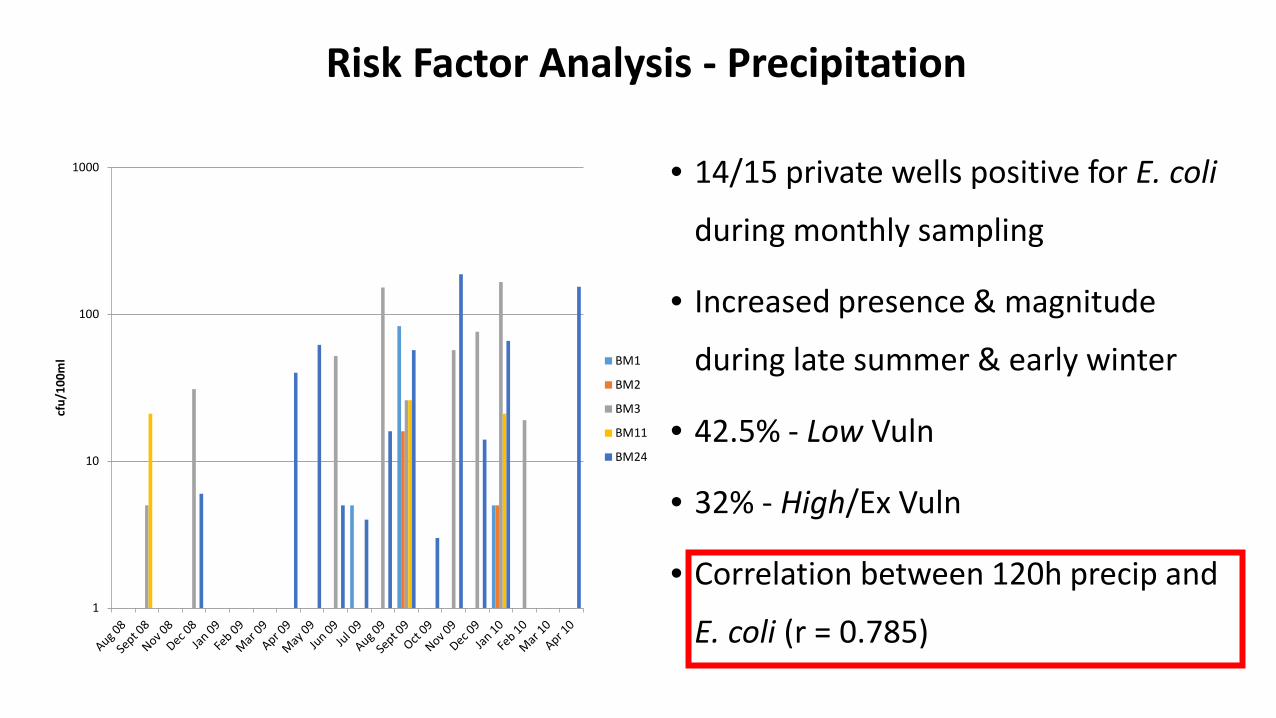
Risk Factor Analysis - Precipitation
• 14/15 private wells positive for E. coli
during monthly sampling
• Increased presence & magnitude
during late summer & early winter
• 42.5% - Low Vuln
• 32% - High/Ex Vuln
• Correlation between 120h precip and
E. coli (r = 0.785) 1
10
100
1000
cfu/
100m
l BM1
BM2
BM3
BM11
BM24

Hierarchical Logistic Regression
• 11 models in total
• Classification Cutoff point = 0.5
• Susceptibility models were developed to 90% predictive accuracy
• Will present Low and High Vuln. Models

Low Vulnerability LR Model
• Significant hierarchies included: • Well Design Parameters – 52.8% • Septic Tank Proximity – 24.2% • Antecedent Precipitation – 13.2% • Agricultural Landuse – 9.5% Well Design Parameters – Liner Clearance & Liner Cap Antecedent Precipitation – 48-hour & 120-hour

Low Vulnerability LR Model
• Significant hierarchies included: • Well Design Parameters – 52.8% • Septic Tank Proximity – 24.2% • Antecedent Precipitation – 13.2% • Agricultural Landuse – 9.5% Well Design Parameters – Liner Clearance & Liner Cap Antecedent Precipitation – 48-hour & 120-hour WHAT’S MISSING? HYDROGEOLOGY!
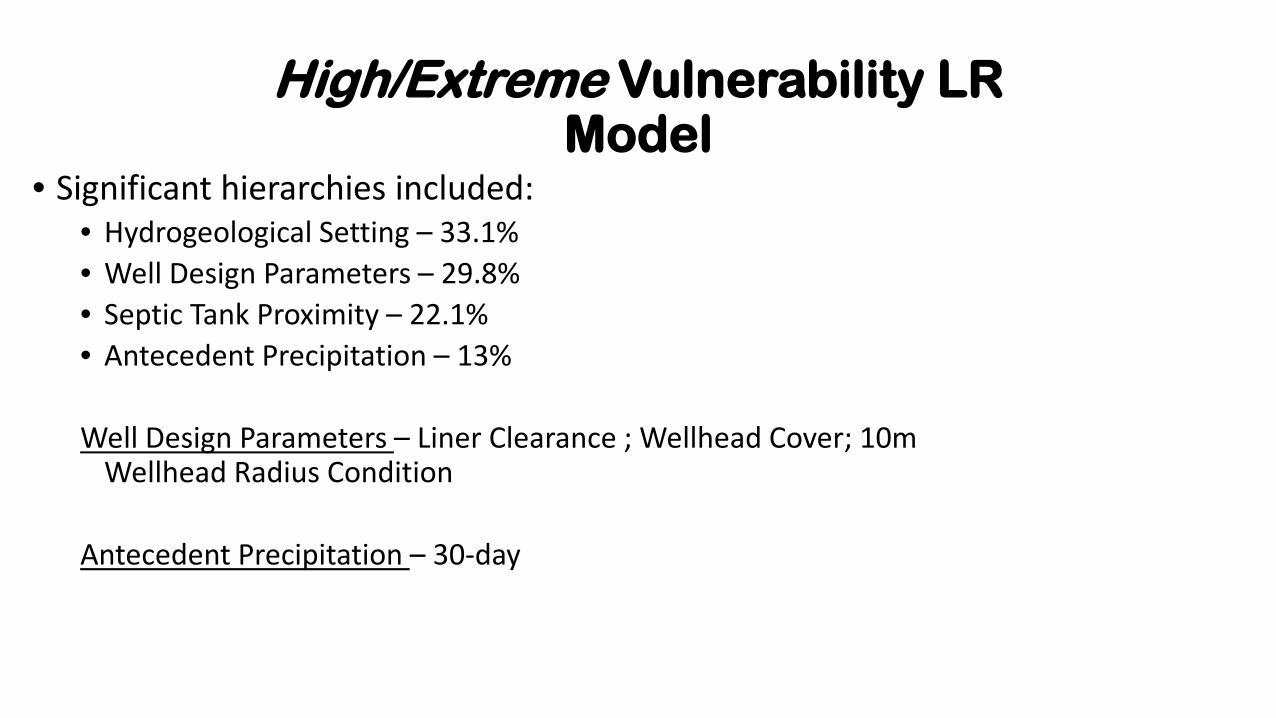
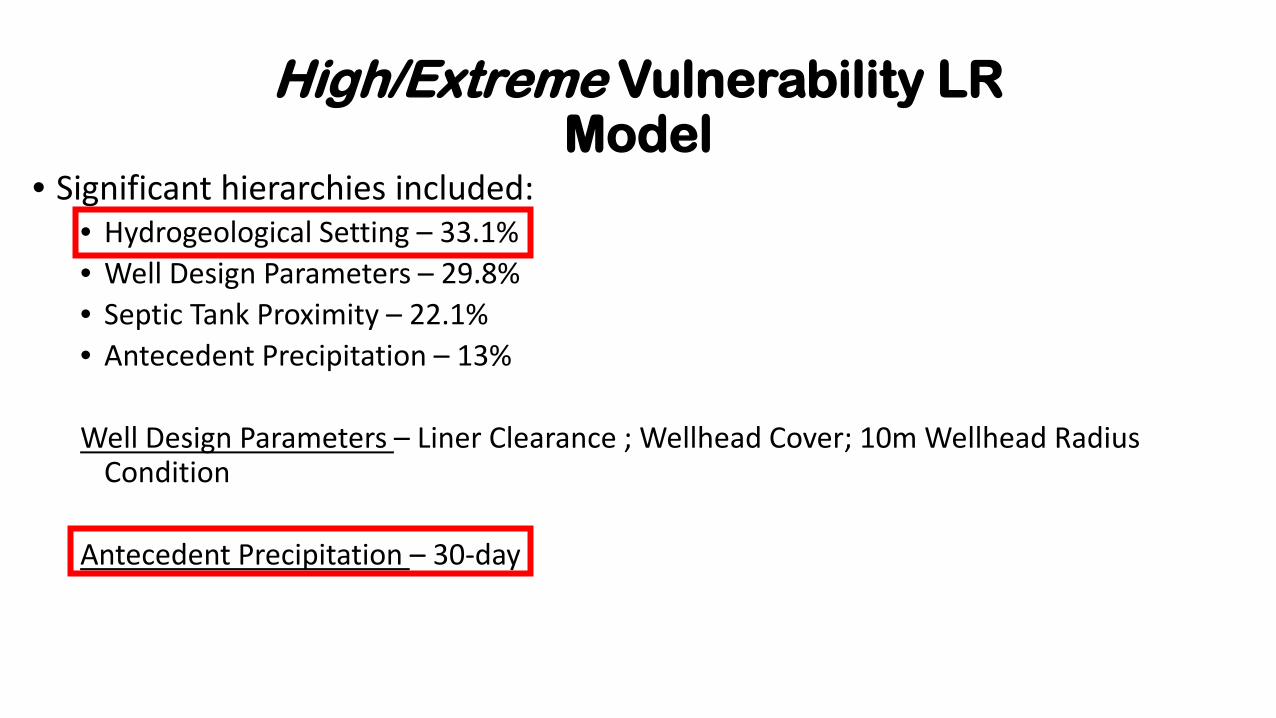
High/Extreme Vulnerability LR Model
• Significant hierarchies included: • Hydrogeological Setting – 33.1% • Well Design Parameters – 29.8% • Septic Tank Proximity – 22.1% • Antecedent Precipitation – 13% Well Design Parameters – Liner Clearance ; Wellhead Cover; 10m
Wellhead Radius Condition Antecedent Precipitation – 30-day
High/Extreme Vulnerability LR Model
• Significant hierarchies included: • Hydrogeological Setting – 33.1% • Well Design Parameters – 29.8% • Septic Tank Proximity – 22.1% • Antecedent Precipitation – 13% Well Design Parameters – Liner Clearance ; Wellhead Cover; 10m Wellhead Radius
Condition Antecedent Precipitation – 30-day

Vulnerability Model Comparison Low Vulnerability High/Extreme Vulnerability
• Local hydrogeology not found to be significant
• Well design highly significant (52.8%)
• Septic tank proximity significant (24.2%)
• Short-term precipitation significant (13.2%)
• Agriculture significant (9.5%)
• Local hydrogeology significant (33.1%)
• Well design significant (29.8%)
• Septic tank proximity significant (22.1%)
• Medium-term precipitation significant (13%)
• Agriculture not found to be significant

Vulnerability – Recharge – Runoff – Precipitation - Susceptibility
The link between subsoil permeability, recharge, runoff and vulnerability
Source: Misstear et al.; Hydrogeology Journal (2009) 17: 275-285

The “Ontario Dataset”

The “WELLness” Project
Dual Receptor Model

Well Testing Information System
Water Well Information System
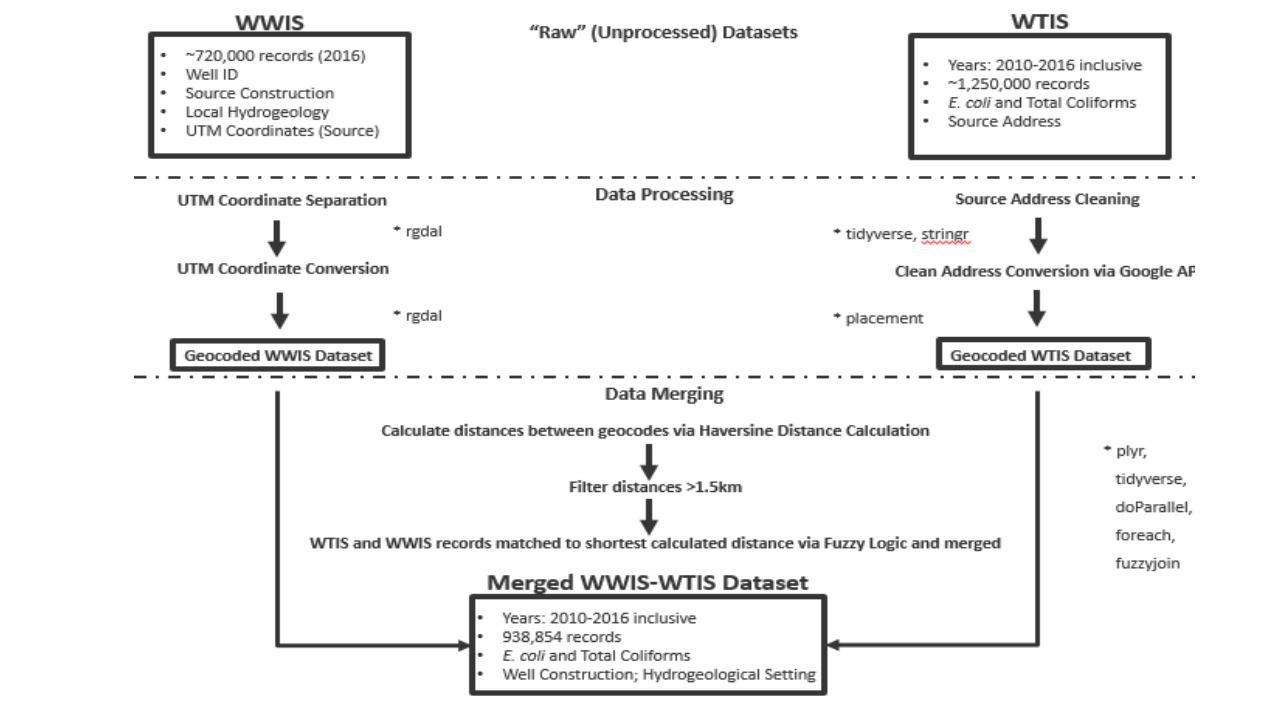
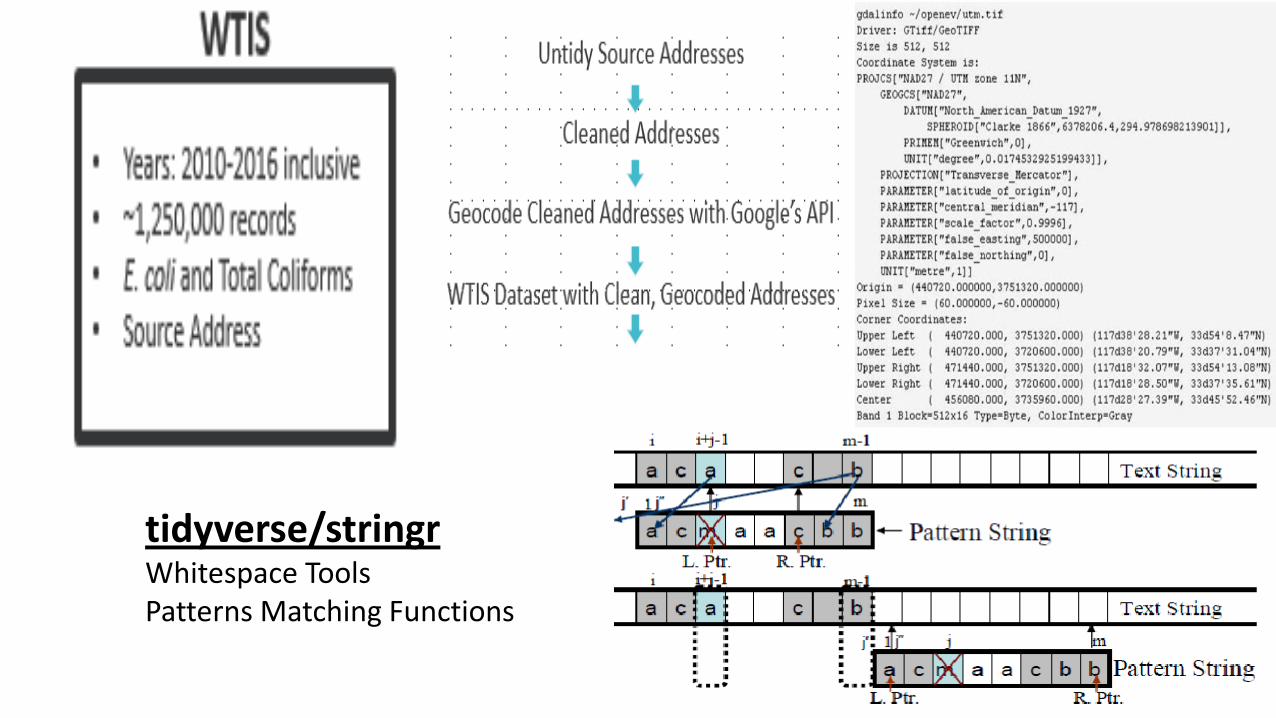
tidyverse/stringr Whitespace Tools Patterns Matching Functions
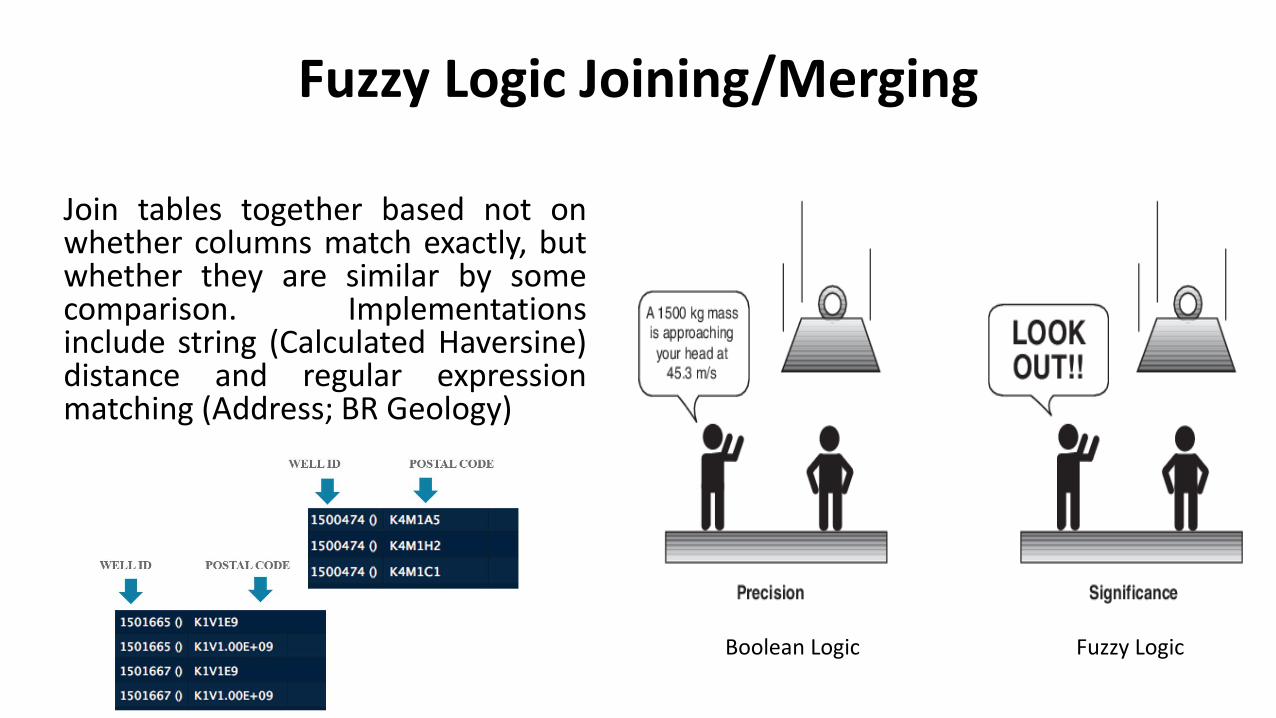
Fuzzy Logic Joining/Merging Join tables together based not on whether columns match exactly, but whether they are similar by some comparison. Implementations include string (Calculated Haversine) distance and regular expression matching (Address; BR Geology)
Boolean Logic Fuzzy Logic

Distance Analysis of Merged Dataset
Approximately 62,000,000 datapoints!!!
?


Conclusions
• Developed models seem to work logically as predictive tools; • Private well susceptibility is a product of a number of factors including; well
type, well design and construction, hazard source proximity, geological setting (High/Extreme vuln), precipitation and aquifer vulnerability;
• Significance of short-term precipitation (Low vuln) suggests rapid by-pass
contamination mechanisms and very specific point/zone of ingress;
Conclusions
• Significance of medium-term antecedent precipitation (High Vuln) suggests slower contamination pathways;
• Significance of hydrogeo setting within High Vuln cohort and source characteristics within total cohort suggests multiple mechanisms;
• Vulnerability/susceptibility/risk probability are extremely fluid concepts and
depend on multiple variables and variable interactions
• Contamination mechanisms (well and aquifer) are as unique as the well or aquifer they are associated with.

O18 isoscape for Ireland and geospatial drivers
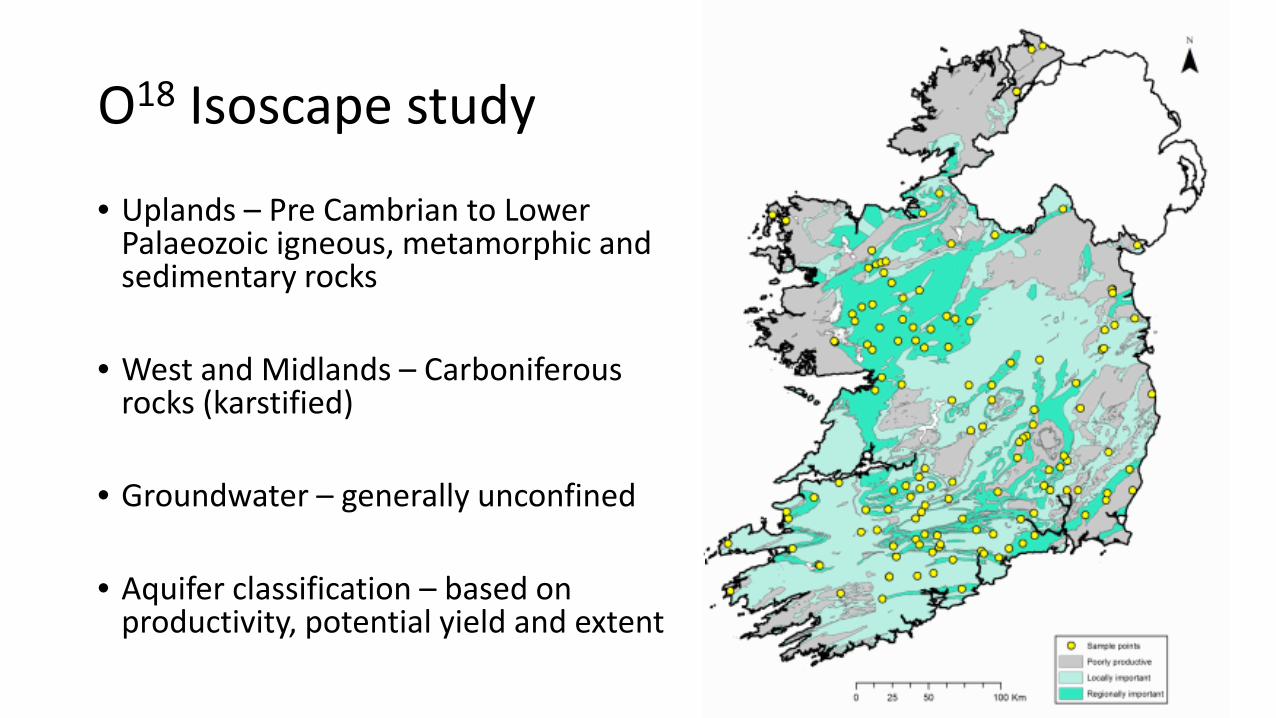
O18 Isoscape study
• Uplands – Pre Cambrian to Lower Palaeozoic igneous, metamorphic and sedimentary rocks
• West and Midlands – Carboniferous
rocks (karstified)
• Groundwater – generally unconfined
• Aquifer classification – based on productivity, potential yield and extent
O18 Isoscape drivers
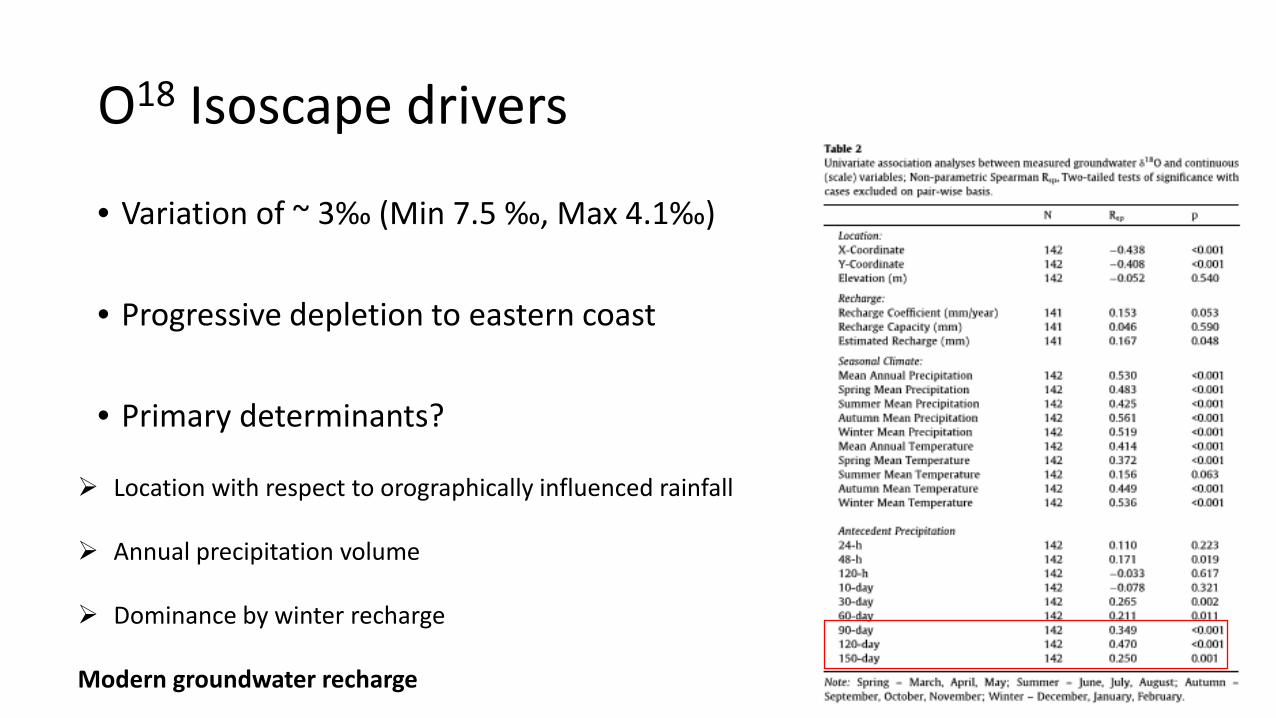
• Variation of ~ 3‰ (Min 7.5 ‰, Max 4.1‰)
• Progressive depletion to eastern coast
• Primary determinants?
Location with respect to orographically influenced rainfall
Annual precipitation volume
Dominance by winter recharge Modern groundwater recharge
O18 Isoscape drivers
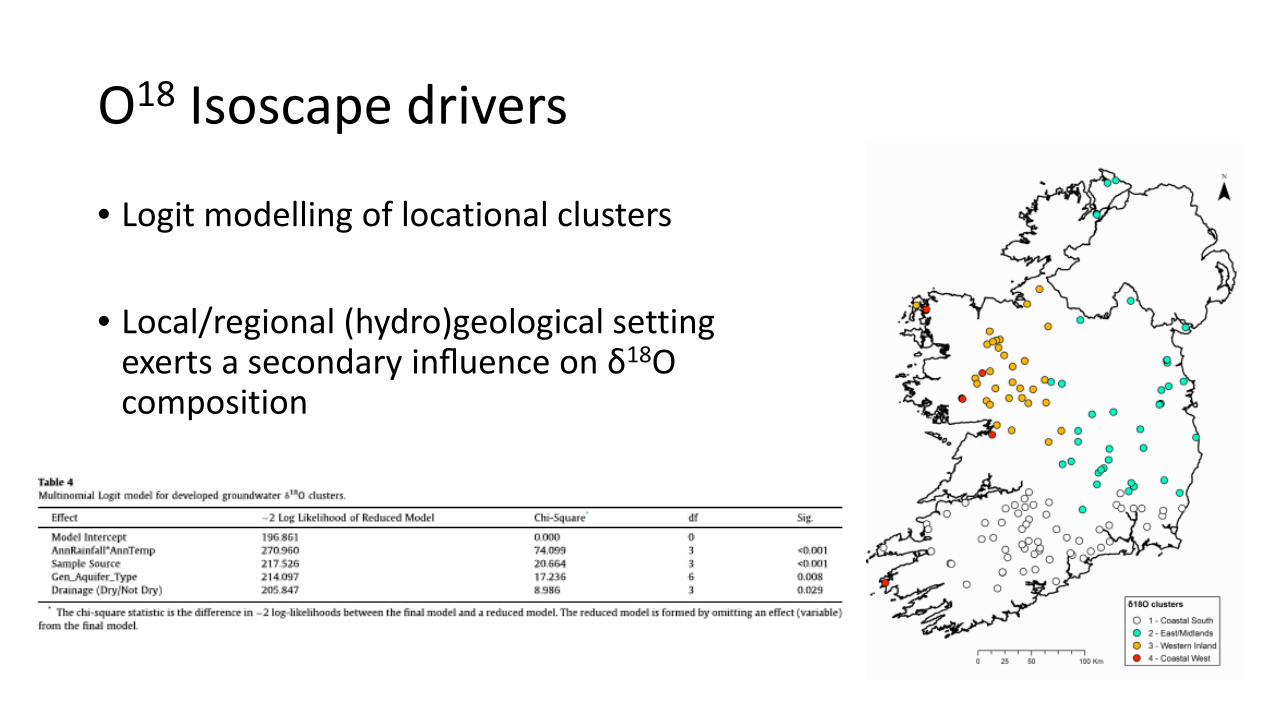
• Logit modelling of locational clusters
• Local/regional (hydro)geological setting exerts a secondary influence on δ18O composition
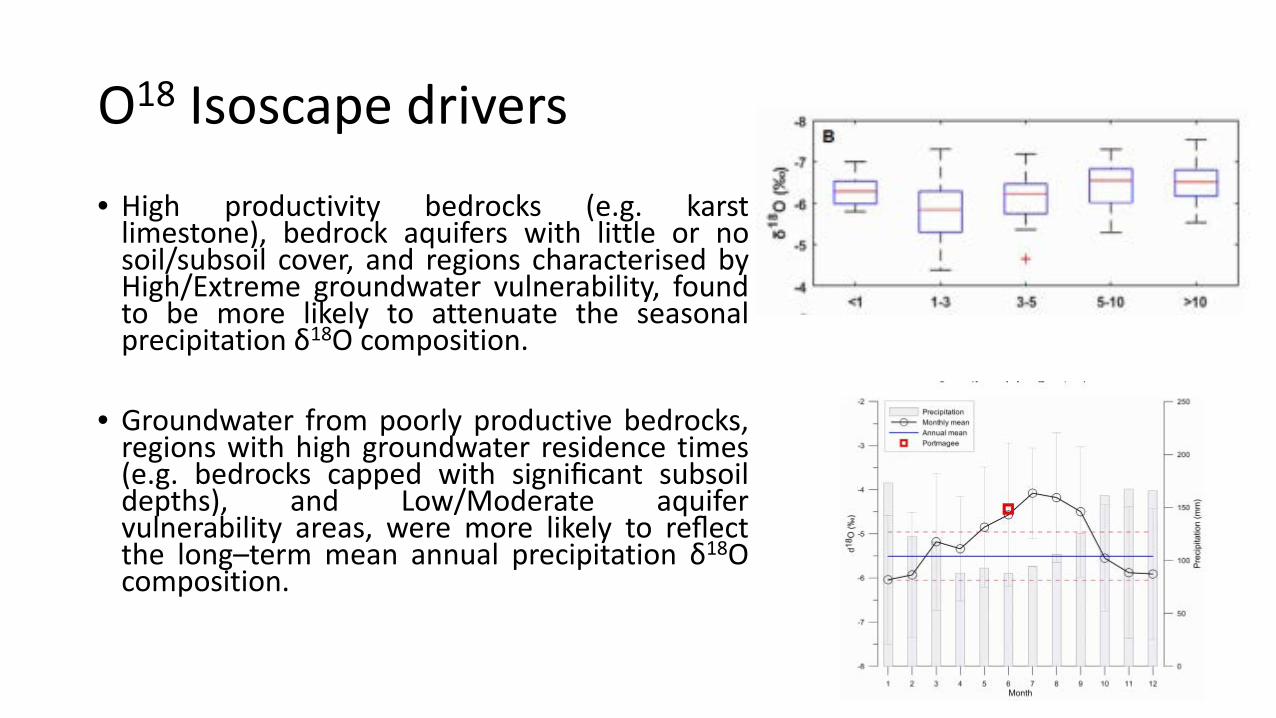
O18 Isoscape drivers • High productivity bedrocks (e.g. karst
limestone), bedrock aquifers with little or no soil/subsoil cover, and regions characterised by High/Extreme groundwater vulnerability, found to be more likely to attenuate the seasonal precipitation δ18O composition.
• Groundwater from poorly productive bedrocks,
regions with high groundwater residence times (e.g. bedrocks capped with significant subsoil depths), and Low/Moderate aquifer vulnerability areas, were more likely to reflect the long–term mean annual precipitation δ18O composition.

2018 ‘Drought’

2018 ‘Drought’
• Increase ~ 1 mil in karst area (e.g. from -6.3 to -5.6) – Karst aquifers
• Decrease in east ~ 1 mil in karst area (e.g. from - 6.6 to -7.9) – Ll aquifers
• Faster recharge to west? GW-SW interaction in karst systems
• East – more representative of annual rainfall concentration

Precipitation dynamic
-12.00
-10.00
-8.00
-6.00
-4.00
-2.00
0.0031.12.17 19.2.18 10.4.18 30.5.18 19.7.18 7.9.18 27.10.18 16.12.18
dO18
Phoenix Park
Clara
Claremorris
Fermoy
Bell Harbour
Snow

Enteric Microbes and Isotopes -
Mechanistic Inference

Contamination Mechanisms Mechanism affects:
- Incidence
- Frequency
- Seasonality
- Concentration
- Predictive Accuracy
- Likelihood of
Infection
- Acquired Immunity
- Ability to design
interventions
Microbes and Isotopes – The Theory • Surface water (and “new” groundwater) can be a source of contamination in
a drinking water well, an understanding of the volume of surface water and travel time to the well is needed to assess a well’s vulnerability/susceptibility/risk prob,
• Seasonal, spatio-temporally distinct isotopic signals could be used as an indicator,
• Stable Isotopes are DEFINITELY not suitable as a tracker/tracer, but may shed light on source- or aquifer-specific mechanisms

Hunt et al., 2005; Journal of Hydrology • Stable isotope ratios of oxygen in river water at the
City of La Crosse, Wisconsin; peak to peak seasonal variation over 2 years,
• 13 urban (public) wells sampled over same period,
• 12-month time-series from 1 well and piezometer located between river,
• Time of travel (TOT) of floodwater assessed using 4 methods; GW Temp, Virus culture, Particle tracking (Model), and Age Dating (3H–3 He)
• NB: No precipitation isotopes

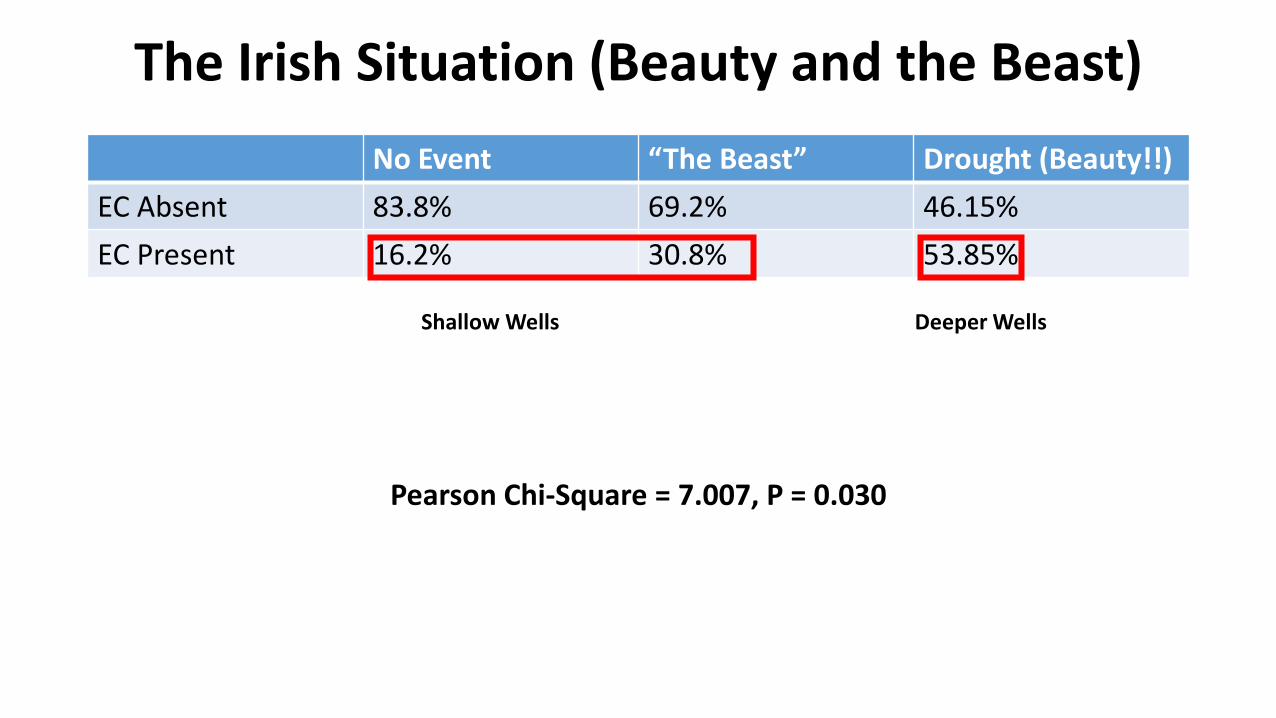
The Irish Situation (Beauty and the Beast) No Event “The Beast” Drought (Beauty!!)
EC Absent 83.8% 69.2% 46.15% EC Present 16.2% 30.8% 53.85%
Shallow Wells Deeper Wells
Pearson Chi-Square = 7.007, P = 0.030

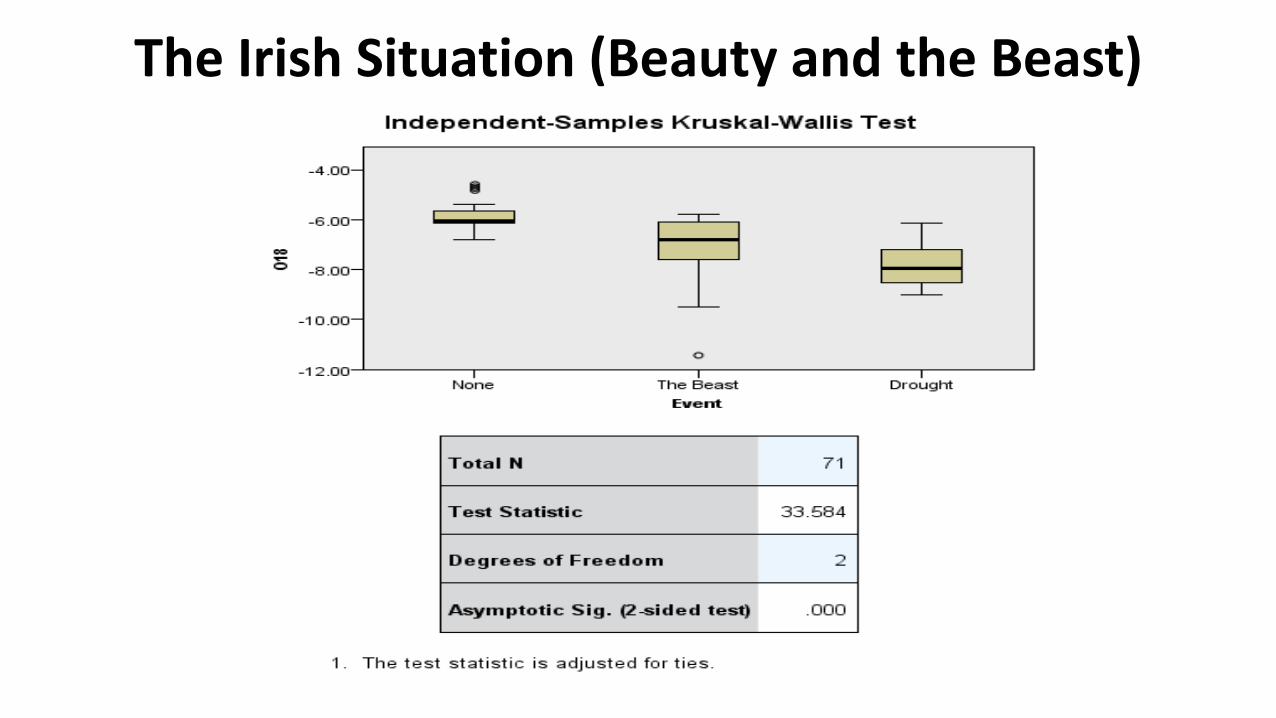
The Irish Situation (Beauty and the Beast) ANOVA
O18 Sum of Squares df Mean Square F Sig. Between Groups 43.264 2 21.632 24.866 .000 Within Groups 59.156 68 .870 Total 102.420 70
Multiple Comparisons Dependent Variable: O18 Bonferroni
(I) Event (J) Event Mean
Difference (I-J) Std. Error Sig. 95% Confidence Interval
Lower Bound Upper Bound None The Beast 1.28218* .25483 .000 .6567 1.9077
Drought 1.87848* .30072 .000 1.1403 2.6166 The Beast None -1.28218* .25483 .000 -1.9077 -.6567
Drought .59630 .32916 .223 -.2117 1.4043 Drought None -1.87848* .30072 .000 -2.6166 -1.1403
The Beast -.59630 .32916 .223 -1.4043 .2117 *. The mean difference is significant at the 0.05 level.
The Irish Situation (Beauty and the Beast)

“THE MODEL” (3-D Incl EC Pres, Event, Depth and O18)
Normal Conditions: Shallow Source (Infiltration), SW & GW Drought Conditions: Deep Source, High Concentration (Dilution), “Real Groundwater” Snow Conditions: Shallow Source (Top Melt), Low Concentration (Dilution), All meltwater after 24hrs Currently, isotopes (O18) 65-75% effective at predicting E. coli presence during all events Precipitation not employed to date
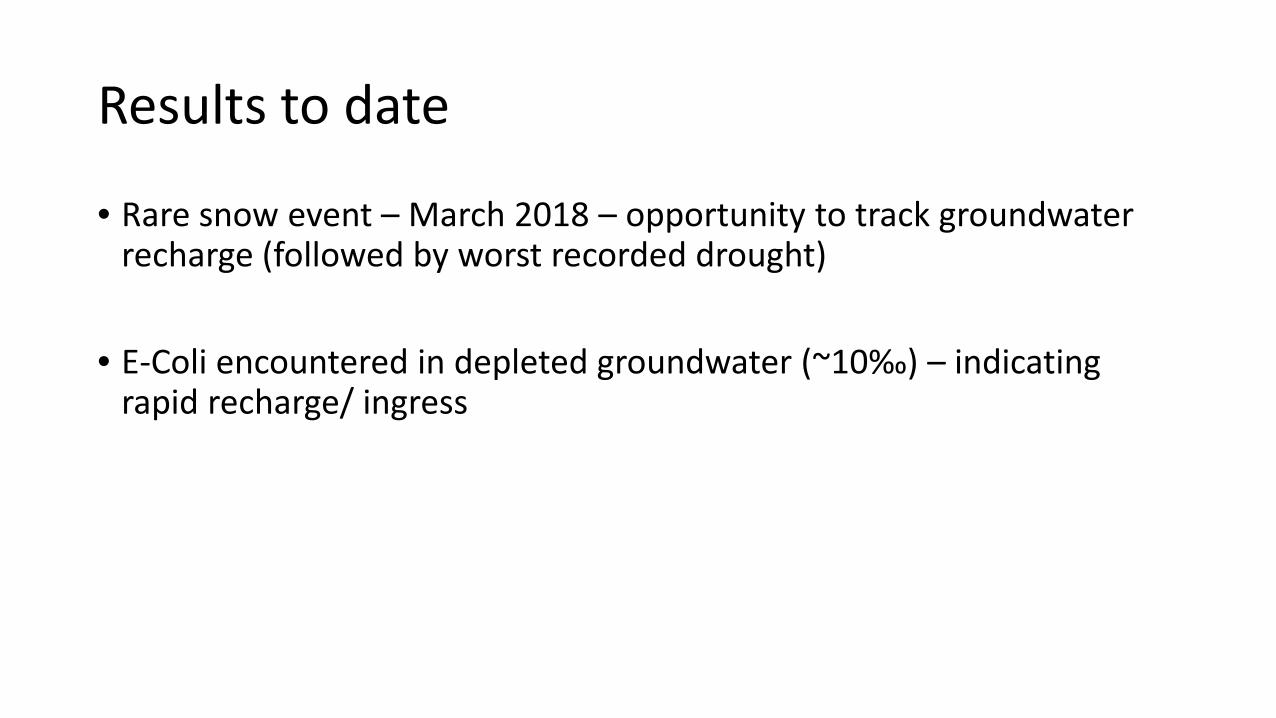
Results to date
• Rare snow event – March 2018 – opportunity to track groundwater recharge (followed by worst recorded drought)
• E-Coli encountered in depleted groundwater (~10‰) – indicating rapid recharge/ ingress

Work to complete and direction
Conclusions
• Recharge biased towards winter months
• 3-5 month recharge time
• Hydrogeology – secondary influence
• Early results indicate potential to track pathogens in ‘vulnerable’ aquifer areas
To do
• Deuterium analysis
• 2nd EPA groundwater sampling round (Oct-Dec 2018), incl. pathogen analysis
• Precipitation isoscapes
• P/GW ratios