st. louis, mo-il nonattainment area final area …. francois county, mo, in the larger st. louis...
TRANSCRIPT
Page 1 of 27
St. Louis, MO-IL Nonattainment Area
Final Area Designations for the 2015 Ozone National Ambient Air Quality Standards
Technical Support Document (TSD)
1.0 Summary This technical support document (TSD) describes the EPA’s final designations for the St. Louis, MO-IL area in Missouri and Illinois as nonattainment for the 2015 ozone National Ambient Air Quality Standards (NAAQS).
On October 1, 2015, the EPA promulgated revised primary and secondary ozone NAAQS (80 FR 65292; October 26, 2015). The EPA strengthened both standards to a level of 0.070 parts per million (ppm). In accordance with Section 107(d) of the Clean Air Act (CAA), whenever the EPA establishes a new or revised NAAQS, the EPA must promulgate designations for all areas of the country for that NAAQS.
Under section 107(d), states were required to submit area designation recommendations to the EPA for the 2015 ozone NAAQS no later than 1 year following promulgation of the standards, i.e., by October 1, 2016. Tribes were also invited to submit area designation recommendations. On September 30, 2016, Illinois recommended that the counties identified in Table 1 be designated nonattainment for the 2015 ozone NAAQS based on air quality data from 2013-2015.1 On September 30, 2016, Missouri recommended that certain counties in Missouri be designated as nonattainment for the 2015 Ozone NAAQS based on air quality data from 2013-2015. Missouri subsequently, on September 22, 2017, requested that EPA not act on these recommendations, and indicated they would submit additional information to inform designations and boundaries for the area. On February 23, 2018, Missouri submitted additional information, recommending St. Charles County, St. Louis County, and St. Louis City be designated nonattainment based on air quality data from 2015-2017.
After considering the States’ recommendations, including the additional information submitted after EPA notified the State of the intended designation, and based on the EPA’s technical analysis as described in this TSD, the EPA is designating the area listed in Table 1 as nonattainment for the 2015 ozone NAAQS. The EPA must designate an area nonattainment if it has an air quality monitor that is violating the standard or if it has sources of emissions that are contributing to a violation of the NAAQS in a nearby area. A detailed description of the nonattainment boundary for the area is found in the supporting technical analysis in Section 3.
1 On April 26, 2018, Illinois submitted a letter to EPA indicating that consideration of a designation of attainment would be appropriate for Monroe County.

Page 2 of 27
Table 1. Recommended Nonattainment Counties and the EPA’s Final Nonattainment Area for the 2015 Ozone NAAQS
St. Louis, MO-IL Recommended Nonattainment Counties
Updated Recommended Nonattainment Counties
EPA’s Final Nonattainment Counties
Missouri
None
City of St. Louis St. Charles St. Louis2
City of St. Louis
Franklin (partial; Boles Township) St. Charles St. Louis
Illinois
Madison Monroe St. Clair
Madison Monroe3 St. Clair
Madison St. Clair
On November 6, 2017 (82 FR 54232), the EPA signed a final rule designating most of the areas in Missouri and Illinois as attainment/unclassifiable.4 EPA explains in section 2.0 the approach it is now taking to designate the remaining areas in the State.
After considering the Missouri’s revised recommendation and additional information submitted by Missouri and Illinois, the EPA is designating St. Charles and St. Louis Counties, the City of St. Louis, and Boles Township in Franklin County in Missouri, and Madison and St. Clair Counties in Illinois as nonattainment based on technical analyses discussed in Section 3 of this document.
2.0 Nonattainment Area Analyses and Boundary Determination The EPA evaluated and determined the boundaries for each nonattainment area on a case-by-case basis, considering the specific facts and circumstances of the area. In accordance with the CAA section 107(d), the EPA is designating as nonattainment the areas with the monitors that are violating the 2015 ozone NAAQS and nearby areas with emissions sources (i.e., stationary, mobile, and/or area sources) that contribute to the violations. As described in the EPA’s designations guidance for the 2015 NAAQS (hereafter referred to as the
2 EPA received Missouri’s initial recommendation in a letter dated September 30, 2016. However, Missouri subsequently sent a letter on September 22, 2017, requesting the Agency not act on the state’s initial recommendations, and indicating MDNR’s desire to reconsider its previous boundary recommendation. During the 120-day period, the State recommended designating as nonattainment three counties as part of the St. Louis area. 3 On April 26, 2018, Illinois submitted a letter to EPA indicating that consideration of a designation of attainment would be appropriate for Monroe County. 4 In previous ozone designations and in the designation guidance for the 2015 ozone NAAQS, the EPA used the designation category label Unclassifiable/Attainment to identify both areas that were monitoring attainment and areas that did not have monitors but for which the EPA had reason to believe were likely attainment and were not contributing to a violation in a nearby area. The EPA is now reversing the order of the label to be Attainment/Unclassifiable so that the category is more clearly distinguished from the separate Unclassifiable category.
Page 3 of 27
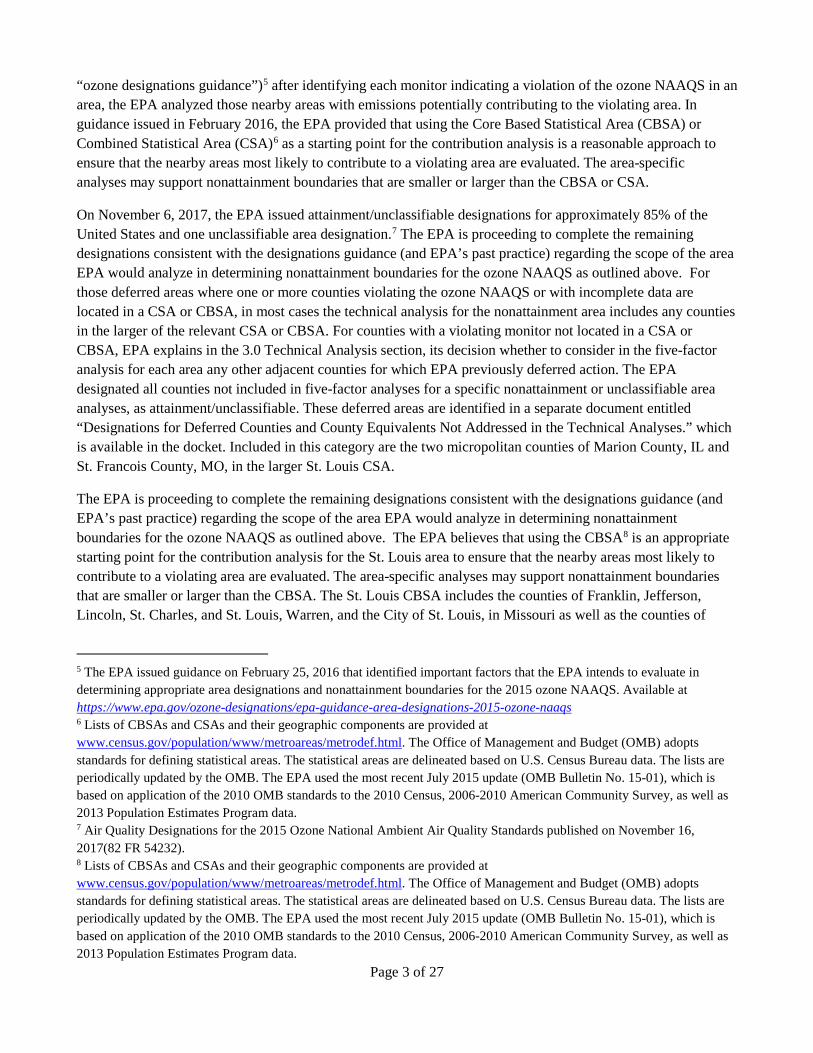
“ozone designations guidance”)5 after identifying each monitor indicating a violation of the ozone NAAQS in an area, the EPA analyzed those nearby areas with emissions potentially contributing to the violating area. In guidance issued in February 2016, the EPA provided that using the Core Based Statistical Area (CBSA) or Combined Statistical Area (CSA)6 as a starting point for the contribution analysis is a reasonable approach to ensure that the nearby areas most likely to contribute to a violating area are evaluated. The area-specific analyses may support nonattainment boundaries that are smaller or larger than the CBSA or CSA.
On November 6, 2017, the EPA issued attainment/unclassifiable designations for approximately 85% of the United States and one unclassifiable area designation.7 The EPA is proceeding to complete the remaining designations consistent with the designations guidance (and EPA’s past practice) regarding the scope of the area EPA would analyze in determining nonattainment boundaries for the ozone NAAQS as outlined above. For those deferred areas where one or more counties violating the ozone NAAQS or with incomplete data are located in a CSA or CBSA, in most cases the technical analysis for the nonattainment area includes any counties in the larger of the relevant CSA or CBSA. For counties with a violating monitor not located in a CSA or CBSA, EPA explains in the 3.0 Technical Analysis section, its decision whether to consider in the five-factor analysis for each area any other adjacent counties for which EPA previously deferred action. The EPA designated all counties not included in five-factor analyses for a specific nonattainment or unclassifiable area analyses, as attainment/unclassifiable. These deferred areas are identified in a separate document entitled “Designations for Deferred Counties and County Equivalents Not Addressed in the Technical Analyses.” which is available in the docket. Included in this category are the two micropolitan counties of Marion County, IL and St. Francois County, MO, in the larger St. Louis CSA.
The EPA is proceeding to complete the remaining designations consistent with the designations guidance (and EPA’s past practice) regarding the scope of the area EPA would analyze in determining nonattainment boundaries for the ozone NAAQS as outlined above. The EPA believes that using the CBSA8 is an appropriate starting point for the contribution analysis for the St. Louis area to ensure that the nearby areas most likely to contribute to a violating area are evaluated. The area-specific analyses may support nonattainment boundaries that are smaller or larger than the CBSA. The St. Louis CBSA includes the counties of Franklin, Jefferson, Lincoln, St. Charles, and St. Louis, Warren, and the City of St. Louis, in Missouri as well as the counties of
5 The EPA issued guidance on February 25, 2016 that identified important factors that the EPA intends to evaluate in determining appropriate area designations and nonattainment boundaries for the 2015 ozone NAAQS. Available at https://www.epa.gov/ozone-designations/epa-guidance-area-designations-2015-ozone-naaqs 6 Lists of CBSAs and CSAs and their geographic components are provided at www.census.gov/population/www/metroareas/metrodef.html. The Office of Management and Budget (OMB) adopts standards for defining statistical areas. The statistical areas are delineated based on U.S. Census Bureau data. The lists are periodically updated by the OMB. The EPA used the most recent July 2015 update (OMB Bulletin No. 15-01), which is based on application of the 2010 OMB standards to the 2010 Census, 2006-2010 American Community Survey, as well as 2013 Population Estimates Program data. 7 Air Quality Designations for the 2015 Ozone National Ambient Air Quality Standards published on November 16, 2017(82 FR 54232). 8 Lists of CBSAs and CSAs and their geographic components are provided at www.census.gov/population/www/metroareas/metrodef.html. The Office of Management and Budget (OMB) adopts standards for defining statistical areas. The statistical areas are delineated based on U.S. Census Bureau data. The lists are periodically updated by the OMB. The EPA used the most recent July 2015 update (OMB Bulletin No. 15-01), which is based on application of the 2010 OMB standards to the 2010 Census, 2006-2010 American Community Survey, as well as 2013 Population Estimates Program data.
Page 4 of 27
Bond, Calhoun, Clinton, Jersey, Macoupin, Madison, Monroe, and St. Clair in Illinois. The EPA’s analytical approach is described in Section 3 of this technical support document.

Page 5 of 27
3.0 Technical Analysis for St. Louis, MO-IL This technical analysis identifies the counties with monitors that violate the 2015 ozone NAAQS. The EPA evaluated counties with violating monitors and any nearby counties to determine whether those nearby counties had emissions sources that potentially contribute to ambient ozone concentrations at the violating monitors, based on the weight-of-evidence of the five factors recommended in the EPA’s ozone designations guidance and any other relevant information. In developing this technical analysis, the EPA used the latest data and information available to the EPA (and to the states and tribes through the Ozone Designations Mapping Tool and the EPA Ozone Designations Guidance and Data web page).9 In addition, the EPA considered any additional data or information provided to the EPA by states or tribes.
The five factors recommended in the EPA’s guidance are:
1. Air Quality Data (including the design value calculated for each Federal Reference Method (FRM) or Federal Equivalent Method (FEM) monitor;
2. Emissions and Emissions-Related Data (including locations of sources, population, amount of emissions, and urban growth patterns);
3. Meteorology (weather/transport patterns); 4. Geography/Topography (including mountain ranges or other physical features that may influence the
fate and transport of emissions and ozone concentrations); and 5. Jurisdictional Boundaries (e.g., counties, air districts, existing nonattainment areas, areas of Indian
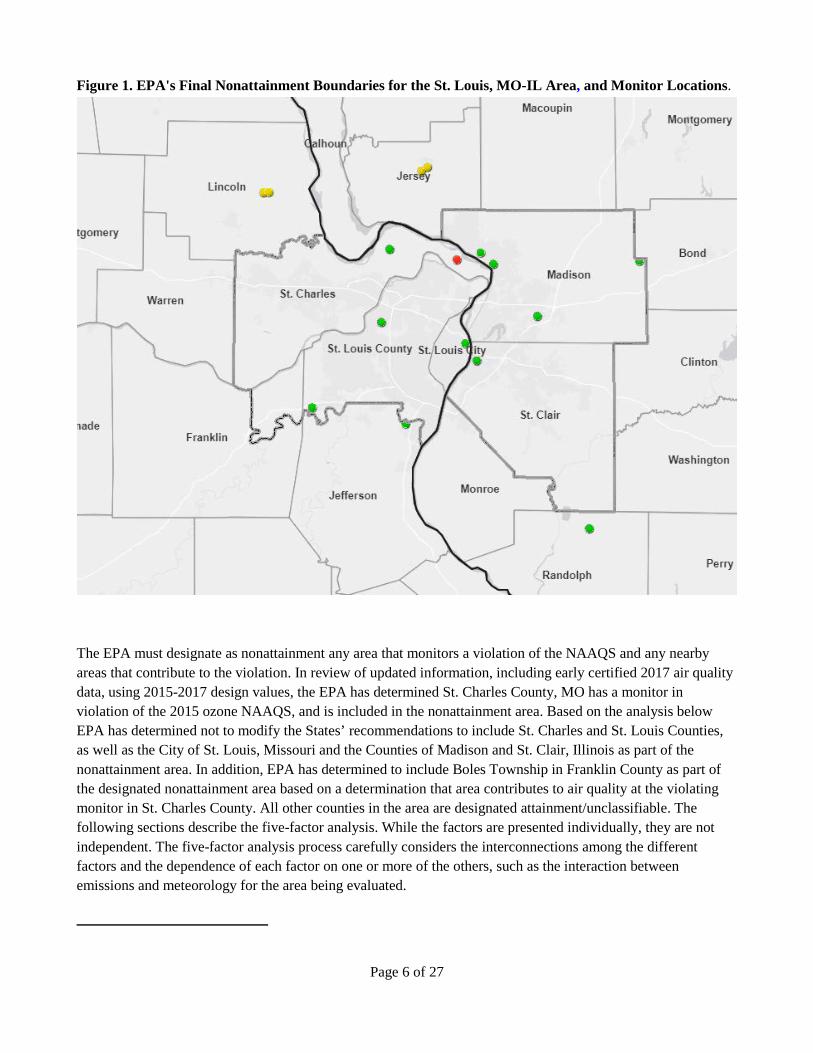
country, Metropolitan Planning Organizations (MPOs)). Figure 1 is a map of the EPA’s final boundary for the St. Louis, MO-IL nonattainment area. The map shows the location of the ambient air quality monitors, county, and other jurisdictional boundaries. All of the areas in the final nonattainment boundary for the 2015 ozone NAAQS were also in the boundary for 2008 ozone NAAQS nonattainment area.
For purposes of the 1997 ozone NAAQS, this area was also designated nonattainment. The boundary for the nonattainment area for the 1997 ozone NAAQS included the entire counties of Franklin, Jefferson, St. Charles, and St. Louis, and the City of St. Louis, Missouri as well as the entire counties of Jersey, Madison, Monroe, and St. Clair, Illinois. For purposes of the 2008 ozone NAAQS, the nonattainment area included the same counties as for the 1997 ozone NAAQS, with the exception of Jersey County in Illinois.
9 The EPA’s Ozone Designations Guidance and Data web page can be found at https://www.epa.gov/ozone-designations/ozone-designations-guidance-and-data. .
Page 6 of 27
Figure 1. EPA's Final Nonattainment Boundaries for the St. Louis, MO-IL Area, and Monitor Locations.
The EPA must designate as nonattainment any area that monitors a violation of the NAAQS and any nearby areas that contribute to the violation. In review of updated information, including early certified 2017 air quality data, using 2015-2017 design values, the EPA has determined St. Charles County, MO has a monitor in violation of the 2015 ozone NAAQS, and is included in the nonattainment area. Based on the analysis below EPA has determined not to modify the States’ recommendations to include St. Charles and St. Louis Counties, as well as the City of St. Louis, Missouri and the Counties of Madison and St. Clair, Illinois as part of the nonattainment area. In addition, EPA has determined to include Boles Township in Franklin County as part of the designated nonattainment area based on a determination that area contributes to air quality at the violating monitor in St. Charles County. All other counties in the area are designated attainment/unclassifiable. The following sections describe the five-factor analysis. While the factors are presented individually, they are not independent. The five-factor analysis process carefully considers the interconnections among the different factors and the dependence of each factor on one or more of the others, such as the interaction between emissions and meteorology for the area being evaluated.
Page 7 of 27
Factor Assessment Factor 1: Air Quality Data
The 2015 NAAQS is met when the design value is 0.070 ppm or less. The design value is the 3-year average of the annual 4th highest daily maximum 8-hour average ozone concentration.10 Only ozone measurement data collected in accordance with the quality assurance (QA) requirements using approved (FRM/FEM) monitors are used for NAAQS compliance determinations.11 The EPA uses FRM/FEM measurement data residing in the EPA’s Air Quality System (AQS) database to calculate the ozone design values. Individual violations of the 2015 ozone NAAQS that the EPA determines have been caused by an exceptional event that meets the administrative and technical criteria in the Exceptional Events Rule are not included in these calculations.12 Whenever several monitors are located in a county (or designated nonattainment area), the design value for the county or area is determined by the monitor with the highest valid design value. The presence of one or more violating monitors (i.e. monitors with design values greater than 0.070 ppm) in a county or other geographic area forms the basis for designating that county or area as nonattainment. The remaining four factors are then used as the technical basis for determining the spatial extent of the designated nonattainment area surrounding the violating monitor(s) based on a consideration of what nearby areas are contributing to a violation of the NAAQS.
The EPA identified monitors where the most recent design values violate the NAAQS, and examined historical ozone air quality measurement data (including previous design values) to understand the nature of the ozone ambient air quality problem in the area. Eligible monitors for providing design value data generally include State and Local Air Monitoring Stations (SLAMS) that are operated in accordance with 40 CFR part 58, appendix A, C, D and E and operating with an FRM or FEM monitor. These requirements must be met in order to be acceptable for comparison to the 2015 ozone NAAQS for designation purposes. All data from Special Purpose Monitors (SPMs) using an FRM or FEM are eligible for comparison to the NAAQS, subject to the requirements given in the March 28, 2016, Revision to Ambient Monitoring Quality Assurance and Other Requirements Rule (81 FR 17248).
EPA based its evaluation on 2014-2016 monitoring data for its intended designations announced in December 2017. However, since that time, the Missouri Department of Natural Resources and Illinois Environmental Protection Agency submitted their 2017 ozone data certifications in the AQS database on February 09, 2018, and February 28, 2018, respectively. EPA has concurred on the 2017 data in the AQS database. Therefore, in finalizing the designation for this area EPA considered 2015-2017 monitoring data. This is the most recent three-year period with fully-certified air quality data for the area.
The location of monitors is shown in Figure 1, and the 2014-2016 and 2015-2017 design values for the area of analysis are shown in Table 2.
10 The specific methodology for calculating the ozone design values, including computational formulas and data completeness requirements, is described in 40 CFR part 50, appendix U. 11 The QA requirements for ozone monitoring data are specified in 40 CFR part 58, appendix A. The performance test requirements for candidate FEMs are provided in 40 CFR part 53, subpart B. 12 The EPA finalized the rule on the Treatment of Data Influenced by Exceptional Events (81 FR 68513) and the guidance on the Preparation of Exceptional Events Demonstrations for Wildfire Events in September of 2016. For more information, see https://www.epa.gov/air-quality-analysis/exceptional-events-rule-and-guidance.

Page 8 of 27
Table 2. Air Quality Data (all values in ppm) a
County/State Local Site Name AQS Site ID
2015-2017
Design Value
2014-2016
Design Value
2014 4th Highest
Daily Max
Value
2015 4th Highest
Daily Max
Value
2016 4th Highest
Daily Max
Value
2017 4thHighest Daily Max
Value
Jersey, IL Illini Jr. High 170831001 0.069 0.068 0.065 0.067 0.074 0.067 Macoupin, IL IEPA Trailer 171170002 0.065 0.064 0.063 0.064 0.067 0.066
Madison, IL
Clara Barton School 171190008 0.069 0.071 0.072 0.069 0.073 0.066
Southwest Cable TV 171191009 0.068 0.067 0.07 0.064 0.067 0.074
Water Plant 171193007 0.070 0.071 0.070 0.069 0.075 0.067 Alhambra 171199991 0.065 0.067 0.068 0.067 0.068 0.062
Saint Clair, IL IEPA-RAPS Trailer 171630010 0.068 0.068 0.067 0.066 0.073 0.067 Jefferson, MO Arnold West 290990019 0.068 0.070 0.072 0.069 0.070 0.06613 Lincoln, MO Foley 291130003 N/A 0.065 0.067 0.065 0.065 N/A Foley 291130004 N/A N/A N/A N/A N/A 0.066 Saint Charles, MO
West Alton 291831002 0.072 0.072 0.072 0.07 0.075 0.072 Orchard Farm 291831004 0.070 0.071 0.072 0.066 0.076 0.068
Saint Louis, MO
Pacific 291890005 0.064 0.065 0.065 0.065 0.067 0.062 Maryland Heights 291890014 0.069 0.071 0.072 0.069 0.073 0.067
City of St. Louis, MO Blair Street 295100085 0.066 0.065 0.066 0.063 0.068 0.068
a The current highest valid design value in counties with multiple monitors is indicated in bold In the analysis based on 2014-2016 data, four monitors in three different counties indicated violations of the 2015 NAAQS: two monitors in St. Charles County and one monitor in St. Louis County in Missouri and one monitor in Madison County, Illinois. For the final designation, based on 2015-2017 data, only one monitor in
13 Review of the data from the Arnold West monitor (site ID 290990019) showed a potential low bias when comparing recorded 2017 data to other St. Louis monitoring location sites. The comparison showed apparent bias in ozone concentrations observed at the Arnold West site from 3/1/2017 through 7/5/2017. This could have been due to the effects of ozone scrubbing from particulate contamination in the site inlet manifold possibly due to sandblasting during water tower maintenance performed near the site from 3/31/2017 to 6/23/2017. MoDNR’s Arnold West site quality assurance performance records indicate that the monitor was performing within specifications during this period of time. MoDNR has indicated that it will place informational flags in the AQS database for the Arnold West ozone data set for the period of time likely impacted by the water tower maintenance work. The annual fourth-highest daily maximum 8-hour ozone concentration ranking for the Arnold West site (and hence its 2015-2017 design value of 68 ppb) does not change due to the data ranking, flagging, and QC standards as there are no provisions in 40 CFR 58 or 40 CFR 50 that allow for adjusting ozone data due to bias.

Page 9 of 27
the area in St. Charles County, Missouri is in violation of the 2015 ozone NAAQS. There are no violating monitors in the Illinois portion of the area for 2015-2017.
As shown in Figure 2, there is an overall downward trend in the annual design values for the violating St. Charles County monitor (West Alton) from 2007-2017, from a 102 ppb design value in 1976 to a 72 ppb design value in 2017. MoDNR notes in their revised boundary recommendation document (February 2018), that this downward trend is expected to continue with new federal onroad and nonroad source controls that target NOX
emissions from motor vehicles and the Cross-State Air Pollution Rule (CSAPR) that targets NOX emissions from large electric generating units (EGU). Figure 2. Three-Year Design Values for West Alton Monitor (2007-2017).
Factor 2: Emissions and Emissions-Related Data The EPA evaluated ozone precursor emissions of NOx and VOCs and other emissions-related data that provide information on areas potentially contributing to the violating monitor.
Emissions Data
The EPA reviewed data from the 2014 National Emissions Inventory (NEI). For each county in the area of analysis, the EPA examined the magnitude of large sources (NOx or VOC emissions greater than 100 tons per year) and the magnitude of county-level emissions reported in the NEI. These county-level emissions represent the sum of emissions from the following general source categories: point sources, non-point (i.e., area) sources, non-road mobile, on-road mobile, and fires. Emissions levels from sources in a nearby area indicate the potential for the area to contribute to monitored violations.
Table 3 provides a county-level emissions summary of NOx and VOC (given in tons per year (tpy)) emissions for the area of analysis considered for inclusion in the St. Louis, MO-IL nonattainment area.
0.06
0.065
0.07
0.075
0.08
0.085
0.09
0.095
2007 2008 2009 2010 2011 2012 2013 2014 2015 2016 2017
West Alton

Page 10 of 27
Table 3. Total County-Level NOx and VOC Emissions.
County* NOx (tpy) VOC (tpy) NOx % VOC % St. Louis, MO 34,847 26,869 28.8% 31.6% St. Charles, MO 16,190 9,650 13.4% 11.3% Madison, IL 14,818 9,036 12.3% 10.6% Jefferson, MO 12,067 6,287 10.0% 7.4% Franklin, MO 11,742 7,349 9.7% 8.6% St. Clair, IL 7,639 5,949 6.3% 7.0% City of St. Louis, MO 7,243 7,238 6.0% 8.5% Clinton, IL 4,922 2,279 4.1% 2.7% Monroe, IL 2,682 1,171 2.2% 1.4% Lincoln, MO 2,268 2,506 1.9% 2.9% Macoupin, IL 1,795 2,311 1.5% 2.7% Warren, MO 1,519 1,516 1.3% 1.8% Bond, IL 1,089 1,104 0.9% 1.3% Calhoun, IL 1,075 981 0.9% 1.2% Jersey, IL 1,025 911 0.8% 1.1% Area Total 120,921 85,156 100.0% 100.0%
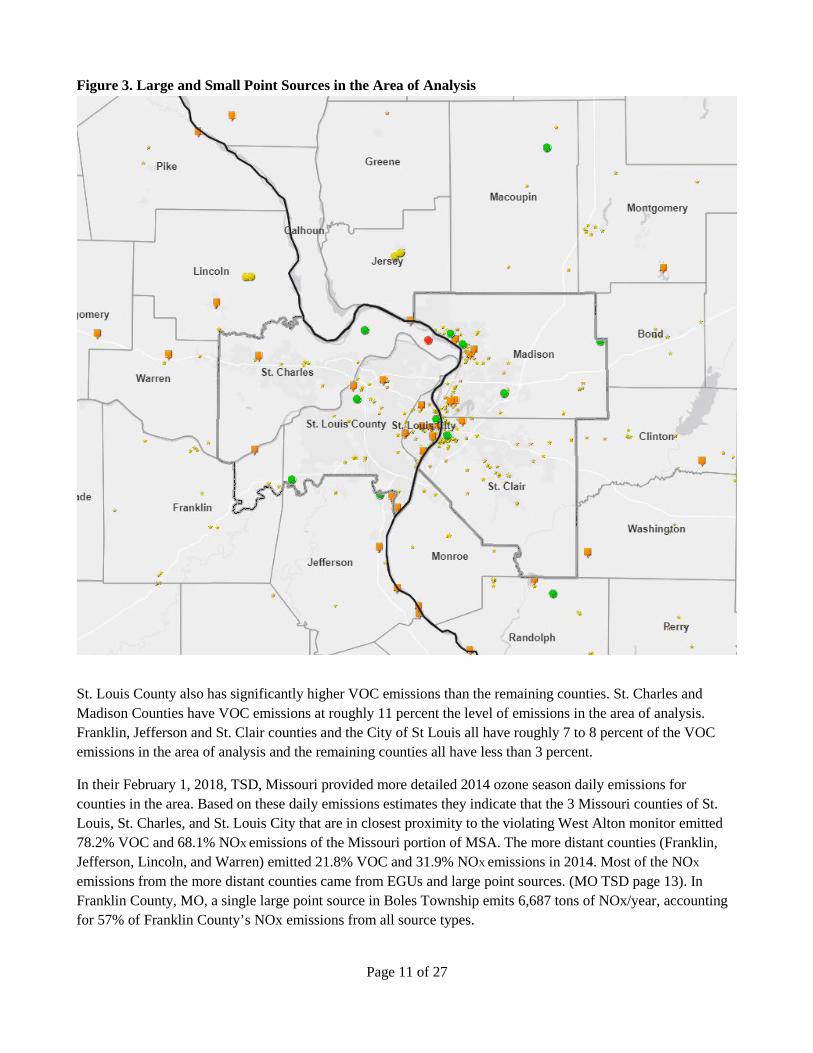
The locations of the large and small point sources are shown in Figure 3 below. The nonattainment boundary is also shown.
For NOx, St. Louis County has emissions that are more than twice as high as any of the other counties in the area of analysis. St. Charles and Madison counties have the next highest level of emissions – approximately 13 and 12 percent the level of emissions in the area of analysis. Jefferson and Franklin Counties each have approximately 10 percent the level of emissions of St. Louis County. The next highest NOx emissions are in St. Louis City and St Clair County at about 6 percent the level of emissions in the area. The NOx emissions in Clinton County are about 4 percent the level of emissions in the area of analysis and the remaining counties have NOx emissions that are less than 3 percent.
Page 11 of 27
Figure 3. Large and Small Point Sources in the Area of Analysis
St. Louis County also has significantly higher VOC emissions than the remaining counties. St. Charles and Madison Counties have VOC emissions at roughly 11 percent the level of emissions in the area of analysis. Franklin, Jefferson and St. Clair counties and the City of St Louis all have roughly 7 to 8 percent of the VOC emissions in the area of analysis and the remaining counties all have less than 3 percent.
In their February 1, 2018, TSD, Missouri provided more detailed 2014 ozone season daily emissions for counties in the area. Based on these daily emissions estimates they indicate that the 3 Missouri counties of St. Louis, St. Charles, and St. Louis City that are in closest proximity to the violating West Alton monitor emitted 78.2% VOC and 68.1% NOX emissions of the Missouri portion of MSA. The more distant counties (Franklin, Jefferson, Lincoln, and Warren) emitted 21.8% VOC and 31.9% NOX emissions in 2014. Most of the NOX
emissions from the more distant counties came from EGUs and large point sources. (MO TSD page 13). In Franklin County, MO, a single large point source in Boles Township emits 6,687 tons of NOx/year, accounting for 57% of Franklin County’s NOx emissions from all source types.
Page 12 of 27
Population density and degree of urbanization
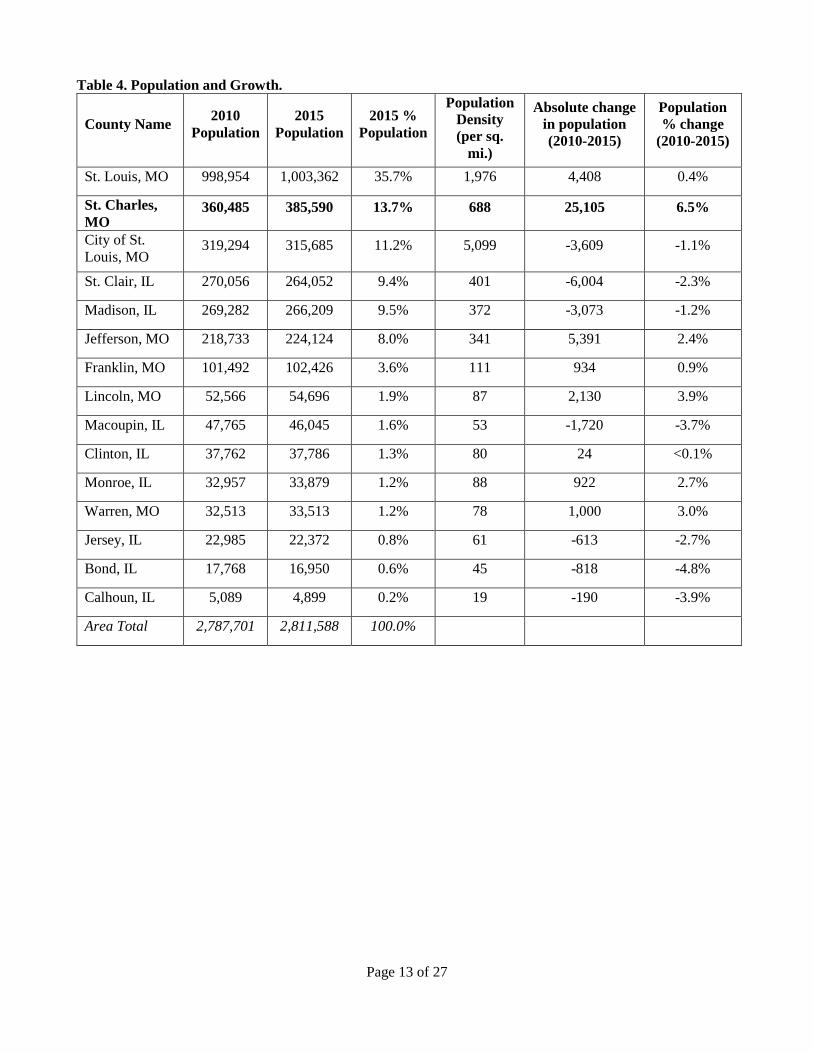
In this part of the factor analysis, the EPA evaluated the population and vehicle use characteristics and trends of the area as indicators of the probable location and magnitude of non-point source emissions. These include emissions of NOx and VOC from on-road and non-road vehicles and engines, consumer products, residential fuel combustion, and consumer services. Areas of dense population or commercial development are an indicator of area source and mobile source NOx and VOC emissions that may contribute to violations of the NAAQS. Table 4 shows the population, population density, and population growth information for each county in the area of analysis. Figure 4 exhibits the county-level population.
St. Louis County has more than 2.5 times the population as the next populous county and also is densely populated with a density of almost 2,000 per square mile. St. Charles County, MO is the next most populated, but is more rural in character with a density of 688. St. Louis City is the third most populous area but has the highest population density of almost 5,100. St. Clair and Madison Counties in Illinois and Jefferson County Missouri and have the next highest populations and population densities, each with populations between 200,000 and 300,000 and densities of 341 and 401. Franklin County Missouri has a population of just over 100,000 and a density of 111 with the remaining counties having populations less than 100,000 and densities less than 100. These characterizations of population concentration are supported by a more refined 2012 population density map provided on page 16 (Figure 5) and a 2014 urbanization map on page 17 (Figure 6) of the MO February 1, 2018 TSD. In their February 1, 2018, TSD, Missouri emphasizes that the 3 Missouri counties in closest proximity to the West Alton monitor (St. Louis County, St. Charles County and St Louis City) contain 80.5% of the population in the Missouri portion of the MSA. The more distant counties (Franklin, Jefferson, Lincoln and Warren) comprise 19.5% of the population in the Missouri portion of the MSA based on 2014 population data (MO TSD, page 13).
Page 13 of 27
Table 4. Population and Growth.
County Name 2010 Population
2015 Population
2015 % Population
Population Density (per sq.
mi.)
Absolute change in population (2010-2015)
Population % change
(2010-2015)
St. Louis, MO 998,954 1,003,362 35.7% 1,976 4,408 0.4%
St. Charles, MO
360,485 385,590 13.7% 688 25,105 6.5%
City of St. Louis, MO
319,294 315,685 11.2% 5,099 -3,609 -1.1%
St. Clair, IL 270,056 264,052 9.4% 401 -6,004 -2.3%
Madison, IL 269,282 266,209 9.5% 372 -3,073 -1.2%
Jefferson, MO 218,733 224,124 8.0% 341 5,391 2.4%
Franklin, MO 101,492 102,426 3.6% 111 934 0.9%
Lincoln, MO 52,566 54,696 1.9% 87 2,130 3.9%
Macoupin, IL 47,765 46,045 1.6% 53 -1,720 -3.7%
Clinton, IL 37,762 37,786 1.3% 80 24 <0.1%
Monroe, IL 32,957 33,879 1.2% 88 922 2.7%
Warren, MO 32,513 33,513 1.2% 78 1,000 3.0%
Jersey, IL 22,985 22,372 0.8% 61 -613 -2.7%
Bond, IL 17,768 16,950 0.6% 45 -818 -4.8%
Calhoun, IL 5,089 4,899 0.2% 19 -190 -3.9%
Area Total 2,787,701 2,811,588 100.0%

Page 14 of 27
Figure 4. County-Level Population
Traffic and Vehicle Miles Travelled (VMT)
The EPA evaluated the commuting patterns of residents, as well as the total VMT for each county in the area of analysis. In combination with the population/population density data and the location of main transportation arteries, this information helps identify the probable location of non-point source emissions. A county with high VMT and/or a high number of commuters is generally an integral part of an urban area and high VMT and/or high number of commuters indicates the presence of motor vehicle emissions that may contribute to violations of the NAAQS. Rapid population or VMT growth in a county on the urban perimeter may signify increasing integration with the core urban area, and thus could indicate that the associated area source and mobile source emissions may be appropriate to include in the nonattainment area. In addition to VMT, the EPA evaluated
Page 15 of 27
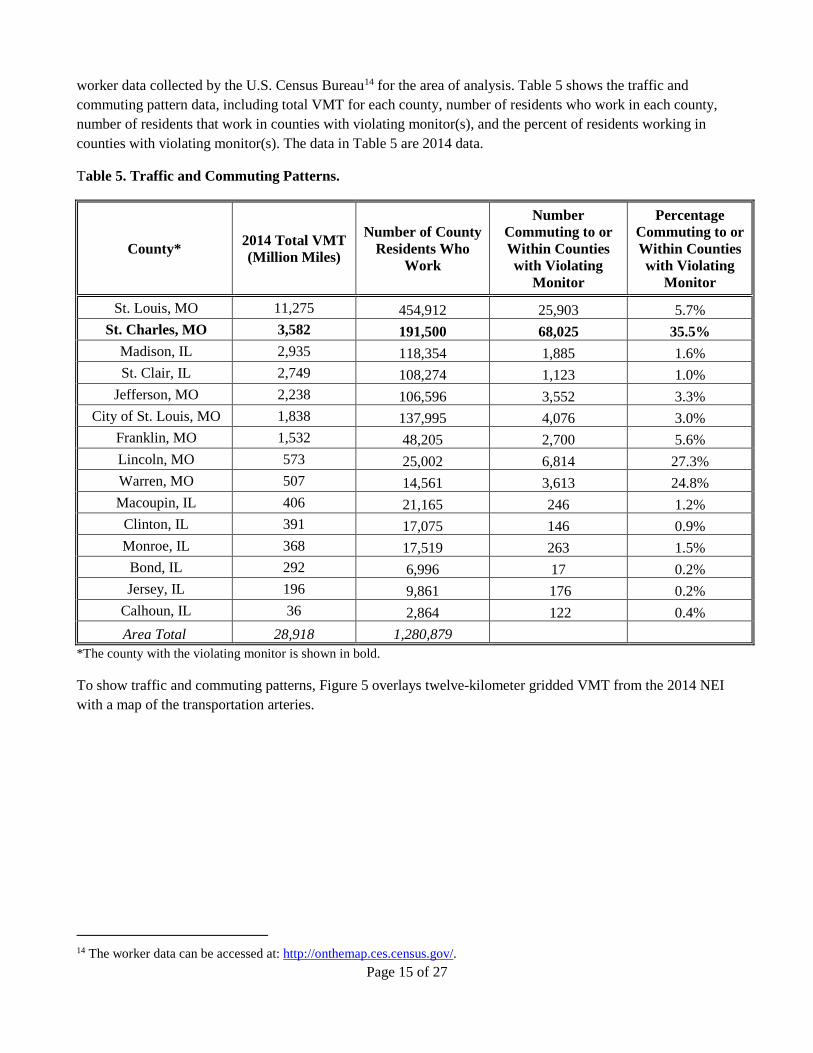
worker data collected by the U.S. Census Bureau14 for the area of analysis. Table 5 shows the traffic and commuting pattern data, including total VMT for each county, number of residents who work in each county, number of residents that work in counties with violating monitor(s), and the percent of residents working in counties with violating monitor(s). The data in Table 5 are 2014 data.
Table 5. Traffic and Commuting Patterns.
County* 2014 Total VMT (Million Miles)
Number of County Residents Who
Work
Number Commuting to or Within Counties with Violating
Monitor
Percentage Commuting to or Within Counties with Violating
Monitor
St. Louis, MO 11,275 454,912 25,903 5.7% St. Charles, MO 3,582 191,500 68,025 35.5%
Madison, IL 2,935 118,354 1,885 1.6% St. Clair, IL 2,749 108,274 1,123 1.0%
Jefferson, MO 2,238 106,596 3,552 3.3% City of St. Louis, MO 1,838 137,995 4,076 3.0%
Franklin, MO 1,532 48,205 2,700 5.6% Lincoln, MO 573 25,002 6,814 27.3% Warren, MO 507 14,561 3,613 24.8% Macoupin, IL 406 21,165 246 1.2%
Clinton, IL 391 17,075 146 0.9% Monroe, IL 368 17,519 263 1.5%
Bond, IL 292 6,996 17 0.2% Jersey, IL 196 9,861 176 0.2%
Calhoun, IL 36 2,864 122 0.4% Area Total 28,918 1,280,879
*The county with the violating monitor is shown in bold.
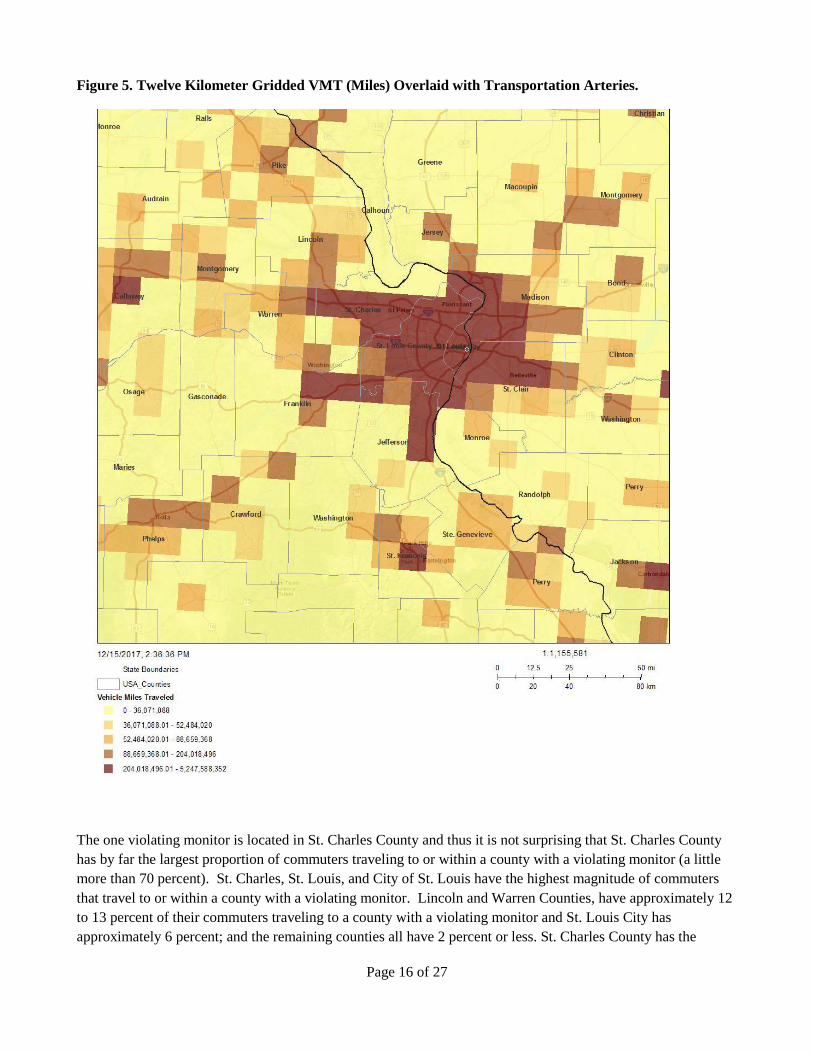
To show traffic and commuting patterns, Figure 5 overlays twelve-kilometer gridded VMT from the 2014 NEI with a map of the transportation arteries.
14 The worker data can be accessed at: http://onthemap.ces.census.gov/.
Page 16 of 27
Figure 5. Twelve Kilometer Gridded VMT (Miles) Overlaid with Transportation Arteries.
The one violating monitor is located in St. Charles County and thus it is not surprising that St. Charles County has by far the largest proportion of commuters traveling to or within a county with a violating monitor (a little more than 70 percent). St. Charles, St. Louis, and City of St. Louis have the highest magnitude of commuters that travel to or within a county with a violating monitor. Lincoln and Warren Counties, have approximately 12 to 13 percent of their commuters traveling to a county with a violating monitor and St. Louis City has approximately 6 percent; and the remaining counties all have 2 percent or less. St. Charles County has the

Page 17 of 27
second largest VMT and the largest number of residents that travel to or within a county with a violating monitor for work with over 3.5 million vehicle miles traveled and over 92,000 residents commuting to or within counties with a violating monitor. St. Louis County has the highest VMT with over 11 million vehicle miles traveled and over 71,000 commuting to or within counties with a violating monitor, which is approximately 13 percent of total commuters in the county. Madison County has the third highest VMT in the area of analysis with nearly 3 million vehicles miles traveled but only 1,000 residents who commute to or within counties with a violating monitor, which translates to approximately less than 1 percent of the commuters in the county. In addition, Franklin, Jefferson in Missouri, and St. Clair in Illinois have more than 1.5 million vehicle miles traveled and the remaining counties have 600 thousand or less vehicle miles traveled. The counties outside the existing 2008 NAAQS nonattainment area have relatively low VMTs as compared to the rest of the area of analysis.
In their February 1, 2018, TSD Missouri emphasizes that only 3 of the counties in the Missouri portion of the CBSA (St. Louis, St. Charles, and St. Louis City) accounted for 77.0% of the VMT and 90.5% of the employment in that portion of the CBSA, while the remaining Missouri counties comprise much smaller individual fractions of VMT and employment (MO TSD pages 13-14).
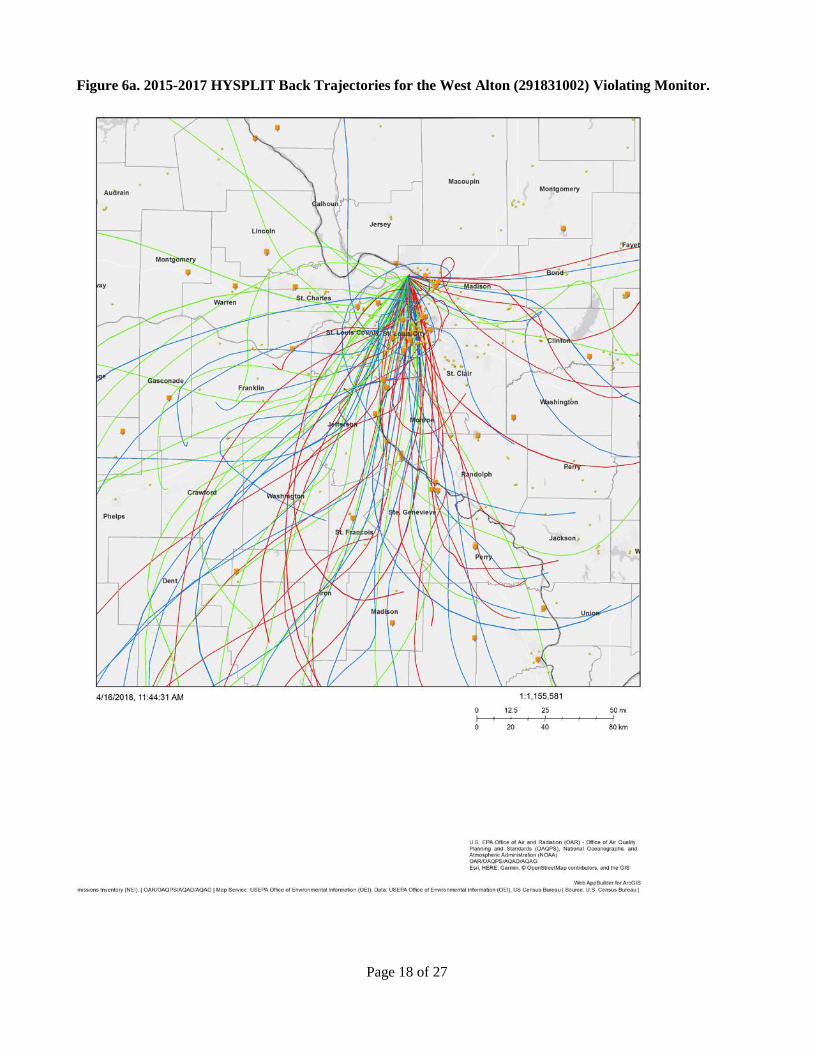
Factor 3: Meteorology Evaluation of meteorological data helps to assess the fate and transport of emissions contributing to ozone concentrations and to identify areas potentially contributing to the monitored violations. Results of meteorological data analysis may inform the determination of nonattainment area boundaries. In order to determine how meteorological conditions, including, but not limited to, weather, transport patterns, and stagnation conditions, could affect the fate and transport of ozone and precursor emissions from sources in the area, The EPA evaluated 2015-2017 HYSPLIT (HYbrid Single-Particle Lagrangian Integrated Trajectory) trajectories at 100, 500, and 1000 meters above ground level (AGL) that illustrate the three-dimensional paths traveled by air parcels to a violating monitor. Figure 6a-6d show the 24-hour HYSPLIT back trajectories for exceedance days (i.e., daily maximum 8- hour values that exceed the 2015 ozone NAAQS) for the only violating monitor (West Alton) in the area of analysis.
Page 18 of 27
Figure 6a. 2015-2017 HYSPLIT Back Trajectories for the West Alton (291831002) Violating Monitor.
Page 19 of 27
Figure 6b (MO TSD P. 69)
Page 20 of 27
Figure 6c (MO TSD P. 73)
Page 21 of 27
Figure 6c (MO TSD P. 75)
Page 22 of 27
The HYSPLIT back trajectories in Figure 6a show all days exceeding the 2015 ozone NAAQS at the West Alton monitor in 2015 – 2017. Trajectories to the West Alton violating monitor are predominately from the south, with much less frequency from the east and west. The most highly urbanized area of the St. Louis metro area, which also contains the highest density of VOC and NOx point sources, is directly south of the West Alton monitor. On exceedance days, the back trajectories show air masses travel over both large and small point sources (see Factor 2 and Figure 3 above) within St. Louis County, St. Charles County and the City of St. Louis in Missouri and Madison and St. Clair Counties in Illinois (see Factor 2 and Figure 3 above, and similar Figures 7 and 8 in the MO TSD pages 19-20). These counties also contain a majority of the mobile vehicle emissions as these counties have the largest VMT; these counties also have the highest populations and the highest number of commuters as noted in Table 5.
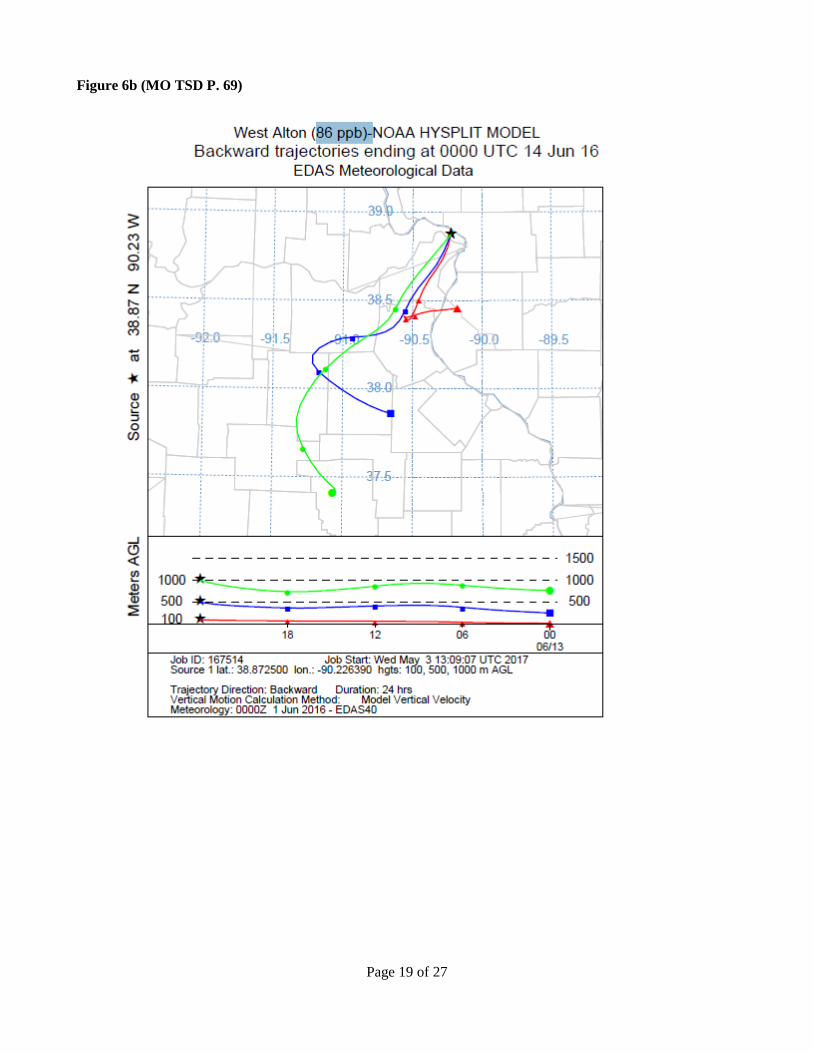
Missouri provided additional analysis of HYSPLIT trajectories in their February 2018 TSD. Their analysis focused on three specific high-ozone days at the West Alton monitor during the 2015 through 2017 ozone seasons that illustrate the meteorological parameters that are conducive to high ozone concentration formation (Figures 9, 10, and 11 MO TSD). The three days with their corresponding concentrations, as shown in Table 8 of the MO TSD, are June 13, 2016 (86 ppb), September 23, 2016 (78 ppb), and June 2, 2017 (78 ppb). These figures depict conditions observed at the end of the peak 8-hour ozone concentrations. There is a surface high pressure area east or south of St. Louis on each of these days, and low pressure to the northwest. The spacing of isobars of equal pressure, indicated by solid red lines, is large. Missouri observes this indicates that pressure differences are small and winds are light, and that the combination of light southerly flow from the St. Louis MSA toward the West Alton monitor is a typical meteorological setup for high ozone concentrations, along with sunny skies that typically accompany high pressure. The day-specific HYSPLIT trajectories for all 17 exceedance days (>70 ppb) for 2015-2017 are shown in the MO TSD on pages 62-78, with the three high ozone days emphasized by MO shown on page 69 (June 13, 2016 event), pages 73 (September 23, 2016 event), and page 75 (June 2, 2017 event). The HYSPLIT trajectories for these three days are shown above as Figures 6b-6d. For these days, the Missouri TSD provides: “As shown in the plots, the 100-meter back trajectory path for dates with concentrations of 78 ppb and above is short indicating that the highest concentration readings at these monitors are mostly as a result of stagnant air in the area. Figure 11 also shows that St. Louis MSA experienced a “Stationary Front.” As a result, on June 2, 2017, West Alton, Orchard Farm and Maryland Heights monitors had concentrations of 78 ppb, 89 ppb, and 83 ppb, respectively. Only St. Louis City, St. Louis County, Madison County (IL) and St. Clair County (IL) appear to be in the path of the 100-meter back trajectory on these dates. In addition, all of the high concentration readings (> 74 ppb) at these monitors seem to occur when the back trajectory paths go through these areas. This indicates that ozone formation in these areas is mostly attributable to NOX and VOC emissions from point sources and onroad mobile sources. The other counties in the back trajectory paths will have little effect on ozone formation because they are a greater distance from the violating monitor and contribute few emissions.” While distance alone is not determinative of the impact of ozone precursor emissions in high ozone episodes, conditions with more stagnant air masses, such as these three highest days shown in Figures 6b-d, are indicative of greater potential impact from sources in the more immediate vicinity of the monitor recording the high values relative to more distance sources.

Page 23 of 27
In addition to the points that Missouri emphasizes in their February 2018 TSD, EPA notes that the other 14 days in 2015-2017 with ozone above the level of the NAAQS should also be assessed and given appropriate weight. EPA observed that the trajectories to the West Alton monitor on 5 of the 17 high-ozone days exhibit a west-south-westerly wind component (see HYSPLIT trajectories in MO TSD pages 64, 65, 67, 69, and 73). As shown in Figure 6a (above) and in the MO TSD, back trajectories from this direction pass through Franklin County, Missouri. This is most notable on one of the three days (9/23/16 page 73) Missouri highlights in their analysis. As indicated in the emissions factor section above, a large NOx point source in Boles Township with typical emissions of greater than 6,000 tons per year (about half of the total NOx emissions in the county) is located in the trajectory path. This source is approximately 20 km from the violating monitor.
Factor 4: Geography/topography
Consideration of geography or topography can provide additional information relevant to defining nonattainment area boundaries. Analyses should examine the physical features of the land that might define the air shed. Mountains or other physical features may influence the fate and transport of emissions as well as the formation and distribution of ozone concentrations. The absence of any such geographic or topographic features may also be a relevant consideration in selecting boundaries for a given area.
The EPA used geography/topography analysis to evaluate the physical features of the land that might affect the air shed and, therefore, the distribution of ozone over the area.
The St. Louis, MO-IL area does not have geographical or topographical features significantly limiting air pollution transport within its air shed. St. Louis is located at the confluence of the Missouri and Mississippi rivers, and they are the most significant topographic feature of the area. These shallow river valleys do not cause the trapping of pollutants and do not cause the long-term buildup of pollutants seen in more extreme topographically influenced areas of the country. Therefore, this factor did not play a pivotal role in this analysis.
Page 24 of 27
Figure 7. Topographic Illustration of the Physical Features
Factor 5: Jurisdictional boundaries
Once the geographic extent of the violating area and the nearby area contributing to violations is determined, the EPA considered existing jurisdictional boundaries for the purposes of providing a clearly defined legal boundary to carry out the air quality planning and enforcement functions for nonattainment areas. In defining the boundaries of the St. Louis, MO-IL nonattainment area, the EPA considered existing jurisdictional boundaries, which can provide easily identifiable and recognized boundaries for purposes of implementing the NAAQS. Examples of jurisdictional boundaries include, but are not limited to: counties, air districts, areas of Indian country, metropolitan planning organizations, and existing nonattainment areas. If an existing jurisdictional boundary is used to help define the nonattainment area, it must encompass all of the area that has been identified
Page 25 of 27
as meeting the nonattainment definition. Where existing jurisdictional boundaries are not adequate or appropriate to describe the nonattainment area, the EPA considered other clearly defined and permanent landmarks or geographic coordinates for purposes of identifying the boundaries of the intended designated areas. The St. Louis, MO-IL area has previously established nonattainment boundaries associated with the 1997 and 2008 ozone NAAQS. For the 1997 NAAQSs, this boundary included the City of St. Louis and the counties of Franklin, Jefferson, St. Charles, and St. Louis in Missouri, and Jersey, Madison, Monroe, and St. Clair in Illinois. For the 2008 NAAQS, Missouri recommended and the EPA finalized designations for the same boundary for its portion of the area. For the 2008 NAAQS, Illinois recommended the same boundary for its portion of the area with the exception of Jersey County, and EPA finalized nonattainment designations for those three counties. For the 2015 NAAQS, Missouri has recommended a nonattainment boundary that includes fewer counties than in prior designations, citing fewer violating monitors than in prior years as indicative of ever-improving ozone air quality in the area. In addition, the East-West Gateway Council of Governments is the designated MPO for the area including the City of St. Louis and the counties of Franklin, Jefferson, St. Charles, and St. Louis in Missouri, and Madison, Monroe, and St. Clair counties in Illinois.
Conclusion for the St. Louis, MO-IL Area The EPA is not modifying the State of Missouri’s recommendation to include the following counties in the St. Louis, MO-IL nonattainment area because they are either violating the 2015 ozone NAAQS or contributing to a violation in a nearby area: St. Charles County, City of St. Louis, and St. Louis County. The EPA is modifying the State of Missouri’s recommendation for Franklin County by including Boles Township in Franklin County as part of the St. Louis, MO-IL nonattainment area because this area is contributing to a violation in a nearby area. In addition, the EPA is not modifying the State of Illinois’s recommendation to include the following areas as part of the St. Louis, MO-IL nonattainment area because they are contributing to a violation in a nearby area: Madison County and St. Clair County in Illinois. EPA’s designation of Monroe County, Illinois as attainment/unclassifiable is consistent with Illinois’ communication to EPA in an April 26, 2018 letter. All other portions of the St. Louis CBSA are designated attainment/unclassifiable. Based on 2015-2017 design values, one monitor in St. Charles County, Missouri is in violation of the 2015 ozone NAAQS, and St. Charles County is included in the final St. Louis, MO-IL nonattainment area. No monitors in Illinois currently violate the 2015 ozone NAAQS. Emissions and emissions-related data and meteorological data support the inclusion of named counties in the final nonattainment area. St. Louis County, MO ranks first in NOx and first in VOC emissions, first in population, first in VMT, and second in the percentage of commuters traveling to the county with the violating monitor (St. Charles, MO). St. Charles County, MO ranks second in NOx and second in VOC emissions, second in population, second in VMT, and first in the percentage of commuters traveling to or within the county with the violating monitor. Madison County, IL ranks third in NOx and VOC emissions, third in population, third in VMT, and seventh in the percentage of commuters traveling to the county with the violating monitor. St. Charles and St. Louis Counties in MO and Madison County in IL were also included as part of the nonattainment area for the 1997 and 2008 ozone NAAQS and they are all part of the MPO. Therefore, these counties are included in the nonattainment area.

Page 26 of 27
The City of St. Louis has the third largest population and the highest population density, and ranks in the top seven for NOx and VOC emissions when compared to the rest of the area of analysis. St. Clair ranks fourth in VMT and sixth in both NOx and VOC emissions and population in the area of analysis. EPA is designating Boles Township in Franklin County, MO as nonattainment. As shown in Figure 6a, some exceedance day back trajectories from this direction pass through Franklin County. A large NOx point source with typical emissions of greater than 6,000 tons per year is located in Boles Township. This source accounts for more than half of the NOx emissions within the county. Franklin County as a whole is less urban than other areas included in the nonattainment area. Emissions from sources outside Boles Township are relatively low, with levels less than the more densely populated City of St. Louis and five other counties in the area of analysis. For the remaining counties in the area of analysis, our analysis of the totality of the factors presented in the preceding sections for each county do not support a decision to modify the State’s recommendation and include them as part of the nonattainment area. Warren County, Missouri is located to the west-northwest of the metropolitan area. Warren County ranks 12th in NOx emissions and 11th in VOC emissions, 12th in population, 9th in VMT. Lincoln County, MO has a monitor that attains the 2015 ozone NAAQS, and ranks 10th in NOx, 8th in VOC, 8th in population, and 8th in VMT Moreover, these counties rank among the lowest for the emission factors. By county, the emissions rankings for NOx and VOC are as follows: Bond (13th/13th); Clinton (8th/10th); Jersey (15th/15th); Macoupin (11th/9th); and Monroe (9th/12th). In addition, all of these counties, with the exception of Monroe were not part of the nonattainment area for the 1997 or 2008 ozone NAAQS and are not part of the MPO. With regards to meteorology, Calhoun, Jersey and Macoupin Counties in IL are all located to the north and northeast and few back trajectories pass through each of these counties showing limited potential for contribution to the violating monitor. HYSPLIT trajectories show the potential for air masses to traverse Warren, Clinton, Monroe and Bond Counties. However, these same trajectories subsequently pass through counties with much higher emissions, VMT, and population, and less distant from the violating monitor. For example, a trajectory passing through Bond County, Illinois also passes downwind through Madison County, Illinois, which has nearly 10 times greater emissions and much higher VMT and population than Bond County, before reaching the violating monitor. Likewise, a trajectory passing through Warren County, Missouri subsequently passes downwind through higher-emitting St. Charles County, Missouri before reaching the violating monitor. Similarly, trajectories through Monroe County subsequently pass through much higher-emitting areas in St. Louis County and City, St. Clair County and Madison County. Lincoln county back trajectories show limited potential impact from Lincoln county. Missouri’s analysis of meteorology and HYSPLIT back trajectories on the highest ozone days at the West Alton monitor show relatively stagnant conditions indicative of the precursor emissions in the counties immediately south of the violating monitor heavily influencing monitored ozone levels at the monitor. Under these conditions counties more distant from the violating monitor, including Bond, Clinton, Jersey, Macoupin and Monroe Counties in Illinois, and western Franklin County in Missouri, are less likely to contribute to the violations.
Page 27 of 27
Although Jefferson County, Missouri ranks 6th in VOC emissions and 4th in NOx emissions, it is more rural than the other counties (ranks 6th in population and population density), and the most significant point sources in Jefferson County are in the southern half of the county, further away from the violating monitor and less likely to contribute during the stagnation conditions highlighted by Missouri on the 3 highest ozone days at the West Alton monitor. Based on the assessment of factors described above, EPA is designating the following Missouri areas as part of the St. Louis, MO-IL nonattainment for the 2015 ozone NAAQS: Boles Township in Franklin County, St. Charles County, City of St. Louis, and St. Louis County. In addition, the EPA is designating the following areas in Illinois as part of the St. Louis, MO-IL nonattainment for the 2015 ozone NAAQS: Madison County and St. Clair County. The EPA is designating the remaining Franklin County, excluding Boles Township, Jefferson, Lincoln and Warren Counties in Missouri and Bond, Calhoun, Clinton, Jersey, Macoupin and Monroe Counties in Illinois as attainment/unclassifiable for the 2015 ozone NAAQS.