spring 2015 jp dolphin final capstone project submission
TRANSCRIPT

Historic Review,
Comparative Analysis and
Future Recommendations For
Distributed Renewable Energy
Management Strategies
John-Peter Dolphin
Candidate, Harvard University Masters in Sustainability and
Environmental Management
Spring 2015

i
Abstract
Swanson’s Law has held true and the price of photovoltaic solar panels has dropped
precipitously. In fact, the technology has now reached a tipping point where installing rooftop
solar is within the reach of middle class Americans. The U.S. solar industry already employs
more individuals than the coal and natural gas industries combined, and the number of rooftop
installations in the US is expected to grow more than 600% over the next five years.
The rise of solar will catalyze a stark transition in the electric utility industry on par with
the switch from direct to alternating current. In mass, solar, and other distributed generating
systems, can cause considerable damage to existing electrical infrastructure, which is designed to
facilitate the historic centralized generation service model. In addition to this new bi-directional
flow of energy, distributed solar is extremely variable, with changes in on-site usage as well as
local weather conditions significantly affecting generation. As such and based on the accuracy of
current weather prediction algorithms, distributed generation systems are difficult to incorporate
into demand forecasts. In addition to infrastructure damage and over generation, solar is also
causing a cost shift to non-solar customers. Similar to deregulation and decoupling, this solar
cost shift will significantly impact the financial integrity of the electric utility industry.
This research paper reviews how three geographies, California, Hawaii and Germany, are
handling the growth of distributed solar. Infrastructure integrity as well as government policies
and financial incentives are reviewed. Load profile curves for each jurisdiction are compared,
with utility responses evaluated. Eight key recommendations are made, applicable to not only the
geographies reviewed, but also to any grid operator facing increasing distributed solar
penetration rates.

ii
Acknowledgements
My pursuit of a graduate degree, never mind the successful completion of this research paper,
would not be possible without the love and support of my wife, Rachel Silverman Dolphin. In
good times, and bad, she has been on my side, all while exceling in her own graduate work. I
also have to thank my parents and in-laws for their unbridled emotional and mental support.
Professor George Buckley and Teaching Assistant Sarah Driscoll provided the entire Spring
2015 Capstone cohort with an excellent framework for success and enough positive feedback to
fill the Giant Ocean Tank of the New England Aquarium.
Thank you to all of the professors and administrators, past and present, who helped shape the
Sustainability and Environmental Management program into the cornucopia of opportunity and
new beginnings that it is today.

iii
Table of Contents
Abstract ............................................................................................................................................ i
Acknowledgements ......................................................................................................................... ii
List of Figures ................................................................................................................................ iii
List of Tables ................................................................................................................................. iv
Definition of Terms......................................................................................................................... v
Introduction ..................................................................................................................................... 1
Note on Prior Knowledge Requirements .................................................................................... 2
Background ..................................................................................................................................... 2
The Industrial Revolution Sparks Demand for Electricity ......................................................... 3
The Battle of the Currents ........................................................................................................... 5
Centralized Power with Monopoly Service Territories .............................................................. 7
RTOs and OPEC ......................................................................................................................... 9
Deregulation, Enron, and Decoupling ...................................................................................... 14
Critical Mass and Impacting the Electricity Grid ..................................................................... 21
Methodology ................................................................................................................................. 27
Cases ............................................................................................................................................. 28
California .................................................................................................................................. 29
Hawaii ....................................................................................................................................... 36
Germany .................................................................................................................................... 40
Discussion & Recommendations .................................................................................................. 48
Discussion ................................................................................................................................. 49
Strengths and Weaknesses of the German Electricity Industry ............................................. 50
Energy Storage ...................................................................................................................... 53
A Threatened Business Model ............................................................................................... 57
Forecasting............................................................................................................................. 58
Recommendations ..................................................................................................................... 60
Conclusion ............................................................................................................................. 66
References ..................................................................................................................................... 68

iv
List of Figures
Figure 1 – Competition Abounds In The Early DC Market . ......................................................... 4
Figure 2 – Simplified Diagram Of Electricity Flow, From Generation To Use ............................. 8
Figure 3 – The Ratio Between Elrctricity Demand And Generation Capacity ............................. 12
Figure 4 – Historic Price Of Electricity ........................................................................................ 13
Figure 5 – Wholesale Price Of Electricity In California During Deregulation ............................ 19
Figure 6 – Installed Solar Cost per Watt ...................................................................................... 23
Figure 7 – Levelized Cost of Energy, variety of generating sources ........................................... 25
Figure 8 – Recent and Expect Residential Solar Growth ............................................................ 26
Figure 9 – Organization of NERC Interconnections.................................................................... 30
Figure 10 – California Genration Mix .......................................................................................... 31
Figure 11 – CSI Installed Capacity ............................................................................................... 32
Figure 12 – California's Duck Curve (Cal ISO 2013). ................................................................. 34
Figure 13 – Hawaii Genration Mix ............................................................................................... 37
Figure 14 – Hawaii's Nessie Curve ............................................................................................... 38
Figure 15 – Growth of Renewables in Germany .......................................................................... 42
Figure 16 – Solar Irradiation Rates, United States v. Germany .................................................... 43
Figure 17 – Germany's Extended Nessie Curve ........................................................................... 44
Figure 18 – Map of US Renewable Portfolio Standards............................................................... 51
Figure 19 – Worldwide Energy Storage Installtions .................................................................... 54
Figure 20 – Solar Cost Shift Positive Feedback Loop .................................................................. 58
Figure 21 – R&D by Investor Owned Utilities ............................................................................. 61
Figure 22 – Rooftop Solar Cost Comparision US v. Germany .................................................... 62
List of Tables
Table 1 – Basic Case Study Jurisdiction Comparables ................................................................ 28
v
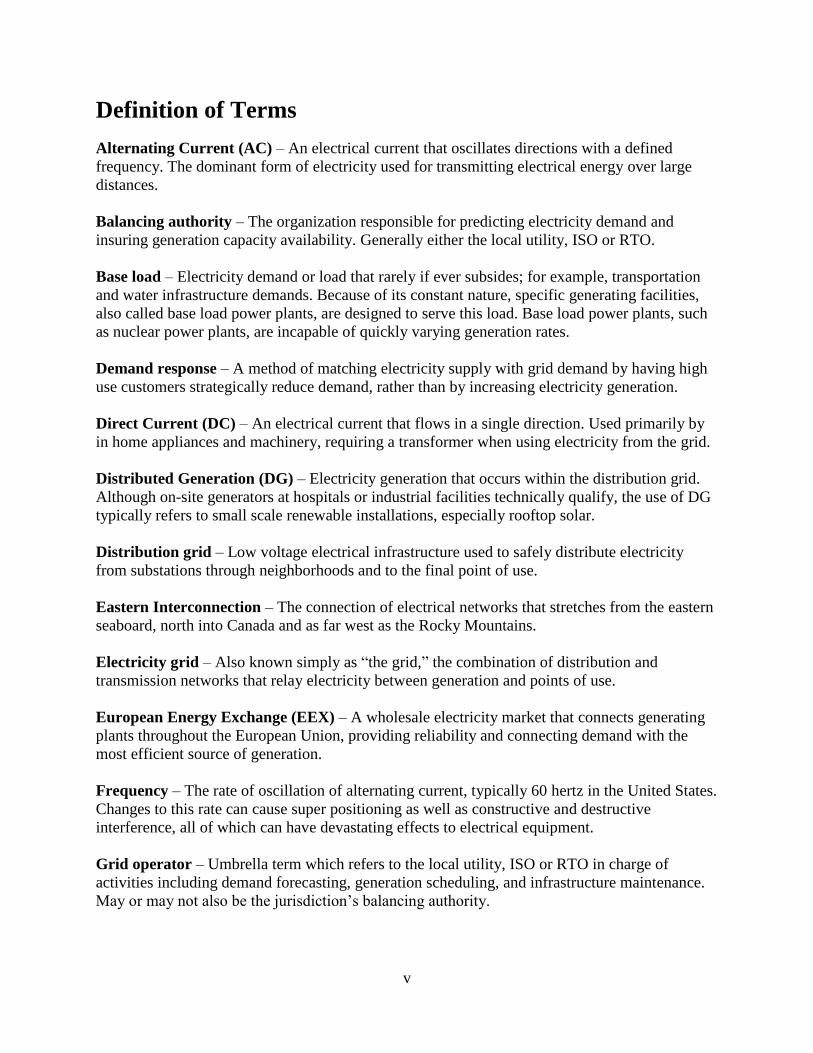
Definition of Terms
Alternating Current (AC) – An electrical current that oscillates directions with a defined
frequency. The dominant form of electricity used for transmitting electrical energy over large
distances.
Balancing authority – The organization responsible for predicting electricity demand and
insuring generation capacity availability. Generally either the local utility, ISO or RTO.
Base load – Electricity demand or load that rarely if ever subsides; for example, transportation
and water infrastructure demands. Because of its constant nature, specific generating facilities,
also called base load power plants, are designed to serve this load. Base load power plants, such
as nuclear power plants, are incapable of quickly varying generation rates.
Demand response – A method of matching electricity supply with grid demand by having high
use customers strategically reduce demand, rather than by increasing electricity generation.
Direct Current (DC) – An electrical current that flows in a single direction. Used primarily by
in home appliances and machinery, requiring a transformer when using electricity from the grid.
Distributed Generation (DG) – Electricity generation that occurs within the distribution grid.
Although on-site generators at hospitals or industrial facilities technically qualify, the use of DG
typically refers to small scale renewable installations, especially rooftop solar.
Distribution grid – Low voltage electrical infrastructure used to safely distribute electricity
from substations through neighborhoods and to the final point of use.
Eastern Interconnection – The connection of electrical networks that stretches from the eastern
seaboard, north into Canada and as far west as the Rocky Mountains.
Electricity grid – Also known simply as “the grid,” the combination of distribution and
transmission networks that relay electricity between generation and points of use.
European Energy Exchange (EEX) – A wholesale electricity market that connects generating
plants throughout the European Union, providing reliability and connecting demand with the
most efficient source of generation.
Frequency – The rate of oscillation of alternating current, typically 60 hertz in the United States.
Changes to this rate can cause super positioning as well as constructive and destructive
interference, all of which can have devastating effects to electrical equipment.
Grid operator – Umbrella term which refers to the local utility, ISO or RTO in charge of
activities including demand forecasting, generation scheduling, and infrastructure maintenance.
May or may not also be the jurisdiction’s balancing authority.

vi
Independent System Operator (ISO) – A third party organization typically established by a
state government to oversee the jurisdiction’s wholesale electricity market. An ISO typically
owns no infrastructure and its revenue is separated from the amount of electricity sold.
Peak load – The highest electricity demand of either a day, season or year. Peak load often
coincides with extreme weather events. Specific power plants, known as peaker plants, typically
serve this load and are normally designed with minimal lead time requirements and increased
ramping flexibility. Peaker plants are generally not as economically efficient to operate and often
have some of the highest emission rates.
Point of use – Overarching term meant to signal the location of energy consumption by any
customer class including homes, businesses and industrial locations.
Ramp rate – How quickly a power plant can change its generation. Because of their very nature,
the incorporation of variable energy sources, such as solar and wind, can require ramping by
other generating facilities in order to meet consistent demand requirements.
Regional Transmission Organization (RTO) – Typically a self-organized group of
neighboring utilities who interconnect electricity networks in order to continue to meet customer
needs during times of increased demand or maintenance.
Photovoltaics solar (PV solar) – A type of solar panel, typically made of silicon, that generates
electricity through the transfer of electrons between metalloids, rather than through the use of
thermal energy.
Smart meter – Onsite equipment that measures electricity consumption at intervals as short as
every minute and relays such information to the grid’s operator via a wireless radio network.
Substation – A critical piece of the electricity grid that steps down high voltage electricity from
the transmission grid to voltages usable on the distribution grid.
Transmission grid – Network of high tension, high voltage electrical wires that transmits
electricity from large centralized power plants to substations, typically using AC.
Variable energy source - Electricity generating systems that depend on natural conditions,
rather than fuel, for power. As such, their generation varies when weather conditions change.
Watt (W) – Standard unit of measure for electricity. 1,000 watts is abbreviated as kW, a MW is
1 million watts and a GW is 1 billion watts. A single CFL lightbulb uses about 12 watts in an
hour or 12Wh, and the average U.S. home uses about 900 kWh of electricity per month. The
average centralized power plant has a generation capacity of between 1 – 1.5 MWhs.
Western Interconnection – The connection of electrical networks that stretches from Baja,
Mexico to British Columbia, Canada and east to the Rocky Mountains.
1
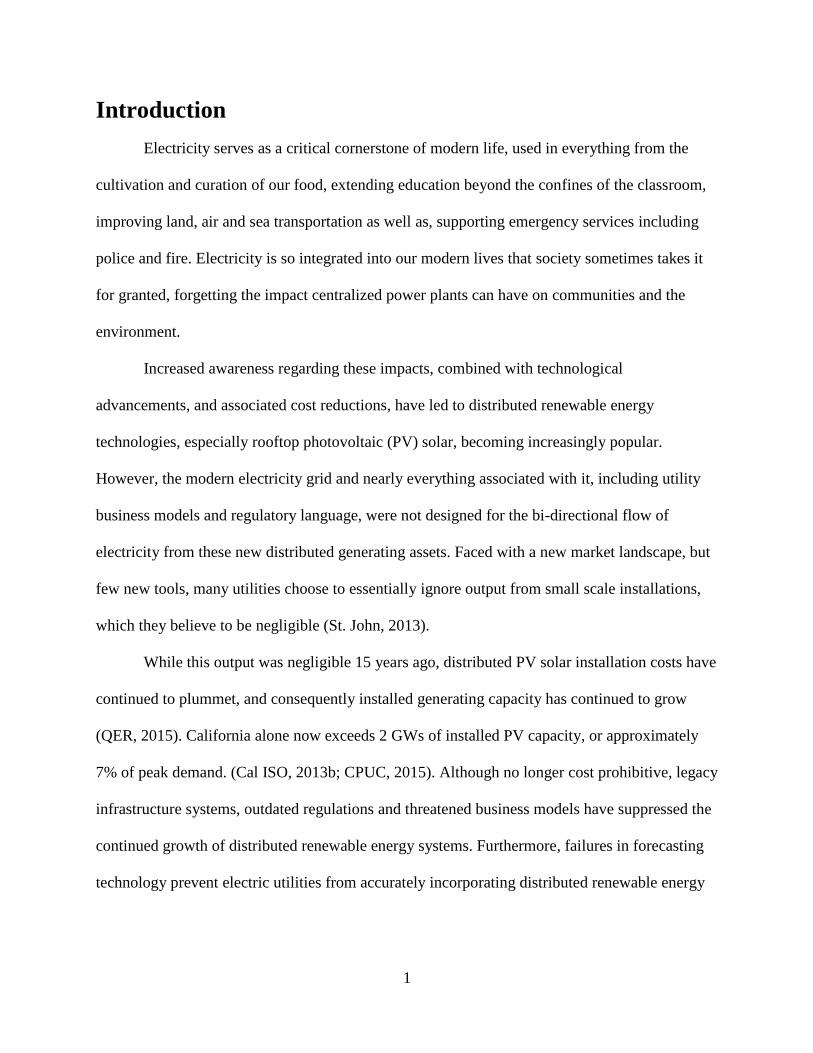
Introduction
Electricity serves as a critical cornerstone of modern life, used in everything from the
cultivation and curation of our food, extending education beyond the confines of the classroom,
improving land, air and sea transportation as well as, supporting emergency services including
police and fire. Electricity is so integrated into our modern lives that society sometimes takes it
for granted, forgetting the impact centralized power plants can have on communities and the
environment.
Increased awareness regarding these impacts, combined with technological
advancements, and associated cost reductions, have led to distributed renewable energy
technologies, especially rooftop photovoltaic (PV) solar, becoming increasingly popular.
However, the modern electricity grid and nearly everything associated with it, including utility
business models and regulatory language, were not designed for the bi-directional flow of
electricity from these new distributed generating assets. Faced with a new market landscape, but
few new tools, many utilities choose to essentially ignore output from small scale installations,
which they believe to be negligible (St. John, 2013).
While this output was negligible 15 years ago, distributed PV solar installation costs have
continued to plummet, and consequently installed generating capacity has continued to grow
(QER, 2015). California alone now exceeds 2 GWs of installed PV capacity, or approximately
7% of peak demand. (Cal ISO, 2013b; CPUC, 2015). Although no longer cost prohibitive, legacy
infrastructure systems, outdated regulations and threatened business models have suppressed the
continued growth of distributed renewable energy systems. Furthermore, failures in forecasting
technology prevent electric utilities from accurately incorporating distributed renewable energy

2
into generation plans. Because of this, utilities over-generate, essentially negating any positive
environmental or health benefits created by the distributed energy (MIT, 2011).
This report will assess the impacts that distributed generation (DG) has had on the
German electricity market, where nearly 70% of peak demand is met by solar power (Wirth,
2015). Based on third party and governmental reviews of this jurisdiction, the policies,
technologies and equipment used to successfully manage this level of distributed solar PV
penetration will be accessed against the infrastructure and regulatory environments of California
and Hawaii. These two locations are currently the largest markets for distributed PV solar in the
United States by capacity and penetration rate, respectively.
Note on Prior Knowledge Requirements
A technical understanding of electrical power systems and electricity generation, i.e.
voltage, frequency, reactive power, etc., are not required to understand the recommendations
made by this research paper. However, if a reader would like to learn more about these
fundamental topics, The Future of the Electric Grid provides an accessible, yet thorough,
overview of the topic (MIT, 2011). A historical account of the growth and transformation of the
electricity industry does, however, provide an important backdrop to the legacy systems,
operating standards and regulations of today. As such, the Background section of this report
includes a chronological overview of the foundation, growth, regulation and evolution of the
electricity industry.
Background
The saying “Thomas Edison would recognize today’s electricity grid” is widely used to
highlight the slow moving nature of the electricity industry (LaMonica, 2014). For several
reasons, including utility companies’ service territory monopolies which eliminate competition

3
and therefore innovation, the sentiment of the saying is true; the use of Edison, however, is
anachronistic. The electricity industry in general, and especially the electricity grid, has evolved
significantly since the early twentieth century. To begin, Edison’s direct current technology lost
to Nikola Tesla’s alternating current (EIA, 2000). Alternating current allows for centralized
power plants, leading to the radial array electricity grid of today (MIT, 2011). Rising costs, along
with increasing environmental awareness, have however led to a return to on-site direct current
generation, this time in the form of rooftop solar PV arrays (DOE, 2015). The penetration rate of
solar PV systems is now reaching a critical mass and beginning to negatively impact
infrastructure and reduce system wide efficiencies (MIT, 2011). This historical perspective is
critical to understanding why the modern electrical grid is designed and operated in the way it is
today.
The Industrial Revolution Sparks Demand for Electricity
While electricity as we know it has been experimented with since the mid-1700s, it was
not until the invention of the reciprocating steam engine during the Industrial Revolution that
electricity’s potential was realized (NAE, 2015). In addition to enabling railroad transportation,
the steam engine revolutionized manufacturing and allowed factories, previously dependent on
water wheels for mechanical power, to be located more strategically. These first closed circuit
systems were initially limited to facilities that could afford on-site generators, which required
significant fuel and labor. Electricity generation continued in this on-site manner until the first
commercial power plant, the Edison Electric Light Station, was built in 1882 (NAE, 2015). The
attraction of electric lights in storefront windows helped to expose the marvel of electricity to the
masses, and combined with safety campaigns lambasting the use of open flames, these and other
efforts led to increased demand for electricity in residential applications (ibid). This increased

4
demand led to an explosion of electricity and lighting companies. By 1907 there were forty-five
electricity companies operating in Chicago, with similar numbers in other major cities (Crews,
1998). An open market meant that while one resident received power from Company A, their
neighbor on the left might receive service from Company B, and their neighbor on the right from
Company C. Soon overhead electric lines crisscrossed even small cities, see Figure 1.
Although revolutionary, electricity service from the power company was both unreliable
and expensive. As a result many manufacturing facilities maintained their own on-site generation
capabilities, and those that didn’t often used batteries (EIA, 2000). Although they had minimal
capacity when compared to today’s devices, these batteries aimed to provide the same service
that modern day data centers and manufacturing centers require: a bridge power supply that helps
Figure 1 – Pratt, Kansas 1911. With no defined service territories and minimal regulations,
providing electricity to businesses and residents was a wide open market, even in small
town America (Cassingham, 2011).
5
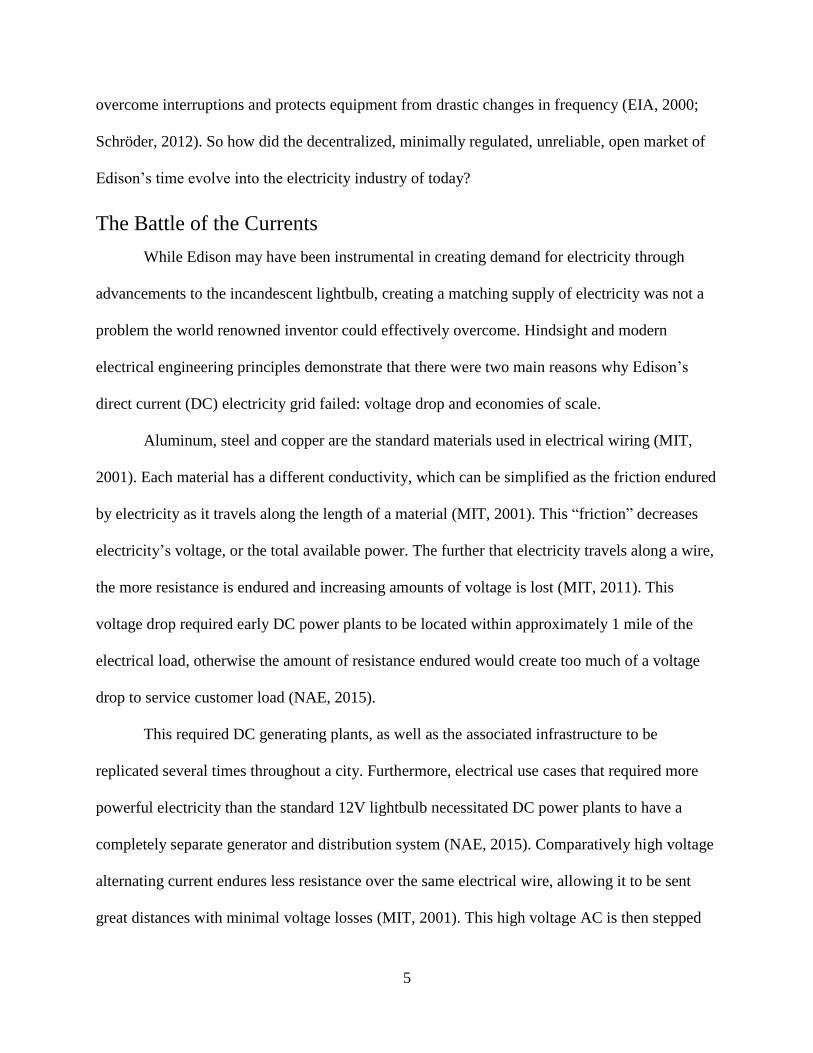
overcome interruptions and protects equipment from drastic changes in frequency (EIA, 2000;
Schröder, 2012). So how did the decentralized, minimally regulated, unreliable, open market of
Edison’s time evolve into the electricity industry of today?
The Battle of the Currents
While Edison may have been instrumental in creating demand for electricity through
advancements to the incandescent lightbulb, creating a matching supply of electricity was not a
problem the world renowned inventor could effectively overcome. Hindsight and modern
electrical engineering principles demonstrate that there were two main reasons why Edison’s
direct current (DC) electricity grid failed: voltage drop and economies of scale.
Aluminum, steel and copper are the standard materials used in electrical wiring (MIT,
2001). Each material has a different conductivity, which can be simplified as the friction endured
by electricity as it travels along the length of a material (MIT, 2001). This “friction” decreases
electricity’s voltage, or the total available power. The further that electricity travels along a wire,
the more resistance is endured and increasing amounts of voltage is lost (MIT, 2011). This
voltage drop required early DC power plants to be located within approximately 1 mile of the
electrical load, otherwise the amount of resistance endured would create too much of a voltage
drop to service customer load (NAE, 2015).
This required DC generating plants, as well as the associated infrastructure to be
replicated several times throughout a city. Furthermore, electrical use cases that required more
powerful electricity than the standard 12V lightbulb necessitated DC power plants to have a
completely separate generator and distribution system (NAE, 2015). Comparatively high voltage
alternating current endures less resistance over the same electrical wire, allowing it to be sent
great distances with minimal voltage losses (MIT, 2001). This high voltage AC is then stepped

6
down through a transformer to a voltage that is useful for the customer (MIT, 2001). This step
down process allows for large centralized plants, which benefit from economies of scale, to be
built in strategic locations some distance away from the end user. High voltage alternating
current can also be stepped down to different levels. This allows one generating facility to
provide power to both manufacturing and residential applications through the same distribution
grid.
Because of these benefits, AC was chosen to power the World’s Fair in Chicago and
shortly thereafter the Niagara Falls hydro-electric plant also chose to employ AC (EIA, 2000).
Edison, who had invested significantly in direct current, did not readily admit defeat; driven by
pride and the desire for profit, Edison conducted a media blitz which lambasted AC as dangerous
and orchestrated, among other things, the invention of the electric chair, which was built to use
alternating current (EIA, 2000). Economic realities of centralized power production overpowered
Edison’s efforts and AC became the standard in the US and around the world.
Over the course of just 50 years the proximity relationship between man and power, both
mechanical and electrical, came full circle. Pre-Industrial Revolution manufacturing centers were
located along rivers, in order to take advantage of the natural power of flowing water. Thanks to
the steam engine, DC electricity could be generated locally or onsite and factories were moved to
cities, which were more strategic locations given the proximity to labor and transportation
networks. Centralized AC power plants then moved electricity generation out of the city center
and back to the water, which is used to help cool the plants’ generators (Botkin & Keller, 2010).
As previously mentioned, this research paper will discuss how rooftop solar is now bringing
customer-located DC power generation back.

7
Centralized Power with Monopoly Service Territories
Economies of scale played a critical role in the War of the Currents and again in the
creation of utility service territories as they are known today. As shown in Figure 1, the urban
electricity market was flooded with competition in the late nineteenth and early twentieth
century. Direct current required generation to occur within just a few miles of consumption, and
as a result an entire electric company’s operations were often within the purview of a municipal
government. However, the Great Depression brought a steep decline in demand for electricity.
Many electric utilities declared bankruptcy, selling off both their customer bases and the metal in
their overhead power lines, in order to help pay off debts (EIA, 2000). As a result, the utilities
that survived often had operations that extended beyond municipal and sometimes state
boundaries, undermining the authority and bearing of local regulations. With local laws no
longer enough to control these large utilities, and a great sense of distrust in unregulated
industries due to the stock market crash, The Public Utilities Holding Company Act of 1935
granted the Securities and Exchange Commission regulatory authority over utilities (MIT, 2011).
As part of this regulation and despite the aversion to large corporations, it was widely
recognized that a geographically based natural monopoly was a more efficient use of
infrastructure. It was at this time that both natural gas pipeline companies and electric utilities
were granted exclusive service territories and exceptions from the Sherman Antitrust Act (MIT,
2011). As part of the negotiations leading up to this legislation, utility representatives agreed to
not resist or impede the efforts of the Bureau of Reclamations, the Tennessee Valley Authority
(TVA) and the Rural Electrification Administration (REA) (EIA, 2000). These government
agencies created large generation sites, including the Hoover, Cooley and Bonneville dams,
providing low cost electricity to rural and Western markets. Utility representatives, whose

8
businesses served mainly large East Coast municipalities, bartered away what they saw as
perpetually small, rural markets.
Government and commercial systems alike, utilized large centralized AC power plants.
These plants were both more efficient, i.e. more affordable for the consumer, and more reliable
than previous DC plants, eliminating the need for manufacturing facilities to continue to own and
operate onsite generating facilities or battery storage devices. Figure 2 provides a basic overview
of the infrastructure involved in transmitting high voltage AC power from a centralized plant to
end users. Moving from left to right, a centralized power plant generates high voltage AC
electricity, which in turn is sent over transmission lines. Because of this potentially dangerous
voltage level, transmission lines have clearly defined easements and are strung above the tree
line. Community lines are the prototypical electricity lines one might see on a residential street
and are often also referred to as distribution or overhead lines. Before electricity can be sent
along local community lines, a decrease in voltage must be made. This decrease is completed at a
local sub-station; substations can reduce the electric flow from upwards of 65kV all the way
down to the standard 120V utilized by modern day home appliances (EIA, 2000).
Figure 2 – Simplified diagram of electricity flow, from generation to use

9
Community lines can be arranged in either radial, grid or hybrid arrays. Radial arrays
reach outward like the branches of a tree. With only one connection to a central source of
electricity, outer service areas are vulnerable to an interruption in operation closer to the center;
true radial arrays are rare due to their vulnerability (EIA, 2000). Grid arrays traverse a given area
in a checkerboard type pattern; such systems minimize the number of customers impacted by any
one incident through extreme redundancy with a multitude of alternative routes available if any
interruption occurs (ibid). Hybrid arrays combine the two in what can be most accurately
described as a spider web type fashion. Hybrid arrays allow for an effective level of redundancy
without requiring extensive amounts of infrastructure (ibid). The presence of one array type or
another depends significantly on the geographic conditions and history of development.
RTOs and OPEC
Between the Great Depression and the end of the twentieth century, technological
advancements continued to improve the efficiency of centralized plants. However, this 70 year
period brought with it significant changes in how utilities operated and the demands of the
customers they served.
During World War II and for approximately the ten years after, electricity demand was
dominated by factories and manufacturing facilities. Demand was predictable and consistent, and
the limited number of large customers allowed for utilities to have direct relationships with their
most important clients. It was at this time that demand response relationships first developed;
scheduled maintenance, extreme weather or unexpected grid demands would occasionally
exceed a local utility’s generation capacity. Rather than force a brownout, or worse, rolling
blackouts on all customers, strapped local utilities would request that industrial facilities reduce

10
production or cut a shift short. In exchange, utilities offered these industrial customers reduced
rates, and lauded them for putting the needs of the community above their own.
While these mutually beneficial relationships between industrial customers and utilities
continue to this day, there were and will continue to be times when industrial users of electricity
prefer not to reduce demand. For example, ahead of an impending quarterly manufacturing
quota, or in the middle of a sensitive production run. While formal demand response contracts
exist today, locking industrial users into specific curtailments, historically such contracts were
not common-place and in many instances plant managers chose not to reduce electricity use
when requested (EIA, 2000). The combination of increased grid demand due to suburbanization
and increasingly stalwart industrial customers put local electric utilities in a difficult position.
Should the local utility build a power plant that would only be utilized to meet peak demand for a
few hours every year? Even if the answer is yes, constructing a power plant is a multi-year
process, what was a utility to do in the interim? In order to most efficiently meet peak demand
requirements, many local utilities began to connect their electrical grid with that of a neighboring
utility. “Because different utilities often had standardized on different transmission voltages,
mergers and interconnections between adjacent utilities often required—and often still require—
transformers to link lines with different voltages. These transformers produce losses” (MIT,
2011, p. 238). Despite these losses, the marginal cost of these connections is generally lower
than building a rarely used “peaker plant,” and consequently these types of connections between
otherwise vertically integrated utilities with service territory monopolies began to arise with
increased frequency during the 1950s. This happened to such an extent that by 1962, nearly the
entire Eastern Seaboard of the United States was connected.

11
Interconnection brought reliability, but it also brought the potential for domino effect
destruction. This was the case in 1965 when a transmission line’s safety relay was tripped and set
in motion a cascade of overwhelmed electricity grids. In addition to affecting power availability
in Ontario, which was the site of the original infrastructure failure, the resulting blackout covered
the vast majority of New York (including Manhattan), New Jersey, Connecticut, Rhode Island,
Vermont, New Hampshire and Maine; all in all, 30 million people were without power (NBC,
1965).
In response to the blackout, and with the hopes of preempting increased regulation, the
electric utility industry formed the North American Electric Reliability Council (NERC). The
council created voluntary operating standards and worked communally to address reliability and
capacity issues. Side Note: Following a similar overloading event in 2003, affecting 55 million
people across 9 states and provinces, the Federal Energy Regulatory Commission (FERC)
directed that all NERC standards, previously voluntary, were mandatory (MIT, 2011). Because
all systems are not the same, NERC moved to establish Regional Transmission Organizations
(RTOs). Where interconnected utilities previously primarily relied on one another during times
of excess demand, RTOs coordinate generation capacity, maintenance, and related issues on a
daily basis.
While RTOs helped to improve resiliency, they did little to reduce the cost of generation.
Incremental technological advancements were made during the time period, but they could not
compete with the rising costs of fuel leading up to and following the OPEC Oil Embargo. While
many associate the OPEC Embargo with gasoline rationing during the winter of 1973, the utility
industry was hit just as hard and perhaps for a longer period of time. In 1973, 30% of the total
energy (BTUs) consumed in the US was attributable to gasoline, almost entirely by the

12
transportation industry; however, 47% of total energy consumption was from oil and similarly
was almost entirely attributable to electricity generation (EIA, 1979). Limited domestic supplies,
either pumped dry or abandoned due to the previously cheap availability of Middle Eastern oil,
escalated the problem.
In addition to scarcity inflated fuel costs, utilities also faced a continually increasing
demand for electricity, as outlined by Figure 3.
. Compounding double digit increases in demand were experienced each year between
1950 and 1973 (EIA, 2015b). In the three years leading up to the Oil Embargo, electricity
demand increased by 30%, 49% and 46%, respectively (EIA, 2015b). Faced with rising demand
Figure 3 –The ratio between supply and demand has stayed very stable over the last 65 years, save for
three influential events (Derived from EIA, 2015b).

13
and limited supply from both domestic and foreign sources, electricity prices began to increase.
As shown in Figure 4 in the years following the OPEC Oil Embargo of 1973, electricity prices
rose by as much as 35% (MIT, 2011, p. 237). In order to help reign in rising costs, as well as
diversify the electricity industry in hopes of protecting it from future international market
manipulations, Congress passed a series of pieces of legislation beginning with the Public
Utilities Regulatory Policies Act (PURPA) (EIA, 2000). PURPA aimed to add market
coordinated cost minimizing functions to a regulated monopoly space and did so by requiring
local utilities to buy power from non-utility power generators at “avoided costs,” effectively
creating the wholesale market for electricity (MIT, 2011, p. 238). This required the creation of a
third party purchasing authority, a role filled by Independent System Operators (ISOs). Whereas
RTOs are self-organized industry association aimed at insuring adequate supply during periods
of maintenance and high demand, ISOs are independent third party organizations that operate
Figure 4 – During the time of Edison, electricity cost as much as $5 per kWh (MIT, 2011, p.
235). The transition to centralized plants and alternating current significantly reduced costs,
and following the recovery from the Great Depression electricity prices have dropped
significantly (MIT, 2011, p. 237).

14
above the utilities with the goal of insuring generation efficiency. While ISOs play an important
role in forecasting system wide demand as well as scheduling and dispatching generation assets,
they do not own any power plants or transmission infrastructure, nor do they operate at the
distribution level of the electricity grid. This lack of ownership helps to insure efficient operation
and shortly after initial implementation the PURPA created ISO structure was deemed a success.
The combination of behind the scenes competition with a consumer facing monopoly was lauded
“as the benchmark for market design – the textbook ideal that should be the target for policy
makers” (MIT, 2011, p. 239). Following its successful implementation in the United States
historic revision to electricity markets were made all across the globe, most notably in Chile and
the United Kingdom (ibid).
Deregulation, Enron, and Decoupling
As previously mentioned the original intent behind PURPA was to create wholesale
electricity markets. The underlying ideology behind the legislative change was that opening up
the utility markets to competition would help to drive down the price of electricity (Weare,
2003). This was certainly the thought process in California, where electricity rates were “on
average 50 percent higher than the rest of the U.S.” (PBS, 2001). Deregulation was a step beyond
the creation of ISOs; in theory a free market would aggressively identify waste without the need
for an overseeing body. Each jurisdiction implemented deregulation in its own manner; for
example, Pennsylvania created a wholesale market, but does not allow independent energy
traders, who did not directly own generating assets, to participate (MIT, 2001). Because of the
number of companies and individuals affected, the size of the financial ramifications, and the
impact on international policy, California’s deregulation process will be the focus of this section.

15
Determining the underlying cause of the California Energy Crisis is beyond the scope of
this research paper. This paper will, however, outline several of the coinciding factors that
affected and allowed for manipulation of the California electricity market. These factors become
increasingly important as distributed energy generation capacities continue their penetration
beyond first adopters and further into the general population.
With an ISO already in place, and electricity prices still unreasonably higher than the rest
of the country, California was one of the first states to pursue almost complete deregulation
(Weare, 2003). This “almost” is an important caveat as traditional utilities were not allowed to
change rates charged to residential customers, despite the fact that the utility would be facing
variable costs depending on market pricing, fuel costs, etc. A wholesale market requires
suppliers other than the pre-existing vertically integrated utilities. Because it takes several years
to build a power plant, the first step in deregulation in California was the forced sale of 40% of
California investor owner utilities’ (IOUs) generation capacity (Weare, 2003) . Under Assembly
Bill (AB) 1890 power plants were sold at auction, with minimal requirements relating to industry
knowledge or ability to effectively operate the generating facility (ibid). Several out of state
investment companies purchased power plants (ibid). One issue that would add another layer to
the Energy Crisis is that many of these purchasing companies owned and operated assets outside
of the state. Similar to the transition from municipal to state utilities, these new companies no
longer came under the exclusive jurisdiction of prior regulators, in this case the California
Public Utilities Commission as all previous state utilities had, instead they fell under the
jurisdiction of the Federal Energy Regulatory Commission (Weare, 2003). Another subtle, but
important, variable that contributed to the energy crisis was reduced new generating capacity
construction. As previously outlined by Figure 3, electricity generating capacity traditionally
16
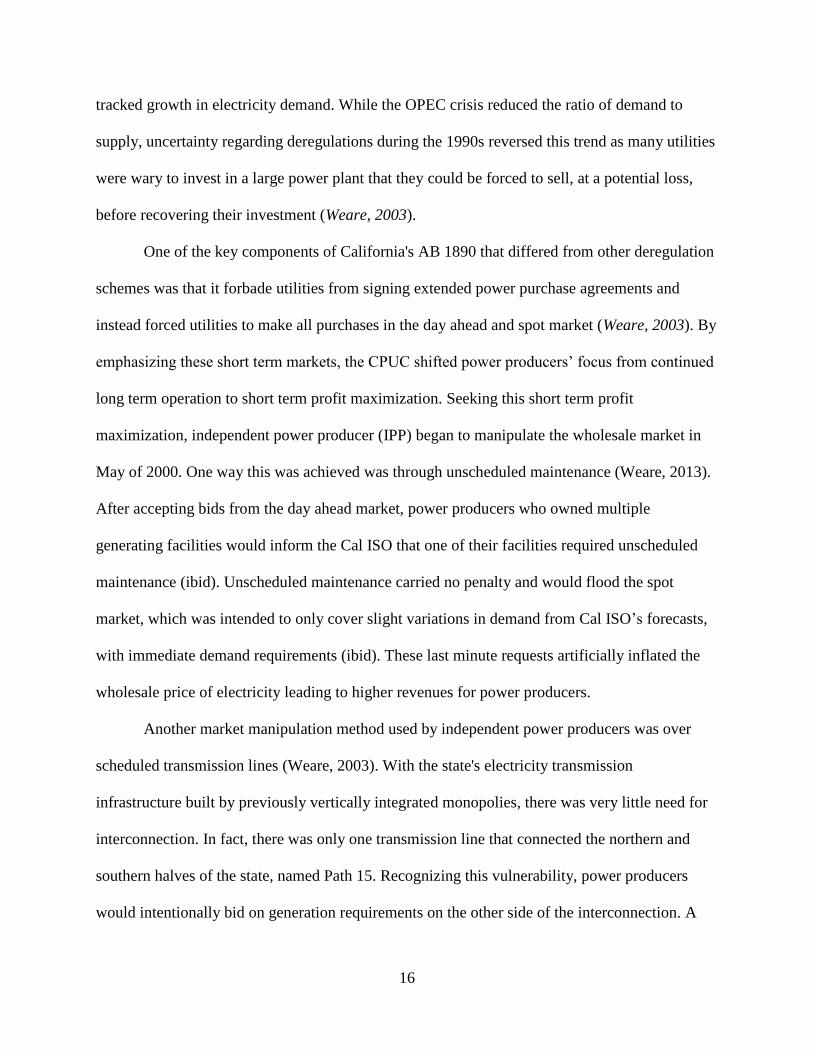
tracked growth in electricity demand. While the OPEC crisis reduced the ratio of demand to
supply, uncertainty regarding deregulations during the 1990s reversed this trend as many utilities
were wary to invest in a large power plant that they could be forced to sell, at a potential loss,
before recovering their investment (Weare, 2003).
One of the key components of California's AB 1890 that differed from other deregulation
schemes was that it forbade utilities from signing extended power purchase agreements and
instead forced utilities to make all purchases in the day ahead and spot market (Weare, 2003). By
emphasizing these short term markets, the CPUC shifted power producers’ focus from continued
long term operation to short term profit maximization. Seeking this short term profit
maximization, independent power producer (IPP) began to manipulate the wholesale market in
May of 2000. One way this was achieved was through unscheduled maintenance (Weare, 2013).
After accepting bids from the day ahead market, power producers who owned multiple
generating facilities would inform the Cal ISO that one of their facilities required unscheduled
maintenance (ibid). Unscheduled maintenance carried no penalty and would flood the spot
market, which was intended to only cover slight variations in demand from Cal ISO’s forecasts,
with immediate demand requirements (ibid). These last minute requests artificially inflated the
wholesale price of electricity leading to higher revenues for power producers.
Another market manipulation method used by independent power producers was over
scheduled transmission lines (Weare, 2003). With the state's electricity transmission
infrastructure built by previously vertically integrated monopolies, there was very little need for
interconnection. In fact, there was only one transmission line that connected the northern and
southern halves of the state, named Path 15. Recognizing this vulnerability, power producers
would intentionally bid on generation requirements on the other side of the interconnection. A
17
coordinated bidding process eventually led to the maximum capacity passing through the
transmission line; this allowed IPPs to tack on “congestion charges” on top of their day ahead
bid. This eliminated the availability of generating capacity from the other side of Path 15 to serve
spot market needs. As a result, the spot market was separated into two separate markets, allowing
independent power producers located on either side of Path 15 to charge even higher prices, and
leaving traditional utilities with no recourse (ibid).
AB 1890 included a tariff on electricity produced outside of California (Weare, 2003). In
theory, this allowed in-state power producers to charge comparatively lower prices, making their
electricity more attractive, with the intended purpose of encouraging in-state operation and job
creation (ibid). However, IPPs participated in electricity laundering schemes that would obscure
the original source of the electricity generated (ibid). Their goal was to make it seem that
electricity was actually coming from out of state, increasing the sales price. A simplified
explanation of the convoluted accounting schemes used does not do justice to the lengths IPPs
went to in order to scheme the wholesale market (Weare, 2003). In short, IPPs purchased,
bundled, resold, split, rebundled and then resold generation quotas dozens of times (ibid).
California’s deregulation process did not require separation between upstream and
downstream non-utility actors (Weare, 2003). As such, divisions of the same company were
allowed to purchase generation rights from one another, as discussed previously in regards to
energy laundering. Several IPPs also owned and operated natural gas supply pipelines and
extended this corporate nepotism to the purchase of natural gas (ibid). These companies,
including Enron, manipulated the underlying cost of natural gas in order to affect the price of
electricity, costs that were recuperated when they were eventually passed onto the local utility.

18
In order to drive prices even higher, independent power producers on several occasions
chose not to completely match all demand purchase requests. Because electricity cannot be
efficiently stored, these gaps between supply and demand would lead to brown and black outs
(Weare, 2003). Utilities, who were legally obligated to serve customers in their service territory,
would then be forced to bid even higher in the whole sale markets, in hopes of attracting
generation capacity that previously had not participated (ibid).
Market manipulation is not completely to blame, as the newly created regulatory
structure exaggerated suppliers’ power and left electricity purchasers with imperfect competition
and no reasonable alternatives. Rises in wholesale market prices, outlined in Figure 5, could not
be passed along to consumers, who were protected by a rate freeze (Weare, 2003). With no
consumer price signal attached to the peaks in the wholesale market, demand for electricity
increased as individuals and companies moved to incorporate computers and other electronics
into the daily operation of homes and businesses. During the ten years between 1990 and 2000,
electricity demand in the state increased on average approximately 1.5% annually (ibid, p. 16).
But this average rate was heavily influence by 4% annual increases in demand between 1998 and
2000, which was coincidently the time period of California’s deregulation. It was during this
same time period that supply was at its lowest (ibid, p. 16). California historically imported 20%
of its electricity from neighboring states, but droughts in the Pacific Northwest limited the
amount of hydroelectricity available to meet California’s increased demand (ibid). Demand also
increased by 6.2% in Nevada and 3.7% in Arizona, leading to limited export availability (ibid, p.
16).
As a result of these and other market variables, the price of electricity on the wholesale
market was 2,000% higher during the winter of 2000 than it had been just a year prior, see Figure

19
5 (Weare, 2003 p. 1). Unable to pass along these increased costs, state utilities lost millions of
dollars. The electricity crisis was at its worse during 2001 when over the course of nine days
there were “a total of 42 hours of outages,” (Weare, 2003, p. 3). The US urban area average is no
more than 5 minutes over the course of an entire year (MIT, 2011, p. 9).
With its income limited and facing unprecedented increases in costs, Pacific Gas &
Electric (PG&E), California’s largest utility, borrowed $13 billion dollars in order to bridge the
gap between rising costs and limited income. With no end to the underlying issues in sight and
the company’s lowest credit rating in history, barring it from borrowing any further at reasonable
rates, PG&E declared bankruptcy (ibid). California’s other large IOUs were also forced to
borrow significantly in order to meet their obligations. A conservative estimate of the financial
Figure 5 - The wholesale price of electricity in California during the period of deregulation. As can be
clearly seen the mere initiation of deregulation in 1998 did not immediately lead to the rise of electricity
prices, in fact prices initially dipped. It was however the confluence of several factors that played a role
the rising price of electricity (Weare, 2003, p. 1).
20
impact of The California Energy Crisis is $40 billion or 3.5% of California’s annual GDP (id, p.
3). In comparison, the most temporally recent crisis, the nationwide Savings and Loan Crisis,
was approximately $100 billion, but only 0.05% of the country’s GDP (ibid, p. 4).
The California state government was forced to intervene and using its emergency powers
shutdown the wholesale electricity market. Criminal charges were filed against IPPs who
colluded to affect wholesale prices, including Enron and its CEO Kenneth Lay. The international
popularity of PURPA legislation came to a screeching halt; no new ISOs have been formed since
the 2001 Energy Crisis (MIT 2011, p. 240). That being said previously established alternative
forms of deregulation including in Texas and New York have been successful in decreasing costs
and providing consumers with increased provider options.
California’s electricity industry required significant reforms, one of which was
decoupling. Decoupling separates a utility’s revenues from the amount of electricity the utility
sells. Instead revenues are based on a percentage of the monetary value of assets under
management. This calculation includes the value of power plants, transmission lines, and the
distribution grid. Electricity usage is estimated and this forecast is used to determine electricity
rates, which in aggregate meet state set revenue levels. Decoupling eliminates the juxtaposition
of promoting customer energy efficiency with utility revenues. In fact, customer energy
efficiency, along with corporate operational efficiency and demand side management can lead to
increased profits as they reduce costs, while leaving revenues unaffected. Decoupling actually
presents electric utilities with a rare opportunity: even when other parts of the economy are doing
poorly, the utility is essentially guaranteed revenues.
Similarly distributed renewables do not affect decoupled utilities’ profits as they simply
reduce demand, just like customer energy efficiency. Decreased demand, whether through

21
efficiency or renewable energy generation, does however effect electricity rate calculations. In
order to recoup the same amount of revenue from a smaller amount of demand, usage rates must
be raised. This phenomenon is known as a “cost shift;” similar to the unintended impacts of
deregulation, cost shifting could potentially impact the utility industry’s financial integrity and is
reviewed in more detail during the California and Discussion sections.
Critical Mass and Impacting the Electricity Grid
Before the California Energy Crisis, the PURPA ISO model was replicated in
Switzerland, where for the first time the right to produce electricity by “non-utility” actors was
extended beyond involvement in wholesale markets and all the way downstream to the consumer
(Perlin, 2013). Just like in the United States, electricity prices in Switzerland rose following the
OPEC Oil Embargo (Perlin, 2013). It was at this time that research into renewable energy
systems, which required no fuel, began to increase (ibid). Markus Real of Zurich was an early
adopter of rooftop PV solar and felt that it was an underappreciated technology, which not only
had the potential to protect consumers from future oil embargos, but also to reduce pollution
(ibid). Mr. Real believed so adamantly in the potential of the technology that in 1987 he started
Project Megawatt (Perlin, 2013). Intended as a social movement more than anything, Project
Megawatt aimed to install 333, three kW solar PV systems on rooftops throughout the capital
city (Perlin, 2013). The combined capacity of all 333 systems was one MW, hence the name. The
core idea of price protection and environmental stewardship resonated with the people of Zurich
and Project Megawatt was able to quickly enroll more than enough homeowners. However, once
the rooftop PV systems were installed, participating homeowners were disappointed with paying
the retail rate for electricity from their local utility, but only being paid an “avoided costs” rate,
which was 600% lower, for the electricity that their rooftop panels generated (ibid). As these
22
early adopters were individuals of influence, they were able to convince the local utility council
that electricity generated on their roofs was just as valuable as the electricity generated by the
utility’s large centralized plant (ibid). Side Note: One key factor in this political success was the
incorporation of local business leaders into Project Megawatt, including the owner of
Switzerland’s largest glass fabrication company, which made glass covers for solar panels. As a
result “net metering” was born, and Project Megawatt’s impact extended well beyond the 333
homes in Zurich, with net metering legislation significantly improving the return on investment
of distributed renewable systems and became the legislative standard in regions with some of the
highest rates of renewable energy generation, including Japan, Germany and California (ibid).
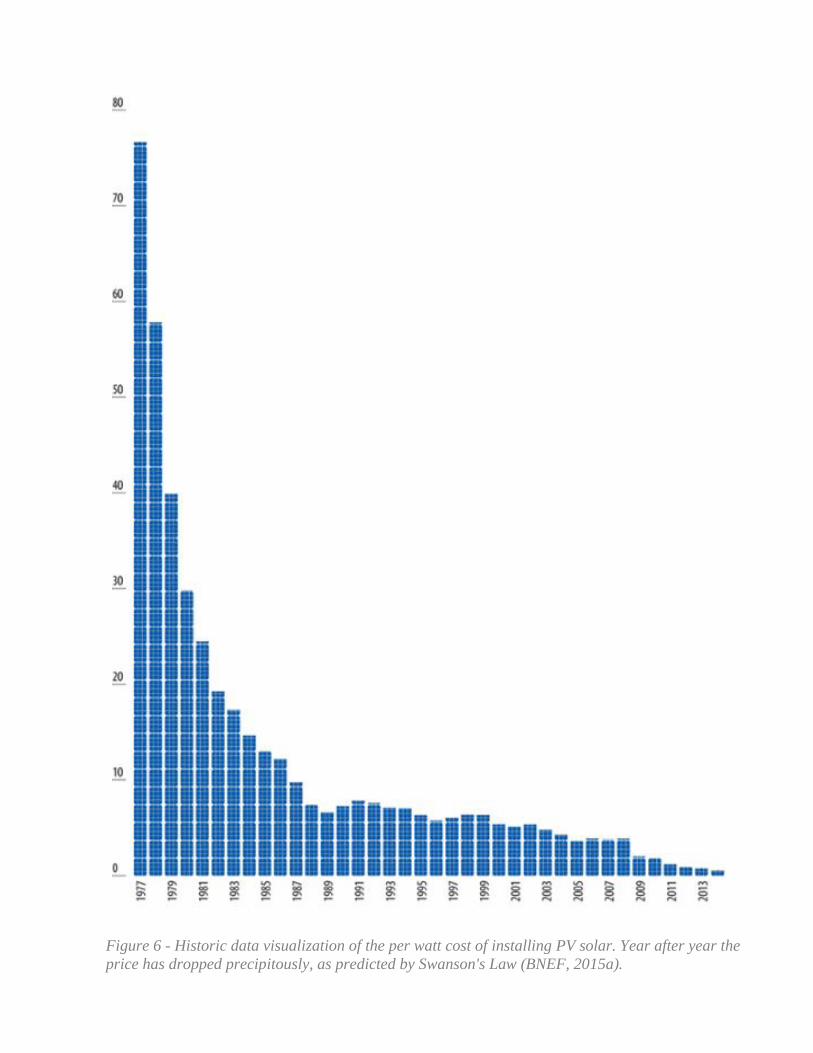
While net metering revolutionized the potential revenue stream for distributed
renewables, the core technology was still relatively expensive at approximately $10.00 per watt
in 1987 (BNEF, 2015a). For reference the un-weighted average residential price of electricity in
the United States in 2014 was $0.115 per kWh (EIA, 2015b). However, similar to Moore's Law
regarding the exponential increase in semiconductor computing power, Swanson's Law exists in
regards to the exponential decrease in the per watt cost of PV solar. Historical pricing metrics
outline the validity of this hypothesis, as seen in Figure 6. The per watt cost of utility scale solar
installations is now so low that it has reached "grid parity" in some markets. Grid parity
compares the per watt marginal costs of building a new generating source, such as a traditional
centralized coal, natural gas or nuclear power plant (EIA, 2000). In order to better account for
required operating expenses over the life of a plant, and not just installation costs, a different
metric has been developed: the Levelized Cost of Energy (LCOE). In addition to the cost of fuel,
which renewables do not entail, LCOE takes into account operating labor, maintenance and the
23
Figure 6 - Historic data visualization of the per watt cost of installing PV solar. Year after year the
price has dropped precipitously, as predicted by Swanson's Law (BNEF, 2015a).
24
expected useful life of the power plant (EIA, 2000). LCOE has its own faults, as it does not take
into account associated transmission infrastructure costs or end of life recycling and remediation
costs. There are several other metrics, including lifetime system costs, which attempt to consider
either a more holistic approach or a different perspective. While solar may be dependent on feed-
in tariffs or subsidies in order to reach grid parity, or a comparable LCOE, many argue that these
financial appropriations help to take into account externalities not currently considered by the
market (MIT, 2011; QER, 2015; Weare, 2003). Examples of externalities include the human
health and environmental impacts of smokestack exhaust, the greenhouse gas effect of power
plant emissions, and the historic non-monetary subsidies received by the oil and gas industries.
The National Renewable Energy Laboratory tracks LCOE in an open database, called the
Transparent Cost Database, and has developed an interactive tool which allows users to
compare LCOE as well as capital costs, operating costs and capacity factors across generation
technologies. A screen shot of the Transparent Cost Database’s LCOE visualization can be seen
in Figure 7.
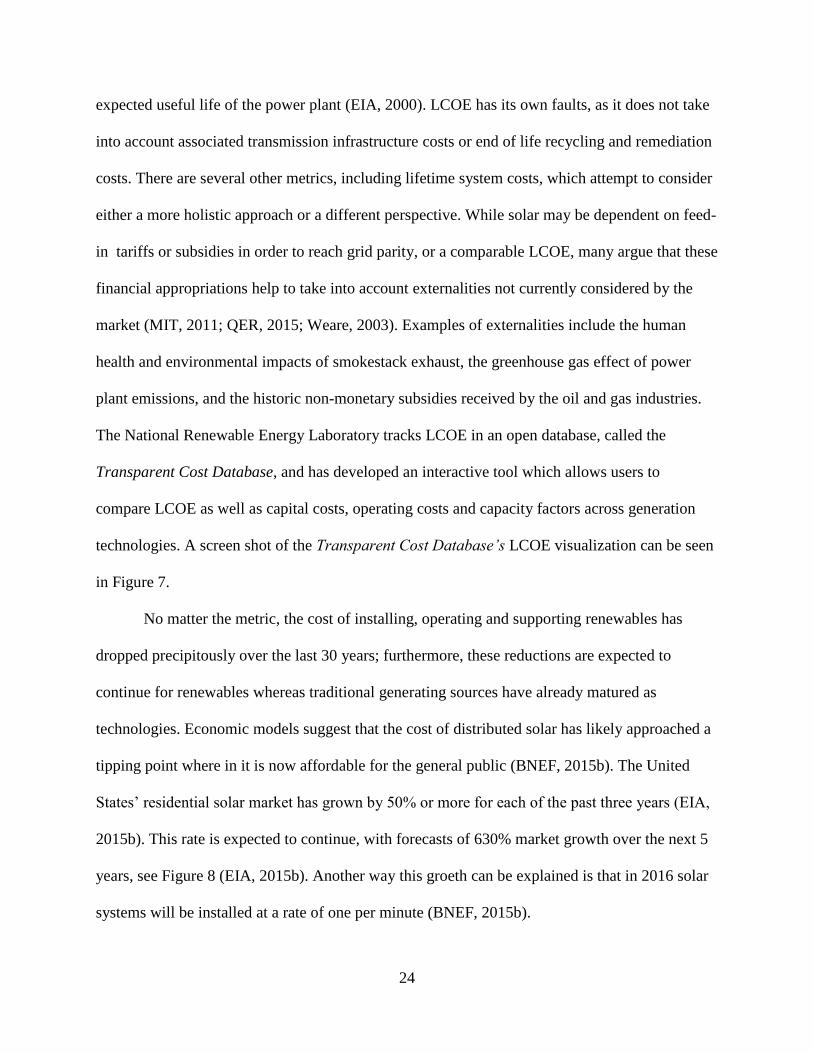
No matter the metric, the cost of installing, operating and supporting renewables has
dropped precipitously over the last 30 years; furthermore, these reductions are expected to
continue for renewables whereas traditional generating sources have already matured as
technologies. Economic models suggest that the cost of distributed solar has likely approached a
tipping point where in it is now affordable for the general public (BNEF, 2015b). The United
States’ residential solar market has grown by 50% or more for each of the past three years (EIA,
2015b). This rate is expected to continue, with forecasts of 630% market growth over the next 5
years, see Figure 8 (EIA, 2015b). Another way this groeth can be explained is that in 2016 solar
systems will be installed at a rate of one per minute (BNEF, 2015b).
1977: $76.67 per watt
2014: $0.70 per watt

25
Fig
ure 7
- Histo
ric and estim
ated
LC
OE
from
a va
riety of g
enera
ting so
urces. T
he len
gth
of th
e box
plo
ts outlin
es technolo
gy va
riatio
ns a
nd
subsid
y differen
ces (NR
EL
, 2015
).
26
This exponential growth rate has transformed what was once a small group of early
adopters into a substantial assembly of distributed power generators. As such the scale of these
systems’ impacts on the electricity grid has also significantly increased. Much of the electrical
infrastructure was built during the post-World War II construction boom, and designed to
accommodate the centralized flow of electricity from power plant to end user (DOE, 2015). The
bi-directional flow of electricity, caused when distributed energy systems create more electricity
than is used on site, is a new phenomenon and not something legacy systems were built to
handle. The impacts of bi-directional flow include overheated transformers, voltage spikes and
frequency interruptions, just to name a few, and can cause significant equipment damage. As a
result utilities are reassessing the resilience of their infrastructure and moving to bring
2012
2013
2014
Figure 8 - A to scale
representation of the near
term historic and five year
expected increase in the
number of residential solar
systems in the United
States (Derived from EIA,
2015b).
2019 - 3.2 million homes

27
transparency to these unintended, nevertheless significant, infrastructure costs. Distributed solar
does however offer benefits to the electricity grid as well. If strategically located the combination
of distributed systems, batteries and/or demand response can eliminate the need for expensive
transmission infrastructure upgrades (MIT, 2011). Furthermore solar systems generation
overlaps with a significant portion of peak demand and can reduce associated GHG emissions
and air pollution (QER, 2015).
Methodology
This research paper takes a case study approach to assessing how governments and
private utilities have promoted and are incorporating distributed photovoltaic solar into the
electricity grid. Utility structures, renewable penetration rates and infrastructure resiliency are
reviewed for California, Hawaii and Germany. The cases under consideration each bring a
unique perspective, as distributed solar generation is in a different stage of deployment in each
jurisdiction, and are further differentiated as the regulatory atmosphere in each circumstance is
unique. This research paper relies entirely on publically available information; in addition to
aiming to understand the problems faced by utilities, this research attempts to discover strategies,
based on historic successes and failures, that will aid in the continued integration of distributed
renewables into the electricity grid. As the installation costs of renewables continues to drop and
demand for greenhouse gas and pollution free electricity continues to rise, utilities will be faced
with critical decisions regarding how to minimize costs while fully utilizing a growing asset
class.

28
Cases
This research paper reviews three electricity markets: California, Hawaii and Germany.
Although more in depth details will be given in each section, Table 1provides an overview of the
each geography.
California Hawaii Germany
Population Served 38.8 million1 1.42 million
1 80.62 Million
2
Service Territory 163,696 mi2 1
4,028 mi2 1
137,903 mi2 2
Total Generation 296,628 Gwh3 9639 Gwh
4 614,000 Gwh
5
from Renewables 18.77%3 13.7%
4 26.2%
5
from Solar 1.8%3 <3%
4 5.7%
5
from Distributed Solar <1%3 <2%
4 4.5%
5
Peak demand met by Solar 7%6 80%
7 69.5%
5
Price* $0.1747/kWh8 $0.3334/ kWh
8 $0.31428/kWh
5
* Residential rate; assumes €1=$1.08
1: (USCB, 2014). 2: (World Bank, 2015). 3: (DBEDT, 2013). 4: (CEC, 2014). 5: (Wirth,
2015). 6: (CPUC, 2015). 7: (Paulos, 2014). 8: (EIA, 2015b).
California Overview:
California’s state government has set clear mandates regarding distributed energy
resource integration, yet utilities have little control over their own energy generation portfolio, as
they have been forced to cede this authority to the Cal ISO (Weare, 2003). California has the
largest installed solar capacity, distributed or otherwise, in the nation (CPUC, 2015). As a result,
grid operators are beginning to encounter a bi-model demand curve (PG&E, 2014). Often called
the Duck curve, the associated bi-directional flow of electricity can negatively impact
infrastructure (Cal ISO, 2013).
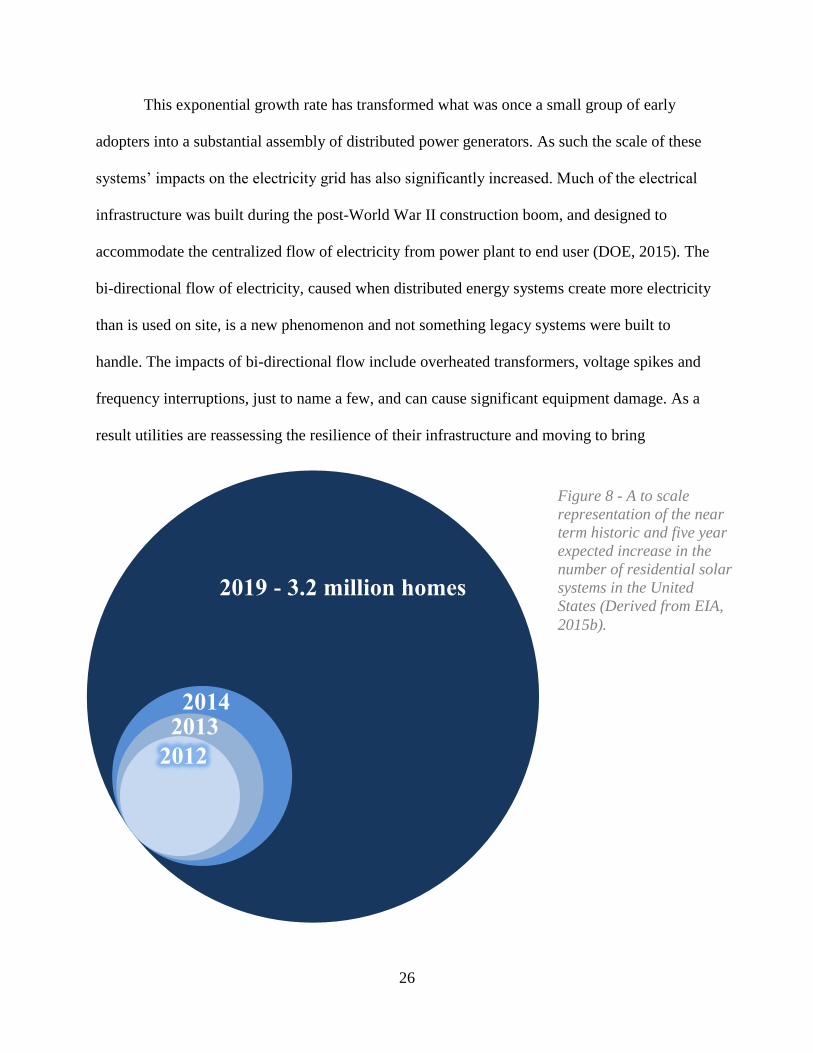
Hawaii Overview:
Spurred by the highest electricity rates in the United States, one in nine Hawaiian utility
customers have rooftop solar installed (HECO, 2013; Wesoff, 2014). Faced with dwindling
Table 1 – Basic electrical industry information comparison for each case study jurisdiction
29
profits and strained infrastructure, the local electric company is no longer approving solar
interconnection requests in some areas (St. John, 2014a). This high level of solar penetration
forms a “Nessie Curve,” which has a steep increase in electricity demand following sunset,
similar to the steep slope of the Loch Ness Monster’s neck. Such a quick ramp up in demand is
not only expensive to service, but is also nearly unfeasible with the current infrastructure. (St.
John, 2014b). The utility and the state’s Public Utilities Commission are at odds, with the PUC
calling the Hawaiian Electric Company’s (HECO’s) renewable integration plans “fundamentally
flawed” and a “failure” (HPUC, 2014, p. 28).
Germany Overview:
As the result of the country’s unique feed-in tariffs, Germany exceeds both California in
total installed solar capacity and Hawaii in penetration rate. German utilities have dealt with the
Duck and Nessie curves by focusing on local infrastructure and shifting from a centralized power
production model to a distributed system where the utility acts as an enabler of customer owned
generating assets. Following Fukushima, Germany expedited the decommissioning of a majority
of its nuclear power plants GFNA, 2015. These shutdowns have added flexibility to the
electricity grid and allowed it to actually increase electricity exports to neighboring countries,
while still being able to supply power during a solar eclipse.
California
The California Independent System Operator (Cal ISO or CAISO) is one of the largest
third party grid management organizations in the world and is considered a thought leader in the
space (Weare, 2003). Cal ISO incorporates over 80% of the state of California and works closely
with the state’s utilities, especially the three largest: Pacific Gas & Electric (PG&E), Southern
California Edison (SCE), and San Diego Gas & Electric (SDG&E), all of which are investor

30
owned utilities (IOUs) (Cal ISO, 2015d). Cal ISO forecasts the state’s electricity demand and
then manages the competitive wholesale electricity market in order to properly match this
demand, while insuring transmission lines and other high level infrastructure are not
overburdened (Cal ISO, 2015a). As a result of unique state legislation, utility and Cal ISO
revenues are “decoupled” from both demand forecasts and the amount of electricity generated.
Approximately a quarter of the electricity used in the state is imported from power plants
outside of, but connected to, the Cal ISO grid as part of the Western Interconnection (Cal ISO,
2015a). The Western Interconnection helps to provide Cal ISO and all connected electricity grid
Figure 9 – The electricity grids of the United States and Canada are linked and
subsequently split into three different interconnections governed by eight different regional
councils (NERC, 2013).

31
operators with reliability and the opportunity to service electricity demand outside of their
service territory. The Western Interconnect stretches eastward into parts of Texas, as far south as
Baja, Mexico, and north to encompass the Canadian provinces of British Columbia and Alberta,
see Figure 9 (Cal ISO, 2015b).
Over 1,400 generation facilities, located throughout the Western Interconnection and
owned by more than 100 companies, participate in Cal ISO’s wholesale electricity markets,
which include day ahead, hour ahead and on-demand auctions (Cal ISO, 2015a; Cal ISO, 2015c;
Cal ISO, 2015e). It is Cal ISO’s responsibility to manage these markets while adhering to the
confines of the Renewable Portfolio Standard (RPS) set by the CPUC. The Cal ISO failed to
meet the RPS legislation requirement for 2010, which required that 20% of electricity generated
during that year come from renewable resources (CEC, 2014). The next goal, established by
Senate Bill X1-2, is for 33% of electricity to be renewable in 2020 (CEC, 2014). California’s
Figure 10 - In 2013 California consumed 199,783 GWhs of electricity. The fuel source ratios outline a
clear commitment to low greenhouse gas emission sources (CEC, 2014).

32
electricity generation portfolio is outlined in Figure 10.
In order to meet these renewable energy generation goals California has instituted several
programs, including financial incentives. The Go Solar Campaign is the umbrella name for state
programs designed to incentivize customer owned solar; the largest such program is the
California Solar Initiative (CSI) which has a budget allocation of $2.167 billion over 10 years
(CPUC 2014a). The CSI program, as outlined by Figure 11, contains a stepwise functionality
designed to incentivize a growing capacity of solar given the same amount of funding each year.
Financial payments are made to solar system owners based on monitored system generation
(CPUC 2014a). The incentive, which is a consistent per kWh rate, continues for 20 years.
Incentive rates decrease with each year for new participants (ibid). To date, the CSI program has
Figure 11 – Customer sited solar capacity installed in CA’s IOU territories through the CSI
program, 1993-2013 (CPUC, 2014b).
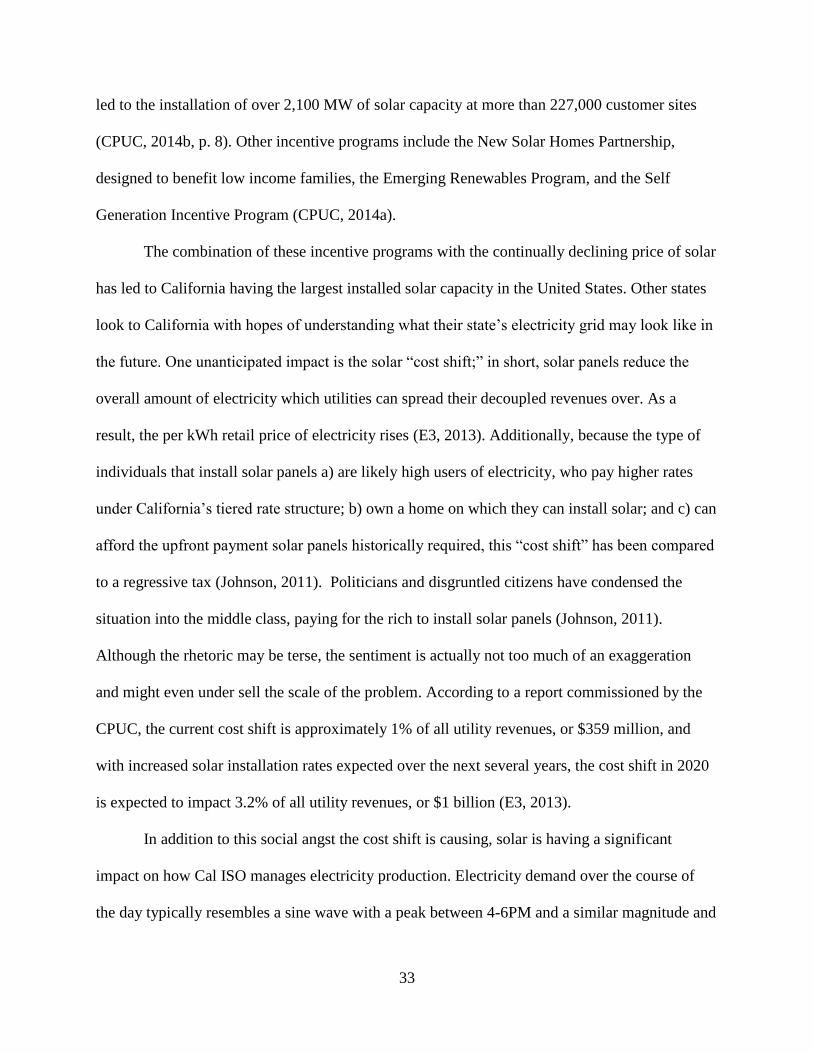
33
led to the installation of over 2,100 MW of solar capacity at more than 227,000 customer sites
(CPUC, 2014b, p. 8). Other incentive programs include the New Solar Homes Partnership,
designed to benefit low income families, the Emerging Renewables Program, and the Self
Generation Incentive Program (CPUC, 2014a).
The combination of these incentive programs with the continually declining price of solar
has led to California having the largest installed solar capacity in the United States. Other states
look to California with hopes of understanding what their state’s electricity grid may look like in
the future. One unanticipated impact is the solar “cost shift;” in short, solar panels reduce the
overall amount of electricity which utilities can spread their decoupled revenues over. As a
result, the per kWh retail price of electricity rises (E3, 2013). Additionally, because the type of
individuals that install solar panels a) are likely high users of electricity, who pay higher rates
under California’s tiered rate structure; b) own a home on which they can install solar; and c) can
afford the upfront payment solar panels historically required, this “cost shift” has been compared
to a regressive tax (Johnson, 2011). Politicians and disgruntled citizens have condensed the
situation into the middle class, paying for the rich to install solar panels (Johnson, 2011).
Although the rhetoric may be terse, the sentiment is actually not too much of an exaggeration
and might even under sell the scale of the problem. According to a report commissioned by the
CPUC, the current cost shift is approximately 1% of all utility revenues, or $359 million, and
with increased solar installation rates expected over the next several years, the cost shift in 2020
is expected to impact 3.2% of all utility revenues, or $1 billion (E3, 2013).
In addition to this social angst the cost shift is causing, solar is having a significant
impact on how Cal ISO manages electricity production. Electricity demand over the course of
the day typically resembles a sine wave with a peak between 4-6PM and a similar magnitude and
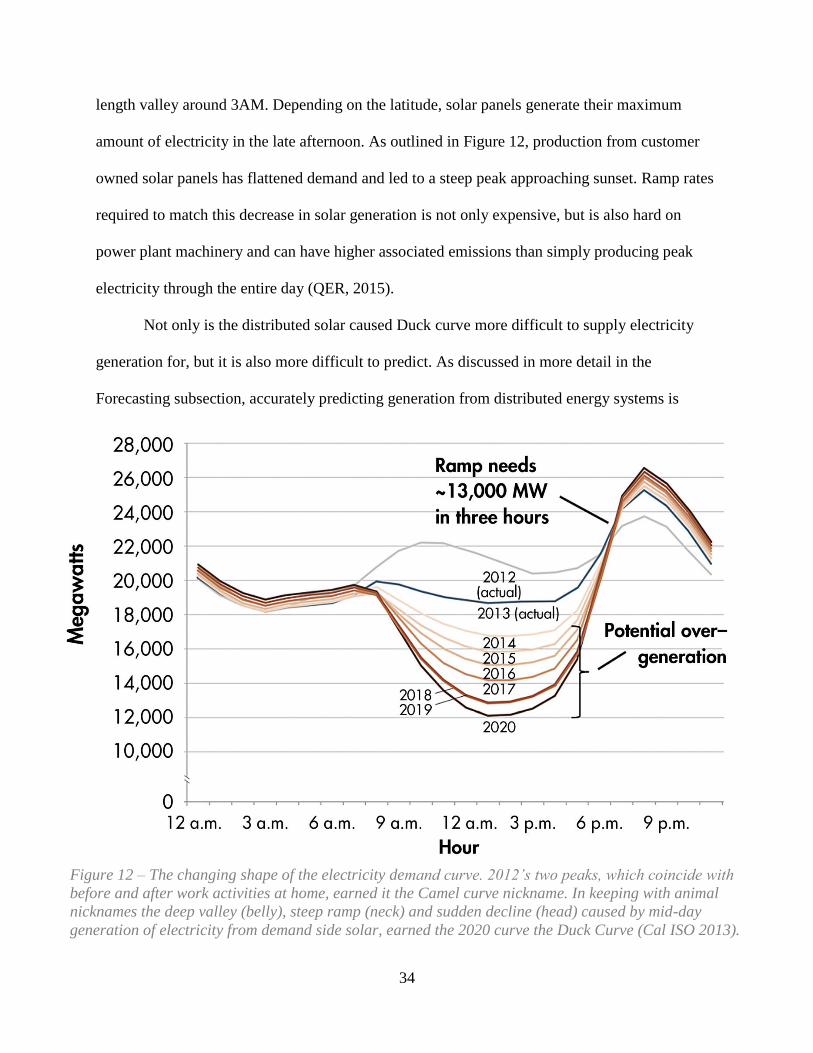
34
length valley around 3AM. Depending on the latitude, solar panels generate their maximum
amount of electricity in the late afternoon. As outlined in Figure 12, production from customer
owned solar panels has flattened demand and led to a steep peak approaching sunset. Ramp rates
required to match this decrease in solar generation is not only expensive, but is also hard on
power plant machinery and can have higher associated emissions than simply producing peak
electricity through the entire day (QER, 2015).
Not only is the distributed solar caused Duck curve more difficult to supply electricity
generation for, but it is also more difficult to predict. As discussed in more detail in the
Forecasting subsection, accurately predicting generation from distributed energy systems is
Figure 12 – The changing shape of the electricity demand curve. 2012’s two peaks, which coincide with
before and after work activities at home, earned it the Camel curve nickname. In keeping with animal
nicknames the deep valley (belly), steep ramp (neck) and sudden decline (head) caused by mid-day
generation of electricity from demand side solar, earned the 2020 curve the Duck Curve (Cal ISO 2013).

35
difficult. One of these reasons is that most DG systems are installed “behind the meter,” meaning
grid operators only have insight into the net demand, and not the independent variables of solar
generation and on-site demand (Letendre, 2014, p. v). The ramp rate of solar panels, which can
quickly change the amount of electricity generated due to a passing cloud, adds another layer to
forecasting algorithms. When combined with weather forecasts that are both temporally
inaccurate, and do not have enough locational granularity, the task is almost impossible (ibid).
For these reasons Cal ISO does not currently include DG systems in demand forecasts, although
the organization is working on a pilot algorithm to predict generation; there are no plans to
incorporate the results of this algorithm into demand forecasts (ibid).
One of the final unique characteristics of the California electricity industry to be
discussed as a part of this research paper is the ability of local governments to create public
power agencies (CMUA, 2003). As previously discussed, decoupling bases local utilities’
revenues on assets under management. Via public power agencies, local governments are able to
purchase the electrical infrastructure within their jurisdiction, despite IOUs regulatory protected
service territory monopolies (Eskenazi, 2014). Therefore, the creation of new public power
agencies threatens to decrease future revenues for the state’s IOUs. This purchasing authority
extends beyond standard city governments and includes almost any formal body regardless of its
involvement or expertise in energy generation such as school boards, water districts, and public
transit authorities (Eskenazi, 2014). Based on growing consumer demand for renewable energy,
an increasing number of applications have been submitted to create new public power agencies
(Eskenazi, 2014). While the scale of public power authorities is currently minimal, they could
radically shift the utility landscape and require an increased role from the Cal ISO to maintain
infrastructure and insure reliability (ibid).

36
Hawaii
Where California leads in total installed capacity, Hawaii leads in distributed renewable
penetration: one in nine customers has rooftop solar installed (Wesoff, 2014). Growth in
distributed solar has been fueled by electricity rates at 34 cents per kilowatt hour, which is more
than three times higher than the national average (HECO, 2013). Like many things in the
Hawaiian Islands, much of the cost associated with power production is a result of supply chain
costs, mainly, transporting fuel to the remote islands. As outlined in Figure 13, petroleum
accounts for the overwhelming majority of electricity generated by the HECO, the state’s
electricity conglomerate (IER, n.d.).
Unfortunately, energy generation from petroleum causes significant pollution, including
greenhouse gas emissions. This combination of the high expense and environmental impacts has
made Hawaii a popular market for alternative energy generation systems. Biomass and waste-to-
energy systems experienced early adoption, as legislatures recognized that using part of the
state’s limited space for landfills was a losing proposition. Offshore wind has also seen success,
as the prevailing winds that made Hawaii an important trade waystation continue today. The
distributed energy generation source that has been most popular, however, is solar. Rooftop solar
systems are financially accessible and aesthetically minimalist. In addition, the state has
significantly subsidized the installation of solar panels through its feed-in tariff program.
Hawaii’s feed-in tariff structure is both technology and size dependent, but in almost
every category has some of the highest tariffs in the world (HECO, 2014b). Residential sized PV
systems qualify for $0.274 per kWh, in addition to Hawaii’s personal tax credit (PTC) of 35% of
system costs and the federal government’s 30% PTC (HECO, 2014b; Farrell, 2010). Combined,
this creates a 24% return on investment, leading to installations paying themselves off in just
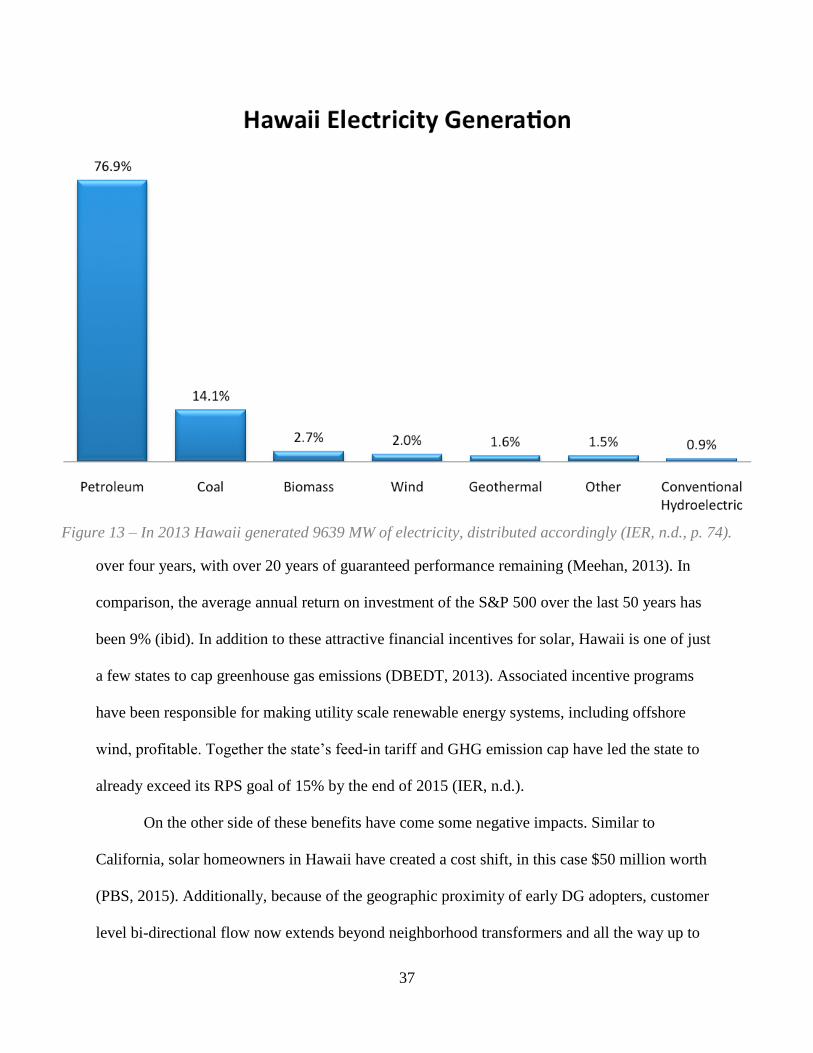
37
over four years, with over 20 years of guaranteed performance remaining (Meehan, 2013). In
comparison, the average annual return on investment of the S&P 500 over the last 50 years has
been 9% (ibid). In addition to these attractive financial incentives for solar, Hawaii is one of just
a few states to cap greenhouse gas emissions (DBEDT, 2013). Associated incentive programs
have been responsible for making utility scale renewable energy systems, including offshore
wind, profitable. Together the state’s feed-in tariff and GHG emission cap have led the state to
already exceed its RPS goal of 15% by the end of 2015 (IER, n.d.).
On the other side of these benefits have come some negative impacts. Similar to
California, solar homeowners in Hawaii have created a cost shift, in this case $50 million worth
(PBS, 2015). Additionally, because of the geographic proximity of early DG adopters, customer
level bi-directional flow now extends beyond neighborhood transformers and all the way up to
Figure 13 – In 2013 Hawaii generated 9639 MW of electricity, distributed accordingly (IER, n.d., p. 74).

38
the substation (St. John, 2014b). In fact, the impact of solar DG in Hawaii is far greater than
anything the Cal ISO has ever predicted for itself, as the Hawaiian grid reaches system-wide
demands “underwater”, or below zero, during peak solar generation, see Figure 14. In order to
highlight the dangerous nature of this negative demand, Hawaii’s demand curve has earned the
name “Nessie” curve (Paulos, 2014). The isolated nature of the Hawaiian grid means there is no
place for this electricity to go; in fact, in Kauai there are considerations for the utility to pay
customers to use electricity during the mid-day over generation period, for example to charge
electric cars (Paulos, 2014). The isolation also means that when quick or unexpected
interruptions in solar generation occur there is no RTO, ISO or interconnect to supply generation
capacity. Instead, energy storage has taken off on the chain of islands. Such a system prevented a
Figure 14 – Load profile curve for one of the Hawaiian Islands. The features of California’s Duck curve are
accentuated, with solar generation actually exceeding even base load demand (HECO, 2014a).

39
significant blackout in Kauai when an oil-fired generator tripped offline due to a DG solar
caused frequency interruption (Paulos, 2014).
Insight into when this type of event might happen in the future is complicated by two
factors. The first is a lack of accurate and granular solar generation data. Similar to California,
most Hawaiian DG systems are installed behind the meter, and as a result the local utility can
only access net generation information. However, where the case is worse in Hawaii than it is in
California is the lack of “smart meters” (DBEDT, 2013). In Hawaii, on-site electricity meters are
checked by hand once a month, while in California smart meters register electricity flow every
15 minutes and relay this information via a radio network to the utility. Smart meters provide
temporally relevant data with minimal operating costs. Without smart meters HECO is forced to
depend on transformer level data, which may cover several square miles of service territory,
making determining the location or cause of an interruption notoriously difficult. The second
difficulty in predicting DG production is a result of the microclimates of the leeward and
windward sides of the islands. Climates can be significantly different within just a few miles of
one another. Quick moving Pacific Ocean storms can arrive, interrupt solar generation and then
dissipate, all within the ramp period of an oil fired power plant (HECO, 2014; MIT, 2011). Note:
Similarly, these storms can increase generation from wind farms, and because of the difficulty to
predict these events, HECO prefers to curtail generation from wind farms, rather than adjust the
output of inflexible base load plants. For example, during the month of February 2013, 40% of
wind generation in Maui was curtailed (NREL, 2014b). Independent models suggest that
curtailment rates of 2-4% are achievable with minimum modifications (ibid).
These complications have delayed HECO’s ability to further integrate increased
renewable energy onto the grid, distributed or otherwise. It is estimated that HECO would need
40
to make $38 billion in capital investments in order to safely reach existing 2050 RPS goals
(Shimogawa, 2015). The utility understandably is hesitant to make such large investments and
has submitted several requests for revisions to the state’s RPS goals and the Public Utility
Commission’s (PUC’s) implementation procedures. The PUC, aggravated by years of delays,
intentional disregard of its instructions, and inaction by the utility, called HECO’s renewable
integration plans “fundamentally flawed” and a “failure” (HPUC, 2014, p. 28). Florida Power
and Light is awaiting federal regulatory approval for a purchase of HECO. Hawaiian citizens and
the state’s PUC hope this change in ownership will mark a change in commitment to renewables,
especially distributed systems (PBS, 2015).
Germany
Sparked by social concerns regarding pollution and climate change in the mid 1980s,
Germany has since become one of the leading governemental advocates for energy efficiency
and renewable energy (Wirth, 2015). The first piece of national legislation focused on energy
generation was the Stromeinspeisegesetz, or “Electricity Feed-In Act,” of 1991; with it, Germany
began to financially incentivize the democratization of electricity production through guaranteed
prices for electricity generated from distributed renewable energy systems (Wirth, 2015). The
Erneuerbare-Energien-Gesetz (EEG) or “German Renewable Energy Act” of 2000 refined the
earlier legislation, leading to increased renewable energy installations. The three main tenets of
the EEG are:
1) Guaranteed purchasing
Previous legislation allowed for private utilities to prefer centralized and conventional
generation facilities when scheduling eletricity generation merit order; as a result, generation
from distributed renewable systems was rarely utilized (GNFNA, 2015). The EEG mandates that

41
electricity grid operators incorporate distributed renewable systems before conventional sources
(GNFNA, 2015). These systems, because of their lack of externalities, are then paid an above
market rate for the electricity generated, this rate is called a feed-in tariff (ibid).
2) Revenue neutrality
The EEG feed-in tariff does not cost the German government anything. Instead, the
German people have accepted paying higher electricity rates to fund these renewable energy
installations (GNFNA, 2015). While the German citizenry pays approximately $0.14 extra per
kWh in order to fund the program, German industrial and manufacturing facilities are exempt
from electricity price increases associated with feed-in tariffs (NREL, 2014a). Because of this
guaranteed subsidy, the electriricty price that feed-in tariff renewables require to operate
profitiablly is extremelly low. This in turn drives prices on the wholesale elctricity market down.
In fact, retail electricity prices have dropped for four years straight (Morison & Mengewein,
2014).
3) Declining subsidies over time
Renewable energy installations are guaranteed a technology specific feed-in tariff rate for
20 years (GFNA, 2015). However, the initial tariff amount decreases each month at a
predetermined rate; this digression is desgined to promote increasingly efficient systems over
time (ibid). While future rates and time tables have been adjusted several times since the initial
passage of the EEG in 2000, historical rates have been left intact (ibid). This is not the case in
Spain, which has a similar feed-in tariff system, where the government has retroactively changed
tariff prices, obviously negatively impacting project economics (NREL, 2014a).
As a result of the EEG, significant increases in renewable enegry installations have
occurred. In 2000, all renewables (onshore and offshore wind, biomass, photovoltaics and
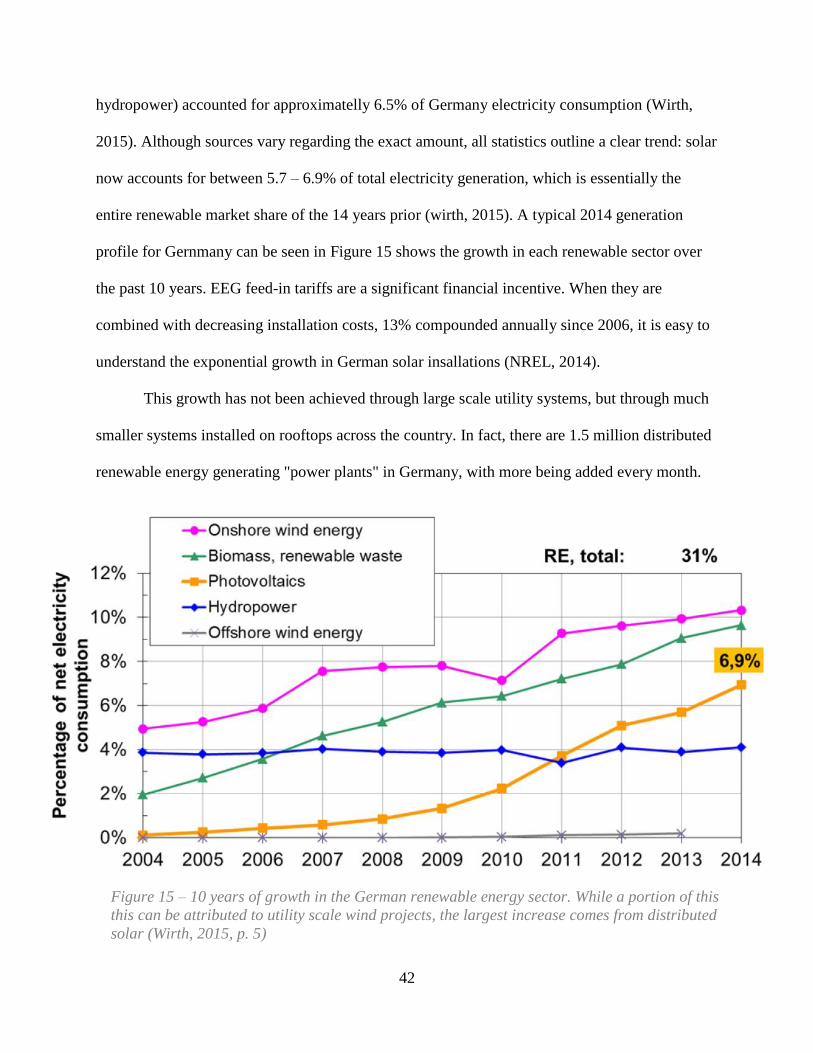
42
hydropower) accounted for approximatelly 6.5% of Germany electricity consumption (Wirth,
2015). Although sources vary regarding the exact amount, all statistics outline a clear trend: solar
now accounts for between 5.7 – 6.9% of total electricity generation, which is essentially the
entire renewable market share of the 14 years prior (wirth, 2015). A typical 2014 generation
profile for Gernmany can be seen in Figure 15 shows the growth in each renewable sector over
the past 10 years. EEG feed-in tariffs are a significant financial incentive. When they are
combined with decreasing installation costs, 13% compounded annually since 2006, it is easy to
understand the exponential growth in German solar insallations (NREL, 2014).
This growth has not been achieved through large scale utility systems, but through much
smaller systems installed on rooftops across the country. In fact, there are 1.5 million distributed
renewable energy generating "power plants" in Germany, with more being added every month.
Figure 15 – 10 years of growth in the German renewable energy sector. While a portion of this
this can be attributed to utility scale wind projects, the largest increase comes from distributed
solar (Wirth, 2015, p. 5)

43
Germay has also streamlined the application and permitting process. Installing a rooftop solar
panel system costs more than twice as much in the United States than it does in Germany
(Woody, 2012).
All of this investment and dependence on solar has occurred despite the fact that
Germany has comparatively poor solar resources. As outlined in Figure 16, the amount of annual
solar radiation that lands on Germany, with its generally cloudy weather, is akin to the amount of
sunshine that lands on Alaska, which partailly falls within the Artic Cirlce. Despite this,
Germany creates 6.5 times the solar energy of the entire United States (Sahan, 2013b).
Only 20% to 30% of the energy generated by rooftop arrays in Germany is “self
Figure 16 – Solar irradiation rates for the United States compared to Germany. Note not only
the relative size of each country, but also the wealth of solar irradiation in even the wet Pacific
Northwest as compared to Germany (Shahan, 2013a).

44
consumption” or used on-site to fill household demand (Stetz et al, p. 51). This means that 70 –
80% of the elctricity generated by rooftop solar panels is sent up the distribution grid. To
decrease the amount of electricity sent back to the grid, an incentive program for residential scale
battery storage system was initiated in May of 2013. This program includes a €600 per kW
subsidy, in addition to a low interest rate loan to cover the remaining system cost (Stetz et al, p.
51). Residents are prohibitied, however, from exporting more than 60% of their PV system’s
capacity (ibid). In the last two years the program has funded the installation of more than 15,000
combination PV and battery systems. The energy not absorbed by these in home energy storage
systems flows to the distirbution grid, and in 2009 Germany began to experience substation level
reverse load flows (Stetz et al, 2015). As outlined by Figure 17, these negative loads grew until
Figure 17 – Similar to Hawaii’s Nessie Curve, solar generation in Germany first began to exceed
demand in 2009. The scale of reverse flows now exceeds the scale of peak demand (Shahan, 2013).

45
2011, when the amount of eletricity exported from the substation matched the peak amount used
by the station during the winter. Note that Germany’s system is a full four years ahead of the
Hawaiian Nessie Curve, and at rates that the Hawaiians have yet to experience. Since 2011,
summer exports have only continued to grow in relation to peak load demands, which are now
50% of peak exports. Given that the elctricity grid is desgined for a downflow of electricity from
centralized power plants to end users, a substation level back flow has significant infrastucture
impacts. German utilities were forced to make infrastructure upgrades and chose to pursue $35
million worth of “classic grid reinforcements,” such as the installation of additional transformers
and builing of new substations (GTAI, 2015).
Even with these infrastructure investments, the German grid is subject to a 1,000 MW
swing in solar production over the course of just 15 minutes (Stetz et al., 2015, p. 58). The
negative ramifications of these swings in production can be magnified when poor forecasting
tools are utilized. The scale of current forecasting error is exemplified by an example from April
of 2013 (Stetz et al., 2015, p. 58). A day ahead forecast estimated that 20 GW of distributed
electricity would feed into the German electricity grid (ibid). This exceeded expected demand
and required German utilities to find electricity buyers on the European Energy Exchange
(EEX). Actual distributed production for the day in question only reached 11.2 GW, which
represents more than a 45% over estimation (ibid). Grid reliability required German utilities to
find 8,800 MW of reserve power. This amount exhausted all power reserves of the four German
utiltiies and the support of neighboring countries was required in order to balance the electricity
grid (ibid). This example is an extreme outlier regarding the accuracy of current forecasting
methodolodies; the root mean squared error of forecast compared to production is between 5 and

46
7% (Stetz et al., 2015, p. 58). Even these single digit inaccuracies can result in significant
pressure on on-demand elctricity requirements (ibid).
This accuracy was at no time more important than during the recent near total solar
eclipse. The eclipse, which lasted for two and a half hours, caused solar generation in Germany
to go from 21.7 GW to 6.2 GW, a more than 70% drop in production (Wesoff, 2015). Not only
was there expansive decline in production, but also it happened more than 2.7 times faster than
would normally occur during sunset, which means that following the eclipse, producition from
PV solar rebounded excessively faster than is the norm as well (Wesoff, 2015). Germany’s grid
operators responded with a combination of strategies to match the generation and ramp rate
needs. These included increasing hydroelectric storage in anticipation of the event, employing
demand response in order to cut demand by more than 5%, and ramping up natural gas peaker
plants earlier in the day than traditionally would be required (ibid). Europe as a whole was able
to counteract the impact of the eclipse by importing electricity into areas impacted by the eclipse.
In addition to connecting to the EEX, in order to effectively match DG variability and
forecast error, Germany has made significant investments in the flexibility of its generation
profile. Modifications to baseload nuclear and coal power plants have allowed for increased
flexibility and ramp rate. This has allowed the baeload facilities to act in conjunction with peaker
plants (GTAI, 2015). Despite these investments, electricity outages do occur. Even though these
fluctations generally only last a few seconds, they can have significant impacts on sensitve
electrical machinery. In order to counteract this impact, manufacturing facilities, which account
for a significant percentage of Germany’s economy, are investing in onsite power production and
protection equipment (Schröder, 2012). Depending on the timing of an interruption and the
sensitivity of the process, damages can range “between €10,000 and hundreds of thousands of

47
euros” (ibid). If it is deemed that an interruption could have been prevented, the utility is only
responsible for €5,000 worth of losses (ibid). As a result of the increased frequency of
interruptions and the gap between potential damages and utility liability, sales of emergency
power technologies have grown by 10% each of the last three years (Schröder, 2012). Some
facilities are actually moving beyond surge protectors and batteries and are instead using the
electricity grid as a back up to on-site power generation, which is powered by natural gas fuel
cells (Bloom Energy, 2013).
With this in mind, Germany’s largest power producer, RWE, has shifted from a
generation based business model to one of a service provider, positioning the company as a
“project enabler, operator and systems integrator” based on the company’s internal expertise
with the country’s energy infrastructure and markets (Beckman, 2013). RWE is aiming to reduce
risk by facilitating, rather than leading, investments now funded by third parties (ibid). RWE
aims to shed operations with long payback periods and significant maintenance costs, such as
nuclear and coal power plants, while holding onto assets it believes will be critical to the
successful transition towards a green energy future, including transmission and distribution
infrastructure (ibid).
One piece of infrastructure RWE believes will be critical to the German electricity grid in
the future is the Stromautobahn or “Energy Highway,” a transmission line which will connect
the wind rich North Sea coasts with the demand of the Southern cities; the Stromautobahn is
expected to cost $1 trillion (Karnitschnig, 2014). This expense is larger than it otherwise would
have been, as Germany has been accused of putting the cart before the horse by engaging in the,
siting, construction and operation of wind farms before determining how the associated
electricity would be transmitted (Karnitschnig, 2014). As outlined by Günther Oettinger, Energy

48
Commissioner of the European Union, this has forced the hand of German utilities, leading to
increased cost and limited transmission route flexibility (Karnitschnig, 2014).
Discussion & Recommendations
Regardless of the jurisdiction in question, the entire electrical industry suffers from a lack
of standard metrics and performance evaluation methodologies. This in turn limits comparable
statistics and analysis of system performance and industry changes over time. This deficit has
been noted in prior industry reports, but its importance merits repeating, as overcoming it is
critical to the success of centralized policy and focused reforms (MIT, 2011; DOE, 2015). This
difference in metrics spawns from the same cause that makes RTO interconnections difficult:
service territory monopolies that did not require corporate communication between utilities. But
as the industry moves towards a more integrated grid, it is not just the infrastructure that needs to
be harmonized, but also the data centers and corporate reports. With utilities and grid
interconnections spreading across state and province boundaries, it is the role of national
agencies and international industry associations to set and enforce standards. Common financial
measures should at a minimum consider operating costs, as the leveled cost of energy metric
does, if not also account for externalities including human and environmental health effects.
Until such standards are developed, future analysis of the electric industry will be limited from
reaching its full potential.
Another limiting factor is the timing of this paper in relation to two other in-depth reports
by the US federal government in relation to the current state of the country’s electrical
infrastructure. The Quadrennial Energy Review (QER) was published within the same month as
this research paper and findings from the 350 page document could only minimally be
incorporated (DOE, 2015). The breadth of the report outlines the expansive nature of the

49
problems at hand and the impact climate change will have on the nation; the QER Task Force,
which helped compile the document, includes representatives from over 20 different federal
departments including Defense, Interior, Agriculture, State, Energy and Army Corps of
Engineers (DOE, 2015). The second report, the Eastern Renewable Generation Integration Study
(ERGIS) is a computer based model of the Eastern Interconnect including infrastructure
mapping, interlinked capacity limits and a simulated wholesale market (NREL, 2015). This
model allows for the impact of a variety of renewable integration scenarios to be assessed,
including both utility and distribution scale systems (ibid). ERGIS will help to identify weak
links in the Eastern Interconnect and aid in the prevention of cascading system failures
previously described and experienced in 1965 and 2003 (ibid). A request to review a preliminary
version of the report was made, but denied; the final report, dataset and model should be
published within the next three months. Future research on the subject of distributed energy
management strategies should incorporate findings from both of these sources.
Discussion
As was previously outlined by Figure 6, the price of solar panels has a downward cost
trend over time. When this trend is combined with the increased number of states that are
requiring the installation of renewables, see Figure 18, it can almost be guaranteed that
distributed energy penetration rates will increase in the United States. However, as outlined by
both the German and Hawaiian cases, if regulations are not properly worded or allow utilities
discretion, these entrenched interests will resist, at least initially, the expansion of renewables in
their service territories (HPUC, 2014; GNFNA, 2015). These utilities’ concerns are not
misplaced, as renewables do significantly impact the complexity of operating an already intricate
system as well as have the potential to cause harm to distribution level infrastructure (MIT,

50
2011). In order to minimize the infrastructure damage caused by integrating renewables at
critical mass, it is important that a strategic and coordinated approach is taken.
As outlined in Figure 18, even the U.S. states with the highest renewable integration
goals, in terms of capacity and percentage, pale in comparison to the amount of solar already
installed in Germany. It is because Germany has already overcome the challenges that California
and Hawaii are currently facing that this research paper aims to understand the governmental
policies and corporate strategies that have allowed for the incorporation of significant distributed
renewables, with minimal impact on grid integrity and reliability.
Strengths and Weaknesses of the German Electricity Industry
The German electrical system is not without its faults. For example outage rates in the
U.S. are about 30 seconds annually in urban areas, while the comparable German rate is 45
seconds (Nicola & Landberg, 2015; MIT, 2011, p. 9). Although a holistically minimal
difference, this 50% increase in total outage length can have a significant effect on computer
driven systems (Schröder, 2012). In order to combat these effects, owners of such systems are
forced to spend thousands of dollars on surge protection and emergency power supplies (ibid). In
fact, some of the most sensitive operations, such as data centers, are initiating a movement back
to employing onsite power generation and have gone so far as to flip the script and are relying on
the grid as a back-up power source. (Bloom Energy, 2013). Furthermore, several key factors
separate and differentiate the three geographies, making an exact mimicking of the German
electrical system both unwarranted and improbable. Although clear upon examination, it should
be explicitly noted that the California and German electricity grids are part of the larger Western
Interconnect and European Network of Transmission System Operators for Electricity,
respectively. As such, these locations are provided with additional flexibility regarding
electricitygeneration and the effect of weather, as well as better access to emergency generation

51
Fig
ure 1
8 –
A su
mm
ary sta
te Ren
ewa
ble P
ortfo
lio S
tandard
s (DSIR
E, 2
015
).

52
support. Conversely, the Hawaiian electricity grids are a series of semi-independent island
networks which serve a population orders of magnitude smaller. Hawaii’s 14 power plants have
a firm capacity of just over 2,000 MWs (NREL, 2013). California, through the Cal ISO, is
comprised of 760 central generation facilities with a capacity of 60,000 MW (Cal ISO 2013a).
Despite the fact that Germany has a smaller land mass than California, Germany’s two-state
history and district utility focus have resulted in the country having over 5,200 power plants over
10MWs in size, with combined capacity of 70,769 MWs (GTAI, 2015). Despite their differences
grid operators from each jurisdiction can learn a significant amount from one another.
In all three geographies distributed generation has reached grid parity (Meehan, 2013;
Wirth, 2015). As such, it is not deployment costs that further limit the incorporation of additional
renewables, but the flexibility of system operators to handle these variable, yet semi-predictable
generation sources. Centralized generating plants, especially nuclear and lignite coal base load
facilities, cannot effectively reduce generation. As a result power systems with more flexibility,
such as windmills, are curtailed when peak solar generation, which cannot be curtailed, occurs
(MIT, 2011). Such instances have happened in all three jurisdictions under consideration,
including 1,200 MW of renewable curtailment by Cal ISO (Howarth & Monsen, 2014). Pitting
renewable energy generating systems against one another, rather than applying the focus on
outdated and non-displaceable base load generation facilities, outlines a clear status quo basis.
Base load facilities were designed with the centralized grid in mind, which is a paradigm, for
better or worse, which no longer applies. Without these non-displaceable sources of base load
generation, it is estimated that the Cal ISO could increase renewable penetration by as much as
18.6% without enduring additional curtailment requirements (Taneja, Smith, Culler &
Rosenberg, 2013).

53
Germany has excelled at integrating renewables into its generation mix, both distributed
and centralized, and although Germany is lauded for the growth of its solar market, the country
has been technology agnostic when it comes to emission standards and subsidies. Similarly, the
EPA’s new Clean Power Plan is technology agnostic, allowing state governments to determine
how they will meet federal goals, whether it be through efficiency, solar wind, tidal, clean coal,
natural gas, etc. (QER, 2015). Where there is still room to grow in the United States compared to
Germany is investments in both distribution and transmission infrastructure. In Germany’s
“Energy Highway,” the transmission line will cross municipal and province boundaries in order
to support North Sea wind farms. The United States’ transmission network is in dismal shape and
the lack of connection between the Wind Belt and the West Coast or the Eastern Seaboard and
Mid Atlantic population centers has already made developing projects in those areas
economically unfeasible (QER, 2015).
While investment in infrastructure may separate the three jurisdictions, investments in
workforce training for “green collar” jobs does not. Germany’s investment in its energy
infrastructure helped to carry it through the Financial Crisis and Great Recession (Wirth, 2015).
In the U.S., the solar industry employs more individuals than the coal and natural gas industries
combined (Sustainable Business, 2014). The current count of 173,000 solar jobs is likely to
continue to rise as the number of rooftop systems increases (ibid). In Hawaii, the number of jobs
in the solar industry exceeds the number of jobs in agriculture and is second only to the tourism
industry (Shimogawa, 2015).
Energy Storage
Energy storage represents an alternative to retrofitting base load power plants, as it
provides both a flexible form of generation and a depository for otherwise curtailed production.
Although often lumped together, energy storage is actually comprised of a myriad of distinct

54
technologies including gravitational, thermal, chemical, and combination approaches. Depending
on the technology, energy storage can serve a variety of important roles including load leveling,
frequency control, contingency reserves, and infrastructure upgrade replacement (NREL, 2010).
As shown in Figure 19, the vast majority of currently installed energy storage capacity is in the
form of pumped hydro.
Pumped hydro energy storage is very similar to hydroelectric energy generation,
popularized by the Hoover and Three Gorges Dams. Where these dams allow water to continue
down river once it flows over gravitationally fed turbines, pumped storage moves water between
two reservoirs with differing elevations. Water from the higher embankment flows downhill and
over a turbine when energy is needed, and when there is excess energy, water from the lower
reservoir is pumped to the higher basin to develop capacity for future energy needs (EPRI,
2010). Because there are no thermal or change of state losses, pumped hydro storage is only
Figure 19- Worldwide installed electricity storage capacity by technology (EPRI, 2010).

55
limited by the efficiency of the turbine, losses due to evaporation, and the elevation difference
between upper and lower reservoirs, allowing it to reach recovery rates as high as 80% (EPRI,
2010). However, because of the geographic constraints, few additional locations for pumped
energy storage exist (EPRI, 2010). Furthermore, flooding otherwise healthy ecosystems in the
name of energy storage is becoming increasingly unpopular. As such, alternatives to pumped
hydro are needed. Lead-acid batteries are one of the oldest and most mature battery types,
reaching 85% efficiency (EPRI, 2010). Lead-acid batteries are used in a slew of industrial and
household applications, most popularly in vehicles. However, lead-acid batteries corrode over
time and lose efficiency when deeply drained, making them unsuitable for use by utilities (ibid).
Consequently, researchers and private companies are pursuing an alternative battery technology.
Lithium-ion batteries are popular in consumer electronic because of their energy density;
however, the availability of rare earth metals like lithium makes large scale lithium-ion energy
storage systems prohibitively expensive.
Compressed air energy storage (CAES) may have the most potential. Although the
underlying technology was first developed during the Industrial Revolution, compressed air was
not used for utility scale energy storage until a 642 MWh facility was built in Germany in 1978
(DOE, 2014). The still operational facility utilizes natural subterranean geological formations to
store compressed air (DOE, 2014). The facility exemplifies all of the benefits of CAES: it is
extremely reliable, has minimal operating costs, and has essentially no ramp up or cool down
requirements (ESA, 2014). Just as with pumped hydro storage, however, the size and location of
CAES facilities has been limited by the existence of adequate natural geographic locations.
Several attempts were made to build compression tanks large enough to serve utility scale
demand; however, the size of the equipment required was cost prohibitive (ESA, 2014). Modular

56
compression tanks arranged in series were also attempted, but commercially unattractive (ESA,
2014). These attempts have been limited by the intense heat generated during compression, a
result of the Ideal Gas Law, PV = nRT; where P stands for the gas’ pressure, V represents the
volume of the compression chamber, n the mass of the gas, R the ideal gas constant, and T the
gasses’ temperature.
Recent technological advancements, however, allow for a work around to the variables of
the Ideal Gas Law, specifically the high temperatures created during compression (LightSail
Energy, 2014a). When an ambient temperature liquid is aerosolized in the chamber of a CAES
system during compression, the liquid absorbs the change in temperature. Once settled, this
liquid, and the associated thermal properties, can be removed from the chamber. The process can
then be repeated, allowing for high pressures to be reached without the previously associated
high temperatures (LightSail Energy, 2014). Where previous CAES systems reached
approximately 40% efficiency and were geographically and capacity limited, this new ambient
temperature design is achieving energy recovery rate upwards of 70% (ESA, 2014; LightSail
Energy, 2014).
Finding an economically viable form of energy storage has become increasingly
important as California’s Duck Curve is five years ahead of schedule (Blunden, 2015). This
unexpected advancement becomes progressively overbearing as the Cal ISO and CPUC both
based their energy storage pilots and funding for similar programs on the model’s timeline
(Blunden, 2015). Based on the accelerated nature of the Duck curve, investments in energy
storage, including increased government research and a streamlined energy storage
interconnection application process, should also be accelerated.

57
A Threatened Business Model
While deregulation and decoupling significantly impacted the electrical industry in short
order, distributed renewables can slowly erode away a utility’s customer base and establish a
positive feedback loop that escalates bottom line impacts over time. As previously discussed, in
jurisdictions that allow net metering, solar creates a cost shift from customers with solar panels
to those without. While this cost shift is currently minimal, an informed and active consumer
base, triggered by increased costs and a lower cost alternative, will create a downward cycle, as
outlined by Figure 20. In fact, Figure 20 comes straight from a publication by the Edison Electric
Institute (EEI), one of the oldest and most well regarded electricity industry organizations in the
U.S. EEI believes that distributed renewables represent a threat on the same scale as cell phones,
which bankrupted the telecommunications industry, or the digital camera, which all but
artistically replaced the use of film for photography (EEI, 2013). EEI is not alone in its
sentiment, financial services firm Barron’s downgraded corporate bonds for the entire electric
utility sector, citing competition from solar (Anerio, 2014). Although it is unlikely, at least in the
near term, that all utility customers will install on-site solar panels, the EEI suggests that in order
for utilities to survive they must disrupt the positive feedback loop’s cycle by shifting to a
service based model (EEI, 2013). Similar shifts include Kodak’s use of the disposable camera
and IBM’s movement towards consulting services.
As previously discussed, utilities in Germany have already began to adopt changes in
their business models. In addition to changes in the type and location of generation systems,
utilities should consider changes to how and where people use energy. Easy access to electricity
has become increasingly important as use of smart phones and electric cars escalates. Depending
on penetration rates, electric vehicles (EVs) could drastically change the shape of the demand
curve. If properly incentivized, EV owners could help to reduce if not eliminate DG mid-day

58
backflow (QER, 2015). Until recently, California utilities were not allowed to own EV charging
infrastructures (Trabish, 2015). Following a regulatory change, PG&E is proposing building
25,000 EV charging stations throughout its service territory (Trabish, 2015). EVs represent a
completely new class of customer, as the demand from charging a single EV is akin to that of 10
homes (ibid). Yet this load is mobile and can connect without warning to almost any part of the
grid. Do EVs represent another blow to utilities or the potential to avoid the cost shift positive
feedback cycle?
Forecasting
Astronomers were able to predict the occurance of the eclipse with significant foresight
and satelittle technology allowed for the path of lunar shadow to be plotted as it moved across
the Earth (Letendre, 2014). This same foresight accuracy and locational granularity does not
exist with regards to the weather. Weather patterns, including cloud location, translucence,
Figure 20 – A positive feedback loop of rising costs and fewer customers. Triggering the solar
cost shift threatens the financial integrity of the electricity utility industry (EEI, 2013).

59
speed, and direction, are influenced by conduction, convection, humidity and a slew of other
global forces, and are difficult to predict with significant accuracy. It is therefore equally difficult
for grid operators to predict with accuracy the amount of electricity that will be produced by
renewable systems. A miscalulation in the timing of a storm front, or the speed at which it will
pass through an area, significantly affects generation needs. Solar panels can vary their output by
as much as 90% over the course of just a few seconds (MIT, 2011, p. 55). Current hourly
forecasts provided by NOAA are both not accurate enough, nor at a time scale that is informative
(Letendre, 2014). Although private weather forecasting services do exist, they too could benefit
from increased accuracy, with a 16% mean absolute error for hour ahead forecasts (Letendre,
2014). On top of the need for this temporal accuracy, grid operators also need location
granularity. Centralized electricity systems are only moderately affected by the location of
demand; the narrowest location of consequence is the substation level, which has a bi-model
distribution of urban versus rural in regards to a service area size with a mean of 50 square miles
(QER, 2015). Because weather can vary significantly within just one square mile, sub-station
level weather predictions are not granular enough to provide insight into distributed generation
(Letendre, 2014). Pilot programs that combine numerical weather predictions with spacial cloud
imagery offer the potential for increased accuracy and granularity, but still require significant
development (Letendre, 2014).
Because of the extreme volatility and lack of accurate information regarding expected
generation, utility companies cannot rely on production from distributed renewables to service
grid demand. As a result, distributed energy generation is only marginally included in demand
forecasts (MIT, 2011). Rough calculations of the cost of this over production in California are
conservatively $296 Million annually and will continue to grow (EIA, 2014). This is on top of
60
the estimated 590,000 metric tons of carbon dioxide and other greenhouse gas emissions caused
by over production (EIA, 2014).
Recommendations
Among the following recommendations are those that can be implemented in the short
term, medium term and long term. Despite its delayed impact, the potential of this first
recommendation is so great that it should be pursued immediately. As highlighted by Figure 21,
investments in research and development in electrical infrastructure by investor owned utilities
(IOUs) have degraded. R&D budgets in the mid-2000s were half of what they had been just ten
years prior and the most recently available data represents that less than 1% of the industries’
revenues are spent on R&D (MIT, 2011, p. 11). While the bottom line impacts of these cuts in
R&D are enjoyed by short term decision makers, they negatively impact the industries’ potential,
and the success of future leaders to handle market shifts, such as the increased penetration of
distributed renewable energy. Both fortunately and unfortunately, a small portion of these R&D
investment gaps have been filled by research teams at the National Renewable Energy
Laboratory (NREL) and Lawrence Livermore National Labs (LLNL). However, the scale, focus
and risk profile of national laboratories is much different than that of private industry. As such,
these labs have not had the same impact as if private research efforts had been continued. It is
essential that the NREL and LLNL be allowed to continue their work, immune from fear of
budget cuts or experiments being interrupted by government shutdowns. These organizations
offer a critical independent voice and have outlined the technical and economic potential of
renewable resources, including power system models which allow utilities to test and visualize
the infrastructure impacts of projects before requests for procurement are even finalized (NREL,
2014a). Furthermore, utilities should reassess the financial perspectives that value the short term

61
benefits of budget cuts, when compared against the long term shareholder value created by past
developments projects. Furthermore, the foregone advantages of potential developments should
be calculated before any future cuts in R&D budgets are considered.
The need for leadership from governments and utilities continues and should include
streamlining the distribution grid interconnection application process. As outlined by Figure 22
the cost required to purchase, install and interconnect a residential rooftop solar system in the
United States is more than twice what it costs in Germany. Although a small difference in the
price of the physical panels exists, much of the cost variance is attributable to permitting, taxes
and company overhead (Woody, 2012). In fact, these “soft costs” account for over half of the
price of installing such a system in the U.S. (Woody, 2012). Temporal requirements mirror the
ratio of excessive financial burdens placed on U.S. potential residenital solar homeowners via
paperwork and applications required by local, county, utility and state oversight boards (ibid). In
Figure 21 – Research and Development investments by Investor Owned Utilities. Over ten years
R&D budgets were cut by over 50% (MIT, 2011, p. 11).

62
Germany, just one form, which fits on one piece of paper front and back is required; in
comparison, depending on the jurisdiction in the United States, more than 50 separate documents
must be completed and approved before interconnection approval is granted (Woody, 2012).
Nevermind the waste of paper or frustration completing so many forms causes, this red tape
levies significant opporutnity costs on potential solar homeowners. Where Germany has
streamlined the process, Hawaii has brought it to a halt by placing holds on all solar
interconnections (DBEDT, 2013). Although the Hawaiian electricity grid faces unique
limitations because of its isolated nature, barring additional interconnections is a short term
Figure 22 – Cost breakdown of installing residential rooftop systems in Germany compared to the
United States. “Soft costs” represent over 80% of the difference (Woody, 2012)

63
solution for a long term problem that requires investments in the distribution grid, discussed in
more detail below.
Further investment is required as society adapts legacy infrastructure, originally designed
to service centralized power distribution, to a bi-directional paradigm. The California Energy
Crisis outlined the need for redundant transmission lines in order to protect against market
manipulation or a less nefarious, but equally impactful, event. The Western Area Power
Administration (WAPA) commissioned an upgrade to Path 15, the congested transmission line
that served as a bottle neck during the energy crisis (WAPA, 2004). While resilience is
important, investments in infrastructure are often dismissed for more popular projects. Although
the corporate recovery from the Great Recession may be complete, Main Street’s recovery is
snarled by both un- and under- employment. With this in mind, few government programs can
offer better returns than investments in the country’s electrical networks. For every dollar spent,
as much as six dollars are returned in the form of increased efficiency and reliability, in addition
to the creation of 47,000 skilled jobs since 2012. (Silverstein, 2015). Even when projects have
enough local political capital, “fragmented and overlapping jurisdictions threaten to impede
development of the grid of the future” (DOE, 2015, p.3-22). It is for this reason that federal
guidance is required, especailly if new transmission lines are to cross state and province
boundaries.
While the transmission grid requires new paths and increased redundancy, the distributed
grid has been, and will continue to be, the segment of the electricity grid most impacted by the
co-location of generation with customer demand. As previously discussed, Germany has also
made significant investments in its distribution grids, and luckily for grid operators in Hawaii,
California, and the rest of the globe, the vast majority of these infrastructure upgrades, completed

64
in 2009, used mature and ubiquitous technologies (Wirth, 2015). Technologies that were not yet
commercially viable or cost competiivtive in 2009, but are today, such as local reactive power
provisions and tap changing transformers, could potentially result in a 50% cost savings when
compared to classical grid reinforcement techniques (Stetz et al., 2015, p. 55). Rather than
delaying distribution system upgrades until they are required, as is already the case in Hawaii,
grid operators should use a mix of mature and experimental technologies, testing and publically
reporting on the benefits and problems of each.
These investments should be paired with increased scrutiny regarding distributed
generating system interconnections. PV solar technology, although still developing, is mature
enough to no longer require universal and unfettered access to the electrical grid. Just like horse
drawn carriages, bicycles and mopeds are not allowed on highways, standards should be
developed in order to protect the electron highway, the elctricity grid (PBS, 2015). Such
interconnections can and do cause significant harm and reliability issues, including the potential
for a frequency shift to trip sensitive solar inverters and cause a snowball effect, disconnecting
massive amounts of renewable generation from the grid (MIT, 2011). Such an event would
require significant ramping of generation without warning and would likely lead to brown, if not
black, outs.
It is clear that neither the utilities nor the solar industry are independent enough of their
own bottom lines to create such standards. Instead, an independent body, likely compiled of
representatives from both industries as well as government regulators and advisors, should
conduct studies and pilots in order to determine actual impacts and only then establish a standard
for where, how, what type, and in what quantities distirbuted renewable systems can be
interconnected.

65
In addition to standards and independent arbiters, the electricity grid also needs increased
flexibility, specifically ramp-up and ramp-down speed and capacity capable of matching
predictable changes in renewable output. As has been previously discussed, legacy centralized
plants were designed for steady, continual output. While Germany’s base load capacity still
includes some nuclear facilities, these power plants have undergone upgrades allowing for
stepwise changes in generation, rather than all or nothing operation (GFNA, 2015). This
flexibility allowed the German electrical grid to successfully meet demand during a near total
solar eclipse (Wesoff, 2015).
While pumped hydro also played a critical role in the German electricity grid’s clean
encounter with the solar eclipse, there is little additional capacity available (Wesoff, 2015; ESA,
2013). In order to handle such an event in the future, when increased penetration of solar is
likely, utilities will need to make significant investments in energy storage. Compressed air
energy storage may have the most unmet potential, but rare earth metal batteries may offer
higher energy densities and round trip recovery efficiency. Similar to feed in tariffs, energy
storage research and investments should be technology agnostic, helping to reduce the potential
for inappropriate industry influence on regulators. Another key component of surviving the solar
eclipse was accurate forecasting regarding the path, intensity and duration of the event. Similar
forecasting accuracy is needed for every day weather events. Forecasts that accuratly represent
an actionable time frame, i.e. 15 minutes which would match the wholesale spot market time
frame, would help to increase the inclusion of DG into demand profiles and reduce over
generation and curtailment.
The next two recommendations strike at the core of the traditional electric utility model.
These recommendations’ institutionalization will be required due to the increasing threat of the
66
solar cost shift and resulting positive feedback cycle, both previously discussed. The first action
is a change in business model from a consumption based service territory company to an open
and enabling service provider. Again, U.S.-based utilities can look to Germany to determine the
potential pitfalls and successes of such a system. Acting as an enabler of renewables, even in the
short term, may help to dissuade the cry for Public Power Agencies in California and improve
relationships with regulators in Hawaii. In decoupled markets, like California, solar still
represents a cost shift for customers, but does not threaten the utility’s revenues. It is in these
areas that utilities should pursue rate reform to more accurately reflect the cost associated with
the bi-directional flow of electricity. This includes the separation of transmission and distribution
infrastructure use from generation charges, and the inclusion of demand or time of use charges
that highlight the temporal value of electricity. While this may complicate consumers’ bills, it
provides transparency into the complexity of operating a 24/7/365 system to cynical regulators,
wary investors and uninformed consumers. Alternatively, or perhaps as an intermediate step,
utilities can begin to collect fixed charges. This is already the case for customers of the leading
utility in Arizona, APS, where residential solar customers are now charged a $5 “grid access fee”
(Pyper, 2015). The resulting $60 annual expenditure seems to have little, if any, impact on the
decision by homeowners to install solar panels. Installations are actually up 10% since initiating
the charge and interconnection applications have doubled compared to the same period just a
year prior (Pyper, 2015).
Conclusion
With the price of solar and other distributed renewable energy generation technologies
continuing to fall, on-site consumer generation is forecasted to increase significantly. Electricity
grid operators in California and Hawaii have already been exposed to the initial impacts of solar
penetrations; government bodies and utilities across the country, and in fact the world, look to

67
these jurisdictions for guidance. Fortunately, the experiences of German utilities have provided
clear examples of how to handle significantly high levels of solar penetration using existing
technology, all while maintaining profitability and resiliency. In order to achieve this same
success, utilities and government regulators should begin to transition the electricity grid into a
bi-directional network by implementing the following changes:
1) Institutionalize operational and metric standards across the industry
2) Streamline interconnection costs and paperwork, while creating interconnection standards
3) Invest in transmission and distribution infrastructure, increasing resilience
4) Increase generation capacity flexibility through legacy base load power plant upgrades
5) Make technology agnostic investments in the energy storage industry
6) Improve distributed generation forecasting accuracy and granularity
7) Shift to an open and enabling service based business model
8) Modernize rate structures to reflect infrastructure costs and the temporal value of electricity
The need for reliable electricity and the momentum of distributed energy need not be
diametrically opposed forces. By making smart investments in infrastructure and improving the
accuracy and use of analytics, grid operators can transition towards a generation profile with
minimum greenhouse gas emissions and pollution. There were those that thought electricity
would never catch on due to the amount of effort required to traverse the nation with miles and
miles of expensive metal wires, yet look where we are today. Is the challenge of renewable
energy greater than the challenge of starting from nothing? With technology and knowledge
already in hand, societal will is all that is needed now.

68
References
Anerio, M. (2014 May 23). Barclays Downgrades Electric Utility Bonds, Sees Viable Solar
Competition. Barron’s. Retrieved from
http://blogs.barrons.com/incomeinvesting/2014/05/23/barclays-downgrades-electric-
utility-bonds-sees-viable-solar-competition/
Beckman, K. (2013 October 21). Exclusive: RWE sheds old business model, embraces
transition. Energy Post. Retrieved from http://www.energypost.eu/exclusive-rwe-sheds-
old-business-model-embraces-energy-transition/
Bloom Energy (2013 September 26). Bloom Energy Powers eBay's Utah Data Center [VIDEO].
Retrieved from https://youtu.be/TcRyUmxeyt8
Bloomberg New Energy Finance (BNEF). (2015a). Solar Price Index. Retrieved from
https://surveys.bnef.com/solar/
Bloomberg New Energy Finance (BNEF). (2015b, February 25). By the Time You Read This,
They've Slapped a Solar Panel on Your Roof. Retrieved from
http://www.bloomberg.com/news/articles/2015-02-25/in-the-time-it-takes-to-read-this-
story-another-solar-project-will-go-up
Blunden, J. (2015, January 27). The Case for Long-Duration Storage: Net Electricity Load in
Calif. Is 5 Years Ahead of Schedule. Greentech Media. Retrieved from
http://www.greentechmedia.com/articles/read/california-is-already-hitting-its-2020-duck-
curve
Botkin, D. B. & Keller, E. A. (2010). Environmental Science: Earth as a Living Planet. New
York: John Wiley and Sons, 8th Edition.
Bundesnetzagentur (German Federal Network Agency – GFNA). (2015 March 31). Facts and
information about EEG [English Translation]. Retrieved from
http://www.bundesnetzagentur.de/DE/Sachgebiete/ElektrizitaetundGas/Unternehmen_Ins
titutionen/ErneuerbareEnergien/Photovoltaik/DatenMeldgn_EEG-
VergSaetze/DatenMeldgn_EEG-VergSaetze_node.html
California Energy Commission (CEC). (2014, September 25). 2013 Total System Power in
Gigawatt Hours. California Energy Almanac. Retrieved from
http://energyalmanac.ca.gov/electricity/total_system_power.html
California Independent System Operator. (Cal ISO). (2013a, October). Company Information
and Facts. Retrieved from
http://www.caiso.com/Documents/CompanyInformation_Facts.pdf

69
California Independent System Operator. (Cal ISO). (2013b, October). What the duck curve tells
us about managing a green grid. Retrieved from
http://www.caiso.com/documents/flexibleresourceshelprenewables_fastfacts.pdf
California Independent System Operator. (Cal ISO). (2015a). Our Business: California ISO
Overview [VIDEO]. Retrieved from
http://www.caiso.com/about/Pages/OurBusiness/Default.aspx
California Independent System Operator. (Cal ISO). (2015b). Our Business: Understanding the
ISO – Opening Access. Retrieved from
http://www.caiso.com/about/Pages/OurBusiness/UnderstandingtheISO/Opening-
access.aspx
California Independent System Operator. (Cal ISO). (2015c). Our Business: Understanding the
ISO – Competition Brings Transparency. Retrieved from
http://www.caiso.com/about/Pages/OurBusiness/UnderstandingtheISO/Competition-
brings-transparency.aspx
California Independent System Operator. (Cal ISO). (2015d). Our Business: Understanding the
ISO – The ISO Grid. Retrieved from
http://www.caiso.com/about/Pages/OurBusiness/UnderstandingtheISO/The-ISO-
grid.aspx
California Independent System Operator. (Cal ISO). (2015e). Market & Operations: Market
Processes. Retrieved from http://www.caiso.com/market/Pages/MarketProcesses.aspx
California Public Utilities Commission (CPUC). (2015, February 10). Go Solar, Working Data
Sets. Retrieved from http://californiasolarstatistics.ca.gov/current_data_files/
California Public Utilities Commission (CPUC). (2014a, January 31). About the California Solar
Initiative. Retrieved from http://www.cpuc.ca.gov/puc/energy/solar/aboutsolar.htm
California Public Utilities Commission (CPUC). (2014b, June). California Solar Initiative
Annual Program Assessment. Retrieved from
http://www.cpuc.ca.gov/NR/rdonlyres/9FBE11AB-1120-4BE1-8C66-
8C239E36A641/0/CASolarInitiativeReport2014_0701.pdf
Cassingham, R. (2011, December 9). Rural Electrification, Meet the Rural Internet. Retrieved
from http://www.thisistrue.com/blog-rural_electrification_meet_the_rural_internet.html
Crews Jr., C. W. (1998, April 13). Electric Avenues: Why “Open Access” Can’t Compete. Cato
Institute. (1998; 301). Retrieved from http://www.cato.org/pubs/pas/pa-301.html
Database of State Incentives for Renewable Energy (DSIRE). (March, 2015). Renewable
Portfolio Standards. N.C. Clean Energy Technology Center. Retrieved from
http://www.dsireusa.org/resources/detailed-summary-maps/

70
Department of Energy (DOE). (2014, November 20). DOE Global Energy Storage Database.
Sandia National Laboratories. Retrieved from
http://www.energystorageexchange.org/projects
Department of Energy (DOE). (2015 April). Quadrennial Energy Review: Energy Transmission,
Storage, and Distribution Infrastructure. Retrieved from
http://energy.gov/sites/prod/files/2015/04/f22/QER-ALL%20FINAL_0.pdf
Edison Electric Institute (EEI). (2013, January). Disruptive Challenges: Financial Implications
and Strategic Responses to a Changing Retail Electric Business. Retrieved from
http://www.eei.org/ourissues/finance/Documents/disruptivechallenges.pdf
Electric Power Research Institute (EPRI). (2010, December 23). Electricity Energy Storage
Technology Options. Retrieved from
http://www.epri.com/abstracts/Pages/ProductAbstract.aspx?ProductId=00000000000102
0676
Energy Information Administration (EIA). (1979). Annual Report to Congress. Retrieved from
http://www.eia.gov/forecasts/archive/aeo79/pdf/0173(79)3.pdf
Energy Information Administration (EIA). (2000, October). The Changing Structure of the
Electric Power Industry 2000: An Update. Retrieved from
http://webapp1.dlib.indiana.edu/virtual_disk_library/index.cgi/4265704/FID1578/pdf/ele
ctric/056200.pdf
Energy Information Administration (EIA). (2014, May). State Electricity Profiles – CA.
Retrieved from http://www.eia.gov/electricity/state/california/.
Energy Information Administration (EIA). (2015a, March 26). Electric Power Sector Energy
Consumption. Retrieved from
http://www.eia.doe.gov/totalenergy/data/annual/index.cfm#consumption
Energy Information Administration (EIA). (2015b, April 14). Annual Energy Outlook 2015.
Retrieved from http://www.eia.gov/forecasts/aeo/pdf/0383(2015).pdf
Energy Storage Association (ESA). (2014). Compressed Air Energy Storage (CAES). Retrieved
from http://energystorage.org/compressed-air-energy-storage-caes
Energy + Environmental Economic (E3). (2013, September 26). Draft California Net Energy
Metering Evaluation. Retrieved from http://www.cpuc.ca.gov/NR/rdonlyres/BD9EAD36-
7648-430B-A692-8760FA186861/0/CPUCNEMDraftReport92613.pdf
71
Eskenazi, J. (2013, April 10). Who has the Power over Your Power? SF Weekly. Retrieved from
http://www.sfweekly.com/2013-04-10/news/puc-cleanpowersf-pg-e-renewable-energy-
credits/
Farrell, J. (2010, Nov 10). Hawaii Feed-in Tariff Pays Less Than Net Metering for Solar PV (and
that’s ok). Institute for Local Self Reliance (ILSR). Retrieved from http://ilsr.org/hawaii-
feed-tariff-pays-less-net-metering-solar-pv-and-thats-ok/
Germany Trade & Invest (GTAI). (2015 March 11). Germany’s Renewable Energy Revolution
[VIDEO]. Retrieved from https://www.youtube.com/watch?t=63&v=EvceQ0T80Zc
Hawaiian Electric Company (HECO). (2013). Average Electricity Prices for Hawaiian Electric,
Maui Electric, and Hawaii Electric Light Company. Retrieved from
http://www.heco.com/heco/Residential/Electric-Rates/Average-Electricity-Prices-for-
Hawaiian-Electric,-Maui-Electric,-and-Hawaii-Electric-Light-Company
Hawaiian Electric Company (HECO). (2014a, January). Presentation by Dora Nakafuji, Director
of Renewable Energy Planning . Retrieved from
http://www.greentechmedia.com/articles/read/hawaiis-solar-grid-landscape-and-the-
nessie-curve
Hawaiian Electric Company (HECO). (2014b, December 22). Docket No. 2013-0194 –
Investigation to Reexamine the Feed-in Tariff (“FIT”) Program. Retrieved from
http://www.heco.com/vcmcontent/GenerationBid/Files/Dkt%202013-0194%202021-12-
22%20HECO%20Ltr%20to%20PUC%20re%20FIT%20Tariff%20Compliance.pdf
Hawaii Public Utilities Commission (HPUC). (2014, April). Exhibit A: Commission’s
Inclinations on the Future of Hawaii’s Electric Utilities. Retrieved from
http://puc.hawaii.gov/wp-content/uploads/2014/04/Commissions-Inclinations.pdf
Howarth, D. & Monsen, B. (2014 December). Renewable Energy Faces Daytime Curtailment in
California. North American WindPower Magazine. 11(12).
Institute for Energy Research (IER). (n.d.) Energy Regulations in the States: A Wake-up Call.
Retrieved from http://instituteforenergyresearch.org/media/pdf/statereport.pdf
Johnson, G. (2011, March 31). Are Solar Power Incentives A Nasty Regressive Tax On The
Poor/Misinformed? Forbes. http://www.forbes.com/sites/gordonjohnson/2011/03/31/are-
solar-power-incentives-a-nasty-regressive-tax-on-the-poormisinformed/
Karnitschnig, M. (2014 August 26). Germany's Expensive Gamble on Renewable Energy. The
Wall Street Journal. Retrieved from http://www.wsj.com/articles/germanys-expensive-
gamble-on-renewable-energy-1409106602
LaMonica, M. (2014, August 26). Responsive Electricity Pricing Is the Missing Piece of a
Distributed, Reactive Grid. Greentech Media. Retrieved from

72
http://www.greentechmedia.com/articles/read/responsive-electricity-pricing-still-a-
missing-piece-in-distributed-energy
Letendre, S. (2014, March). Predicting Solar Power Production: Irradiance Forecasting Models,
Application and Future Prospects. Solar Electric Power Association (SEPA). Washington
DC.
LightSail Energy. (2014a). Technology. Retrieved from http://lightsail.com/
Massachusetts Institute of Technology (MIT). (2011). The Future of the Electric Grid. Retrieved
from https://mitei.mit.edu/system/files/Electric_Grid_Full_Report.pdf
Morison, R. & Mengewein, J. (2014, January 3). German Power Costs Seen Dropping for Fourth
Year: Energy. BloombergBusiness. Retrieved from
http://www.bloomberg.com/news/articles/2014-01-03/german-power-costs-seen-
dropping-for-fourth-year-energy
National Academy of Engineering (NAE). (2015). Greatest Engineering Achievements of the
20th Century: Electrification. Retrieved from http://www.greatachievements.org/
National Broadcasting Company (NBC). (1965, November 9). Nightly News Special Report
[VIDEO]. Retrieved from https://youtu.be/o47VVM5riaQ
National Renewable Energy Laboratory (NREL). (2010, January). The Role of Energy Storage
with Renewable Electricity Generation. Retrieved from
http://www.nrel.gov/docs/fy10osti/47187.pdf
National Renewable Energy Laboratory (NREL). (2013, June). Hawaii Solar Integration Study.
Retrieved from http://www.nrel.gov/docs/fy13osti/57215.pdf
National Renewable Energy Laboratory (NREL). (2015, April 23). Transparent Cost Database.
Open EI. Retrieved from http://en.openei.org/wiki/Transparent_Cost_Database
National Renewable Energy Laboratory (NREL). (2014 March). Wind and Solar Energy
Curtailment: Experience and Practices in the United States. Retrieved from
http://www.nrel.gov/docs/fy14osti/60983.pdf
National Renewable Energy Laboratory (NREL). (2014 September 14). Eastern Renewable
Generation Integration Study Overview. Retrieved from
http://www.nrel.gov/electricity/transmission/eastern_renewable.html
Nicola, S. & Landberg, R. (2015, April 12). Germany Proves Life With Less Fossil Fuel Getting
Easier. BloombergBusiness. Retrieved from
http://www.bloomberg.com/news/articles/2015-04-12/germany-proves-life-with-less-
fossil-fuel-getting-easier

73
North American Electric Reliability Corporation (NERC). (2013). About NERC: Interconnection
Map. Retrieved from http://www.nerc.com/AboutNERC/keyplayers/Documents/NERC_
Interconnections_ Color_072512.jpg
Pacific Gas and Electric (PG&E). (2014). Corporate Responsibility and Sustainability Report,
2014. Retrieved from
http://www.pgecorp.com/corp_responsibility/reports/2014/index.jsp
Paulos, B. (2014, Feb 13). Postcard From the Grid’s Future: Hawaii as a Solar Laboratory
Greentech Media. Retrieved from
http://www.greentechmedia.com/articles/read/postcard-from-the-grids-future-hawaii-as-
a-solar-laboratory
Perlin, J. (2013, September 10). Let It Shine: The 6,000-Year Story of Solar Energy. New World
Library. Oakland, CA.
Public Broadcasting Station (PBS). (2015, April, 11). Gridlocked by the power grid: Why
Hawaii’s solar energy industry is at a crossroads. PBS News Hour. Retrieved from
http://www.pbs.org/newshour/bb/gridlocked-power-grid-hawaiis-solar-energy-industry-
crossroads/
Public Broadcasting Station (PBS). (2001, June 5). Blackout. Frontline. Retrieved from
http://www.pbs.org/wgbh/pages/frontline/shows/blackout/
Pyper, J. (2015, April 14). NRG Energy Exec Questions Why Solar Is the ‘Bad Boy,’ While
Efficiency Is Good. Greentech Media. Retrieved from
http://www.greentechmedia.com/articles/read/NRG-Executive-questions-why-solar-is-
the-bad-boy
Schröder, C. (2012, August 16). Energy Revolution Hiccups: Grid Instability Has Industry
Scrambling for Solutions. Spiegal. Retrieved from
http://www.spiegel.de/international/germany/instability-in-power-grid-comes-at-high-
cost-for-german-industry-a-850419.html
Shahan, Z. (2013, February 9). 10 Huge Lessons We’ve Learned From Solar Power Success In
Germany. Clean Technica. Retrieved from
http://cleantechnica.com/2013/02/09/germany-solar-power-lessons/
Shahan, Z. (2013, August 19). Germany Breaks Monthly Solar Generation Record, ~6.5 Times
More Than US Best. Clean Technica. Retrieved from
http://cleantechnica.com/2013/08/19/germany-breaks-monthly-solar-generation-record/
Shimogawa, D. (2015, April 24). $38B in capital spending needed to reach Hawaii's original
renewable energy goals. Pacific Business News. Retrieved from
http://www.bizjournals.com/pacific/news/2015/04/24/38b-in-capital-spending-needed-to-
reach-hawaiis.html

74
Silverstein, K. (2015 April 13). Want More Wind And Solar Energy? Invest A Lot More In
The Grid. Forbes. Retrieved from
http://www.forbes.com/sites/kensilverstein/2015/04/13/want-more-wind-and-solar-
energy-invest-a-lot-more-in-the-grid/
St. John, J. (2013a, November 13). California Closes In on Smart Solar Inverter Rules.
Greentech Media. Retrieved from
http://www.greentechmedia.com/articles/read/california-closes-in-on-smart-solar-
inverter-rules
St. John, J. (2014a, January 28). Charting Hawaii’s Spectacular Solar Growth. Greentech Media.
Retrieved from http://www.greentechmedia.com/articles/read/Charting-Hawaiis-
Spectacular-Solar-Growth
St. John, J. (2014b, February 10). Hawaii’s Solar-Grid Landscape and the ‘Nessie Curve’.
Greentech Media. Retrieved from http://www.greentechmedia.com/articles/read/hawaiis-
solar-grid-landscape-and-the-nessie-curve
St. John, J. (2014c, September 9). 5 Key Proposals for New York’s Grid Transformation.
Greentech Media. Retrieved from http://www.greentechmedia.com/articles/read/5-key-
proposals-for-new-yorks-grid-transformation
State of Hawaii Department of Business, Economic Development and Tourism (DBEDT). (2013
June). Hawaii State Energy Office. Hawaii Energy Facts & Figures. Retrieved from
http://energy.hawaii.gov/wp-content/uploads/2011/10/FF_June2013_R2.pdf
Stetz, T., Appen, J., Niedermeyer, F., Scheibner, G., Sikora R. & Braun, M. (2015, February 24).
Twilight of the Grids. IEEE Power & Energy Magazine. 13(2).
Sustainable Business (2014, January 28). US Solar Industry Employs More Than Coal, Gas
Industries Combined. Retrieved from
http://www.sustainablebusiness.com/index.cfm/go/news.display/id/25475
Taneja, J., Smith, V., Culler, D. & Rosenberg, C. (2013). A Comparative Study of High
Renewables Penetration Electricity Grids. University of California, Berkeley. Retrieved
from http://www.cs.berkeley.edu/~vsmith/docs/renewables_sgc_2013.pdf
Trabish, H. (2015, February 12) Inside the PG&E proposal to build 25,000 EV charging stations.
Utility Dive. Retrieved from http://www.utilitydive.com/news/inside-the-pge-proposal-to-
build-25000-ev-charging-stations/363553/
United States Census Bureau (USCB). (2014). State and County QuickFacts. Retrieved from
http://www.census.gov/quickfacts/

75
Weare, C. (2003). The California Electricity Crisis: Causes and Policy Options. Public Policy
Institute Of California. Retrieved from
http://www.ppic.org/content/pubs/report/R_103CWR.pdf
Western Area Power Administration (WAPA) (2004, June 1). Path 15 Upgrade Project.
Retrieved from http://www.wapa.gov/sn/ops/transmission/path15/factSheet.pdf
Wesoff, E. (2014, February 10). How Much Solar Can HECO and Oahu’s Grid Really Handle?
Greentech Media. Retrieved from http://www.greentechmedia.com/articles/read/How-
Much-Solar-Can-HECO-and-Oahus-Grid-Really-Handle
Wesoff, E. (2015, March 20). German and European Power Grids, Civilization Intact Following
Solar Eclipse. Greentech Media. http://www.greentechmedia.com/articles/read/German-
and-European-Power-Grids-Civilization-Intact-Following-Solar-Eclips
Woody, T. (2012, July 5). Cut The Price Of Solar In Half By Cutting Red Tape. Forbes.
Retrieved from http://www.forbes.com/sites/toddwoody/2012/07/05/cut-the-price-of-
solar-in-half-by-cutting-red-tape/
World Bank. (2015). Country Data – Germany. Retrieved from
http://data.worldbank.org/country/germany
Wirth, H. (2015, January 7). Recent Facts about Photovoltaics in Germany. Fraunhofer ISE.
Retrieved from http://www.ise.fraunhofer.de/en/publications/veroeffentlichungen-pdf-
dateien-en/studien-und-konzeptpapiere/recent-facts-about-photovoltaics-in-germany.pdf