dolphin master issuer b.v. monthly portfolio and ......a4 dolphin 2015-1 a2 dolphin 2015-1 a3...
TRANSCRIPT
1 / 43
[email protected] / www.abnamro.com/ir
www.dutchsecuritisation.nl Report Version 1.2 - June 2016
Reporting period: 1 April 2020 - 30 April 2020
Reporting Date: 30 April 2020
AMOUNTS IN EURO
ABN AMRO Hypotheken Groep B.V.
Monthly Portfolio and Performance Report
Dolphin Master Issuer B.V.
2 / 43
Page356789
10114143Contact Information
This Portfolio and Performance Report has been prepared based on the Template Portfolio and Performance Report as published by the Dutch Securitisation Association and applicable as at the time of this report. The Template Portfolio and Performance Report has been recognised by PCS as part of the Domestic Market Guideline applicable to Dutch RMBS transactions.
Foreclosure Statistics - TotalForeclosure Statistics - NHG LoansForeclosure Statistics - Non NHG Loans
Performance RatiosStratification TablesGlossary
Programme Specific Information
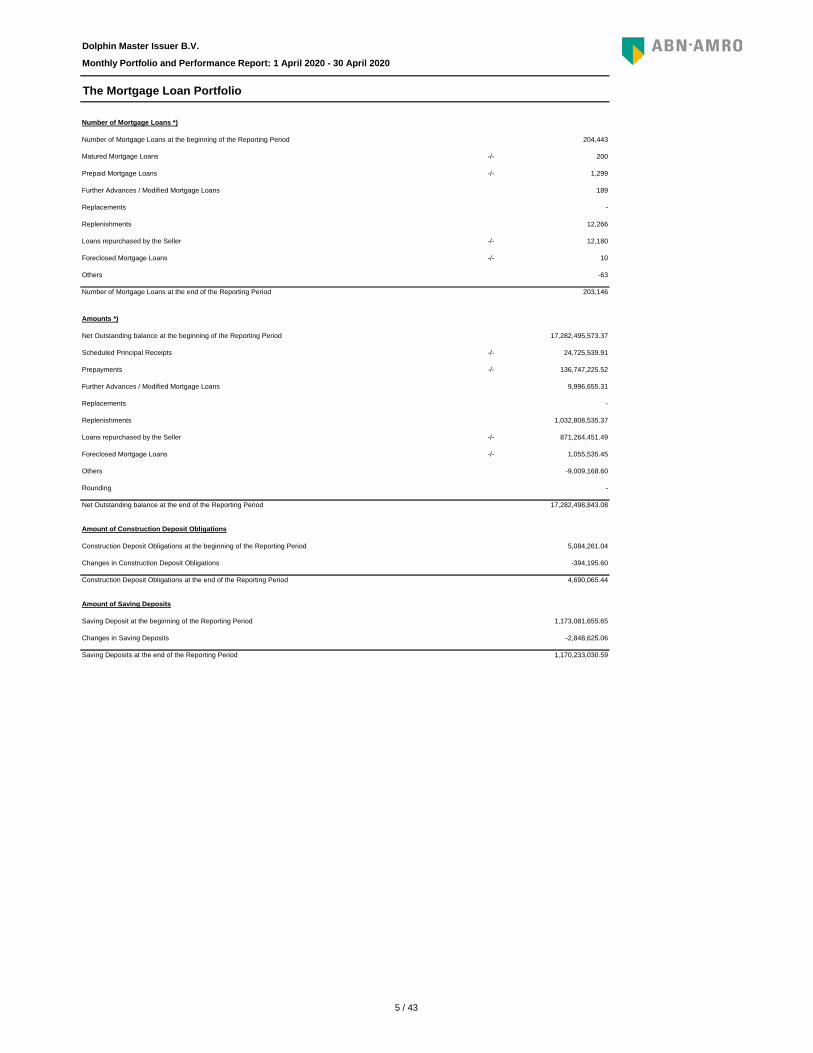
The Mortgage Loan Portfolio
Dolphin Master Issuer B.V.
Monthly Portfolio and Performance Report: 1 April 2020 - 30 April 2020
Table of Contents
Key Dates
3 / 43
Dolphin Master Issuer B.V.
Monthly Portfolio and Performance Report: 1 April 2020 - 30 April 2020
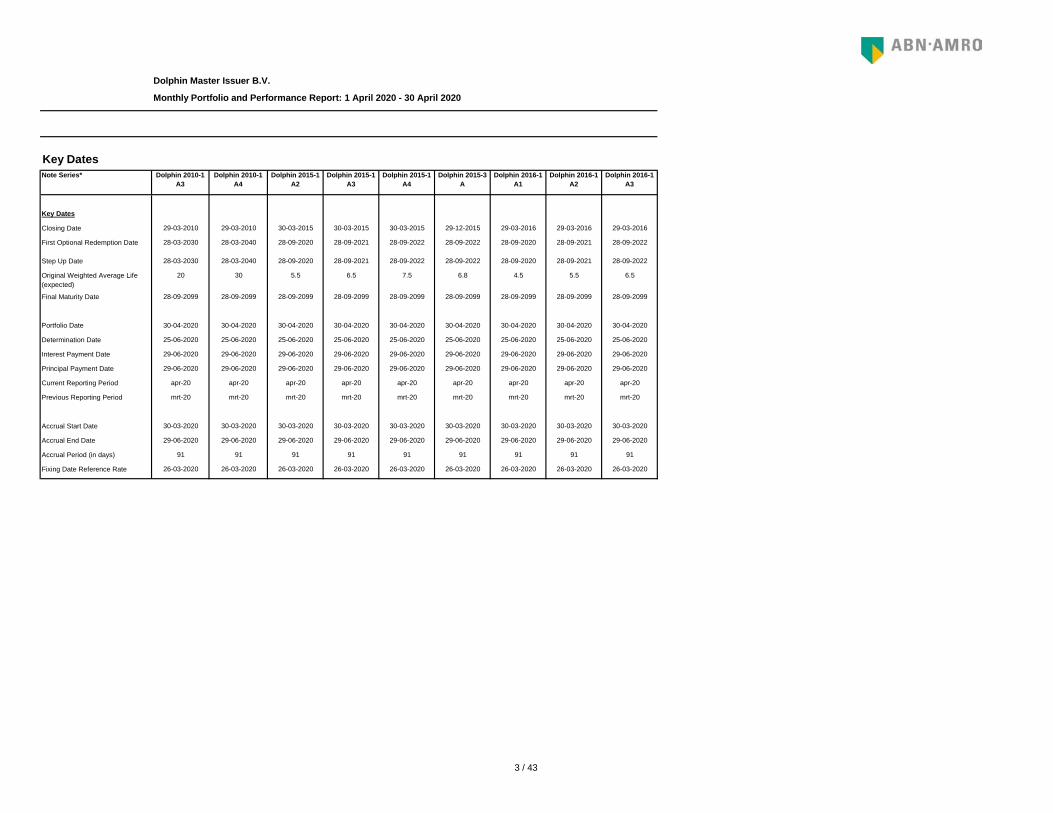
Key DatesNote Series* Dolphin 2010-1
A3Dolphin 2010-1
A4Dolphin 2015-1
A2Dolphin 2015-1
A3Dolphin 2015-1
A4Dolphin 2015-3
ADolphin 2016-1
A1Dolphin 2016-1
A2Dolphin 2016-1
A3
Key Dates
Closing Date 29-03-2010 29-03-2010 30-03-2015 30-03-2015 30-03-2015 29-12-2015 29-03-2016 29-03-2016 29-03-2016
First Optional Redemption Date 28-03-2030 28-03-2040 28-09-2020 28-09-2021 28-09-2022 28-09-2022 28-09-2020 28-09-2021 28-09-2022
Step Up Date 28-03-2030 28-03-2040 28-09-2020 28-09-2021 28-09-2022 28-09-2022 28-09-2020 28-09-2021 28-09-2022
Original Weighted Average Life (expected)
20 30 5.5 6.5 7.5 6.8 4.5 5.5 6.5
Final Maturity Date 28-09-2099 28-09-2099 28-09-2099 28-09-2099 28-09-2099 28-09-2099 28-09-2099 28-09-2099 28-09-2099
Portfolio Date 30-04-2020 30-04-2020 30-04-2020 30-04-2020 30-04-2020 30-04-2020 30-04-2020 30-04-2020 30-04-2020
Determination Date 25-06-2020 25-06-2020 25-06-2020 25-06-2020 25-06-2020 25-06-2020 25-06-2020 25-06-2020 25-06-2020
Interest Payment Date 29-06-2020 29-06-2020 29-06-2020 29-06-2020 29-06-2020 29-06-2020 29-06-2020 29-06-2020 29-06-2020
Principal Payment Date 29-06-2020 29-06-2020 29-06-2020 29-06-2020 29-06-2020 29-06-2020 29-06-2020 29-06-2020 29-06-2020
Current Reporting Period apr-20 apr-20 apr-20 apr-20 apr-20 apr-20 apr-20 apr-20 apr-20
Previous Reporting Period mrt-20 mrt-20 mrt-20 mrt-20 mrt-20 mrt-20 mrt-20 mrt-20 mrt-20
Accrual Start Date 30-03-2020 30-03-2020 30-03-2020 30-03-2020 30-03-2020 30-03-2020 30-03-2020 30-03-2020 30-03-2020
Accrual End Date 29-06-2020 29-06-2020 29-06-2020 29-06-2020 29-06-2020 29-06-2020 29-06-2020 29-06-2020 29-06-2020
Accrual Period (in days) 91 91 91 91 91 91 91 91 91
Fixing Date Reference Rate 26-03-2020 26-03-2020 26-03-2020 26-03-2020 26-03-2020 26-03-2020 26-03-2020 26-03-2020 26-03-2020

4 / 43
Dolphin Master Issuer B.V.
Monthly Portfolio and Performance Report: 1 April 2020 - 30 April 2020
Dolphin 2016-1 A4
Dolphin 2017-1 B
Dolphin 2017-1 C
Dolphin 2017-1 D
Dolphin 2017-1 E
29-03-2016 28-09-2017 28-09-2017 28-09-2017 28-09-2017
28-09-2023 28-09-2022 28-09-2022 28-09-2022 28-09-2022
28-09-2023 28-09-2022 28-09-2022 28-09-2022 28-09-2022
7.5 5 5 5 5
28-09-2099 28-09-2099 28-09-2099 28-09-2099 28-09-2099
30-04-2020 30-04-2020 30-04-2020 30-04-2020 30-04-2020
25-06-2020 25-06-2020 25-06-2020 25-06-2020 25-06-2020
29-06-2020 29-06-2020 29-06-2020 29-06-2020 29-06-2020
29-06-2020 29-06-2020 29-06-2020 29-06-2020 29-06-2020
apr-20 apr-20 apr-20 apr-20 apr-20
mrt-20 mrt-20 mrt-20 mrt-20 mrt-20
30-03-2020 30-03-2020 30-03-2020 30-03-2020 30-03-2020
29-06-2020 29-06-2020 29-06-2020 29-06-2020 29-06-2020
91 91 91 91 91
26-03-2020 26-03-2020 26-03-2020 26-03-2020 26-03-2020
5 / 43
Number of Mortgage Loans *)
Number of Mortgage Loans at the beginning of the Reporting Period
Matured Mortgage Loans
Prepaid Mortgage Loans
Further Advances / Modified Mortgage Loans
Replacements
Replenishments
Loans repurchased by the Seller
Foreclosed Mortgage Loans
Others
Number of Mortgage Loans at the end of the Reporting Period
Amounts *)
Net Outstanding balance at the beginning of the Reporting Period
Scheduled Principal Receipts
Prepayments
Further Advances / Modified Mortgage Loans
Replacements
Replenishments
Loans repurchased by the Seller
Foreclosed Mortgage Loans
Others
Rounding
Net Outstanding balance at the end of the Reporting Period
Amount of Construction Deposit Obligations
Construction Deposit Obligations at the beginning of the Reporting Period
Changes in Construction Deposit Obligations
Construction Deposit Obligations at the end of the Reporting Period
Amount of Saving Deposits
Saving Deposit at the beginning of the Reporting Period
Changes in Saving Deposits
Saving Deposits at the end of the Reporting Period
4,690,065.44
1,173,081,655.65
-2,848,625.06
1,170,233,030.59
-
17,282,498,843.08
5,084,261.04
-394,195.60
9,996,655.31
-
1,032,808,535.37
-/- 871,264,451.49
-/- 1,055,535.45
-9,009,168.60
203,146
17,282,495,573.37
-/- 24,725,539.91
-/- 136,747,225.52
189
-
12,266
-/- 12,180
-/- 10
-63
Dolphin Master Issuer B.V.
Monthly Portfolio and Performance Report: 1 April 2020 - 30 April 2020
The Mortgage Loan Portfolio
204,443
-/- 200
-/- 1,299

6 / 43
Dolphin Master Issuer B.V.
Monthly Portfolio and Performance Report: 1 April 2020 - 30 April 2020
Foreclosure Statistics - Total
Previous Period Current PeriodForeclosures reporting periodically
Number of Mortgage Loans foreclosed during the Reporting Period 11 10
Net principal balance of Mortgage Loans foreclosed during the Reporting Period 569,919.45 1,055,535.45
Recoveries from sales on Foreclosed Mortgage Loans during the Reporting Period -/- 436,022.58 954,157.07
Total amount of losses on Foreclosed Mortgage Loans during the Reporting Period 133,896.87 101,378.38
- -
Post-Foreclosure recoveries on Foreclosed Mortgage Loans during the Reporting Period -/- - -
Losses minus recoveries during the Reporting Period 133,896.87 101,378.38
Average loss severity during the Reporting Period 23.49% 9.60%
Foreclosures since Closing Date
Number of Mortgage Loans foreclosed since the Closing Date 3,510 3,520
Net principal balance of Mortgage Loans foreclosed since the Closing Date 630,760,593.27 631,816,128.72
Recoveries from sales on Foreclosed Mortgage Loans since the Closing Date -/- 457,812,269.57 458,766,426.64
Total amount of losses on Mortgage Loans foreclosed since the Closing Date 172,948,323.70 173,049,702.08
- -
Post-Foreclosure recoveries on Mortgage Loans Foreclosed since the Closing Date -/- 1,502,547.58 1,502,547.58
Losses minus recoveries since the Closing Date 171,445,776.12 171,547,154.50
Average loss severity since the Closing Date 27.18% 27.15%
Foreclosures
Number of Mortgage Loans in foreclosure at the beginning of the Reporting Period N.A. N.A.
Number of new Mortgage Loans in foreclosure during the Reporting Period N.A. N.A.
Number of Mortgage Loans for which foreclosure was completed in the Reporting Period -/- N.A. N.A.
Number of Mortgage Loans in foreclosure at the end of the Reporting Period N.A. N.A.
Net principal balance of Mortgage Loans in foreclosure at the beginning of the Reporting Period N.A. N.A.
Net principal balance of new Mortgage Loans in foreclosure during the Reporting Period N.A. N.A.
Net principal balance of Mortgage Loans for which foreclosure was completed during the Reporting Period -/- N.A. N.A.
Net principal balance of Mortgage Loans in foreclosure at the end of the Reporting Period N.A. N.A.
Constant Default Rate
Constant Default Rate current month N.A.
Constant Default Rate 3-month average N.A.
Constant Default Rate 6-month average N.A.
Constant Default Rate 12-month average N.A.
Constant Default Rate to date N.A. N.A.
N.A.
N.A.
N.A.
N.A.

7 / 43
Foreclosure Statistics - NHG Loans
Foreclosures reporting periodically
Number of NHG Loans foreclosed during the Reporting Period
Net principal balance of NHG Loans foreclosed during the Reporting Period
Recoveries from sales on Foreclosed NHG Loans during the Reporting Period -/-
Total amount of losses on Foreclosed NHG Loans during the Reporting Period
Post-foreclosure recoveries on foreclosed NHG loans during the Reporting Period -/-
Losses minus recoveries during the Reporting Period
Average loss severity NHG Loans during the Reporting Period
Foreclosures since Closing Date
Number of Mortgage Loans foreclosed since the Closing Date
Net principal balance of NHG Loans foreclosed since the Closing Date
Recoveries from sales on foreclosed NHG Loans since the Closing Date -/-
Total amount of losses on NHG Loans foreclosed since the Closing Date
Post-Foreclosure recoveries on NHG Loans foreclosed since the Closing Date -/-
Losses minus recoveries since the Closing Date
Average loss severity NHG Loans since the Closing Date
Foreclosures
Number of NHG Loans in foreclosure at the beginning of the Reporting Period
Number of new NHG Loans in foreclosure during the Reporting Period
Number of NHG Loans for which foreclosure was completed in the Reporting Period -/-
Number of NHG Loans in foreclosure at the end of the Reporting Period
Net principal balance of NHG Loans in foreclosure at the beginning of the Reporting Period
Net principal balance of new NHG Loans in foreclosure during the Reporting Period
Net principal balance of NHG Loans for which foreclosure was completed during the Reporting Period -/-
Net principal balance of NHG Loans in foreclosure at the end of the Reporting Period
WEW Claims periodicallyNumber of claims to WEW at the beginning of the Reporting Period
New claims to WEW during the Reporting Period
Finalised claims with WEW during the Reporting Period -/-
Number of claims to WEW at the end of the Reporting Period
Notional amount of claims to WEW at the beginning of the Reporting Period
Notional amount of new claims to WEW during the Reporting Period
Notional amount of finalised claims with WEW during the Reporting Period -/-
Notional amount of claims to WEW at the end of the Reporting Period
Notional amount of finalised claims with WEW during the Reporting Period
Amount paid out by WEW during the Reporting Period
Payout ratio WEW during the Reporting Period
WEW Claims since Closing
Number of finalised claims to WEW since the Closing DateAmount of finalised claims with WEW since the Closing DateAmount paid out by WEW since the Closing Date -/-Payout ratio WEW since the Closing Date
Reasons for non payout as percentage of non recovered claim amount
Amount of finalised claims with WEW since the Closing Date
Amount paid out by WEW since the Closing Date -/-
Non recovered amount of WEW since the Closing Date
Insufficient guaranteed amount due to decrease with annuity amount
Loan does not comply with NHG criteria at origination
Other administrative reasons
Other
0.00% 0.00%
0.00% 0.00%
0.00% 0.00%
0.00% 0.00%
- -
- -
- -
- -
- - - -
- -
- -
- -
- -
- -
- -
- -
- -
- -
- -
- -
- -
- -
- -
- -
- -
- -
- -
- -
- -
- -
- -
- -
- -
- -
- -
- -
- -
- -
- -
Dolphin Master Issuer B.V.
Monthly Portfolio and Performance Report: 1 April 2020 - 30 April 2020
Previous Period Current Period
- -
- -
- -
- -

8 / 43
Dolphin Master Issuer B.V.
Monthly Portfolio and Performance Report: 1 April 2020 - 30 April 2020
Foreclosure Statistics - Non NHG Loans
Previous PeriodForeclosures reporting periodically
Number of Non NHG Loans foreclosed during the Reporting Period 11
Net principal balance of Non NHG Loans foreclosed during the Reporting Period 569,919.45
Recoveries from sales on Foreclosed Non NHG Loans during the Reporting Period -/- 436,022.58
Total amount of losses on Foreclosed Non NHG Loans during the Reporting Period 133,896.87
Post-foreclosure recoveries on Foreclosed Non NHG Loans during the Reporting Period -/- -
Losses minus recoveries during the Reporting Period 133,896.87
Average loss severity Non NHG Loans during the Reporting Period 23.49%
Foreclosures since Closing Date
Number of Mortgage Loans foreclosed since the Closing Date 3,510
Net principal balance of Non NHG loans foreclosed since the Closing Date 630,760,593.27
Recoveries from sales on foreclosed Non NHG Loans since the Closing Date -/- 457,812,269.57
Total amount of losses on Non NHG Loans foreclosed since the Closing Date 172,948,323.70
Post-Foreclosure recoveries on Non NHG Loans foreclosed since the Closing Date -/- 1,502,547.58
Losses minus recoveries since the Closing Date 171,445,776.12
Average loss severity Non NHG Loans since the Closing Date 27.18%
Foreclosures
Number of Non NHG Loans in foreclosure at the beginning of the Reporting Period N.A. N.A.
Number of new Non NHG Loans in foreclosure during the Reporting Period N.A. N.A.
Number of Non NHG Loans for which foreclosure was completed in the Reporting Period -/- N.A. N.A.
Number of Non NHG Loans in foreclosure at the end of the Reporting Period N.A. N.A.
Net principal balance of Non NHG Loans in foreclosure at the beginning of the Reporting Period N.A. N.A.
Net principal balance of new Non NHG Loans in foreclosure during the Reporting Period N.A. N.A.
Net principal balance of Non NHG Loans for which foreclosure was completed during the Reporting Period -/- N.A. N.A.
Net principal balance of Non NHG Loans in foreclosure at the end of the Reporting Period N.A. N.A.
27.15%
1,502,547.58
171,547,154.50
458,766,426.64
173,049,702.08
9.60%
631,816,128.72
3,520
-
101,378.38
1,055,535.45
954,157.07
101,378.38
10
Current Period

9 / 43
No transaction specific information for this reporting period.
Programme Specific Information
Dolphin Master Issuer B.V.
Monthly Portfolio and Performance Report: 1 April 2020 - 30 April 2020

10 / 43
Constant Prepayment Rate (CPR)
Annualized Life CPR 7.38% 7.40%
Annualized 1-month average CPR 9.17% 9.09%
Annualized 3-month average CPR 8.67% 8.68%
Annualized 6-month average CPR 9.54% 9.61%
Annualized 12-month average CPR 8.60% 8.76%
Principal Payment Rate (PPR)
Annualized Life PPR 1.44% 1.44%
Annualized 1-month average PPR 1.71% 1.70%
Annualized 3-month average PPR 1.73% 1.70%
Annualized 6-month average PPR 1.78% 1.81%
Annualized 12-month average PPR 1.71% 1.72%
Payment Ratio
Periodic Payment Ratio N.A. N.A.
Dolphin Master Issuer B.V.
Monthly Portfolio and Performance Report: 1 April 2020 - 30 April 2020
Performance Ratios
Previous Period Current Period
11 / 43
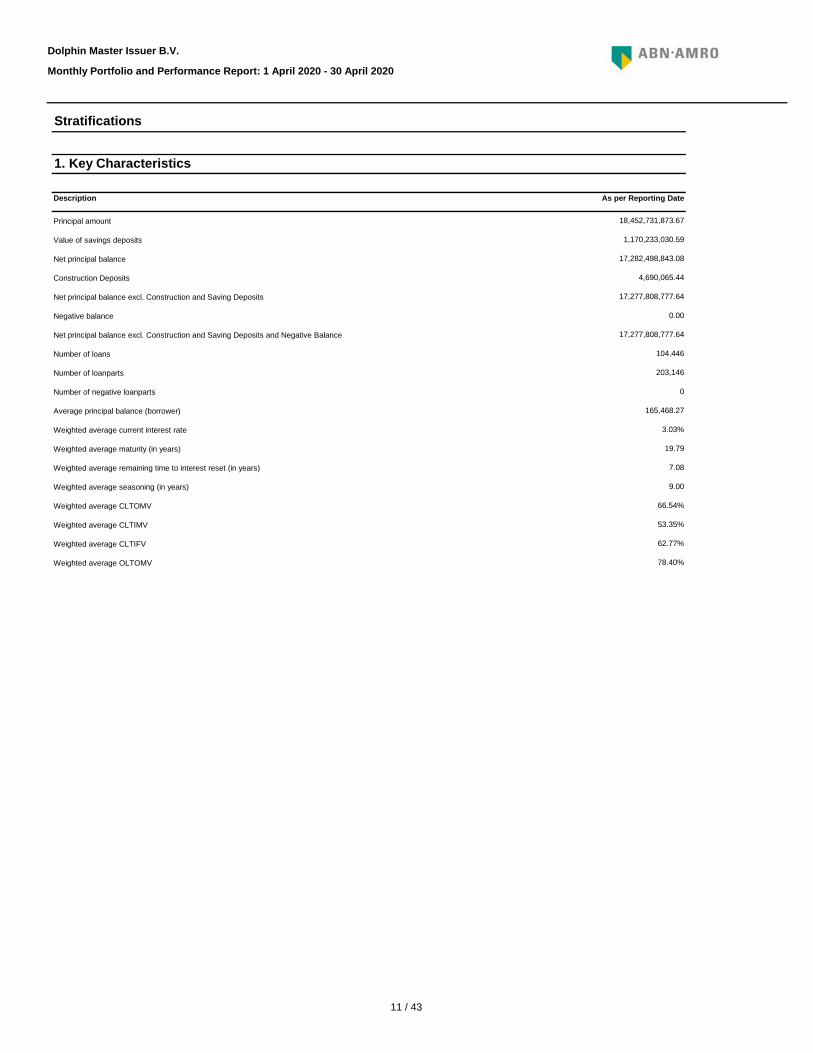
1. Key Characteristics
Description
Principal amount
Value of savings deposits
Net principal balance
Construction Deposits
Net principal balance excl. Construction and Saving Deposits
Negative balance
Net principal balance excl. Construction and Saving Deposits and Negative Balance
Number of loans
Number of loanparts
Number of negative loanparts
Average principal balance (borrower)
Weighted average current interest rate
Weighted average maturity (in years)
Weighted average remaining time to interest reset (in years)
Weighted average seasoning (in years)
Weighted average CLTOMV
Weighted average CLTIMV
Weighted average CLTIFV
Weighted average OLTOMV
Dolphin Master Issuer B.V.
Monthly Portfolio and Performance Report: 1 April 2020 - 30 April 2020
Stratifications
203,146
As per Reporting Date
18,452,731,873.67
1,170,233,030.59
17,282,498,843.08
4,690,065.44
17,277,808,777.64
0.00
17,277,808,777.64
104,446
66.54%
53.35%
62.77%
78.40%
0
165,468.27
3.03%
19.79
7.08
9.00
12 / 43
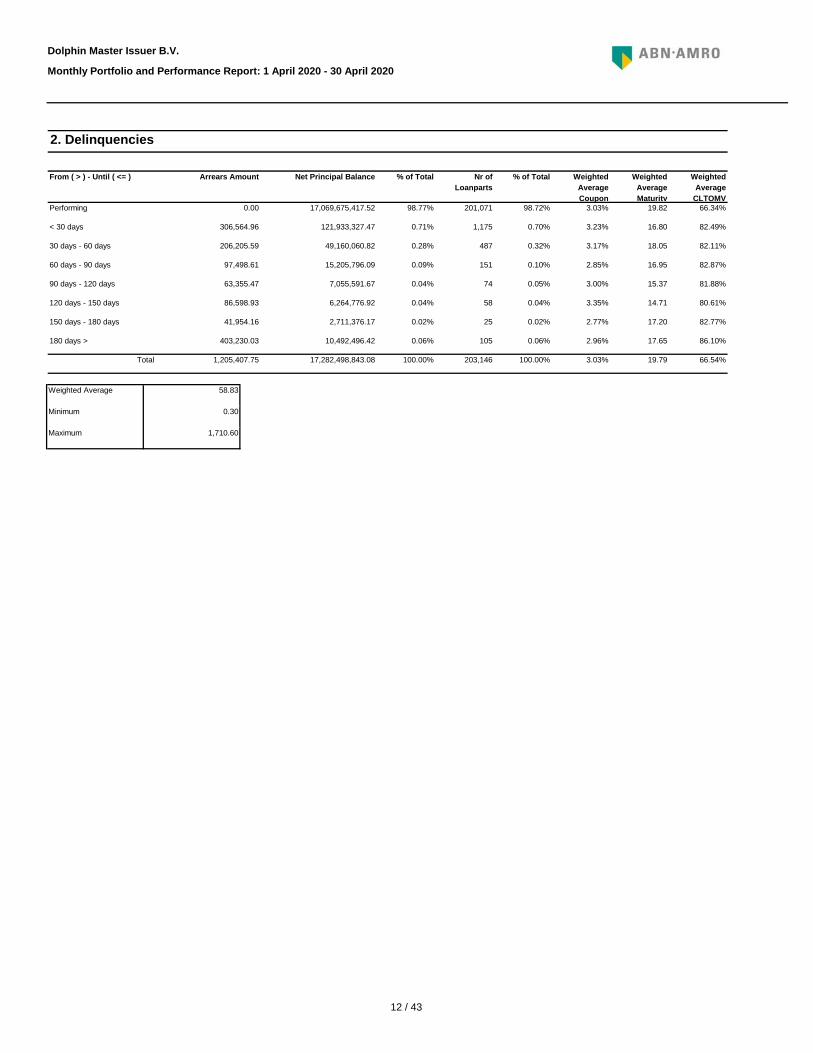
Net Principal Balance % of Total Nr of Loanparts
Weighted Average Maturity
Weighted Average
CLTOMV17,069,675,417.52 98.77% 201,071 19.82 66.34%
121,933,327.47 0.71% 1,175 16.80 82.49%
49,160,060.82 0.28% 487 18.05 82.11%
15,205,796.09 0.09% 151 16.95 82.87%
7,055,591.67 0.04% 74 15.37 81.88%
6,264,776.92 0.04% 58 14.71 80.61%
2,711,376.17 0.02% 25 17.20 82.77%
10,492,496.42 0.06% 105 17.65 86.10%
17,282,498,843.08 100.00% 203,146 19.79 66.54%
Dolphin Master Issuer B.V.
Monthly Portfolio and Performance Report: 1 April 2020 - 30 April 2020
2. Delinquencies
From ( > ) - Until ( <= ) Arrears Amount % of Total Weighted Average Coupon
Performing 0.00 98.72% 3.03%
< 30 days 306,564.96 0.70% 3.23%
30 days - 60 days 206,205.59 0.32% 3.17%
60 days - 90 days 97,498.61 0.10% 2.85%
90 days - 120 days 63,355.47 0.05% 3.00%
120 days - 150 days 86,598.93 0.04% 3.35%
150 days - 180 days 41,954.16 0.02% 2.77%
180 days > 403,230.03 0.06% 2.96%
Total 1,205,407.75 100.00% 3.03%
Weighted Average 58.83
Minimum 0.30
Maximum 1,710.60

13 / 43
Description Net Principal Balance % of Total Nr of Loanparts
Weighted Average Coupon
Weighted Average
CLTOMVAnnuity 2,495,188,664.42 14.44% 31,295 2.59% 70.40%
Bank Savings 229,657,501.06 1.33% 3,940 3.60% 66.23%
Interest only 9,839,100,937.37 56.93% 112,383 3.03% 62.95%
Investment 793,860,300.76 4.59% 4,834 2.91% 82.61%
Life investment 1,887,343,530.96 10.92% 19,051 3.05% 78.91%
Linear 348,596,809.59 2.02% 4,238 2.30% 59.57%
Savings 958,920,825.28 5.55% 17,074 4.18% 58.31%
Hybrid 568,547,469.41 3.29% 5,236 3.77% 72.27%
Other 161,282,804.23 0.93% 5,095 1.76% 46.28%
Null values
Total 17,282,498,843.08 100.00% 203,146 3.03% 66.54%
Dolphin Master Issuer B.V.
Monthly Portfolio and Performance Report: 1 April 2020 - 30 April 2020
3. Redemption Type
% of Total Weighted Average Maturity
15.41% 23.48
1.94% 15.64
55.32% 21.99
2.38% 13.20
9.38% 11.60
2.09% 22.86
8.40% 13.11
2.58% 14.38
2.51% 14.87
100.00% 19.79

14 / 43
% of Total Nr of Loans Weighted Average Coupon
Weighted Average
CLTOMV0.41% 4,818 3.03% 18.12%
1.75% 7,787 2.94% 26.52%
3.35% 9,147 2.96% 35.14%
5.52% 10,736 2.98% 44.18%
15.52% 21,263 3.01% 57.09%
18.78% 18,583 3.07% 67.46%
17.08% 13,152 3.15% 72.86%
13.18% 8,332 3.12% 75.50%
8.37% 4,468 3.03% 75.13%
5.31% 2,454 2.98% 76.05%
3.40% 1,385 2.89% 75.95%
2.56% 934 2.83% 75.23%
1.63% 536 2.79% 75.69%
1.22% 366 2.79% 75.20%
0.80% 222 2.76% 77.98%
0.53% 135 2.61% 76.01%
0.21% 51 2.45% 76.43%
0.13% 28 2.93% 78.70%
0.08% 16 2.75% 70.98%
0.08% 16 2.52% 74.35%
0.04% 7 2.48% 79.56%
0.06% 10 2.42% 82.28%
100.00% 104,446 3.03% 66.54%
Dolphin Master Issuer B.V.
Monthly Portfolio and Performance Report: 1 April 2020 - 30 April 2020
4. Outstanding Loan Amount
25,000 - 50,000 303,234,611.75 7.46% 15.41
50,000 - 75,000 579,108,120.29 8.76% 16.82
From ( > ) - Until ( <= ) Net Principal Balance % of Total Weighted Average Maturity
<= 25,000 71,105,856.28 4.61% 12.47
150,000 - 200,000 3,245,462,830.43 17.79% 19.60
200,000 - 250,000 2,952,536,818.27 12.59% 19.80
75,000 - 100,000 953,149,935.06 10.28% 17.80
100,000 - 150,000 2,682,154,233.62 20.36% 18.81
350,000 - 400,000 917,452,593.91 2.35% 21.11
400,000 - 450,000 588,069,542.17 1.33% 21.06
250,000 - 300,000 2,277,331,792.57 7.98% 20.64
300,000 - 350,000 1,445,821,308.91 4.28% 21.00
550,000 - 600,000 210,200,954.75 0.35% 22.58
600,000 - 650,000 138,687,051.78 0.21% 22.09
450,000 - 500,000 442,901,502.23 0.89% 21.68
500,000 - 550,000 281,601,559.52 0.51% 22.46
750,000 - 800,000 21,654,507.63 0.03% 23.66
800,000 - 850,000 13,330,835.39 0.02% 30.58
650,000 - 700,000 91,317,514.26 0.13% 21.01
700,000 - 750,000 37,025,197.44 0.05% 24.02
950,000 - 1,000,000 9,711,279.58 0.01% 22.93
1,000,000 >
850,000 - 900,000 14,180,271.94 0.02% 20.45
900,000 - 950,000 6,460,525.30 0.01% 20.54
Minimum 0.01
Maximum 988,989.12
Total 17,282,498,843.08 100.00% 19.79
Average 165,468.27

15 / 43
% of Total Nr of Loanparts
Weighted Average Coupon
Weighted Average
CLTOMV0.34% 1,796 3.39% 41.86%
0.22% 904 2.91% 47.43%
0.31% 1,172 2.93% 50.07%
0.48% 1,739 2.92% 51.09%
0.72% 2,283 2.70% 54.59%
0.94% 2,529 3.13% 59.22%
1.59% 3,314 3.17% 66.92%
2.12% 4,430 3.19% 67.79%
3.43% 7,297 3.18% 69.98%
3.96% 8,255 3.16% 71.10%
8.68% 17,341 3.18% 69.54%
10.85% 21,286 3.62% 68.62%
6.98% 13,660 4.17% 67.58%
5.80% 11,865 4.09% 68.67%
2.57% 5,629 2.74% 64.15%
1.63% 4,051 3.93% 61.95%
0.95% 2,477 3.56% 66.34%
0.85% 2,315 3.54% 64.85%
1.08% 3,029 3.41% 63.04%
1.70% 3,849 3.25% 61.62%
8.56% 15,288 2.89% 63.51%
12.28% 20,805 2.36% 66.40%
8.92% 16,907 2.42% 66.22%
5.83% 12,465 2.52% 66.79%
6.12% 12,651 2.28% 66.36%
3.10% 5,809 2.12% 65.55%
100.00% 203,146 3.03% 66.54%
Dolphin Master Issuer B.V.
Monthly Portfolio and Performance Report: 1 April 2020 - 30 April 2020
5. Origination Year
1996 - 1997 37,941,109.84 0.45% 8.77
1997 - 1998 54,186,537.22 0.58% 8.73
From ( >= ) - Until ( < ) Net Principal Balance % of Total Weighted Average Maturity
< 1996 58,207,112.43 0.88% 6.84
2000 - 2001 161,869,796.15 1.24% 11.07
2001 - 2002 274,519,566.57 1.63% 12.07
1998 - 1999 82,893,381.69 0.86% 10.01
1999 - 2000 123,762,610.62 1.12% 10.61
2004 - 2005 684,241,244.64 4.06% 14.04
2005 - 2006 1,500,533,035.39 8.54% 16.00
2002 - 2003 365,724,305.88 2.18% 12.81
2003 - 2004 593,420,593.55 3.59% 13.49
2008 - 2009 1,001,949,763.72 5.84% 17.64
2009 - 2010 444,166,410.09 2.77% 17.79
2006 - 2007 1,875,103,515.33 10.48% 16.02
2007 - 2008 1,205,555,162.30 6.72% 17.28
2012 - 2013 146,126,545.98 1.14% 19.25
2013 - 2014 186,421,375.57 1.49% 19.85
2010 - 2011 281,749,702.15 1.99% 19.19
2011 - 2012 164,781,422.35 1.22% 21.38
2016 - 2017 2,122,808,816.17 10.24% 26.13
2017 - 2018 1,542,035,632.96 8.32% 22.16
2014 - 2015 293,744,028.99 1.89% 23.56
2015 - 2016 1,479,782,509.52 7.53% 29.55
21.99
Total 17,282,498,843.08 100.00% 19.79
2018 - 2019 1,007,459,623.09 6.14% 20.25
2019 - 2020 1,058,140,345.06 6.23% 21.62
Weighted Average 2011
Minimum 1975
Maximum 2020
2020 >= 535,374,695.82 2.86%
16 / 43
% of Total Nr of Loanparts
Weighted Average Coupon
Weighted Average
CLTOMV6.96% 13,636 2.17% 65.73%
5.68% 12,148 2.47% 67.19%
6.32% 13,060 2.53% 67.04%
13.94% 23,692 2.31% 66.36%
9.66% 17,153 2.73% 63.88%
3.54% 7,034 3.08% 63.11%
1.08% 2,742 3.32% 62.36%
0.86% 2,573 3.54% 63.31%
0.98% 2,535 3.60% 65.91%
1.31% 3,364 3.90% 64.27%
2.04% 4,827 3.07% 61.50%
4.97% 10,033 3.78% 68.22%
6.42% 12,783 4.15% 67.49%
7.67% 15,233 3.95% 68.91%
12.50% 24,364 3.29% 68.88%
4.61% 9,771 3.17% 70.14%
3.77% 7,879 3.17% 71.11%
2.21% 4,750 3.14% 68.61%
1.97% 4,016 3.21% 66.95%
1.15% 2,831 3.17% 62.41%
0.75% 2,250 2.77% 56.88%
0.59% 2,045 2.84% 51.94%
0.36% 1,292 2.89% 50.83%
0.23% 947 2.93% 47.10%
0.18% 776 3.11% 47.99%
0.10% 471 3.15% 42.25%
0.10% 583 3.80% 38.04%
0.04% 241 3.50% 41.11%
0.02% 109 3.15% 32.72%
0.00% 2 3.66% 23.20%
0.00% 6 2.08% 32.79%
100.00% 203,146 3.03% 66.54%
Dolphin Master Issuer B.V.
Monthly Portfolio and Performance Report: 1 April 2020 - 30 April 2020
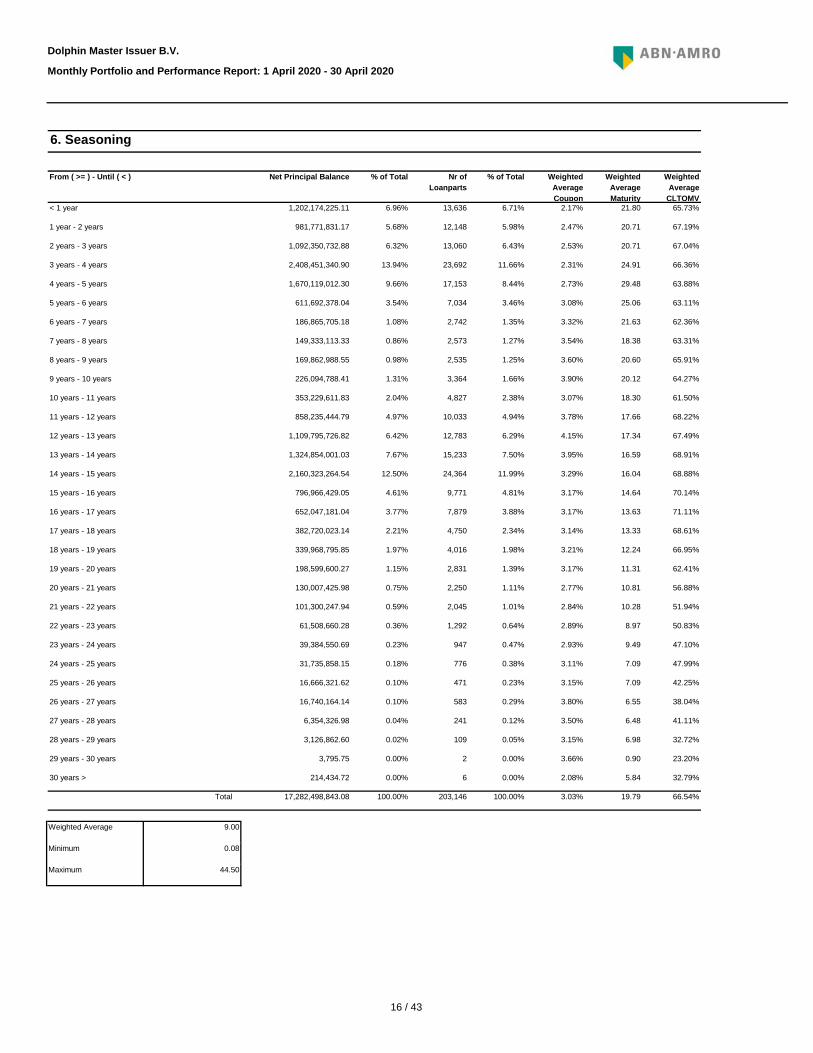
6. Seasoning
1 year - 2 years 981,771,831.17 5.98% 20.71
2 years - 3 years 1,092,350,732.88 6.43% 20.71
From ( >= ) - Until ( < ) Net Principal Balance % of Total Weighted Average Maturity
< 1 year 1,202,174,225.11 6.71% 21.80
5 years - 6 years 611,692,378.04 3.46% 25.06
6 years - 7 years 186,865,705.18 1.35% 21.63
3 years - 4 years 2,408,451,340.90 11.66% 24.91
4 years - 5 years 1,670,119,012.30 8.44% 29.48
9 years - 10 years 226,094,788.41 1.66% 20.12
10 years - 11 years 353,229,611.83 2.38% 18.30
7 years - 8 years 149,333,113.33 1.27% 18.38
8 years - 9 years 169,862,988.55 1.25% 20.60
13 years - 14 years 1,324,854,001.03 7.50% 16.59
14 years - 15 years 2,160,323,264.54 11.99% 16.04
11 years - 12 years 858,235,444.79 4.94% 17.66
12 years - 13 years 1,109,795,726.82 6.29% 17.34
17 years - 18 years 382,720,023.14 2.34% 13.33
18 years - 19 years 339,968,795.85 1.98% 12.24
15 years - 16 years 796,966,429.05 4.81% 14.64
16 years - 17 years 652,047,181.04 3.88% 13.63
21 years - 22 years 101,300,247.94 1.01% 10.28
22 years - 23 years 61,508,660.28 0.64% 8.97
19 years - 20 years 198,599,600.27 1.39% 11.31
20 years - 21 years 130,007,425.98 1.11% 10.81
25 years - 26 years 16,666,321.62 0.23% 7.09
26 years - 27 years 16,740,164.14 0.29% 6.55
23 years - 24 years 39,384,550.69 0.47% 9.49
24 years - 25 years 31,735,858.15 0.38% 7.09
29 years - 30 years 3,795.75 0.00% 0.90
30 years > 214,434.72 0.00% 5.84
27 years - 28 years 6,354,326.98 0.12% 6.48
28 years - 29 years 3,126,862.60 0.05% 6.98
Minimum 0.08
Maximum 44.50
Total 17,282,498,843.08 100.00% 19.79
Weighted Average 9.00
17 / 43
% of Total Nr of Loanparts
Weighted Average Coupon
Weighted Average
CLTOMV0.04% 143 2.64% 59.23%
1.73% 7,949 2.97% 52.56%
6.89% 21,099 3.02% 56.63%
21.24% 42,685 3.05% 69.21%
38.41% 73,394 3.41% 68.98%
5.46% 12,379 3.08% 60.79%
20.29% 34,486 2.40% 65.84%
0.58% 1,398 2.13% 63.44%
0.14% 294 2.73% 52.24%
0.15% 312 2.60% 51.13%
0.17% 342 2.74% 54.40%
0.17% 431 2.82% 58.52%
0.16% 367 2.85% 61.39%
1.35% 2,741 3.00% 61.31%
1.29% 2,130 2.52% 71.31%
1.92% 2,994 2.71% 66.28%
0.00% 2 1.43% 27.26%
100.00% 203,146 3.03% 66.54%
Dolphin Master Issuer B.V.
Monthly Portfolio and Performance Report: 1 April 2020 - 30 April 2020
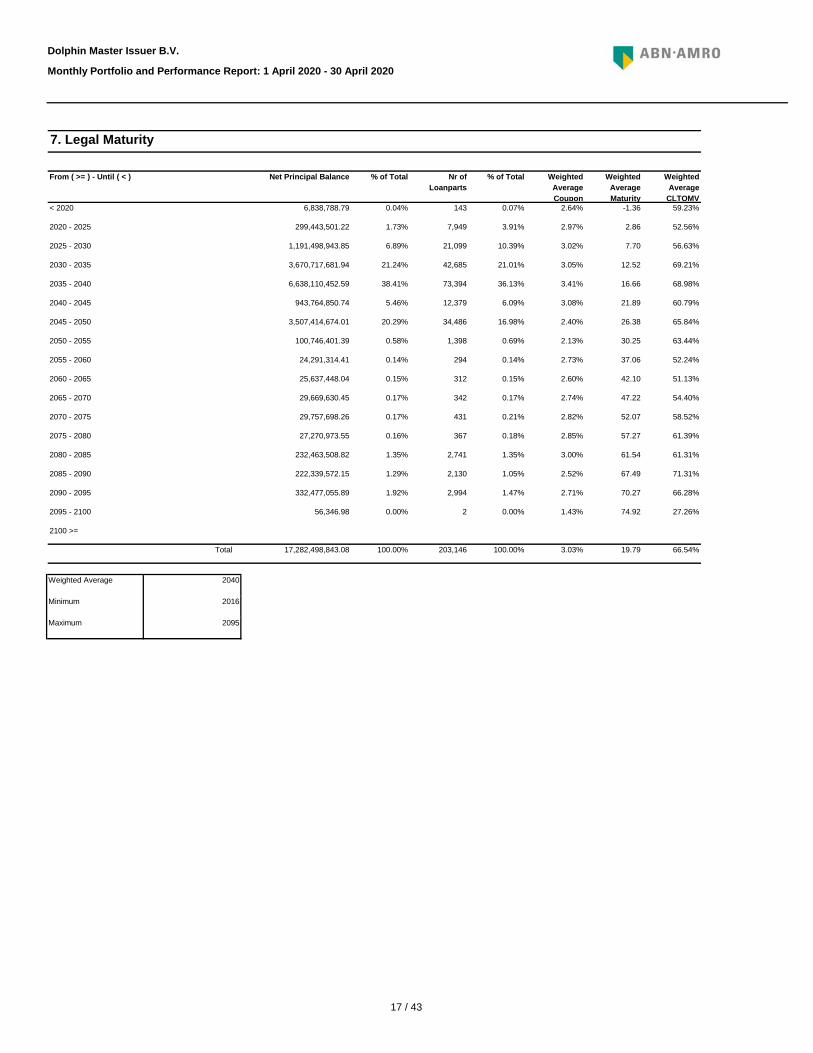
7. Legal Maturity
From ( >= ) - Until ( < ) Net Principal Balance % of Total Weighted Average Maturity
< 2020 6,838,788.79 0.07% -1.36
2020 - 2025 299,443,501.22 3.91% 2.86
2025 - 2030 1,191,498,943.85 10.39% 7.70
2030 - 2035 3,670,717,681.94 21.01% 12.52
2035 - 2040 6,638,110,452.59 36.13% 16.66
2040 - 2045 943,764,850.74 6.09% 21.89
2045 - 2050 3,507,414,674.01 16.98% 26.38
2050 - 2055 100,746,401.39 0.69% 30.25
2055 - 2060 24,291,314.41 0.14% 37.06
2060 - 2065 25,637,448.04 0.15% 42.10
2065 - 2070 29,669,630.45 0.17% 47.22
2070 - 2075 29,757,698.26 0.21% 52.07
2075 - 2080 27,270,973.55 0.18% 57.27
2080 - 2085 232,463,508.82 1.35% 61.54
2085 - 2090 222,339,572.15 1.05% 67.49
2090 - 2095 332,477,055.89 1.47% 70.27
2095 - 2100 56,346.98 0.00% 74.92
2100 >=
Total 17,282,498,843.08 100.00% 19.79
Weighted Average 2040
Minimum 2016
Maximum 2095

18 / 43
% of Total Nr of Loanparts
Weighted Average Coupon
Weighted Average
CLTOMV0.23% 1,236 2.67% 57.00%
0.25% 1,178 2.88% 54.29%
0.33% 1,596 2.99% 52.31%
0.52% 2,368 3.10% 51.26%
0.65% 2,562 3.00% 51.83%
0.82% 2,832 3.16% 54.04%
1.07% 3,476 3.17% 54.95%
1.25% 3,978 3.12% 56.00%
1.96% 5,768 2.98% 57.67%
2.25% 5,950 2.84% 59.59%
2.79% 6,638 3.17% 63.89%
4.11% 8,297 3.15% 67.89%
4.23% 8,211 3.05% 69.86%
5.60% 10,578 3.00% 71.45%
5.89% 11,444 2.95% 71.48%
12.19% 23,006 3.10% 69.57%
9.67% 18,327 3.60% 69.44%
6.60% 12,626 3.91% 67.95%
6.01% 11,317 3.63% 68.92%
2.54% 5,569 2.63% 63.77%
1.56% 3,686 3.57% 62.26%
0.84% 1,982 3.06% 61.42%
0.50% 1,257 2.92% 56.78%
0.91% 1,901 2.79% 58.74%
2.20% 3,916 2.73% 61.95%
5.70% 9,345 2.68% 62.64%
9.88% 15,050 2.22% 67.30%
1.16% 2,681 2.40% 66.07%
1.31% 3,051 2.43% 68.74%
1.47% 3,382 2.16% 68.62%
5.49% 9,938 2.73% 64.45%
100.00% 203,146 3.03% 66.54%
Dolphin Master Issuer B.V.
Monthly Portfolio and Performance Report: 1 April 2020 - 30 April 2020
8. Remaining Tenor
1 - 2 years 43,882,199.33 0.58% 1.50
2 - 3 years 57,197,952.34 0.79% 2.46
From ( >= ) - Until ( < ) Net Principal Balance % of Total Weighted Average Maturity
< 1 year 40,558,662.81 0.61% 0.14
5 - 6 years 142,124,867.42 1.39% 5.50
6 - 7 years 185,541,162.50 1.71% 6.47
3 - 4 years 89,518,254.31 1.17% 3.50
4 - 5 years 111,921,096.64 1.26% 4.45
9 - 10 years 389,439,761.57 2.93% 9.44
10 - 11 years 481,739,033.16 3.27% 10.52
7 - 8 years 215,974,458.38 1.96% 7.47
8 - 9 years 339,160,016.03 2.84% 8.48
13 - 14 years 967,408,104.67 5.21% 13.46
14 - 15 years 1,018,078,653.23 5.63% 14.46
11 - 12 years 710,732,327.01 4.08% 11.47
12 - 13 years 730,836,367.91 4.04% 12.46
17 - 18 years 1,141,338,095.58 6.22% 17.45
18 - 19 years 1,038,399,460.15 5.57% 18.35
15 - 16 years 2,107,463,167.01 11.32% 15.53
16 - 17 years 1,671,932,714.26 9.02% 16.40
21 - 22 years 145,633,609.08 0.98% 21.43
22 - 23 years 85,793,528.49 0.62% 22.44
19 - 20 years 439,597,518.77 2.74% 19.39
20 - 21 years 269,167,070.37 1.81% 20.36
25 - 26 years 984,306,366.43 4.60% 25.37
26 - 27 years 1,707,951,114.49 7.41% 26.44
23 - 24 years 157,120,698.33 0.94% 23.54
24 - 25 years 379,652,801.83 1.93% 24.60
29 - 30 years 253,981,068.65 1.66% 29.43
> 30 years 949,362,572.36 4.89% 63.17
27 - 28 years 199,663,817.28 1.32% 27.40
28 - 29 years 227,022,322.69 1.50% 28.53
Minimum 0.00
Maximum 74.92
Total 17,282,498,843.08 100.00% 19.79
Weighted Average 19.79
19 / 43
% of Total Nr of Loans Weighted Average Coupon
Weighted Average
CLTOMV0.04% 280 2.76% 6.32%
0.27% 1,279 2.70% 12.81%
0.91% 2,971 2.75% 19.20%
2.01% 4,854 2.83% 26.45%
3.75% 7,163 2.85% 33.66%
6.82% 10,278 2.85% 41.91%
7.86% 10,335 2.90% 48.19%
12.16% 13,373 2.90% 55.15%
11.33% 11,061 3.02% 63.18%
15.33% 12,262 2.95% 70.25%
9.12% 7,152 3.14% 75.63%
12.66% 9,367 3.14% 82.82%
15.14% 12,126 3.33% 91.02%
1.13% 814 3.14% 81.75%
0.58% 418 2.98% 77.82%
0.90% 713 2.93% 80.32%
100.00% 104,446 3.03% 66.54%
Dolphin Master Issuer B.V.
Monthly Portfolio and Performance Report: 1 April 2020 - 30 April 2020
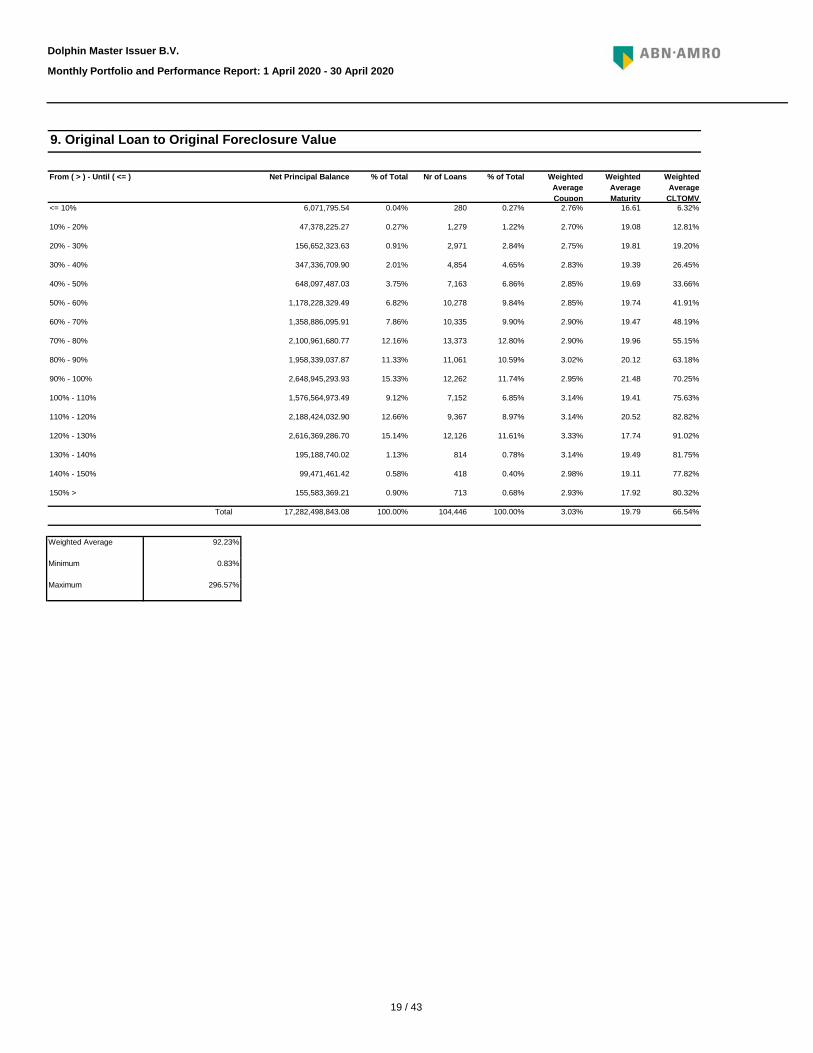
9. Original Loan to Original Foreclosure Value
From ( > ) - Until ( <= ) Net Principal Balance % of Total Weighted Average Maturity
<= 10% 6,071,795.54 0.27% 16.61
10% - 20% 47,378,225.27 1.22% 19.08
20% - 30% 156,652,323.63 2.84% 19.81
30% - 40% 347,336,709.90 4.65% 19.39
40% - 50% 648,097,487.03 6.86% 19.69
50% - 60% 1,178,228,329.49 9.84% 19.74
60% - 70% 1,358,886,095.91 9.90% 19.47
70% - 80% 2,100,961,680.77 12.80% 19.96
80% - 90% 1,958,339,037.87 10.59% 20.12
90% - 100% 2,648,945,293.93 11.74% 21.48
100% - 110% 1,576,564,973.49 6.85% 19.41
110% - 120% 2,188,424,032.90 8.97% 20.52
120% - 130% 2,616,369,286.70 11.61% 17.74
130% - 140% 195,188,740.02 0.78% 19.49
140% - 150% 99,471,461.42 0.40% 19.11
150% > 155,583,369.21 0.68% 17.92
Total 17,282,498,843.08 100.00% 19.79
Weighted Average 92.23%
Minimum 0.83%
Maximum 296.57%

20 / 43
% of Total Nr of Loans Weighted Average Coupon
Weighted Average
CLTOMV0.23% 2,626 3.11% 5.98%
1.15% 4,854 3.00% 13.49%
2.54% 6,691 2.99% 21.69%
4.43% 8,288 2.99% 30.09%
6.73% 9,736 2.96% 38.58%
10.18% 12,120 2.92% 47.14%
12.07% 11,912 2.93% 55.52%
14.00% 12,119 2.96% 63.37%
13.36% 10,636 3.05% 72.67%
13.99% 9,834 3.01% 81.00%
9.16% 6,704 3.27% 89.41%
6.82% 4,756 3.21% 97.27%
5.34% 4,170 3.21% 105.94%
100.00% 104,446 3.03% 66.54%
Dolphin Master Issuer B.V.
Monthly Portfolio and Performance Report: 1 April 2020 - 30 April 2020
10. Current Loan to Original Foreclosure Value
From ( > ) - Until ( <= ) Net Principal Balance % of Total Weighted Average Maturity
<= 10% 40,383,226.12 2.51% 14.53
10% - 20% 198,567,316.28 4.65% 16.72
20% - 30% 438,742,773.76 6.41% 17.52
30% - 40% 765,755,540.51 7.94% 18.58
40% - 50% 1,163,492,280.53 9.32% 18.99
50% - 60% 1,758,543,522.79 11.60% 19.80
60% - 70% 2,086,399,033.62 11.40% 19.94
70% - 80% 2,418,744,617.52 11.60% 20.49
80% - 90% 2,308,930,787.42 10.18% 20.62
90% - 100% 2,418,377,691.41 9.42% 21.24
100% - 110% 1,583,715,931.22 6.42% 20.43
110% - 120% 1,178,008,746.67 4.55% 19.74
120% - 130% 922,837,375.23 3.99% 14.64
130% - 140%
140% - 150%
150% >
Total 17,282,498,843.08 100.00% 19.79
Weighted Average 78.28%
Minimum 0.00%
Maximum 130.00%

21 / 43
% of Total Nr of Loans Weighted Average Coupon
Weighted Average
CLTOMV0.66% 5,167 3.03% 11.30%
2.73% 8,385 2.88% 22.03%
5.48% 10,567 2.93% 32.21%
8.50% 11,819 2.93% 41.24%
12.29% 13,601 2.92% 50.78%
14.50% 13,387 2.96% 60.13%
16.17% 13,004 3.01% 69.44%
15.21% 11,203 3.08% 78.92%
12.42% 8,728 3.19% 87.30%
7.67% 5,395 3.21% 93.49%
3.24% 2,347 3.21% 99.49%
0.96% 673 3.27% 102.47%
0.18% 170 3.01% 105.88%
100.00% 104,446 3.03% 66.54%
Dolphin Master Issuer B.V.
Monthly Portfolio and Performance Report: 1 April 2020 - 30 April 2020
11. Current Loan to Indexed Foreclosure Value
From ( > ) - Until ( <= ) Net Principal Balance % of Total Weighted Average Maturity
<= 10% 113,518,090.58 4.95% 12.95
10% - 20% 471,005,452.48 8.03% 15.97
20% - 30% 947,433,908.26 10.12% 17.66
30% - 40% 1,469,649,337.58 11.32% 18.73
40% - 50% 2,123,980,287.05 13.02% 19.74
50% - 60% 2,506,155,185.98 12.82% 20.06
60% - 70% 2,794,720,650.07 12.45% 20.50
70% - 80% 2,628,434,990.48 10.73% 20.78
80% - 90% 2,146,285,787.66 8.36% 20.78
90% - 100% 1,324,733,260.90 5.17% 19.82
100% - 110% 559,705,481.25 2.25% 18.32
110% - 120% 165,520,783.00 0.64% 18.89
120% - 130% 31,355,627.79 0.16% 12.74
130% - 140%
140% - 150%
150% >
Total 17,282,498,843.08 100.00% 19.79
Weighted Average 62.77%
Minimum 0.00%
Maximum 127.33%

22 / 43
% of Total Nr of Loans Weighted Average Coupon
Weighted Average
CLTOMV0.05% 388 2.69% 8.04%
0.48% 2,011 2.75% 14.61%
1.55% 4,415 2.76% 22.51%
3.48% 7,180 2.85% 30.92%
7.06% 11,110 2.84% 40.25%
9.67% 12,827 2.90% 48.01%
13.54% 14,695 2.92% 55.93%
13.21% 12,354 3.01% 64.65%
16.70% 13,022 3.00% 72.41%
11.88% 9,070 3.14% 80.41%
18.69% 14,513 3.29% 89.01%
2.28% 1,785 3.15% 89.74%
0.62% 445 2.99% 78.42%
0.29% 224 2.96% 77.86%
0.21% 173 2.87% 78.48%
0.28% 234 2.91% 84.51%
100.00% 104,446 3.03% 66.54%
Dolphin Master Issuer B.V.
Monthly Portfolio and Performance Report: 1 April 2020 - 30 April 2020
12. Original Loan to Original Market Value
From ( > ) - Until ( <= ) Net Principal Balance % of Total Weighted Average Maturity
<= 10% 9,130,040.17 0.37% 17.48
10% - 20% 83,156,340.18 1.93% 19.78
20% - 30% 268,144,233.82 4.23% 19.69
30% - 40% 601,132,091.61 6.87% 19.71
40% - 50% 1,219,524,536.47 10.64% 19.85
50% - 60% 1,671,970,514.37 12.28% 19.42
60% - 70% 2,339,596,144.26 14.07% 19.97
70% - 80% 2,283,375,751.91 11.83% 20.25
80% - 90% 2,885,426,109.11 12.47% 20.88
90% - 100% 2,053,784,272.03 8.68% 20.21
100% - 110% 3,230,069,505.01 13.90% 18.65
110% - 120% 394,330,300.30 1.71% 17.55
120% - 130% 106,689,946.33 0.43% 18.93
130% - 140% 50,620,135.43 0.21% 19.57
140% - 150% 36,767,253.07 0.17% 16.98
150% > 48,781,669.01 0.22% 16.90
Total 17,282,498,843.08 100.00% 19.79
Weighted Average 78.40%
Minimum 0.70%
Maximum 252.09%

23 / 43
% of Total Nr of Loans Weighted Average Coupon
Weighted Average
CLTOMV0.35% 3,322 3.10% 7.10%
1.75% 6,383 3.00% 15.87%
3.90% 8,657 2.97% 25.57%
6.79% 10,759 2.98% 35.42%
11.03% 13,575 2.92% 45.49%
14.32% 14,260 2.93% 55.27%
15.80% 13,570 2.99% 64.50%
16.06% 12,220 3.02% 75.12%
13.89% 9,927 3.13% 84.53%
9.48% 6,697 3.22% 94.49%
6.09% 4,650 3.23% 104.53%
0.53% 426 3.13% 110.38%
100.00% 104,446 3.03% 66.54%
Dolphin Master Issuer B.V.
Monthly Portfolio and Performance Report: 1 April 2020 - 30 April 2020
13. Current Loan to Original Market Value
From ( > ) - Until ( <= ) Net Principal Balance % of Total Weighted Average Maturity
<= 10% 61,151,477.34 3.18% 14.91
10% - 20% 302,820,771.75 6.11% 17.03
20% - 30% 674,477,722.15 8.29% 17.98
30% - 40% 1,174,329,809.69 10.30% 18.90
40% - 50% 1,906,421,368.73 13.00% 19.77
50% - 60% 2,474,124,809.31 13.65% 19.95
60% - 70% 2,731,287,060.61 12.99% 20.42
70% - 80% 2,775,444,561.74 11.70% 20.89
80% - 90% 2,399,879,604.08 9.50% 20.70
90% - 100% 1,638,095,412.95 6.41% 20.64
100% - 110% 1,052,518,659.68 4.45% 15.18
110% - 120% 91,947,585.05 0.41% 14.26
120% - 130%
130% - 140%
140% - 150%
150% >
Total 17,282,498,843.08 100.00% 19.79
Weighted Average 66.54%
Minimum 0.00%
Maximum 110.50%
24 / 43
% of Total Nr of Loans Weighted Average Coupon
Weighted Average
CLTOMV0.96% 6,445 3.00% 13.01%
3.98% 10,590 2.90% 25.02%
8.05% 13,227 2.93% 36.25%
12.91% 15,361 2.92% 47.38%
16.41% 15,703 2.96% 58.30%
19.02% 15,351 3.01% 69.16%
17.41% 12,779 3.10% 80.34%
12.98% 9,030 3.18% 89.20%
6.18% 4,412 3.23% 96.35%
1.84% 1,317 3.24% 101.81%
0.26% 231 3.03% 105.31%
100.00% 104,446 3.03% 66.54%
Dolphin Master Issuer B.V.
Monthly Portfolio and Performance Report: 1 April 2020 - 30 April 2020
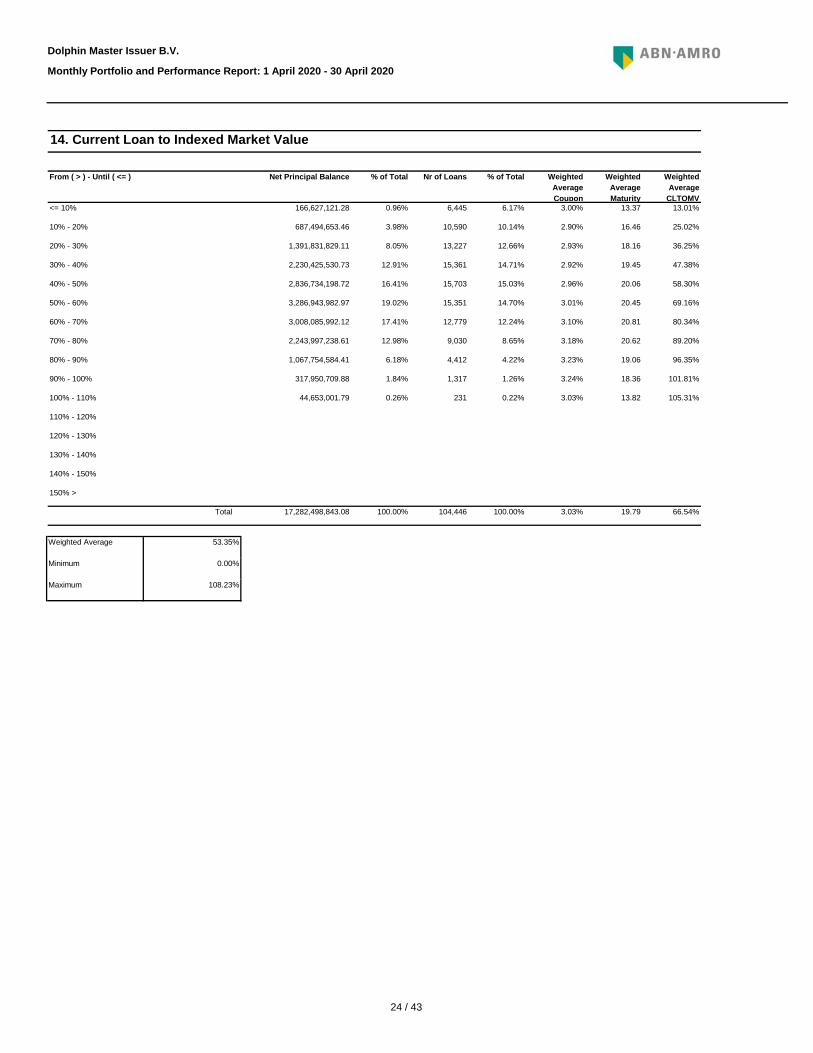
14. Current Loan to Indexed Market Value
From ( > ) - Until ( <= ) Net Principal Balance % of Total Weighted Average Maturity
<= 10% 166,627,121.28 6.17% 13.37
10% - 20% 687,494,653.46 10.14% 16.46
20% - 30% 1,391,831,829.11 12.66% 18.16
30% - 40% 2,230,425,530.73 14.71% 19.45
40% - 50% 2,836,734,198.72 15.03% 20.06
50% - 60% 3,286,943,982.97 14.70% 20.45
60% - 70% 3,008,085,992.12 12.24% 20.81
70% - 80% 2,243,997,238.61 8.65% 20.62
80% - 90% 1,067,754,584.41 4.22% 19.06
90% - 100% 317,950,709.88 1.26% 18.36
100% - 110% 44,653,001.79 0.22% 13.82
110% - 120%
120% - 130%
130% - 140%
140% - 150%
150% >
Total 17,282,498,843.08 100.00% 19.79
Weighted Average 53.35%
Minimum 0.00%
Maximum 108.23%

25 / 43
% of Total Nr of Loanparts
Weighted Average Coupon
Weighted Average
CLTOMV0.12% 149 0.28% 63.33%
0.68% 972 0.73% 69.80%
3.07% 6,880 1.40% 52.09%
18.33% 42,773 1.79% 59.35%
20.15% 39,334 2.25% 66.40%
18.56% 34,155 2.75% 72.19%
9.18% 16,755 3.24% 76.32%
5.10% 9,551 3.79% 69.35%
8.06% 15,634 4.30% 64.13%
8.36% 17,056 4.77% 66.07%
5.69% 12,627 5.24% 65.97%
2.06% 5,308 5.73% 64.68%
0.56% 1,683 6.22% 65.29%
0.07% 257 6.69% 58.34%
0.00% 12 7.21% 52.96%
100.00% 203,146 3.03% 66.54%
Dolphin Master Issuer B.V.
Monthly Portfolio and Performance Report: 1 April 2020 - 30 April 2020
15. Loanpart Coupon (interest rate bucket)
From ( > ) - Until ( <= ) Net Principal Balance % of Total Weighted Average Maturity
<= 0.5% 21,092,027.04 0.07% 14.54
0.5% - 1.0% 117,842,008.71 0.48% 14.88
1.0% - 1.5% 530,554,369.36 3.39% 20.72
1.5% - 2.0% 3,168,150,686.99 21.06% 20.79
2.0% - 2.5% 3,482,190,877.69 19.36% 20.84
2.5% - 3.0% 3,207,146,570.86 16.81% 21.57
3.0% - 3.5% 1,586,881,349.77 8.25% 21.74
3.5% - 4.0% 880,552,764.14 4.70% 19.14
4.0% - 4.5% 1,393,651,766.15 7.70% 16.64
4.5% - 5.0% 1,444,467,486.37 8.40% 16.63
5.0% - 5.5% 983,526,670.35 6.22% 16.05
5.5% - 6.0% 356,617,651.68 2.61% 15.43
6.0% - 6.5% 97,286,991.25 0.83% 13.94
6.5% - 7.0% 12,079,746.16 0.13% 11.23
7.0% > 457,876.56 0.01% 10.20
Unknown
Total 17,282,498,843.08 100.00% 19.79
Weighted Average 3.0%
Minimum 0.0%
Maximum 8.4%
26 / 43
% of Total Nr of Loanparts
Weighted Average Coupon
Weighted Average
CLTOMV10.60% 26,212 2.29% 67.08%
3.81% 9,179 3.27% 66.58%
2.76% 7,174 3.45% 65.82%
3.57% 8,933 3.44% 63.32%
4.77% 10,852 3.13% 64.29%
13.22% 25,497 3.17% 65.65%
18.37% 33,470 3.03% 67.28%
10.98% 21,355 3.42% 67.64%
8.04% 15,836 3.11% 68.62%
5.53% 10,884 2.29% 66.40%
2.45% 4,846 3.21% 64.41%
1.63% 3,304 2.94% 66.04%
0.99% 1,986 3.20% 66.04%
0.94% 1,953 3.42% 64.93%
1.63% 2,967 3.16% 65.72%
4.08% 7,103 3.22% 64.64%
4.06% 6,412 2.70% 68.37%
0.59% 1,215 3.06% 67.27%
1.07% 2,019 3.96% 67.66%
0.69% 1,540 2.68% 64.01%
0.13% 210 4.84% 57.11%
0.02% 38 4.53% 63.07%
0.00% 8 4.02% 87.00%
0.00% 2 5.75% 63.69%
0.01% 12 4.32% 62.16%
0.02% 39 3.65% 63.17%
0.01% 22 3.71% 64.76%
0.00% 7 3.22% 56.74%
0.00% 5 4.08% 56.21%
0.02% 64 2.37% 59.60%
0.00% 2 2.03% 68.81%
100.00% 203,146 3.03% 66.54%
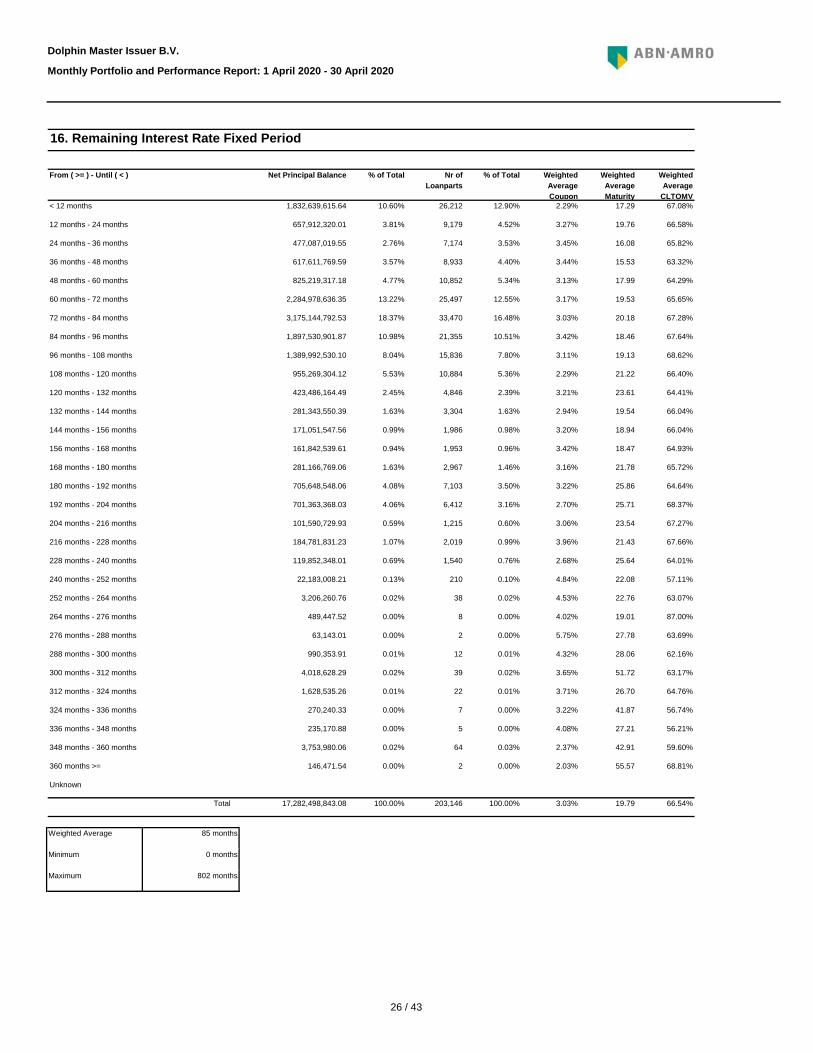
From ( >= ) - Until ( < ) Net Principal Balance % of Total Weighted Average Maturity
< 12 months 1,832,639,615.64 12.90% 17.29
Dolphin Master Issuer B.V.
Monthly Portfolio and Performance Report: 1 April 2020 - 30 April 2020
16. Remaining Interest Rate Fixed Period
36 months - 48 months 617,611,769.59 4.40% 15.53
48 months - 60 months 825,219,317.18 5.34% 17.99
12 months - 24 months 657,912,320.01 4.52% 19.76
24 months - 36 months 477,087,019.55 3.53% 16.08
84 months - 96 months 1,897,530,901.87 10.51% 18.46
96 months - 108 months 1,389,992,530.10 7.80% 19.13
60 months - 72 months 2,284,978,636.35 12.55% 19.53
72 months - 84 months 3,175,144,792.53 16.48% 20.18
132 months - 144 months 281,343,550.39 1.63% 19.54
144 months - 156 months 171,051,547.56 0.98% 18.94
108 months - 120 months 955,269,304.12 5.36% 21.22
120 months - 132 months 423,486,164.49 2.39% 23.61
180 months - 192 months 705,648,548.06 3.50% 25.86
192 months - 204 months 701,363,368.03 3.16% 25.71
156 months - 168 months 161,842,539.61 0.96% 18.47
168 months - 180 months 281,166,769.06 1.46% 21.78
228 months - 240 months 119,852,348.01 0.76% 25.64
240 months - 252 months 22,183,008.21 0.10% 22.08
204 months - 216 months 101,590,729.93 0.60% 23.54
216 months - 228 months 184,781,831.23 0.99% 21.43
276 months - 288 months 63,143.01 0.00% 27.78
288 months - 300 months 990,353.91 0.01% 28.06
252 months - 264 months 3,206,260.76 0.02% 22.76
264 months - 276 months 489,447.52 0.00% 19.01
324 months - 336 months 270,240.33 0.00% 41.87
336 months - 348 months 235,170.88 0.00% 27.21
300 months - 312 months 4,018,628.29 0.02% 51.72
312 months - 324 months 1,628,535.26 0.01% 26.70
Total 17,282,498,843.08 100.00% 19.79
348 months - 360 months 3,753,980.06 0.03% 42.91
360 months >= 146,471.54 0.00% 55.57
Weighted Average 85 months
Minimum 0 months
Maximum 802 months
Unknown

27 / 43
Description Net Principal Balance % of Total Nr of Loanparts
Weighted Average Coupon
Weighted Average
CLTOMVFixed 16,506,313,297.02 95.51% 190,672 3.10% 66.68%
Floating 776,185,546.06 4.49% 12,474 1.54% 63.57%
Total 17,282,498,843.08 100.00% 203,146 3.03% 66.54%
Dolphin Master Issuer B.V.
Monthly Portfolio and Performance Report: 1 April 2020 - 30 April 2020
17. Interest Payment Type
100.00% 19.79
% of Total Weighted Average Maturity
93.86% 19.91
6.14% 17.29

28 / 43
Property Net Principal Balance % of Total Nr of Loans Weighted Average Coupon
Weighted Average
CLTOMVHouse 15,650,441,614.18 90.56% 93,521 3.06% 66.56%
Appartment 1,589,614,955.47 9.20% 10,677 2.82% 66.57%
House / Business ( < 50% ) 41,390,529.58 0.24% 242 2.70% 59.53%
House / Business ( >= 50% ) 1,051,743.85 0.01% 6 2.76% 45.79%
Business
Other
Total 17,282,498,843.08 100.00% 104,446 3.03% 66.54%
Dolphin Master Issuer B.V.
Monthly Portfolio and Performance Report: 1 April 2020 - 30 April 2020
18. Property Description
% of Total Weighted Average Maturity
89.54% 19.57
10.22% 21.96
100.00% 19.79
0.23% 17.95
0.01% 14.14
29 / 43
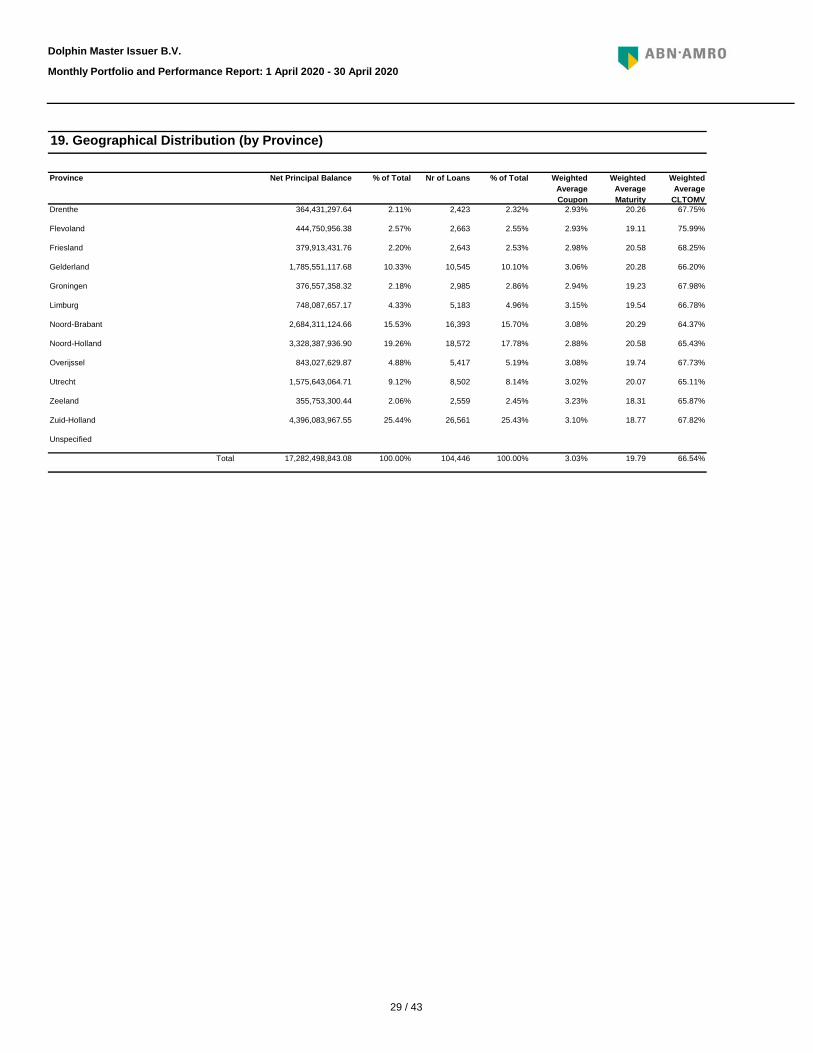
Province Net Principal Balance % of Total Nr of Loans Weighted Average Coupon
Weighted Average
CLTOMVDrenthe 364,431,297.64 2.11% 2,423 2.93% 67.75%
Flevoland 444,750,956.38 2.57% 2,663 2.93% 75.99%
Friesland 379,913,431.76 2.20% 2,643 2.98% 68.25%
Gelderland 1,785,551,117.68 10.33% 10,545 3.06% 66.20%
Groningen 376,557,358.32 2.18% 2,985 2.94% 67.98%
Limburg 748,087,657.17 4.33% 5,183 3.15% 66.78%
Noord-Brabant 2,684,311,124.66 15.53% 16,393 3.08% 64.37%
Noord-Holland 3,328,387,936.90 19.26% 18,572 2.88% 65.43%
Overijssel 843,027,629.87 4.88% 5,417 3.08% 67.73%
Utrecht 1,575,643,064.71 9.12% 8,502 3.02% 65.11%
Zeeland 355,753,300.44 2.06% 2,559 3.23% 65.87%
Zuid-Holland 4,396,083,967.55 25.44% 26,561 3.10% 67.82%
Unspecified
Total 17,282,498,843.08 100.00% 104,446 3.03% 66.54%
Dolphin Master Issuer B.V.
Monthly Portfolio and Performance Report: 1 April 2020 - 30 April 2020
19. Geographical Distribution (by Province)
% of Total Weighted Average Maturity
2.32% 20.26
2.55% 19.11
2.53% 20.58
10.10% 20.28
2.86% 19.23
4.96% 19.54
15.70% 20.29
17.78% 20.58
5.19% 19.74
8.14% 20.07
2.45% 18.31
25.43% 18.77
100.00% 19.79
30 / 43
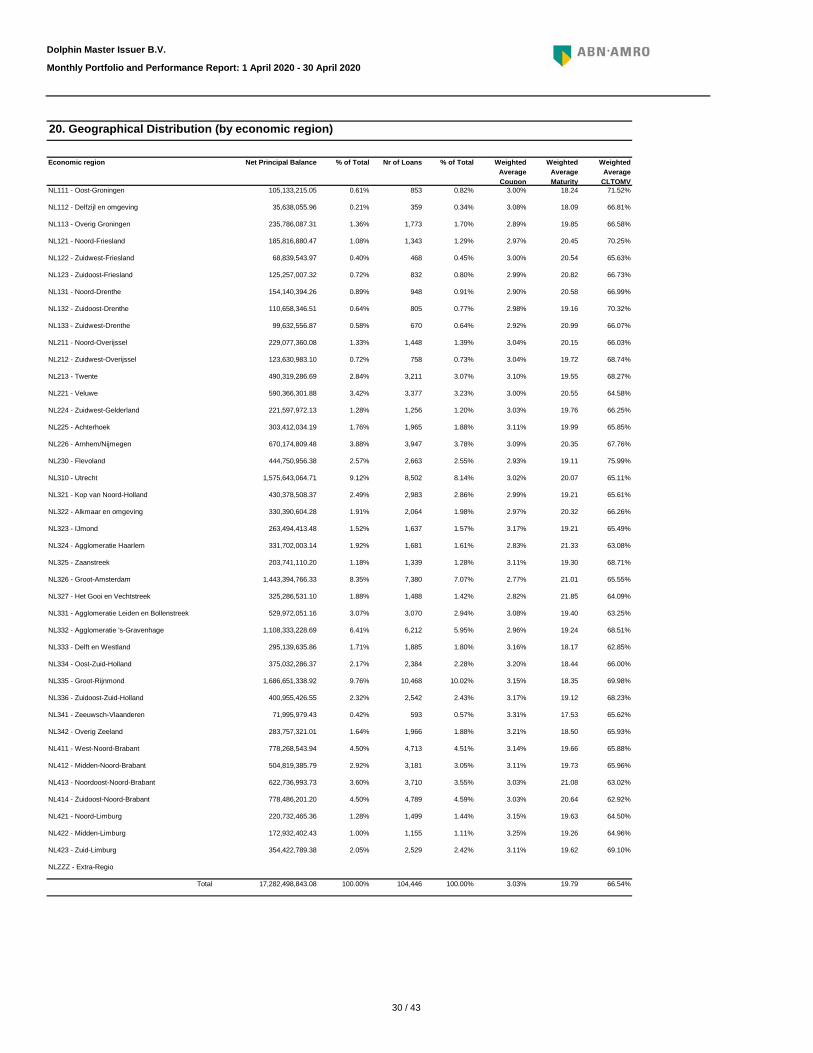
Economic region Net Principal Balance % of Total Nr of Loans Weighted Average Coupon
Weighted Average
CLTOMVNL111 - Oost-Groningen 105,133,215.05 0.61% 853 3.00% 71.52%
NL112 - Delfzijl en omgeving 35,638,055.96 0.21% 359 3.08% 66.81%
NL113 - Overig Groningen 235,786,087.31 1.36% 1,773 2.89% 66.58%
NL121 - Noord-Friesland 185,816,880.47 1.08% 1,343 2.97% 70.25%
NL122 - Zuidwest-Friesland 68,839,543.97 0.40% 468 3.00% 65.63%
NL123 - Zuidoost-Friesland 125,257,007.32 0.72% 832 2.99% 66.73%
NL131 - Noord-Drenthe 154,140,394.26 0.89% 948 2.90% 66.99%
NL132 - Zuidoost-Drenthe 110,658,346.51 0.64% 805 2.98% 70.32%
NL133 - Zuidwest-Drenthe 99,632,556.87 0.58% 670 2.92% 66.07%
NL211 - Noord-Overijssel 229,077,360.08 1.33% 1,448 3.04% 66.03%
NL212 - Zuidwest-Overijssel 123,630,983.10 0.72% 758 3.04% 68.74%
NL213 - Twente 490,319,286.69 2.84% 3,211 3.10% 68.27%
NL221 - Veluwe 590,366,301.88 3.42% 3,377 3.00% 64.58%
NL224 - Zuidwest-Gelderland 221,597,972.13 1.28% 1,256 3.03% 66.25%
NL225 - Achterhoek 303,412,034.19 1.76% 1,965 3.11% 65.85%
NL226 - Arnhem/Nijmegen 670,174,809.48 3.88% 3,947 3.09% 67.76%
NL230 - Flevoland 444,750,956.38 2.57% 2,663 2.93% 75.99%
NL310 - Utrecht 1,575,643,064.71 9.12% 8,502 3.02% 65.11%
NL321 - Kop van Noord-Holland 430,378,508.37 2.49% 2,983 2.99% 65.61%
NL322 - Alkmaar en omgeving 330,390,604.28 1.91% 2,064 2.97% 66.26%
NL323 - IJmond 263,494,413.48 1.52% 1,637 3.17% 65.49%
NL324 - Agglomeratie Haarlem 331,702,003.14 1.92% 1,681 2.83% 63.08%
NL325 - Zaanstreek 203,741,110.20 1.18% 1,339 3.11% 68.71%
NL326 - Groot-Amsterdam 1,443,394,766.33 8.35% 7,380 2.77% 65.55%
NL327 - Het Gooi en Vechtstreek 325,286,531.10 1.88% 1,488 2.82% 64.09%
NL331 - Agglomeratie Leiden en Bollenstreek 529,972,051.16 3.07% 3,070 3.08% 63.25%
NL332 - Agglomeratie 's-Gravenhage 1,108,333,228.69 6.41% 6,212 2.96% 68.51%
NL333 - Delft en Westland 295,139,635.86 1.71% 1,885 3.16% 62.85%
NL334 - Oost-Zuid-Holland 375,032,286.37 2.17% 2,384 3.20% 66.00%
NL335 - Groot-Rijnmond 1,686,651,338.92 9.76% 10,468 3.15% 69.98%
NL336 - Zuidoost-Zuid-Holland 400,955,426.55 2.32% 2,542 3.17% 68.23%
NL341 - Zeeuwsch-Vlaanderen 71,995,979.43 0.42% 593 3.31% 65.62%
NL342 - Overig Zeeland 283,757,321.01 1.64% 1,966 3.21% 65.93%
NL411 - West-Noord-Brabant 778,268,543.94 4.50% 4,713 3.14% 65.88%
NL412 - Midden-Noord-Brabant 504,819,385.79 2.92% 3,181 3.11% 65.96%
NL413 - Noordoost-Noord-Brabant 622,736,993.73 3.60% 3,710 3.03% 63.02%
NL414 - Zuidoost-Noord-Brabant 778,486,201.20 4.50% 4,789 3.03% 62.92%
NL421 - Noord-Limburg 220,732,465.36 1.28% 1,499 3.15% 64.50%
NL422 - Midden-Limburg 172,932,402.43 1.00% 1,155 3.25% 64.96%
NL423 - Zuid-Limburg 354,422,789.38 2.05% 2,529 3.11% 69.10%
NLZZZ - Extra-Regio
Total 17,282,498,843.08 100.00% 104,446 3.03% 66.54%
Dolphin Master Issuer B.V.
Monthly Portfolio and Performance Report: 1 April 2020 - 30 April 2020
20. Geographical Distribution (by economic region)
% of Total Weighted Average Maturity
0.82% 18.24
0.34% 18.09
1.70% 19.85
1.29% 20.45
0.45% 20.54
0.80% 20.82
0.91% 20.58
0.77% 19.16
0.64% 20.99
1.39% 20.15
0.73% 19.72
3.07% 19.55
3.23% 20.55
1.20% 19.76
1.88% 19.99
3.78% 20.35
2.55% 19.11
8.14% 20.07
2.86% 19.21
1.98% 20.32
1.57% 19.21
1.61% 21.33
1.28% 19.30
7.07% 21.01
1.42% 21.85
2.94% 19.40
5.95% 19.24
1.80% 18.17
2.28% 18.44
10.02% 18.35
2.43% 19.12
0.57% 17.53
1.88% 18.50
4.51% 19.66
3.05% 19.73
3.55% 21.08
4.59% 20.64
1.44% 19.63
100.00% 19.79
1.11% 19.26
2.42% 19.62

31 / 43
% of Total Nr of Loans Weighted Average Coupon
Weighted Average
CLTOMV99.78% 104,310 3.03% 66.52%
0.12% 68 2.89% 77.31%
0.08% 50 2.64% 74.96%
0.02% 14 2.81% 79.11%
0.01% 4 2.58% 64.65%
100.00% 104,446 3.03% 66.54%
Dolphin Master Issuer B.V.
Monthly Portfolio and Performance Report: 1 April 2020 - 30 April 2020
21. Construction Deposits (as percentage of Net Principal Balance)
From ( > ) - Until ( <= ) Net Principal Balance % of Total Weighted Average Maturity
<= 0% 17,243,684,155.44 99.87% 19.78
0% - 10% 20,068,234.55 0.07% 22.89
10% - 20% 14,189,079.89 0.05% 24.77
20% - 30% 3,529,959.13 0.01% 22.98
30% - 40% 1,027,414.07 0.00% 25.22
40% - 50%
50% - 60%
60% - 70%
70% - 80%
80% - 90%
90% >
Unknown
Total 17,282,498,843.08 100.00% 19.79
Weighted Average 0.03%
Minimum 0.00%
Maximum 34.05%
32 / 43
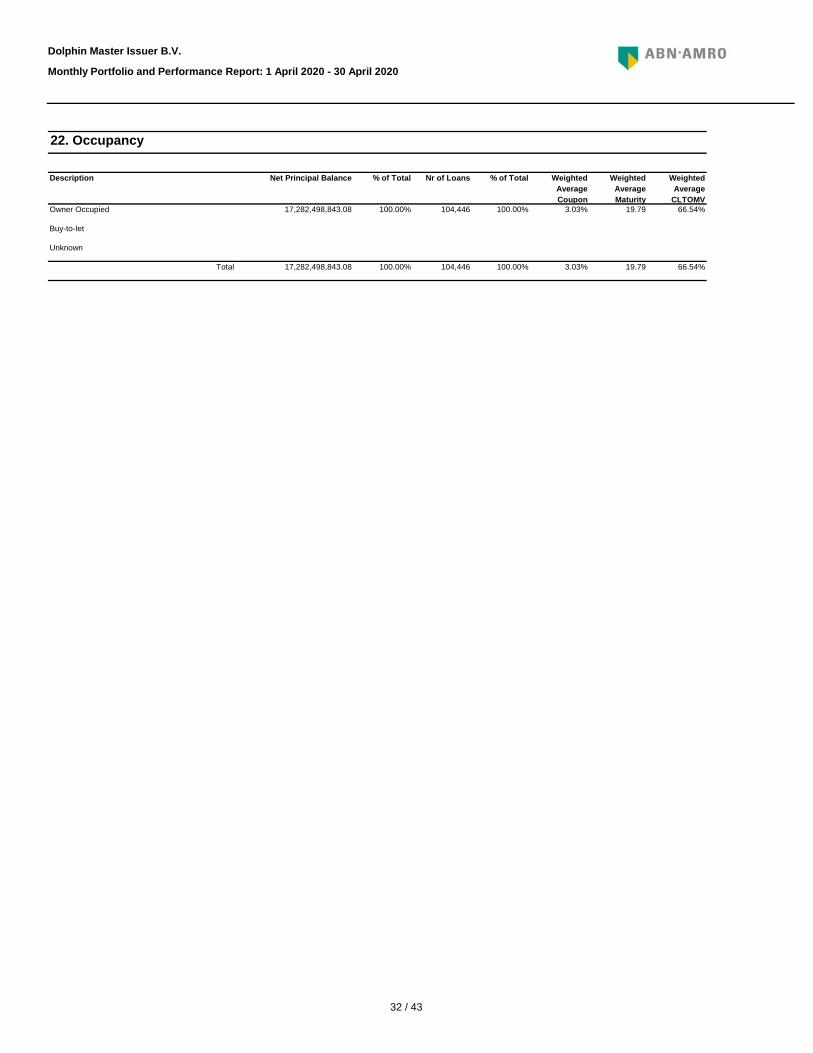
Description Net Principal Balance % of Total Nr of Loans Weighted Average Coupon
Weighted Average
CLTOMVOwner Occupied 17,282,498,843.08 100.00% 104,446 3.03% 66.54%
Buy-to-let
Unknown
Total 17,282,498,843.08 100.00% 104,446 3.03% 66.54%
Dolphin Master Issuer B.V.
Monthly Portfolio and Performance Report: 1 April 2020 - 30 April 2020
22. Occupancy
100.00% 19.79
% of Total Weighted Average Maturity
100.00% 19.79
33 / 43
Description Net Principal Balance % of Total Nr of Loans Weighted Average Coupon
Weighted Average
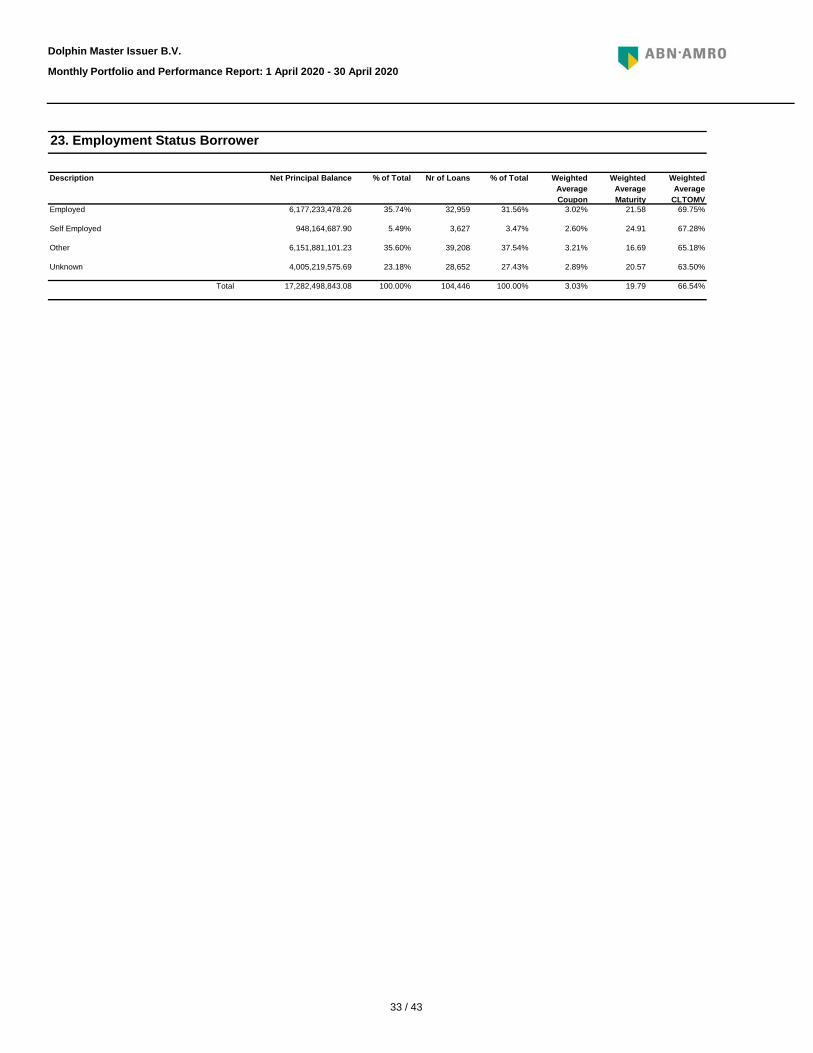
CLTOMVEmployed 6,177,233,478.26 35.74% 32,959 3.02% 69.75%
Self Employed 948,164,687.90 5.49% 3,627 2.60% 67.28%
Other 6,151,881,101.23 35.60% 39,208 3.21% 65.18%
Unknown 4,005,219,575.69 23.18% 28,652 2.89% 63.50%
Total 17,282,498,843.08 100.00% 104,446 3.03% 66.54%
Dolphin Master Issuer B.V.
Monthly Portfolio and Performance Report: 1 April 2020 - 30 April 2020
23. Employment Status Borrower
% of Total Weighted Average Maturity
31.56% 21.58
3.47% 24.91
37.54% 16.69
27.43% 20.57
100.00% 19.79

34 / 43
% of Total Nr of Loans Weighted Average Coupon
Weighted Average
CLTOMV0.14% 957 2.81% 33.32%
0.58% 1,777 2.75% 35.02%
1.31% 2,408 2.72% 40.35%
2.28% 3,216 2.73% 47.72%
3.37% 3,814 2.81% 55.13%
4.68% 4,704 2.85% 61.17%
5.61% 4,961 2.88% 66.15%
6.40% 5,192 2.89% 71.03%
6.12% 4,677 2.88% 74.27%
4.92% 3,470 2.86% 77.23%
3.13% 2,147 2.87% 79.36%
1.96% 1,281 2.86% 78.88%
1.00% 621 2.81% 76.59%
0.74% 455 2.83% 74.68%
1.35% 801 3.04% 76.97%
56.41% 63,965 3.17% 65.53%
100.00% 104,446 3.03% 66.54%
Dolphin Master Issuer B.V.
Monthly Portfolio and Performance Report: 1 April 2020 - 30 April 2020
24. Loan to Income
From ( > ) - Until ( <= ) Net Principal Balance % of Total Weighted Average Maturity
<= 0.5 23,344,967.86 0.92% 18.19
0.5 - 1.0 100,960,723.92 1.70% 19.90
1.0 - 1.5 226,144,140.24 2.31% 21.71
1.5 - 2.0 394,407,688.33 3.08% 22.41
2.0 - 2.5 583,235,518.41 3.65% 22.76
2.5 - 3.0 809,044,817.77 4.50% 22.92
3.0 - 3.5 970,182,628.49 4.75% 23.18
3.5 - 4.0 1,106,549,770.79 4.97% 23.11
4.0 - 4.5 1,056,913,016.44 4.48% 23.35
4.5 - 5.0 850,900,350.86 3.32% 22.78
5.0 - 5.5 541,320,444.57 2.06% 22.13
5.5 - 6.0 338,097,396.58 1.23% 22.45
6.0 - 6.5 172,031,920.19 0.59% 22.93
6.5 - 7.0 127,912,833.97 0.44% 23.42
7.0 > 232,878,995.09 0.77% 22.63
Unknown 9,748,573,629.57 61.24% 17.45
Total 17,282,498,843.08 100.00% 19.79
Weighted Average 3.8
Minimum 0.0
Maximum 10.0

35 / 43
% of Total Nr of Loans Weighted Average Coupon
Weighted Average
CLTOMV3.10% 6,042 2.07% 46.19%
8.98% 10,065 2.33% 57.38%
11.31% 9,834 2.71% 68.89%
9.49% 7,230 3.06% 73.52%
5.98% 4,256 3.44% 75.32%
2.60% 1,733 3.63% 78.04%
1.20% 748 3.31% 78.33%
0.58% 360 3.41% 79.03%
0.28% 181 3.69% 79.20%
0.13% 88 4.35% 75.36%
0.07% 48 4.39% 77.38%
0.05% 35 4.39% 73.04%
0.03% 22 4.63% 74.79%
0.02% 13 3.92% 82.05%
0.06% 42 4.17% 73.87%
56.13% 63,749 3.17% 65.51%
100.00% 104,446 3.03% 66.54%
Dolphin Master Issuer B.V.
Monthly Portfolio and Performance Report: 1 April 2020 - 30 April 2020
25. Debt Service to Income
From ( > ) - Until ( <= ) Net Principal Balance % of Total Weighted Average Maturity
<= 5% 534,957,810.65 5.78% 23.12
5% - 10% 1,551,200,165.12 9.64% 23.67
10% - 15% 1,955,318,310.84 9.42% 23.20
15% - 20% 1,640,519,973.45 6.92% 22.64
20% - 25% 1,034,137,854.85 4.07% 21.62
25% - 30% 448,792,253.58 1.66% 21.53
30% - 35% 206,819,855.96 0.72% 22.97
35% - 40% 99,690,595.08 0.34% 22.76
40% - 45% 48,957,120.68 0.17% 22.55
45% - 50% 22,446,850.00 0.08% 19.46
50% - 55% 11,705,522.57 0.05% 18.15
55% - 60% 8,505,999.15 0.03% 21.11
60% - 65% 5,119,067.35 0.02% 20.50
65% - 70% 3,549,514.73 0.01% 19.87
70 % > 9,575,483.71 0.04% 18.17
Unknown 9,701,202,465.36 61.04% 17.43
Total 17,282,498,843.08 100.00% 19.79
Weighted Average 15.54%
Minimum 0.00%
Maximum 99.52%

36 / 43
Description Net Principal Balance % of Total Nr of Loanparts
Weighted Average Coupon
Weighted Average
CLTOMVMonthly 17,282,498,843.08 100.00% 203,146 3.03% 66.54%
Quarterly
Semi-annually
Annually
Total 17,282,498,843.08 100.00% 203,146 3.03% 66.54%
Dolphin Master Issuer B.V.
Monthly Portfolio and Performance Report: 1 April 2020 - 30 April 2020
26. Loanpart Payment Frequency
% of Total Weighted Average Maturity
100.00% 19.79
100.00% 19.79

37 / 43
Description Net Principal Balance % of Total Nr of Loanparts
Weighted Average Coupon
Weighted Average
CLTOMVNHG Loans
Non NHG Loans 17,282,498,843.08 100.00% 203,146 3.03% 66.54%
Total 17,282,498,843.08 100.00% 203,146 3.03% 66.54%
Dolphin Master Issuer B.V.
Monthly Portfolio and Performance Report: 1 April 2020 - 30 April 2020
27. Guarantee Type (NHG / Non NHG)
100.00% 19.79
% of Total Weighted Average Maturity
100.00% 19.79

38 / 43
Originator Net Principal Balance % of Total Nr of Loanparts
Weighted Average Coupon
Weighted Average
CLTOMVABN AMRO 4,350,367,986.12 25.17% 52,613 2.85% 63.70%
Florius (label) 3,859,133,551.64 22.33% 43,985 3.03% 68.14%
Florius 9,072,997,305.32 52.50% 106,548 3.12% 67.23%
Total 17,282,498,843.08 100.00% 203,146 3.03% 66.54%
Dolphin Master Issuer B.V.
Monthly Portfolio and Performance Report: 1 April 2020 - 30 April 2020
28. Originator
52.45% 20.77
100.00% 19.79
% of Total Weighted Average Maturity
25.90% 18.73
21.65% 18.67
39 / 43
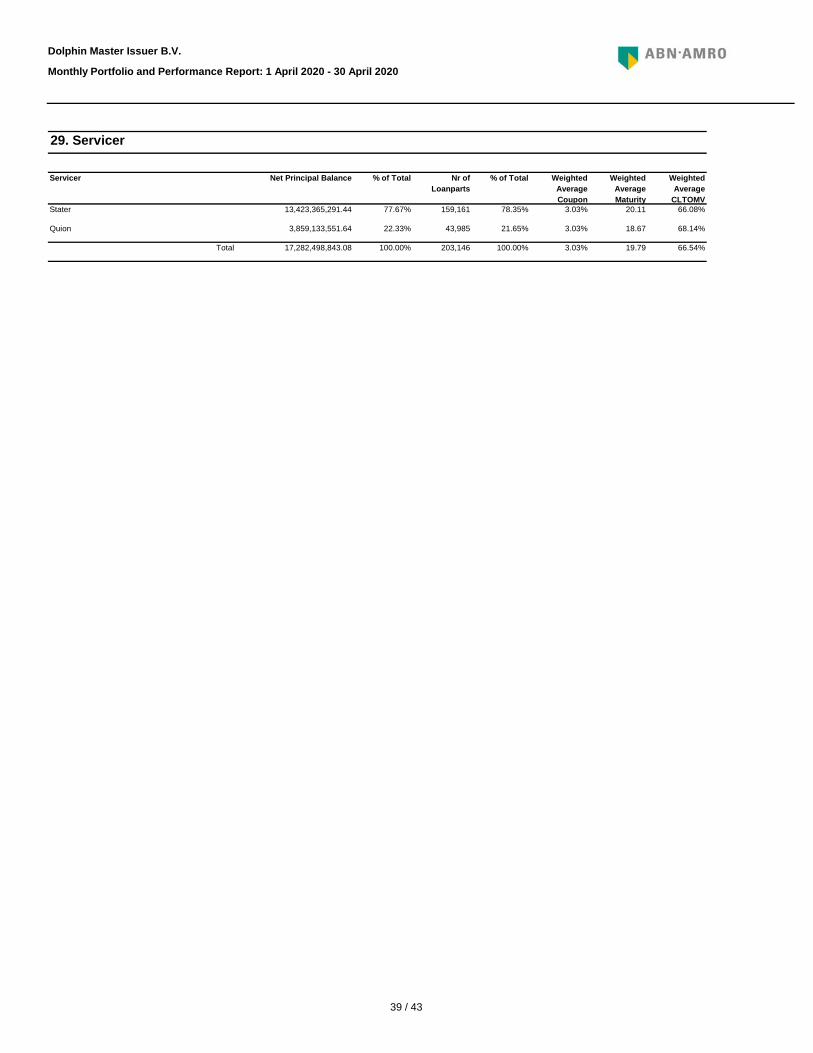
Servicer Net Principal Balance % of Total Nr of Loanparts
Weighted Average Coupon
Weighted Average
CLTOMVStater 13,423,365,291.44 77.67% 159,161 3.03% 66.08%
Quion 3,859,133,551.64 22.33% 43,985 3.03% 68.14%
Total 17,282,498,843.08 100.00% 203,146 3.03% 66.54%
Dolphin Master Issuer B.V.
Monthly Portfolio and Performance Report: 1 April 2020 - 30 April 2020
29. Servicer
100.00% 19.79
% of Total Weighted Average Maturity
78.35% 20.11
21.65% 18.67

40 / 43
Insurance Policy Provider Net Principal Balance % of Total Nr of Loanparts
Weighted Average Coupon
Weighted Average
CLTOMVNo policy attached 13,969,853,543.18 80.83% 161,176 2.91% 65.84%
ABN AMRO 228,255,096.06 1.32% 3,928 3.61% 66.14%
ASR 2,166,363,682.90 12.54% 26,188 3.63% 69.03%
Delta Lloyd (51%) ABN AMRO (49%) 76,753,177.17 0.44% 1,016 3.33% 67.21%
SRLEV N.V. 377,124,443.08 2.18% 5,636 3.87% 68.73%
Others 464,148,900.69 2.69% 5,202 3.03% 74.29%
Total 17,282,498,843.08 100.00% 203,146 3.03% 66.54%
Dolphin Master Issuer B.V.
Monthly Portfolio and Performance Report: 1 April 2020 - 30 April 2020
30. Capital Insurance Policy Provider
% of Total Weighted Average Maturity
79.34% 21.45
1.93% 15.64
2.56% 11.07
100.00% 19.79
12.89% 12.72
0.50% 12.62
2.77% 13.67

41 /43
Issuer Redemption Priority of Payments means the priority of payments as set out in section 5.2 (Priority of Payments) of this Base Prospectus.
Issuer Reserve Account means the bank account of the Issuer designated as such in the Issuer Account Agreement.
Interest Rate Fixed Period means the period for which the interest on a mortgage loon has been fixed.
Issuer means Dolphin Master Issuer B.V., a private company with limited liability (besloten vennootschap met beperkte aansprakelijkheid) incorporated under Dutch law and established in Amsterdam.
Issuer Account Bank means ABN AMRO Bank N.V..
IC Loan means any advance of moneys granted by the Issuer to the Asset Purchaser.
Indexed Foreclosure Value means the value calculated by indexing the Original Foreclosure Value with a property price index (weighted average of houses and apartments prices), as provided by the Land Registry or NVM for the province where the property is located.
Indexed Market Value means the value calculated by indexing the Original Market Value with a property price index (weighted average of houses and apartments prices), as provided by the Land Registry or NVM for the province where the property is located.
Foreclosure means forced (partial) repayment of the mortgage loan.
Foreclosure Value means the foreclosure value of the Mortgaged Asset. which is the estimated value of a mortgaged property if that property would be sold in a public auction.
Further Advances / Modified Loans means a loan or a further advance to be made to a Borrower under a Mortgage Loan, which is secured by the same Mortgage.
Foreclosed Mortgage Loan means all mortgage rights and ancillary rights have been exercised.
Foreclosed NHG Loan means all mortgage rights and ancillary rights have been exercised on a mortgage that has the benefit of a NHG Guarantee.
Foreclosed Non NHG Loan means all mortgage rights and ancillary rights have been exercised on a mortgage that does not have the benefit of a NHG Guarantee.
Excess Spread Percentage means 0.5 per cent. per annum.
Final Maturity Date means in respect of a Series and Class or Sub-class of Notes, the Final Maturity Date set out in the Applicable Final Terms.
First Optional Redemption Date means, in respect of the Notes of a Series and Class or Sub-class, the Notes Payment Date listed as first optional redemption date in the Applicable Final Terms.
Delinquency means a mortgage loan being in arrear.
Economic Region means an economic region as determined based on the zip code of the property underlying the mortgage loan based on the Nomenclature of Territorial Units for Statistics (NUTS).
Excess Spread Margin means the excess margin of 0.5 per cent. per annum of the sum of (a) the Principal Outstanding Amount of all IC Loans of the Asset Purchaser on the first day of each IC Interest Period in the relevant Floating Rate Interest Period, less (b) any IC Loan Principal Deficiency recorded on the IC Loan
Debt Service to Income means the ratio calculated by dividing the total annual interest and principal payments a borrower is required to make by the borrowers disposable income.
Deferred Purchase Price means part of the purchase price for the Mortgage Receivables equal to the sum of all Deferred Purchase Price Instalments.
Deferred Purchase Price Instalment means, after application of the relevant available amounts in accordance with the relevant Priority of Payments, any amount remaining after all items ranking higher than the item relating to the Deferred Purchase Price have been satisfied.
Current Loan to Original Market Value (CLTOMV) means the ratio calculated by dividing the outstanding principal amount of a mortgage receivable by the original market value.
Cut-Off Date means the date at which the closing pool has been created.
Day Count Convention means actual/360 with respect to floating rate notes, and actual/actual with respect to fixed rate notes.
Current Loan to Indexed Foreclosure Value (CLTIFV) means the ratio calculated by dividing the outstanding principal amount of a mortgage receivable by the indexed foreclosure value.
Current Loan to Indexed Market Value (CLTIMV) means the ratio calculated by dividing the outstanding principal amount of a mortgage receivable by the indexed market value.
Current Loan to Original Foreclosure Value(CLTOFV) means the ratio calculated by dividing the outstanding principal amount of a mortgage receivable by the original foreclosure value.
Coupon means the interest coupons appertaining to the Notes.
Credit Enhancement means the combined structural features that improve the credit worthiness of the respective notes. Types of credit enhancement might consist of subordinated notes, excess spread and a reserve account.
Credit Rating An assessment of the credit worthiness of the notes assigned by a Credit Rating Agency.
Constant Prepayment Rate (CPR) means the ratio calculated by dividing the annualized scheduled repayments and prepayments by the outstanding principal balances of the mortgage pool at the beginning of the relevant period.
Construction Deposit means in relation to a Mortgage Loan, that part of the Mortgage Loan which the relevant Borrower requested to be disbursed into a blocked account held in his name with the relevant Seller, the proceeds of which may be applied towards construction of, or improvements to, the relevant Mortgaged
Construction Deposit Guarantee N/A
Cash Advance Facility Provider N/A
Cash Advance Facility Stand-by Drawing Account N/A
Constant Default Rate (CDR) means the ratio calculated by dividing the outstanding principal balances in the pool that are in default (delinquent for more than 90 days) by the total outstanding principal balance of the pool.
Back-Up Servicer N/A
Cash Advance Facility N/A
Cash Advance Facility Maximum Available Amount N/A
Asset Purchaser Swap Counterparty means ABN AMRO Bank N.V..
Asset Purchaser Swap Counterparty Default Payment means any termination payment due and payable to the Swap Counterparty as a result of (i) an Event of Default where the Asset Purchaser Swap Counterparty is the Defaulting Party or (ii) an Additional Termination Event where the Swap Counterparty is the sole Affected Party, including a
Asset Purchaser Swap Notional Amount means an amount equal to the aggregate Principal Outstanding Amount on the IC Loans . less an amount equal to any balance standing to the debit of the IC Loan Principal Deficiency Ledger as at the first date of such Floating Rate Interest Period (taking into account the amount of principal repaid
Asset Purchaser Account Bank means ABN AMRO Bank N.V..
Asset Purchaser Redemption Priority of Payments means the priority of payments as set out as such in section 5.9 (Priority of Payments) of this Base Prospectus.
Asset Purchaser Revenue Priority of Payments means the priority of payments as set out in section 5.9 (Priority of Payments) of this Base Prospectus.
Article 122a CRD means Article 122a of Directive 2006/48/EC as issued by the European Parliament and Council (as amended by Directive 2009/111/EC).
Asset Purchaser means Dolphin Asset Purchasing B.V., a private company with limited liability ("besloten vennootschap met beperkte aansprakelijkheid") incorporated under Dutch law and established in Amsterdam, or, as the case may be, any asset purchaser who accedes to the Programme as Asset Purchaser.
Asset Purchaser Accounts means any of the Asset Purchaser Collection Account and the Asset Purchaser Construction Deposit Account.
[Article 405 of the CRR] means Article 405 of Regulation (EU) No 575/2013 of the European Parliament andof the Council of 26 June 2013 on prudential requirements for credit institutions and
[Article 51 of the AIFMR] means Article 51 of the Commission Delegated Regulation No 231/2013 of 19December 2012 supplementing Directive 2011/61/EU of the European Parliament
Arrears means any amounts due by a borrower (including scheduled interest, scheduled principal, arrears penalties on scheduled amounts in arrears, and any other amounts) that are unpaid at the reporting date.
Dolphin Master Issuer B.V.
Monthly Portfolio and Performance Report: 1 April 2020 - 30 April 2020
Glossary
Term Definition / Calculation

42 /43
WEW Claims means losses which are claimed with the WEW based on the NHG conditions.
Weighted Average Life means the expected average number of years for which each euro of unpaid principal on an issued note is to remains outstanding, whereby the time between the initial period and each repayment is weighted by the principal amout outstanding on the notes.
Weighted Average Maturity means the expected average number of years between the Cut-off date and the legal maturity of the mortgage loans weighted over the Net Outstanding Balance of the mortgage loans.
WEW means Stichting Waarborgfonds Eigen Woningen.
Trigger Event has the meaning ascribed to it in section 5.2 (Priority of Payments) of this Base Prospectus.
Unreserved Ledger has the meaning ascribed to it in section 5.5 (Issuer Transaction Account) of this Base Prospectus.
Unreserved Ledger Required Amount means, on any date, an amount equal to the aggregate Principal Amount Outstanding of the Class D Notes of all Series on their respective Issue Dates that are outstanding on such date, taking into account any redemptions and any issuances of Class D Notes to be made on such date.
Special Servicer N/A
Sub- Servicer means Stater Nederland B.V. in relation to Mortgage Receivables sold by ABN AMRO Bank N.V.,ABN AMRO Hypotheken Groep B.V, MoneYou B.V..; and Quion Groep B.V in relation to Mortgage Receivables sold by Oosteroever Hypotheken B.V. and Quion 9 B.V.
Subordinated Loan has the meaning ascribed to it in section 5.7 (IC Loan Agreement) of this Base Prospectus.
Seasoning means he period between the origination date of the mortgage loan and the cut-off date.
Sellers means ABN AMRO Bank N.V., ABN AMRO Hypotheken Groep B.V., MoneYou B.V., Quion 9 B.V. and Oosteroever Hypotheken B.V.;
Servicer means ABN AMRO Hypotheken Groep B.V..
Repossessions means the seizure of collateral by the lender during the foreclosure process.
Reserved Ledger has the meaning ascribed to it in section 5.5 (Issuer Transaction Accounts) of this Base Prospectus.
Saving Deposits means the savings in a bank account that is linked to a savings mortgage loan, which is meant to repay the loan at maturity.
Remaining Tenor means the period between the cut-off date and the legal maturity of a loan part.
Replacements n/a
Replenishments means any new mortgage receivables which are sold and assigned by the Seller to the Asset Purchaser as ascribed in section 7.1 (Purchase, repurchase and sale) of the Base Prospectus.
Purchase Conditions has the meaning ascribed to it in section 7.4 (Portfolio Conditions) of the Base Prospectus.
Realised Losses has the meaning ascribed thereto in section 5.10 (Loss Allocation) of the Base Prospectus.
Recoveries means collection of proceeds towards redemption of any outstanding claims on the borrower relating to the mortgage loan including both foreclosure and post-foreclosure proceeds.
Principal Payment Rate (PPR) The ratio calculated by dividing the sum of the collections of the principal receivables by the amount of the outstanding principal balances of the mortgage pool at the beginning the relevant period.
Pro-Rata Condition has the meaning ascribed to it in section 5.1 (Available Funds) of the Base Prospectus.
Prospectus means the offering circular relating to the issue of the relevant notes.
Prepayments means non scheduled principal paid by the borrower prior to the expected maturity date.
Principal Deficiency Ledger means the principal deficiency ledger relating to the IC Loans as well as the sub-ledgers related to the different classes of notes.
Principal Payment Date means any Note Payment Date on which the Principal Outstanding Amount on a Note is repaid either partly or in full.
Performing Loans means Mortgage Loans that are not in Arrear or Delinquent.
Portfolio Review Event has the meaning ascribed to it in section 7.4 (Portfolio Conditions) of this Base Prospectus.
Post-Foreclosure Proceeds means all recoveries with regard to the relavant mortgage loan received after foreclosure of that mortgage loan.
Outstanding Principal Amount means, at any moment in time, (i) the outstanding principal amount of a mortgage receivable at such time (net of any saving deposits related to the mortgage receivable) and (ii), after a realised loss in respect of such mortgage receivable having occurred, zero.
Payment Ratio N/A
Penalties means amounts to be paid by the borrower with regard to amounts in arrears and or (partial) prepayment of the mortgage loan according to the relevant mortgage contract and applicable general conditions.
Original Loan to Original Market Value (OLTOMV) means the ratio calculated by dividing the outstanding principal amount of a mortgage receivable by the original market value.
Original Market Value means the Market Value as assessed by the relevant Originator (or derived from the Foreclosure Value) at the time of granting the Mortgage Loan, or subsequently in case a new valuation is performed the Market Value as assigned (or derived from the Foreclosure Value) by the valuer in that
Originator means the relevant originator of a Mortgage Loan.
Occupancy means the way the mortgaged property is used.
Original Foreclosure Value means the Foreclosure Value as assessed by the relevant Originator (or derived from the Market Value) at the time of granting the Mortgage Loan, or subsequently in case a new valuation is performed the Foreclosure Value as assigned (or derived from the Market Value) by the valuer in that
Original Loan to Original Foreclosure Value(OLTOFV means the ratio calculated by dividing the outstanding principal amount of a mortgage receivable by the original foreclosure value.
Non NHG Loan means a mortgage loan that does not benefit from a NHG Guarantee.
Notification Events means any of the issuer pledge notification events, the asset purchaser pledge notification events, and the asset purchaser assignment notification events specified in Clause 7.1 of the Base Prospectus.
Notification Trigger means an event that when it occurs, or a threshold that when it is breached. is considered as an asset purchaser assignment notification event.
Net Outstanding Balance means the agregate outstanding principal amount on the mortgage pool net of savings deposits.
NHG Guarantee means a guarantee (borgtocht) under the NHG Conditions granted by Stichting WEW.
NHG Loan means a mortgage loan that benefits from a NHG Guarantee.
Mortgage Loan Criteria has the meaning ascribed to it in section 5.3 (Mortgage Loan Criteria) of this Base Prospectus.
Mortgage Loan Portfolio means the portfolio of mortgage loans of which the legal assignment resides with the Issuer at a given point in time.
Mortgage Receivable means any and all rights of the relevant Seller (and after assignment of such rights to the Asset Purchaser, of the Asset Purchaser) against the Borrower under or in connection with a Mortgage Loan, including any and all claims of the Seller (or the Asset Purchaser after assignment) on the
Loss Severity means the ratio calculated by dividing the loss on a mortgage loan by the outstanding principal amount on that mortgage loan.
Market Value means the estimated value of a mortgaged property if that property would be privately sold voluntary.
Mortgage Loan means, after any purchase and assignment of any New Mortgage Receivables and Further Advance Receivables has taken place in accordance with the Asset Purchaser Mortgage Receivables Purchase Agreement, the mortgage loans granted by the relevant Seller or the relevant Originator to the
Loan part Payment Frequency means the contractually agreed number of principal and/or interest payments made by the borrower on an annual basis.
Loan to Income (LTI) means the ratio calculated by dividing the outstanding principal amount on a mortgage loan by the sum of all income of the borrowers at the moment of origination of the mortgage loan.
Loss means any amounts due by the borrower less any net proceeds after a foreclosure.
Issuer Transaction Account means any of the Issuer Collection Account, the Issuer Pre-Funded Account, and the Issuer Reserve Account.
Issuer Trust Deed means the issuer trust deed entered into by, amongst others, the Issuer and the Security Trustee dated the Programme Signing Date.
Loan part means one or more loan parts (leningdelen) of which a mortgage loan consists. the different loan parts of a mortgage loan usually differentiate for repayment type or maturity date.
Issuer Revenue Priority of Payments means the priority of payments set out in section 5.2 (Priority of Payments) of this Base Prospectus.

43/43
ABN AMRO Bank N.V.
Gustav Mahlerlaan 10
1082 PP Amsterdam
the Netherlands
Ernst & Young Accountants LLP
Antonio Vivaldistraat 150
1083 HP Amsterdam
the Netherlands
BNP Paribas Securities Services, Luxembourg Branch33, rue de Gasperich, Howald - Hesperage
L-2085 Luxembourg
Luxembourg
ABN AMRO Hypotheken Groep B.V.
Postbus 1700
3800 BS Amersfoort
the Netherlands
NautaDutilh N.V.
Strawinskylaan 1999
1077 XV Amsterdam
the Netherlands
ABN AMRO Bank N.V.
Gustav Mahlerlaan 10
1082 PP Amsterdam
the Netherlands
ABN AMRO Bank N.V.
Gustav Mahlerlaan 10
1082 PP Amsterdam
the Netherlands
ABN AMRO Bank N.V.
Gustav Mahlerlaan 10
1082 PP Amsterdam
the Netherlands
MoneYou B.V.
Sciencepark 404
1098 XH Amsterdam
the Netherlands
Quion 9 B.V.
Fascinatio Boulevard 1302
2909 VA Capelle a/d IJssel
the Netherlands
Quion Groep B.V.
Fascinatio Boulevard 1302
2909 VA Capelle a/d IJssel
the Netherlands
ABN AMRO Bank N.V.
Gustav Mahlerlaan 10
1082 PP Amsterdam
the Netherlands
the Netherlands
SWAP Couterparty
Podium 1
3826 PA Amersfoort
the Netherlands
Sub-Servicer Sub-Servicer Stater Nederland B.V.
Gustav Mahlerlaan 10
1082 PP Amsterdam
the Netherlands
Seller Servicer ABN AMRO Bank N.V.
Fascinatio Boulevard 1302
2909 VA Capelle a/d IJssel
the Netherlands
Seller Seller Oosteroever Hypotheken B.V.
Postbus 1700
3800 BS Amersfoort
the Netherlands
Seller Seller ABN AMRO Hypotheken Groep B.V.
Prins Bernhardplein 200
1097 JB Amsterdam
Luxembourg
Reference Agent Security Trustee Stichting Security Trustee Dolphin
33, rue de Gasperich, Howald - Hesperage
L-2085 Luxembourg
the Netherlands
Paying Agent Principal Paying Agent BNP Paribas Securities Services, Luxembourg Branch
Gustav Mahlerlaan 10
1082 PP Amsterdam
the Netherlands
Legal Advisor (Seller and Issuer) Listing Agent ABN AMRO Bank N.V.
Prins Bernhardplein 200
1097 JB 1076 EE Amsterdam
Luxembourg
Company Administrator Issuer Dolphin Master Issuer B.V.
42 Avenue J.F. Kennedy
L-2085 Luxembourg
Luxembourg
Common Depositary Common Safekeeper (wrt Class A) Clearstream
33, rue de Gasperich, Howald - Hesperage
L-2085 Luxembourg
Auditor Commom Safekeeper (wrt Class B & C) BNP Paribas Securities Services, Luxembourg Branch
Gustav Mahlerlaan 10
1082 PP Amsterdam
Dolphin Master Issuer B.V.
Monthly Portfolio and Performance Report: 1 April 2020 - 30 April 2020
Contact Information
Account Bank Arranger ABN AMRO Bank N.V.
the Netherlands