spatial structure and genetic diversity of two tropical ... · for the management and conservation...
TRANSCRIPT

Molecular Ecology (2004) doi: 10.1046/j.l365-294X.2004.02094.x
Spatial structure and genetic diversity of two tropical tree species with contrasting breeding systems and different ploidy levels
KEVIN K. S. NG,*S. L. LEE*andC. L. KOHt *Genetic Laboratory, Forest Research Institute Malaysia, 52109 Kuala Lumpur, Malaysia, ilnstitute of Biological Sciences, Faculty of Science, University of Malaya, 50603 Kuala Lumpur, Malaysia
Abstract
Analyses of the spatial distribution pattern, spatial genetic structure and of genetic diver- sity were carried out in two tropical tree species with contrasting breeding systems and dif- ferent ploidy levels using a 50-ha demographic plot in a lowland dipterocarp forest in Peninsular Malaysia. Shorea leprosula is a diploid and predominantly outcrossed species, whereas S. ovalis ssp. sericea is an autotetraploid species with apomictic mode of repro- duction. Genetic diversity parameters estimated for S. leprosula using microsatellite were consistently higher than using allozyme. In comparisons with S. leprosula and other tropical tree species, S. ovalis ssp. sericea also displayed relatively high levels of genetic diversity. This might be explained by the lower pressure of genetic drift due to tetrasomic inherit- ance, and for autotetraploids each locus can accommodate up to four different alíeles and this allows maintenance of more alíeles at individual loci. The observed high levels of genetic diversity in S. ovalis ssp. sericea can also be due to a random retention of more heterogeneous individuals in the past, and the apomictic mode of reproduction might be an evolutionary strategy, which allows the species to maintain high levels of genetic diversity. The spatial distribution pattern analyses of both species showed significant levels of aggrega- tion at small and medium but random distribution at the big diameter-class. The decrease in magnitude of spatial aggregation from small- to large-diameter classes might be due to compensatory mortality during recruitment and survival under competitive thinning process. Spatial genetic structure analyses for both species revealed significant spatial genetic struc- ture for short distances in all the three diameter-classes. The magnitude of spatial genetic structure in both species was observed to be decreasing from smaller- to larger-diameter classes. The high spatial genetic structuring observed in S. ovalis ssp. sericea at the small- diameter class is due primarily to limited seed dispersal and apomictic mode of reproduction. The similar observation in S. leprosula, however, can be explained by limited seed and pollen dispersal, which supports further the fact that the species is pollinated by weak fliers, mainly of Thrips and Megalurothrips in the lowland dipterocarp forest.
Keywords: allozyme, genetic diversity, microsatellite, Shorea, spatial distribution pattern, spatial genetic structure, tropical tree species
Received 14 August 2003; revision received 23 August 2003; accepted 14 November 2003
. processes such as seed dispersal, intra- and interspecific competition and environmental heterogeneity which take
The spatial distribution pattern, within plant populations, place during the life history of a plant. Seed shadow is influenced by various ecological and evolutionary basically determines the spatial distribution pattern of
cohorts. After seed dispersal, the compensatory mortality
Correspondence: Soon-Leong Lee. Fax: 603 62797878; E-mail: due to intra-and interspecific competitions, environmental [email protected] heterogeneity, herbivores and plant diseases would
© 2004 Blackwell Publishing Ltd
2 K. K. S. NG, S. L. LEE and C. L. KOH
affect the spatial distribution pattern. The degree to which individuals are aggregated affects plant mating systems and also how plant species use resources or can be used as resources (Condit et al. 2000).
The spatial genetic structure within plant populations, in addition to the ecological and evolutionary processes that affect spatial distribution patterns, can also be influ- enced by limited pollen dispersal, local genetic drift, inbreeding and selection favouring the same or different genotypes (Wright 1943; Levin & Kerster 1974; Turner et al. 1982; Heywood 1991; Epperson 1992,1995). Studies of spa- tial genetic structure in plant populations can reveal the operation of key evolutionary processes. When spatial genetic structure develops, it may influence the patterns of local breeding and evolution. Hence, understanding of spatial genetic structure at the population level is crucial for the management and conservation of genetic resources.
Information on spatial genetic structure within natural stands have been reported extensively for temperate forest trees species but somewhat limited for tropical forest trees. For temperate forest tree species, the majority of the stud- ies showed weak spatial genetic structure, consistent with long-distance seed and pollen dispersal (e.g. Epperson & AUard 1989; Berg & Hamrick 1995; Schnabel & Hamrick 1995; Leonardi et al. 1996; Chung et al. 2000; Epperson & Chung 2001; Parker et al. 2001). However, some studies showed significant spatial genetic structure and these were explained by limited seed dispersal (e.g. Schnabel et al. 1991; Chung & Epperson 2000).
For tropical forest tree species, Hamrick et al. (1993) showed that spatial genetic structure was present in small- and intermediate-diameter classes for Platypodium elegans, Alseis blackiana and Swartzia simplex in Panama. Boshier etal. (1995), in their study of Cordia alliodora, showed that near neighbours were related genetically more highly than more distant trees. Doligez & Joly (1997) revealed no clearcut spatial pattern of Carapa procera in French Guiana. Degen et al. (2001a), when applying a multilocus approach using a random amplified polymorphic DNA (RAPD) marker on eight tropical tree species revealed significant spatial genetic structure at distances up to 300 m for some of these species. Spatial structure varies with life history stages (Epperson & Alvarez-Buylla 1997). However, there are few studies of the spatial distribution of genetic variation in different age or size classes of plants. Analysis of spatial genetic struc- ture without consideration of life stage or age may fail to observe spatial structure and might lead to misinterpreta- tion of the underlying ecological and evolutionary processes (Aldrich etal. 1998; Schnabel etal. 1998; Caron etal. 2000; Kahsz et al. 2001).
Shorea leprosula and S. ovalis ssp. sericea are both common dipterocarps and distributed widely in Peninsular Malaysia (Symington 1943; Ashton 1982). Previous studies on S. lep- rosula showed that it is a diploid (2M = 14; Jong & Lethbridge
1967), reproduced mainly through outcrossing (Chan 1981; Lee et al. 2000a), and with low energy flower thrips (Thysanoptera), mainly Thrips and Megalurothrips as the primary pollinators (Chan & Appanah 1980; Appanah & Chan 1981). S. ovalis ssp. sericea is known to be a tetraploid (4M = 28; Jong & Lethbridge 1967; Jong & Kaur 1979) and reproduce largely apomictically through adventive poly- embryony, in which outgrowth of the nucellar or integument cells produce an embryo (Kaur et al. 1978,1986). Although both species produce winged seeds, seed dispersal is due mainly to gravity and seldom exceeds 50 m radius from the mother trees (Webber 1934; Chan 1980).
Outcrossing plants in general exhibit higher levels of genetic diversity than selfing plants (Hamrick & Godt 1996). AUozyme study of S. leprosula throughout Malaysia showed that the species exhibited high levels of genetic diversity and most of the diversity was partitioned within popula- tions (Lee et al. 2000b). Literature on the genetic diversity of apomictic plant species is relatively sparse. Some studies using allozymes indicated that apomicts harboured sub- stantial levels of genetic diversity (e.g. EUstrand & Roose 1987; Widen etal. 1994). It was suggested that apomixis may be a way of retaining heterozygosity in species exposed to high rates of autogamy, by combining vegetative repro- duction and seed dispersal and by preserving locally adapted genotypes from recombination (Durand et al. 2000). The strong association between apomixis and pol5rploidy has been noted for many years (Asker & Jerling 1992; Mogie 1992) even though, at present, strong evidence is still lack- ing to show how polyploidy initiates apomixis directly. In a comprehensive review on the association between poly- ploidy and apomixis, Gustafsson (1946, 1947) concluded that although apomixis can be induced in diploids by favourable mutation, the action of many apomixis-inducing genes is stronger at the polyploidy level.
Brown & Young (2000), in their study of an endangered autotetraploid daisy (Rutidosis leptorrhynchoides) popula- tion, observed increase in allelic richness compared to their diploid populations. Similarly, other studies also showed that autotetraploid species exhibited high levels of genetic diversity in comparison with their closely related diploid species (e.g. Soltis & Rieseberg 1986; Mahy et al. 2000; Hardy & Vekemans 2001). To our knowledge, to date, genetic diversity studies on apomictic and tetraploid species have never been reported for tropical tree species.
The aims of this study were to investigate the spatial distribution pattern, spatial genetic structure and genetic diversity of two tiopical tree species, with contiasting breed- ing systems and different ploidy levels using allozyme and microsatellite markers. S. leprosula is outcrossed with limited pollen and seed dispersal. We would there- fore postulate the species to exhibit high levels of genetic diversity and display significant levels of spatial aggregation and spatial genetic structure. Similarly, autotetraploidy
© 2004 Blackwell Publishing Ltd, Molecular Ecology, 10.1046/j.l365-294X.2004.02094.x

SPATIAL STRUCTURE AND GENETIC DIVERSITY OF DIPTEROCARP 3
and apomictic mode of reproduction allows us to postulate significant levels of spatial aggregation and spatial genetic structure, and high levels of genetic diversity in S. ovalis ssp. sericea.
Materials and methods
Study site and sample collections
This study was conducted at a 50-ha demographic plot in Pasoh Forest Reserve (NegeriSembilan,2°59 N,102°19 E), Peninsular Malaysia (Fig. 1). In September 2001 a total of 348 individuals of S. leprosula and S. ovalis ssp. sericea were identified and sampled. All samples collected were classified according to diameter at breast height (dbh) into three diameter classes: large (BIG, dbh > 40 cm), medium (MED, dbh 8-15 cm) and small (SMA, dbh 1 -4 cm). Of the 178 individuals collected for S. leprosula, 64, 60 and 54 individuals were classified into large-, medium- and small- diameter classes, respectively (Fig. 2a). For S. ovalis ssp. sericea, of the 170 individuals collected 58 were classified as large, 55 as medium and 57 as small (Fig. 2b).
Genetic analysis
AUozyme analysis was carried out according to Lee et al. (2000c) for four enzyme systems: glucose phosphate iso- merase (GPI), diphosphogluconate pyrophosphatase (UGP), phosphoglucomutase (PGM) and malate dehydrogenase (MDH). Assignment of genotypes was conducted in accor- dance with the known enzyme substructure (Weeden & Wendel 1989). The aUozyme analysis was carried out only for S. leprosula and not for S. ovalis ssp. sericea, because S. ovalis
ssp. sericea exhibited tetrasomic banding patterns, which were too complicated to be interpreted into genotypic data.
For microsatellite analysis, genomic DNA was extracted from leaves or inner bark tissues using the procedure of Murray & Thompson (1980) with modifications. The extracted DNAs were purified further using a high pure polymerase chain reaction (PCR) template preparation kit (Boehringer Mannheim). The samples were genotyped for seven nücrosatellite loci, developed for S. curtisii (Ujino et al. 1998), i.e. ShcOl, ShcOl, ShcOS, ShcOá, Shc07, Shc09 and Shcl7. Microsatellites amplification were performed in a 25 iiL reaction volume, containing 10 ng DNA, 50 mM KCl, 20 mM Tris-HCl (pH 8.0) and 1.5 mM MgCl^ 0.2 ^M of each primer, 0.2 mM of each dNTP and 1 unit of platinum Taq DNA polymerase (Gibco-BRL). The pol5nnerase chain reac- tion (PCR) was carried out on a GeneAmp 9700 thermal cycler (Applied Biosystems) for an initial denaturing step at 94 °C for 4 min, followed by 35 cycles each at 94 °C for 1 min, 52-54 °C for 30 s and 72 °C for 45 s. A final extension step at 72 °C for 30 min was performed after the 35 cycles. Genotyping was performed on 5% denaturing (6 M urea) polyacrylamide gels. Electrophoresis was carried out with Ix Tris-borate-EDTA (TBE) buffer on an ABI Prism 377 automated DNA sequencer (Applied Biosystems). Alíele sizes were scored against the internal size standard and the individuals were genot5rped using GENESCAN 3.1 and GENOTYPER 2.1 Software (Applied Biosystems).
Statistical analysis
The levels of genetic diversity of S. leprosula were estimated for mean number of alíeles per locus (AJ, effective number of alíeles per locus (A^; Crow & Kimura 1970), allelic
PASOH FIELD RESEARCH STATION NEGERI SEMBILAN DARUL KHUSUS
MALAYSIA
LEGEND
^^ Main Trail -'-- Nature Trail i Tree Tower
I I 50 ha plot
ÍÍ Arboretum
Ô Substation oftice
Fig. 1 Location of the Pasoh Forest Reserve in Negeri Sembilan and the map description of the Pasoh Field Research Station.
© 2004 Blackwell Publishing Ltd, Molecular Ecology, 10.1046/j.l365-294X.2004.02094.x

4 K. K. S. NG, S. L. LEE and C. L. KOH
(a)
(b) 500
400
300
200
100
BIG
480-1 r- p•1 480
440
400
360
320
280
1240 200
160
120 80
40
0
^ 480
440
400
360
320
280
1 240
200
160
120 80
40
0
360'
280. s. 240'
200'
160' - 1 1.
80. 40. 0 - 1•, - J L, - 1•, - L, •, L J L L J L - L, - J P. J L - 1•, - 1•, J L J L L, -^ J •, - L L L
0 40 80 120 160 200 240 280 320 360 400 440 480 520 560 6
(m)
0 40 80 120 160 200 240 280 320 360 400 440 480 520 580 600
(m)
0 40 80 120 160 200 240 280 320 360 400 440 480 520 580 800
(m)
BIG SMA
: :: i::::::::::
2ÜÜ-
0--
::::;±m!::::::::::;:::^:::::::::::::::::
0 100 200 300 400 600 600 700 800 900 1000
(m)
O 100 200 300 400 500
(m)
700 800 900 1000 O 100 200 300 400 500
(m)
700 800 900 1000
Fig. 2 (a) Distribution of Shorea leprosula individuals witiiin the 30-ha plot in the Pasoh Forest Reserve. BIG: 64 individuals (dbh > 40 cm); MED: 60 individuals (8-15 cm); and SMA: 54 individuals (1-4 cm), (b) Distribution of S. ovalis ssp. sericea individuals within the 50-ha plot in the Pasoh Forest Reserve. BIG: 58 individuals (dbh > 40 cm); MED: 55 individuals (8-15 cm); and SMA: 57 individuals (1-4 cm).
richness (7?^; Petit et al. 1998), observed heterozygosity (HQ)
and expected heterozygosity (H^; Nei 1987) with the assistance of programs BIOSYS-1 (Swofford & Selander 1981), POPGENE version 1.31 (Yeh etal. 1999) and FSTAT version 2.9.3.2 (Goudet 2002). Wright's (1965) fixation index (Fjg), averaged over all loci, was calculated to assess the overall departure from Hardy-Weinberg equilibrium for each dia- meter class. For S. ovalis ssp. sericea, the following parameters were calculated using AUTOTET program (Thrall & Young 2000): mean number of alíeles per locus (AJ, observed heterozygosity (HQ), expected heterozygosity under random mating and assuming random chromosomal segregation (e.g. no double reduction) (H^; Geiringer 1949; Wricke & Weber 1986; Bever & Felber 1992) and fixation index (Fjg). To test whether mean f jg values were significantly different from zero, an approximation of a 95% confidence level was determined by multiplying the standard error by 1.96 (Loiselle et al. 1995).
The spatial distribution of the three diameter classes for both species were tested for clumping using univariate second-order spatial pattern analysis, based on Ripley's (1976) iC-function. This method considers all individuals of trees within a given radius t of the focal individual. The estimator of the function K(t) used is:
K(t) = n-'AY^'£wp,(Uij)
where n is the number of plants in the plot, A is the area of the plot in square metres (nfi), I¡ is a counter variable, u¡- is the distance between trees / and; and w^ is a weighting factor to correct for edge effects (Haase 1995). The K(t) was calculated separately for each distance t (0-245 m in 35-m increments). Results were displayed as a plot of V[iC(f)/Ji] - i, and then plot K(t) vs. Í to examine the spatial dispersion at all distance classes t. To test the significant deviation from a random distribution, Monte Carlo computer-generated data were used. To construct a 99% confidence envelope, 99 simulations were run and the sample statistic was compared to this envelope. These calculations were performed using the program SPATIAL POINT PATTERN ANALYSIS (Haase 1995).
Spatial genetic structure for S. leprosula was analysed for Moran's I coefficient (Moran 1950). The correlograms are computed as an indication of spatial scale of genetic substructuring (Sokal & Oden 1978; Sokal & Wartenberg 1983). Alíele frequencies greater than 5% were calculated. Average Moran's I coefficients were calculated for all alíeles as a summary statistic. A permutation procedure using Monte Carlo simulations was applied to test significant deviation from random spatial distribution of each calcu- lated measure (Manly 1997). Each permutation consisted of a random redistribution of multilocus genotypes over the spatial coordinate of the sampled trees. For each of the spatial distance classes, observed values were compared with the distribution obtained after 1000 permutations.
© 2004 Blackwell Pubhshing Ltd, Molecular Ecology, 10.1046/j.l365-294X.2004.02094.x

SPATIAL STRUCTURE AND GENETIC DIVERSITY OF DIPTEROCARP 5
A 99% confidence interval for the parameters was con- structed as the interval (Streiff et al. 1998). These calcula- tions were performed using the program SPATIAL GENETIC
soFTWARE-SGS (Degen et al. 2001b). The Moran's I coefficient has been used widely, but
recently many studies have also used the kinship coefficient for spatial genetic structure analysis (e.g. Loiselle et al. 1995; Hardy & Vekemans 2001; Kalisz et al. 2001; Parker et al. 2001; Chung et al. 2002,2003; Dutech et al. 2002; Erickson & Hamrick 2003). The kinship coefficient, a measure of coancestry (F-) was used in the analysis of spatial genetic structure of S. ovalis ssp. sericea. This coefficient can esti- mate between pairs of mapped individuals i and ; or the probability that genes in different individuals within subpopulations are identical by descent (Cockerham 1969). This statistic was computed between all pairs of indi- viduals belonging to the same ploidal using multilocus esti- mates obtained following Loiselle et al. (1995), where the contribution of each alíele is weighted by its respective polymorphism p¡J,l - p^J, with p^^ being the uth alíele fre- quency at locus /. The average F¡- over pairs of individuals was computed for distance intervals of 35 m. The standard error over loci was estimated using the jackknife method. The absence of spatial genetic structure was tested within each class using a permutation method (1000 permuta- tions); spatial distances were permuted randomly among pairs of individuals, and the estimated value of the average kinship coefficient was compared to the distribution after permutations. These calculations were performed using
the program AUTOCORG 2.1 (Hardy & Vekemans 2001; available at [email protected]).
Results
Genetic diversity
For S. leprosula, a total of four allozyme and seven micro- satellite loci were resolved consistently. Comparatively, genetic diversity parameters estimated using allozyme loci (Table 1) were consistently lower than microsatellite loci (Table 2). The number of alíeles observed for allozyme loci ranged from two {Pgm-1 and Mdh-1) to six (Gpi-1), and for microsatellite loci from three (Shcl7) to 20 (ShcOT). The mean number of alíeles per locus for allozyme loci ranged from 2.5 (SMA) to 3.5 (BIG and MED) and for microsateUite loci from 11.0 (SMA) to 11.4 (BIG). The mean expected heterozygosity was relatively similar across the three diameter classes for allozyme loci (BIG = 0.49, MED = 0.51 and SMA = 0.48) and microsateUite loci (BIG = 0.70, MED = 0.71 and SMA = 0.69). However, the mean effective number of alíeles per locus and allelic richness for alloz5nne were highest in MED (A^ = 2.11 and R^ = 3.48), followed by BIG (A^ = 1.98 and R^ = 3.08) and SMA {A^ = 1.91 and R^ = 2.47). The mean effective number of alíeles per locus for micro- satellite loci also shows a similar trend to allozyme loci, with the highest value in MED (6.21) followed by BIG (5.50) and SMA (4.93). However, mean allelic richness values for microsateUite loci showed the highest value in
Diameter class/ locus N Ho H•
BIG Gpi-1 Ugp-1 Pgm-1 Mdh-1 Mean SE
MED Gpi-1 Ugp-1 Pgm-1 Mdh-1 Mean SE
SMA Gpi-1 Ugp-1 Pgm-1 Mdh-1 Mean SE
62 6 2.25 4.87 0.53 0.56 62 4 2.13 3.43 0.45 0.54
55 2 1.96 2.00 0.24 0.49
58 2 1.60 2.00 0.22 0.38
59.3 3.5 1.98 3.08 0.36 0.49 1.7 1.0 0.14 0.69 0.03 0.04
36 5 2.68 4.92 0.73 0.64
36 5 2.33 4.98 0.42 0.58
35 2 1.94 2.00 0.37 0.49
33 2 1.50 2.00 0.18 0.34
35.0 3.5 2.11 3.48 0.42 0.51 0.7 0.9 0.26 0.85 0.06 0.07
38 3 2.11 2.98 0.55 0.53 37 3 2.05 2.89 0.43 0.52
34 2 1.84 2.00 0.35 0.46
38 2 1.63 2.00 0.16 0.39
36.8 2.5 1.91 2.47 0.37 0.48 0.9 0.3 0.11 0.27 0.02 0.03
Table 1 Levels of genetic diversity of Shorea leprosula in three diameter classes (BIG, MED and SMA) based on four allo- zyme loci. Number of individuals (N); mean number of alíeles per locus {AJ; effective number of alíeles per locus (A^); allelic rich- ness (Kg); observed heterozygosity (HQ) and expected heterozygosity (Hg)
© 2004 Blackwell Publishing Ltd, Molecular Ecology, 10.1046/j.l365-294X.2004.02094.x
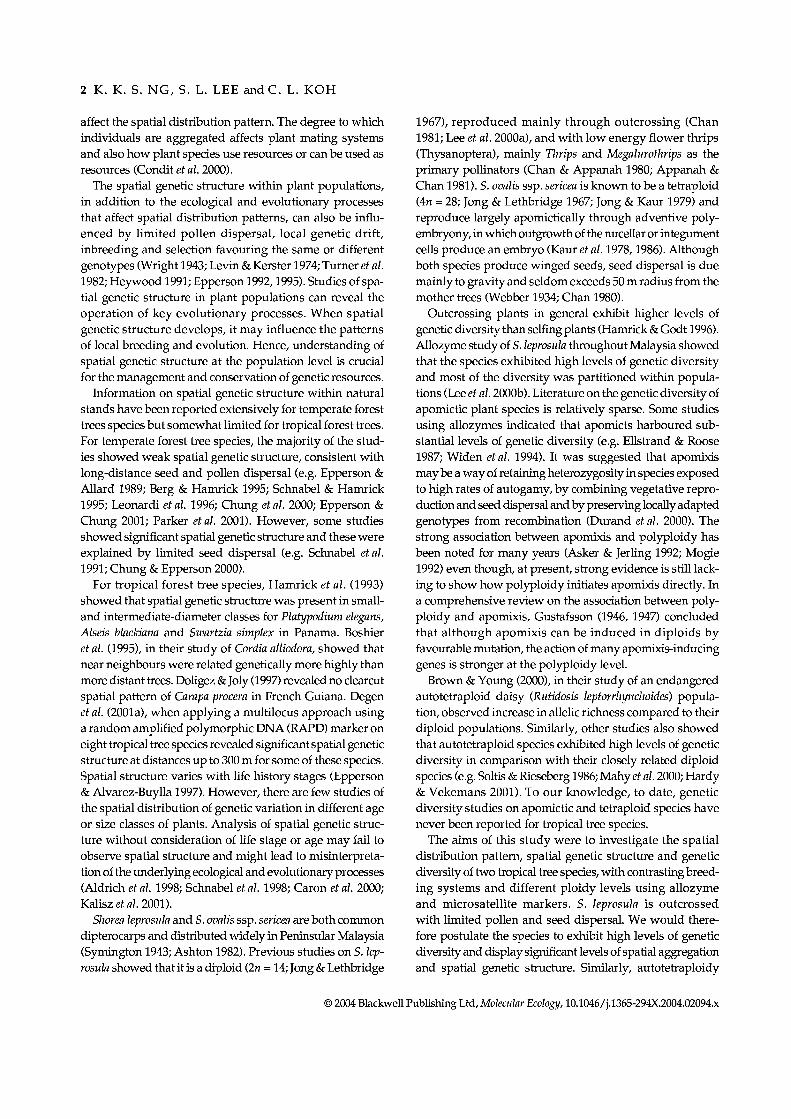
6 K. K. S. NG, S. L. LEE and C. L. KOH
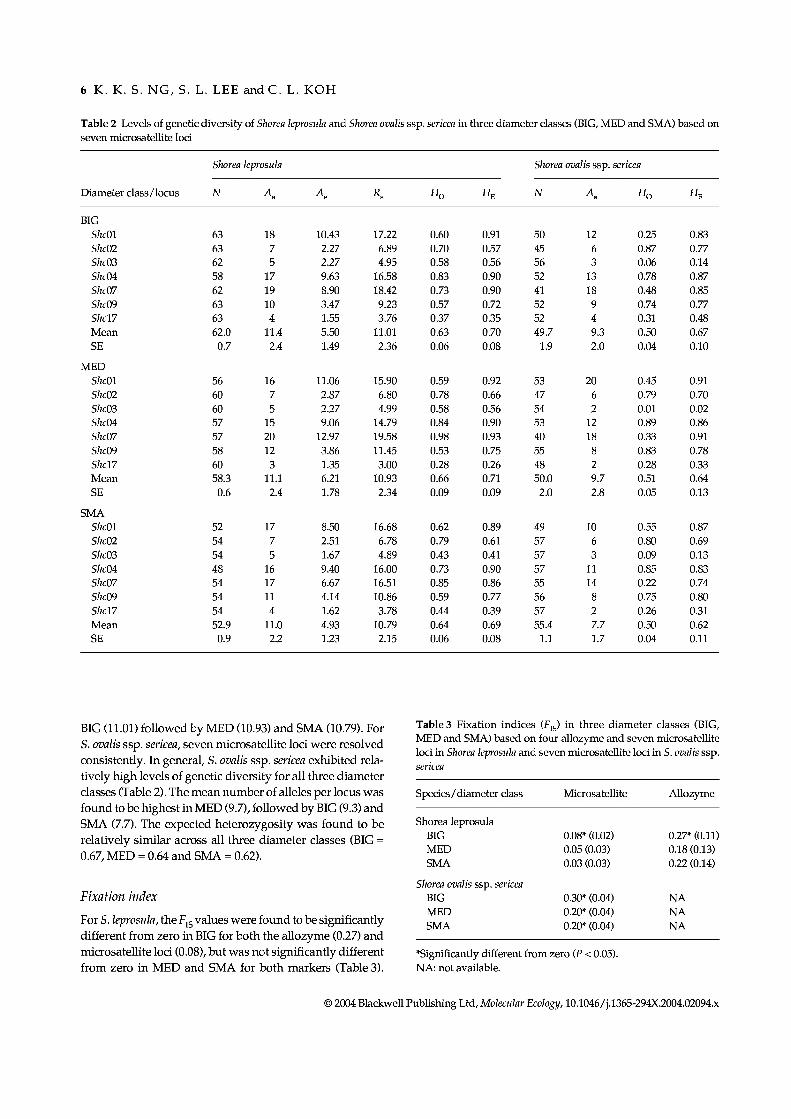
Table 2 Levels of genetic diversity of Shorea leprosula and Shorea ovalis ssp. sericea in three diameter classes (BIG, MED and SMA) based on seven microsatellite loci
Diameter class/locus
Shorea leprosula
N H• H•
Shorea ovalis ssp. sericea
N H• H•
BIG ShcOl Shc02 Shc03 ShcOá ShcQ7 Shc09 Shcl7 Mean SE
MED ShcOl ShcOl Shc03 ShcOá Shc07 Shc09 Shell Mean SE
SMA SheOl SheOl She03 SheOá She07 She09 Shell Mean SE
63 18 10.43 17.22 0.60 0.91 50 12 0.25 0.83 63 7 2.27 6.89 0.70 0.57 45 6 0.87 0.77 62 5 2.27 4.95 0.58 0.56 56 3 0.06 0.14 58 17 9.63 16.58 0.83 0.90 52 13 0.78 0.87 62 19 8.90 18.42 0.73 0.90 41 18 0.48 0.85 63 10 3.47 9.23 0.57 0.72 52 9 0.74 0.77 63 4 1.55 3.76 0.37 0.35 52 4 0.31 0.48 62.0 11.4 5.50 11.01 0.63 0.70 49.7 9.3 0.50 0.67 0.7 2.4 1.49 2.36 0.06 0.08 1.9 2.0 0.04 0.10
56 16 11.06 15.90 0.59 0.92 53 20 0.45 0.91 60 7 2.87 6.80 0.78 0.66 47 6 0.79 0.70 60 5 2.27 4.99 0.58 0.56 54 2 0.01 0.02 57 15 9.06 14.79 0.84 0.90 53 12 0.89 0.86 57 20 12.97 19.58 0.98 0.93 40 18 0.33 0.91 58 12 3.86 11.45 0.53 0.75 55 8 0.83 0.78 60 3 1.35 3.00 0.28 0.26 48 2 0.28 0.33 58.3 11.1 6.21 10.93 0.66 0.71 50.0 9.7 0.51 0.64 0.6 2.4 1.78 2.34 0.09 0.09 2.0 2.8 0.05 0.13
52 17 8.50 16.68 0.62 0.89 49 10 0.55 0.87 54 7 2.51 6.78 0.79 0.61 57 6 0.80 0.69 54 5 1.67 4.89 0.43 0.41 57 3 0.09 0.13 48 16 9.40 16.00 0.73 0.90 57 11 0.85 0.83 54 17 6.67 16.51 0.85 0.86 55 14 0.22 0.74 54 11 4.14 10.86 0.59 0.77 56 8 0.75 0.80 54 4 1.62 3.78 0.44 0.39 57 2 0.26 0.31 52.9 11.0 4.93 10.79 0.64 0.69 55.4 7.7 0.50 0.62 0.9 2.2 1.23 2.15 0.06 0.08 1.1 1.7 0.04 0.11
BIG (11.01) followed by MED (10.93) and SMA (10.79). For S. ovalis ssp. sericea, seven microsatellite loci were resolved consistently. In general, S. ovalis ssp. sericea exhibited rela- tively high levels of genetic diversity for all three diameter classes (Table 2). The mean number of alíeles per locus was found to be highest in MED (9.7), followed by BIG (9.3) and SMA {7.7). The expected heterozygosity was found to be relatively similar across all three diameter classes (BIG = 0.67, MED = 0.64 and SMA = 0.62).
Fixation index
For S. leprosula, the Fjg values were found to be significantly different from zero in BIG for both the allozyme (0.27) and microsatellite loci (0.08), but was not significantly different from zero in MED and SMA for both markers (Table 3).
Table 3 Fixation indices (Fjg) in three diameter classes (BIG, MED and SMA) based on four allozyme and seven microsatellite loci in Shorea leprosula and seven microsatellite loci in S. ovalis ssp. sericea
Species/diameter class Microsatellite Allozyme
Shorea leprosula BIG 0.08* (0.02) 0.27» (0.11) MED 0.05 (0.03) 0.18 (0.13) SMA 0.03 (0.03) 0.22 (0.14)
Shorea ovalis ssp. sericea BIG 0.30* (0.04) NA MED 0.20* (0.04) NA SMA 0.20* (0.04) NA
»Significantly different from zero {P < 0.05). NA: not available.
© 2004 Blackwell Pubhshing Ltd, Molecular Ecology, 10.1046/j.l365-294X.2004.02094.x
SPATIAL STRUCTURE AND GENETIC DIVERSITY OF DIPTEROCARP 7
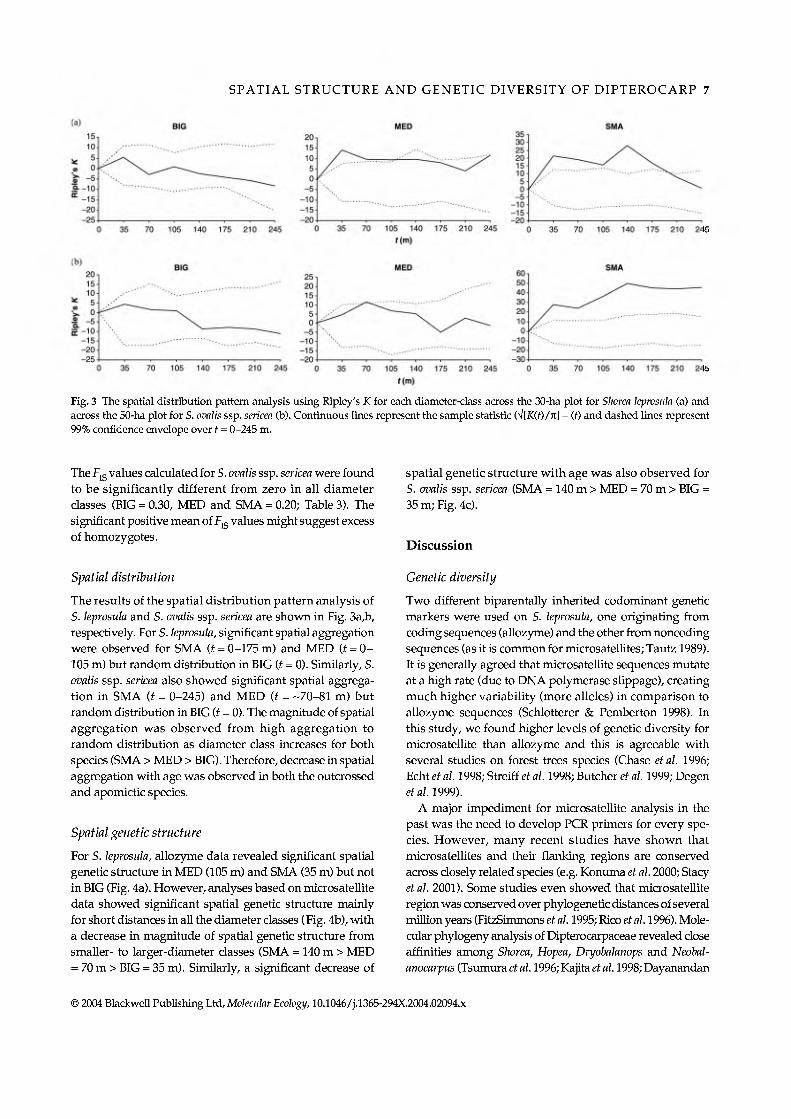
Fig. 3 The spatial distribution pattern analysis using Ripley's K for eacl\ diameter-class across the 30-ha plot for Shorea leprosula (a) and across the 50-ha plot for S. ovalis ssp. sericea (b). Continuous lines represent the sample statistic (V[iC(f)/ic] - (f) and dashed lines represent 99% confidence envelope over f = 0-245 m.
The Fjg values calculated for S. ovalis ssp. sericea were found to be significantly different from zero in all diameter classes (BIG = 0.30, MED and SMA = 0.20; Table 3). The significant positive mean of f jg values might suggest excess of homozygotes.
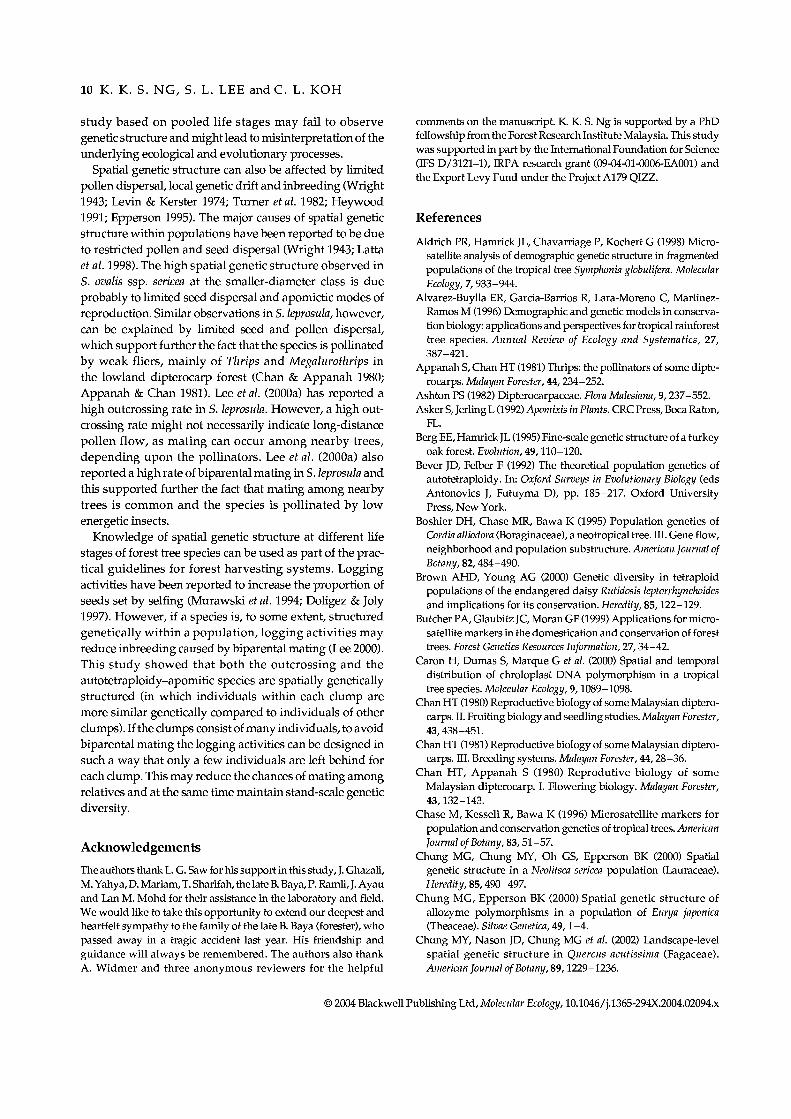
spatial genetic structure with age was also observed for S. ovalis ssp. sericea (SMA = 140 m > MED = 70 m > BIG = 35 m; Fig. 4c).
Discussion
Spatial distribution
The results of the spatial distribution pattern analysis of S. leprosula and S. ovalis ssp. sericea are shown in Fig. 3a,b, respectively. For S. leprosula, significant spatial aggregation were observed for SMA (i = 0-175 m) and MED (i = 0- 105 m) but random distribution in BIG (f = 0). Similarly, S. ovalis ssp. sericea also showed significant spatial aggrega- tion in SMA (Í = 0-245) and MED (i = -70-81 m) but random distiibution in BIG (i = 0). The magnitude of spatial aggregation was observed from high aggregation to random distribution as diameter class increases for both species (SMA > MED > BIG). Therefore, decrease in spatial aggregation with age was observed in both the outcrossed and apomictic species.
Spatial genetic structure
For S. leprosula, allozyme data revealed significant spatial genetic structure in MED (105 m) and SMA (35 m) but not in BIG (Fig. 4a). However, analyses based on microsatellite data showed significant spatial genetic structure mainly for short distances in all the diameter classes (Fig. 4b), with a decrease in magnitude of spatial genetic structure from smaller- to larger-diameter classes (SMA = 140 m > MED = 70 m > BIG = 35 m). Similarly, a significant decrease of
Genetic diversity
Two different biparentally inherited codominant genetic markers were used on S. leprosula, one originating from coding sequences (alloz5nne) and the other from noncoding sequences (as it is common for microsatellites; Tautz 1989). It is generally agreed that microsatellite sequences mutate at a high rate (due to DNA polymerase slippage), creating much higher variability (more alíeles) in comparison to allozyme sequences (Schlotterer & Pemberton 1998). In this study, we found higher levels of genetic diversity for microsatellite than allozyme and this is agreeable with several studies on forest trees species (Chase et al. 1996; Echt et al. 1998; Streiff et al. 1998; Butcher et al. 1999; Degen et al. 1999).
A major impediment for microsatellite analysis in the past was the need to develop PCR primers for every spe- cies. However, many recent studies have shown that microsatellites and their flanking regions are conserved across closely related species (e.g. Konuma et al. 2000; Stacy et al. 2001). Some studies even showed that microsatellite region was conserved over phylogenetic distances of several million years (FitzSimmons et al. 1995; Rico et al. 1996). Mole- cular phylogeny analysis of Dipterocarpaceae revealed close affinities among Shorea, Hopea, Dryobalanops and Neobal- anocarpus (Tsumura et al. 1996; Kajita et al. 1998; Dayanandan
© 2004 Blackwell Publishing Ltd, Molecular Ecology, 10.1046/j.l365-294X.2004.02094.x

8 K. K. S. NG, S. L. LEE and C. L. KOH
(a) 0.25
0.2 0.15
0.1 0.05-.
0- -0.05 -0.1
-0.15 -0.2
-0.25 1
BIG
8 9
MED
Distance class
4 5 6 7
Distance class
SMA
4 5 6
Distance class
(b) BIG MED
3 4 5 6 7
Distance class
4 5 6 7
Distance class
SMA
3 4 5 6 7
Distance class
MED
3 4 5 6 7
Distance class
SMA
3 4 5 6 7
Distance class
3 4 5 6 7
Distance class
Fig. 4 (a, b) Correlograms of estimated Moran's I coefficient for Shorea leprosula using allozyme and microsatellite, respectively. Dashed lines represent upper and lower 99% confidence limits around zero relationship, (c) Correlograms of estimated coancestry (f • ) using microsatellite for S. ovalis ssp. sericea. The filled circles in each of the diameter classes refer to values that deviate significantly from zero (P < 0.01). For (a), (b) and (c), distance class was defined at nine intervals; each interval is 35 m, from 0 to 35 m (distance class 1) up to 280- 315 m (distance class 9).
et al. 1999). In this study, we have amphfied successfully seven microsatellite primers developed for S. curtisii on S. leprosula and S. ovalis ssp. sericea, and this might support further that affinities among these species are relatively closed.
The observed mean number of alíeles per locus (A^) in all three diameter classes of S. leprosula (A_^ = 11.0-11.4) was higher in comparisons with S. curtisii {A_^ = 7.9 based on 40 samples over eight loci; Ujino et al. 1998), Neobalanocarpus heimii (A^ = 8.8 based on 30 samples over four loci; Konuma etal. 2000) and Dryobalanops aromática (A^ = 5.1 based on seven loci over five populations, each about 18 samples; Lim et al. 2002). However, in terms of expected heterozygosities (Hg), the values of S. leprosula (0.69-0.71) were relatively similar to S. curtisii (0.64), N. heimii (0.78) and D. aromática (0.71). The value of A^ is affected greatly by sample size (Leberg 2002). Hence, the higher values of A^
observed in S. leprosula could be due to the larger number of individuals being used in the present study. However, it could also be due to the characteristic of the species, where the species had been reported to exhibit remarkably high levels of genetic diversity (Lee et al. 2000b). The value of Hg is determined mainly by the evenness of alíele frequencies (Marshall & Brown 1975). In comparison with S. curtisii, N. heimii and D. aromática, S. leprosula exhibited the highest value of A^. However, many of these aUeles were present at low frequencies and this could be the reason why the Hg of S. leprosula is relatively similar to S. curtisii, N. heimii and D. aromática.
Shorea ovalis ssp. sericea (Table 2) displayed comparable levels of genetic diversity with S. leprosula (present study), S. curtisii (Ujino et al. 1998), N. heimii (Konuma et al. 2000) and D. aromática (Lim et al. 2002). Similarly, many studies also showed that autotetraploid species exhibited high
© 2004 Blackwell Pubhshing Ltd, Molecular Ecology, 10.1046/j.l365-294X.2004.02094.x

SPATIAL STRUCTURE AND GENETIC DIVERSITY OF DIPTEROCARP 9
levels of genetic diversity (e.g. Toltniea menziesii: Soltis & Rieseberg 1986; Rutidosis leptorrhynchoides: Brown & Young 2000; Vaccinium oxycoccos: Mahy et al. 2000; Centaurea jacea: Hardy & Vekemans 2001). This can be explained by the lower pressure of genetic drift due to the effects of tetra- somic inheritance on autotetraploid species (Stebbins 1980; Moody et al 1993; Mahy et al. 2000). In addition, for autotetraploids, each locus can accommodate up to four different alíeles and this allows maintenance of more alíeles at individual loci. The observed high levels of genetic diversity in S. ovalis ssp. sericea could also be due to a random retention of more heterogeneous individuals in the past, and the apomictic mode of reproduction might be an evolutionary strategy which allows the species to maintain high levels of genetic diversity.
Fixation index
Shorea ovalis ssp. sericea is an apomictic species and due to the absence of segregation and recombination during reproduction, the value of Fjg may possibly indicate either an excess of hétérozygotes or that of homozygotes. However, in this study an excess of homozygotes was observed. The significant positive value of Fjg for S. leprosula at large- diameter class might indicate an excess of homozygotes in a manner consistent with inbreeding due to selfing or biparental mating (Lee et al. 2000a).
The proportion of homozygotes has been reported frequently to decrease with age and this was explained by the selection in favour of particular hétérozygote geno- type individuals or the selection against homozygote indi- viduals resulting from inbreeding depression (Schaal & Levin 1976; El Kassaby et al. 1987; Hamrick et al. 1993; Tonsor et al. 1993; Alvarez-Buylla et al. 1996). However, in this study the Fjg values calculated for both species (Table 3) showed a contrary result; the proportion of hétérozygotes reduces as diameter classes increases. Similar observations have also been reported on Pinus attenuate (Strauss 1986) and Finns clausa (Parker et al. 2001). This might indicate the lack of hétérozygote advantage and selection might be in favour of particular homozygous genotypes. Nevertheless, it is still not clear how homozygosity and heterozygosity affect survival and their response to different selection forces. If the hypothesis of hétérozygote advantage is preferable then the homozygous genotype individuals might show inferior qualities, but they can still manage to survive and reach maturity under favourable environmental conditions.
Spatial distribution pattern
Spatial distribution pattern analyses showed that the majority of tropical tree species aggregated at various diameter classes (Hubbell 1979; He etal. 1997; Itoh etal. 1997; Okuda etal. 1997; Condit etal. 2000; Plotkin etal.
2000). Similarly, in this study we found significant spatial aggregation in medium- and small-diameter classes for both the S. leprosula and S. ovalis ssp. sericea (small-diameter class trees are generally more clumped than medium-diameter class trees). The possible mechanisms of clumping have been discussed by other groups from the viewpoint of seed dispersal (Plotkin et al. 2000), gap recruitment (Itoh et al. 1997; Plotkin etal. 2000), distance-dependent mortahty (Itoh et al. 1997), density-dependent recruitment (Okuda etal. 1997), topography (Plotkin etal. 2000), pest effect (Wills & Condit 1999; Harms etal. 2000), herbivores and plant diseases (Condit et al. 2000) and species density (Condit et al. 2000). For S. leprosula and S. ovalis ssp. sericea, seed shadow due to limited seed dispersal determines basically the clumping of small-diameter class trees. After seed dispersal, the compensatory mortality due to environ- mental heterogeneity (e.g. formation of gaps due to canopy opening) and intra- and interspecific competition on small-diameter class trees might lead to less clumping on medium-diameter class trees. Subsequently, the compen- satory mortality due to microenvironmental selection, herbivores and plant diseases on medium-diameter class trees will aggravate the thinning process so that only few individuals will be able to survive and form the future adults, and this might cause the random distribution on large-diameter class trees.
Spatial genetic structure
The use of allozyme markers on S. leprosula could detect spatial genetic structure in only small- and medium- diameter class trees, while microsatellite markers were able to detect spatial genetic structure for all three diameter classes. Because we used the same set of individuals for both markers, the microsatellite marker can be considered to have higher sensitivity (because microsatellite loci carry more alíeles) than allozyme markers to detect spatial genetic structure, and this merit has also been reported in other studies (e.g. Peakall etal. 1995; Powell etal. 1996; Smouse & Peakall 1999; Degen et al. 2001a).
The ecological and evolutionary processes (e.g. limited seed dispersal, competitive thinning, prédation and environ- mental heterogeneity) that affect spatial distribution patterns can also be contributing factors to the observed spatial genetic structure. The decrease in magnitude of spatial genetic structure from smaller- to larger-diameter classes was observed in both species, which is in accordance with other studies (Hamrick et al. 1993; Berg & Hamrick 1995; Epperson & Alvarez-Buylla 1997). This can be explained by the compensatory mortality and competitive thinning process during recruitment and selection in favour of dif- ferent genotypes. In addition, the presence of different levels of spatial genetic structure at different diameter classes indicated that analysis of spatial genetic structure
© 2004 Blackwell Publishing Ltd, Molecular Ecology, 10.1046/j.l365-294X.2004.02094.x
10 K. K. S. NG, S. L. LEE and C. L. KOH
study based on pooled life stages may fail to observe genetic structure and might lead to misinterpretation of the underlying ecological and evolutionary processes.
Spatial genetic structure can also be affected by limited pollen dispersal, local genetic drift and inbreeding (Wright 1943; Levin & Kerster 1974; Turner et al. 1982; Heywood 1991; Epperson 1995). The major causes of spatial genetic structure within populations have been reported to be due to restricted pollen and seed dispersal (Wright 1943; Latta et al. 1998). The high spatial genetic structure observed in S. ovalis ssp. sericea at the smaller-diameter class is due probably to Umited seed dispersal and apomictic modes of reproduction. Similar observations in S. leprosula, however, can be explained by limited seed and pollen dispersal, which support further the fact that the species is pollinated by weak fliers, mainly of Thrips and Megalurothrips in the lowland dipterocarp forest (Chan & Appanah 1980; Appanah & Chan 1981). Lee et al. (2000a) has reported a high outcrossing rate in S. leprosula. However, a high out- crossing rate might not necessarily indicate long-distance pollen flow, as mating can occur among nearby trees, depending upon the pollinators. Lee et al. (2000a) also reported a high rate of biparental mating in S. leprosula and this supported further the fact that mating among nearby trees is common and the species is pollinated by low energetic insects.
Knowledge of spatial genetic structure at different life stages of forest tree species can be used as part of the prac- tical guidelines for forest harvesting systems. Logging activities have been reported to increase the proportion of seeds set by selfing (Murawski et al. 1994; Doligez & Joly 1997). However, if a species is, to some extent, structured genetically within a population, logging activities may reduce inbreeding caused by biparental mating (Lee 2000). This study showed that both the outcrossing and the autotetraploidy-apomitic species are spatially genetically structured (in which individuals within each clump are more similar genetically compared to individuals of other clumps). If the clumps consist of many individuals, to avoid biparental mating the logging activities can be designed in such a way that only a few individuals are left behind for each clump. This may reduce the chances of mating among relatives and at the same time maintain stand-scale genetic diversity.
Acknowledgements
The authors thank L. G. Saw for his support in this study, J. GhazaH, M. Yahya, D. Mariam, T. Sharifah, the late B. Baya, P. Ramli, J. Ayau and Lan M. Mohd for their assistance in the laboratory and field. We would like to take this opportunity to extend our deepest and heartfelt sympathy to the family of the late B. Baya (forester), who passed away in a tragic accident last year, ilis friendship and guidance will always be remembered. The authors also thank A. Widmer and three anonymous reviewers for the helpful
comments on the manuscript. K. K. S. Ng is supported by a PhD fellowship from the Forest Research Institute Malaysia. This study was supported in part by the International Foundation for Science (IFS D/3121-1), IRPA research grant (09-04-01-0006-EAOOl) and the Export Levy Fund under the Project Al 79 QIZZ.
References
Aldrich PR, Hamrick JL, Chavarriage P, Kochert G (1998) Micro- satellite analysis of demographic genetic structure in fragmented populations of the tropical tree Symphonia globulifera. Molecular Ecology, 7, 933-944.
AIvarez-Buylla ER, Garcia-Barrios R, Lara-Moreno C, Martinez- Ramos M (1996) Demographic and genetic models in conserva- tion biology: applications and perspectives for tropical rainforest tree species. Annual Review of Ecology and Sysiematics, 27, 387-421.
Appanah S, Chan HT (1981) Thrips: the pollinators of some dipte- rocarps. Malayan Forester, 44, 234-252.
Ashton PS (1982) Dipterocarpaceae. Flora Malesiana, 9, 237-552. Asker S, Jerling L (1992) Apomixis in Plants. CRC Press, Boca Raton,
FL. Berg EE, Hamrick JL (1995) Fine-scale genetic structure of a turkey
oak forest. Evolution, 49,110-120. Bever JD, Felber F (1992) The theoretical population genetics of
autotetraploidy. In: Oxford Surveys in Evolutionary Biology (eds Antonovics J, Futujona D), pp. 185-217. Oxford University Press, New York.
Boshier DH, Chase MR, Bawa K (1995) Population genetics of Cordia alliodora (Boraginaceae), a neotropical tree. III. Gene flow, neighborhood and population substructure. American Journal of Botany, 82,484-490.
Brown AHD, Young AG (2000) Genetic diversity in tetraploid populations of the endangered daisy Rutidosis leptorrhynchoides and implications for its conservation. Heredity, 85,122-129.
Butcher PA, Glaubitz JC, Moran GF (1999) Applications for micro- satellite markers in the domestication and conservation of forest trees. Forest Genetics Resources Information, 27,34-42.
Caron H, Dumas S, Marque G et al. (2000) Spatial and temporal distribution of chroloplast DNA poljonorphism in a tropical tree species. Molecular Ecology, 9,1089-1098.
Chan HT (1980) Reproductive biology of some Malaysian diptero- carps. II. Fruiting biology and seedling studies. Malayan Forester, 43,438-451.
Chan HT (1981) Reproductive biology of some Malaysian diptero- carps. III. Breeding systems. Malayan Forester, 44, 28-36.
Chan HT, Appanah S (1980) Reprodutive biology of some Malaysian dipterocarp. I. Flowering biology. Malayan Forester, 43,132-143.
Chase M, Kesselt R, Bawa K (1996) Microsatellite markers for population and conservation genetics of tropical trees. American Journal of Botany, 83,51-57.
Chung MG, Chung MY, Oh GS, Epperson BK (2000) Spatial genetic structure in a Neolitsea sericea population (Lauraceae). Heredity, 85,490-497.
Chung MG, Epperson BK (2000) Spatial genetic structure of allozyme polymorphisms in a population of Eurya japónica (Theaceae). Silvae Genética, 49,1-4.
Chung MY, Nason JD, Chung MG et al. (2002) Landscape-level spatial genetic structure in Quercus acutissima (Fagaceae). American Journal of Botany, 89,1229-1236.
© 2004 Blackwell PubHshing Ltd, Molecular Ecology, 10.1046/j.l365-294X.2004.02094.x

SPATIAL STRUCTURE AND GENETIC DIVERSITY OF DIPTEROCARP 11
Chung MY, Nason JD, Epperson BK, Chung MG (2003) Temporal aspects of the fine-scale genetic structure in a population of Cinnamomum insularimontanum (Lauraceae). Heredity, 90, 98- 106.
Cockerham CC (1969) Variance of gene frequencies. Evolution, 23, 72-84.
Condit R, Ashton PS, Baker P et al (2000) Spatial patterns in the distribution of tropical tree species. Science, 288,1414-1418.
Crow JF, Kimura M (1970) An Introduction to Population Genetics Theory. Harper & Row Publishers, New York.
Dayanandan S, Ashton PS, Williams SM, Primack RB (1999) Phylogeny of the tropical trees family Dipterocarpaceae based on nucleotide sequences of the chroloplast rbcL gene. American Journal of Botany, 86,1182-1190.
Degen B, Caron H, Bandou E et al, (2001a) Fine-scale spatial struc- ture of eight tropical tree species as analysed by RAPDs. Heredity, 87,497-507.
Degen B, Petit R, Kremer A (2001b) SGS-SPATIAL GENETIC SOET-
WARE: a computer program for analysis of spatial genetic and phenotypic structures of individuals and populations. Journal of Heredity, 92, 447-449.
Degen B, Streiff R, Ziegenhagen B (1999) Comparative study of genetic variation and differentiation of two pedunculate oak {Quercus robur) stands using microsatellite and allozyme loci. Heredity, 83, 597-603.
Doligez A, Joly HI (1997) Genetic diversity and spatial structure within a natural stand of a tropical forest tree species, Carapa procera (Meliaceae), in French Guiana. Heredity, 79, 72-82.
Durand J, Garnier L, Dajoz 1, Mousset S, Veuille M (2000) Gene flow in a facultative apomictic Poecea, the savanna grass Hyparrhenia diplandra. Genetics, 156, 823-831.
Dutech C, Seiter J, PetroneUi P, Joly HI, Jarne P (2002) Evidence of low gene flow in a neotropical clustered tree species in two rain forest stands of French Guiana. Molecular Ecology, 11, 725-738.
Echt es, DeVerno LL, Anzidei M, Vendramin GG (1998) Chloro- plast microsatellites reveal population genetic diversity in red pine, Pinus resinosa Ait. Molecular Ecology, 7, 307-316.
El Kassaby YA, Meagher MD, Parkinson J, Portlock FT (1987) Allozyme inheritance, heterozygosity and outcrossing rate among Pinus montícola near Ladysmith, British Columbia. Heredity, 58,173-181.
EUstrand NC, Roose ML (1987) Patterns of genotypic diversity in clonal plant species. American Journal of Botany, 74,123-131.
Epperson BK (1992) Spatial structure of genetic variation within populations of forest trees. New Forest, 6, 257-278.
Epperson BK (1995) Spatial structure of two-locus genotypes under isolation by distance. Genetics, 140, 365-375.
Epperson BK, AUard RW (1989) Spatial autocorrelation analysis of the distribution of genotypes within populations of lodgepole pine. Genetics, 121, 369-377.
Epperson BK, Alvarez-Buylla E (1997) Spatial autocorrelation analysis of family structure in multiple life stages of Cecropia obtusifolia. Evolution, 51,275-282.
Epperson BK, Chung MG (2001) Spatial genetic structure of allozyme poljonorphisms within populations of Pinus strobus (Pinaceae). American Journal of Botany, 88,1006-1010.
Erickson DL, Hamrick JL (2003) Genetic and clonal diversity for Myrica cerífera along a spatiotemporal island chronosequence. Heredity, 90, 25-32.
FitzSimmons NN, Mority C, Moore SS (1995) Conservation and dynamics of microsatellite loci over 300 million years of marine turtle evolution. Molecular Biology and Evolution, 12, 432-440.
Geiringer H (1949) Chromatid segregation of tetraploids and hexaploids. Genetics, 34, 665-684.
Goudet J (2002) FSTAT, Version 2.93.2: a Computer Package for Pcs Which Estimates and Tests Gene Diversities and Differentiation Sta- tistics from Codominant Genetic Markers, http://www.unil.ch/ izea / software / fstat.html.
Gustafsson A (1946) Apomixis in higher plants. I. The mechanism of apomixis. Lunds Universitets Aarsskrift, Neue Forschungen, 42, 1-68.
Gustafsson A (1947) Apomixis in higher plants. II. The causal aspect of apomixis. Lunds Universitets Aarsskrift, Neue Forschungen,
iX 71-17%. Haase P (1995) Spatial pattern analysis in ecology based on
Ripley's iC-function: introduction and methods of edge correction. Journal of Vegetation Science, 6, 575-582.
Hamrick IL, Godt MIW (1996) Effects of life history tiaits on genetic diversity in plant species. Philosophical Transactions of the Royal Society, Biological Sciences, 351,1291-1298.
Hamrick IL, Murawski DA, Nason ID (1993) Influence of seed dispersal mechanisms on the genetic struture of tropical tree populations. Vegetatio, 107/108,281-297.
Hardy OI, Vekemans X (2001) Patterns of allozyme variation in diploid and tetraploid Centaurea jacea at different spatial scales. Evolution, 55, 943-954.
Harms KE, Wright SI, Calderón O, Hernandez A, Herre EA (2000) Pervasive density-dependent recruitment enhances seedling diversity in the tropical forest. Nature, 404, 493-495.
He F, Legendre P, LaFrankie IV (1997) Distribution patterns of tree species in a Malaysian tropical rain forest. Journal of Vegetation Science, 8,105-114.
Heywood IS (1991) Spatial analysis of genetic variation in plant populations. Annual Review of Ecology and Systematics, 22, 335- 355.
Hubbell SP (1979) Tree dispersion, abundance and diversity in a dry tropical forest. Science, 203,1299-1309.
Itoh A, Yamakura T, Ogino K, Lee HS, Ashton PS (1997) Spatial distribution patterns of two predominant emergent tiees in a tropical rainforest in Sarawak, Malaysia. Plant Ecology, 132, 121-136.
long K, Kaur A (1979) A cytotaxonomic view of the Diptero- carpaceae with some comments on polj^loidy and apomixis. Mémoires du Museum National d'Histoire Naturelle, Nouvelle Serie B, Botanique, 26,42-49.
long K, Lethbridge A (1967) Cytological studies in the Diptero- carpaceae. I. Chromosome numbers of certain Malaysian genera. Notes from the Royal Botanic Garden Edinburgh, 27,175-184.
Kajita T, Kamiya K, Nakamura K et al. (1998) Molecular phylogeny of Dipterocarpaceae in Southeast Asia based on nucleotide sequences of matK, trnL intron, and trnl^-trnV intergenic spacer region in chloroplast DNA. Molecular Phylogenetics and Evolution, 10,202-209.
Kalisz S, Nason ID, Hanzawa FM, Tonsor SI (2001) Spatial popu- lation genetic structure in Trillium grandiflorum: the roles of dispersal, mating history and selection. Evolution, 55, 1560- 1568.
Kaur A, Ha CO, long K et al. (1978) Apomixis may be widespread among trees of the climax rain forest. Nature, 271,440-441.
Kaur A, long K, Sands VE, Soepadmo E (1986) Cytoembryology of some Malaysian dipterocarps, with some evidance of apomixis. Botanical Journal of the Linnean Society, 92, 75-88.
Konuma A, Tsumura Y, Lee CT, Lee SL, Okuda T (2000) Estima- tion of gene flow in the tropical rain forest tree Neobalanocarpus
© 2004 Blackwell Publishing Ltd, Molecular Ecology, 10.1046/j.l365-294X.2004.02094.x

12 K. K. S. NG, S. L. LEE and C. L. KOH
heimii (Dipterocarpaceae), inferred from paternity analysis. Molecular Ecology, 9,1843-1852.
Latta RG, Linhart YB, Fleck D, Elliot M (1998) Direct and indirect estimates of seed versus pollen movement within a population of ponderosa pine. Evolution, 52, 61-67.
Leberg PL (2002) Estimating allelic richness: effects of sample size and bottlenecks. Molecular Ecology, 11, 2445-2449.
Lee SL (2000) Mating system parameters of Dryohalanops aromática Gaertn. f. (Dipterocarpaceae) in three different forest types and seed orchard. Heredity, 85, 338-345.
Lee SL, Wickneswari R, Mahani MC, Zakri AH (2000a) Mating system parameters in a tropical tree species, Shorea leprosula Miq. (Dipterocarpaceae) from Malaysian lowland Dipterocarp forest. Biotropica, 32, 693-702.
Lee SL, Wickneswari R, Mahani MC, Zakri AH (2000b) Genetic diversity of Shorea leprosula Miq. (Dipterocarpaceae) in Malaysia: implication for conservation of genetic resources and tree improvement. Biotropica, 32,213-224.
Lee SL, Wickneswari R, Mahani MC, Zakri AH (2000c) Inheritance of allozjone variants in Shorea leprosula Miq. (Dipterocarpaceae). Journal of Tropical Forest Science, 12,124-138.
Leonardi S, Raddi S, Borghetti M (1996) Spatial autocorrelation of allozyme traits in a Norway spruce {Picea abies) population. Canadian Journal of Forest Research, 26, 63-71.
Levin DA, Kerster HW (1974) Gene flow in seed plants. Evolution- ary Biology, 7, !?><)-120.
Lim LS, Wickneswari R, Lee SL, Latiff A (2002) Genetic variation of Dryohalanops aromática Gaerfn. F. (Dipterocarpaceae) in Peninsular Malaysia using microsatellite DNA markers. Forest Genetics, 9,125-136.
Loiselle BA, Sork VL, Nason JD, Graham C (1995) Spatial genetic stiucture of a tropical understorey shrub, Psychotria officinalis (Rubiaceae). American Journal of Botany, 82,1420-1425.
Mahy G, Bruederle LP, Connors B, Van Hofwegen M, Vorsa N (2000) Allozyme evidence for genetic autotetraploidy and high genetic diversity in tetraploid cranberry, Vaccinium oxycoccos (Ericaceae). American Journal of Botany, 87,1882-1889.
Manly BFJ (1997) Randomization, Bootstraps, and Monte Carlo Methods in Biology. Chapman & Hall, London.
Marshall DR, Brown AHD (1975) Optimum sampling strategies in genetic conservation. In: Crop Genetic Resources for Today and Tomorrow (eds Frankel OH, Hawkes JG), pp. 53-80. Cambridge University Press, Cambridge, UK.
Mogie M (1992) The Evolution of Asexual Reproduction in Plants. Chapman & Hall, London.
Moody ME, Mueller DL, Soltis DE (1993) Genetic variation and random genetic drift in autotetraploid populations. Genetics, 134, 649-657.
Moran PAP (1950) Notes on continuous stochastic phenomena. Biometrika, 37,17-23.
Murawski DA, Gunatilleke I AUN, Bawa KS (1994) The effect of selective logging on inbreeding in Shorea megistophylla (Dipterocarpaceae) from Sri Lanka. Conservation Biology, 8, 997-1002.
Murray M, Thompson WE (1980) Rapid isolation of high mole- cular weight plant DNA. Nucleic Acids Research, 8,4321-4325.
Nei M (1987) Molecular Evolutionary Genetics. Columbia University Press, New York.
Okuda T, Kachi N, Yap SK, Manokaran N (1997) Tree distiibution pattern and fate of juveniles in a lowland tropical rain forest • implications for regeneration and maintenance of species diver- sity. Plant Ecology, 131,155-177.
Parker KG, Hamrick JL, Parker AL, Nason JD (2001) Fine-scale genetic structure in Pinus clausa (Pinaceae) populations: effects of disturbance history. Heredity, 87, 99-113.
Peakall R, Smouse PE, Huff DR (1995) Evolutionary implications of allozyme and RAPD variation in diploid populations of buffalo grass (Buchloe dactyloides (Nutt.) Engelm.). Molecular Ecology, 4,135-147.
Petit RJ, El Mousadik A, Pons O (1998) Identifying population for conservation on the basis of genetic markers. Conservation Biology, 12, 844-855.
Plotkin JB, Potts M, Leslie N, Manokaran N, LaFrankie J, Ashton PS (2000) Species-area curves, spatial aggregation, and habitat specialization in tropical forests. Journal of Theoretical Biology, 207,81-99.
Powell W, Morgante M, Andre C, Hanafey M, Vogel J, Tingey S, Rafalski A (1996) The comparison of RELP, RAPD, AFLP and SSR (microsatellite) markers for germplasm analysis. Molecular Breeding, 2, 225-238.
Rico C, Rico I, Hewitt G (1996) 470 million years of conser- vation of microsatellite loci among fish species. Proceedings of the Royal Society of London Series B, Biological Sciences, 263, 549- 557.
Ripley BD (1976) The second-order analysis of stationary processes. Journal of Applied Probability, 13,255-266.
Schaal BA, Levin DA (1976) The demographic genetics of Liatris cylindracaea Michx. (Compositae). American Naturalist, 110,191- 206.
Schlotterer C, Pemberton J (1998) The use of microsatellites for genetic analysis of natural populations • a critical review. In: Molecular Approaches to Ecology and Evolution (eds DeSalle R, Schierwater B), pp. 71-86. Birkhauser-Verlag, Switzerland.
Schnabel A, Hamrick JL (1995) Understanding the population genetic structure of Gleditsia triacanthos L. The scale and pattern of pollen gene flow. Evolution, 49, 921-931.
Schnabel A, Laushman RH, Hamrick JL (1991) Comparative genetic structure of two co-occuring tiee species, Madura pomíf- era (Moraceae) and Gleditsia triacanthos (Leguminosae). Heredity, 67, 357-364.
Schnabel A, Nason JD, Hamrick JL (1998) Understanding the population genetic structure of Gleditsia triacanthos L. Seed dispersal and variation in female reproductive success. Molecular Ecology, 7, 819-832.
Smouse PE, Peakall R (1999) Spatial autocorrelation analysis of individual multiallele and multilocus genetic stiucture. Heredity, 82,561-573.
Sokal RR, Oden NL (1978) Spatial autocorrelation in biology. I. Methodology. Biology Journal of the Linnean Society, 10,199-228.
Sokal RR, Wartenberg DE (1983) A test of spatial autocorrelation analysis using an isolation-by-distance model. Genetics, 105, 219-247.
Soltis DE, Rieseberg LH (1986) Autopolyploidy in Tolmeia menziesii (Saxifragaceae): genetic insights from enzyme electro- phoresis. American Journal of Botany, 73, 310-318.
Stacy EA, Dayanandan S, Dancik BP, Khasa PD (2001) Micro- satellite DNA markers for the Sri Lankan rainforest tree species, Shorea cordifolia (Dipterocarpaceae), and cross-species amplification in S. megistophylla. Molecular Ecology Notes, 1, 53-54.
Stebbins GL (1980) Polyploidy in plants: unsolved problems and prospects. In: Polyploidy: Biology Relevance (ed. Lewis WH), pp. 498-512. Plenum Press, New York.
Strauss SH (1986) Heterosis at allozyme loci under inbreeding and cross-breeding in Pinus attenuate. Genetics, 113,115-134.
© 2004 Blackwell Pubhshing Ltd, Molecular Ecology, 10.1046/j.l365-294X.2004.02094.x
SPATIAL STRUCTURE AND GENETIC DIVERSITY OF DIPTEROCARP 13
Streiff R, Labbe T, Bacilieri R, Steinkellner H, Glossl J, Kremer A (1998) Within-population genetic structure in Quercus robur L. and Quercus petraea (Matt.) Liebl. assessed with isozymes and microsatellites. Molecular Ecology, 7,317-328.
Swofford DL, Selander RB (1981) BIOSYS-1: a FORTRAN program for the comprehensive analysis of electrophoretic data in popula- tion genetics and systematics. journal of Heredity, 72,281-283.
Symington CF (1943) Foresters' Manual of Dipterocarps. Malayan Forest Records no. 16. University Malaya Press, Kuala Lumpur, Malaysia.
Tautz D (1989) Hypervariability of simple sequences as a general source for polymorphic DNA markers. Nucleic Acids Research, 17,6463-6471.
Thrall PH, Young A (2000) AUTOTET: a program for analysis of autotetraploid genotypic data. Journal of Heredity, 91, 348-349.
Tonsor SJ, Kalizs S, Fisher J (1993) A life-history based study of population structure: seed bank to adults in Plantago lanceolata. Evolution, 47, 833-843.
Tsumura Y, Kawahara T, Wickneswari R, Yoshimura K (1996) Molecular phylogeny of Dipterocarpaceae in Southeast Asia using RFLP of PCR-amplified chloroplast genes. Theoritical and Applied Genetics, 93,22-29.
Turner ME, Stephens JC, Anderson WW (1982) Homozygosity and patch structure in plant populations as a result of nearest- neighbor pollination. Proceedings of the National Academy of Sciences USA, 79, 203-207.
Ujino T, Kawahara T, Tsumura Y, Nagamitsu T, Yoshimura H, Wickneswari R (1998) Development and polymorphism of simple sequence repeat DNA markers for Shorea curtisii and other Dipterocarpaceae species. Heredity, 81,422-428.
Webber ML (1934) Fruit dispersal. Malayan Forester, 3,18-19. Weeden NF, Wendel JF (1989) Genetics of plant isozymes. In:
Isozymes in Plant Biology (eds Soltis DE, Soltis PS), pp. 46-72. Dioscorides Press, Portland, OR.
Widen B, Cronberg N, Widen M (1994) Genotj^ic diversity, molecular markers and spatial distribution of genets in clonal plants, a literature survey. Folia Geobotánica and Phytotaxonomica, 29, 245-263.
Wills C, Condit R (1999) Similar non-random processes maintain diversity in two tropical rainforests. Proceedings of the Royal Society of London, 266,1445-1452.
Wricke G, Weber WE (1986) Quantitative Genetics and Selection in Plant Breeding. deGruyter, Berlin.
Wright S (1943) Isolation by distance. Genetics, 28,114-138. Wright S (1965) The interpretation of population structure by
f-statistics with special regard to systems of mating. Evolution, 19, 395-420.
Yeh FC, Yang RC, Boyle TBJ (1999) POPGENE, version 131: Microsoft Windows-Based Freeware for Population Genetic Analysis. University of Alberta and Centre for International Forestry Research, Canada.
This study forms part of the PhD study of K. K. S. Ng and it was initiated by S. L. Lee, both of whom shared a similar interest in population genetics, reproductive biology and ecology of tropical tree species, in particular Dipterocarpaceae. C. L. Koh is a Professor of genetics with a broad interest in molecular genetics and population genetics of humans and plants.
© 2004 Blackwell Publishing Ltd, Molecular Ecology, 10.1046/j.l365-294X.2004.02094.x