phylogeographic analysis reveals significant spatial ...phylogeographic analysis reveals significant...
TRANSCRIPT

Chen et al. BMC Plant Biology 2012, 12:58http://www.biomedcentral.com/1471-2229/12/58
RESEARCH ARTICLE Open Access
Phylogeographic analysis reveals significantspatial genetic structure of Incarvillea sinensis as aproduct of mountain buildingShaotian Chen1, Yaowu Xing2,3, Tao Su2, Zhekun Zhou1,2*, Emeritus David L Dilcher4 and Douglas E Soltis5
Abstract
Background: Incarvillea sinensis is widely distributed from Southwest China to Northeast China and in the RussianFar East. The distribution of this species was thought to be influenced by the uplift of the Qinghai-Tibet Plateauand Quaternary glaciation. To reveal the imprints of geological events on the spatial genetic structure of Incarvilleasinensis, we examined two cpDNA segments (trnH-psbA and trnS-trnfM) in 705 individuals from 47 localities.
Results: A total of 16 haplotypes was identified, and significant genetic differentiation was revealed (GST =0.843,NST = 0.975, P< 0.05). The survey detected two highly divergent cpDNA lineages connected by a deep gap withallopatric distributions: the southern lineage with higher genetic diversity and differentiation in the easternQinghai-Tibet Plateau, and the northern lineage in the region outside the Qinghai-Tibet Plateau. The divergencebetween these two lineages was estimated at 4.4 MYA. A correlation between the genetic and the geographicdistances indicates that genetic drift was more influential than gene flow in the northern clade with lowerdiversity and divergence. However, a scenario of regional equilibrium between gene flow and drift was shown forthe southern clade. The feature of spatial distribution of the genetic diversity of the southern lineage possiblyindicated that allopatric fragmentation was dominant in the collections from the eastern Qinghai-Tibet Plateau.
Conclusions: The results revealed that the uplift of the Qinghai-Tibet Plateau likely resulted in the significantdivergence between the lineage in the eastern Qinghai-Tibet Plateau and the other one outside this area. Thediverse niches in the eastern Qinghai-Tibet Plateau created a wide spectrum of habitats to accumulate andaccommodate new mutations. The features of genetic diversity of populations outside the eastern Qinghai-TibetPlateau seemed to reveal the imprints of extinction during the Glacial and the interglacial and postglacialrecolonization. Our study is a typical case of the significance of the uplift of the Qinghai-Tibet Plateau and theQuaternary Glacial in spatial genetic structure of eastern Asian plants, and sheds new light on the evolution ofbiodiversity in the Qinghai-Tibet Plateau at the intraspecies level.
Keywords: Spatial genetic pattern, cpDNA variations, Phylogeography, Eastern Asian plant
BackgroundPatterns of genetic and geographical structure in naturalpopulations have been strongly influenced not only byintrinsic factors, such as life histories and ecologicaltraits, but also by extrinsic factors including habitats andhistorical events [1-4]. Population geneticists have beeninterested in illustrating the factors determining genetic
* Correspondence: [email protected] Laboratory of Biodiversity and Biogeography, Kunming Institute ofBotany, Chinese Academy of Sciences, Kunming, Yunnan 650204, China2Key Laboratory of Tropical Forest Ecology, Xishuangbanna Tropical BotanicalGarden, Chinese Academy of Sciences, Mengla, 666303, ChinaFull list of author information is available at the end of the article
© 2012 Chen et al.; licensee BioMed Central LCommons Attribution License (http://creativecreproduction in any medium, provided the or
structure over the long term [5,6]. During the past twodecades, the phylogeographic histories of a broadspectrum of animal and plant species have been recon-structed, and phylogeographical analysis has proven tobe a powerful method in searching for congruent geo-graphical patterns of genetic variation and determiningthe roles that historical events have played in shapingthe present spatial genetic structure of a species [3,7-20].The elevation of the Qinghai-Tibetan Plateau and Qua-ternary glaciation were key geological events that signifi-cantly affected Asian topography, atmosphericcirculation, and even global climate. These events
td. This is an Open Access article distributed under the terms of the Creativeommons.org/licenses/by/2.0), which permits unrestricted use, distribution, andiginal work is properly cited.

Chen et al. BMC Plant Biology 2012, 12:58 Page 2 of 12http://www.biomedcentral.com/1471-2229/12/58
influenced floristic distributions, and therefore it is import-ant for biologists to seek out responses of organisms to theuplift of the Qinghai-Tibetan Plateau and the climatic fluc-tuations during glacial periods to better understandcurrent species distributions [3,19,21-25]. Until very re-cently, numerous phylogeographical studies have outlinedQuaternary evolutionary histories of European and North-ern American floras (e.g., [3,16,26-29]), but relatively fewinvestigations have focused on population divergence andphylogeography of plants in the Qinghai-Tibet Plateau[22-25,30-33]. In this study, we concentrated on elucidat-ing the spatial genetic structure of an attractive herb,Incarvillea sinensis Lam., which is widely distributed fromthe southwest China through to the northeast China andthe Russian Far East (Figure 1), whose biogeographic his-tory was proposed to be closely related to the uplift of theQinghai-Tibet Plateau and to Quaternary climate oscilla-tions [34].Incarvillea sinensis is the type species of Incarvillea
Juss. (Bignoniaceae) including 16 species, and it also is thetype of the subgenus Incarvillea including two species.Compared with other members of the genus centered inthe Himalaya-Hengduan Mountains, this species has abroad range and altitudinal distribution (Figure 1). It is veryrich in morphological variation, such as flower color, habit,and leaf characteristics, and its broad spectrum of morpho-logical variants bewildered taxonomists in their attempts to
Figure 1 The geographical distribution of Incarvillea sinensis and 16 hand SEQTP are the abbreviations of the Qinghai-Tibet Plateau, the northeasrespectively, as described in the materials and methods.
propose intraspecific subdivisions; therefore, two classifica-tions were established due to the discretionary priorities ofmorphological characteristics [35,36]. Based on habit (an-nual or perennial), Grierson [35] subdivided I. sinsensis intotwo subspecies: I. sinensis subsp. sinensis and subsp. variabi-lis. The former is an annual herb with simple roots, whilethe latter is a perennial herb with woody, branched rootsand often bears the remains of the previous year’s stems. Inanother system described in Flora Reipublicae PopularisSinicae [36], two variants were recognized, I. sinensis var.sinensis and var. przewalskii. The former is characterized byred flowers and the latter by yellow flowers. Both intraspeci-fic classifications seemed reasonable given that straightfor-ward characters (flower color or habit) were used todistinguish intraspecific taxa, but the annual populationswith red flowers were confusing owing to the disjunct distri-bution between the northern region and the southernmostLancangjiang Valley (Figure 1). The distribution was splitdue to the occurrence of perennial groups with yellow andred flowers in the middle of the entire species distribution.After investigating all of the specimens of Incarvillea
sinensis in CDBI, E, K, KUN, PE, and SZ, and exploringits distribution in China, we found that its variation inmorphology was regional and that all populations can beclassified into three types (Figure 1, Table 1). Type 1 isan annual with red flowers, distributed from the easternGansu Province to the Northeast China and the Russian
aplotypes (H1-H16) found among 705 individuals. QTP, NEQTPtern Qinghai-Tibet Plateau and the southeastern Qinghai-Tibet Plateau
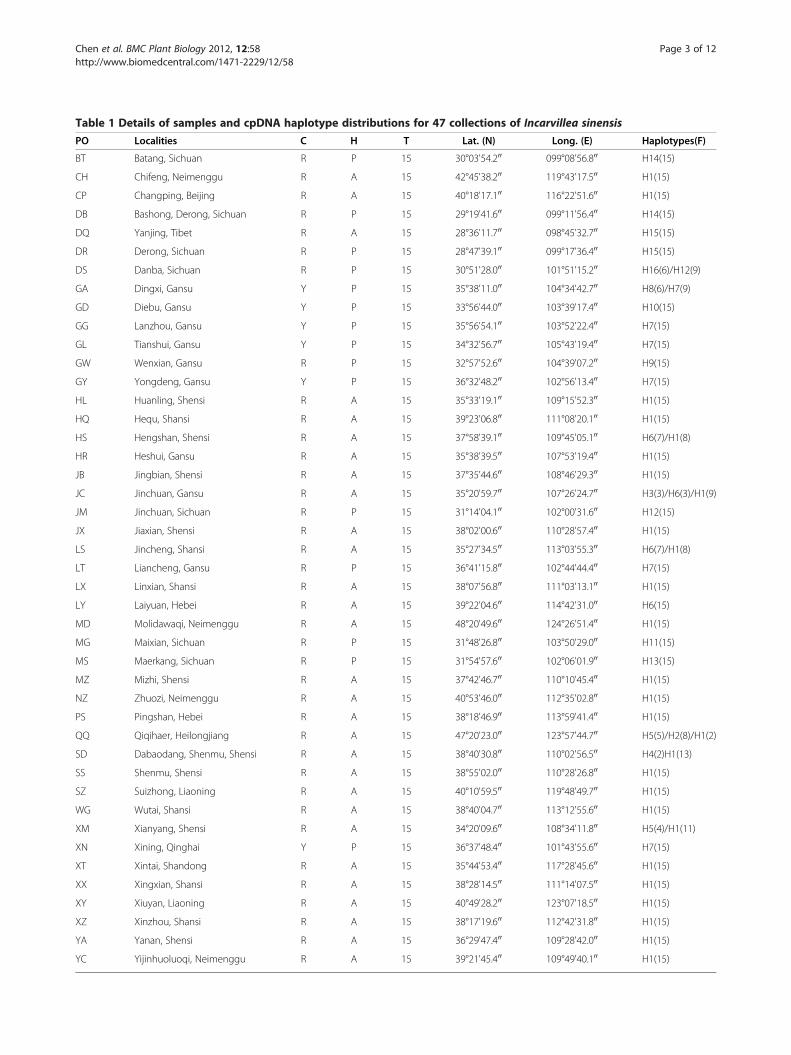
Table 1 Details of samples and cpDNA haplotype distributions for 47 collections of Incarvillea sinensis
PO Localities C H T Lat. (N) Long. (E) Haplotypes(F)
BT Batang, Sichuan R P 15 30°03'54.200 099°08'56.800 H14(15)
CH Chifeng, Neimenggu R A 15 42°45'38.200 119°43'17.500 H1(15)
CP Changping, Beijing R A 15 40°18'17.100 116°22'51.600 H1(15)
DB Bashong, Derong, Sichuan R P 15 29°19'41.600 099°11'56.400 H14(15)
DQ Yanjing, Tibet R A 15 28°36'11.700 098°45'32.700 H15(15)
DR Derong, Sichuan R P 15 28°47'39.100 099°17'36.400 H15(15)
DS Danba, Sichuan R P 15 30°51'28.000 101°51'15.200 H16(6)/H12(9)
GA Dingxi, Gansu Y P 15 35°38'11.000 104°34'42.700 H8(6)/H7(9)
GD Diebu, Gansu Y P 15 33°56'44.000 103°39'17.400 H10(15)
GG Lanzhou, Gansu Y P 15 35°56'54.100 103°52'22.400 H7(15)
GL Tianshui, Gansu Y P 15 34°32'56.700 105°43'19.400 H7(15)
GW Wenxian, Gansu R P 15 32°57'52.600 104°39'07.200 H9(15)
GY Yongdeng, Gansu Y P 15 36°32'48.200 102°56'13.400 H7(15)
HL Huanling, Shensi R A 15 35°33'19.100 109°15'52.300 H1(15)
HQ Hequ, Shansi R A 15 39°23'06.800 111°08'20.100 H1(15)
HS Hengshan, Shensi R A 15 37°58'39.100 109°45'05.100 H6(7)/H1(8)
HR Heshui, Gansu R A 15 35°38'39.500 107°53'19.400 H1(15)
JB Jingbian, Shensi R A 15 37°35'44.600 108°46'29.300 H1(15)
JC Jinchuan, Gansu R A 15 35°20'59.700 107°26'24.700 H3(3)/H6(3)/H1(9)
JM Jinchuan, Sichuan R P 15 31°14'04.100 102°00'31.600 H12(15)
JX Jiaxian, Shensi R A 15 38°02'00.600 110°28'57.400 H1(15)
LS Jincheng, Shansi R A 15 35°27'34.500 113°03'55.300 H6(7)/H1(8)
LT Liancheng, Gansu R P 15 36°41'15.800 102°44'44.400 H7(15)
LX Linxian, Shansi R A 15 38°07'56.800 111°03'13.100 H1(15)
LY Laiyuan, Hebei R A 15 39°22'04.600 114°42'31.000 H6(15)
MD Molidawaqi, Neimenggu R A 15 48°20'49.600 124°26'51.400 H1(15)
MG Maixian, Sichuan R P 15 31°48'26.800 103°50'29.000 H11(15)
MS Maerkang, Sichuan R P 15 31°54'57.600 102°06'01.900 H13(15)
MZ Mizhi, Shensi R A 15 37°42'46.700 110°10'45.400 H1(15)
NZ Zhuozi, Neimenggu R A 15 40°53'46.000 112°35'02.800 H1(15)
PS Pingshan, Hebei R A 15 38°18'46.900 113°59'41.400 H1(15)
QQ Qiqihaer, Heilongjiang R A 15 47°20'23.000 123°57'44.700 H5(5)/H2(8)/H1(2)
SD Dabaodang, Shenmu, Shensi R A 15 38°40'30.800 110°02'56.500 H4(2)H1(13)
SS Shenmu, Shensi R A 15 38°55'02.000 110°28'26.800 H1(15)
SZ Suizhong, Liaoning R A 15 40°10'59.500 119°48'49.700 H1(15)
WG Wutai, Shansi R A 15 38°40'04.700 113°12'55.600 H1(15)
XM Xianyang, Shensi R A 15 34°20'09.600 108°34'11.800 H5(4)/H1(11)
XN Xining, Qinghai Y P 15 36°37'48.400 101°43'55.600 H7(15)
XT Xintai, Shandong R A 15 35°44'53.400 117°28'45.600 H1(15)
XX Xingxian, Shansi R A 15 38°28'14.500 111°14'07.500 H1(15)
XY Xiuyan, Liaoning R A 15 40°49'28.200 123°07'18.500 H1(15)
XZ Xinzhou, Shansi R A 15 38°17'19.600 112°42'31.800 H1(15)
YA Yanan, Shensi R A 15 36°29'47.400 109°28'42.000 H1(15)
YC Yijinhuoluoqi, Neimenggu R A 15 39°21'45.400 109°49'40.100 H1(15)
Chen et al. BMC Plant Biology 2012, 12:58 Page 3 of 12http://www.biomedcentral.com/1471-2229/12/58

Table 2 Polymorphic sites of 16 haplotypes found forIncarvillea sinensis based on two cpDNA segments
NP trnH-psbA(1–372) trnS-trnfM(373–1381)
8 9 1 1 1 1 2 2 2 2 4 9 9 9 9 1 1 1 1 1 1 1 1
0 7 6 6 9 9 5 6 8 9 4 2 4 4 4 0 0 0 1 1 2 3 3
1 5 5 6 4 9 9 8 8 0 4 5 6 0 3 6 2 5 8 7 7
4 5 2 4 0 5 2 5
H1 A C T G - - - G A G G G C A A T A G G * - T G
H2 A C T G - - - G A A G G C A A T A G G * - T G
H3 A C T G - - - G A G G G A A A T A G G * - T G
H4 A C T G - - - G A G G A C A A T A G G * - T G
H5 A C T G - - - G A G G G C C A T A G G * - T G
H6 A C T G - - - G A G G G C C C T A G G * - T G
H7 G T T T A - - T G G G G C A A C A G T - † C C
H8 G T T T A - # T G G G G C A A C A G T - † C C
H9 G T T T A - - A G G G G C A A C A G T - † C C
H10 G T T T A A - A G G G G A A A C A G T - † C C
H11 G T T T A - - T G G G G C C A C A G T - † C C
H12 G T T T A - - T G G G G C C A C A C T - † C C
H13 G T C T A - - T G G G G C C A C A C T - † C C
H14 G T T T A - - T G G G G C C C C A C T - † C C
H15 G T T T A - - T G G G G C C C C C C T - † C C
H16 G T T T A - - T G G A G C C A C A C T - † C C
NP, nucleotide position; # = CTTCTA * = TATTA †=GATTAGG.
Table 1 Details of samples and cpDNA haplotype distributions for 47 collections of Incarvillea sinensis (Continued)
YH Yinchuan, Ninxia R A 15 38°42'27.100 105°57'29.900 H1(15)
YJ Yongji, Shansi R A 15 34°50'40.700 110°20'24.500 H6(10)/H1(5)
ZZ Zezhou, Shansi R A 15 35°30'29.700 113°03'03.300 H6(9)/H1(6)
PO, populations; C, flower colors; R, red flowers; Y, yellow flowers; H, habits; A, annual; P, perennial; T, number of individuals; Lat., latitude; Long., longitude; F,frequency of haplotype.
Chen et al. BMC Plant Biology 2012, 12:58 Page 4 of 12http://www.biomedcentral.com/1471-2229/12/58
Far East, with one population in the Lancangjiang Valley.Type 2 is a perennial with yellow flowers and is found inthe western Gansu Province and the eastern QinghaiProvince. Type 3 is a perennial with red flowers found inthe southeastern Qinghai-Tibet Plateau, mainly in Si-chuan Province. The morphological variations within I.sinensis can be correlated with their geographic distribu-tion, while the eastern Qinghai-Tibet Plateau (QTP) con-tain all three morphological types, and appears to be thecenter of diversity for this species. We suspected that thespatial pattern of morphological characteristics likelydropped a hint to the potential divergence in genetics.A study on the biogeography of Incarvillea suggests
that its evolution may be related to the uplift of theQinghai-Tibet Plateau. In addition, the continuous distri-bution of the subgenus Incarvillea, from the easternQinghai-Tibet Plateau to the Russian Far East, couldpartially be the result of the Quaternary expansion sincepart of its range was glaciated [34]. Incarvillea sinensisoccupies almost the full range of the subgenus except inMongolia. Considering the morphological variations cor-relative to geography, we proposed that the uplift of theQinghai-Tibetan Plateau potentially resulted in the gen-etic variations between populations within and outside ofthe Qinghai-Tibetan Plateau. Furthermore, the Pleisto-cene glaciation possibly induced the extinction of somenorthern populations and the modern distribution likelyresulted from the postglacial and interglacial expansion.In order to test the hypothesis, we examined the geneticdiversity of populations within and outside the Qinghai-Tibet Plateau and identified potential genetic lineageswithin this species.Since the colonization of new habitats occurs through
seeds, and chloroplast DNA is generally maternallyinherited in angiosperms (meaning that the plastid gen-ome is moved only by seeds) [13], chloroplast DNA(cpDNA) markers provide information on past changesin species ranges that are unaffected by subsequentpollen movements [37]. We investigated patterns ofcpDNA diversity in Incarvillea sinensis using phylogeo-graphical methods that can indicate how historicalevents such as range fragmentation, range expansion,and long distance dispersal, as well as current levels ofgene flow, have influenced present-day distributions. Thegoals of this study are to provide new insights into thepopulation genetic structure and responses of I. sinensis to
geological events and reveal the imprints of geologicalevents on the spatial pattern of the genetic diversity.
ResultsSequence variation and haplotype distributionA matrix of 1,396 characters was obtained from concate-nated alignments of trnH-psbA (377 sites) and trnS-trnfM(1,019 sites) sequences from 705 individuals representing47 collections, in which 38 polymorphic sites were con-firmed by sequencing in both directions. Sequences withpolymorphisms between each other were deposited inGenBank (Accession No. JQ858492-JQ858511). Of thesepolymorphisms, five were indels (insertions and deletions).Two indels were single nucleotides and the other threewere six bp, five bp and seven bp long respectively. In sub-sequent analysis, indels with length more than one basewere considered as a single mutation. All five indels were

Chen et al. BMC Plant Biology 2012, 12:58 Page 5 of 12http://www.biomedcentral.com/1471-2229/12/58
coded as binary characters, 1 s and 0 s, so that the matrixwas shortened to 1381 characters in length: 372 sites fromtrnH-psbA and 1,009 sites from trnS-trnfM. The adjustedmatrix included 23 variable sites, five of which were dueto the presence of indels, and all of variable sites were in-formative and involved in all analysis. All of the sequencesfrom the 47 localities contained 16 unique haplotypeswhen indels were included (Table 2). Haplotypes and theirfrequency from each locality are shown in Table 1 andtheir spatial pattern is portrayed in Figure 1.
Genealogical relationships among haplotypes ofIncarvillea sinensisIn our phylogenetic analysis, a data set including haplo-type and outgroup sequences was used to reconstructthe relationships among the haplotypes. This matrix was1,447 sites in length, and contains 38 informative sites.The consensus tree resulting from Bayesian analysis ispresented in Figure 2. The ingroup sequences clusteredinto two major clades, the southern and northern clades,concordant with geography (Figures 1, 2). The northern
Figure 2 Phylogram among cpDNA (trnS-trnfM and trnH-psbAregions) haplotypes of Incarvillea sinenesis resulting fromBayesian analysis. Numbers above the branches are posteriorprobabilities of nodes. Posterior probabilities of Bayesian run withoutassuming the molecular clock was enforced. RA: red flowers, annual;RP: red flowers, perennial; YP: yellow flowers, perennial; SEQTP: thesoutheastern Qinghai-Tibet Plateau; NEQTP: the northeasternQinghai-Tibet Plateau.
clade accommodated six haplotypes (H1-H6) from thenorthern distribution, and 10 haplotypes (H7-H16) fromthe southern distribution were nested in the southernclade. Moreover, a subclade was formed within thesouthern clade to accommodate six haplotypes (H11-H16)from the southeastern Qinghai-Tibet Plateau, situated inthe southernmost range of I. sinensis.Compared with the phylogenetic tree, the haplotype
network with 95% connection constructed using the TCSprogram was better resolved in genealogical relationshipsamong the haplotypes, but the network showed a loopindication ambiguous connections involving haplotypesH1, H5, H7, and H11. Following the rules of Crandall &Templeton [38] in combination with the genetic dis-tances between haplotypes and the phylogenetic tree, theloop was resolved and the network was shown in Figure 3.Two lineages from the southern and northern regionswere connected by 11 mutations. The northern lineagecontained six haplotypes (H1-H6) from the northern re-gion (that is, the northern clade in the phylogenetictree), and the southern lineage contained 10 haplotypes(H7-H16) from the eastern Qinghai-Tibet Plateau (thatis, the southern clade in the phylogenetic tree).The net averaged population genetic distance per site
between two regional lineages calculated using Arlequinwas 0.00879, and the divergence of these two majorclades within this species was dated at 4.396 MYA.
Population genetic parameters and phylogeographicalstructureThe total gene diversity hT was 0.677 and the averagewithin-population gene diversity hS was 0.106 at the specieslevel. The indices of population structure GST and NST were0.843 and 0.975, respectively. The permutation test showedthat NST was significantly larger than GST (P< 0.05). TheGST and NST at the regional level implicated that significantstructures existed in the SEQPT, NEQTP and theircombined regions, but not in the northern region. Geneticparameters at different levels are listed in Table 3.The analysis of molecular variance (AMOVA) of the
data from the two cpDNA fragments indicates the pres-ence of a strong differentiation in genetics among thelineages and regions (Table 4). When populations weregrouped by three geographical regions, a statistically sig-nificant structure was detected by AMOVA. The compari-son among the three regions shows that 93.94%(P< 0.001) of the genetic variations occurred betweenthese regions. Only 4.7% (P< 0.001) of the variance wasdistributed within each of these regions, and less variance(1.36%, P< 0.001) can be attributed to the variationswithin the populations. When populations were groupedby two lineages, once again, the results show a similar pat-tern. Once the populations were grouped by subspecies

Figure 3 The parsimonious network of cpDNA Haplotypes of Incarvillea sinensis inferred using the TCS program. Every haplotype isidentified by a number and each branch represents a mutational step with intermediate missing haplotypes represented by small and emptydots. The numbers in the parentheses are the frequencies of the haplotypes.
Chen et al. BMC Plant Biology 2012, 12:58 Page 6 of 12http://www.biomedcentral.com/1471-2229/12/58
and variants on taxonomy, the genetic variations betweenthe groups decreased, and the remaining variations fromthe other two sources increased accordingly. The leastamount of variance was contributed by the variationswithin populations, and this value is less than 1.5%.
Correlation between genetic and geographic distancesThe Mantel test quantified the correlations between thetwo distance matrices, allowing for the determination ofthe relationships between the genetic and the geographicaldistances. The results of this test did not show a significanteffect of isolation by distance at the species level (r=0.001,P=0.48, Figure 4A). The distributions of haplotype showedthat only six haplotypes were detected in 31 populationsfrom the northern region, and 20 of them possessed thesame haplotype (H1), so we performed this test once againafter replacing the Fsts with pairwise Nei’s genetic distances.The positive correlation between genetic difference andgeographic distance (isolation by distance) was encounteredin the species (r=0.083, P=0.034, Figure 4B). Furthermorewe found significantly positive and monotonic relationshipsacross all of the pairwise FST measures and spatial distances
Table 3 Statistic summary of genetic diversity and population
Groups Number ofpopulations
Number ofhaplotypes hs
NEQTP 8 4 0.064
SEQTP 7 5 0.064
EQTP 16 10 0.064
The northern 31 6 0.127
Total 47 16 0.106
NEQTP: the northeastern Qinghai-Tibet Plateau; SEQTP: the southeastern Qinghai-Ti
separating the populations of regions in SEQPT, NEQTP,and their combination (Figure 4C, D, and E), whose patternof scatterplots were consistent with Case I proposed byHutchison & Templeton [39]. This pattern describes thescenario of regional equilibrium between gene flow anddrift (i.e., isolation by distance). In contrast, the null hy-pothesis of the regional equilibrium was rejected in popula-tions from the northern region, and the scatterplotapproximated case Ш of Hutchison & Templeton [39], in-dicating that drift is more influential than gene flow(r=0.06, P=0.249, Figure 4E).
DiscussionConflict between the phylogeny and intraspecificclassifications previously proposedWe found neither of the intraspecific subdivisions of thetwo subspecies and the two variants was supported byphylogenetic analysis, although the species was provento be monophyletic by the cpDNA trnH-psbA sequence(not shown). Because the haplotype H15 was detected inthe DQ population, the annual DQ population with redflowers phylogenetically clustered together with all of the
subdivision of Incarvillea sisnensis
Genetic diversity and divergence
ht Gst Nst P-value
0.536 0.880 0.938 <0.05
0.907 0.929 0.960 <0.05
0.870 0.926 0.973 <0.05
0.282 0.548 0.546 <0.05
0.677 0.843 0.975 <0.05
bet Plateau; QTP: the Qinghai-Tibet Plateau.

Table 4 Results from Analysis of molecular variance ofdata from two cpDNA fragments of Incarvillea sinensis
Grouped by Source of variations
Amonggroups
Among populationswithin groups
Withinpopulations
Two lineages 91.59* 7.16* 1.25*
Three regions 93.94* 4.70* 1.36*
Two subspecies 86.95* 11.77* 1.28*
Two variants 58.41* 40.18* 1.41*
* P< 0.05.
Chen et al. BMC Plant Biology 2012, 12:58 Page 7 of 12http://www.biomedcentral.com/1471-2229/12/58
other perennial populations with red flowers from thesoutheastern Qinghai-Tibet Plateau, not together with theannual populations with red flowers from the northernregion (Table 1, Figure 1 & 2). According to the systemdescribed by Wang et al. [36], the DQ population shouldbe classified into I. sinensis var. sinensis, while the other
Figure 4 Scatterplots representing relationships between genetic distlevels. A: species level, r= 0.001, P= 0.480; B: species level, r = 0.083, p = 0.03northeastern Qinghai-Tibet Plateau, r= 0.486, P= 0.025; E: the Qinghai-TibetF: N region except the recently isolated and small populations, r=0.29, P=
populations from the southeastern Qinghai-Tibet Plateaushould be classified into I. sinensis var. przewalskii.Likewise, the perennial GW population (haplotype H9)with red flowers was most closely related to the peren-nial populations with yellow flowers from the northeast-ern Qinghai-Tibet Plateau (Table 1, Figure 1 & 2). Basedon the Grierson’s system [35], the former should beclassified into I. sinensis subsp. sinensis, while the lattershould be I. sinensis subsp. variabilis.Our study provides evidence in support of parallel evolu-
tion of morphological characteristics in allopatric popula-tions (Figure 2). Character convergence within this speciesapparently resulted from adaptation to similar niches.From the genetic data, we found no evidence warrantingthe suggestion of monophyly for any of the recognizedtaxa. We therefore propose to view this species as a speciescomplex that should not be subdivided into intraspecificunits in taxonomy.
ance (FST) and geographic distance (Km) at species and regional4; C: the southeastern Qinghai-Tibet Plateau, r= 0.512, P = 0.006; D: thePlateau, r= 0.473, P< 0.001; F: the northern region, r= 0.06, P= 0.249;0.011.
Chen et al. BMC Plant Biology 2012, 12:58 Page 8 of 12http://www.biomedcentral.com/1471-2229/12/58
Genetic diversity and structure at species and regionallevelsThe mean within-population genetic diversity is lowcompared with the total diversity at both species and re-gional levels. The AMOVA results also showed thatmost of the genetic diversity was attributed to theamong-population effects. The global indices of popula-tion differentiation were very high, up to 0.843 and0.975 for GST and NST, respectively. When NST is signifi-cantly higher than GST, this usually indicates the occur-rence of a phylogeographical structure [40]. Throughrandom permutations, a significant difference betweenthese two measures was detected within this species. Onthe other hand, 16 haplotypes were clustered into twolineages or three groups harmonious with geography(Figure 2 & 3), and none of them was shared among theregions (Figure 1). These results reveal that the cpDNAvariation of this species is highly structured.The southern clade consists of four haplotypes from
the NEQTP and six haplotypes from the SEQTP. Twopredominant haplotypes (H7 & H8) are widely distribu-ted in NEQTP, except in Wenxian and Diebu in GansuProvince, and the remaining eight haplotypes are rela-tively rare and endemic to one valley or locality (Figure 1,Table 1). The indices of genetic differentiation show thatgeographic structure exists both in the lineage and inthe subdivided regions (SEQTP and NEQTP regions,Table 3). The northern clade is distributed in the north-ern region where six haplotypes (H1-H6) are scatterederratically, and no geographic structure was detected(NST<GST). We note that both the differentiation index(GST) and the diversity index (hT) of the sorthern cladeis higher than those of the southern clade. The degree ofsubdivision of the cpDNA diversity (GST) reflects thedispersal ability of the species and the effect of long-term range fragmentation, while the low GST value is in-dicative of high levels of gene flow through seeds [13].Once capsules of Incarvillea sinensis split, the seeds areejected and the seed wings contribute to seed dispersalby wind. In the southern region accommodating thesouthern clade, orogenesis resulted in range fragmenta-tion, and populations of I. sinensis were distributed invalleys, except for those populations with haplotypes H7and H8 (Figure 1). The connections between thesepopulations were severed by towering ridges and peaks.As a result, efficient seed dispersal was reduced and thegene flow through seed dispersal was confined withinthe valleys, or between the neighboring populations.In contrast, the analogous limiting factors of seed
movement did not exist in the northern region, and wecould not identify the existence of a significant geo-graphic structure in the northern clade (GST>NST). Dis-tantly related haplotypes were more often found in thesame populations, as case 3 proposed by Pons & Petit
[40], which indicates that the relative geographic distri-bution of the haplotypes may have nothing to do withtheir genetic distances, in this case old lineages have hadample time to become geographically redistributed sincethey first appeared as products of mutation. Based onthe comparison of the indices of genetic diversity anddifferentiation between two lineages, we consider thetopographical barriers in gene flow through seed disper-sal to be the most likely factors leading to the higher di-vergence in the southern clade. The diverse niches inthe eastern Qinghai-Tibet Plateau created a widespectrum of habitats to accumulate and accommodatenew mutations.
Distinctive evolutionary histories between lineagesThe two major cpDNA lineages were revealed bymeans of reconstructing the phylogenetic tree and thehaplotype network, which can be recognized by aconnection of 11 mutations. The deep gap betweenthese two clades indicates the early origin of the cor-responding lineages in the evolution of the species,and the long-standing separation thereafter. We datedthe divergence between the two lineages at approxi-mately 4.4 MYA, which corresponds to the early Plio-cene. The uplift of the Himalaya-Hengduan massifswas a complicated geological event, and the chron-ology of this process is still under debate [41-45]. Itis believed that the plateau underwent its most recentdramatic uplift after the early Pliocene [43,44]. Thetwo lineages of Incarvillea sinensis most likely origi-nated because of decreased effective gene flow due totopographic isolation after orogenesis and long termadaptation to the distinct habitats (if their non-over-lapping distributions and unshared haplotypes aretaken into consideration). The long evolutionary his-tory allowed this species to accumulate not onlymutations relative to diversity, but also high differen-tiation between regions.For the northern lineage, the long history should be
enough for localized gene flow to interact with drift toproduce a pattern of isolation by distance across the re-gion (i.e., regional equilibrium), but the correlation esti-mation of pairwise genetic and geographical distancesshow that drift was much more influential than geneflow on the distribution of genetic variability (Figure 4E).Populations were not at equilibrium, either because con-ditions required or the populations themselves have notexisted long enough for regional pattern of isolation-by-distance to have been achieved [39,46]. The northernlineage was composed of six haplotypes detected in 31collections from the northern region. The basal and pre-dominant haplotypes (H1) was distributed randomly andthe other five haplotypes were concentrated on thehaplotype H1 in the network (Figure 3). The starlike

Chen et al. BMC Plant Biology 2012, 12:58 Page 9 of 12http://www.biomedcentral.com/1471-2229/12/58
shape of the network of the six haplotypes reflected theextremely low level of the sequence divergence and thelow frequency of rare haplotypes. The lack of regionalequilibrium, the lower diversity and starlike shape net-work of the northern lineage likely indicated that pos-sible extinction during the glacial and the interglacialand postglacial recolonization.On the contrary, within the southern clade, including all
haplotypes from the eastern Qinghai-Tibet Plateau, a sig-nificant association between the genetic variability and thegeographical distribution was revealed by the Mantel test.The Mantel tests also showed that there was a significanteffect of isolation by distance, which means that a regionalequilibrium was reached and that more closely situatedpopulations tended to communicate and be more genetic-ally similar to one another [47]. Obviously, gene flow wasmore easily accomplished on the alpine platform than infragmented landscapes, such as the southeastern Qinghai-Tibet Plateau. We conclude that the populations from thesoutheastern Qinghai-Tibet Plateau suffered severe isola-tion owing to orogenesis, which significantly reduced seeddispersal, so that gene flow through the seeds was confinedbetween neighboring populations within areas withoutstrict topographical barriers. Allopatric fragmentation be-came a theme throughout the evolutionary history of thesouthern lineage. Significant ridges and peaks of the locallandscape formed permanent spatial barrier that intensifiedand fixed genetic isolations.
ConclusionsWe detected two lineages connected by a deep gapwithin the species, and significant difference in geneticdiversity between them. The significant genetic diver-gence concordant with geography and the features ofgenetic diversity seemed to reveal the imprints of geo-logical events on the plant evolution. We preferred thesignificance of the uplift of the Qinghai-Tibet Plateauand the Quaternary Glacial in the distribution of thegenetic diversity and differentiation of Incarvillea sinen-sis, as mentioned by Chen et al. [34].The Qinghai-Tibet Plateau and its adjacent areas have
been listed as one of the world’s biodiversity hotspots[48,49]. Two processes may contribute to the formationof biodiversity centers: the elevation of local speciationrates (the center of origin hypothesis) and a greater accu-mulation of species formed elsewhere (the center of ac-cumulation hypothesis). Available studies in this areahave focused mainly on traditional taxonomy, botanicalinventory, and phylogeny-based species radiation [50-53],and as evidence mounts, it becomes increasingly clear thatboth the origin and the accumulation hypotheses haveacted in concert to form this biodiversity hotspot [51,54-59]. Only a few plant species in this region, however, havebeen phylogeographically studied (e.g. [22-25,30,32,33]).
In the absence of phylogeographical investigations on amultitude of plants, it is very difficult to uncover the com-mon microevolutionary patterns of the extant organismswithin this area. The pattern of genetic variation withinthe widely distributed Incarvillea sinensis populations,however, offers clues to the mechanisms of the evolution-ary of the diversity of plants in the Qinghai-Tibet Plateau.Our present study not only shows that the spatial geneticstructure within this species likely is the result of tectonicevents and long term adaptation to distinct habits, butalso supports an evidence on the higher diversity in theQinghai-Tibet Plateau influenced by origins.
MethodsSample collectionsWe conducted extensive fieldwork following herbar-ium specimen records of Incarvillea sinensis fromCDBI, E, K, KUN, PE, and SZ. A number of popula-tions, in some locations, became extinct due to habi-tat destruction. Numerous specimens were collectedin Henan, Shandong, Inner Mongolia, Jilin, Liaoning,and Heilongjiang provinces during the 1920s–1950s.Subsequently, fewer collections have been recorded;and no new specimens were recorded since 1985. Wewere able to obtain only eight samples in these areas,seven of which (i.e., CH, MD, QQ, SZ, XT, XY, andYH, see Table 1) were isolated and small in size. Inthis study, we sampled 705 individuals from 47 popu-lations distributed in China (Figure 1, Table 1) cover-ing the entire range of the species, except for theRussian Far East, where only a few collections wererecorded. Leaves were dried using silica-gel. A modi-fied CTAB extraction protocol was used to extractDNA from the dried leaf tissue [60].
Chloroplast DNA amplification and sequencingTwo regions of cpDNA, trnH-psbA and trnS-trnfM wereamplified and sequenced. The mixture for polymerasechain reactions consisted of a total volume of 25 μL con-taining 2.5 μL of MgCl2-free buffer, 1.5 μL of MgCl2 so-lution (25 mM), 0.5 μL of dNTPs (2.5 mM each), 1.25μL of each primer (10 μM), 1 U Taq polymerase, 1 μL oftemplate (c. 50–100 ng double-stranded DNA), and17.25 μL of sterile water.The trnH-psbA segment was amplified using the pri-
mers trnH [61] and psbA [62], and trnH was used for se-quencing. The PCRs consisted of an initial denaturationat 94°C for 3 min, followed by 30 cycles of 30 s at 94°C(denaturation), 30 s at 52°C (annealing), and 30 s at 72°C(extension), and concluding with a final extension periodof 7 min at 72°C.The trnS-trnfM fragment was amplified using the trnS
and trnfM primers [63] and both primers were used insequencing. The amplification parameters for this

Chen et al. BMC Plant Biology 2012, 12:58 Page 10 of 12http://www.biomedcentral.com/1471-2229/12/58
segment were 94°C, 3 min; 30 cycles (94°C, 30 s; 52°C,30 s; 72°C, 1 min); 72°C, 7 min.The PCR products were purified with DNA-purifica-
tion kits (Shenggong, Shanghai). The trnH-psbA andtrnS-trnfM PCR products were sequenced in both direc-tions using the ABI BigDye version 3.1 terminator cyclesequencing chemistry, with sequences read by an ABI3730 Genetic Analyser (Applied Biosystems).
Phylogenetic analysisSequences were aligned using ClustalX (version 1.81,[64]), and indels were coded as substitutions followingCaicedo & Schaal [65] using a '1' for present and '0' formissing. Haplotypes were identified using DnaSP (ver-sion 3.0, [66]). We performed phylogenetic analysis onhaplotypes of Incarvillea sinensis using MrBayes V3.1.2[67]. Based on the phylogenetic relationships amongspecies of the genus, the outgroup Incarvillea argutawas used to root the phylogenetic trees, which is similarto I. sinensis on morphology such as the flower, fruitand habit. We ran 500,000 Markov chain Monte Carlo(MCMC) generations for the Bayesian analysis, with asampling frequency of 1 in 100 generations. The con-sensus tree was constructed from trees saved afterreaching the stationarity (the density plot took a normalshape after ca. 6000 generations). Tree-building meth-ods might not always be the most appropriate way torepresent genealogical relationships among haplotypeswithin a species, owing to the possibly shallow geneticdivergence [68]; thus, a haplotype network was builtusing the TCS program [69] with the statistical parsi-mony method described by Templeton et al. [70] andCrandall et al. [71]. Ambiguities in the haplotype net-work were resolved following the recommendations ofCrandall & Templeton [38].
Genetic diversity and divergenceThe genetic structure was evaluated by the analysis of mo-lecular variance [72] using ARLEQUIN 3.11 version [73],partitioning the genetic diversity within populations,among populations within groups, and among groups. Sig-nificance was assessed after 1,023 permutations. Popula-tions were grouped by clades in phylogenetic trees,intraspecific taxonomic categories (subspecies and variantsbased on two taxonomic systems), and spatial regions.The geographic regions used for the AMOVA were: (1)the southeastern Qinghai-Tibet Plateau (SEQTP), includ-ing the southeast Tibet and the Sichuan Province; (2) thenortheastern Qinghai-Tibet Plateau (NEQTP), includingthe Qinghai Province and the western Gansu Province;and (3) the northern area, including all of the remainingdistributions outside the Qinghai-Tibet Plateau (Figure 1).The SEQTP and NEQTP regions composed the southernregion.
We calculated within-population diversity (hS), total di-versity (hT), and the level of population differentiation(GST and NST) at the species and regional levels. The oc-currence of a significant phylogeographical structurewas inferred by testing whether GST (the index that onlyconsiders haplotype identities) and NST (the index thattakes into account a measure of haplotype divergence)were significantly different using 1000 permutations inPERMUT [40,74].Traditional FST and GST estimates can not distinguish
different genetic structures with similar FST values be-cause the FST is a compound product of gene flow anddrift. In response, Hutchison & Templeton [39] pro-posed a method to evaluate the relative historical influ-ences of gene flow and drift on regional populationstructure by constructing regional scatterplots of FST ongeographical distances and calculating the correlationcoefficients describing the relationship between them.Following this method, the FST values between pairwisepopulations were calculated using ARLEQUIN. Scatter-plots of the FST on geographical distances were con-structed, and correlation coefficients were calculatedalong with the significance of correlation by performingGenAlEx6 [75], in which the genetic distance matrices(pairwise FST) were compared with the matrix of geo-graphical distance by means of a simple Mantel test todetect isolation by distance and to evaluate the relativeinfluences of gene flow and drift on the regional popula-tion structure. We used 999 random permutations totest for the Mantel statistic significance.
Dating the divergence between the major groupsThe net averaged population genetic distance, DA=diXY -(diX + diY)/2 [76], accounts for the polymorphism withinpopulations, and is thus proportional to the time sincethe divergence of two reciprocally monophyleticgroups, assuming homogeneity of the mutation ratesacross the lineage [77]. To date approximately the di-vergence of high-level clusters reconstructed usingphylogenetic and statistic parsimony analysis, we esti-mated the net pairwise divergence per site (dA) usingARLEQUIN, and then calculated the divergence timefollowing the formula T= dA/2 μ [78]. In seed plants,the approximate evolutionary rate of noncoding spaceror introns of cpDNA was estimated at 1.01 × 10⁻⁹ sub-stitutions per site per year [79], which can be used toestimate divergence time for taxa without fossil records(e.g., [24,80]; etc.). We also used this rate as the proximateevolutionary rate of the trnH-psbA and trns-trnfM frag-ments owing to the lack of any fossils for this group to useas calibration points.
Authors’ contributionsShaotian Chen carried out field work, the molecular genetic studies, thestatistical analysis, and drafted the manuscript. Yaowu Xing and Tao Su

Chen et al. BMC Plant Biology 2012, 12:58 Page 11 of 12http://www.biomedcentral.com/1471-2229/12/58
participated in sample collections and sequencing. Zhekun Zhou designedthe study. David L. Dilcher and Douglas E. Soltis polished the manuscript,and David L. Dilcher helped to conceive of the manuscript. All authors readand approved the final manuscript.
AcknowledgementsThe authors thank Drs. Xun Gong, Yong Yang, Jianying Xiang, Fujuan Zhang,Bo Tian, Wentao Yu and Lianming Gao for help with this project. This projectwas jointly funded by the National Natural Science Foundations of China(30770137, 31070198 and 41030212), the Natural Science Foundation ofYunnan Province (2007C087M) and the West Light Foundation of TheChinese Academy of Sciences.
Author details1Key Laboratory of Biodiversity and Biogeography, Kunming Institute ofBotany, Chinese Academy of Sciences, Kunming, Yunnan 650204, China. 2KeyLaboratory of Tropical Forest Ecology, Xishuangbanna Tropical BotanicalGarden, Chinese Academy of Sciences, Mengla, 666303, China. 3Institute ofSystematic Botany, University of Zürich, Zürich, 8008, Switzerland.4Department of Biology, Indiana University, Bloomington, IN 47405, USA.5Department of Biology, University of Florida, Gainesville, FL 32611-7800,USA.
Received: 20 December 2011 Accepted: 4 April 2012Published: 30 April 2012
References1. Ge XJ, Chiang YC, Chou CH, Chiang TY: Nested clade analysis of Dunnia
sinensis (Rubiaceae), a monotypic genus from China based on organelleDNA sequences. Conserv Genet 2002, 3:351–362.
2. Hamrick JL, Godt MJW, Sherman-Broyles SL: Factors influencing levels ofgenetic diversity in woody plant species. New Forest 1992, 6:95–124.
3. Hewitt GM: Genetic consequences of climatic oscillations in theQuaternary. Philos T Roy Soc B 2004, 359:183–195.
4. Newton AC, Allnutt AR, Gillies ACM, Lowe AJ, Ennos RA: Molecularphylogeography, intraspecific variation and the conservation of treespecies. Trends Ecol Evol 1999, 14:140–145.
5. Avise JC: Phylogeography: The History and Formation of Species. Cambridge,Massachusetts: Harvard University Press; 2000.
6. Schaal BA, Hayworth DA, Olsen KM, Rauscher JT, Smith W: Phylogeographystudies in plants: problems and prospects. Mol Ecol 1998, 7:465–474.
7. Aoki K, Suzuki T, Hsu T-W, Murakami N: Phylogeography of the componentspecies of broad-leaved evergreen forests in Japan, based on chloroplastDNA. J Plant Res 2004, 117:77–94.
8. Arbogast BS, Kenagy GJ: Comparative phylogeography as an integrativeapproach to historical biogeography. J Biogeogr 2001, 28:819–825.
9. Avise JC: Molecular population structure and the biogeographic historyof a regional fauna: a case history with lessons for conservation biology.Oikos 1992, 63:62–76.
10. Brochmann C, Gabrielsen TM, Nordal I, Landvik JY, Elven R: Glacial survivalor tabula rasa? The history of North Atlantic biota revisited. Taxon 2003,52:417–450.
11. Fujii N, Ueda K, Watano Y, Shimizu T: Intraspecific sequence variation of chloroplastDNA in Pedicularis chamissonis Steven (Scrophulariaceae) and geographicstructuring of the Japanese ‘alpine’ plants. J Plant Res 1997, 110:195–207.
12. Huang SF, Hwang SY, Wang JC, Lin TP: Phylogeography of Trochodendronaralioides (Trochodendraceae) in Taiwan and its adjacent areas. J Biogeog2004, 31:1251–1259.
13. Petit RJ, Aguinagalde I, De Beaulieu J-L, Bittkau C, Brewer S, Cheddadi R,Ennos R, Fineschi S, Griver D, Lascoux M, Mohanty A, Müller-Starck G,Demesure-Musch B, Palmé A, Martin JP, Rendell S, Vendramin GG: Glacialrefugia: hotspots but not melting pots of genetic diversity. Science 2003,300:1563–1565.
14. Seo A, Watanabe M, Hotta M, Murakami N: Geographical patterns ofallozyme variation in Angelica japonica (Umbelliferae) and Farfugiumjaponicum (Compositae) on the Ryukyu Islands, Japan. Acta PhytotaxGeobot 2004, 55:29–44.
15. Soltis DE, Gitzendanner MA, Strenge DD, Soltis PS: Chloroplast DNAintraspecific phylogeography of plants from the Pacific Northwest ofNorth America. Plant Syst Evol 1997, 206:353–373.
16. Soltis DE, Morris AB, McLachlan JS, Manos PS, Soltis PS: Comparativephylogeography of unglaciated eastern North America. Mol Ecol 2006,15:4261–4293.
17. Stehlik I: Resistance or emigration? Response of alpine plants to the iceages. Taxon 2003, 52:499–510.
18. Stewart JR, Lister AM: Cryptic northern refugia and the origins of themodern biota. Trends Ecol Evol 2001, 16:608–613.
19. Taberlet P, Fumagalli L, Wust-Saucy AG, Cosson JF: Comparativephylogeography and postglacial colonization routes in Europe. Mol Ecol1998, 7:453–464.
20. Trewick SA, Wallis GP, Morgan-Richards M: Phylogeographical patterncorrelates with Pliocene mountain building in the alpine scree weta(Orthoptera, Anostostomatidae). Mol Ecol 2000, 9:657–666.
21. Su B, Wang YX, Lan H, Wang W, Zhang Y: Phylogenetic study of completecytochrome b genes in musk deer (genus Moschus) using museumsamples. Mol Phylogenet Evol 1999, 12:241–249.
22. Wang F, Gong X, Hu C, Hao G: Phylogeography of an alpine speciesPrimula secundiflora inferred from the chloroplast DNA sequencevariation. J Syst Evol 2008, 46:13–22.
23. Yang FS, Li YF, Ding X, Wang XQ: Extensive population expansion ofPedicularis longiflora (Orobanchaceae) on the Qinghai-Tibetan Plateauand its correlation with the Quaternary climate change. Mol Ecol 2008,17:5135–5145.
24. Yuan QJ, Zhang ZY, Peng H, Ge S: Chloroplast phylogeography ofDipentodon (Dipentodontaceae) in southwest China and northernVietnam. Mol Ecol 2008, 17:1054–1065.
25. Zhang Q, Chiang TY, George M, Liu JQ, Abbott RJ: Phylogeography of theQinghai-Tibetan Plateau endemic Juniperus przewalskii (Cupressaceae)inferred from chloroplast DNA sequence variation. Mol Ecol 2005,14:3513–3524.
26. Abbott RJ, Brochmann C: History and evolution of the arctic flora: in thefootsteps of Eric Hultén. Mol Ecol 2003, 12:299–313.
27. Abbott RJ, Smith LC, Milne RI, Crawford RMM, Wolff K, Balfour J: Molecularanalysis of plant migration and refugia in the Arctic. Science 2000,289:1343–1346.
28. Anderson LL, Hu FS, Nelson DM, Petit RJ, Paige KN: Ice-age endurance:DNA evidence of a white spruce refugium in Alaska. Proc Natl Acad SciUSA 2006, 103:12447–12450.
29. Petit RJ, Hampe A, Cheddadi R: Climate changes and treephylogeography in the Mediterranean. Taxon 2005, 54:877–885.
30. Gao LM, Möller M, Zhang XM, Hollingsworth ML, Liu J, Mill RR, Gibby M, LiDZ: High variation and strong phylogeographic pattern among cpDNAhaplotypes in Taxus wallichiana (Taxaceae) in China and North Vietnam.Mol Ecol 2007, 16:4684–4698.
31. Ge XJ, Zhang LB, Yuan YM, Hao G, Chiang TY: Strong geneticdifferentiation of the East-Himalayan Megacodon stylophorus(Gentianaceae) detected by inter-simple sequence repeats (ISSR).Biodivers Conserv 2005, 14:849–861.
32. Meng L, Yang R, Abbott RJ, Miehe G, Hu TH, Liu JQ: Mitochondrial andchloroplast phylogeography of Picea crassifolia Kom. (Pinaceae) in theQinghai-Tibetan Plateau and adjacent highlands. Mol Ecol 2007, 16:4128–4137.
33. Song BH, Wang XQ, Wang XR, Ding KY, Hong DY: Cytoplasmiccomposition in Pinus densata and population establishment of thediploid hybrid pine. Mol Ecol 2003, 12:2995–3001.
34. Chen S, Guan K, Zhou Z, Olmstead R, Cronk Q: Molecular phylogeny ofIncarvillea (Bignoniaceae) based on ITS and trnL-F sequences. Am J Bot2005, 92:625–633.
35. Grierson AJC: A revision of the genus Incarvillea. Notes Roy Bot Gard Edinb1961, 23:303–354.
36. Wang WT, Pan KY, Zhang ZY, Li ZY, Tao DD, Yin WQ: Incarvillea Juss. InFlora Reipublicae Popularis Sinicae, Volume 69. Edited by Wang WT. Beijing,China: Science Press; 1990:34–49.
37. Petit RJ, Kremer A, Wagner DB: Finite island model for organelle andnuclear genes in plants. Heredity 1993, 71:630–641.
38. Crandall KA, Templeton AR: Empirical tests of some predictions fromcoalescent theory with applications to intraspecific phylogenyreconstruction. Genetics 1993, 134:959–969.
39. Hutchison DW, Templeton AR: Correlation of pairwise genetic andgeographic distance measures: inferring the relative influences of gene

Chen et al. BMC Plant Biology 2012, 12:58 Page 12 of 12http://www.biomedcentral.com/1471-2229/12/58
flow and drift on the distribution of genetic variability. Evolution 1999,53:1898–1914.
40. Pons O, Petit RJ: Measuring and testing genetic differentiation withordered versus unordered alleles. Genetics 1996, 144:1237–1245.
41. Coleman M, Hodges K: Evidence for Tibetan plateau uplift before 14 Myrago from a new minimum age for eat-west extension. Nature 1995,374:49–52.
42. Guo ZT, Ruddiman WF, Hao QZ, Wu HB, Qiao YS, Zhu RX, Peng SZ, Wei JJ,Yuan BY, Liu TS: Onset of Asian desertification by 22 Myr ago inferredfrom loess deposits in China. Nature 2002, 416:159–163.
43. Li JJ, Fang XM, Pan BT, Zhao ZJ, Song YG: Qinghai-Tibetan Plateau violentuplift and influence upon circumjacent environment in Late Cenozoic.Quaternary Sci (in Chinese) 2001, 21:381–390.
44. Shi YF, Li JJ, Li BY, Yao TD, Wang SM, Li SJ, Cui ZJ, Wang FB, Pan BT, Fang XM,Zhang QS: Uplift of the Qinghai-Xizang (Tibetan) Plateau and East Asiaenvironmental change during late Cenozoic. Acta Geograph Sin (in Chinese)1999, 54:10–21.
45. Spicer RA, Harris NBW, Widdowson M, Herman AB, Guo SX, Valdes PJ, WolfeJA, Kelley SP: Constant elevation of southern Tibet over the past 15million years. Nature 2003, 421:622–624.
46. McCauley DE: Genetic consequences of extinction and recolonization infragmented habitats. In Biotic interactions and global change. Edited byKareiva PM, Kingsolver JG, Huey RB. Sunderland, MA: Sinauer; 1993:217–233.
47. Wright S: Isolation by distance. Genetics 1943, 28:114–138.48. Myers N, Mittermeier R, Mittermeier C, Fonseca G, Kent J: Biodiversity
hotspots for conversation priorities. Nature 2000, 403:853–858.49. Conservation International: Biodiversity-hotspots. [http://www.
biodiversityhotspots.org/xp/Hotspots/hotspots_by_region/Pages/default.aspx]50. Guo X, He S, Zhang Y: Phylogeny and biogeography of Chinese sisorid
catfishes re-examined using mitochondrial cytochrome b and 16 S rRNAgene sequences. Mol Phylogenet Evol 2005, 35:344–362.
51. Liu JQ, Wang YJ, Wang AL, Hideaki O, Abbott RJ: Radiation anddiversification within the Ligularia-Cremanthodium-Parasenecio complex(Asteraceae) triggered by uplift of the Qinghai-Tibetan Plateau. MolPhylogenet Evol 2006, 38:31–49.
52. Luo J, Yang D, Suzuki H, Wang YG, Chen WJ, Campbell KL, Zhang YP:Molecular phylogeny and biogeography of Oriental voles: genusEothenomys (Muridae, Mammalia). Mol Phylogenet Evol 2004, 33:349–362.
53. Sun HL, Zheng D: Formation, Evolution and Development of Qinghai-Xizang(Tibetan) Plateau. Guangzhou, China: Guangdong Science & TechnologyPress; 1998.
54. Peng Z, Ho SYW, Zhang Y, He S: Uplift of the Tibetan plateau: Evidencefrom divergence times of glyptosternoid catfishes. Mol Phylogenet Evol2006, 39:568–572.
55. Qiao CY, Ran JH, Wang XQ: Phylogeny and biogeography of Cedrus(Pinaceae) inferred from sequences of seven paternal chloroplast andmaternal mitochondrial DNA regions. Ann Bot 2007, 100:573–580.
56. Ran JH, Wei XX, Wang XQ: Molecular phylogeny and biogeography ofPicea (Pinaceae): implications for phylogeographical studies usingcytoplasmic haplotypes. Mol Phylogenet Evol 2006, 41:405–419.
57. Wei XX, Wang XQ: Recolonization and radiation in Larix (Pinaceae):evidence from nuclear ribosomal DNA paralogues. Mol Ecol 2004,13:3115–3123.
58. Wu CY: Vegetation of China. Beijing: Science Press; 1980.59. Yang FS, Wang XQ, Hong DY: Unexpected high divergence in nrDNA ITS
and extensive parallelism in floral morphology of Pedicularis(Orobanchaceae). Plant Syst Evol 2003, 240:91–105.
60. Doyle JJ, Doyle JL: A rapid DNA isolation procedure for small quantitiesof fresh leaf tissue. Phytochem Bull 1987, 19:11–15.
61. Tate JA, Simpson BB: Paraphyly of Tarasa (Malvaceae) and diverse originsof the polyploid species. Syst Bot 2003, 28:723–737.
62. Sang T, Crawford DJ, Stuessy TF: Chloroplast DNA phylogeny, reticulateevolution, and biogeography of Paeonia (Paeoniaceae). Am J Bot 1997,84:1120–1136.
63. Demesure B, Sodzi N, Petit RJ: A set of universal primers for amplificationof polymorphic non-coding regions of mitochondrial and chloroplastDNA in plants. Mol Ecol 1995, 4:129–131.
64. Thompson JD, Gibson TJ, PLewniak F, Jeanmougin F, Higgins DG: TheCLUSTALX windows interface: flexible strategies for multiple sequencealignment aided by quality analysis tools. Nucleic Acids Res 1997,24:4876–4882.
65. Caicedo AL, Schaal BA: Population structure and phylogeography ofSolanum pimpinellifolium inferred from a nuclear gene. Mol Ecol 2004,13:1871–1882.
66. Rozas J, Rozas R: DnaSP version 3: an integrated program for molecularpopulation genetics and molecular evolution analysis. Bioinformatics1999, 15:174–175.
67. Huelsenbeck JP, Ronquist F: Mrbayes: Bayesian inference of phylogenetictrees. Bioinformatics 2001, 17:754–755.
68. Posada D, Crandall KA: Intraspecific gene genealogies: trees grafting intonetworks. Trends Ecol Evol 2001, 16:37–45.
69. Clement M, Posada D, Crandall KA: TCS: A computer program to estimategene genealogies. Mol Ecol 2000, 9:1657–1660 (Available from URL: http://darwin.uvigo.es/software/tcs.html.).
70. Templeton AR, Crandall KA, Sing CF: A cladistic analysis of phenotypicassociations with haplotypes inferred from restriction endonucleasemapping and DNA sequence data. III. Cladogram estimation. Genetics1992, 132:619–633.
71. Crandall KA, Templeton AR, Sing CF: Intraspecific cladogram estimation:problems and solutions. In Models in Phylogeny Reconstruction. Edited byScotland RW, Siebert DJ, Williams DM. Oxford: Clarendon; 1994:273–297.
72. Excoffier L, Smouse PE, Quattro JM: Analysis of molecular variance inferredfrom metric distances among DNA haplotypes: application to humanmitochondrial DNA restriction data. Genetics 1992, 131:479–491.
73. Schneider S, Roessli D, Excoffier L: ARLEQUIN Version 2.000: A Software forPopulation Genetics Data analysis. [http://lgb.unige.ch/arlequin/]
74. Burban C, Petit RJ, Carcreff E, Jactel H: Rangewide variation of themaritime pine bast scale Matsucoccus feytaudi Duc. (Homoptera:Matsucoccidae) in relation to the genetic structure of its host. Mol Ecol1999, 8:1593–1602.
75. Peakall R, Smouse PE: GENALEX 6: genetic analysis in Excel. Populationgenetic software for teaching and research. Mol Ecol Notes 2006, 6:288–295.
76. Nei M, Li WH: Mathematical model for studying genetic variation interms of restriction endonucleases. Proc Natl Acad Sci USA 1979, 76:5269–5273.
77. Edwards SV, Beerli P: Perspective: gene divergence, populationdivergence, and the variance in coalescence time in phylogeographicstudies. Evolution 2000, 54:1839–1854.
78. Nei M, Kumar S: Molecular Evolution and Phylogenetics. New York: OxfordUniversity Press; 2000.
79. Graur D, Li WH: Fundamentals of Molecular Evolution. Sunderland,Massachusetts: Sinauer & Associates; 1999.
80. Chiang YC, Hung KH, Schaal BA, Ge XJ, Hsu TW, Chiang TY: Contrastingphylogeographical patterns between mainland and island taxa of thePinus luchuensis complex. Mol Ecol 2006, 15:765–779.
doi:10.1186/1471-2229-12-58Cite this article as: Chen et al.: Phylogeographic analysis revealssignificant spatial genetic structure of Incarvillea sinensis as a product ofmountain building. BMC Plant Biology 2012 12:58.
Submit your next manuscript to BioMed Centraland take full advantage of:
• Convenient online submission
• Thorough peer review
• No space constraints or color figure charges
• Immediate publication on acceptance
• Inclusion in PubMed, CAS, Scopus and Google Scholar
• Research which is freely available for redistribution
Submit your manuscript at www.biomedcentral.com/submit