spatial network, theory and applications - marc barthelemy
TRANSCRIPT

Lake Como 2016
Spatial network Theory and applications
Marc Barthelemy
CEA, Institut de Physique Théorique, Saclay, France EHESS, Centre d’Analyse et de Mathématiques sociales, Paris, France
[email protected] http://www.quanturb.com

Lake Como 2016
Outline
n I. Introduction: space and networks
n II. Tools q Irrelevant tools q Interesting tools
n Typology (street patterns) n Simplicity n Time evolution (Streets, subway) n Mobility networks: Extracting mesoscale information
n III. Some models q “Standard” models
n Random geometric graph, tessellations n Optimal networks
q “Non-standard” n Road networks
q Scaling theory n Subway and railways

Lake Como 2016
(Short) Bibliography
n Review article and books q Spatial Networks, MB, Physics Reports 499:1-101 (2011) (and arXiv) q Morphogenesis of spatial networks, MB, Springer, to appear (2017)
n Books and articles (more mathematical) q Spatial tessellations, A Okabe (2009) q Papers by D. Aldous
n Older (but excellent) material: q Models in geography, Chorley and Haggett q Network analysis in geography, Haggett and Chorley
n More specialized (urban systems and transportation) q The geography of transport systems, Rodrigue, Comtois, Slack q Geography of transportation, Taaffe and Gauthier q Planning for place and plexus, Levinson and Krizek q A new science of cities, M Batty (2013) q The Structure and dynamics of cities, MB, Cambridge Univ Press, to appear
(2016)

Lake Como 2016
Space and networks
n Network science: space is not important n But for many networks, space does matter !
q Biological (neural networks, veins) q Technological (power grids, Internet) q Transportation (roads, railways, airline network) ⇒ Nodes in space
Questions: - Effect of space on the traffic and on the shape of (transportation) networks - Principles of formation/evolution of spatial networks

Lake Como 2016
Spatial networks
n A network is ‘spatial’ if q The nodes are located in space q The network is embedded in a space: There is a ‘cost’
associated to the length of links: a long link must be compensated by something else (large degree, traffic, etc.)
n Adjacency matrix (NxN) + the position of nodes q Very rich object q Time evolution: difficult problem
n Many examples q Transportation systems q Power grids q Social networks q …

Lake Como 2016
Transportation networks
Transporting energy, goods or individuals - formation and evolution - congestion, optimization, robustness - disease spread, urban evolution

Lake Como 2016
Transporting water
Nodes: intersections, auxins sources"Links: veins !!Example of a "planar network"

Lake Como 2016
Transporting goods
State of Indiana (Bureau of Transportation statistics)

Lake Como 2016
Nodes: power plants, transformers, etc,…)"
Links: cables"
Transporting electricity
New York state power grid"

Lake Como 2016
Transporting electricity US power grid"

Lake Como 2016
Transporting gas European pipelines"

Lake Como 2016
Transporting individuals: urban scale

Lake Como 2016
Intra urban movements: streets and roads

Lake Como 2016
TRANSIMS project"
Nodes: locations (homes, shops, offices, …)"
Links: flow of individuals"
Chowell et al Phys. Rev. E (2003) Nature (2004)
Transporting individuals: intra city"Mobility networks

Nodes: airports Links: direct flight"
Transporting individuals: global scale "(air travel)

Neural Network Nodes: neurons "Links: axons !

Social Networks and space Nodes: individuals "Links: ‘relation’!
Distance distribution of your friends ?
P (r) ⇠ 1
r�

Lake Como 2016
Planar networks Most of the interesting spatial networks are planar

Lake Como 2016
Planar networks
Graph G=(V,E) and can be represented in the plane without intersections
n Does not contain K5 or K3,3
n Euler’s formula:
n Any face has at least 3 edges and every edge touches at most two faces (2E≥3F): Exact bound

Lake Como 2016
Planar networks
n Other consequence:
n Important for null models ! Don’t compare to Emax=N(N-1)/2

Lake Como 2016
n A graph has many representations (in 2d)
n But it can be drawn in 2d in such a way that no edges cross each other: planar embedding, plane graph, planar map
n The planar map is the well-defined object for
mathematicians -used for the four color theorem for example and in combinatorics (Tutte, Schaeffer, …)
Planar maps

Lake Como 2016
Irrelevant measures

Lake Como 2016
Uninteresting measures
n Average degree
n Degree distribution
n Clustering and assortativity properties
n Edge length distribution

Lake Como 2016
Degree distribution P(k)
n Physical constraints limit the degree (planar networks: <k> <6)
n Road network and commuters in sardinia
Lammer et al, Physica A (2006) De Montis et al, Env Plan B (2007)

Power grids
Sole et al (2008)
Map Topological network
Degree distribution Europe, Italy, UK &Ireland

Power grids
Albert et al (2004)
North America

Lake Como 2016
Airline network
n For spatial non-planar networks, we can have large degrees (worldwide airline network, inter-urban)
Barrat, MB, Pastor-Satorras, Vespignani (2005)
Airline network

Lake Como 2016
n In general:
Spatial networks are usually more clustered (>> 1/N)
n In general
Almost flat assortativity ( )
Clustering and assortativity properties "

Lake Como 2016
North American Airline network
Clustering and assortativity properties "
Barrat et al, 2005
Lake Como 2016
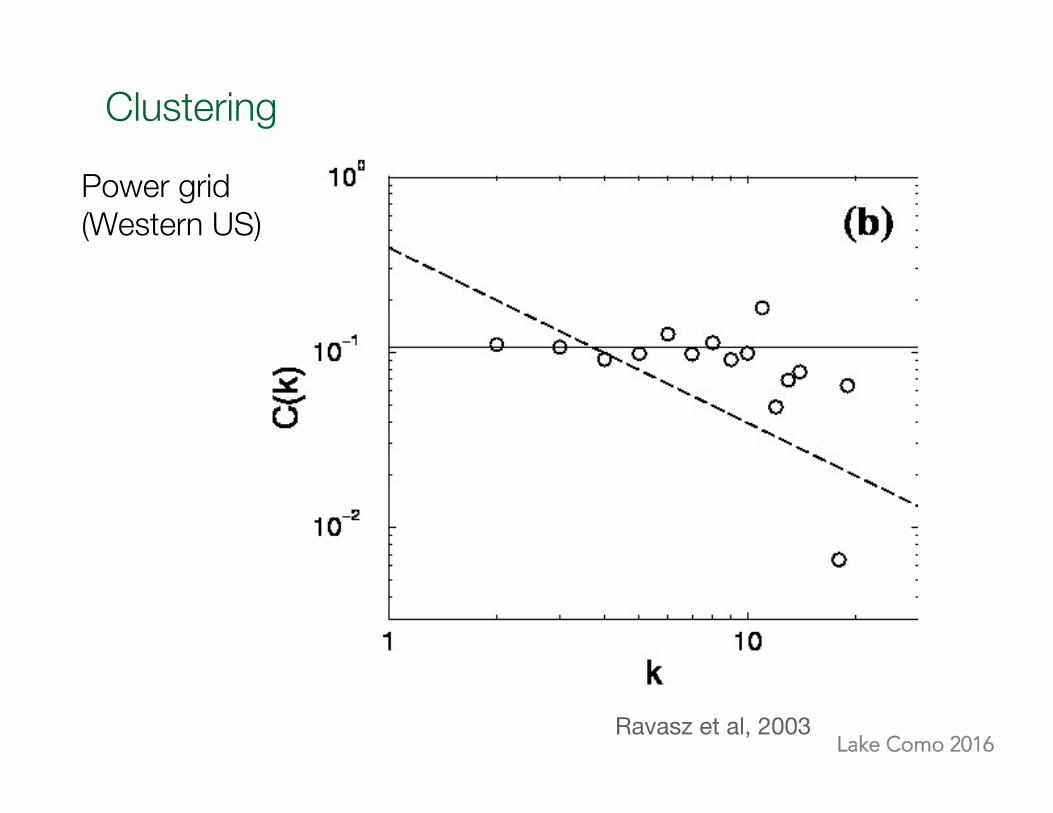
Power grid (Western US)
Clustering"
Ravasz et al, 2003

Lake Como 2016
Internet (router level)
Clustering"
Ravasz et al, 2003
C(k)=const. (BA: C(k)=1/k)]

Lake Como 2016
Empirical fact: Length of links
n Edge link limited by cost
Gastner et Newman EPJ (2006)
Barrat, MB, Vespignani, JSTAT (2005)

Lake Como 2016
Empirical fact: Length of links
n London street length
Masucci et al., 2009

Lake Como 2016
Road networks: Total length
Data from: Cardillo et al, PRE 2006
Total length vs. N
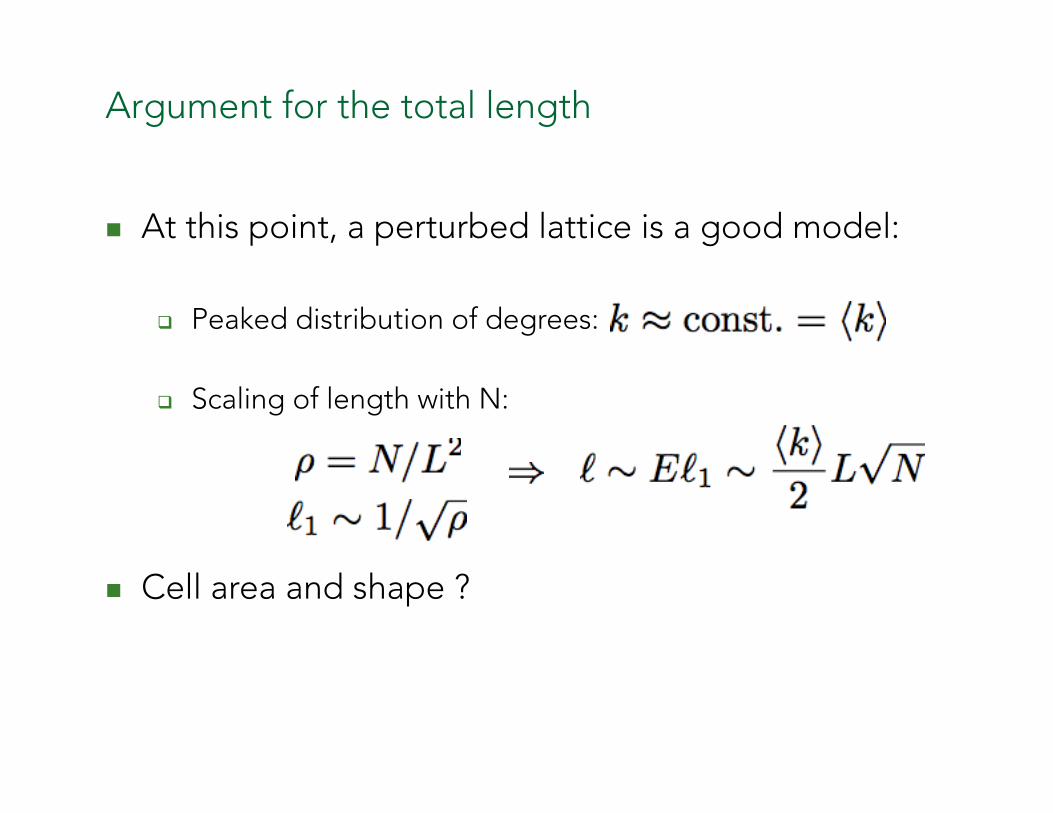
Argument for the total length
n At this point, a perturbed lattice is a good model:
q Scaling of length with N:
q Peaked distribution of degrees:
n Cell area and shape ?

Lake Como 2016
Interesting tools
- Various indicators - Typology of street patterns - Simplicity - Time evolution of networks

Lake Como 2016
Space has an important impact on the structure
Low information content measures: n Generally planar (nodes, edges, faces or cells) n Degree distribution: peaked (if planar) n Clustering: large n Assortativity spectrum: flat n Edge length distribution: peaked n Total length: N1/2
More interesting: n Geometry statistics of cells (for planar graphs) n Betweenness centrality properties n Communities n Traffic, correlations: degree-distance, degree-traffic n …

Specific tools for spatial networks
§ Indices alpha, gamma, etc…

Specific tools for spatial networks
§ Indice for street networks
§ If r close to 1: ‘organic’ city § Small r<<1: organized city (N(4) dominant)

Specific tools for spatial networks
§ Indice for transportation networks
§ Q=1: straight line § Q>>1: large detour (see D. Aldous)

Specific tools for spatial networks
§ Indice for transportation networks

Specific tools for spatial networks
§ Indice for transportation networks

Specific tools for spatial networks
§ An interesting null model: the minimum spanning tree (MST)
§ Cost and efficiency

Lake Como 2016
Typology: “classification” of planar graphs

Lake Como 2016
Typology of planar graphs
Many applications: n Botanics (classification of leaves) n Urban morphology: street network (“Space syntax”)

Lake Como 2016
Typology of street networks
S. Marshall (2005)

Lake Como 2016
Typology of street networks
Classification Attempt
S. Marshall (2005)

Lake Como 2016
“Census of planar graphs”
n BDG bijection between a rooted map and a tree (Bouttier, Di Francesco, Guitter, Electron J Combin, 2009) n Approximate tree representation of a weighted planar map (Mileyko et al, PLoS One, 2012 Katifori et al, PLoS One 2012)

Lake Como 2016
Typology of planar graphs
From the graph to the statistics of blocks

Lake Como 2016 Lammer et al, Physica A (2006)
Shape of blocks
Lammer et al, Physica A (2006)

Lake Como 2016
- Lammer et al, Physica A (2006) - MB, Physics Reports (2011)
Area of blocks
⌧ ' 2.0
Lake Como 2016
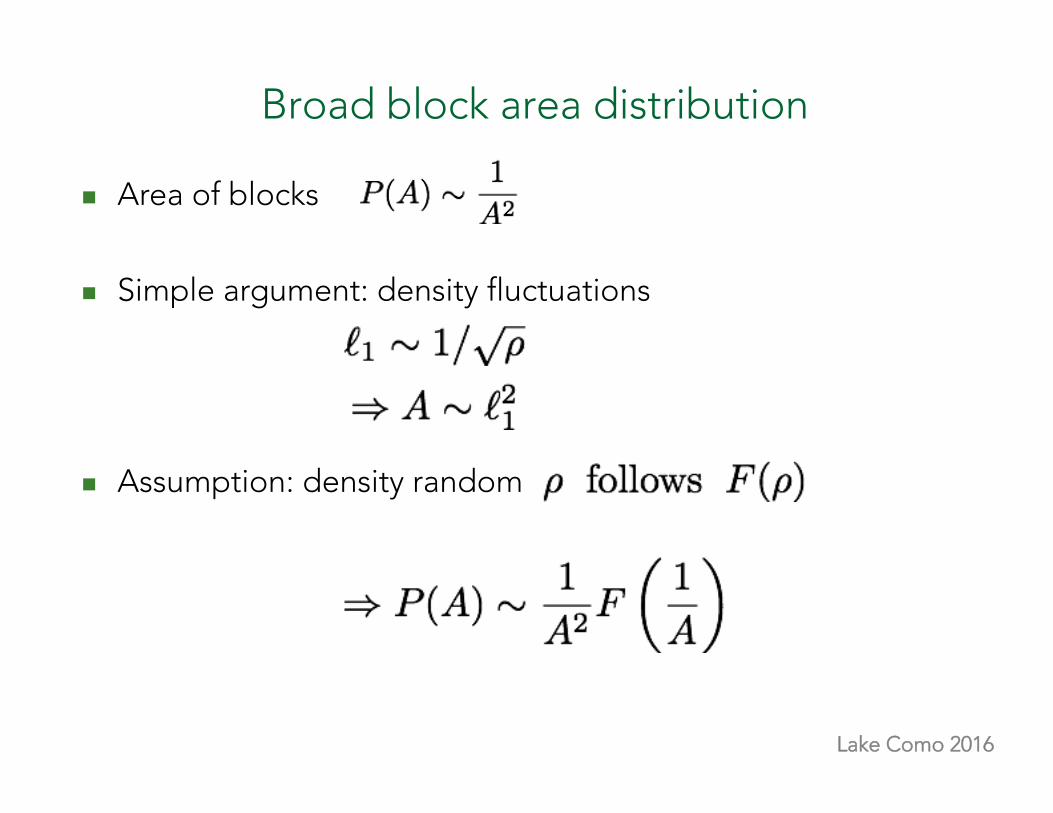
Broad block area distribution
n Area of blocks
n Simple argument: density fluctuations
n Assumption: density random

Lake Como 2016
Shape versus area
n But even with the same P(Φ) the networks can be very different ! Importance of P(A)
n The visual impression of a map is given by both the distribution of shapes and areas
n We thus use P(Φ|A) and bin the area (small, medium, large)

Lake Como 2016
Combining shape and area of blocks: a “fingerprint” of planar graphs:
Louf & MB, RS Interface (2014)
P (�|A)

Lake Como 2016
A “fingerprint” of planar graphs
Tokyo
NYC

Lake Como 2016
Typology of street patterns
Louf & MB, RS Interface (2014)
n Distance constructed on n Clustering -> classes of planar graphs (131 cities)
P (�|A)

Lake Como 2016
Not the end of the story
n Attempt to classify planar maps
n Taking into account both topological and geometrical features
n Correlations ? (existence of neighborhoods)
Lake Como 2016
Time evolution: Characterization ?
Too many things to measure…

Lake Como 2016
An old problem in quantitative geography
n Kansky (63-69) Evolution of the Sicilian railroad network n Morrill (1965) Railway network Growth n New data sources: Digitization of old maps
Lake Como 2016
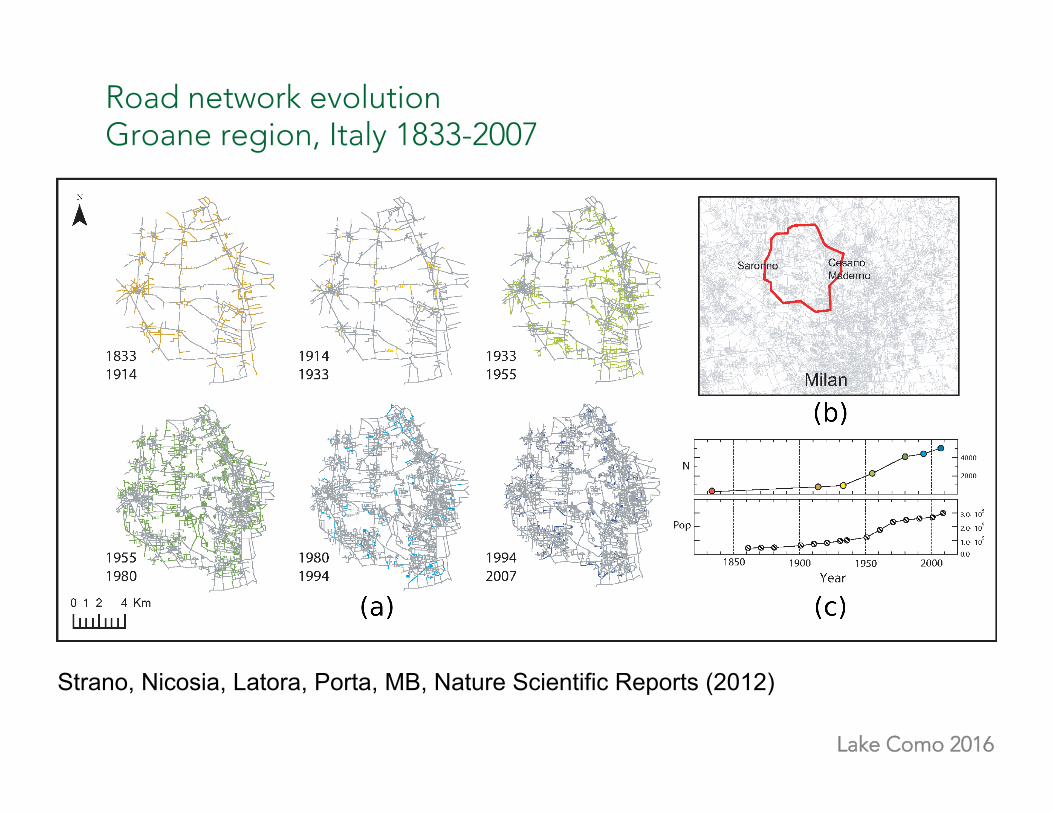
Road network evolution Groane region, Italy 1833-2007
Strano, Nicosia, Latora, Porta, MB, Nature Scientific Reports (2012)

Lake Como 2016
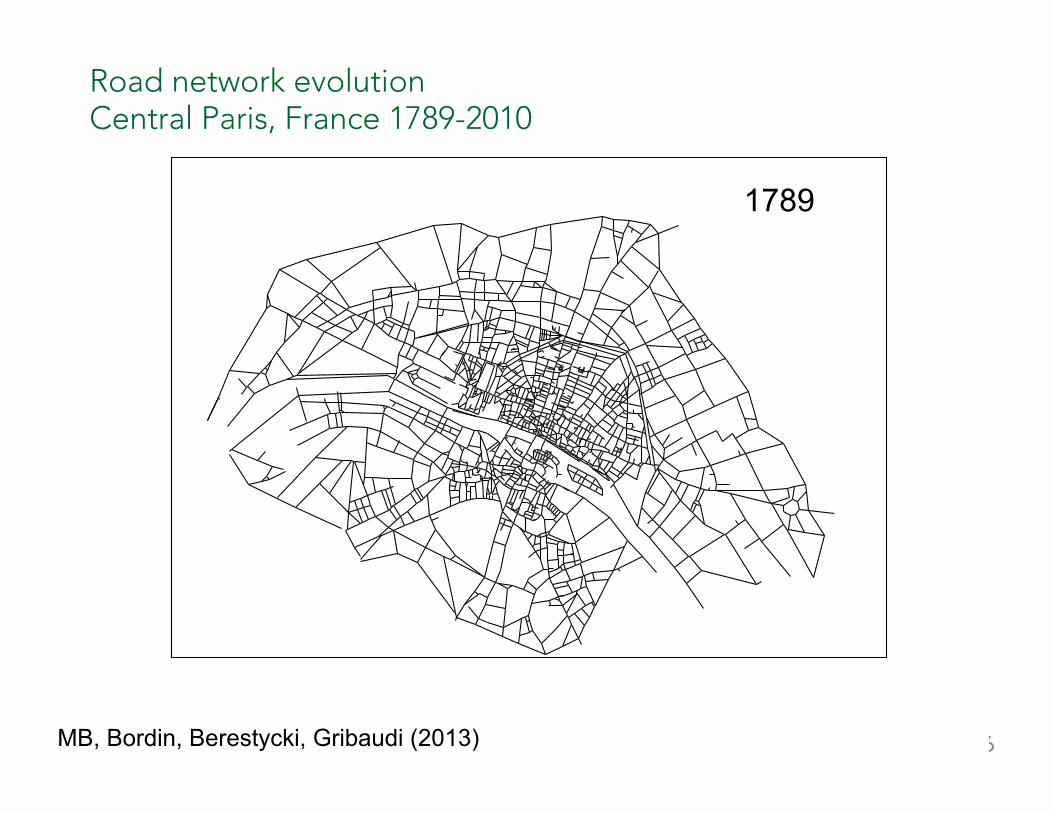
Road network evolution: Importance of central planning
n Evolution of the Paris street network 1789-2010 (1789, 1826, 1836, 1888, 1999, 2010-soon 1591, 1652, 1728)
n Haussmann period (~1853-1870)
Lake Como 2016
Road network evolution Central Paris, France 1789-2010
MB, Bordin, Berestycki, Gribaudi (2013)
1789

Lake Como 2016
Road network evolution Central Paris, France 1789-2010
MB, Bordin, Berestycki, Gribaudi (2013)
1826

Lake Como 2016
Road network evolution Central Paris, France 1789-2010
MB, Bordin, Berestycki, Gribaudi (2013)
1836

Lake Como 2016
Road network evolution Central Paris, France 1789-2010
MB, Bordin, Berestycki, Gribaudi (2013)
1888

Lake Como 2016
Road network evolution Central Paris, France 1789-2010
MB, Bordin, Berestycki, Gribaudi (2013)
1999

Lake Como 2016
Road network China 1600(BC)- 1900 (AC)
Wang, Ducruet, Wang (2015)

Lake Como 2016
1. Simple measures

Lake Como 2016
Road network evolution (Groane region, Italy)

Lake Como 2016
Importance of central planning
n N follows the population evolution
n The “good” clock here is the number of nodes

Lake Como 2016
Time evolution (Paris 1789-2010)
n Standard indicators versus time or N

Lake Como 2016 Lammer et al, Physica A (2006)
Faces (blocks): shape and area
P (A) ⇠?

Lake Como 2016
Haussmann effect: shape factor

Lake Como 2016
Haussmann effect: angle distribution

Lake Como 2016
Road network evolution

Lake Como 2016
2. The betweenness centrality

Lake Como 2016
More interesting: Betweenness Centrality (Freeman ‘77)
σst = # of shortest paths from s to t σst(ij)= # of shortest paths from s to t via (ij)
i j
k ij: large centrality
jk: small centrality
Measures the importance of a segment in the shortest paths flow

Betweenness centrality and space
Large BC: distance to barycenter
Large BC: large degree

Lake Como 2016
Betweenness centrality and space
Lammer et al, 2006

Lake Como 2016
Betweenness centrality
n Backbone of stable central roads

Lake Como 2016
Haussmann effect
n Spatial distribution of centrality (most central nodes)

Lake Como 2016
Characterization of new links: BC impact
n Average BC of the graph at time t:
n BC impact of new edge e*:

Lake Como 2016
Evolution: two processes
n Two different categories of new links: ‘densification’ and ‘exploration’ clearly identified by the BC impact

Lake Como 2016
3. The simplicity

Lake Como 2016
!
Statistical comparison of the length of shortest and simplest paths (with the minimal number of turns)
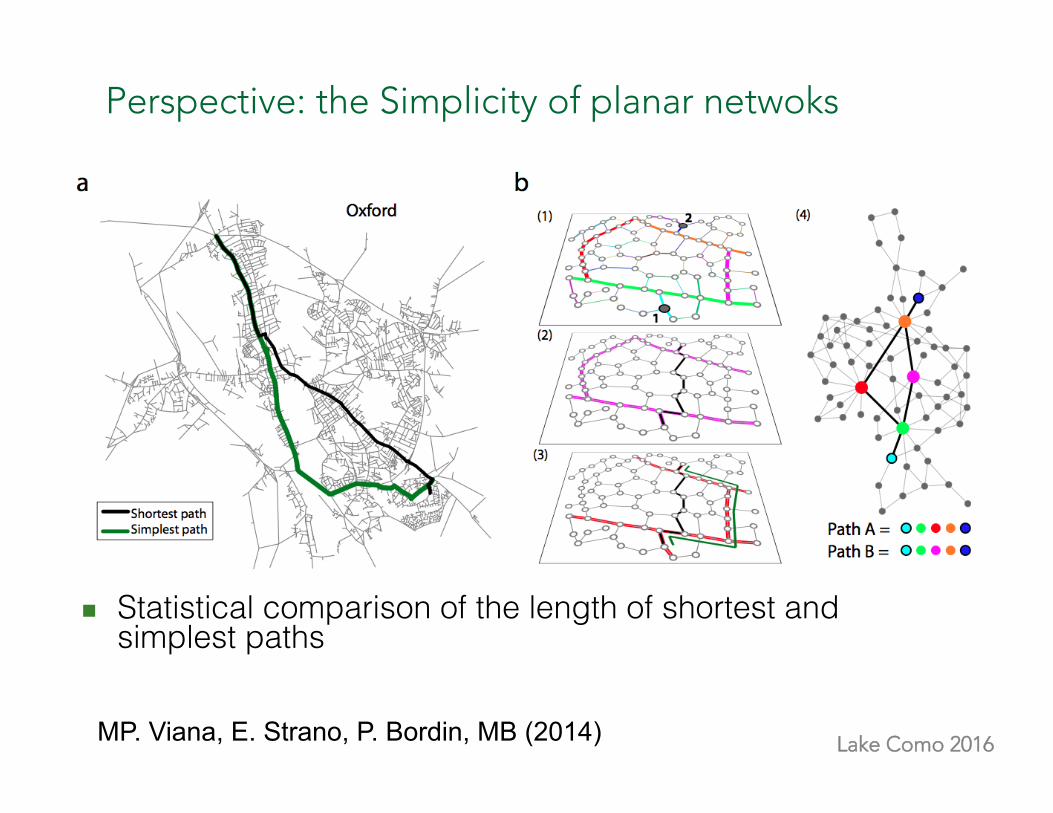
Another measure: Simplicity of planar networks
MP. Viana, E. Strano, P. Bordin, MB (Sci. Rep. 2013)
Lake Como 2016
Perspective: the Simplicity of planar netwoks
!
n Statistical comparison of the length of shortest and simplest paths
MP. Viana, E. Strano, P. Bordin, MB (2014)
Lake Como 2016
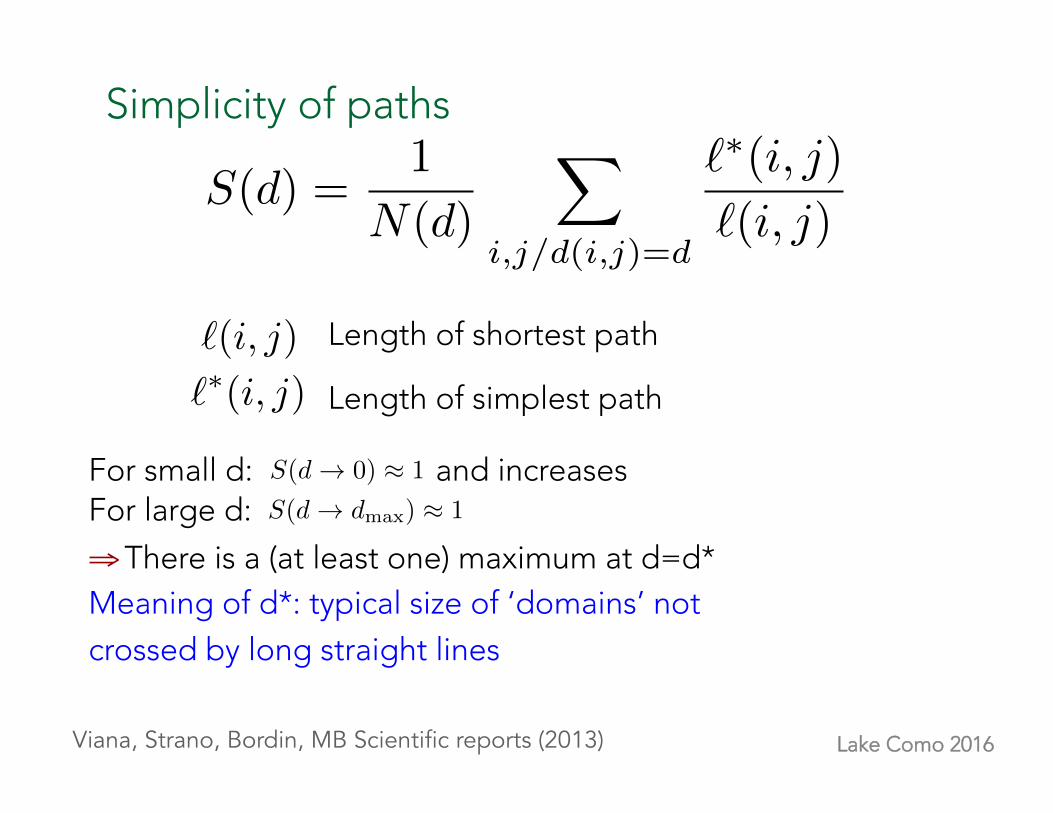
Simplicity of paths
Viana, Strano, Bordin, MB Scientific reports (2013)
S(d) =1
N(d)
X
i,j/d(i,j)=d
`⇤(i, j)
`(i, j)
`(i, j)
`⇤(i, j)
Length of shortest path
Length of simplest path
For small d: and increases For large d:
⇒ There is a (at least one) maximum at d=d* Meaning of d*: typical size of ‘domains’ not crossed by long straight lines
S(d ! 0) ⇡ 1
S(d ! dmax
) ⇡ 1

Lake Como 2016 Lammer et al, Physica A (2006)
Simplicity Spectrum
Viana, Strano, Bordin, MB Scientific reports (2013)
Length of simplest path

Lake Como 2016
10 Km
0 0.2 0.4 0.6 0.8 11
1.1
1.2
1.3
1.41833191419131955198019942007
S(d)
0 0.2 0.4 0.6 0.8 11
1.1
1.2
1.3
1.4
1.5
17891826183618881999
d/dmax
S(d)
1955 1980 2007
¯Groane evolving street network
4 KmParis evolving street network
2 CmPhysarum evolving vascular network
a
b
c
d/dmax
1789
h 4 h 8 h 10 h 15 h 20
19991836
0 0.2 0.4 0.6 0.8 11
1.1
1.2
1.3
1.4h04h08h10h15h20
d/dmax
S(d)
Viana, Strano, Bordin, MB Scientific reports (2013)

Lake Como 2016
4. Template: the subway case
Too many things to measure: a template as a guide

Lake Como 2016
The subway evolution: not a new problem
n Cope (1967): Stages of the London underground rail

Lake Como 2016
All large cities have a subway system

Lake Como 2016
World subway networks
We focus on large networks (N>100 stations)
Time evolving spatial networks: too many things to measure !
Most large cities have a subway network (50% for P>106)

Lake Como 2016

Lake Como 2016
“Universal” template
Algorithm to identify the core and the branches (non-ambiguous)

Lake Como 2016
Measures on this universal structure
n Characterizing the core
NC: number of nodes in the core EC: number of links in the core

Lake Como 2016
Measures on this universal structure
n Characterizing the branches
NB: number of stations in branches NC: number of stations in the core DB: average distance from barycenter to branches stations DC: average distance from barycenter to core stations

Lake Como 2016
Evolution fraction of branches stations

Lake Como 2016
Average degree Percentage f2

Lake Como 2016
Spatial extension of branches

Lake Como 2016
“Universal” template
n Quantitative convergence
q Fraction of branches stations of order 50%
q Extension of branches/core extension of order 2
q Average degree of core of order 2.5 and f2>60%

Lake Como 2016
Spatial organization of the core and branches
n Old result for Paris (Benguigui, Daoud 1991)
N(r): number of stations at distance less than r from barycenter
First regime: homogeneous distribution with df=2 Second regime ?

Lake Como 2016
Spatial organization of the core and branches
n Natural explanation with the universal template
: core density Nb : number of branches : Interstation spacing at distance r

Lake Como 2016
Spatial organization of the core and branches
n Interstation spacing at distance r
n Natural explanation of the Benguigui-Daoud result

Lake Como 2016
Number of branches
n If the spacing between two branches is constant:
n For a lattice of size N

Lake Como 2016
Number of branches

Lake Como 2016
“Universal” template
n Quantitative convergence!
q Fraction of branches !"stations of order 50%!
q Extension of branches/core !"extension of order 2!
q Average degree !"of core of order 2.5 !"and f2>60%!
!q Number of branches!
"!!!=> Existence of a minimal model (?)!!

Lake Como 2016
5. Extracting mesoscale information from mobile phone data
How can we get meaningful information from large dasets ?

Typology of mobility patterns (journey to work trips)
Motivation: Compare the spatial structure of mobility patterns in many cities Question: How to build a quantitative typology of cities based on the spatial structure of the mobility patterns ?
(Bertaud & Malpezzi 2003)

Lake Como 2016
How to compare OD commuting matrices of different cities?
§ The OD matrix is a large and complicated object
§ Difficult to compare different cities ! - Different sizes - Potentially different spatial resolutions
§ We need a simpler, clearer picture: coarse-grained information
Fij
i j

Hotspots: local maxima of density
City structure (mono- vs. polycentric)
Aire urbaine de Zaragoza Aire urbaine de Bilbao
ENPC-2016
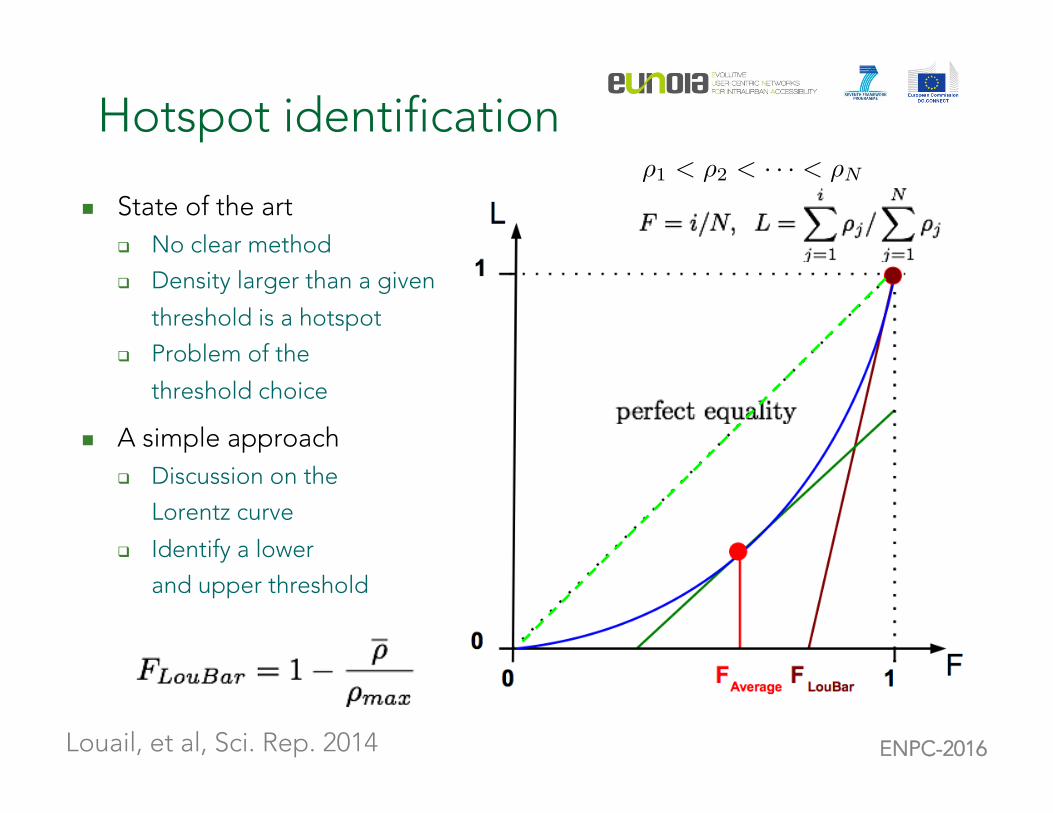
Hotspot identification
n State of the art q No clear method
q Density larger than a given
threshold is a hotspot
q Problem of the
threshold choice
n A simple approach q Discussion on the
Lorentz curve
q Identify a lower
and upper threshold
Louail, et al, Sci. Rep. 2014
⇢1 < ⇢2 < · · · < ⇢N

Lake Como 2016
How to compare OD commuting matrices of different cities?
1. Determine Residential and work hotspots (Louail et al, 2014)
2. Separate 4 categories of flows: I, C, D, R Integrated: Hotspot->Hotspot Convergent: Non hotspot->hotspot Divergent: Hotspot->non hotspot Random: non hotspot->non hotspot
Louail, et al, Nature Comms 2015

0.1
0.2
0.3
0.4
0.5
106P
Flows I C D RThe importance of Integrated flows decreases when population size increases, in favor of an increase of “Random” flows Weights of Divergent and Convergent flows are constant
I and R alone seem enough to characterize cities
Structure of flows versus population (30 largest urban areas in Spain)
Louail, et al, Nature Comms 2015

Lake Como 2016
Structure des flots (Espagne)
Vient des possibilité plus grandes dans les grandes villes de se deplacer (?) Structure spatiale “délocalisée” des grandes villes
Cordoba Gijon Vitoria
Zaragosa Malaga
Valencia Sevilla
Madrid Barcelona
R 27% 36% 41% 46% I 43% 37% 31% 25%
Population

Lake Como 2016
Numbers of hotspots vs. population size of the city
Exponent value is remarkably smaller for work/school/daily activity hotspots à in Spanish urban
areas, the number of activity places grows slower than the number of major residential places.
Sublinear in both cases !!!

Lake Como 2016
Discussion
n New results on new datasets usually imply to have new tools !
n Typology q Attempt to classify planar maps q Taking into account both topological and geometrical features q Correlations ?
n Evolution of planar graphs q Simple measures usually not very helpful q Important structural changes: betweenness centrality distribution q Use of templates q Better characterization ? q Models ?

Lake Como 2016
Thank you for your attention. Students and Postdocs:
Giulia Carra (PhD student) Riccardo Gallotti (Postdoc) Thomas Louail (Postdoc) Remi Louf (PhD student)
Emanuele Strano (PhD student) Collaborators:
M. Batty H. Berestycki P. Bordin S. Dobson M. Gribaudi P. Jensen JP. Nadal V. Nicosia V. Latora J. Perret S. Porta C. Roth S. Shay MP. Viana
Funding:
EUNOIA (FP7-DG.Connect-318367 European Commission) PLEXMATH (FP7-ICT-2011-8 European Commission)
www.quanturb.com [email protected]