southeast asia tech investment in 2019 · - sectors ready for digital transformation ... working...
TRANSCRIPT

Southeast Asia Tech Investment in 2019
dmpABOUT CENTO VENTURES
2
Cento Ventures is a venture capital firm focused on technology startups building products and services emerging from the digital transformation of promising growth markets, particularly Southeast Asia.
We are based in Singapore and backed by a team well experienced in internet business. We operate three funds that invest across industries through a disciplined, well-researched approach to locate technology investment opportunities originating from the Southeast Asian region.
Our investments are guided by three main principles:
- Sectors ready for digital transformation
There is a great opportunity for technology to solve some of the inefficiencies present in emerging markets. However, technology alone does not digitalise industries. Most of our investments apply innovative business models to large industry sectors that are set in their ways, using technology as an enabler.
- Tech startups at an early stage, but with proof points
Our investments are usually at Series A, where we lead the round. This helps us establish a solid relationship with the founder, and to influence company strategy. We only invest once a company can show that a market exists for its product and that it is ready to use extra capital to scale.
- Founders with great ambition
We look for founders who want to build large digital companies that are leaders in their category. In a fragmented region, such as Southeast Asia, operating across multiple countries often essential. Our preference is for business models that are light on physical assets and where the founders have ambitious plans to scale internationally.
Cento Ventures is convinced that the opportunity exists for Southeast Asian founders to build transformational digital companies, and we look forward to working with more startup teams to create new success stories.
Learn more about us at cento.vc or our Facebook or Linkedin pages.
dmpINTRODUCTION
3
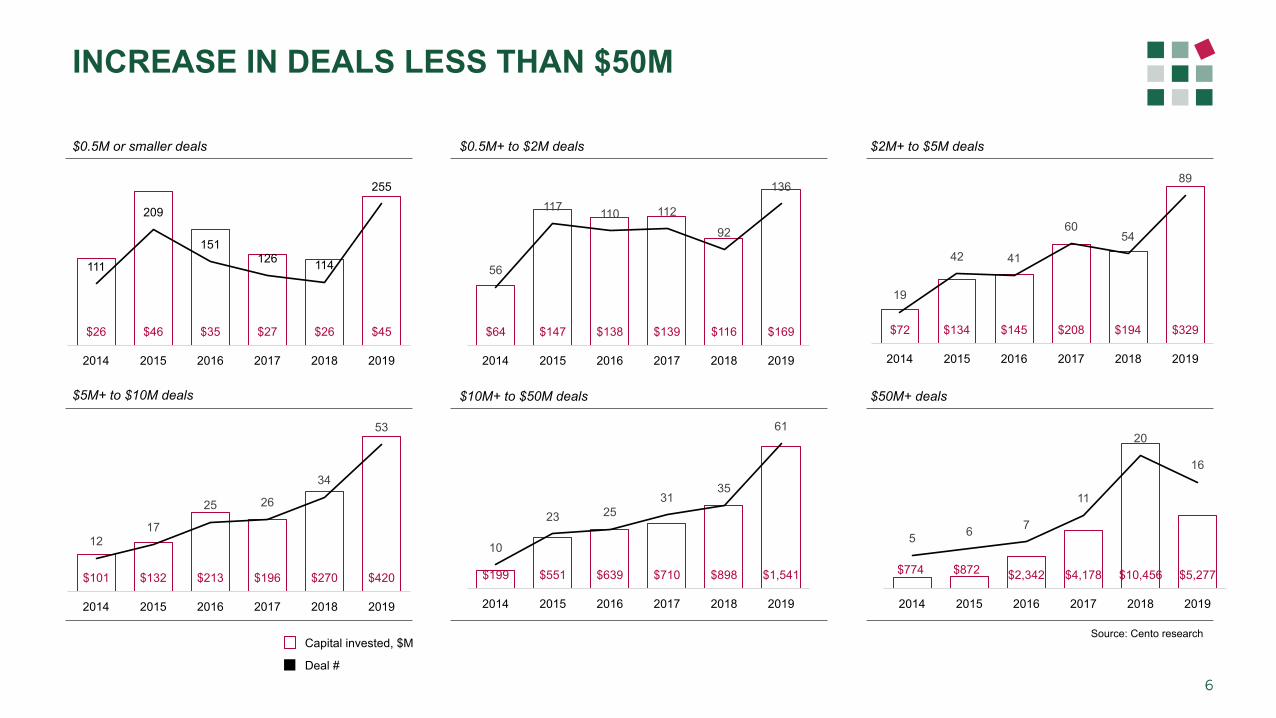
It is our great pleasure to share this latest report in our series that tracks digital investment in Southeast Asia. The data and insights we have accumulated in this Southeast Asia tech investment report cover the period up to the end of 2019. Some changes have been seen in landscape of technology investment in Southeast Asia in 2019. The total amount we have seen invested in tech companies in the region in 2019 totalled $7.7B. This is noticeably lower than the $12B we recorded in 2018, however while there were fewer ‘mega-deals’, there was a significant increase in smaller VC deals. The total amount invested in smaller deals (less than $50M invested) set a new record of $2.4B, up from $1.5B in 2018. In contrast, the amount that was deployed in largest deals (more than $50M invested) was $5.3B in 2019, compared with $10.5B in 2018. A closer look at the data reveals a number of familiar themes as well as some new developments. Record number of deals One the most noticeable trends of 2019, first noted in our report covering the first half of 2019, was a spike in the number of deals reported. 2019 saw a record total of 608 tech VC deals. This is a strong sign of continued healthy investment interest in the region’s startups. Increasing investment at most stages Another key feature of 2019 has been the increase of investment at most VC deal stages. The smallest deals (less than $0.5M and typically seed rounds) more than doubled in number and nearly doubled in value. While for deals between $0.5M and $10M (typically Series A & B rounds) increased by just over 50% in both number and value.
Follow-on funding gaps are being filled The cohorts that track startups follow-on funding continue to show improvements in follow-on funding rates. The 2013 cohort shows improvement with a 2nd follow-on round rate of 26% (and a 3rd follow-on round rate of 14%). The 2014 & 2015 cohorts also show improvement – most notably the 2014 cohort where the 3rd follow-on round rate rose to 8% (compared to 4% in 2018). A newer wave of companies announced large rounds 2019 saw a number of large investment rounds by major tech firms – Traveloka raised $420M and VNPay $300M. Some perhaps less familiar names also announced major rounds - these included Ruangguru, Kredivo, Advance.ai, Tiki.vn, and Scommerce. Of course there were also large new investments at Grab and Gojek, which appeared to be smaller than in the previous year. However, we note that these established unicorns are creating separate units (such as in financial services) which raise their own capital independently of their parent. While it appears that total capital invested in 2019 was lower than in 2018, this may only be a temporary phenomenon. Investment in Vietnam and Thailand based startups grew There was some change to the previous bias of investment toward Indonesia and Singapore based startups, with 2019 showing greater geographical diversification in capital deployed. Vietnam-based startups increased most, making up 18% (or $741M) of the country-specific capital deployment in 2019, a huge jump over 2018 where it only accounted for 4% (or $287M). Thailand has also seen a rise in investment from $80M (2018) to $130M (2019).

dmpINTRODUCTION
4
Indonesia captured a smaller proportion of the total capital invested, falling from 76% in 2018 to 59% in 2019. There was decline in the amount invested in Indonesian startups from $4B (2018) to $2.4B (2019), although it should be noted that the number of deals done in the country increased slightly. Investment into startups in Malaysia, Singapore and the Philippines was reasonably consistent with previous years. New sectors attracting more interest Most investment in the region continues to be into companies that cover ‘multi-verticals’ (our name for diverse digital businesses such as Grab & Gojek) and online retailers, 2019 showed some diversification by sector. Well established sectors such as travel showed a sharp increase, driven by the Traveloka deal. Emerging sectors such as financial services and payments grew strongly, which when combined received nearly $1B in new capital. Newer sectors such as healthcare, logistics and education also benefitted from increasing investor interest. Increase in the number of exits, total proceeds remain steady As we observed at the half year mark, the number of liquidity events increased in 2019. For the full year it reached 64, exceeding 2018’s total of 56. Total proceeds from liquidity events in 2019 was $2.2B, equalling 2018’s amount. The largest exits were: Bigo - acquired by YY Inc for $1.45B; 701 Search - acquired by Carousell for $272M; and Wavecell - acquired by 8x8 for $125M. As a qualifier, while we included the full value of the Bigo event, that may overstate things couple of ways. It included existing YY Inc. owners among the selling shareholders and may exaggerate the value of liquidity generated. Also, we don’t know the proportion of the deal
that can truly be assigned to the company’s Southeast Asian footprint. In the case of 701 Search, the full value of that deal is also perhaps not liquidity since it was a mix of cash and shares. Regardless, these are significant deals and show that corporate acquirers are actively acquiring startups from Southeast Asia. A typical profile of a liquidity event in Southeast Asia in 2019 remains a trade exit to a buyer from Asia, with deal proceeds of less than $100M. Looking ahead to 2020 Southeast Asia in 2019 has remained a very attractive region for tech investors. We see strong growth in investment at most deal sizes, and also a welcome diversification of investment into startups in more countries and in different sectors. As we have said in previous reports, we believe that high-quality startups exist across the region and good opportunities exist at many investment stages. Looking ahead to 2020 we expect these positive trends to continue as the fundamentals of the region remain positive – a large and rapidly digitising population that demands better online services, combined with many industry sectors adopting new technology to transform their operations. Whether 2020 sees a return of the same velocity of huge deals that we saw in 2018 is uncertain. While there is a new wave of large tech startups emerging, there is also increasing discussion about prioritising profitability over growth, and hence the requirements for investor capital may be lower. We will be watching closely and be commenting in the middle of the coming year. As ever, it is highly interesting to watch Southeast Asia’s tech landscape evolve, and we hope this report helps anyone, whether founders, investors, or policymakers, to follow its progress.
Thank you
Mark Suckling, Laphat Tantiphipop, Marco Hadisurya

dmp$7.7B INVESTED IN 2019
5
Capital invested, $M and deals done, # The number of Southeast Asia internet technology related investment set a new record in 2019 even though the total capital decreased from 2018, mainly due to less capital raised by Southeast Asia’s unicorns. The increase in number of deals done in this year is mostly driven by the increase of early stage deals (< $500K). The tech investment during this year is also less concentrated as only 50% of the total capital invested is contributed by ‘mega deals’, lower than 70% in 2018.
Notes: The numbers include various events that while count as investment in technology companies, are considered non-VC, e.g. ICO, project financing, corporate spin-off. Some early stage incubator-funded companies are not yet included in our data
Source: Cento research
$247 $989 $900 $982 $1,468 $2,043 $1,236 $4,222 $8,310 $3,649 $5,727 $2,054
108 105
221
196 211
149
197 198 180 186
338
278
0.0
50.0
100.0
150.0
200.0
250.0
300.0
350.0
400.0
$-
$1,000
$2,000
$3,000
$4,000
$5,000
$6,000
$7,000
$8,000
$9,000
2014 H1 2014 H2 2015 H1 2015 H2 2016 H1 2016 H2 2017 H1 2017 H2 2018 H1 2018 H2 2019 H1 2019 H2
Capital Invested # of Deals
dmpINCREASE IN DEALS LESS THAN $50M
6
$0.5M or smaller deals $0.5M+ to $2M deals $2M+ to $5M deals
$5M+ to $10M deals $10M+ to $50M deals $50M+ deals
Source: Cento research Capital invested, $M
Deal #
$26 $46 $35 $27 $26 $45
111
209
151 126 114
255
2014 2015 2016 2017 2018 2019
$101 $132 $213 $196 $270 $420
12 17
25 26
34
53
2014 2015 2016 2017 2018 2019
$64 $147 $138 $139 $116 $169
56
117 110 112
92
136
2014 2015 2016 2017 2018 2019
$72 $134 $145 $208 $194 $329
19
42 41
60 54
89
2014 2015 2016 2017 2018 2019
$199 $551 $639 $710 $898 $1,541
10
23 25 31
35
61
2014 2015 2016 2017 2018 2019
$774 $872 $2,342 $4,178 $10,456 $5,277
5 6 7
11
20
16
2014 2015 2016 2017 2018 2019

dmpSERIES A & B DEAL SIZES INCREASE
7
Deals done by series, # Average deal size by series, $M
Source: Cento research
123
255 197 178 161
352 55
110
100 145 112
136
11
25
22 34
39
48
9
14
26 22
31
48
2014 2015 2016 2017 2018 2019
Pre A A B C+
$0.4 $0.5 $0.7 $0.5 $0.5 $0.6
$2.4 $2.9
$2.3 $2.7
$3.3
$4.3
$6.2
$11.2
$9.7 $10.5
$11.4 $12.1
2014 2015 2016 2017 2018 2019
Pre-A A B

dmpVIETNAM GAINS LARGER SHARE OF CAPITAL INVESTED
8
Source: Cento research Country of origin is defined as where the company was founded and where it is believed
to generate its core revenues
In 2019, Indonesia continued to capture the majority of capital invested in Southeast Asia. However its share declined in comparison with previous years. Vietnam accounted for a much larger share of capital invested as it produces more late-stage companies such as Tiki, VNPay and Sendo. For the first time, investment into Vietnam startups exceeded Singapore. Singapore maintained its share of investment as a new cohort of later-stage companies such as QExpress, Carousell and Taiger raised larger rounds. On the share of deals done, the trend is fairly consistent with the last few years data. Notes: The data in this slide excludes Sea Group (Garena), Grab, Lazada and other companies that have a truly regional footprint and are therefore hard to allocate to a particular country.
Share of capital invested by country
Share of deals done by country
24%
28%
30%
33%
24%
29%
31%
34%
30%
35%
19%
12%
12%
11%
11%
10%
11%
10%
8%
9%
10%
9%
8%
16%
16%
8%
9%
5%
3%
4%
2015
2016
2017
2018
2019
Indonesia Singapore Malaysia Thailand Vietnam Philippines
36%
67%
60%
76%
59%
33%
15%
21%
13%
17%
10%
7%
8%
3%
2%
14%
6%
8%
1%
3%
4%
3%
2%
5%
18%
3%
2%
2%
$0.0
$0.0
2015
2016
2017
2018
2019
dmpLOGISTICS, HEALTHCARE, EDUCATION - KEY GROWTH SECTORS
9
Capital invested by sector, $M
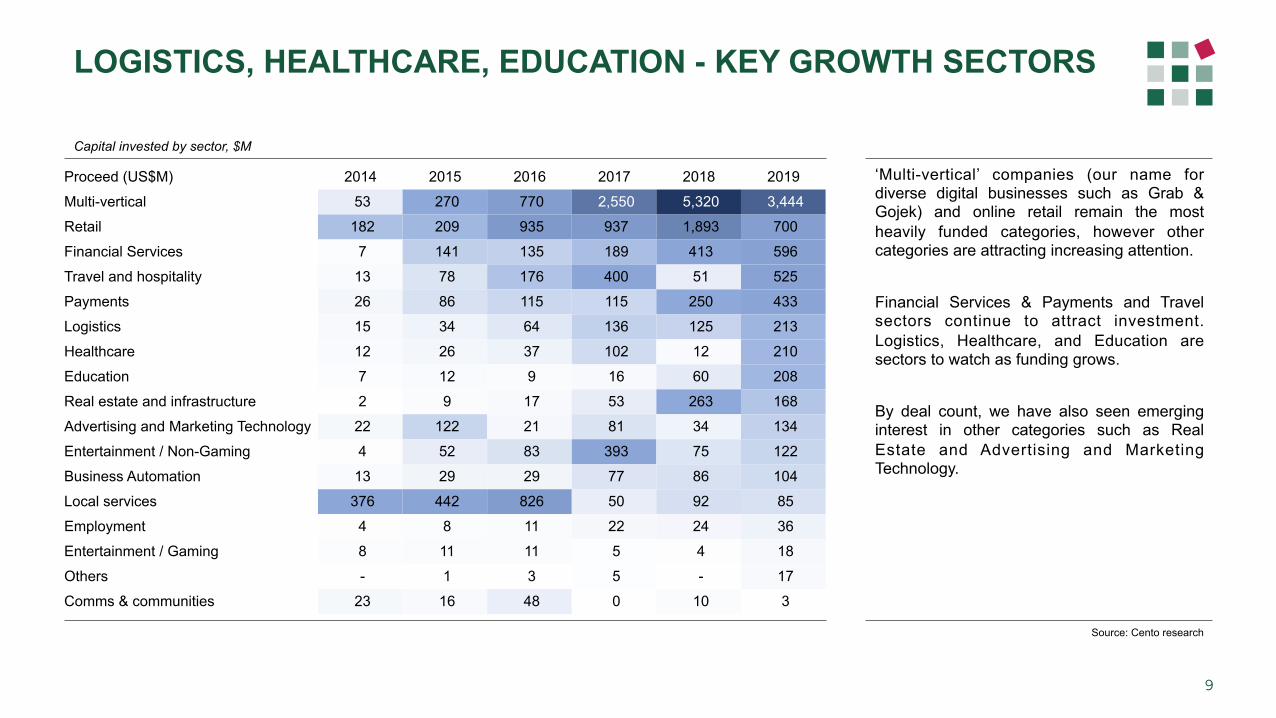
‘Multi-vertical’ companies (our name for diverse digital businesses such as Grab & Gojek) and online retail remain the most heavily funded categories, however other categories are attracting increasing attention.
Financial Services & Payments and Travel sectors continue to attract investment. Logistics, Healthcare, and Education are sectors to watch as funding grows.
By deal count, we have also seen emerging interest in other categories such as Real Estate and Advertising and Marketing Technology.
Source: Cento research
Proceed (US$M) 2014 2015 2016 2017 2018 2019
Multi-vertical 53 270 770 2,550 5,320 3,444
Retail 182 209 935 937 1,893 700
Financial Services 7 141 135 189 413 596
Travel and hospitality 13 78 176 400 51 525
Payments 26 86 115 115 250 433
Logistics 15 34 64 136 125 213
Healthcare 12 26 37 102 12 210
Education 7 12 9 16 60 208
Real estate and infrastructure 2 9 17 53 263 168
Advertising and Marketing Technology 22 122 21 81 34 134
Entertainment / Non-Gaming 4 52 83 393 75 122
Business Automation 13 29 29 77 86 104
Local services 376 442 826 50 92 85
Employment 4 8 11 22 24 36
Entertainment / Gaming 8 11 11 5 4 18
Others - 1 3 5 - 17
Comms & communities 23 16 48 0 10 3
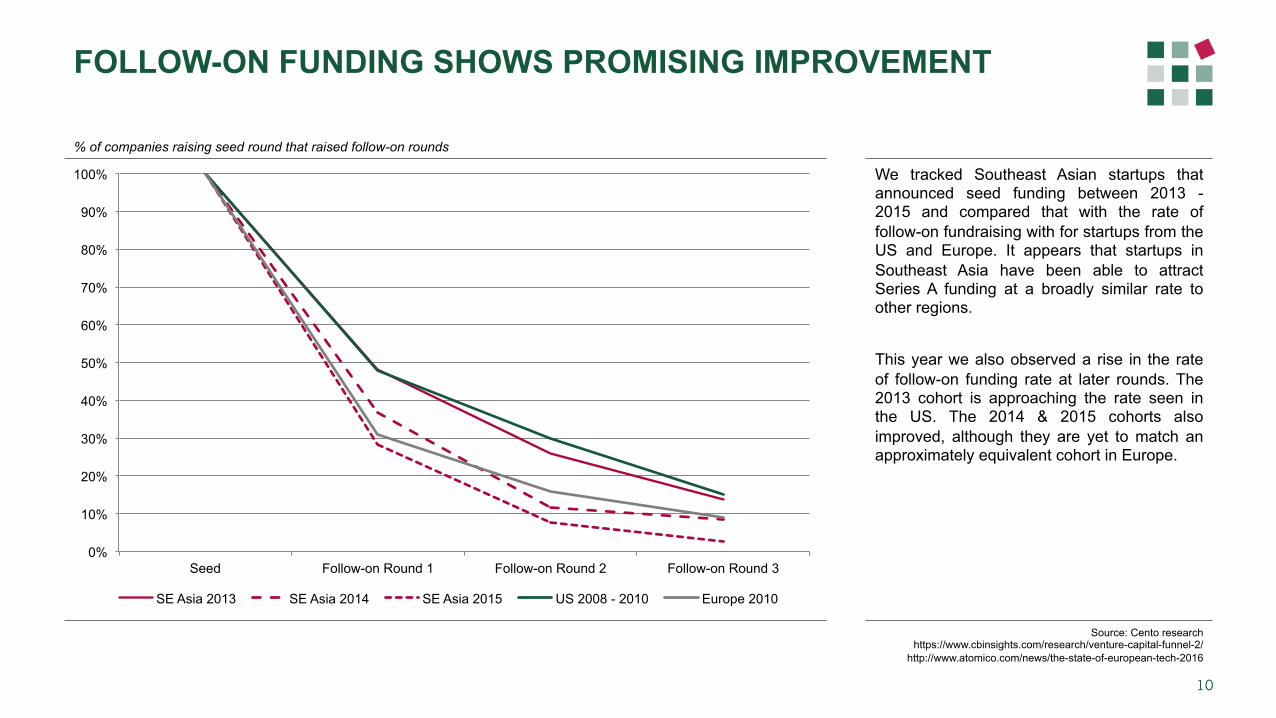
dmp% of companies raising seed round that raised follow-on rounds
10
Source: Cento research https://www.cbinsights.com/research/venture-capital-funnel-2/
http://www.atomico.com/news/the-state-of-european-tech-2016
FOLLOW-ON FUNDING SHOWS PROMISING IMPROVEMENT
We tracked Southeast Asian startups that announced seed funding between 2013 - 2015 and compared that with the rate of follow-on fundraising with for startups from the US and Europe. It appears that startups in Southeast Asia have been able to attract Series A funding at a broadly similar rate to other regions.
This year we also observed a rise in the rate of follow-on funding rate at later rounds. The 2013 cohort is approaching the rate seen in the US. The 2014 & 2015 cohorts also improved, although they are yet to match an approximately equivalent cohort in Europe.
0%
10%
20%
30%
40%
50%
60%
70%
80%
90%
100%
Seed Follow-on Round 1 Follow-on Round 2 Follow-on Round 3
SE Asia 2013 SE Asia 2014 SE Asia 2015 US 2008 - 2010 Europe 2010

dmp
Akulaku
THERE IS A GROWING CROP OF $100M+ COMPANIES
11
SEA beyond recognized leaders: 50+ companies with valuations above $100M and combined value of over $10B
Source: Cento research
>$10
B
Malaysia Thailand Regional
>$1B
Philippines
Publicly-listed company
>$10
0M*
* List of US$ 100M+ companies is not exhaustive
Vietnam
2019 New Entry
Indonesia
RupiahPlus
Singapore
Carro
Although Southeast Asia is a home to over 10 companies valued above $1B, a more comprehensive view of the region’s capability to generate shareholder value in digital space is provided by looking at companies we believe are valued in excess of $100M, based on a recent substantial financing or liquidity event and known business developments.

dmpOTHER $100M+ COMPANIES PRESENT IN THE REGION
12
$1B+ and selected $100M+ enterprise value businesses, executed via prior acquisition / non-third party funded subsidiary
Source: Cento research
An overview of the value being created in the digital space in Southeast Asian would be incomplete without noting: • A significant and growing set of
digital businesses previously acquired by or created within larger companies and continuing to grow a r o u n d t h e i r r e s p e c t i v e opportunities within Southeast Asia
• A number of overseas players - usually from adjacent markets in North Asia - focusing on Southeast Asia as a primary source of growth
• A number of Southeast Asia-originating companies that build their domestic advantage into a significant international footprint beyond Southeast Asia
Indonesia Malaysia Singapore Thailand Regional
Search
Bigo
Revolution Precrafted
Select $100M+ enterprise value businesses by global players targeting SE Asian market or by SE Asian based players targeting a global opportunity.
Vietnam Philippines
Source: Cento research * List of US$ 100M+ opportunities is not exhaustive
>$10
0M*
Publicly-listed company
Razer M-Daq
>$1B

dmp SINGAPORE: DEAL COUNT RISES
Source: Cento Research
13
Capital invested, $M and deals done, # Average deal size in Singapore, $M
$124 $332 $268 $474 $705 $693
75
118 104
124
98
191
2014 2015 2016 2017 2018 2019
Capital invested, $M # of Deals
$0.6 $0.7 $0.9 $0.7 $0.7 $0.7
$2.1 $2.4 $2.2 $2.8
$3.1
$4.5
$7.6 $6.9
$11.7 $11.2
$13.2
$12.2
2014 2015 2016 2017 2018 2019
Pre-A A B
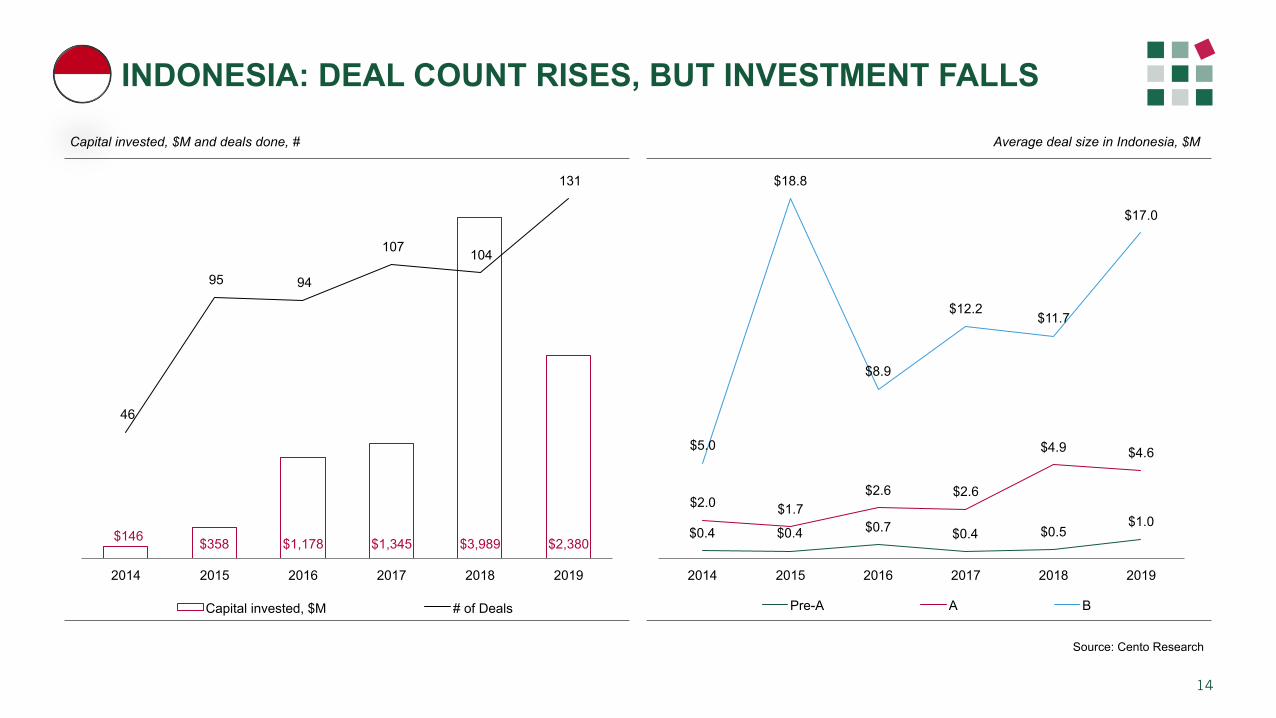
dmp INDONESIA: DEAL COUNT RISES, BUT INVESTMENT FALLS
Source: Cento Research
14
Capital invested, $M and deals done, # Average deal size in Indonesia, $M
$146 $358 $1,178 $1,345 $3,989 $2,380
46
95 94
107 104
131
2014 2015 2016 2017 2018 2019
Capital invested, $M # of Deals
$0.4 $0.4 $0.7 $0.4 $0.5 $1.0
$2.0 $1.7 $2.6 $2.6
$4.9 $4.6 $5.0
$18.8
$8.9
$12.2 $11.7
$17.0
2014 2015 2016 2017 2018 2019
Pre-A A B

dmp MALAYSIA: DEAL COUNT RISES, BUT INVESTMENT STILL LOW
Source: Cento Research
15
Capital invested, $M and deals done, # Average deal size in Malaysia, $M
$30 $102 $116 $190 $150 $85
15
73
41 43
34
61
2014 2015 2016 2017 2018 2019
Capital invested, $M # of Deals
$0.1 $0.4 $0.6
$0.2 $0.3 $0.2 $0.4
$3.1
$1.8 $2.0
$3.0
$1.4
$8.3
$7.0
$12.8
$9.4
2014 2015 2016 2017 2018 2019
Pre-A A B

dmp
16
$28 $136 $98 $174 $78 $135
18
38 38
37
26
52
2014 2015 2016 2017 2018 2019
Capital invested, $M # of Deals
Source: Cento research
Capital invested, $M and deals done, # Average deal size in Thailand, $M
THAILAND: DEAL COUNT & INVESTMENT RISE
$0.6 $0.9
$0.3 $0.8
$0.5 $0.2
$6.2
$3.7
$1.6 $2.2 $2.1
$4.2
$7.0 $7.6
$9.7
$10.5 $10.5
2014 2015 2016 2017 2018 2019
Pre-A A B

dmp
$36 $44 $59 $48 $287 $741
19
40
29 30
50
90
2014 2015 2016 2017 2018 2019
Capital invested, $M # of Deals
17
Capital invested, $M and deals done, #
Source: Cento research
Average deal size in Vietnam, $M
VIETNAM: DEAL COUNT & INVESTMENT RISE SHARPLY
$0.2 $0.1 $0.3 $0.2 $0.4 $0.5
$3.2 $3.6
$1.3
$3.2
$1.9
$5.2
$4.7
$6.0
n.a
$4.1
$2.9
$6.8
2014 2015 2016 2017 2018 2019
Pre-A A B

dmp PHILIPPINES: DEAL COUNT UP, INVESTMENT STABLE
Source: Cento Research
18
Capital invested, $M and deals done, #
$10 $28 $39 $38 $33 $33
15
30 29
19
9
24
2014 2015 2016 2017 2018 2019
Capital invested, $M # of Deals
Average deal size in Philippines, $M
$0.4 $0.2 $0.6 $0.6 $0.5 $0.2
$1.0 $2.5
$4.5
$2.4 $1.3
$2.6
$9.7
$26.0
$6.0
2014 2015 2016 2017 2018 2019
Pre-A A B
dmp
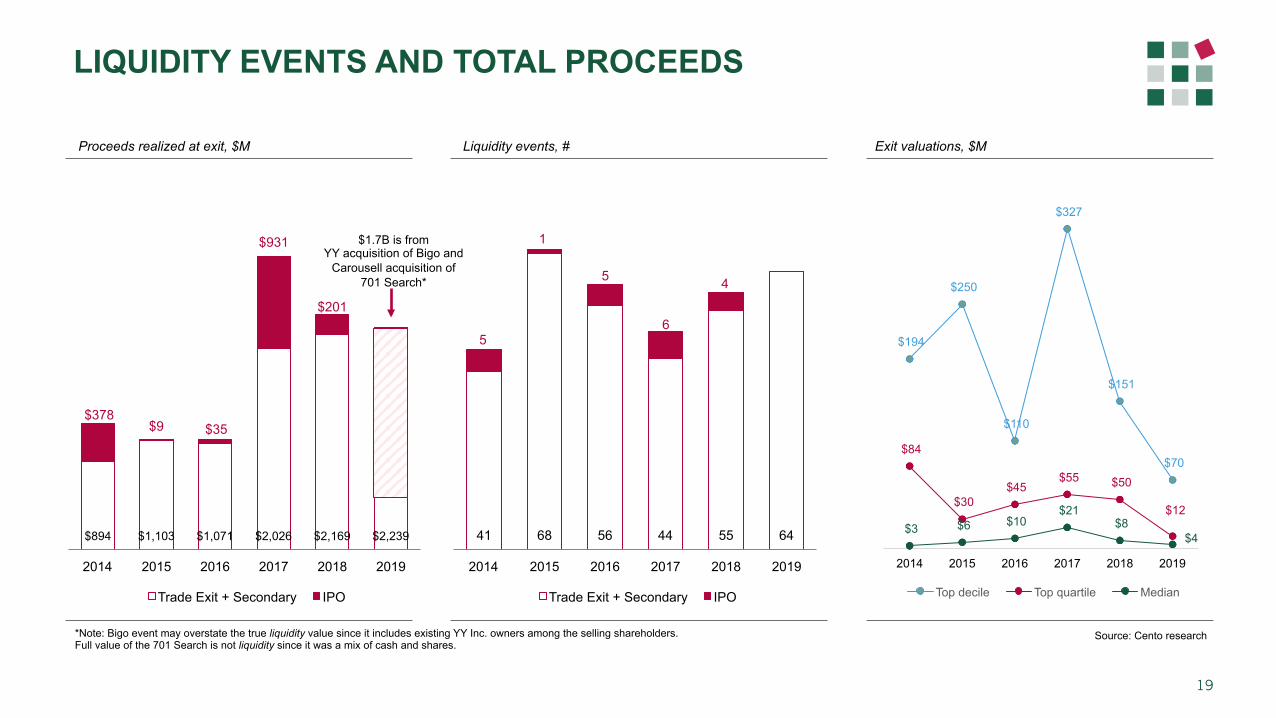
$194
$250
$110
$327
$151
$70 $84
$30 $45
$55 $50
$12 $3 $6 $10
$21 $8
$4
2014 2015 2016 2017 2018 2019
Top decile Top quartile Median
LIQUIDITY EVENTS AND TOTAL PROCEEDS
19
Source: Cento research
Liquidity events, # Proceeds realized at exit, $M Exit valuations, $M
41 68 56 44 55 64
5
1
5
6
4
2014 2015 2016 2017 2018 2019
Trade Exit + Secondary IPO
$894 $1,103 $1,071 $2,026 $2,169 $2,239
$378 $9 $35
$931
$201
2014 2015 2016 2017 2018 2019
Trade Exit + Secondary IPO
$1.7B is from YY acquisition of Bigo and
Carousell acquisition of 701 Search*
*Note: Bigo event may overstate the true liquidity value since it includes existing YY Inc. owners among the selling shareholders. Full value of the 701 Search is not liquidity since it was a mix of cash and shares.

dmp
$9 $16 $9 $9 $19 $11
22
34
24
15
23 27
2014 2015 2016 2017 2018 2019
$22 $38 $31 $50 $37 $28
8
13
10
12 12
9
2014 2015 2016 2017 2018 2019
$76 $112 $176 $104 $142 $117
4
9
15
9
11 12
2014 2015 2016 2017 2018 2019
$150 $189 $143 $195 $148 $104
5 5
4
6
5
3
2014 2015 2016 2017 2018 2019
$239 $220 $163 $111 $271 $132
3 3
2 2
4
2
2014 2015 2016 2017 2018 2019
$1,057 $543 $620 $3,397 $1,856 $1,847
3
2 2
4
2
3
2014 2015 2016 2017 2018 2019
EXITS REMAIN STABLE ACROSS TRANSACTION SIZES
20
Source: Cento research Amount, $M
Events, #
Liquidity events and proceeds, <$1M Liquidity events and proceeds, $1M+ to $5M Liquidity events and proceeds, $5M+ to $20M
Liquidity events and proceeds, $20M+ to $50M Liquidity events and proceeds, $50M+ to $100M Liquidity events and proceeds, >$100M
dmp
28% 27% 19%
33%
19% 20%
53%
42%
44%
44%
44%
56%
20%
27% 27%
19%
15%
19%
5% 10%
5%
21%
5%
0%
20%
40%
60%
80%
100%
2014 2015 2016 2017 2018 2019
Digital Co - Others Digital Co - SE Asia Traditional Co Asset Manager
85%
58% 66%
80%
37%
76%
2%
5%
13%
11%
46%
21%
13%
31%
20%
7%
7%
2% 5% 1% 1% 9%
0%
20%
40%
60%
80%
100%
2014 2015 2016 2017 2018 2019
Digital Co - Others Digital Co - SE Asia Traditional Co Asset Manager
21
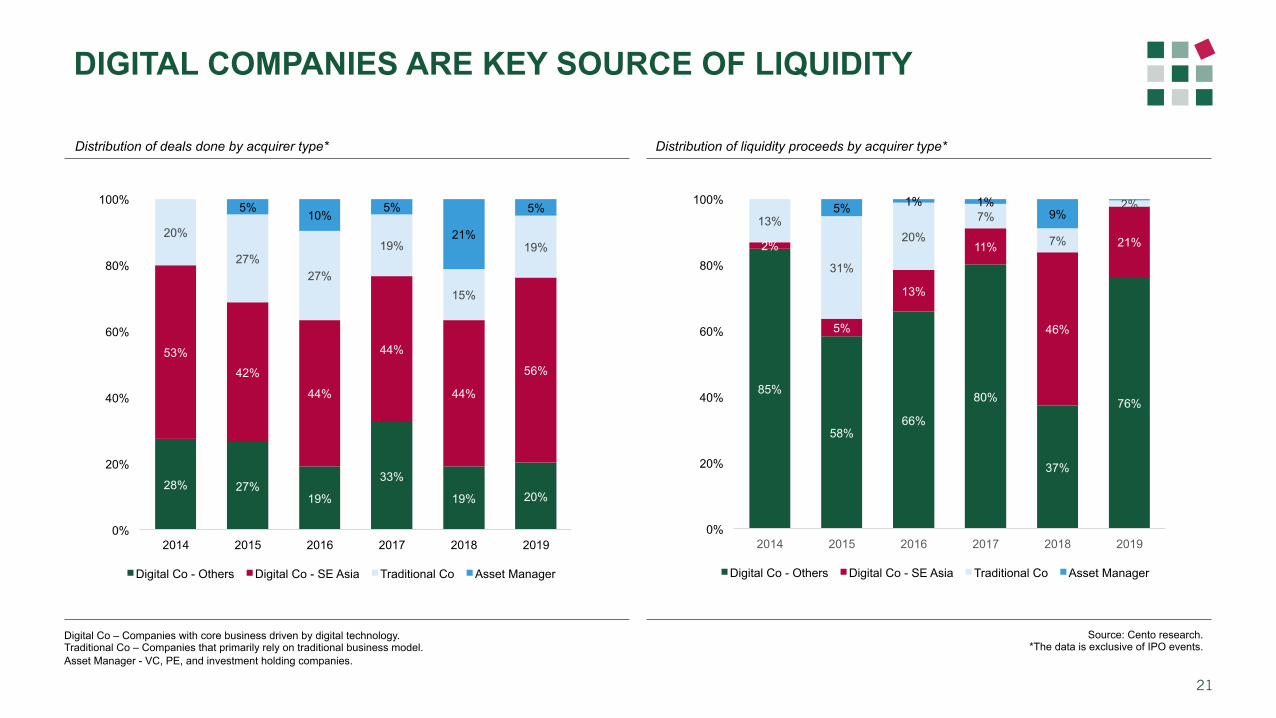
DIGITAL COMPANIES ARE KEY SOURCE OF LIQUIDITY
Distribution of deals done by acquirer type* Distribution of liquidity proceeds by acquirer type*
Source: Cento research. *The data is exclusive of IPO events.
Digital Co – Companies with core business driven by digital technology. Traditional Co – Companies that primarily rely on traditional business model. Asset Manager - VC, PE, and investment holding companies.
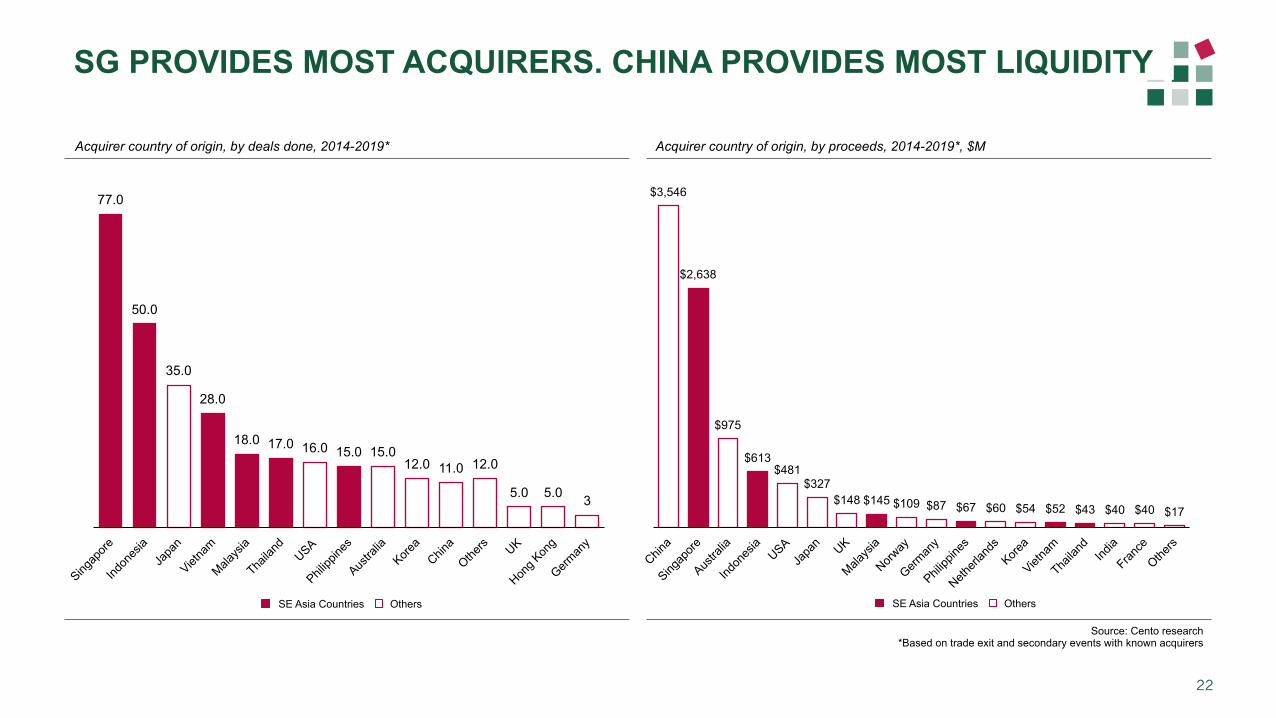
dmp77.0
50.0
35.0
28.0
18.0 17.0 16.0 15.0 15.0 12.0 11.0 12.0
5.0 5.0 3
$3,546
$2,638
$975
$613 $481
$327 $148 $145 $109 $87 $67 $60 $54 $52 $43 $40 $40 $17
22
Source: Cento research *Based on trade exit and secondary events with known acquirers
SG PROVIDES MOST ACQUIRERS. CHINA PROVIDES MOST LIQUIDITY
Acquirer country of origin, by deals done, 2014-2019* Acquirer country of origin, by proceeds, 2014-2019*, $M
Others SE Asia Countries Others SE Asia Countries

dmp
23
MALAYSIA SHOWS HIGHEST RETURN VS. CAPITAL INVESTED
Source: Cento research
Total investment vs liquidity proceeds by country, 2014-2019, $M
Southeast Asia’s digital ecosystem has attracted over $26B in investment and generated over $11B in liquidity between 2014 – 2019. Companies that operated regionally accounted for the majority of the investment and exit volume, with the remaining proceeds being disproportionately distributed across each country.
Several markets have generated over $1B in exits. Malaysia illustrated highest capital efficiency among its Southeast Asia peers. Conversely, Indonesia sizable return continues to be eclipsed by its outsized investment injection as its $1B+ companies have yet to reach exits.
0.5X
0.1X
0.6X
0.3X
2.2X
0.2X
1.0X
Liqu
idity
/ In
vest
men
ts R
atio
$186
$105
$1,457
$400
$1,442
$1,291
$6,146
$180
$650
$673
$1,215
$2,596
$9,419
$11,486
Philippines
Thailand
Malaysia
Vietnam
Singapore
Indonesia
Regional
Total Investment Total Liquidity

dmp
Methodology
dmpMETHODOLOGY
25
In this report, we analysed and verified close to 3,300 financing and liquidity events. Inevitably, a few large deals would avoid detection on occasion of exceptionally secretive nature of the transaction or due to the methodology we apply. It is also our impression that we are likely seeing only half or less of the pre-Series A activity in the region due to a sheer volume of deals in $ 10 - 250K range happening in the market – while total dollar value of inflow and outflows is unlikely to be impacted heavily, do take our “number of deal” assessments for pre-Series A with a large handful of salt. Finally, as new facts come to light and as erstwhile announcements are verified, we adjust our databases retroactively, leading to mild inconsistencies between various versions at the same period.
Category definitions and company profiles include:
This report aims to describe the state of financing and liquidity generated by companies focused on digital technology-driven opportunities in Southeast Asia. The exact definition of what a digital technology-driven opportunity constitutes is a subject of much debate. While leaving biotech, new materials and space tech out is relatively straightforward (but including software and digital services enabling these industries), telling an offline company with digital elements apart from a business where value creation is primarily tied to either its technology core or its digital distribution is anything but simple.
We have generally taken a view that if something is valued as a technology company, we can trust its investors that it probably is. At the same time, we also endeavour to exclude categories that, while adjacent to digital economy, tend to attract non-VC capital to a degree where their financing / liquidation events interfere with the signal from the rest of the ecosystem (notably, excluding the companies with valuations determined by token economics). Furthermore, we currently do not include traditional TV stations, content producers, telcos, IT infrastructures and system integration companies as well as holding level entities that buy or develop technologies in addition to their core business into our reporting.
Key premises:
Numbers and conclusions in this study rely upon a company’s reported last round valuation. At best this is a partial reflection of a company’s true value. To all in our audience who appreciate the importance of financing terms over headline valuations, and who recognise that a more complete understanding of any underlying business is helpful, we apologise. To atone for this oversimplification, we’d like to take this opportunity to give a commendation to the great work being done by a few in academia who probe deeply into the contradictory nature of how tech valuations are reported, and produce splendid research that will one day help us as an industry upgrade our reporting systems and, perhaps, change how tech company narratives are formed. In this report, our recognition goes to Will Gornall and Ilya A. Strebulaev (professors at the Sauder School of Business at the University of British Columbia and the Stanford Graduate School of Business, respectively) for their comprehensive work on “Squaring Venture Capital Valuations with Reality”, available here: https://papers.ssrn.com/sol3/papers.cfm?abstract_id=2955455 and with media coverage http://nymag.com/intelligencer/2018/11/fake-unicorns-are-running-over-the-venture-capital-industry.html Geographies covered:
This iteration of our report does not make an attempt at covering some of the newer digital ecosystems within ASEAN beyond the customary six countries, or the developments in counties starting to gravitate towards SE Asia venture scene such as Pakistan, Bangladesh, Sri Lanka, Hong Kong, and Taiwan. Data sources and completeness :
Our data is compiled from a number of sources, although we primarily rely on public press announcements and community disclosures from the companies and their investors. Our team researches the validity of claims to an extent possible and supplements incomplete information with insights from our own industry sources and, on occasion, somewhat educated guesswork.

dmpMETHODOLOGY
26
Company classification:
Country of origin:
Determined by the country in which the company was founded, and has its primary base of operation (defined in terms of revenue, if known). At the (subjective) point where the company has both operations in multiple countries in Southeast Asia and substantial revenues generated in multiple countries, then it may be classified as Southeast Asia / regional in the country of origin.
Sector classification:
Cento’s definition of the industry segment in which the company’s primary business focus sits. A full taxonomy of sector allocation is listed below. In cases where a company focus on multiple sectors with different units generating thought to generate substantial revenue, then multi-vertical category is used. We also note that a company’s sector may change as the company progresses; the company’s sector is evaluated according to the primary business focus during the event of financing.
• Advertising & Marketing Technology: companies that facilitate the acquisition of customers including coupons and rebates, price comparisons and affiliate marketing
• Business automation: tools that automates non industry-specific business activities such as CRM, ERP, workplace communication tools, etc.
• Comms & communities: social networks and dating
• Education: provision of goods and services revolving teaching and learning, including adult training and education
• Employment: companies that manage and facilitate the management of employees including onboarding, benefit, payroll, etc.
• Entertainment/ Gaming: gaming development, distribution and publishing
• Entertainment/ Non-gaming: content production and news aggregation
• Financial Services: companies that apply technology into traditional banking services i.e. lending, wealth management, etc.
• Healthcare: provision of goods and services revolving around medical and wellness services including, but not limited to, e-pharmacy, medical tourism and telehealth
• Local Services: platforms that connect local merchants/ service providers to consumers in an urban setting including, but limited to, ride-hailing services, local search and directory and food delivery
• Logistics: companies that facilitate the movement of goods including, but not limited to, acquiring, storing and transporting of goods
• Multi-vertical: our name for diverse digital businesses such as Grab & Gojek
• Payments: companies that facilitate movement of capital
• Real Estate and infrastructure: construction, buying & selling and management of real estate assets, including the tools facilitating those activities
• Retail: companies that sell or rent goods using internet technology, including tools that facilitate those activities e.g. Store-front management software, POS systems, etc.
• Travel: tourism and hospitality
Currency:
$ refers to United States Dollar (US$) unless otherwise stated.
dmpMETHODOLOGY
27
Deal definitions:
Deal stage:
Each series definition is determined as follows:
- Pre-Series A: amounts of $10K - $1M. Purpose of investment tends to be building the idea/team; in some cases, the company generates revenue.
- Series A: amounts of $1M - $3M. The product has been built and proven via initial but repeatable revenue. Investment purpose tends to be establishing domestic position, and sometimes scaling regionally.
- Series B: amounts of $3M-$10M. Investment purpose tends to be building scale, either domestically or regionally.
- Series C+: any amount invested later than Series B. Series C, Series D, later series investments, pre-IPO, mezzanine.
We have also estimated a particular company’s valuation through a recent substantial financing or liquidity event and known business developments
Deal type:
We focus mainly on venture capital deals – investments made by fund entities into early stage startups, whether they are from independent funds of corporate venture capital entities. This is a subset of the total number of early stage tech deals in the region.
We separate the following from most of our data, apart from the ‘total capital invested and total deals done’ chart:
- Corporate transfers: events where a corporate entity funds an entity in the region in which it owns a majority or significant minority stake (e.g. Rocket Internet, Lippo Group)
- Project financing: A deal which was a partnership for an identified purpose – e.g. Grab-Honda.
- Non-Southeast Asia deals: e.g. India and China focused companies that happen to use Singapore for their corporate domicile.

dmp
www.cento.vc [email protected] +65 6816 2810 Office address: 56B Pagoda Street, Singapore 059215 Mailing address: Cento Ventures, 3 Church Street, Level 8, Singapore 049483
Con
tact
28