h1 2019 results - pbinvestmedia.s3.amazonaws.com · h1 15 h2 15 h1 16 h2 16 h1 17 h2 17 h1 18 h2 18...
TRANSCRIPT

1
H1 2019 Results13 December 2018

Business Highlights Michael Bruce
Financial Highlights James Davies
Strategic Overview Michael Bruce
Best use of tech in the digital economy award
2
Today’s agenda

Business HighlightsMichael Bruce, CEO
H1 2019 highlights
4
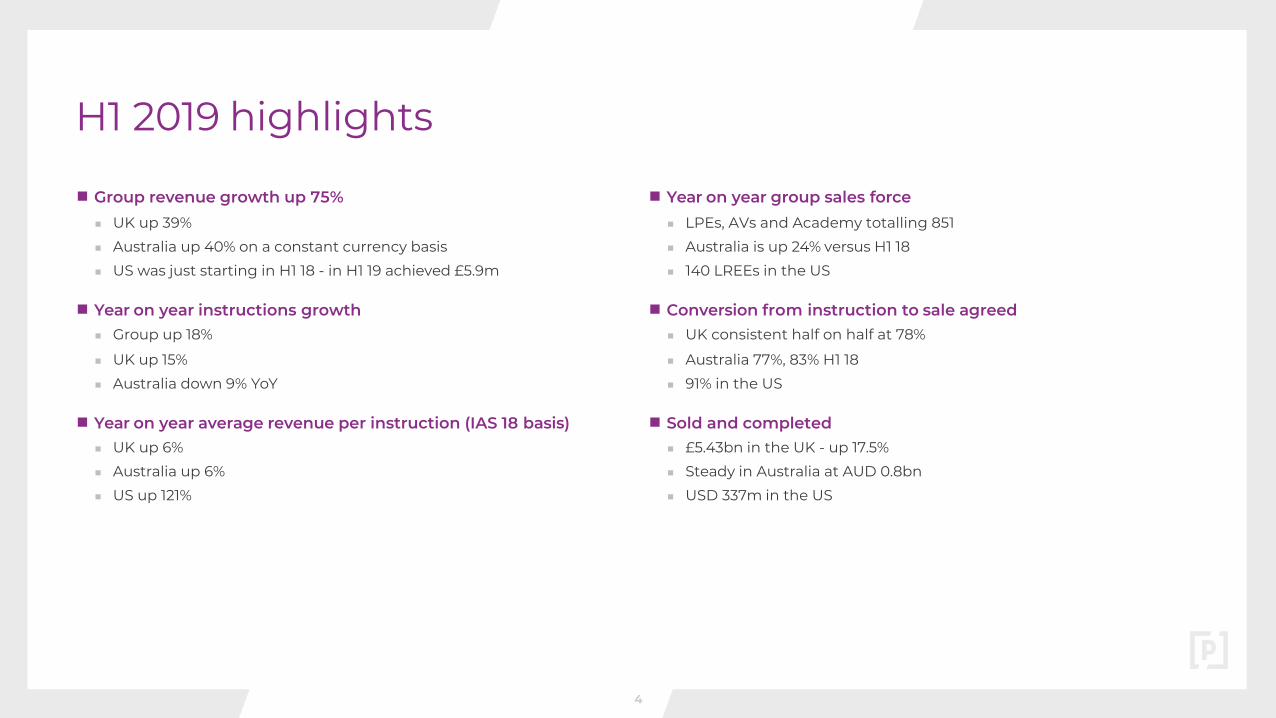
■ Group revenue growth up 75%■ UK up 39%
■ Australia up 40% on a constant currency basis
■ US was just starting in H1 18 - in H1 19 achieved £5.9m
■ Year on year instructions growth■ Group up 18%
■ UK up 15%
■ Australia down 9% YoY
■ Year on year average revenue per instruction (IAS 18 basis)■ UK up 6%
■ Australia up 6%
■ US up 121%
■ Year on year group sales force■ LPEs, AVs and Academy totalling 851
■ Australia is up 24% versus H1 18
■ 140 LREEs in the US
■ Conversion from instruction to sale agreed■ UK consistent half on half at 78%
■ Australia 77%, 83% H1 18
■ 91% in the US
■ Sold and completed■ £5.43bn in the UK - up 17.5%
■ Steady in Australia at AUD 0.8bn
■ USD 337m in the US

Financial reviewJames Davies, CFO
H1 2019 H1 2018£m £m
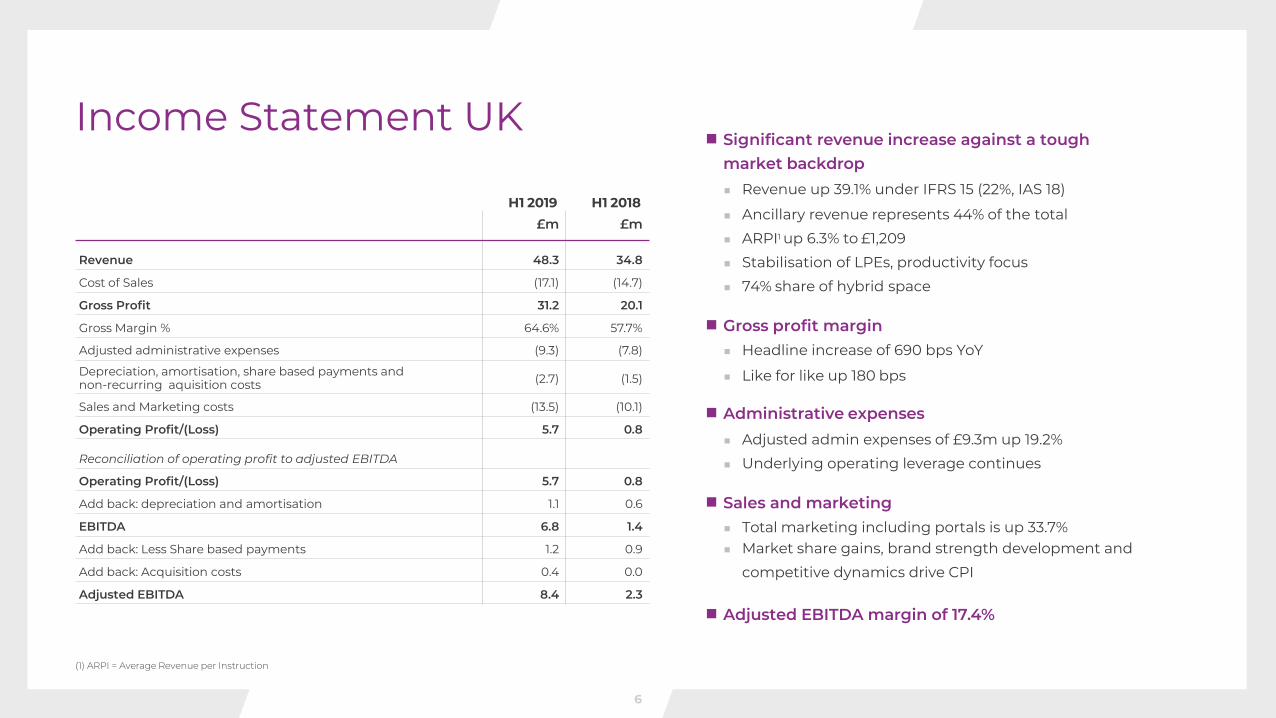
Revenue 48.3 34.8
Cost of Sales (17.1) (14.7)
Gross Profit 31.2 20.1
Gross Margin % 64.6% 57.7%
Adjusted administrative expenses (9.3) (7.8)
Depreciation, amortisation, share based payments andnon-recurring aquisition costs (2.7) (1.5)
Sales and Marketing costs (13.5) (10.1)
Operating Profit/(Loss) 5.7 0.8
Reconciliation of operating profit to adjusted EBITDA
Operating Profit/(Loss) 5.7 0.8
Add back: depreciation and amortisation 1.1 0.6
EBITDA 6.8 1.4
Add back: Less Share based payments 1.2 0.9
Add back: Acquisition costs 0.4 0.0
Adjusted EBITDA 8.4 2.3
■ Significant revenue increase against a tough market backdrop■ Revenue up 39.1% under IFRS 15 (22%, IAS 18)
■ Ancillary revenue represents 44% of the total
■ ARPI1 up 6.3% to £1,209
■ Stabilisation of LPEs, productivity focus
■ 74% share of hybrid space
■ Gross profit margin■ Headline increase of 690 bps YoY
■ Like for like up 180 bps
■ Administrative expenses■ Adjusted admin expenses of £9.3m up 19.2%
■ Underlying operating leverage continues
■ Sales and marketing■ Total marketing including portals is up 33.7%■ Market share gains, brand strength development and
competitive dynamics drive CPI
■ Adjusted EBITDA margin of 17.4%
(1) ARPI = Average Revenue per Instruction
Income Statement UK
6
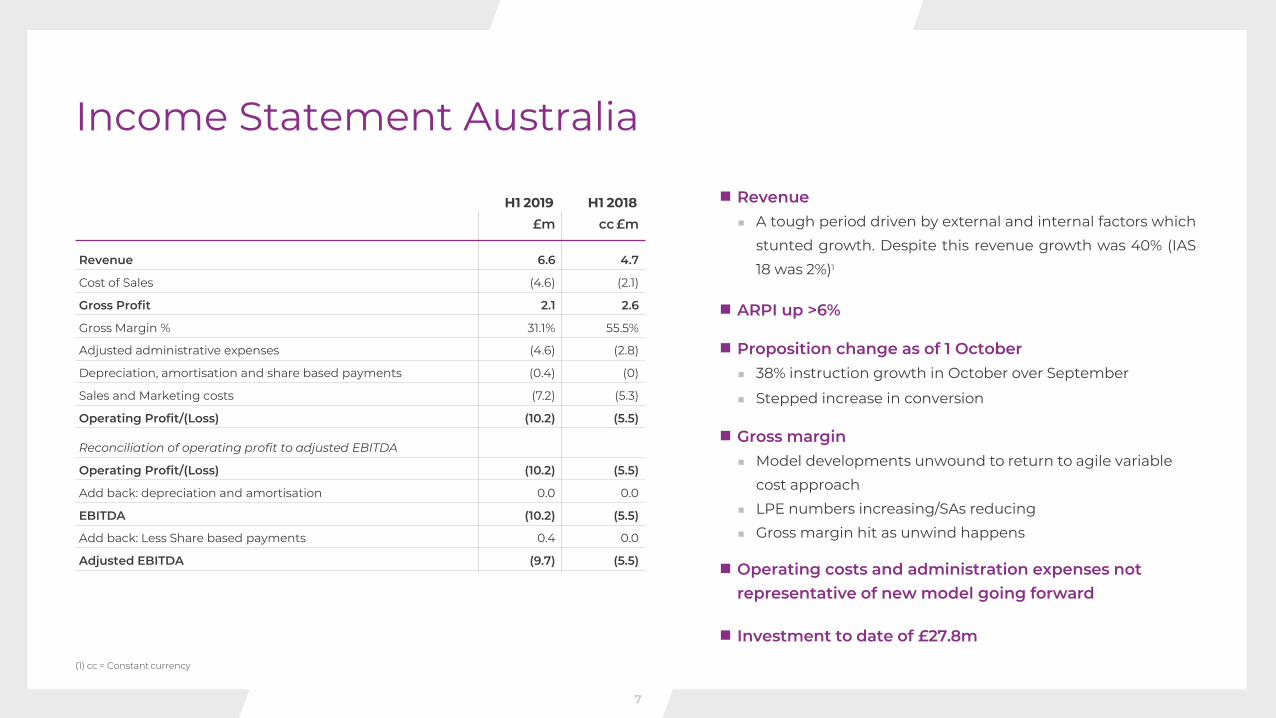
(1) cc = Constant currency
H1 2019 H1 2018£m cc £m
Revenue 6.6 4.7
Cost of Sales (4.6) (2.1)
Gross Profit 2.1 2.6
Gross Margin % 31.1% 55.5%
Adjusted administrative expenses (4.6) (2.8)
Depreciation, amortisation and share based payments (0.4) (0)
Sales and Marketing costs (7.2) (5.3)
Operating Profit/(Loss) (10.2) (5.5)
Reconciliation of operating profit to adjusted EBITDA
Operating Profit/(Loss) (10.2) (5.5)
Add back: depreciation and amortisation 0.0 0.0
EBITDA (10.2) (5.5)
Add back: Less Share based payments 0.4 0.0
Adjusted EBITDA (9.7) (5.5)
Income Statement Australia
■ Revenue■ A tough period driven by external and internal factors which
stunted growth. Despite this revenue growth was 40% (IAS
18 was 2%)1
■ ARPI up >6%
■ Proposition change as of 1 October■ 38% instruction growth in October over September
■ Stepped increase in conversion
■ Gross margin■ Model developments unwound to return to agile variable
cost approach
■ LPE numbers increasing/SAs reducing
■ Gross margin hit as unwind happens
■ Operating costs and administration expenses not representative of new model going forward
■ Investment to date of £27.8m
7
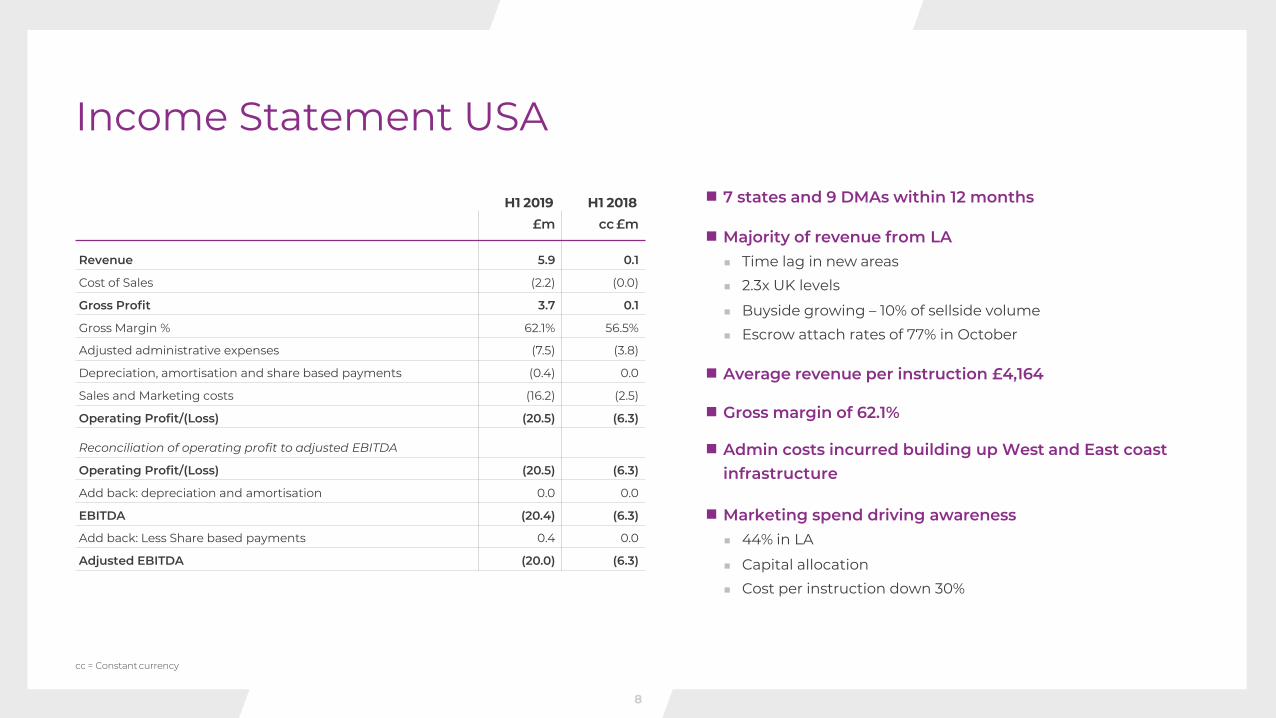
■ 7 states and 9 DMAs within 12 months
■Majority of revenue from LA■ Time lag in new areas
■ 2.3x UK levels
■ Buyside growing – 10% of sellside volume
■ Escrow attach rates of 77% in October
■ Average revenue per instruction £4,164
■ Gross margin of 62.1%
■ Admin costs incurred building up West and East coast infrastructure
■Marketing spend driving awareness■ 44% in LA
■ Capital allocation
■ Cost per instruction down 30%
cc = Constant currency
H1 2019 H1 2018£m cc £m
Revenue 5.9 0.1
Cost of Sales (2.2) (0.0)
Gross Profit 3.7 0.1
Gross Margin % 62.1% 56.5%
Adjusted administrative expenses (7.5) (3.8)
Depreciation, amortisation and share based payments (0.4) 0.0
Sales and Marketing costs (16.2) (2.5)
Operating Profit/(Loss) (20.5) (6.3)
Reconciliation of operating profit to adjusted EBITDA
Operating Profit/(Loss) (20.5) (6.3)
Add back: depreciation and amortisation 0.0 0.0
EBITDA (20.4) (6.3)
Add back: Less Share based payments 0.4 0.0
Adjusted EBITDA (20.0) (6.3)
Income Statement USA
8
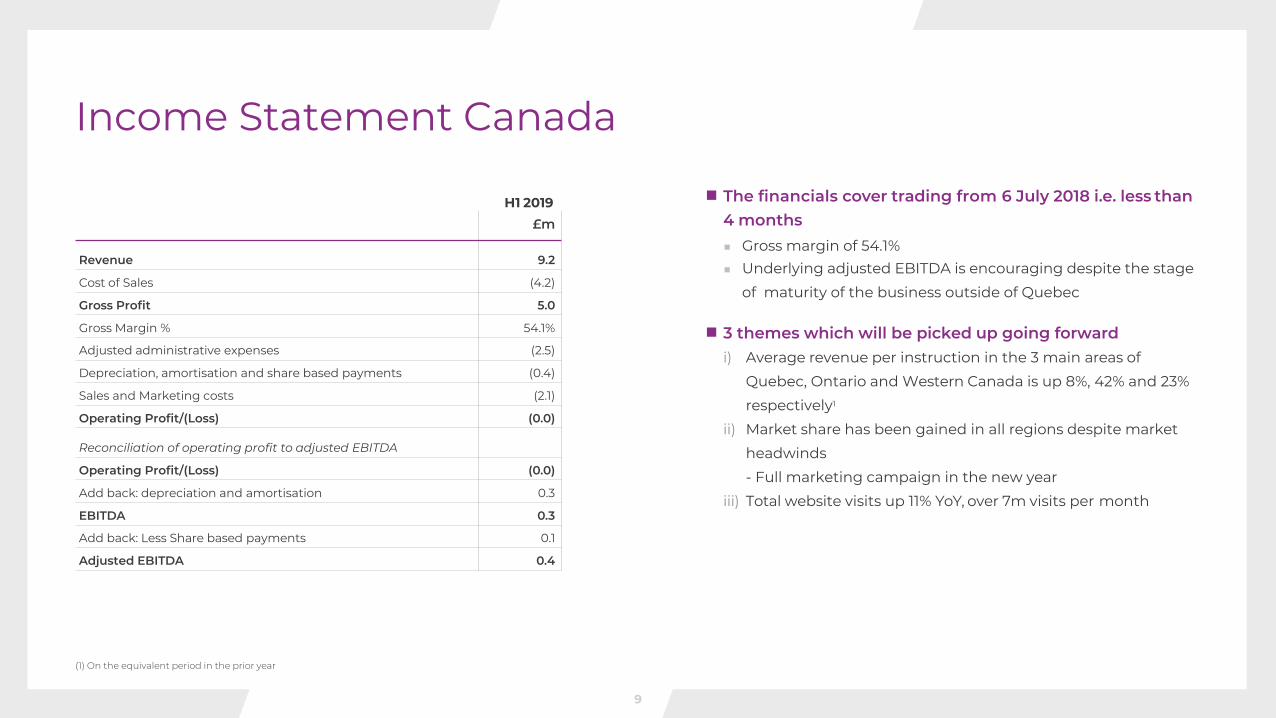
■ The financials cover trading from 6 July 2018 i.e. less than 4 months■ Gross margin of 54.1%■ Underlying adjusted EBITDA is encouraging despite the stage
of maturity of the business outside of Quebec
■ 3 themes which will be picked up going forwardi) Average revenue per instruction in the 3 main areas of
Quebec, Ontario and Western Canada is up 8%, 42% and 23%
respectively1
ii) Market share has been gained in all regions despite market
headwinds
- Full marketing campaign in the new year
iii) Total website visits up 11% YoY, over 7m visits per month
(1) On the equivalent period in the prior year
H1 2019£m
Revenue 9.2
Cost of Sales (4.2)
Gross Profit 5.0
Gross Margin % 54.1%
Adjusted administrative expenses (2.5)
Depreciation, amortisation and share based payments (0.4)
Sales and Marketing costs (2.1)
Operating Profit/(Loss) (0.0)
Reconciliation of operating profit to adjusted EBITDA
Operating Profit/(Loss) (0.0)
Add back: depreciation and amortisation 0.3
EBITDA 0.3
Add back: Less Share based payments 0.1
Adjusted EBITDA 0.4
Income Statement Canada
9
H1 2019 H1 2018
Income Statement Group
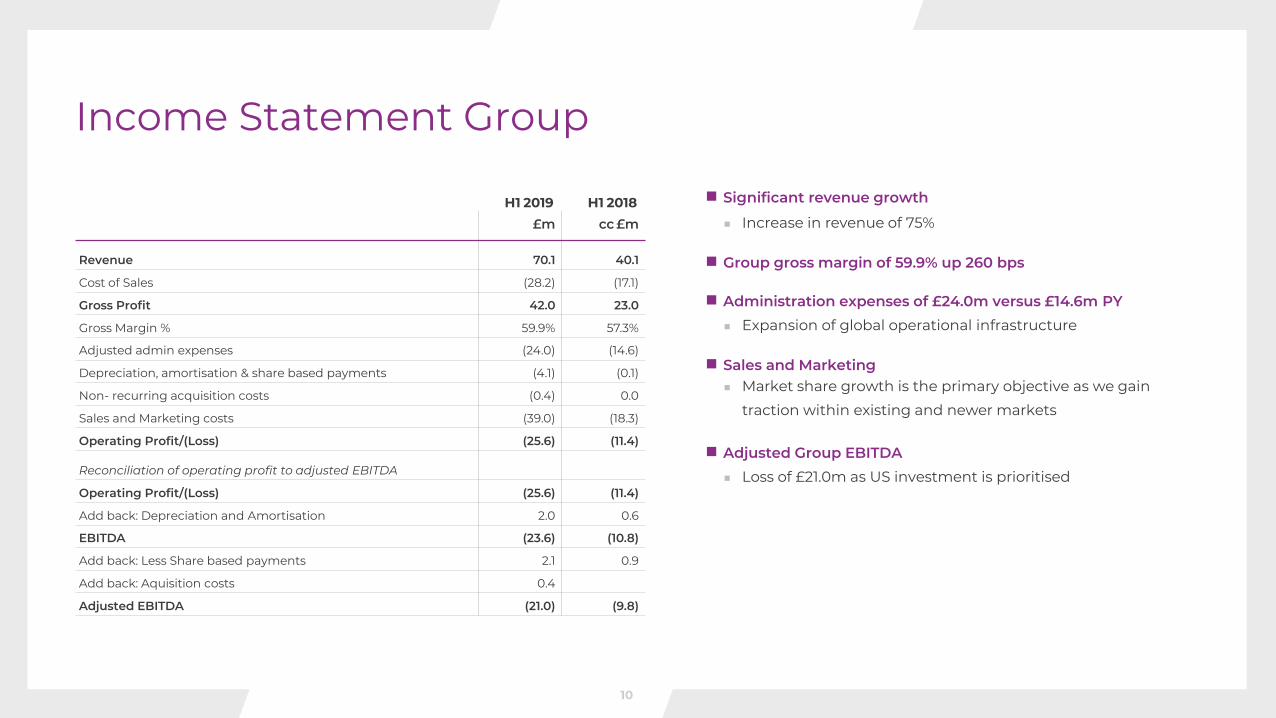
■ Significant revenue growth
■ Increase in revenue of 75%
■ Group gross margin of 59.9% up 260 bps
■ Administration expenses of £24.0m versus £14.6m PY■ Expansion of global operational infrastructure
■ Sales and Marketing■ Market share growth is the primary objective as we gain
traction within existing and newer markets
■ Adjusted Group EBITDA■ Loss of £21.0m as US investment is prioritised
£m cc £m
Revenue 70.1 40.1
Cost of Sales (28.2) (17.1)
Gross Profit 42.0 23.0
Gross Margin % 59.9% 57.3%
Adjusted admin expenses (24.0) (14.6)
Depreciation, amortisation & share based payments (4.1) (0.1)
Non- recurring acquisition costs (0.4) 0.0
Sales and Marketing costs (39.0) (18.3)
Operating Profit/(Loss) (25.6) (11.4)
Reconciliation of operating profit to adjusted EBITDA
Operating Profit/(Loss) (25.6) (11.4)
Add back: Depreciation and Amortisation 2.0 0.6
EBITDA (23.6) (10.8)
Add back: Less Share based payments 2.1 0.9
Add back: Aquisition costs 0.4
Adjusted EBITDA (21.0) (9.8)
10
0100200300400500600700800900
H1 15 H2 15 H1 16 H2 16 H1 17 H2 17 H1 18 H2 18 H1 19
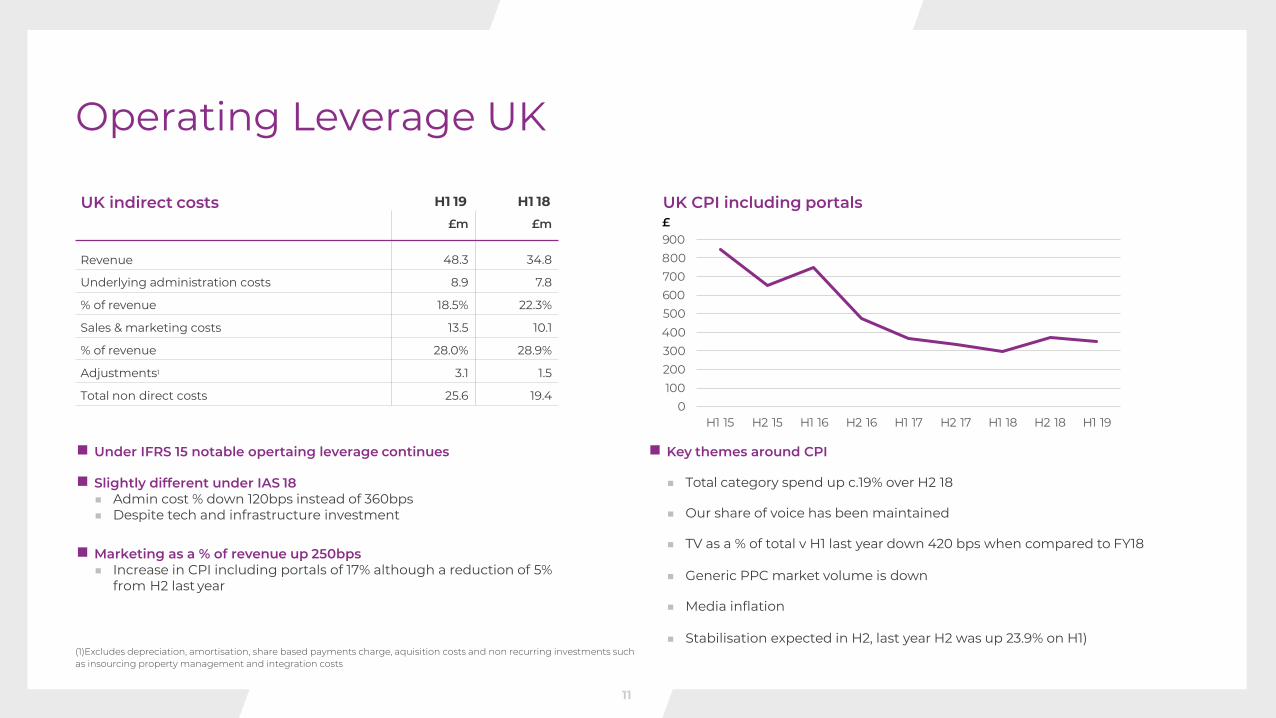
(1)Excludes depreciation, amortisation, share based payments charge, aquisition costs and non recurring investments such as insourcing property management and integration costs
UK indirect costs H1 19 H1 18£m £m
Revenue 48.3 34.8
Underlying administration costs 8.9 7.8
% of revenue 18.5% 22.3%
Sales & marketing costs 13.5 10.1
% of revenue 28.0% 28.9%
Adjustments1 3.1 1.5
Total non direct costs 25.6 19.4
UK CPI including portals
■ Under IFRS 15 notable opertaing leverage continues
■ Slightly different under IAS 18■ Admin cost % down 120bps instead of 360bps■ Despite tech and infrastructure investment
■ Marketing as a % of revenue up 250bps■ Increase in CPI including portals of 17% although a reduction of 5%
from H2 last year
£
Operating Leverage UK
■ Key themes around CPI
■ Total category spend up c.19% over H2 18
■ Our share of voice has been maintained
■ TV as a % of total v H1 last year down 420 bps when compared to FY18
■ Generic PPC market volume is down
■ Media inflation
■ Stabilisation expected in H2, last year H2 was up 23.9% on H1)
11
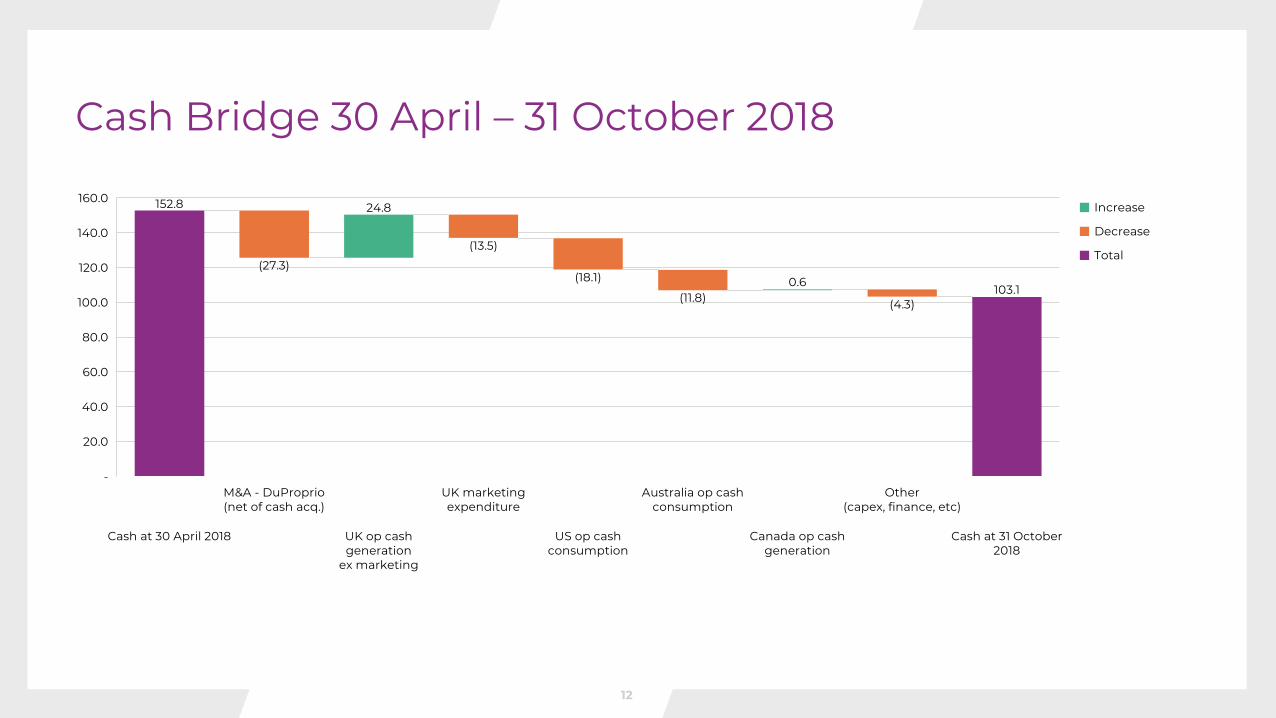
152.8
(27.3)
24.8
(13.5)
(18.1)
(11.8)0.6
(4.3)103.1
Cash at 30 April 2018
M&A - DuProprio(net of cash acq.)
UK op cashgeneration
ex marketing
UK marketingexpenditure
US op cashconsumption
Australia op cashconsumption
Canada op cashgeneration
Other(capex, finance, etc)
Cash at 31 October2018
-
20.0
40.0
60.0
80.0
100.0
120.0
140.0
160.0Increase
Decrease
Total
Cash Bridge 30 April – 31 October 2018
12
0.0
0.5
1.0
1.5
2.0
2.5
3.0
3.5
Linear (US) Linear (UK)
October 2018 in the US
Time
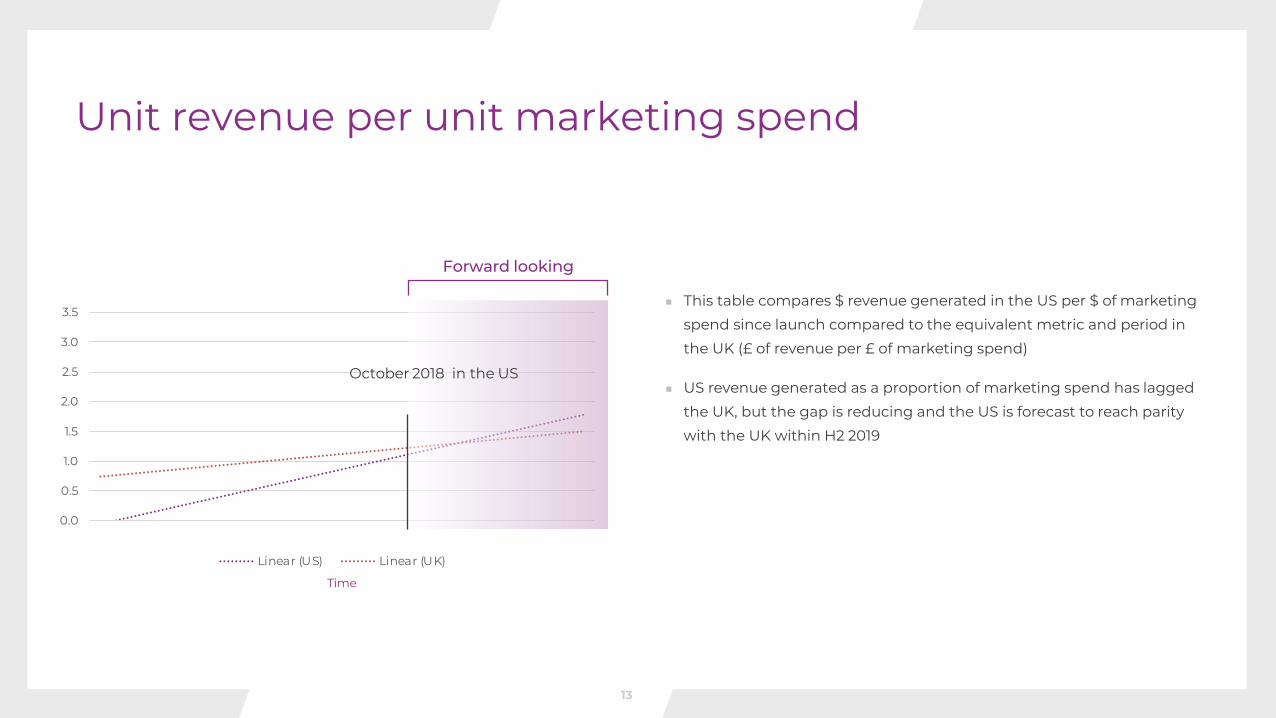
Unit revenue per unit marketing spend
Forward looking
■ This table compares $ revenue generated in the US per $ of marketing
spend since launch compared to the equivalent metric and period in
the UK (£ of revenue per £ of marketing spend)
■ US revenue generated as a proportion of marketing spend has lagged
the UK, but the gap is reducing and the US is forecast to reach parity
with the UK within H2 2019
13

Leading lasting changeMichael Bruce, CEO
Strategic overview
■ Well positioned for what is a challenging market
■ A significant industry shift■ Starting to see more aggressive shake out
■ Business models being tested like never before
■ More pressure on capital and access to capital■ Industry debt is proving a heavy burden on
competitors ability to compete, to innovate, to invest and to attract and retain exceptional people
■ With no debt and a very healthy balance sheet we are better placed than ever to capitalise on our strategy to be the largest, most loved and most profitable estate agent
Leading lasting change
15

Leading lasting change
Four pillars to exceptional growth
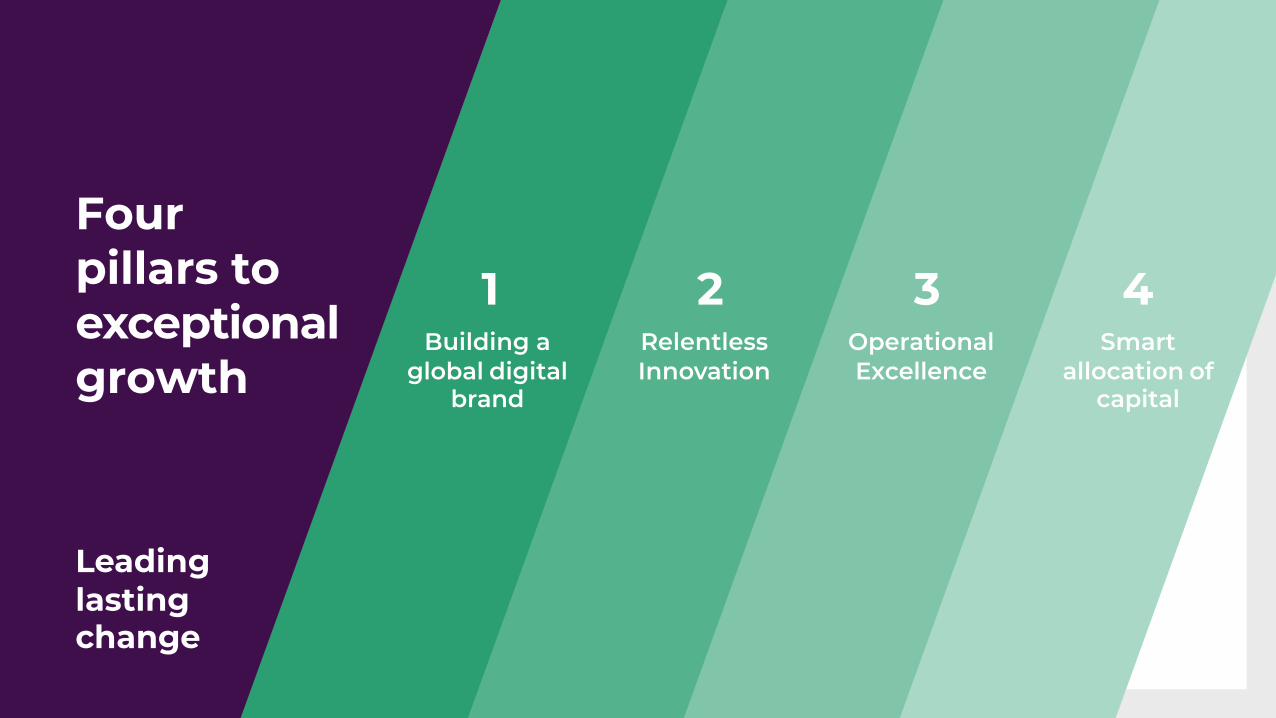
1Building a
global digital brand
Leading lasting change
2Relentless Innovation
3Operational Excellence
4Smart
allocation of capital
Four pillars to exceptional growth

Leading lasting change
Building a global digital brand
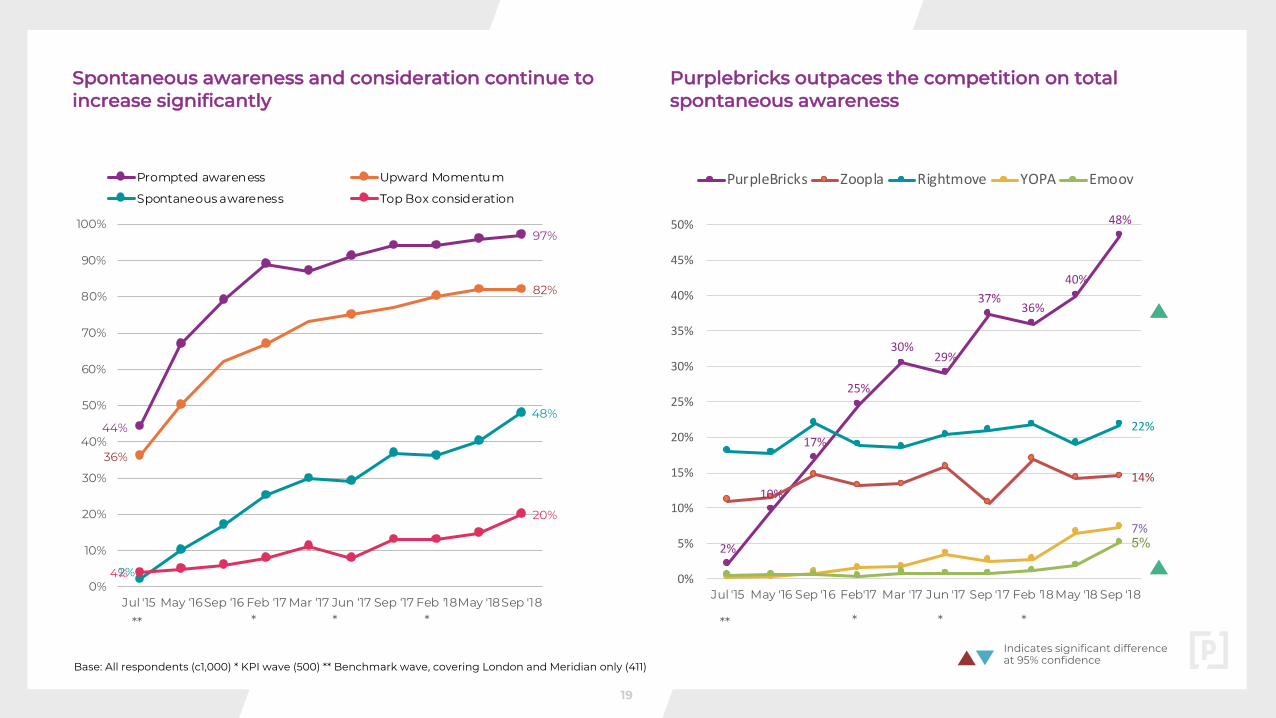
44%
97%
36%
82%
2%
48%
4%
20%
0%
10%
20%
30%
40%
50%
60%
70%
80%
90%
100%
Jul '15 May ‘16Sep ‘16 Feb ‘17 Mar ‘17 Jun ‘17 Sep ‘17 Feb '18May '18Sep '18
Prompted awareness Upward Momentum
Spontaneous awareness Top Box consideration
Indicates significant difference at 95% confidence
***
Spontaneous awareness and consideration continue to increase significantly
Base: All respondents (c1,000) * KPI wave (500) ** Benchmark wave, covering London and Meridian only (411)
2%
10%
17%
25%
30%29%
37%36%
40%
48%
14%
22%
7%5%
0%
5%
10%
15%
20%
25%
30%
35%
40%
45%
50%
Jul '15 May '16 Sep '16 Feb'17 Mar '17 Jun '17 Sep '17 Feb '18 May '18 Sep '18
PurpleBricks Zoopla Rightmove YOPA Emoov
Purplebricks outpaces the competition on total spontaneous awareness
* * ** * * *
19
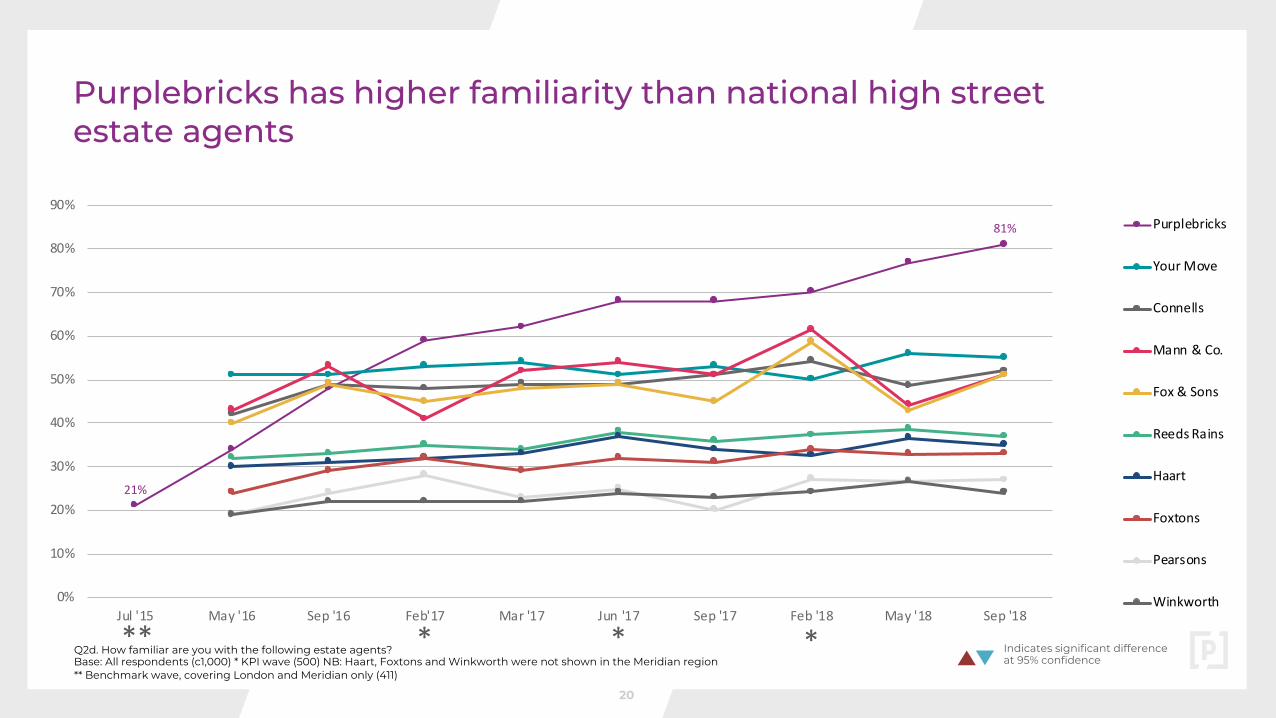
21%
81%
0%
10%
20%
30%
40%
50%
60%
70%
80%
90%
Jul '15 May '16 Sep '16 Feb'17 Mar '17 Jun '17 Sep '17 Feb '18 May '18 Sep '18
Purplebricks
Your Move
Connells
Mann & Co.
Fox & Sons
Reeds Rains
Haart
Foxtons
Pearsons
Winkworth
* * ***
Purplebricks has higher familiarity than national high streetestate agents
Q2d. How familiar are you with the following estate agents? Base: All respondents (c1,000) * KPI wave (500) NB: Haart, Foxtons and Winkworth were not shown in the Meridian region** Benchmark wave, covering London and Meridian only (411)
Indicates significant difference at 95% confidence
20
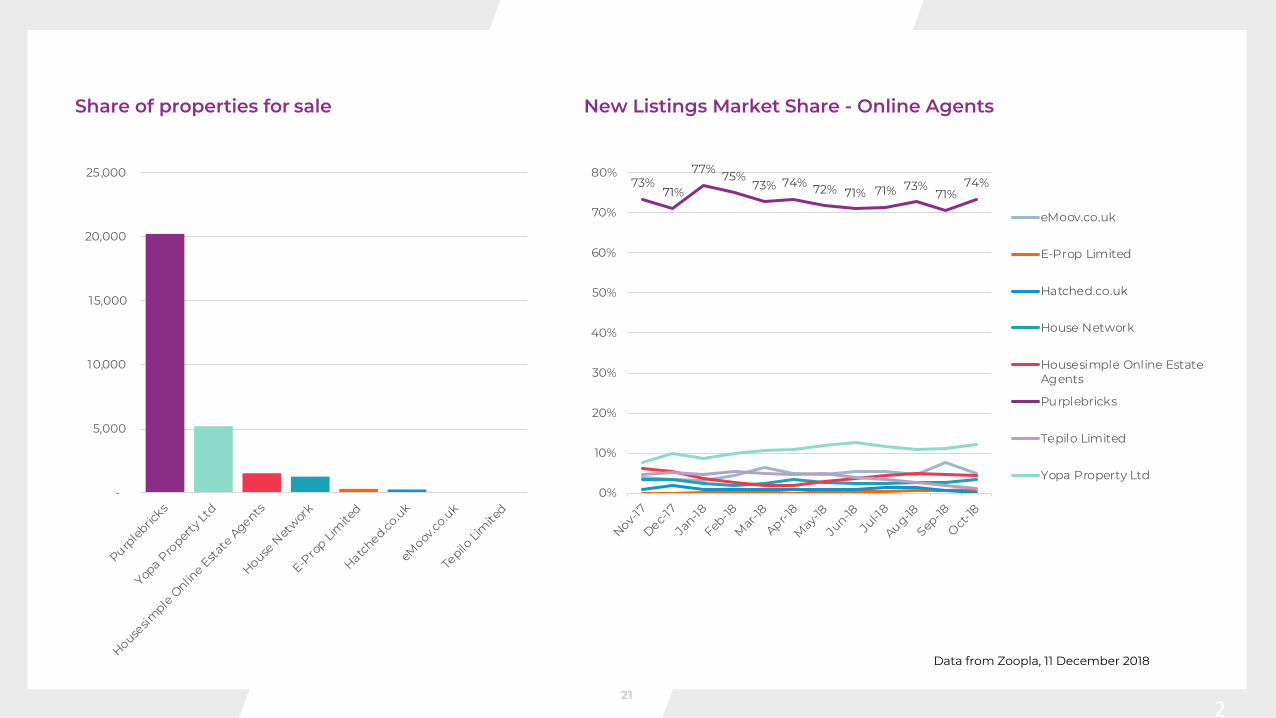
Share of properties for sale New Listings Market Share - Online Agents
21
-
5,000
10,000
15,000
20,000
25,000
Purpleb
ricks
Yopa P
roper
ty Lt
d
Housesim
ple Onlin
e Estate
Agents
House N
etwork
E-Pro
p Lim
ited
Hatched.co.uk
eMoov
.co.uk
Tepilo
Lim
ited
Data from Zoopla, 11 December 2018
73%71%
77% 75%73% 74% 72% 71% 71% 73%
71%74%
0%
10%
20%
30%
40%
50%
60%
70%
80%
Nov-17
Dec-17
Jan-18
Feb-18
Mar-1
8
Apr-18
May-18
Jun-18
Jul-1
8
Aug-18
Sep-18
Oct-18
eMoov.co.uk
E-Prop Limited
Hatched.co.uk
House Network
Housesimple Online EstateAgents
Purplebricks
Tepilo Limited
Yopa Property Ltd
21
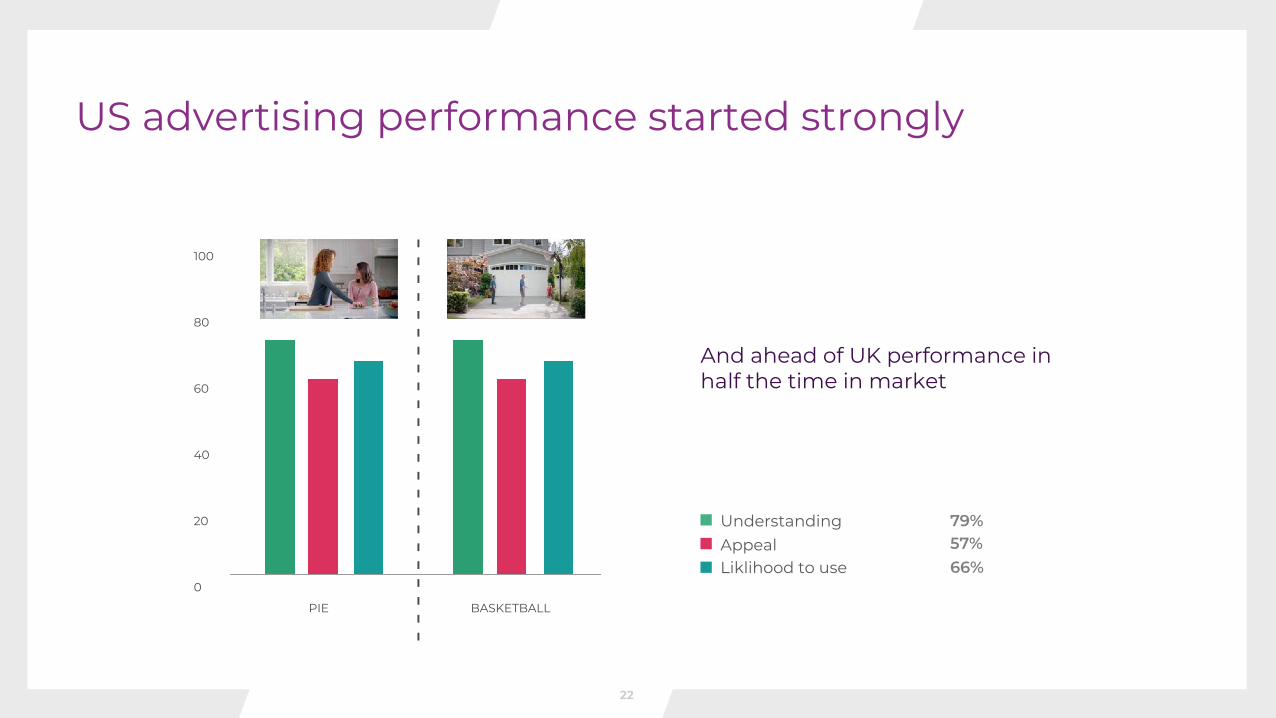
PIE BASKETBALL
100
80
60
40
20
0
- - - - - - - - - - - - - - - - - - - - - - -
US advertising performance started strongly
And ahead of UK performance inhalf the time in market
UnderstandingAppealLiklihood to use
79%57%66%
22
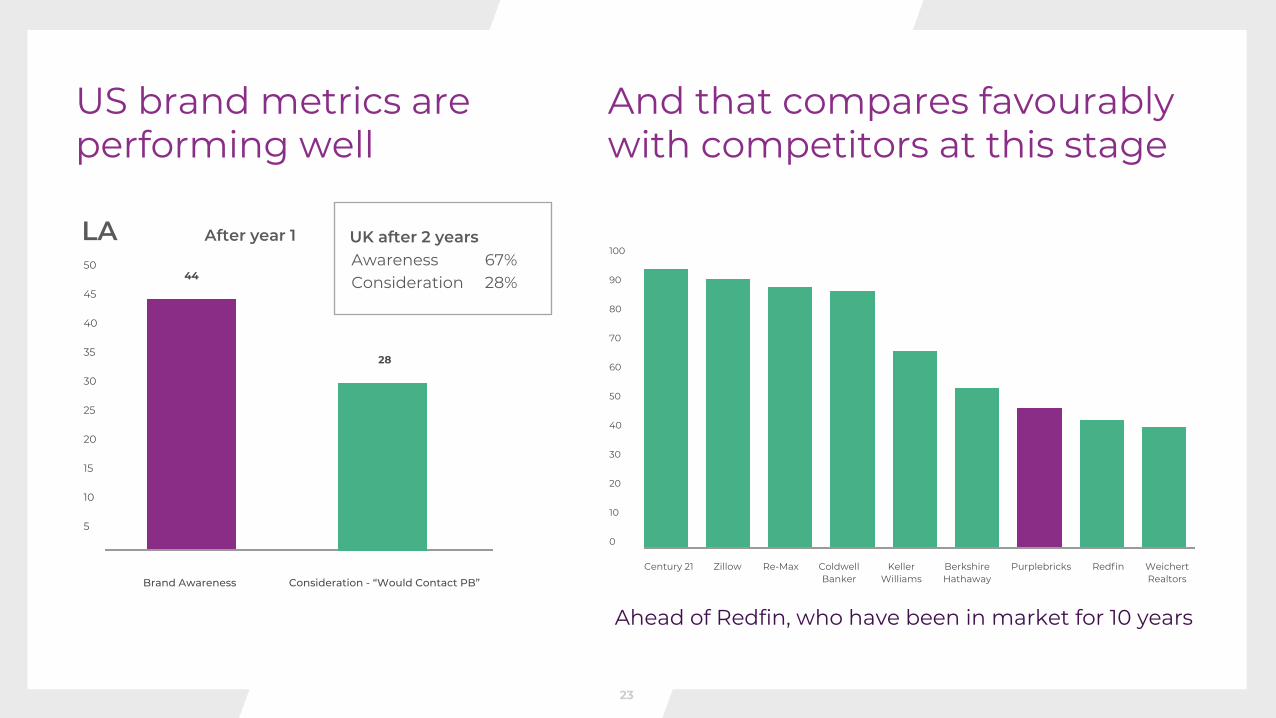
And that compares favourably with competitors at this stage
Century 21 Zillow Re-Max ColdwellBanker
KellerWilliams
BerkshireHathaway
Purplebricks Redfin WeichertRealtors
100
90
80
70
60
50
40
30
20
10
0
Ahead of Redfin, who have been in market for 10 years
US brand metrics are performing well
50
45
40
35
30
25
20
15
10
5
44
28
Brand Awareness Consideration - “Would Contact PB”
UK after 2 yearsAwarenessConsideration
67%28%
After year 1LA
23
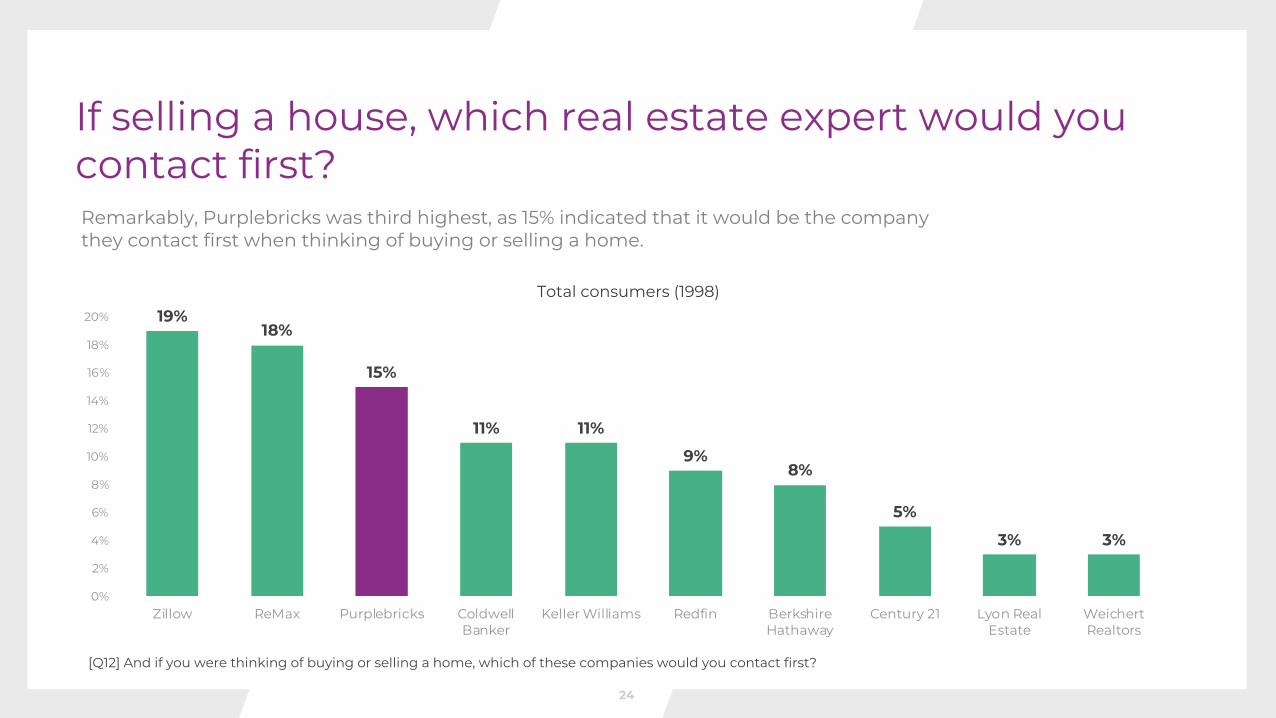
[Q12] And if you were thinking of buying or selling a home, which of these companies would you contact first?
Remarkably, Purplebricks was third highest, as 15% indicated that it would be the company they contact first when thinking of buying or selling a home.
19%18%
15%
11% 11%
9%8%
5%
3% 3%
0%
2%
4%
6%
8%
10%
12%
14%
16%
18%
20%
Zillow ReMax Purplebricks ColdwellBanker
Keller Williams Redfin BerkshireHathaway
Century 21 Lyon RealEstate
WeichertRealtors
Total consumers (1998)
If selling a house, which real estate expert would you contact first?
24
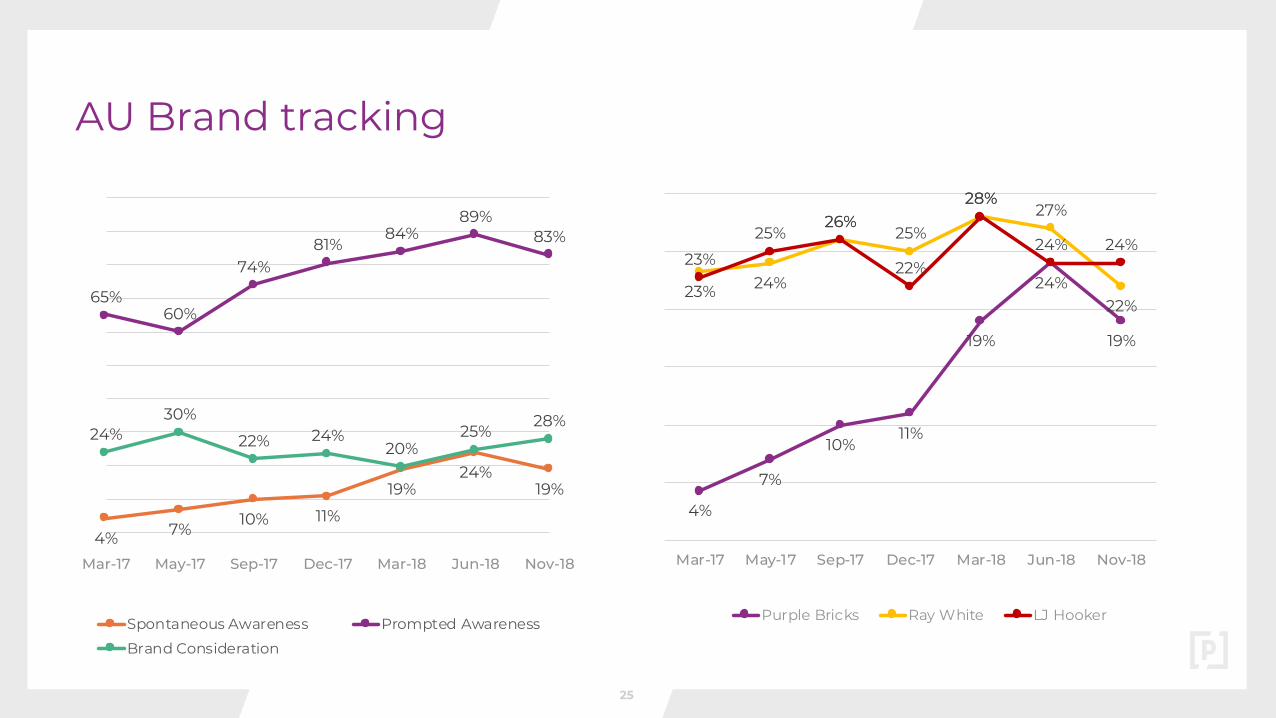
4% 7% 10% 11%
19%24%
19%
65%60%
74%81%
84%89%
83%
24%30%
22% 24%20%
25%28%
Mar-17 May-17 Sep-17 Dec-17 Mar-18 Jun-18 Nov-18
Spontaneous Awareness Prompted Awareness
Brand Consideration
AU Brand tracking
4%
7%
10%11%
19%
24%
19%
23% 24%
26%25%
28%27%
22%
23%
25%26%
22%
28%
24% 24%
Mar-17 May-17 Sep-17 Dec-17 Mar-18 Jun-18 Nov-18
Purple Bricks Ray White LJ Hooker
25

Leading lasting change
Relentless Innovation
■ Supercharge Innovation, efficiency and service for customers
■ Greater productivity and efficiency for LPEs
■ More automated delivery but better experience
■ Share learnings across the Groupeg LPE equivalents in Canada can be over 200% more productive than UK LPEs, whilst maintaining a first class customer experience
Relentless innovation
Leading lasting change
27
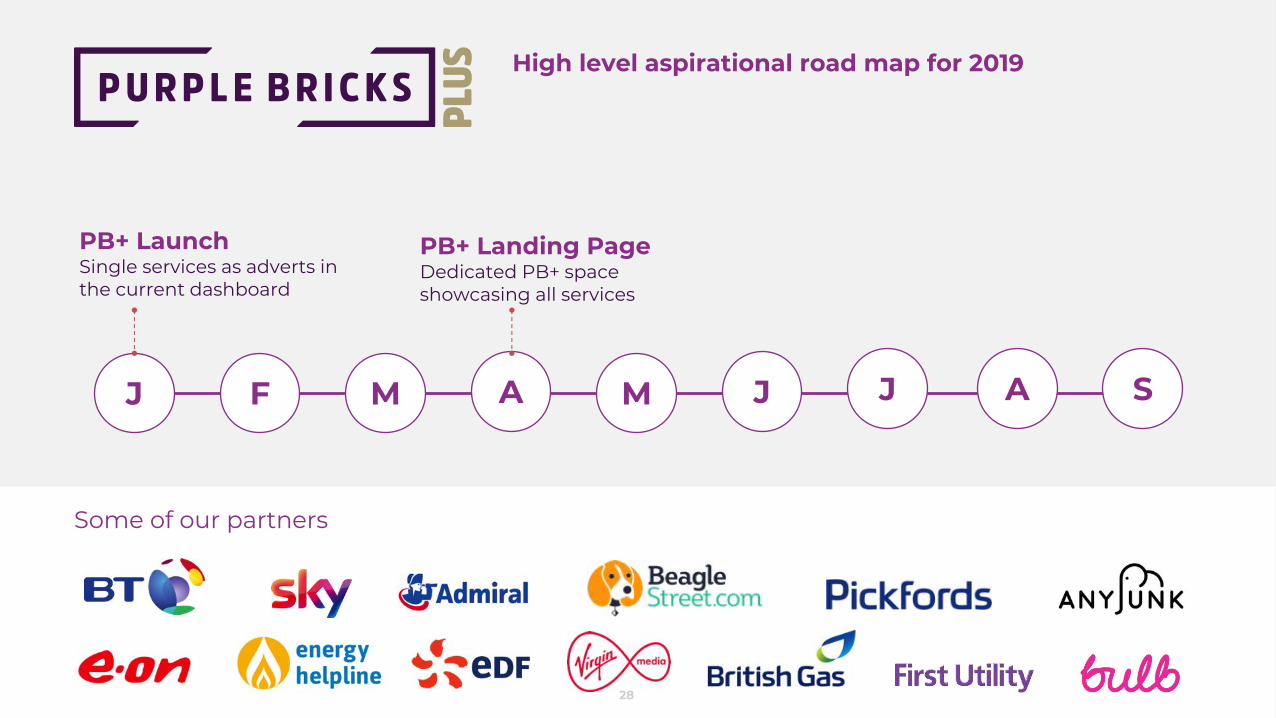
High level aspirational road map for 2019
J F M A M J J A S
PB+ LaunchSingle services as adverts in the current dashboard
PB+ Landing PageDedicated PB+ space showcasing all services
Some of our partners
28
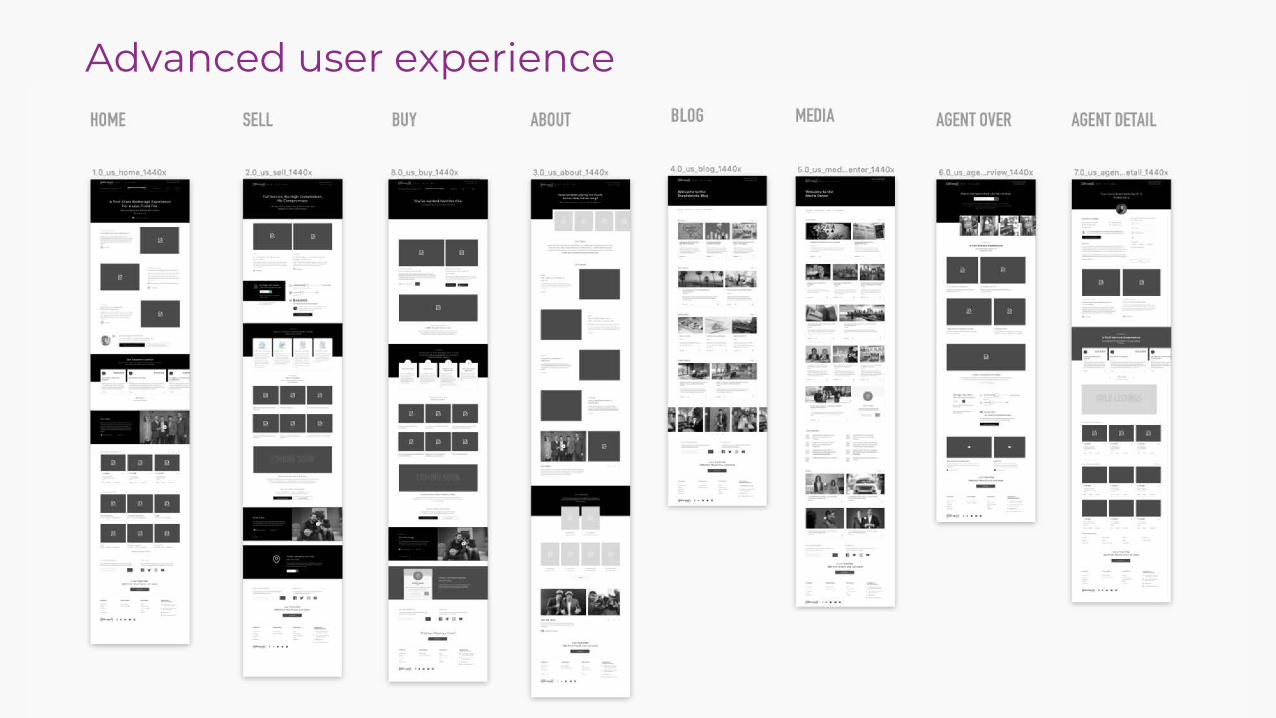
Advanced user experience

30
Relentless innovation
Leading lasting change
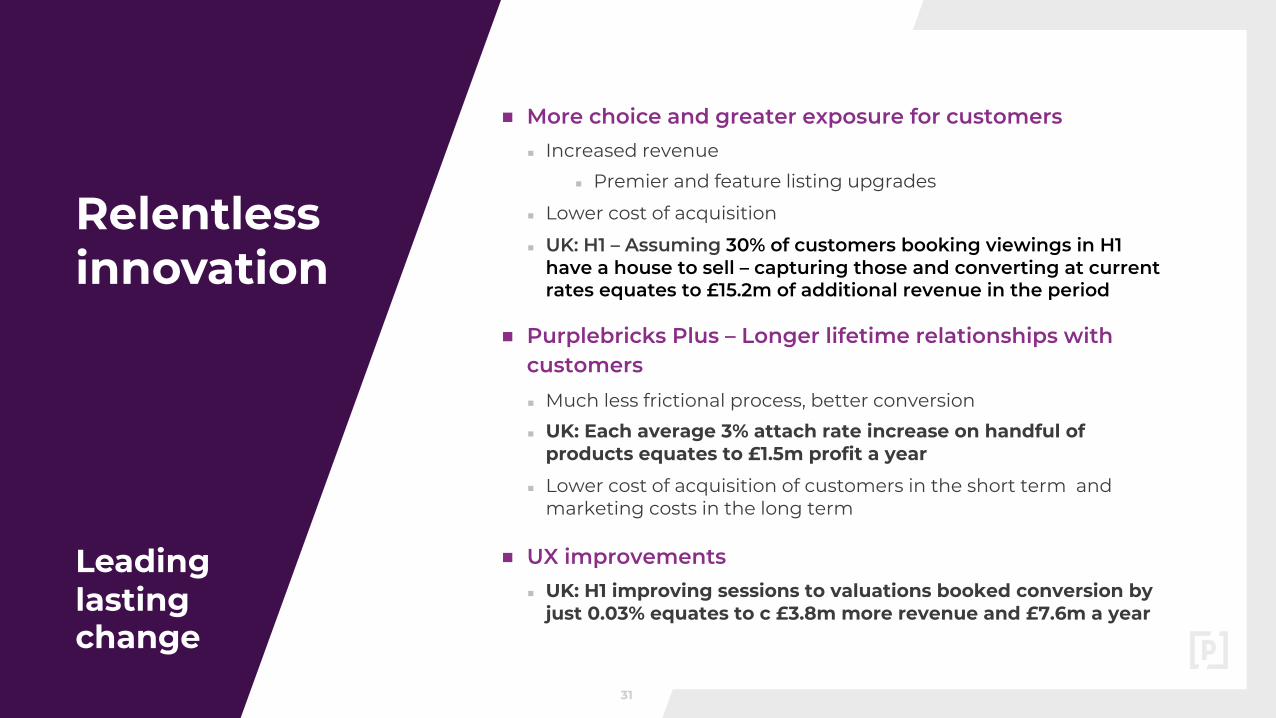
■ More choice and greater exposure for customers■ Increased revenue
■ Premier and feature listing upgrades
■ Lower cost of acquisition
■ UK: H1 – Assuming 30% of customers booking viewings in H1 have a house to sell – capturing those and converting at current rates equates to £15.2m of additional revenue in the period
■ Purplebricks Plus – Longer lifetime relationships with customers■ Much less frictional process, better conversion
■ UK: Each average 3% attach rate increase on handful of products equates to £1.5m profit a year
■ Lower cost of acquisition of customers in the short term and marketing costs in the long term
■ UX improvements■ UK: H1 improving sessions to valuations booked conversion by
just 0.03% equates to c £3.8m more revenue and £7.6m a year
31

Operational Excellence

Training & Development DirectorRecruiting
Increasing quality of service, better experiences for customers, increased revenue for LPEs and
Purplebricks
People Director, Stuart PerkinsRecently recruited, in post
AAA people in every capacity, driving quality, retention and increased revenues
UK: H1 - 3% point increase in conversion to instruction by LPE’s equates to £3.6m in additional
revenue and £7.2m per year
Global COO, Vic DarveyRecently recruited, start January
Operational Excellence and Relentless Delivery
Former Managing DirectorMoney Supermarket 2015 – 2018
Managing DirectorTravel Supermarket 2012 – 2015
Group Director of Marketing & ManagementCMC Markets 2010 - 2012
Vice PresidentLastminute.com 2004 – 2010
Chief Digital Officer, Giles DelafeldRecently recruited, in post
Industrialised output to drive more productivity, greater revenues and simpler processes
Premier and Feature listings, Purplebricks Plus and innovation initiatives can drive millions in additional
revenue, productivity and low cost of acquisition
Extraordinary
19
people withexceptionalexperience
33
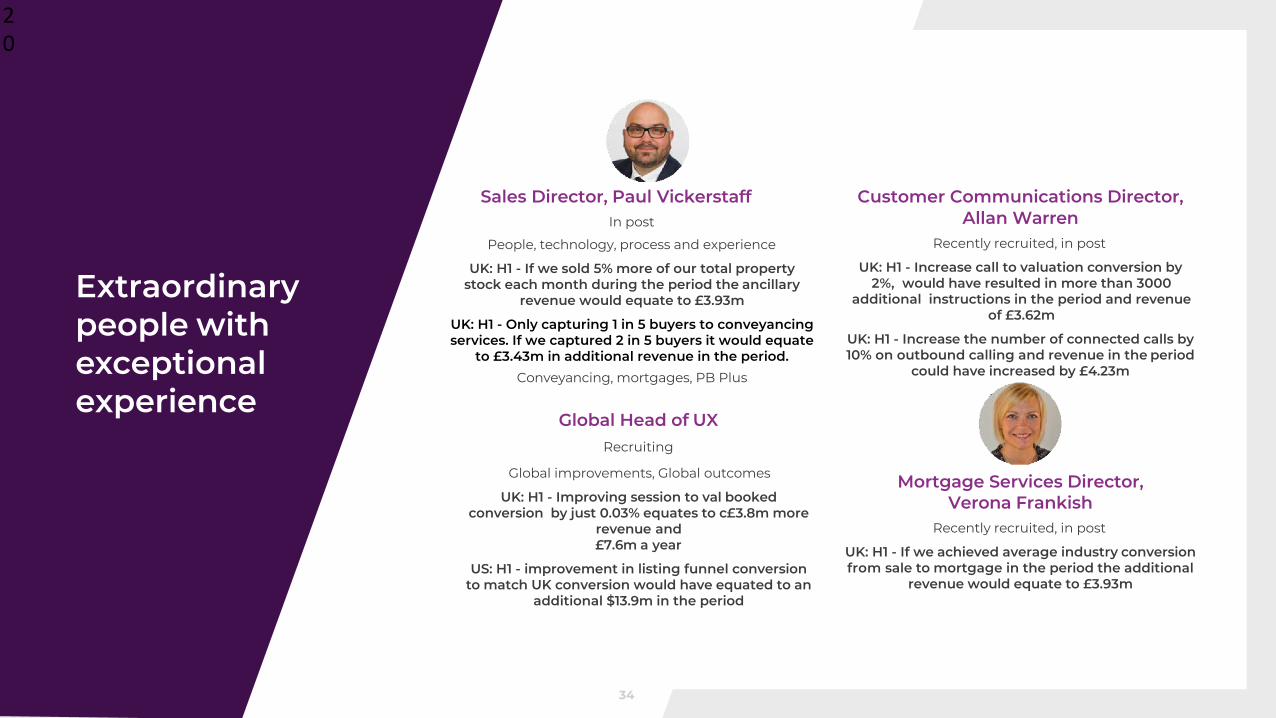
Global Head of UXRecruiting
Global improvements, Global outcomes
UK: H1 - Improving session to val bookedconversion by just 0.03% equates to c£3.8m more
revenue and£7.6m a year
US: H1 - improvement in listing funnel conversion to match UK conversion would have equated to an
additional $13.9m in the period
Sales Director, Paul VickerstaffIn post
People, technology, process and experience
UK: H1 - If we sold 5% more of our total property stock each month during the period the ancillary
revenue would equate to £3.93m
UK: H1 - Only capturing 1 in 5 buyers to conveyancing services. If we captured 2 in 5 buyers it would equate
to £3.43m in additional revenue in the period.Conveyancing, mortgages, PB Plus
Customer Communications Director, Allan Warren
Recently recruited, in post
UK: H1 - Increase call to valuation conversion by 2%, would have resulted in more than 3000
additional instructions in the period and revenue of £3.62m
UK: H1 - Increase the number of connected calls by 10% on outbound calling and revenue in the period
could have increased by £4.23m
Mortgage Services Director, Verona Frankish
Recently recruited, in post
UK: H1 - If we achieved average industry conversion from sale to mortgage in the period the additional
revenue would equate to £3.93m
Extraordinary
20
people withexceptionalexperience
34

Smart Allocation of Capital
Leading lasting change
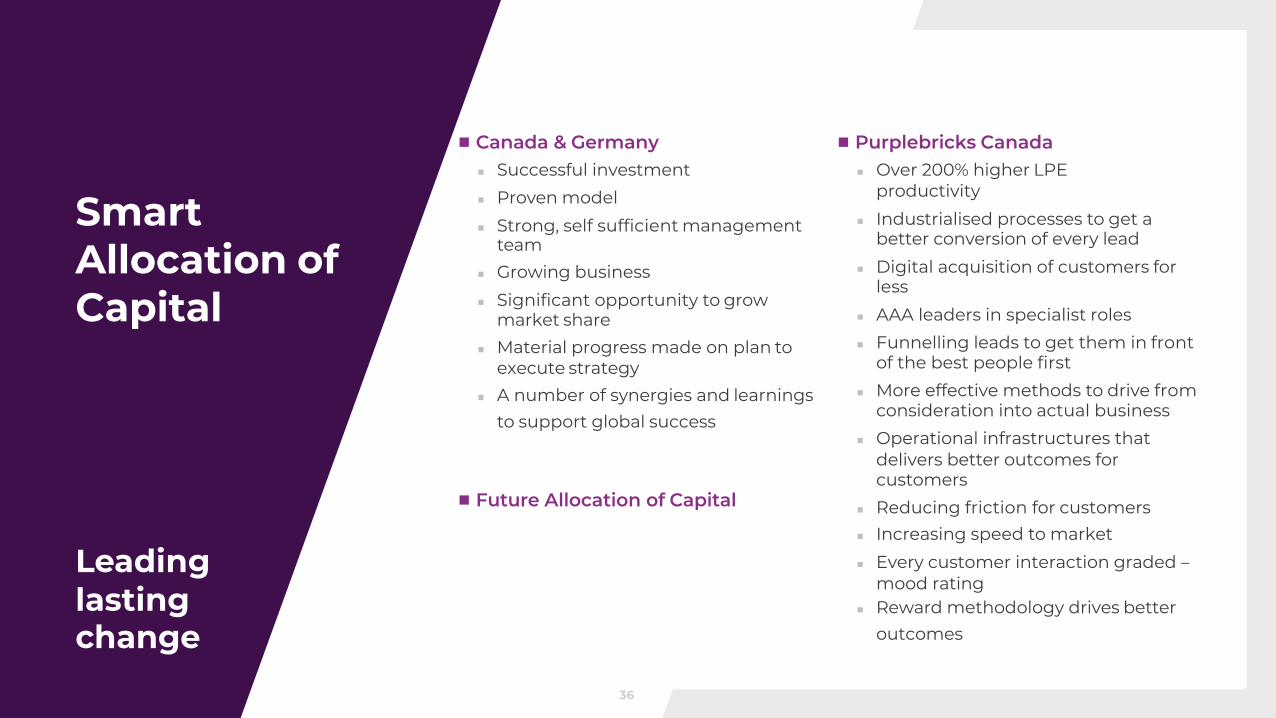
Smart Allocation of Capital
■ Canada & Germany■ Successful investment■ Proven model■ Strong, self sufficient management
team■ Growing business■ Significant opportunity to grow
market share■ Material progress made on plan to
execute strategy■ A number of synergies and learnings
to support global success
■ Purplebricks Canada■ Over 200% higher LPE
productivity■ Industrialised processes to get a
better conversion of every lead■ Digital acquisition of customers for
less■ AAA leaders in specialist roles■ Funnelling leads to get them in front
of the best people first■ More effective methods to drive from
consideration into actual business■ Operational infrastructures that
delivers better outcomes for customers
■ Reducing friction for customers■ Increasing speed to market■ Every customer interaction graded –
mood rating■ Reward methodology drives better
outcomes
■ Future Allocation of Capital
36
Outlook
Leading lasting change
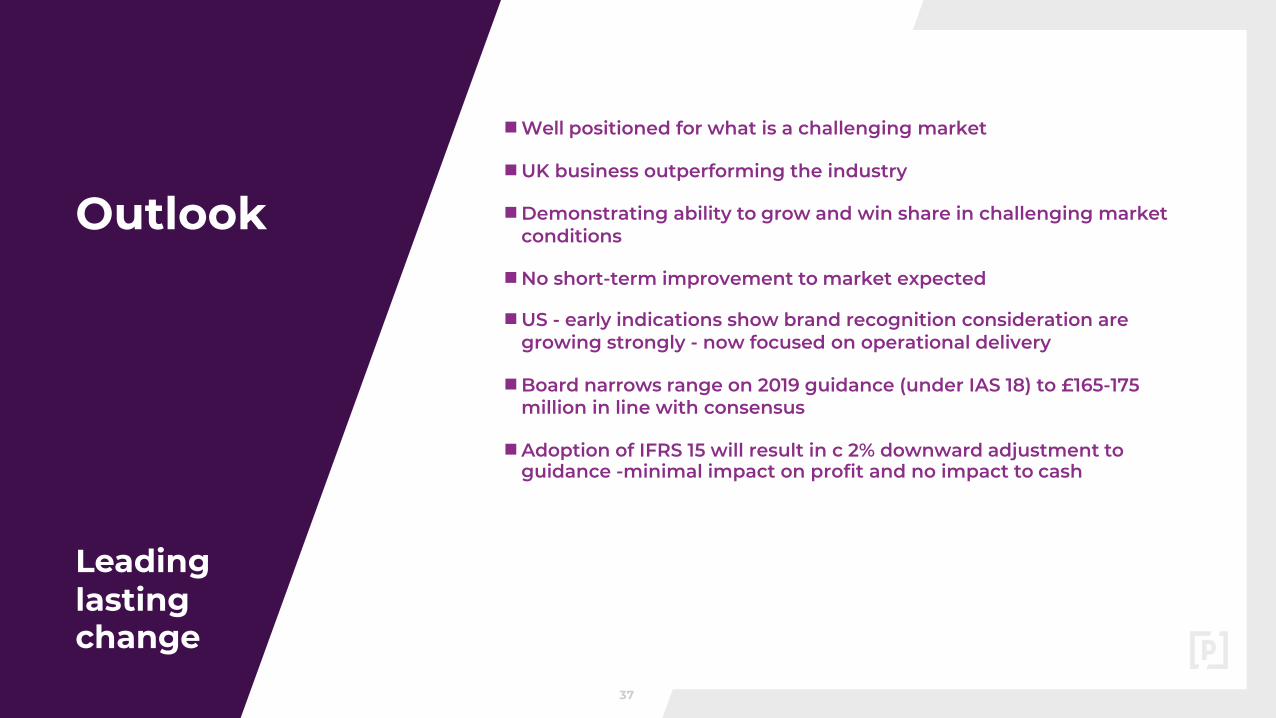
■Well positioned for what is a challenging market
■UK business outperforming the industry
■Demonstrating ability to grow and win share in challenging marketconditions
■No short-term improvement to market expected
■US - early indications show brand recognition consideration are growing strongly - now focused on operational delivery
■Board narrows range on 2019 guidance (under IAS 18) to £165-175 million in line with consensus
■Adoption of IFRS 15 will result in c 2% downward adjustment toguidance -minimal impact on profit and no impact to cash
37


Appendix
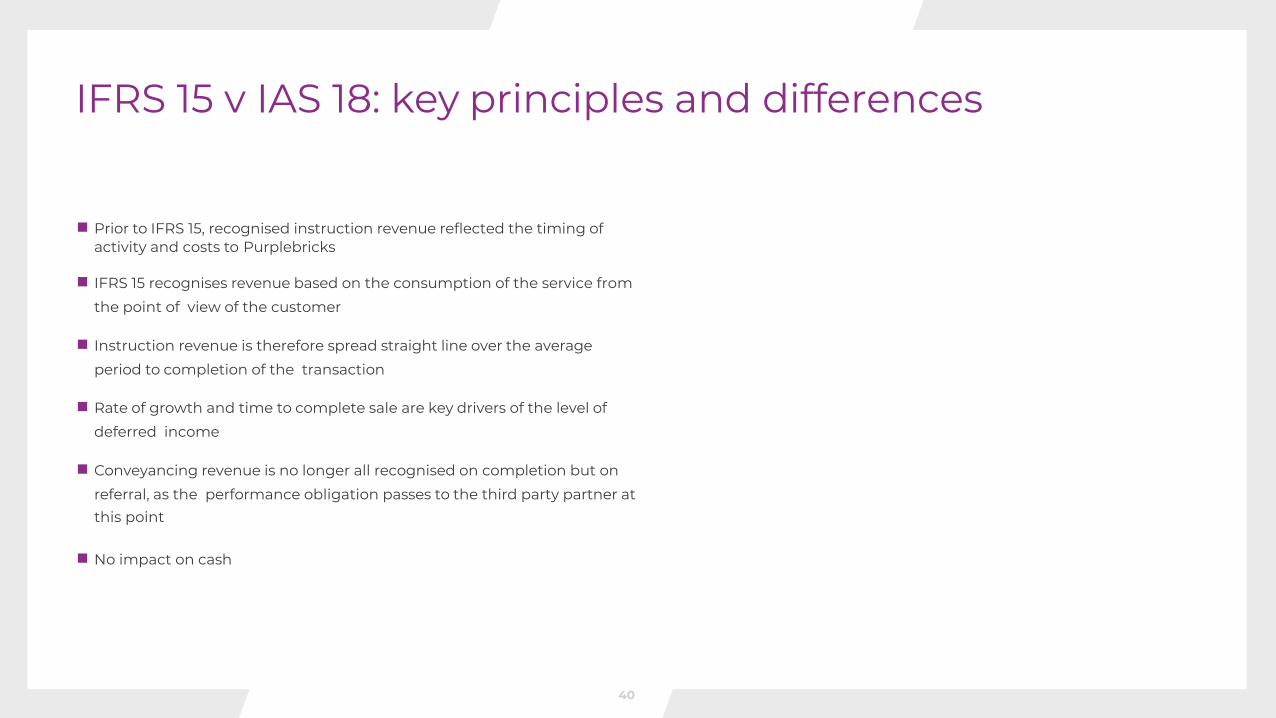
■ Prior to IFRS 15, recognised instruction revenue reflected the timing ofactivity and costs to Purplebricks
■ IFRS 15 recognises revenue based on the consumption of the service from
the point of view of the customer
■ Instruction revenue is therefore spread straight line over the average
period to completion of the transaction
■ Rate of growth and time to complete sale are key drivers of the level of
deferred income
■ Conveyancing revenue is no longer all recognised on completion but on
referral, as the performance obligation passes to the third party partner at this point
■ No impact on cash
IFRS 15 v IAS 18: key principles and differences
40
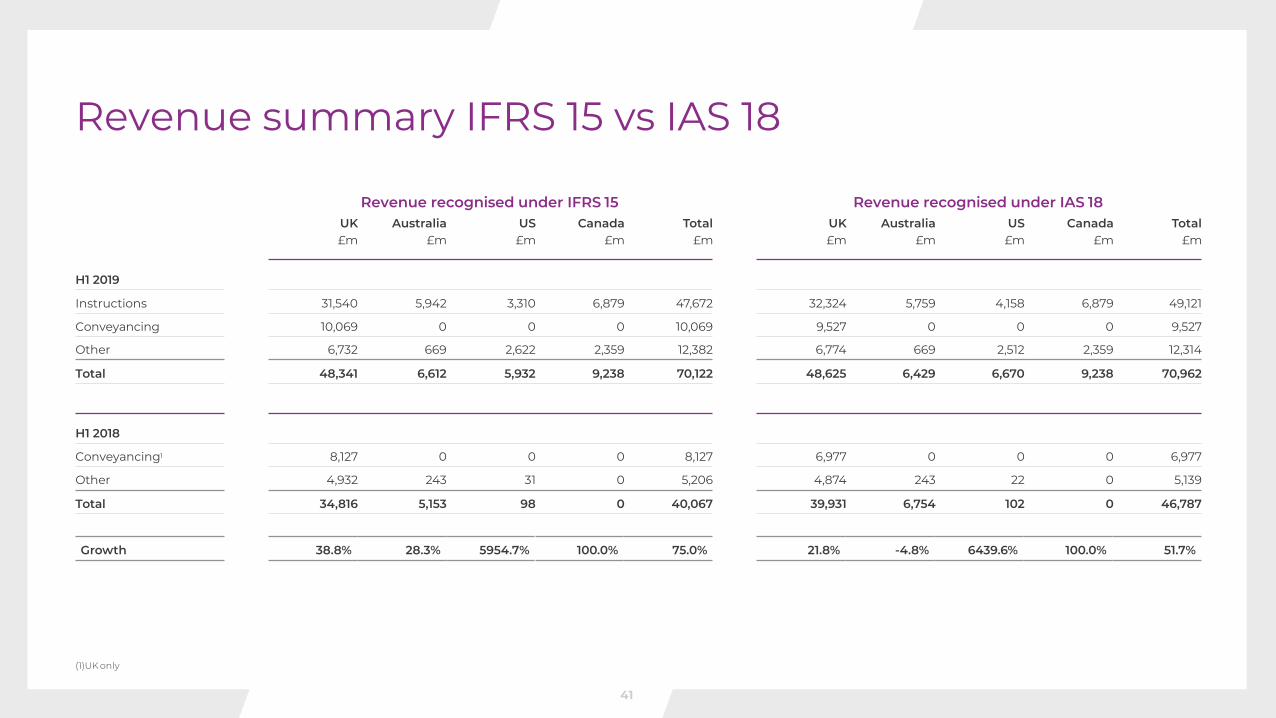
Revenue recognised under IFRS 15 Revenue recognised under IAS 18UK Australia US Canada Total UK Australia US Canada Total£m £m £m £m £m £m £m £m £m £m
H1 2019
Instructions 31,540 5,942 3,310 6,879 47,672 32,324 5,759 4,158 6,879 49,121
Conveyancing 10,069 0 0 0 10,069 9,527 0 0 0 9,527
Other 6,732 669 2,622 2,359 12,382 6,774 669 2,512 2,359 12,314
Total 48,341 6,612 5,932 9,238 70,122 48,625 6,429 6,670 9,238 70,962
H1 2018
Conveyancing1 8,127 0 0 0 8,127 6,977 0 0 0 6,977
Other 4,932 243 31 0 5,206 4,874 243 22 0 5,139
Total 34,816 5,153 98 0 40,067 39,931 6,754 102 0 46,787
Growth 38.8% 28.3% 5954.7% 100.0% 75.0% 21.8% -4.8% 6439.6% 100.0% 51.7%
(1)UKonly
Revenue summary IFRS 15 vs IAS 18
41
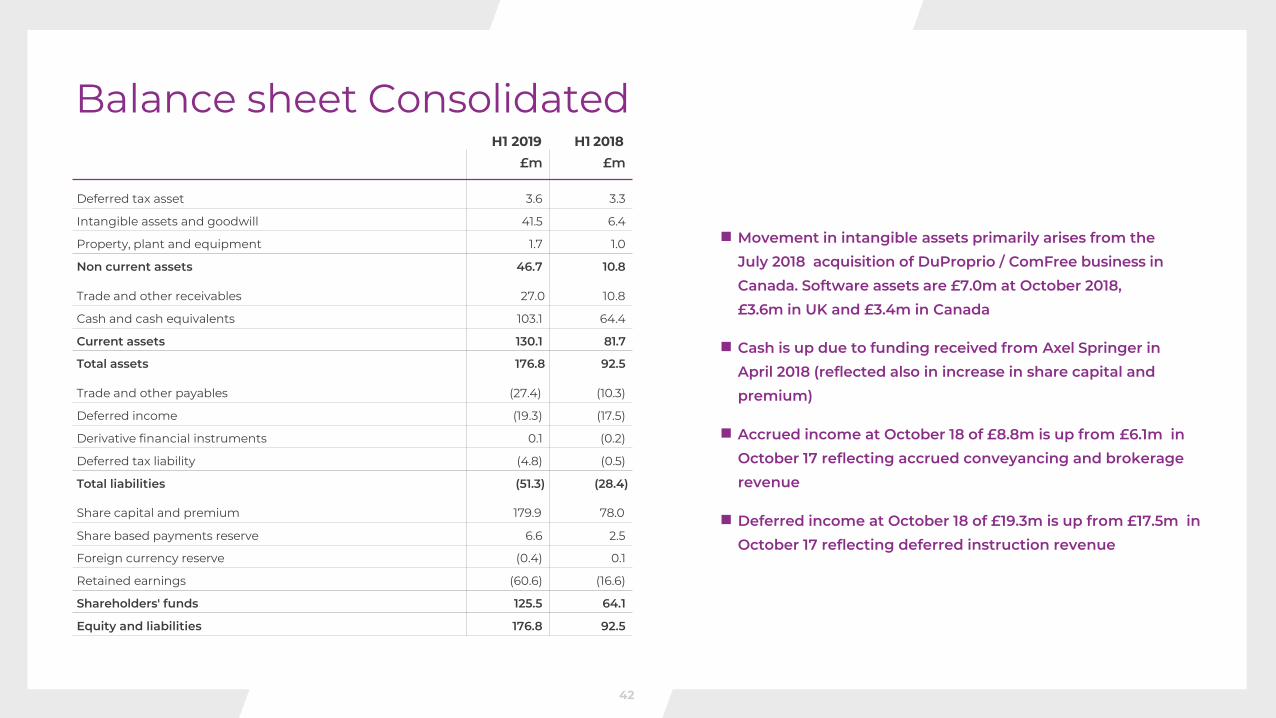
Balance sheet ConsolidatedH1 2019 H1 2018
£m £m
Deferred tax asset 3.6 3.3
Intangible assets and goodwill 41.5 6.4
Property, plant and equipment 1.7 1.0
Non current assets
Trade and other receivables
46.7
27.0
10.8
10.8
Cash and cash equivalents 103.1 64.4
Current assets 130.1 81.7
Total assets
Trade and other payables
176.8
(27.4)
92.5
(10.3)
Deferred income (19.3) (17.5)
Derivative financial instruments 0.1 (0.2)
Deferred tax liability (4.8) (0.5)
Total liabilities
Share capital and premium
(51.3)
179.9
(28.4)
78.0
Share based payments reserve 6.6 2.5
Foreign currency reserve (0.4) 0.1
Retained earnings (60.6) (16.6)
Shareholders' funds 125.5 64.1
Equity and liabilities 176.8 92.5
■ Movement in intangible assets primarily arises from the July 2018 acquisition of DuProprio / ComFree business in Canada. Software assets are £7.0m at October 2018, £3.6m in UK and £3.4m in Canada
■ Cash is up due to funding received from Axel Springer in April 2018 (reflected also in increase in share capital and premium)
■ Accrued income at October 18 of £8.8m is up from £6.1m in October 17 reflecting accrued conveyancing and brokerage revenue
■ Deferred income at October 18 of £19.3m is up from £17.5m in October 17 reflecting deferred instruction revenue
42
31
This Document comprises the written materials/slides for apresentation concerning Purplebricks Group Plc and its FY2019 Half Year Results.
By reviewing this presentation you agree to be bound by the conditions set out below.
No reliance may be placed for any purposes whatsoever on the information in this document or on its completeness. The presentation is intended to provide a general overview of the Company’s business and does not purport to deal with all aspects and details regarding the Company.Accordingly, neither the Company nor any of its respective directors, officers, employees or advisers nor any other person makes any representation or warranty, express or implied, as to, and accordingly no reliance may be placed on, the fairness, accuracy or completeness of the information contained in the presentation or of the views given or implied. Neither the Company nor any of its respective directors, officers, employees or advisers nor any other person shall have any liability whatsoever for any errors or omissions or any loss howsoever arising, directly or indirectly, from any use of this information or its contents or otherwise arising in connection therewith.
The information contained in this presentation is for background purposes only. The subject matter of the presentation may be subject to change and the Company
does not take any responsibility for updating or amending the contents to reflect such changes. The material contained in this presentation reflects current legislation and the business and financial affairs of the Company which are subject to change without notice and audit, and is subject to the provisions contained within legislation.
This presentation summarises information contained in the 2019 Full Year Results. Without prejudice to the generality of these conditions, this summary information, including any views given or implied, or any statement made, in relation to such information should not be relied upon, nor should it be treated as accurate or complete. This presentation and all such information contained herein should be read subject to the Interim Results.
The information contained in this presentation has been obtained from Company sources and from sources which the Company believes to be reliable but it has not independently verified such information and does not guarantee that it is accurate or complete.
No statement in this presentation is intended to be a profit forecast and no statement in this presentation should be interpreted to mean that earnings per Company share for current or future financial years would necessarily match or exceed the historical published earnings per Company share.
DisclaimerForward looking statement
Certain statements in this presentation regarding theCompany are or may be forward-looking statements. Theseforward-looking statements are neither historical facts orguarantees of future performance. Such statements arebased on current expectations and belief and, by theirnature, are subject to a number of known and unknownrisks and uncertainties which may and often do cause theactual results, prospects and developments of the Companyto differ materially from those expressed or implied by theseforward-looking statements.