source test report of the coker steam vent - us epa · source test report of the coker steam vent...
TRANSCRIPT

URS 40942073
Source Test Report of the
Coker Steam Vent
Prepared for:
Hovensa, L.L.C One Estate Hope, Christiansted
St. Croix, USVI 00820-5652
Prepared by:
URS Corporation 9400 Amberglen Boulevard (78729)
PO Box 201088 Austin, Texas 78720-1088
September 8, 2008

iii Source Test Report for the Coker Steam Vent
Table of Contents
Page
1.0 Introduction.................................................................................................................. 1-1 1.1 Test Objectives................................................................................................... 1-3 1.2 Summary of Results........................................................................................... 1-5 1.3 Coker Unit Description ...................................................................................... 1-7 1.4 Source Test Timing............................................................................................ 1-10 1.5 Pre-Survey and Source Test Chronology........................................................... 1-11 1.6 Report Organization........................................................................................... 1-14 1.7 Quality Assurance Summary ............................................................................. 1-15 2.0 Summary....................................................................................................................... 2-1 2.1 Process Operations............................................................................................. 2-1 2.2 Data Reduction Approach.................................................................................. 2-7 2.2.1 Venting Cycle Interval vs. Sampling Train Interval .............................. 2-7 2.2.2 Volumetric Flow Rate Database ............................................................ 2-7 2.2.3 Extrapolated Data................................................................................... 2-8 2.2.4 Pollutant Mass Emission Rates in Lbs/Cycle ........................................ 2-8 2.3 Source Test Results for Volumetric Flow Rates................................................ 2-8 2.4 Results for Speciated Volatile Organic Compound Emissions.......................... 2-25 2.4.1 Pre-Survey Results for Volatile Organic Compound Concentrations ... 2-25 2.4.2 Source Test Results for Methane, Ethane, Benzene and Toluene Concentrations ....................................................................................... 2-29 2.4.3 Source Test Results for Benzene and Toluene Mass Emission Rates ... 2-29 2.5 Source Test Results for Non-Methane/Non-Ethane Volatile Organic Compound Emissions ........................................................................................ 2-34 2.5.1 Source Test Results for Non-Methane/Non-Ethane Volatile Organic Compound Concentrations....................................................... 2-34 2.5.2 Source Test Results for Non-Methane/Non-Ethane Volatile Organic Compound Mass Emission Rates............................................. 2-34 2.6 Source Test Results for Semivolatile Organic Compound Emissions............... 2-38 2.6.1 Source Test Results for Semivolatile Organic Compound Concentrations ....................................................................................... 2-39 2.6.2 Source Test Results for Semivolatile Organic Compound Mass Emission Rates ............................................................................. 2-39 2.7 Source Test Results for Particulate Matter Emissions....................................... 2-97 2.7.1 Source Test Results for Particulate Matter Concentrations ................... 2-97 2.7.2 Source Test Results for Particulate Matter Mass Emission Rates ......... 2-97

iv Source Test Report for the Coker Steam Vent
Table of Contents (continued)
Page 3.0 Sampling and Analytical Procedures ......................................................................... 3-1 3.1 Coker Steam Vent 3 Sampling Locations.......................................................... 3-1 3.2 Speciated Volatile Organic Compound Concentrations by EPA Methods 5 and TO-14................................................................................ 3-3 3.2.1 Deviations from the Protocol................................................................. 3-7 3.3 Volumetric Flow Rate by EPA Methods 2, 3, and 4 ......................................... 3-7 3.3.1 Deviations from the Protocol................................................................. 3-9
3.4 Methane, Ethane, Benzene, and Toluene Concentrations by EPA Method 18 and Other Test Method 12 ................................................................................. 3-10 3.4.1 Deviations from the Protocol................................................................. 3-11 3.5 Total Volatile Organic Compound Concentration by EPA Method 25A and Other Test Method 12 ........................................................................................ 3-12 3.5.1 Low-Range THC Analyzer Calibration (THC1) ................................... 3-14 3.5.2 Mid-Range THC Analyzer Calibration (THC2) .................................... 3-14 3.5.3 High-Range THC Analyzer Calibration (THC4)................................... 3-15 3.5.4 Dilution Ratios and Method Detection Limits....................................... 3-16 3.5.5 Methane and Ethane Response Factors.................................................. 3-17 3.5.6 Deviations from the Protocol................................................................. 3-17 3.6 Non-Methane/Non-Ethane Volatile Organic Compound Concentration by EPA Methods 18 and 25A and Other Test Method 12 ...................................... 3-18 3.6.1 Deviations from the Protocol................................................................. 3-18 3.7 Semivolatile Organic Compound Concentrations by SW-846 Method 0010.... 3-18 3.7.1 Deviations from the Protocol................................................................. 3-19 3.8 Particulate Matter Concentrations by EPA Methods 5 and 202 ........................ 3-20 3.8.1 Deviations from the Protocol................................................................. 3-21 4.0 Calculations ................................................................................................................ 4-1 4.1 Vent Gas Dry Molecular Weight ....................................................................... 4-1 4.2 Vent Gas Velocity.............................................................................................. 4-2 4.3 Vent Gas Volumetric Flow Rate – Standard Conditions ................................... 4-2 4.4 Vent Gas Volumetric Flow Rate – Dry Standard Conditions............................ 4-3 4.5 Standard Dry Gas Meter Sample Volume ......................................................... 4-3 4.6 Concentration of Non-Methane/Non-Ethane Volatile Organic Compounds in the Vent Gas (Per Venting Cycle Interval).................................................... 4-4 4.7 Concentration of Particulate Matter and Selected Semivolatile Organic Compounds in the Vent Gas (Per Venting Cycle Interval)................................ 4-6 4.8 Mass Emission Rate of Pollutant (Per Venting Cycle Interval) ........................ 4-6 4.9 Mass Emission Rate of Pollutant (Per Cycle).................................................... 4-7

v Source Test Report for the Coker Steam Vent
Table of Contents (continued)
Page 5.0 Quality Assurance Objectives for Measurement Data ............................................. 5-1 5.1 Expected Deviations from the Protocol............................................................. 5-2 5.1.2 Isokinetic Sampling Criteria .................................................................. 5-3 5.2 Collection and Analysis of Vent Gas Samples for Speciated Volatile Organic Compound Concentrations (Pre-Survey) ............................... 5-4 5.3 Collection and Analysis of Vent Gas Samples for Methane, Ethane, Benzene, and Toluene Concentrations............................................................... 5-7 5.4 Collection and Analysis of Vent Gas Samples for Total Hydrocarbon Concentration..................................................................................................... 5-8 5.5 Collection of Vent Gas Samples for EPA Method 2/4, EPA Method 5/202, and SW-846 Method 0010 Analyses ................................................................. 5-9 5.6 Analysis of Vent Gas Samples for Selected Semivolatile Organic Compound Concentrations................................................................................. 5-12 5.7 Analysis of Vent Gas Samples for Particulate Matter Concentrations .............. 5-13
vi Source Test Report for the Coker Steam Vent
List of Appendices Volume 2
1-1 Project Correspondence
2-1 HOVENSA Coke Drum 3 Process Data 2-2 URS Instantaneous Volumetric Flow Rate Database 2-3 Laboratory Report – Analysis of Vent Gas Samples for Volatile Organic
Compounds (Pre-Survey)
Volume 3
2-4 URS Gas Chromatograph Raw Data 2-5 URS THC Analyzer Raw Data 2-6 Tentatively Identified Compound Emissions Data 2-7 Laboratory Report – Analysis of Vent Gas Samples for Semivolatile Organic
Compounds Volume 4
2-7 (continued) Laboratory Report – Analysis of Vent Gas Samples for Semivolatile Organic Compounds
Volume 5
2-7 (continued) Laboratory Report – Analysis of Vent Gas Samples for Semivolatile Organic Compounds
Volume 6
2-8 Laboratory Report – Analysis of Vent Gas Samples for Particulate Matter
3-1 URS Field Sample Logbook 3-2 URS Pre-Survey Sampling Train Data Sheets 3-3 URS EPA Method 2/4 Sampling Train Data Sheets 3-4 URS EPA Method 5/202 Sampling Train Data Sheets 3-5 SW-846 Method 0010 Sampling Train Data Sheets 3-6 URS Sampling Equipment Calibration Information 3-7 URS Gas Chromatograph Calibration Data 3-8 URS THC Analyzer Calibration Data
4-1 URS Example Calculations

vii Source Test Report for the Coker Steam Vent
List of Appendices (continued) Volume 6 (continued)
5-1 Data Quality Assessment for Volatile Organic Compounds in the Vent Gas – Pre-Survey Condensate Samples 5-2 Data Quality Assessment for Volatile Organic Compounds in the Vent Gas – Pre-Survey Canister Samples 5-3 Data Quality Assessment for Methane, Ethane, Benzene and Toluene in Vent Gas 5-4 Data Quality Assessment for Total Hydrocarbons in Vent Gas 5-5 Data Quality Assessment for the Collection of Vent Gas Samples for EPA Method
2/4, EPA Method 5/202, and SW-846 Method 0010 Analyses 5-6 Data Quality Assessment for Semivolatile Organic Compounds in the Vent Gas 5-7 Data Quality Assessment for Particulate Matter in the Vent Gas 5-8 URS Chain-of-Custody Forms

viii Source Test Report for the Coker Steam Vent
List of Tables
Page
1-1 Test Information............................................................................................................. 1-4 1-2 Coke Drum 3 – Operating Information.......................................................................... 1-5 1-3 Coke Drum 3 – Process Data Recorded at Venting Cycle Activation........................... 1-6 1-4 Pollutant Mass Emission Rate Results Summary for the Source Test of Coker Steam Vent 3 – Pounds per Cycle....................................................................... 1-6 1-5 Pollutant Mass Emission Rate Results Summary for the Source Test of Coker Steam Vent 3 – Tons per Year ............................................................................ 1-7 1-6 Source Test Venting Cycle Duration ............................................................................. 1-11 1-7 Pre-Survey Chronology ................................................................................................. 1-11 1-8 Source Test Chronology – Run 1................................................................................... 1-12 1-9 Source Test Chronology – Run 2................................................................................... 1-12 1-10 Source Test Chronology – Run 3................................................................................... 1-13 1-11 Source Test Chronology – Run 4................................................................................... 1-13 1-12 Quality Assurance Summary – Pre-Survey ................................................................... 1-16 1-13 Quality Assurance Summary – Run 1............................................................................ 1-17 1-14 Quality Assurance Summary – Run 2............................................................................ 1-18 1-15 Quality Assurance Summary – Run 3............................................................................ 1-19 1-16 Quality Assurance Summary – Run 4............................................................................ 1-20 2-1 Coke Drum 3 – Production Summary............................................................................ 2-1 2-2 Coke Drum 3 – Batch Process Durations ...................................................................... 2-2 2-3 Average Vent Gas (Wet) Molecular Weight Results..................................................... 2-10 2-4 Average Dry Vent Gas Volumetric Flow Rate Results Per Venting Cycle Interval – Run 1.............................................................................................................................. 2-10 2-5 Average Dry Vent Gas Volumetric Flow Rate Results Per Venting Cycle Interval – Run 2.............................................................................................................................. 2-13 2-6 Average Dry Vent Gas Volumetric Flow Rate Results Per Venting Cycle Interval – Run 3.............................................................................................................................. 2-17 2-7 Average Dry Vent Gas Volumetric Flow Rate Results Per Venting Cycle Interval – Run 4.............................................................................................................................. 2-21 2-8 Pre-Survey Results for Volatile Organic Compound Concentrations ........................... 2-26 2-9 Pre-Survey Results for Volatile Organic Compound Concentrations (Tentatively Identified Compounds).............................................................................. 2-27 2-10 Pre-Survey Results for Methane and Ethane Concentrations ........................................ 2-28

ix Source Test Report for the Coker Steam Vent
List of Tables (continued)
Page 2-11 Source Test Results for Benzene, Toluene, Methane, and Ethane Concentrations ....... 2-30 2-12 Source Test Results for C3 through C6 Concentrations ................................................. 2-31 2-13 Source Test Results for Benzene Mass Emission Rates ................................................ 2-32 2-14 Source Test Results for Toluene Mass Emission Rates................................................. 2-33 2-15 Source Test Results for Non-Methane/Non-Ethane Volatile Organic Compound
Concentrations ............................................................................................................... 2-36 2-16 Source Test Results for Non-Methane/Non-Ethane Volatile Organic Compound Mass Emission Rates ..................................................................................................... 2-37 2-17 SW-846 Method 0010 Sampling Train Data ................................................................. 2-40 2-18 SW-846 Method 0010 Sampling Train A Concentration Results – Run 1.................... 2-41 2-19 SW-846 Method 0010 Sampling Train B Concentration Results – Run 1 .................... 2-44 2-20 SW-846 Method 0010 Sampling Train C Concentration Results – Run 1 .................... 2-47
2-21 SW-846 Method 0010 Sampling Train A Concentration Results – Run 2.................... 2-50 2-22 SW-846 Method 0010 Sampling Train B Concentration Results – Run 2 .................... 2-53 2-23 SW-846 Method 0010 Sampling Train C Concentration Results – Run 2 .................... 2-56 2-24 SW-846 Method 0010 Sampling Train A Concentration Results – Run 3.................... 2-59 2-25 SW-846 Method 0010 Sampling Train C Concentration Results – Run 3 .................... 2-62 2-26 SW-846 Method 0010 Sampling Train D Concentration Results – Run 3.................... 2-65 2-27 SW-846 Method 0010 Sampling Train A Concentration Results – Run 4.................... 2-68 2-28 SW-846 Method 0010 Sampling Train B Concentration Results – Run 4 .................... 2-71 2-29 SW-846 Method 0010 Sampling Train C Concentration Results – Run 4 .................... 2-74 2-30 SW-846 Method 0010 Sampling Train A Mass Emission Rate Results – Run 1.......... 2-77 2-31 SW-846 Method 0010 Sampling Train B Mass Emission Rate Results – Run 1 .......... 2-78 2-32 SW-846 Method 0010 Sampling Train C Mass Emission Rate Results – Run 1 .......... 2-79 2-33 SW-846 Method 0010 Extrapolated Mass Emission Rate Results – Run 1 .................. 2-80 2-34 SW-846 Method 0010 Total SVOC Mass Emission Rate Results – Run 1................... 2-81 2-35 SW-846 Method 0010 Sampling Train A Mass Emission Rate Results – Run 2.......... 2-82 2-36 SW-846 Method 0010 Sampling Train B Mass Emission Rate Results – Run 2 .......... 2-83 2-37 SW-846 Method 0010 Sampling Train C Mass Emission Rate Results – Run 2 .......... 2-84 2-38 SW-846 Method 0010 Extrapolated Mass Emission Rate Results – Run 2 .................. 2-85 2-39 SW-846 Method 0010 Total SVOC Mass Emission Rate Results – Run 2................... 2-86 2-40 SW-846 Method 0010 Sampling Train A Mass Emission Rate Results – Run 3.......... 2-87

x Source Test Report for the Coker Steam Vent
List of Tables (continued)
Page 2-41 SW-846 Method 0010 Sampling Train B Mass Emission Rate Results – Run 3 .......... 2-88 2-42 SW-846 Method 0010 Sampling Train C Mass Emission Rate Results – Run 3 .......... 2-89 2-43 SW-846 Method 0010 Extrapolated Mass Emission Rate Results – Run 3 .................. 2-90 2-44 SW-846 Method 0010 Total SVOC Mass Emission Rate Results – Run 3................... 2-91 2-45 SW-846 Method 0010 Sampling Train A Mass Emission Rate Results – Run 4.......... 2-92 2-46 SW-846 Method 0010 Sampling Train B Mass Emission Rate Results – Run 4 .......... 2-93 2-47 SW-846 Method 0010 Sampling Train C Mass Emission Rate Results – Run 4 .......... 2-94 2-48 SW-846 Method 0010 Extrapolated Mass Emission Rate Results – Run 4 .................. 2-95 2-49 SW-846 Method 0010 Total SVOC Mass Emission Rate Results – Run 4................... 2-96 2-50 EPA Method 5/202 Sampling Train Data...................................................................... 2-98 2-51 Source Test Results for Particulate Matter Concentrations – Run 1 ............................. 2-99 2-52 Source Test Results for Particulate Matter Concentrations – Run 2 ............................. 2-99 2-53 Source Test Results for Particulate Matter Concentrations – Run 3 ............................. 2-100 2-54 Source Test Results for Particulate Matter Concentrations – Run 4 ............................. 2-100 2-55 Source Test Results for Particulate Matter Mass Emission Rate – Run 1 ..................... 2-101 2-56 Source Test Results for Particulate Matter Mass Emission Rate – Run 2 ..................... 2-101 2-57 Source Test Results for Particulate Matter Mass Emission Rate – Run 3 ..................... 2-102 2-58 Source Test Results for Particulate Matter Mass Emission Rate – Run 4 ..................... 2-102 3-1 Summary of Sampling and Analytical Methods............................................................ 3-2 3-2 List of Pre-Survey Volatile Organic Compound Analytes for EPA Method TO-14..... 3-5 3-3 List of Pre-Survey Volatile Organic Compound Analytes for SW-846 Method 8260B ................................................................................................. 3-6 3-4 EPA Method 18 Analyte Detection Limits.................................................................... 3-11 3-5 THC Analyzer Calibration Summary ............................................................................ 3-13 3-6 Methane and Ethane Response Factors.......................................................................... 3-17 5-1 Pre-Survey Field Blank Results – Canister Samples ..................................................... 5-6 5-2 Pre-Survey Field Blank Results – Condensate Samples................................................ 5-6 5-3 Proportion of Valid Data Points for the Volumetric Flow Rate Database..................... 5-11

xi Source Test Report for the Coker Steam Vent
List of Figures
Page 1-1 Activated Coker Steam Vent ......................................................................................... 1-8 1-2 Coker Process Flow Diagram ........................................................................................ 1-9 2-1 Coke Drum 3 Pressure Data – Run 1 ............................................................................. 2-3 2-2 Coke Drum 3 Pressure Data – Run 2 ............................................................................. 2-4 2-3 Coke Drum 3 Pressure Data – Run 3 ............................................................................. 2-5 2-4 Coke Drum 3 Pressure Data – Run 4 ............................................................................. 2-6 2-5 EPA Method 5/202 Wet Vent Gas Volumetric Flow Rate vs. Elapsed Time – Run 1.............................................................................................................................. 2-11 2-6 SW-846 Method 0010 Wet Vent Gas Volumetric Flow Rate vs. Elapsed Time – Run 1.............................................................................................................................. 2-12 2-7 EPA Method 5/202 Wet Vent Gas Volumetric Flow Rate vs. Elapsed Time – Run 2.............................................................................................................................. 2-14 2-8 SW-846 Method 0010 Wet Vent Gas Volumetric Flow Rate vs. Elapsed Time – Run 2.............................................................................................................................. 2-15 2-9 EPA Method 2/4 Wet Vent Gas Volumetric Flow Rate vs. Elapsed Time – Run 2.............................................................................................................................. 2-16 2-10 EPA Method 5/202 Wet Vent Gas Volumetric Flow Rate vs. Elapsed Time – Run 3.............................................................................................................................. 2-18 2-11 SW-846 Method 0010 Wet Vent Gas Volumetric Flow Rate vs. Elapsed Time – Run 3.............................................................................................................................. 2-19 2-12 EPA Method 2/4 Wet Vent Gas Volumetric Flow Rate vs. Elapsed Time – Run 3.............................................................................................................................. 2-20 2-13 EPA Method 5/202 Wet Vent Gas Volumetric Flow Rate vs. Elapsed Time – Run 4.............................................................................................................................. 2-22 2-14 SW-846 Method 0010 Wet Vent Gas Volumetric Flow Rate vs. Elapsed Time – Run 4.............................................................................................................................. 2-23 2-15 EPA Method 2/4 Wet Vent Gas Volumetric Flow Rate vs. Elapsed Time – Run 4.............................................................................................................................. 2-24 2-16 EPA Method 25A/OTM12 Total VOC Concentration vs. Elapsed Time ..................... 2-35 3-1 Coker Steam Vent 3 Sampling Location Diagram ........................................................ 3-2

1-1 Source Test Report for the Coker Steam Vent
1.0 Introduction
Hovensa, L.L.C., is a joint venture between a subsidiary of Hess Corporation and a subsidiary of Petroleos de Venezuela, S.A. (PDVSA). Hovensa operates a petroleum refinery in the south-central Estate Hope region of St. Croix, which is located in the United States Virgin Islands (USVI). The facility is one of the most recently constructed refineries in the United States and, with crude oil processing capacity of over 500,000 barrels per day (bpd), is one of the largest in the western hemisphere. The refinery is strategically located to serve gasoline and heating oil markets in both the United States Gulf Coast and along the eastern seaboard, providing a ready market for finished products. The refinery is capable of receiving and processing crudes from all over the world, although a majority of crude is currently supplied from Venezuela.
The refinery operates a Delayed Coker Unit (Coker) that was commissioned in August
2002. The Coker allows for the manufacture of gasoline and heating oil using lower cost heavy crudes.
In September 2007, Hovensa received an emailed communication from the
Environmental Protection Agency (EPA), Office of Enforcement and Compliance Assurance, requesting that Hovensa submit a Source Test Protocol to conduct source testing of the coke drum steam vents (Coker Steam Vents) which are used to depressurize the coke drums to atmosphere as part of routine Coker operation. EPA specifically requested the following testing methodology:
Submit a Protocol for conducting a source test to measure flow, moisture content, particulate matter (PM), non-methane and non-ethane volatile organic compounds, and benzene from the coker drum steam vents for each drum during normal representative operating conditions. The source test shall be conducted as follows: a. Test Methods 1,2,3 and 5 of 40 CFR Part 60 Appendix A and Test Method 202 of
40 CFR Part 51 Appendix M (including a nitrogen purge) shall be used to determine the flow, moisture and concentration and mass emission rate of particulate matter;
b. The Test Method 5 results shall separately report both front-half and back-half catch results with specific attention paid to collecting and analyzing condensed particulate matter in the sampling train;
c. Test Method 18 shall be used to determine the concentration of all major components as determined by a pre-survey that shall include at least methane, ethane, toluene and benzene and the concentration of dissolved VOCs that may be collected in the impinger sampling train or condensate collection device;

1-2 Source Test Report for the Coker Steam Vent
d. Test Method 25A of 40 CFR Part 60 Appendix A shall be used in combination with Methods 1,2,3, and 18 and the dilution methods of Other Test Method 12 (www.epa.gov/ttn/emc/prelim.html) to determine the concentration and mass emission rate of non-methane/non-ethane organic compounds;
e. Four complete venting cycles shall be tested for each pollutant with each cycle being reported as a separate run;
f. Each drum shall be separately tested for each pollutant; g. All steam vents on a given drum shall be tested simultaneously for a given
pollutant (e.g., for Drum A test both vents A-1 and A-2 simultaneously for non-methane/non-ethane organic compounds and then again test both vents A-1 and A-2 simultaneously for particulate matter);
h. Process parameters shall be recorded as frequently as is feasible but in no event less than every 15 minutes for each run and shall include the process parameters described in [Item 1 of the letter referenced above]; and
i. All changes to methodology from the above prescribed methods and requirements shall be specifically reported in a separate section of the protocol and specifically approved in advance. All changes to methodology not planned and approved shall be specifically identified in a separate section of the test report.
As part of the test protocol, provide operating conditions under which measurements shall be made and for which emission measurements shall be representative of normal operation of the coker. Define the ranges of the values of each operating parameter listed in [Item 1 of the letter referenced above] that are representative of normal operation. List all operating parameters that will be monitored and recorded during the test and describe how each parameter will be monitored and recorded. The source test protocol should be organized in accordance with Attachment I. EPA also requested, in subsequent communication to a similar facility, that SW-846
Method 0010 be performed to measure semi-volatile organic compounds (SVOCs) in the Coker Steam Vent emissions in addition to the testing described above1. Testing Project Timeline HOVENSA engaged URS Corporation (URS) of Austin, Texas to prepare a Source Test Protocol for the Coker Steam Vent (Protocol) in a manner consistent with EPA’s requests. The Protocol was submitted to EPA on February 29, 2008, and discussed several necessary deviations from the specifications in the 2007 Section 114 Request to accomplish this very complex measurement program. The reference test methods requested by EPA to be used as the basis for the quantification of the selected pollutants were primarily developed for use on combustion source gases exiting a stack or vent. The extremely high moisture content (>98%) and high velocity (over 600 ft/sec, or 400 mph) of the vent gas stream, the amount of target analyte present in the vent gas stream, the dynamic nature of the vent stream characteristics,
1 EPA letter of January 18, 2008 Re: Citgo Refining and Chemical’s Company Response to October 9, 2007 Section 114 Request
for Information.

1-3 Source Test Report for the Coker Steam Vent
and the batch nature of the coking process made the implementation of the EPA reference test methods, as written, impossible. HOVENSA received EPA’s comments on the Protocol on March 11, 2008, and information supplemental to the Protocol was provided to EPA on March 18, 2008. EPA gave conditional approval of the Protocol in a letter dated March 21, 2008. Copies of correspondence related to the source testing of the Coker Steam Vent are provided in Appendix 1-1. URS conducted two separate test programs according to the Protocol. Pre-Survey gas samples were collected from three (3) separate venting cycles of Coker Steam Vent 3 on April 2 through April 5, 2008, to quantify selected VOCs for potential speciation (i.e., the Pre-Survey) during the subsequent source testing. HOVENSA reported Pre-Survey summary results to EPA on May 5, 2008. URS then mobilized to the site on May 28, 2008, and testing was performed on four separate venting cycles of Coker Steam Vent 3 from June 3 through June 8, 2008 (i.e., the Source Test). Test America Laboratories of Knoxville, TN, was contracted for all off-site sample analyses. General information regarding the testing at Coker Steam Vent 3 is summarized in Table 1-1. 1.1 Test Objectives The EPA Method 18 Pre-Survey of Coker Steam Vent 3 was designed to quantify the emissions of selected VOCs for potential speciation during the Source Test. The Source Test of Coker Steam Vent 3 was designed to quantify the emissions of the following pollutants per EPA’s request:
• Methane, ethane, benzene, and toluene2; • Non-methane/non-ethane volatile organic compounds (NMNE VOCs); • Semivolatile organic compounds (SVOCs); and • Particulate matter (PM).
The approach for accomplishing the Pre-Survey objective was to complete testing during at least one venting cycle for selected VOCs. The approach for accomplishing the Source Test objectives was to complete testing during four separate and complete venting cycles for each pollutant parameter of interest. A comprehensive description of all test methodology is presented in the Protocol.
2 As previously described in the HOVENSA letter to EPA of May 5, 2008, the Pre-Survey determined that no VOCs were present in the Coker Steam Vent 3 gas stream in excess of 100 ppmw (i.e., the agreed upon, via Protocol approval, trigger for speciation during the Source Test). Therefore, no VOCs were required to be speciated during the Source Test other than methane, ethane, benzene, *and toluene.

1-4 Source Test Report for the Coker Steam Vent
Table 1-1. Test Information
Facility Name HOVENSA, L.L.C Refinery Contact Person(s) Kathleen Antoine – Environmental Department Manager
Phil May – EPA Liaison (RTP Environmental) Robert Bivens – Field Test Coordinator (RMB Consulting)
Telephone Number 340-692-3774 Facility Address 1 Estate Hope, Christiansted, St. Croix, USVI, 00820-5652 Types of Process Sampled Coker Steam Vent 3 Gas Stream Person Responsible for Conducting Test George Lipinski Telephone Number 512-454-4797 Testing Company Name URS Corporation Testing Company Address 9400 Amberglen Boulevard
Austin, Texas 78729 Persons Conducting Pre-Survey Chris Weber
Carl Galloway Persons Conducting Source Test George Lipinski
Gene Youngerman Chris Weber Kevin McGinn Carl Galloway Meggen DeLollis Derek Ballek Steven Hall Nathan Reichardt
Modified1 Test Methods Performed Modified EPA Methods 2, 3, and 4 Modified EPA Methods 5 and 202 Modified EPA Method 18 Modified EPA Method 25A Modified Other Test Method 12 Modified SW-846 Method 0010
Dates of Testing April 2-5, 2008 and June 3-8, 2008 1 The Protocol described the modified sampling and analytical methodologies used to conduct the Pre-Survey and
Source Test of Coker Steam Vent 3. The Protocol was submitted to EPA on February 29. 2008 and conditionally approved on March 21, 2008.
Per EPA’s request, the Source Test was also designed to record the following process operating parameters while emission’s testing was performed:
• Coker feed rate in barrels per day (bpd); • Coke produced in tons per day from the tested drum (tpd); • Number of batches per day; • Coke produced per batch for the tested drum in tons per batch; • Duration of steam out to fractionator per batch for the tested drum in hours; • Duration of blowdown to wet gas compressor system; • Duration of quench water fill time per batch for the tested drum in hours; • Duration of quench water drain time per batch for the tested drum in hours;

1-5 Source Test Report for the Coker Steam Vent
• Duration of venting per batch for the tested drum in hours; • Duration of coke cutting for the tested drum in hours; • Duration of drum cycle for the tested drum in hours; • Number of cycles per day for the tested drum; • Drum pressure for the tested drum at the moment venting begins in pounds per square
inch (psi); • Drum pressure for the tested drum throughout each test run in pounds per square inch
(psi); and • Coke drum outage (fill distance from top) for the tested drum in feet.
1.2 Summary of Results The Coker was operated under normal conditions while all source testing was performed. Tables 1-2 and 1-3 present summaries of the Coke Drum 3 process data recorded during the Source Test. Additional process data is discussed in Section 2.1. Tables 1-4 and 1-5 present summaries of the mass emission rates of benzene, toluene, NMNE VOCs, SVOCs and PM quantified during the Source Test for each of the four complete venting cycles of Coker Steam Vent 3. The testing of a complete venting cycle is designated in this report as a “Run.” The pollutant mass emission rates are reported in Table 1-4 as units of mass per complete venting cycle (lbs/cycle). This project-specific reporting convention is discussed in Section 2.2. Table 1-5 presents pollutant mass emission rates as tons per year (tpy) based on a nominal frequency of 219 venting cycles per year for Coker Steam Vent 3 (i.e., 40-hour cycles for a given drum over the course of a year). Pre-Survey test results are presented in Section 2.3.
Table 1-2. Coke Drum 3 – Operating Information
Coke Drum 3 Duration of Batch Process (hours)1 40 Duration of Operating Cycle (hours) 20 Batches/Cycles per Day 0.6 Batches/Cycles per Year 219 Average Coke Production (tons per batch) 1,676 Average Coke Production (tons per day) 1,006 Average Coke Production (tons per year) 367,044
1 The duration of the batch process (40 hours) corresponds to the amount of time between each venting “event” on Coker Steam Vent 3.

1-6 Source Test Report for the Coker Steam Vent
Table 1-3. Coke Drum 3 – Process Data Recorded at Venting Cycle Activation
Overhead Receiver Pressure
(psig)
Fractionator Top Pressure
(psig)
Coke Drum 3 Pressure1
(psig)
Coke Drum 3 Pressure1
(psig) Date
PI-1308 PI-1168 PI-3960 PI-3961 Run 1 6/3/2008 4.38 12.0 7.51 7.89 Run 2 6/4-5/2008 4.45 12.4 8.67 8.89 Run 3 6/6/2008 4.64 11.8 7.57 7.25 Run 4 6/8/2008 4.53 11.8 6.86 7.18
1 Coke Drum 3 pressure was recorded by two separate, redundant instruments.
Table 1-4. Pollutant Mass Emission Rate Results Summary for the Source Test of Coker Steam Vent 3 – Pounds per Cycle1
Date
Benzene Mass
Emission Rate2
(lbs/cycle)
Toluene Mass
Emission Rate2
(lbs/cycle)
NMNE VOC Mass
Emission Rate
(lbs/cycle)
SVOC Mass
Emission Rate
(lbs/cycle)
PM Mass
EmissionRate
(lbs/cycle)
Run 1 6/3/2008 <17.3 <19.8 165 9.27 72.5
Run 2 6/4-5/2008 <10.6 <13.7 354 10.2 95.8
Run 3 6/6/2008 <6.90 <7.89 73.4 2.27 30.7
Run 4 6/8/2008 <9.03 <10.5 120 4.00 47.4
Average - <11.0 <13.0 178 6.44 61.6
1 Pounds per cycle equals pounds per venting “event”. These data include both the measured and any extrapolated data.
2 All mass emission rate values preceded by a “<” reflect pollutant concentrations measured below the applicable method detection limits.

1-7 Source Test Report for the Coker Steam Vent
Table 1-5. Pollutant Mass Emission Rate Results Summary for the Source Test of Coker Steam Vent 3 – Tons per Year
Date
Benzene Mass
Emission Rate1 (tpy)
Toluene Mass
Emission Rate1 (tpy)
NMNE VOC Mass Emission
Rate (tpy)
Total SVOC Mass
Emission Rate (tpy)
PM Mass
EmissionRate (tpy)
Run 1 6/3/2008 <1.89 <2.17 18.1 1.01 7.94
Run 2 6/4-5/2008 <1.17 <1.50 38.7 1.12 10.5
Run 3 6/6/2008 <0.756 <0.864 8.04 0.248 3.36
Run 4 6/8/2008 <0.989 <1.15 13.2 0.438 5.19
Average - <1.20 <1.42 19.5 0.705 6.75
1 All mass emission rate values preceded by a “<” reflect pollutant concentrations measured below the applicable method detection limits.
1.3 Coker Unit Description
The HOVENSA Coker became operational in 2002 and underwent a major equipment and process turn-around from May to June 2007. The Coker is equipped with two process heaters (Heater A and Heater B). These units are limited to combusting fuel gas or propane. Each of the two process heaters has two coke drums and each of the four coke drums has a dedicated steam depressurization vent. The Coker’s four coke drums are designated in this document as Coker Drums 1-43. The dedicated steam depressurization vents are designated as Coker Steam Vents 1-4.
The Coker converts, via thermal cracking, residual oil (pitch) from Vacuum Units 1 and 3
into gas oil that can be made into light products, weak fuel gases, naphtha, and petroleum (pet) coke. The volatile constituents of the cracked product are driven off by baking at a high temperature (935°F) in a coke drum while the fixed carbon and residual ash are fused together. The coke drum effluent is directed out the top of the drum to a fractionation column. Solid pet coke is deposited in the drum in a porous structure that allows flow through the pores. After a coke drum is full of solidified pet coke, its contents are first steamed to further recover any remaining volatile hydrocarbon content (i.e., products) from the coke, and the coke drum contents are then water-quenched to lower the temperature. The top and bottom heads of the full coke drum are then removed, and the pet coke is subsequently ‘cut’ from the coke drum with high-pressure water nozzles situated on a rotating cutter, which is inserted into the top of the drum.
3 Heater A is associated with Coke Drums 1 and 2. Heater B is associated with Coke Drums 3 and 4.

1-8 Source Test Report for the Coker Steam Vent
Following the water quench and prior to the removal of the coke drum’s top and bottom heads to allow for the removal (i.e., cutting) process, the Coker Steam Vent (a 12-inch pipe) on top of a given coke drum activates and depressurizes the coke drum to atmosphere. The Coker Steam Vent also remains open during coke cutting. The entire Coker operates in a continuous series of cycles where one coke drum on a given process heater is quenched and cut while the second coke drum on the heater is filled, and vice versa. The two process heaters on the Coker operate independently.
All four coke drums are identical and operated in the same manner with the same
feedstock. HOVENSA proposed in the Protocol that the emissions from all four coke drums are identical. Subsequently, the source testing was performed on Coker Steam Vent 3 only, located on Coke Drum 3, Heater B. A picture of an activated Coker Steam Vent is shown in Figure 1-1. A process flow diagram of the Coker is presented as Figure 1-2.
Figure 1-1. Activated Coker Steam Vent1
1 Coker Steam Vent 2, located on Coke Drum 2, is shown in this photograph.

1-9 Source Test Report for the Coker Steam Vent
Figure 1-2. Coker Process Flow Diagram

1-10 Source Test Report for the Coker Steam Vent
1.4 Source Test Timing The Coker Steam Vents are each comprised of a single 12-inch pipe on each of the four
coke drums, which vent gas from the coke drum vessel to atmosphere during a typical quench vent release event. A “complete venting cycle” is defined as the period between the activation of the Coker Steam Vent and the “optimal depressurization” of the coke drum that is necessary before the coke-cutting process can begin. The “optimal depressurization” is defined as the operating condition at which the coke drum is considered ready to initiate the coke-cutting procedure (i.e., the point at which a large flange on the top of the coke drum is removed immediately prior to the insertion of the cutting lance into the coke drum), and was contingent upon the following operating parameters:
• Coke bed temperature; • Coker quench water quota; and • Coke drum pressure. This condition of optimal depressurization (i.e., end point) was determined on a test run-
by-test run basis to ensure that the data collected would most accurately reflect actual operating conditions. The duration of each venting cycle was dependent upon the batch process operation of the Coker.
For the purposes of the Source Test, the sampling approach was directed at collecting samples during the first 120 minutes after Coker Steam Vent 3 activation, although data was collected over a longer period of time for all four test runs. The project-specific Health and Safety Plan (HASP) dictated that sampling personnel end sampling activities and begin moving off of the Coker prior to the removal of the top head from Coke Drum 3. All of the venting cycles sampled during the Source Test continued beyond 120 minutes, and efforts were made to continue sample collection over an extended time period for as long as the sampling equipment remained operable within acceptable performance ranges and until health and safety limitations were encountered. Table 1-6 presents the durations of each of the four venting cycles tested during the Source Test. In all cases, the venting cycle duration was contingent upon the final Coke Drum 3 pressure reaching a measured value of 0.00 psig. This pressure data was recorded by two separate, redundant instruments.

1-11 Source Test Report for the Coker Steam Vent
Table 1-6. Source Test Venting Cycle Duration
Date
Time of Venting
Cycle Activation
Initial Coke Drum 3
Pressure1 (psig)
Final Coke Drum 3
Pressure2 (psig)
Time of Optimal Drum
Depressurization
Venting Cycle
Duration (min)
Run 1 6/3/2008 600 7.89 0.00 1018 258
Run 2 6/4-5/2008 2235 8.89 0.00 130 175
Run 3 6/6/2008 1408 7.57 0.00 16153 142
Run 4 6/8/2008 632 7.18 0.00 926 174
1 The initial Coke Drum 3 pressure data is based upon the highest initial pressure recorded by either of the PI-3960 or PI-3961 redundant pressure indicators at the time of venting cycle activation.
2 The final Coke Drum 3 pressure data is based upon the time when both redundant pressure indicators recorded values of 0.00 psig.
3 The sampling of Coker Steam Vent 3 continued until 1630 during Run 3, fifteen (15) minutes past the time of optimal drum depressurization. The venting cycle duration was extended to incorporate this additional sampling duration for the development of all pollutant mass emission rates.
1.5 Pre-Survey and Source Test Chronology The EPA Method 18 Pre-Survey of Coker Steam Vent 3 was conducted from April 2 to April 5, 2008. Three separate venting cycles, designated as Runs A, B, and C, were tested for the purpose of identifying target VOC analytes for future emissions testing using EPA Method 18. Table 1-7 provides a summary of the dates and times for each test run on the Coker Steam Vent 3 gas stream during the Pre-Survey.
Table 1-7. Pre-Survey Chronology
Date Sampling Train Parameter
Time of Venting Cycle
Activation
Sampling Train
Interval
Sampling Train
Duration (min)
Run A 4/2/2008 714 715-816 61
Run B 4/3/2008 2305 2338-039 61
Run C 4/5/2008
Modified EPA Methods 5/TO-14
Speciated
VOC 1532 1532-1636 64
The Source Test of Coker Steam Vent 3 was conducted from June 3 to June 8, 2008. Four separate venting cycles, designated as Runs 1-4, were tested for methane, ethane, benzene, toluene, NMNE VOC, SVOC, and PM emissions. At least three sequential EPA Method 5/202 and three sequential SW-846 0010 sampling trains were performed during each test run. The dilution sampling system used for the performance of EPA Method 18/25A/OTM 12 was

1-12 Source Test Report for the Coker Steam Vent
operated continuously for as long as possible during each test run. Tables 1-8 through 1-11 provide a summary of the dates and times for the performance of each sampling train during each test run on the Coker Steam Vent 3 gas stream during the Source Test.
Table 1-8. Source Test Chronology – Run 1
Date Sampling Train Parameter Sampling
Train ID
Venting Cycle
Venting Cycle
Duration (min)
Sampling Train
Interval
Sampling Train
Duration (min)
EPA Methods 18/25A/OTM 12
Benzene, Toluene,
NMNE VOC - 600-910 190
EPA Methods 5/202 PM 2 607-637 30 SW-846 Method 0010 SVOC A 602-632 30 EPA Methods 5/202 PM 3 638-708 30
SW-846 Method 0010 SVOC B 633-703 30 EPA Methods 5/202 PM 4 708-8221 68
SW-846 Method 0010 SVOC C 704-7342 30 SW-846 Method 0010 SVOC D 734-826 52
Run 1 6/3/2008
EPA Methods 2/4 Volumetric Flow Rate -
600-1018 258
-3 -
1 EPA Method 5/202 sampling train “4” was not operated for six minutes of this sampling train interval due to equipment malfunction.
2 SW-846 Method 0010 sampling train “C” failed a final leak test, and samples were not recovered from this train for SVOC analysis.
3 EPA Method 2/4 was not used to collect vent gas moisture concentration and velocity data during Run 1 due to equipment malfunction.
Table 1-9. Source Test Chronology – Run 2
Date Sampling Train Parameter Sampling
Train ID
Venting Cycle
Venting Cycle
Duration (min)
Sampling Train
Interval
Sampling Train
Duration (min)
EPA Methods 18/25A/OTM 12
Benzene, Toluene,
NMNE VOC - 2235-115 160
EPA Methods 5/202 PM 1 2237-2308 31 SW-846 Method 0010 SVOC A 2236-2306 30 EPA Methods 5/202 PM 2 2309-2339 30
SW-846 Method 0010 SVOC B 2307-2337 30 EPA Methods 5/202 PM 3 2340-040 60
SW-846 Method 0010 SVOC C 2338-035 57
Run 2 6/4-5/2008
EPA Methods 2/4 Volumetric Flow Rate -
2235-130 175
2236-038 122

1-13 Source Test Report for the Coker Steam Vent
Table 1-10. Source Test Chronology – Run 3
Date Sampling Train Parameter Sampling
Train ID
Venting Cycle
Venting Cycle
Duration (min)
Sampling Train
Interval
Sampling Train
Duration (min)
EPA Methods 18/25A/OTM 12
Benzene, Toluene,
NMNE VOC - 1408-1630 142
EPA Methods 5/202 PM 1 1410-1443 33 SW-846 Method 0010 SVOC A 1409-1439 30 EPA Methods 5/202 PM 2 1444-1533 49
SW-846 Method 0010 SVOC C 1442-1532 50 EPA Methods 5/202 PM 3 1538-1622 44
SW-846 Method 0010 SVOC D 1533-1621 48
Run 3 6/6/2008
EPA Methods 2/4 Volumetric Flow Rate -
1408-1630 142
1408-1621 135
Table 1-11. Source Test Chronology – Run 4
Date Sampling Train Parameter Sampling
Train ID
Venting Cycle
Venting Cycle
Duration (min)
Sampling Train
Interval
Sampling Train
Duration (min)
EPA Methods 18/25A/OTM 12
Benzene, Toluene,
NMNE VOC - 632-840 128
EPA Methods 5/202 PM 1 633-705 32 SW-846 Method
0010 SVOC A 633-703 30
EPA Methods 5/202 PM 2 706-736 30 SW-846 Method
0010 SVOC B 703-733 30
EPA Methods 5/202 PM 3 737-834 57 SW-846 Method
0010 SVOC C 735-831 56
Run 4 6/8/2008
EPA Methods 2/4 Volumetric Flow Rate -
632-926 174
632-834 122

1-14 Source Test Report for the Coker Steam Vent
Sampling Train Start Times During the Source Test HOVENSA commented in a letter to EPA, dated March 18, 2008, that the Source Test would incorporate a one-minute delay between Coker Steam Vent 3 activation and the initiation of emissions sampling. This delay was necessary to avoid capturing condensed material present in the vent pipe from previous venting cycles, for the prevention of sampling train leakage, and for the manual adjustment of specialized gate valves prior to sampling probe insertion. As part of the conditional acceptance of the Protocol, EPA expressed that the delay must be minimized to the greatest extent possible. The significant negative static pressure of the vent at the sampling locations and the manual adjustment of the specialized gate valves contributed to a greater delay than anticipated during the Source Test. URS sampling train operators made every effort to begin sampling for moisture concentration, volumetric flow rate, PM emissions, and SVOC emissions within two minutes of Coker Steam Vent 3 activation during Runs 1-4. EPA Methods 5/202 sampling for PM emissions began within seven minutes of Coker Steam Vent 3 activation during Run 14, within two minutes during Run 2, within two minutes during Run 3, and within one minute during Run 4. SW-846 Method 0010 sampling for SVOC emissions began within two minutes of Coker Steam Vent 3 activation for Run 1 and within one minute during Runs 2-4. Sampling using the redundant EPA Method 2/4 sampling train began within one minute of vent activation during Run 2 and immediately with vent activation during Runs 3 and 4. The redundant EPA Method 2/4 sampling train was not used to collect vent gas moisture concentration and velocity data during Run 1 due to equipment malfunction. URS operators initiated the sampling for benzene, toluene, and NMNE VOC emissions immediately with the venting cycle activation during Runs 1-4 because the EPA Method 18/25A/OTM12 dilution sampling system did not contain leak-prone joints and fittings or components sensitive to negative pressures. The EPA Method 18/25A/OTM12 dilution sampling probe was inserted into the vent before venting cycle activation during all four test runs. 1.6 Report Organization
URS has organized this report in a manner consistent with Attachment II of EPA’s request except for two modifications: all raw sampling and analytical data has been included in various appendices of the report and Section 4.0 has been limited to example calculations, and
4 The delay between the venting cycle activation and the start of the first EPA Method 5/202 sampling train during Run 1 was attributed to the significant negative static pressure of Coker Steam Vent 3 at the sampling location used by this sampling train, which caused sampling train impinger solutions to “back-flush,” or migrate from one sampling train component to another, thereby compromising the effectiveness of the sampling train in quantifying PM emissions. The first sampling train was discarded and a second sampling train was inserted into the sampling location and activated within seven (7) minutes of Coker Steam Vent 3 activation.

1-15 Source Test Report for the Coker Steam Vent
Section 5.0 – Quality Assurance Objectives for Measurement Data has been added. The remainder of this report presents the following:
• Section 2.0 – Summary of Results; • Section 3.0 – Sampling and Analytical Procedures; • Section 4.0 – Calculations; and • Section 5.0 – Quality Assurance Objectives for Measurement Data. The appendices provide raw data, including chain-of-custody forms, sampling logs,
laboratory reports, process data, and sampling equipment calibration forms. 1.7 Quality Assurance Summary In accordance with Item “i” of EPA’s request, all deviations from the modified sampling and analytical methodologies specified in the Protocol are identified in Section 3.0 and discussed in Section 5.0. In addition, any sampling and/or analytical quality assurance/quality control (QA/QC) issues associated with the data obtained through the Pre-Survey and Source Test are described in Section 5.0. Table 1-12 presents the quality assurance summary for the three test runs performed during the Pre-Survey. Tables 1-13 through 1-16 present quality assurance summaries for each of the four test runs performed during the Source Test.

1-16 Source Test Report for the Coker Steam Vent
Table 1-12. Quality Assurance Summary – Pre-Survey
Sampling Train Parameter Deviations from Protocol and Quality Assurance/Quality Control Issues
Pre-Survey (Runs A, B, C)
Modified EPA Methods 5/TO-14
SpeciatedVOCs
1) Methanol rinses were not performed on the connecting glassware between the glass condenser and the filter media; 2) Two sample fractions – the “condensate catch” and the “methanol rinse” – were combined for laboratory analysis; 3) Several compounds were found in the field blank at levels above the detection limit; and 4) Amounts of acetone, 2-butanone, and methylene chloride were found in the condensate field blank sample above
detection limits.

1-17 Source Test Report for the Coker Steam Vent
Table 1-13. Quality Assurance Summary – Run 1
Sampling Train Parameter Deviations from Protocol and Quality Assurance/Quality Control Issues
EPA Methods
18/25A/OTM 12
Benzene, Toluene,
NMNE VOC
1) A valid Tedlar bag sample was not obtained for second sampling interval (631-701); 2) The THC2 analyzer response for the low-range calibration gas (after dilution) did not meet the EPA Method 25A
requirement for calibration error; and 3) The drift between the pre-test run THC2 analyzer responses and the post-test run analyzer responses for the mid-level
calibration gas did not meet EPA Method 25A requirements.
EPA Methods 2/4
Volumetric Flow Rate
1) The sampling probe was not inserted completely into the Coker Steam Vent 3 pipe until approximately 40 minutes after venting cycle activation;
2) Critical data points were not recorded every two minutes during various sampling intervals; and 3) The measured final impinger exit temperature exceeded 68°F during most of the operation of the sampling train.
EPA Methods 5/202 PM 1) Critical data points were not recorded every two minutes during various sampling intervals; and
2) The measured final impinger exit temperature exceeded 68°F during most of the operation of the sampling trains. Run 1
SW-846 Method 0010 SVOC
1) The analytical fractions recovered during the Source Test and analyzed separately in the laboratory were different than those presented in the Protocol;
2) The measured XAD sorbent inlet temperature exceeded 68°F during most of the operation of the sampling trains; 3) The measured final impinger exit temperature exceeded 68°F during most of the operation of the sampling trains; 4) Some XAD sorbent trap and filter samples arrived at the laboratory at temperatures between 3 and 16°C; and 5) 328 of 335 surrogate spike recoveries met the laboratory specification. The 7 outliers were low recoveries of 2-
fluorophenol from the XAD/post-XAD condensate sample fractions.

1-18 Source Test Report for the Coker Steam Vent
Table 1-14. Quality Assurance Summary – Run 2
Sampling Train Parameter Deviations from Protocol and Quality Assurance/Quality Control Issues
EPA Methods
18/25A/OTM 12
Benzene, Toluene,
NMNE VOC
1) The third Tedlar bag sample obtained was analyzed in duplicate instead of triplicate; and 2) The THC2 analyzer response for the low-range calibration gas (after dilution) did not meet the EPA Method 25A
requirement for calibration error.
EPA Methods 2/4
Volumetric Flow Rate 1) The measured final impinger exit temperature exceeded 68°F during most of the operation of the sampling train.
EPA Methods 5/202 PM 1) Sampling train "3" measured 97.8% moisture and operated at an isokinetic sampling rate of 158%; and
2) The measured final impinger exit temperature exceeded 68°F during most of the operation of the sampling trains.
Run 2
SW-846 Method 0010 SVOC
1) The analytical fractions recovered during the Source Test and analyzed separately in the laboratory were different than those presented in the Protocol;
2) Critical data points were not recorded every two minutes during various sampling intervals; 3) The measured XAD sorbent inlet temperature exceeded 68°F during most of the operation of the sampling trains; 4) The measured final impinger exit temperature exceeded 68°F during most of the operation of the sampling trains; 5) Critical data points were not recorded every two minutes during various sampling intervals; 6) Some XAD sorbent trap and filter samples arrived at the laboratory at temperatures between 3 and 16°C; 7) 328 of 335 surrogate spike recoveries met the laboratory specification. The 7 outliers were low recoveries of 2-
fluorophenol from the XAD/post-XAD condensate sample fractions.

1-19 Source Test Report for the Coker Steam Vent
Table 1-15. Quality Assurance Summary – Run 3
Sampling Train Parameter Deviations from Protocol and Quality Assurance/Quality Control Issues
EPA Methods
18/25A/OTM12
Benzene, Toluene,
NMNE VOC
1) The THC2 analyzer response for the low-range calibration gas (after dilution) did not meet the EPA Method 25A requirement for calibration error.
EPA Methods 2/4
Volumetric Flow Rate
1) Critical data points were not recorded every two minutes during various sampling intervals; and 2) The measured final impinger exit temperature exceeded 68°F during most of the operation of the sampling train.
EPA Methods 5/202 PM 1) Critical data points were not recorded every two minutes during various sampling intervals; and
2) The measured final impinger exit temperature exceeded 68°F during most of the operation of the sampling trains.
Run 3
SW-846 Method 0010 SVOC
1) The analytical fractions recovered during the Source Test and analyzed separately in the laboratory were different than those presented in the Protocol;
2) Critical data points were not recorded every two minutes during various sampling intervals; 3) The measured XAD sorbent inlet temperature exceeded 68°F during most of the operation of the sampling trains; 4) The measured final impinger exit temperature exceeded 68°F during most of the operation of the sampling trains; 5) Some XAD sorbent trap and filter samples arrived at the laboratory at temperatures between 3 and 16°C; and 6) 328 of 335 surrogate spike recoveries met the laboratory specification. The 7 outliers were low recoveries of 2-
fluorophenol from the XAD/post-XAD condensate sample fractions.

1-20 Source Test Report for the Coker Steam Vent
Table 1-16. Quality Assurance Summary – Run 4
Sampling Train Parameter Deviations from Protocol and Quality Assurance/Quality Control Issues
EPA Methods
18/25A/OTM12
Benzene, Toluene,
NMNE VOC
1) The THC2 analyzer response for the low-range calibration gas (after dilution) did not meet the EPA Method 25A requirement for calibration error.
EPA Methods 2/4
Volumetric Flow Rate 1) The measured final impinger exit temperature exceeded 68°F during most of the operation of the sampling train.
EPA Methods 5/202 PM 1) The measured final impinger exit temperature exceeded 68°F during most of the operation of the sampling trains.
Run 4
SW-846 Method 0010 SVOC
1) The analytical fractions recovered during the Source Test and analyzed separately in the laboratory were different than those presented in the Protocol;
2) Critical data points were not recorded every two minutes during various sampling intervals; 3) The measured XAD sorbent inlet temperature exceeded 68°F during most of the operation of the sampling trains; 4) The measured final impinger exit temperature exceeded 68°F during most of the operation of the sampling trains; 5) Some XAD sorbent trap and filter samples arrived at the laboratory at temperatures between 3 and 16°C; and 6) 328 of 335 surrogate spike recoveries met the laboratory specification. The 7 outliers were low recoveries of 2-
fluorophenol from the XAD/post-XAD condensate sample fractions.

2-1 Source Test Report for the Coker Steam Vent
2.0 Summary of Results
This section presents a summary of Coker process operations as well as the results of the emissions testing of Coker Steam Vent 3 for selected VOCs, NMNE VOCs, selected SVOCs, and PM. Both the Pre-Survey and Source Test programs’ results are presented and discussed. The modified methods used for sampling and analysis were specified in detail in the Protocol and are discussed briefly in Section 3.0. Example calculations are presented in Section 4.0. Quality assurance/quality control objectives for the measurement data are discussed in Section 5.0. 2.1 Process Operations The Coker was operated under normal conditions during both the Pre-Survey and Source Test programs. In accordance with EPA’s request for information, the specific process data outlined in the Protocol was recorded during the Source Test. Coke Drum 3 was operated on a 20 hour cycle during the entire Source Test. The batch duration of Coke Drum 3 was 40 hours during the Source Test. The batch duration is defined as the period of time that includes the operating cycle as well as drum post-cutting procedures such as re-heading, pressure-testing, and back-warming. The batch duration was determined by the elapsed time between each venting cycle, which typically corresponded to 40 hours. Table 2-1 presents a production summary of Coker Drum 3 during the Source Test. Table 2-2 presents the durations of various Coker batch processes that constitute an operating cycle. Additional Coke Drum 3 operating data and venting cycle durations for each test run are presented in Tables 1-2, 1-3, and 1-6. Figures 2-1 through 2-4 present plots of Coke Drum 3 pressure data (recorded by instrument PI-3961) versus the elapsed time of the venting cycle for Runs 1 through 4. Printouts of selected process data recorded approximately every minute during the batch operation of Coke Drum 3 are included in Appendix 2-1.
Table 2-1. Coke Drum 3 – Production Summary
Date Coke Drum
3 Outage (ft)
Average Coker Feed Rate
(mbpd)
Coke Drum 3 Production
(tons per batch)
Coke Drum 3 Production
(tons per day)
Run 1 6/3/2008 36 62.8 1,671 1,002
Run 2 6/4-5/2008 33 63.7 1,739 1,043
Run 3 6/6/2008 35 56.5 1,693 1,016
Run 4 6/8/2008 39 55.6 1,602 961
Average - 36 59.7 1,676 1,006

2-2 Source Test Report for the Coker Steam Vent
Table 2-2. Coke Drum 3 – Batch Process Durations
Run 1 Run 2 Run 3 Run 4
6/3/2008 6/4-5/2008 6/6/2008 6/8/2008 Process Parameters
Start End Duration (h:min) Start End Duration
(h:min) Start End Duration (h:min) Start End Duration
(h:min)
Steam Out to Fractionator 100 130 0:30 1650 1705 0:15 654 710 0:16 056 110 0:14
Steam Out to Blowdown 130 215 0:45 1705 1743 0:38 710 836 1:26 110 148 0:38
Quench Water 215 600 3:45 1743 2235 4:52 836 1408 5:32 148 632 4:44
Soak 500 600 1:00 2135 2235 1:00 1308 1408 1:00 532 632 1:00
Vent and Drain 600 1320 7:20 2235 536 7:01 1408 2055 6:47 632 1225 5:53
Coke Cutting 1320 1600 2:40 536 853 3:17 2055 2335 2:40 1225 1545 3:20

2-3 Source Test Report for the Coker Steam Vent
Figure 2-1. Coke Drum 3 Pressure Data – Run 1
Coke Drum 3 Pressure vs. Elapsed Time - Run 1
y = -1.4519Ln(x) + 8.4183R2 = 0.9748
0
1
2
3
4
5
6
7
8
9
10
0:00 0:30 1:00 1:30 2:00 2:30 3:00 3:30 4:00
Elapsed Time of Venting Cycle (h:min)
Cok
e D
rum
3 P
ress
ure
(psi
g)
Direct Measurement of PM and SVOC Emissions End
Direct Measurement of NMNE VOC, Benzene, and Toluene Emissions End

2-4 Source Test Report for the Coker Steam Vent
Figure 2-2. Coke Drum 3 Pressure Data – Run 2
Coke Drum 3 Pressure vs. Elapsed Time - Run 2
y = -1.6255Ln(x) + 8.6655R2 = 0.9725
0
1
2
3
4
5
6
7
8
9
10
0:00 0:30 1:00 1:30 2:00 2:30
Elapsed Time of Venting Cycle (h:min)
Cok
e D
rum
3 P
ress
ure
(psi
g)
Direct Measurement of PM and SVOC Emissions End
Direct Measurement of NMNE VOC, Benzene, and Toluene Emissions End

2-5 Source Test Report for the Coker Steam Vent
Figure 2-3. Coke Drum 3 Pressure Data – Run 3
Coke Drum 3 Pressure vs. Elapsed Time - Run 3
y = -1.5062Ln(x) + 7.2101R2 = 0.9184
0
1
2
3
4
5
6
7
8
9
10
0:00 0:30 1:00 1:30 2:00
Elapsed Time of Venting Cycle (h:min)
Cok
e D
rum
3 P
ress
ure
(psi
g)
Direct Measurement of PM and SVOC Emissions End
Direct Measurement of NMNE VOC, Benzene, and Toluene Emissions End

2-6 Source Test Report for the Coker Steam Vent
Figure 2-4. Coke Drum 3 Pressure Data – Run 4
Coke Drum 3 Pressure vs. Elapsed Time - Run 4
y = -1.7002Ln(x) + 6.7572R2 = 0.9212
0
1
2
3
4
5
6
7
8
9
10
0:00 0:30 1:02 1:34 2:05 2:37
Elapsed Time of Venting Cycle (h:min)
Cok
e D
rum
3 P
ress
ure
(psi
g)
Direct Measurement of PM and SVOC Emissions End
Direct Measurement of NMNE VOC, Benzene, and Toluene Emissions End

2-7 Source Test Report for the Coker Steam Vent
2.2 Data Reduction Approach EPA’s request for information communicated interest in developing the mass emission
rates for the selected pollutants. Pollutant mass emission rates are typically expressed using an industry standard of mass per unit time, such as lbs/hr, by relating the concentration of a pollutant to the average volumetric flow rate of a gas stream both measured during a distinct unit of time. Due to the atypical, batch nature of the Coker Steam Vent source, HOVENSA proposed that a more comprehensive emissions profile be developed to meet EPA’s request. The use of a simple average or time-weighted average is inappropriate for developing an emissions profile for the intermittent, yet dynamic characteristics of the Coker Steam Vent source. Parameters such as gas stream differential pressure and vent static pressure varied greatly during the venting cycle (especially during the first 15 minutes of a given venting event) as the coke drum depressurized and process parameters such as temperature and pressure fluctuated and steadily decreased. Typical combustion sources – for which the EPA Methods were originally developed – do not operate as dynamic batch processes. Instead, they produce effluent gas streams that are more or less static in their profiles. In addition, the duration of each complete venting cycle varied according to the batch process of the Coker. The data reduction approach used in this report integrates pollutant mass emission rates (as lbs/min and lbs/interval) throughout the complete venting cycle, starting at the point of Coker Steam Vent 3 activation and ending at the point of optimal depressurization of Coke Drum 3. A final pollutant mass per complete venting cycle is reported as lbs/cycle for each of the four test runs performed during the Source Test.
2.2.1 Venting Cycle Interval vs. Sampling Train Interval
A distinction is made in this report between a “venting cycle interval” and a “sampling train interval.” A “venting cycle interval” is defined as a period of time between when Coker Steam Vent 3 was opened (i.e., activated) and the point of optimal depressurization. A “sampling train interval” is defined as a period of time in which a given sampling train was operational and actively sampling the Coker Steam Vent 3 gas stream. For example, the sampling train interval of EPA Method 5/202 sampling train “2” occurred between 607 and 637 during Run 1. The venting cycle interval corresponding to the measurement of PM concentration by EPA Method 5/202 sampling train “2” was from 600 to 637. The PM concentration measured with EPA Method 5/202 sampling train “2” – operated from 607 to 637 – and the database of instantaneous volumetric flow rate data was used to calculate PM mass emission rates, in both lbs/min and lbs/interval, for the venting cycle interval between 600 and 637.
2.2.2 Volumetric Flow Rate Database
The sequential EPA Method 5/202 and SW-846 Method 0010 sampling trains and the redundant EPA Method 2/4 sampling train were used to quantify instantaneous volumetric flow rates for as long as possible during each venting cycle. A database consisting of instantaneous

2-8 Source Test Report for the Coker Steam Vent
volumetric flow rates measured by every sampling train operated during a given venting cycle was used to develop average volumetric flow rates for a given venting cycle interval (defined above). The average venting cycle moisture concentration, developed from moisture concentrations quantified by each individual sampling train operated during a given venting cycle, was used to calculate average dry vent gas volumetric flow rates (dscfm) for each venting cycle interval. This approach was used to maintain the highest level of consistency in the development of pollutant mass emission rates, as well as to incorporate the averaging of data as often as possible.
2.2.3 Extrapolated Data
The volumetric flow rate data “gaps” produced through the limited operation of the EPA Method 2/4, EPA Method 5/202, and SW-846 Method 0010 sampling trains during each venting cycle were extrapolated by plotting the instantaneous volumetric flow rates, in scfm, measured by each individual sampling train against the elapsed time of the venting cycle. Either an exponential or logarithmic regression curve was developed for each sampling train’s data (depending on which fit produced the largest R2 value) and used to calculate instantaneous “pro-rated” volumetric flow rates during the time period between the end of direct measurement and the end of the complete venting cycle (the optimal depressurization of Coke Drum 3). The extrapolated instantaneous data from each individual sampling train operated during a given venting cycle was used to calculate average volumetric flow rates for extrapolated venting cycle intervals. URS sampling train operators recorded as many data points as possible for parameters critical to the calculation of vent gas velocity for the purpose of this volumetric flow rate data extrapolation. Printouts and raw data sheets of all data used to extrapolate instantaneous volumetric flow rates with regression curves are included in Appendix 2-2.
2.2.4 Pollutant Mass Emission Rates in Lbs/Cycle
The average dry vent gas volumetric flow rate (dscfm) and pollutant concentration (dry basis) measured for each venting cycle interval were used to develop pollutant mass emission rates for each venting cycle interval in the units of lbs/min and lbs/interval. The pollutant masses quantified as lbs/interval were then totaled to report a final pollutant mass emission rate in the unit of lbs/cycle for each of the four test runs performed during the Source Test.
Section 2.3 presents a summary of average vent gas volumetric flow rate results obtained
during the Source Test using EPA Method 2, 3, and 4. Section 2.4 presents speciated VOC emission results measured during both the Pre-Survey and Source Test. Section 2.5 presents a summary of NMNE VOC emission results obtained during the Source Test. Section 2.6 presents a summary of SVOC emission results, and Section 2.7 presents a summary of PM emission results, both obtained during the Source Test. 2.3 Source Test Results for Volumetric Flow Rate
Vent gas sampling to determine the volumetric flow rate was performed during the Source Test according to EPA Methods 2, 3 and 4, modified according to the Protocol

2-9 Source Test Report for the Coker Steam Vent
conditionally approved by EPA. Each EPA Method 2/4, EPA Method 5/202, and SW-846 Method 0010 sampling train was operated to obtain the most accurate velocity and moisture measurements as possible given equipment limitations and the nature of the vent stream. Due to the critical nature of volumetric flow rate measurement in the development of pollutant mass emission rates, as well as the atypical data reduction strategy used for the Source Test results, this section presents a significant amount of data in the form of tables and figures. Printouts of all data used to extrapolate instantaneous and average volumetric flow rates are included in Appendix 2-2.
The dry gas molecular weight fraction of the vent gas was determined by using the
average dry gas percentages of methane, ethane, oxygen, and carbon dioxide, with a balance of nitrogen, measured during each test run. The average vent gas molecular weights (wet basis) calculated for Runs 1-4 are presented in Table 2-3.
Table 2-4 presents the average volumetric flow rates of dry gas developed for each
venting cycle interval associated with an individual sampling train conducted during Run 1. (Individual sampling train intervals, as opposed to venting cycle intervals, are presented in Table 1-8.) Figures 2-5 and 2-6 present plots of instantaneous wet vent gas volumetric flow rates versus the elapsed time of the 258-minute venting cycle for both measured and extrapolated data. Volumetric flow rate data was not obtained from the separate EPA Method 2/4 sampling train during Run 1 due to equipment malfunction.
Table 2-5 presents the average volumetric flow rates of dry gas developed for each
venting cycle interval associated with an individual sampling train conducted during Run 2. (Individual sampling train intervals, as opposed to venting cycle intervals, are presented in Table 1-9.) Figures 2-7 through 2-9 present plots of instantaneous wet vent gas volumetric flow rates versus the elapsed time of the 175-minute venting cycle for both measured and extrapolated data.
Table 2-6 presents the average volumetric flow rates of dry gas developed for each
venting cycle interval associated with an individual sampling train conducted during Run 3. (Individual sampling train intervals, as opposed to venting cycle intervals, are presented in Table 1-10.) Figures 2-10 through 2-12 present plots of instantaneous wet vent gas volumetric flow rates versus the elapsed time of the 142-minute venting cycle for both measured and extrapolated data.
Table 2-7 presents the average volumetric flow rates of dry gas developed for each
venting cycle interval associated with an individual sampling train conducted during Run 3. (Individual sampling train intervals, as opposed to venting cycle intervals, are presented in Table 1-11.) Figures 2-13 through 2-15 present plots of instantaneous wet vent gas volumetric flow rates versus the elapsed time of the 174-minute venting cycle for both measured and extrapolated data.

2-10 Source Test Report for the Coker Steam Vent
Table 2-3. Average Vent Gas (Wet) Molecular Weight Results
Date
Average Moisture
Conc. (%)
Average CH4
Conc. (ppmw)
Average C2H6 Conc.
(ppmw)
Average CH4
Conc. (ppmd)
Average C2H6 Conc.
(ppmd)
Average CH4
Conc. (%, dry)
Average C2H6 Conc.
(%, dry)
Average O2
Conc. (%, dry)
Average CO2
Conc. (%, dry)
Average N2
Conc. (%, dry)
Average Vent Gas Molecular
Weight, Wet (g/g-mol)
Run 1 6/3/2008 98.85 8,359 926 728,050 80,658 72.8 8.07 2.00 0 17.1 18.02
Run 2 6/4-5/2008 98.37 12,096 1,423 742,672 87,351 74.3 8.74 2.67 0 14.3 18.02
Run 3 6/6/2008 99.24 4,392 509 579,595 67,140 58.0 6.71 10.5 0 24.8 18.03
Run 4 6/8/2008 98.60 10,003 1,106 715,933 79,152 71.6 7.92 2.33 0 18.2 18.02
Table 2-4. Average Dry Vent Gas Volumetric Flow Rate Results per Venting Cycle Interval – Run 1
Date Sampling Train Sampling
Train ID
Venting Cycle
Venting Cycle
Interval
Venting Cycle
Interval Duration
(min)
Average Moisture
Conc. (%)
Average Volumetric Flow Rate
(scfm)
Average Volumetric Flow Rate
(dscfm)
600-631 31 20,594 236
631-701 30 17,438 200 N/A
701-910 129 13,615 156 EPA Methods 18/25A/OTM12
EXT1 910-1018 68 10,463 120
2 600-637 37 19,863 228
3 637-708 31 17,377 200
4 708-822 74 14,437 166 EPA Methods 5/202
EXT 822-1018 116 11,121 128
A 600-632 32 20,594 236
B 632-703 31 17,391 200
D 703-826 83 14,431 166
Run 1 6/3/2008
SW-846 Method 0010
EXT
600-1018
826-1018 112
98.85
11,062 127
1 Extrapolated data.

2-11 Source Test Report for the Coker Steam Vent
Figure 2-5. EPA Method 5/202 Wet Vent Gas Volumetric Flow Rate vs. Elapsed Time – Run 1
EPA Method 5/202 - Run 1
y = -2372.2Ln(x) + 25523R2 = 0.9036
0
5,000
10,000
15,000
20,000
25,000
30,000
35,000
0 50 100 150 200 250
Elapsed Time of Venting Cycle (min)
Volu
met
ric F
low
Rat
e (s
cfm
) Measured
Extrapolated
Log.(Measured)

2-12 Source Test Report for the Coker Steam Vent
Figure 2-6. SW-846 Method 0010 Wet Vent Gas Volumetric Flow Rate vs. Elapsed Time – Run 1
SW-846 Method 0010 - Run 1
y = 23100e-0.0046x
R2 = 0.7714
0
5,000
10,000
15,000
20,000
25,000
30,000
35,000
0 50 100 150 200 250
Elapsed Time of Venting Cycle (min)
Volu
met
ric F
low
Rat
e (s
cfm
) Measured
Extrapolated
Expon.(Measured)

2-13 Source Test Report for the Coker Steam Vent
Table 2-5. Average Dry Vent Gas Volumetric Flow Rate Results per Venting Cycle Interval – Run 2
Date Sampling Train Sampling
Train ID
Venting Cycle
Venting Cycle
Interval
Venting Cycle
Interval Duration
(min)
Average Moisture
Conc. (%)
Average Volumetric Flow Rate
(scfm)
Average Volumetric Flow Rate
(dscfm)
2235-2305 30 21,663 353 2305-2335 30 17,559 286 N/A
2335-0115 100 8,688 142 EPA Methods 18/25A/OTM 12
EXT1 115-130 15 4,181 68.1 1 2235-2308 33 21,540 351 2 2308-2339 31 17,195 280 3 2339-040 61 10,032 163
EPA Methods 5/202
EXT 040-130 50 5,197 84.6 A 2235-2306 31 21,581 351 B 2306-2337 31 17,418 284 C 2337-035 58 10,548 172
Run 2 6/4-5/2008
SW-846 Method 0010
EXT
2235-0130
035-130 55
98.37
5,332 86.8
1 Extrapolated data.
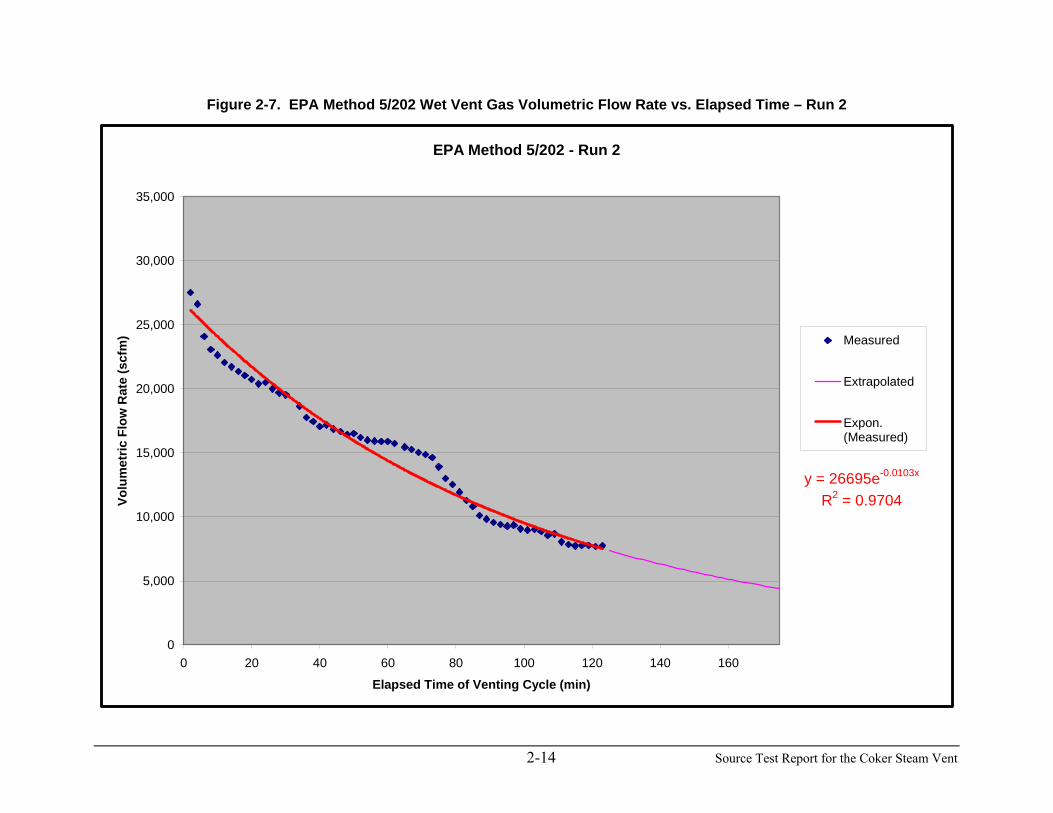
2-14 Source Test Report for the Coker Steam Vent
Figure 2-7. EPA Method 5/202 Wet Vent Gas Volumetric Flow Rate vs. Elapsed Time – Run 2
EPA Method 5/202 - Run 2
y = 26695e-0.0103x
R2 = 0.9704
0
5,000
10,000
15,000
20,000
25,000
30,000
35,000
0 20 40 60 80 100 120 140 160
Elapsed Time of Venting Cycle (min)
Volu
met
ric F
low
Rat
e (s
cfm
) Measured
Extrapolated
Expon.(Measured)

2-15 Source Test Report for the Coker Steam Vent
Figure 2-8. SW-846 Method 0010 Wet Vent Gas Volumetric Flow Rate vs. Elapsed Time – Run 2
SW-846 Method 0010 - Run 2
y = 33427e-0.0133x
R2 = 0.9097
0
5,000
10,000
15,000
20,000
25,000
30,000
35,000
0 20 40 60 80 100 120 140 160
Elapsed Time of Venting Cycle (min)
Volu
met
ric F
low
Rat
e (s
cfm
) Measured
Extrapolated
Expon.(Measured)

2-16 Source Test Report for the Coker Steam Vent
Figure 2-9. EPA Method 2/4 Wet Vent Gas Volumetric Flow Rate vs. Elapsed Time – Run 2
EPA Method 2/4 - Run 2
y = 25887e-0.0108x
R2 = 0.9597
0
5,000
10,000
15,000
20,000
25,000
30,000
35,000
0 20 40 60 80 100 120 140 160
Elapsed Time of Venting Cycle (min)
Volu
met
ric F
low
Rat
e (s
cfm
) Measured
Extrapolated
Expon.(Measured)

2-17 Source Test Report for the Coker Steam Vent
Table 2-6. Average Dry Vent Gas Volumetric Flow Rate Results per Venting Cycle Interval – Run 3
Date Sampling Train Sampling
Train ID
Venting Cycle
Venting Cycle
Interval
Venting Cycle
Interval Duration
(min)
Average Moisture
Conc. (%)
Average Volumetric Flow Rate
(scfm)
Average Volumetric Flow Rate
(dscfm)
1408-1438 30 19,821 150 1438-1508 30 9,438 71.5 N/A
1508-1630 82 5,763 43.7 EPA Methods 18/25A/OTM 12
EXT1 1630-1719 49 2,518 19.1 1 1408-1443 35 18,909 143 2 1443-1533 50 9,298 70.5 3 1533-1622 49 4,139 31.4
EPA Methods 5/202
EXT 1622-1630 8 2,812 21.3 A 1408-1439 31 19,821 150 C 1439-1532 53 9,400 71.2 D 1532-1621 49 4,214 31.9
Run 3 6/6/2008
SW-846 Method 0010
EXT
1408-1630
1621-1630 9
99.24
2,812 21.3
1 Extrapolated data.

2-18 Source Test Report for the Coker Steam Vent
Figure 2-10. EPA Method 5/202 Wet Vent Gas Volumetric Flow Rate vs. Elapsed Time – Run 3
EPA Method 5/202 - Run 3
y = -6437.9Ln(x) + 35324R2 = 0.8986
0
5,000
10,000
15,000
20,000
25,000
30,000
35,000
0 20 40 60 80 100 120 140 160 180
Elapsed Time of Venting Cycle (min)
Volu
met
ric F
low
Rat
e (s
cfm
) Measured
Extrapolated
Log.(Measured)

2-19 Source Test Report for the Coker Steam Vent
Figure 2-11. SW-846 Method 0010 Wet Vent Gas Volumetric Flow Rate vs. Elapsed Time – Run 3
SW-846 Method 0010 - Run 3
y = -6610.5Ln(x) + 35957R2 = 0.9281
0
5,000
10,000
15,000
20,000
25,000
30,000
35,000
0 20 40 60 80 100 120 140 160 180
Elapsed Time of Venting Cycle (min)
Volu
met
ric F
low
Rat
e (s
cfm
) Measured
Extrapolated
Log.(Measured)

2-20 Source Test Report for the Coker Steam Vent
Figure 2-12. EPA Method 2/4 Wet Vent Gas Volumetric Flow Rate vs. Elapsed Time – Run 3
EPA Method 2/4 - Run 3
y = 27304e-0.0199x
R2 = 0.8322
0
5,000
10,000
15,000
20,000
25,000
30,000
35,000
0 20 40 60 80 100 120 140
Elapsed Time of Venting Cycle (min)
Volu
met
ric F
low
Rat
e (s
cfm
) Measured
Extrapolated
Expon.(Measured)

2-21 Source Test Report for the Coker Steam Vent
Table 2-7. Average Dry Vent Gas Volumetric Flow Rate Results per Venting Cycle Interval – Run 4
Date Sampling Train Sampling
Train ID
Venting Cycle
Venting Cycle
Interval
Venting Cycle
Interval Duration
(min)
Average Moisture
Conc. (%)
Average Volumetric Flow Rate
(scfm)
Average Volumetric Flow Rate
(dscfm)
632-702 30 20,989 293 702-732 30 11,435 160 N/A
732-840 68 7,630 107 EPA Methods 18/25A/OTM 12
EXT1 840-926 46 4,232 59.1 1 632-705 33 20,743 290 2 705-736 31 11,149 156 3 736-834 58 7,708 108
EPA Methods 5/202
EXT 834-926 52 4,371 61.1 A 632-703 31 20,863 291 B 703-733 30 11,333 158 C 733-831 58 7,846 110
Run 4 6/8/2008
SW-846 Method 0010
EXT
632-926
831-926 55
98.60
4,507 63.0
1 Extrapolated data.

2-22 Source Test Report for the Coker Steam Vent
Figure 2-13. EPA Method 5/202 Wet Vent Gas Volumetric Flow Rate vs. Elapsed Time – Run 4
EPA Method 5/202 - Run 4
y = 23684e-0.013x
R2 = 0.9271
0
5,000
10,000
15,000
20,000
25,000
30,000
35,000
0 20 40 60 80 100 120 140 160
Elapsed Time of Venting Cycle (min)
Volu
met
ric F
low
Rat
e (s
cfm
) Measured
Extrapolated
Expon.(Measured)

2-23 Source Test Report for the Coker Steam Vent
Figure 2-14. SW-846 Method 0010 Wet Vent Gas Volumetric Flow Rate vs. Elapsed Time – Run 4
SW-846 Method 0010 - Run 4
y = -5503.7Ln(x) + 32997R2 = 0.9285
0
5,000
10,000
15,000
20,000
25,000
30,000
35,000
0 20 40 60 80 100 120 140 160
Elapsed Time of Venting Cycle (min)
Volu
met
ric F
low
Rat
e (s
cfm
) Measured
Extrapolated
Log.(Measured)

2-24 Source Test Report for the Coker Steam Vent
Figure 2-15. EPA Method 2/4 Wet Vent Gas Volumetric Flow Rate vs. Elapsed Time – Run 4
EPA Method 2/4 - Run 4
y = 22113e-0.0117x
R2 = 0.8758
0
5,000
10,000
15,000
20,000
25,000
30,000
35,000
0 20 40 60 80 100 120 140 160
Elapsed Time of Venting Cycle (min)
Volu
met
ric F
low
Rat
e (s
cfm
) Measured
Extrapolated
Expon.(Measured)

2-25 Source Test Report for the Coker Steam Vent
2.4 Results for Speciated Volatile Organic Compound Emissions Speciated VOC emissions results obtained during both the Pre-Survey and Source Test programs are presented in this section. 2.4.1 Pre-Survey Results for Volatile Organic Compound Concentrations
The Pre-Survey was performed according to Section 5.6 of the Protocol. The Pre-Survey was executed for the purpose of identifying target volatile organic analytes for the Source Test of Coker Steam Vent 3 using EPA Method 18. Pre-Survey vent gas samples were collected during three separate venting cycles of Coker Steam Vent 3, designated as Runs A, B, and C, using a modified EPA Method 5/TO-14 sampling train with a slipstream of dry sample gas routed to a Summa canister. The Summa canister sample fractions were analyzed by GC/MS according to EPA Method TO-14, and the condensate sample fractions were analyzed by GC/MS according to SW-846 Method 8260B. Pre-Survey concentration results are presented in Tables 2-8 through 2-10. The development of mass emission rates for speciated volatile organic compounds was not included in the scope of the Pre-Survey program. Several Summa canister samples were collected over the duration of a test run while only one condensate sample was collected during each test run. As a result, the EPA Method TO-14 concentration results presented in Tables 2-8 through 2-10 for the Summa canister samples represent the average analyte concentrations per run. These average EPA Method TO-14 results were then added to the SW-846 Method 8260B concentration results from the condensate samples obtained for each run (if applicable). In some cases, an organic analyte was not detected in both the Summa canister and condensate sample fractions, or an analyte was not part of the established analytical list for the applicable method. The total concentration results obtained during each test run, in ppmd, were then averaged and corrected to the average moisture concentration (99%) measured from all three test runs in order to present these results on a ppmw basis. The full Pre-Survey laboratory report is included as Appendix 2-3.
The Protocol defined that HOVENSA would quantify, during the Source Test, any major organic component (in addition to methane, ethane, benzene, and toluene) measured in excess of 100 ppmw in the Coker Steam Vent 3 gas stream during the Pre-Survey. The Pre-Survey results indicated that no additional organic compounds exceeded this criterion. The organic compound with the highest average concentration was determined to be n-butane at 10 ppmw. The tentatively identified compound (TIC) with the highest average concentration was designated as “Unknown” because the analytical data failed to correspond to the mass spectrometry (MS) library search performed as part of EPA Method TO-14. Based upon technical guidance from the analytical laboratory, the “Unknown” TIC most likely represents a mixture of propane and propene co-eluting from the GC column at an average aggregate concentration of 27 ppmw.

2-26 Source Test Report for the Coker Steam Vent
Table 2-8. Pre-Survey Results for Volatile Organic Compound Concentrations
Run A Run B Run C Runs A-C
Average
Runs A-C
Average
Volatile Organic Compounds1
Average Canister
Conc. (ppmd)
Condensate Conc.
(ppmd)
Total Conc.
(ppmd)
Average Canister
Conc. (ppmd)
Condensate Conc.
(ppmd)
Total Conc.
(ppmd)
Average Canister
Conc. (ppmd)
Condensate Conc.
(ppmd)
Total Conc.
(ppmd)
Total Conc.
(ppmd)
Total Conc.
Corrected to 99%
Moisture
(ppmw)
Acetone ND2 94.7 94.7 ND 141 141 ND 147 147 128 1.28 Benzene 173 60.6 233 355 46.3 401 142 44.8 187 274 2.74 n-Butane 690 ---3 690 1,500 ---3 1,500 878 ---3 878 1,023 10.2 n-Heptane 95.0 ---3 95.0 190 ---3 190 186 ---3 186 157 1.57 n-Hexane 128 ---3 128 270 ---3 270 280 ---3 280 226 2.26 n-Octane 47.3 ---3 47.3 89.0 ---3 89.0 93.3 ---3 93.3 76.5 0.765 Pentane 290 ---3 290 605 ---3 605 583 ---3 583 493 4.93 Toluene 347 185 532 720 178 898 254 120 374 601 6.01 m-Xylene and p-Xylene 168 166 334 325 289 614 101 130 231 393 3.93 o-Xylene 21.8 37.8 59.7 48.5 62.3 111 12.8 35.6 48.3 72.9 0.729 Naphthalene 1.87 81.6 83.4 6.15 154 160 0.508 93.4 93.9 113 1.13 1,2,4-Trimethylbenzene 5.27 38.5 43.7 10.3 96.4 107 2.46 44.4 46.9 65.8 0.658
1 VOCs with average measured total concentrations below 65.8 ppmd (0.658 ppmw) are not shown. 2 Not detected. 3 Not quantified per SW-846 Method 8260B.

2-27 Source Test Report for the Coker Steam Vent
Table 2-9. Pre-Survey Results for Volatile Organic Compound Concentrations (Tentatively Identified Compounds)
Run A Run B Run C Runs A-C
Average
Runs A-C
Average
Tentatively Identified Compounds (TIC)1 Average
Canister Conc.
(ppmd)
Condensate Conc.
(ppmd)
Total Conc.
(ppmd)
Average Canister
Conc. (ppmd)
Condensate Conc.
(ppmd)
Total Conc.
(ppmd)
Average Canister
Conc. (ppmd)
Condensate Conc.
(ppmd)
Total Conc.
(ppmd)
Total Conc.
(ppmd)
Total Conc.
Corrected to 99%
Moisture
(ppmw)
UNKNOWN (Retention Time=3.66)2 1,957 ---3 1,957 4,800 ---3 4,800 1,465 ---3 1,465 2,741 27.4
Isobutane 363 ---3 363 815 ---3 815 470 ---3 470 549 5.49 2-Methylpropene 588 ---3 588 1,390 ---3 1,390 835 ---3 835 938 9.38 2-Methylbutane 229 ---3 229 470 ---3 470 411 ---3 411 370 3.70 2-Pentene 83.3 ---3 83.3 230 ---3 230 173 ---3 173 162 1.62
1 TICs with average measured total concentrations below 162 ppmd (0.162 ppmw) are not shown. 2 This TIC may represent a mixture of propane and propene co-eluting from the GC column (this information was previously conveyed to EPA during the Pre-Survey results
submittal in May 2008). 3 Not quantified per SW-846 Method 8260B.

2-28 Source Test Report for the Coker Steam Vent
Table 2-10. Pre-Survey Results for Methane and Ethane Concentrations
Run A Run B Run C Runs A-C
Average
Runs A-C
Average
Organic Species Average Canister
Conc. (ppmd)
Average Canister
Conc. (ppmd)
Average Canister
Conc. (ppmd)
Total Conc.
(ppmd)
Total Conc. Corrected
to 99% Moisture
(ppmw)
Methane (CH4) 336,667 490,000 321,750 364,111 3,641 Ethane (C2H6) 29,333 51,500 28,250 33,778 338

2-29 Source Test Report for the Coker Steam Vent
2.4.2 Source Test Results for Methane, Ethane, Benzene, and Toluene Concentrations
Methane, ethane, benzene, and toluene concentrations were measured during the Source Test according to EPA Method 18 and the Protocol conditionally approved by EPA. Tedlar bag samples were collected from the same dilution sampling system used for the measurement of THC concentrations via EPA Method 25A and Other Test Method 12. An integrated sample of vent gas was collected in a Tedlar bag during each of three sampling intervals during a venting cycle and analyzed by GC/FID in triplicate. The sampling data from each test run are presented in Table 2-11. Most of the results for benzene and toluene were below the applicable method detection limits and are reported as a maximum (“<”). In subsequent calculations, for results that are reported with a “<”, the “<” is carried through all calculations and reporting (e.g., all emission rates will carry a “<” sign).
EPA’s request for information did not require the speciation by GC/FID of all C1-C6 hydrocarbons; however, the calibration gas standards used for the performance of EPA Method 18 included a mixture of C1-C6 compounds. The analytical results for propane, butane, pentane, and hexane during Runs 1-4 are presented in Table 2-12 as supplementary data.
URS personnel were unable to collect a valid Tedlar bag sample through the EPA
Method 18/25A/OTM 12 dilution sampling system during the second sampling interval (6:31-7:01) of Run 1. GC/FID analysis of this second Tedlar bag sample yielded methane and ethane results approximately 600% higher than the results obtained during the first sampling interval (6:00-6:31) of Run 1 and approximately 900% higher than the results obtained during the third sampling interval (7:01-9:10) of Run 1. These extremely high methane and ethane results are also significantly higher than the average THC concentration measured during the corresponding sampling interval. These outlying results were linked to the use of an un-evacuated Tedlar bag previously used to measure oxygen and carbon dioxide concentrations from the undiluted sample gas stream passed through the EPA Method 2/4 sampling train dry gas meter. The methane, ethane, benzene, and toluene results obtained from the invalid Tedlar bag sample are not presented in the following tables and were not used in the calculation of NMNE concentrations; however, they are included in Appendix 2-4 with the printouts of raw GC/FID data. The average of the methane, ethane, benzene, and toluene concentrations measured during the first and third sampling intervals of Run 1 were applied to the second interval for use in further calculations. 2.4.3 Source Test Results for Benzene and Toluene Mass Emission Rates
Benzene and toluene mass emission rates, calculated in lbs/cycle, are presented in Tables 2-13 and 2-14, respectively. Sections 2.2 and 2.3 discuss the development of pollutant mass emission rates from both measured and extrapolated data.

2-30 Source Test Report for the Coker Steam Vent
Table 2-11. Source Test Results for Benzene, Toluene, Methane, and Ethane Concentrations
Date Venting Cycle
Venting Cycle
Duration (min)
Sampling Interval
Sampling Duration
(min)
Benzene Conc.
(ppmw)
Toluene Conc.
(ppmw)
CH4 Conc.
(ppmw)
C2H6 Conc.
(ppmw)
600-631 31 <23.5 <26.9 9,624 1,092 631-7011 30 <23.5 <26.9 8,359 926 Run 1 6/3/2008 600-1018 258 701-910 129 <23.5 <26.9 7,093 760
2235-2305 30 <24.9 38.6 15,264 1,829 2305-2335 30 <24.9 29.9 10,398 1,216 Run 2 6/4-5/2008 2235-130 175 2335-0115 100 <24.9 <28.5 10,625 1,223
1408-1438 30 <25.2 <28.8 4,050 482 1438-1508 30 <25.2 <28.8 3,767 450 Run 3 6/6/2008 1408-1630 142 1508-1630 82 <25.2 <28.8 5,359 594
632-702 30 <26.4 <30.2 8,041 923 702-732 30 <26.4 <30.2 9,169 1,028 Run 4 6/8/2008 632-926 174 732-840 68 <26.4 <31.2 12,799 1,367
1 The average of the benzene, toluene, methane, and ethane concentrations measured during the first and third sampling intervals of Run 1 were applied to the second sampling interval.
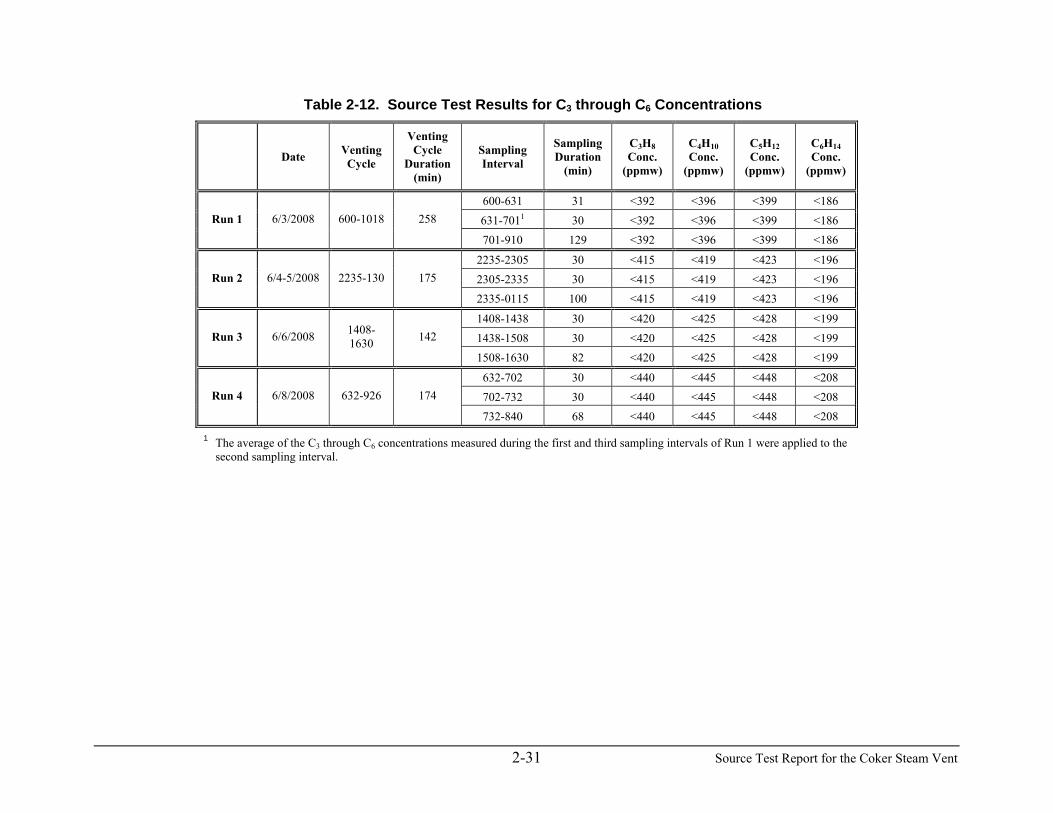
2-31 Source Test Report for the Coker Steam Vent
Table 2-12. Source Test Results for C3 through C6 Concentrations
Date Venting Cycle
Venting Cycle
Duration (min)
Sampling Interval
Sampling Duration
(min)
C3H8 Conc.
(ppmw)
C4H10 Conc.
(ppmw)
C5H12 Conc.
(ppmw)
C6H14 Conc.
(ppmw)
600-631 31 <392 <396 <399 <186 631-7011 30 <392 <396 <399 <186 Run 1 6/3/2008 600-1018 258
701-910 129 <392 <396 <399 <186
2235-2305 30 <415 <419 <423 <196 2305-2335 30 <415 <419 <423 <196 Run 2 6/4-5/2008 2235-130 175
2335-0115 100 <415 <419 <423 <196
1408-1438 30 <420 <425 <428 <199 1438-1508 30 <420 <425 <428 <199 Run 3 6/6/2008 1408-
1630 142
1508-1630 82 <420 <425 <428 <199
632-702 30 <440 <445 <448 <208 702-732 30 <440 <445 <448 <208 Run 4 6/8/2008 632-926 174
732-840 68 <440 <445 <448 <208
1 The average of the C3 through C6 concentrations measured during the first and third sampling intervals of Run 1 were applied to the second sampling interval.

2-32 Source Test Report for the Coker Steam Vent
Table 2-13. Source Test Results for Benzene Mass Emission Rates
Date Venting Cycle
Venting Cycle
Duration (min)
Venting Cycle
Interval
Venting Cycle
Interval Duration
(min)
Benzene Conc.
(ppmw)
Moisture Conc. (%)
Benzene Conc.
(ppmd)
Volumetric Flow Rate
(dscfm)
Benzene Mass
Emission Rate
(lb/min)
Benzene Mass
Emission Rate
(lb/interval)
Benzene Mass
Emission Rate
(lb/cycle)
600-631 31 <23.5 <2,047 236 <0.0982 <3.04
631-701 30 <23.5 <2,047 200 <0.0831 <2.49
701-910 129 <23.5 <2,047 156 <0.0649 <8.37 Run 1 6/3/2008 600-1018 258
910-10181 68 <23.5
98.85
<2,047 120 <0.0499 <3.39
<17.3
2235-2305 30 <24.9 <1,529 353 <0.109 <3.28
2305-2335 30 <24.9 <1,529 286 <0.0887 <2.66
2335-0115 100 <24.9 <1,529 142 <0.0439 <4.39 Run 2 6/4-5/2008 2235-130 175
115-1301 15 <24.9
98.37
<1,529 68.1 <0.0211 <0.317
<10.6
1408-1438 30 <25.2 <3,326 150 <0.101 <3.04
1438-1508 30 <25.2 <3,326 71.5 <0.0482 <1.45 Run 3 6/6/2008 1408-1630 142
1508-1630 82 <25.2
99.24
<3,326 43.7 <0.0295 <2.42
<6.90
632-702 30 <26.4 <1,890 293 <0.112 <3.37
702-732 30 <26.4 <1,890 160 <0.0612 <1.84
732-840 68 <26.4 <1,890 107 <0.0409 <2.78 Run 4 6/8/2008 632-926 174
840-9261 46 <26.4
98.60
<1,890 59.1 <0.0227 <1.04
<9.03
1 No direct measurements were obtained during this venting cycle interval. These results have been extrapolated.

2-33 Source Test Report for the Coker Steam Vent
Table 2-14. Source Test Results for Toluene Mass Emission Rates
Date Venting Cycle
Venting Cycle
Duration (min)
Venting Cycle
Interval
Venting Cycle
Interval Duration
(min)
Toluene Conc.
(ppmw)
Moisture Conc. (%)
Toluene Conc.
(ppmd)
Volumetric Flow Rate
(dscfm)
Toluene Mass
Emission Rate
(lb/min)
Toluene Mass
Emission Rate
(lb/interval)
Toluene Mass
Emission Rate
(lb/cycle)
6:00-6:31 31 <26.9 <2,343 236 <0.112 <3.48
6:31-7:01 30 <26.9 <2,343 200 <0.0952 <2.85
7:01-9:10 129 <26.9 <2,343 156 <0.0743 <9.58 Run 1 6/3/2008 600-1018 258
9:10-10:181 68 <26.9
98.85
<2,343 120 <0.0571 <3.88
<19.8
2235-2305 30 38.6 2,369 353 0.200 6.00
2305-2335 30 29.9 1,838 286 0.126 3.77
2335-0115 100 <28.5 <1,750 142 <0.0502 <5.02 Run 2 6/4-5/2008 2235-130 175
115-1301 15 <28.5
98.37
<1,750 68.1 <0.0242 <0.363
<13.7
1408-1438 30 <28.8 <3,801 150 <0.116 <3.47
1438-1508 30 <28.8 <3,801 71.5 <0.0551 <1.65 Run 3 6/6/2008 1408-1630 142
1508-1630 82 <28.8
99.24
<3,801 43.7 <0.0337 <2.76
<7.89
632-702 30 <30.2 <2,161 293 <0.129 <3.86
702-732 30 <30.2 <2,161 160 <0.0701 <2.10
732-840 68 <31.2 <2,233 107 <0.0483 <3.28 Run 4 6/8/2008 632-926 174
840-9261 46 <31.2
98.60
<2,233 59.1 <0.0268 <1.23
<10.5
1 No direct measurements were obtained during this venting cycle interval. These results have been extrapolated.

2-34 Source Test Report for the Coker Steam Vent
2.5 Source Test Results for Non-Methane/Non-Ethane Volatile Organic Compound Emissions The precise and accurate quantification of methane and ethane concentrations in the
Coker Steam Vent gas stream is related to the measurement of VOC emissions because methane and ethane have been determined by EPA to have negligible atmospheric photochemical reactivity. As such, the concentrations of methane and ethane were subtracted from the measurement of THC prior to the development of VOC mass emission rates. VOC results determined in this manner are referred to as non-methane/non-ethane VOC emissions (NMNE VOC).
2.5.1 Source Test Results for Non-Methane/Non-Ethane Volatile Organic
Compound Concentrations Vent gas sampling for the determination of THC concentration was performed according
to EPA Method 25A and the dilution system procedures outlined in Other Test Method 12, significantly modified according to the Protocol conditionally approved by EPA. These methods were applied to measure the concentration of total hydrocarbons (THC) on a wet basis, as propane (C3H8), using two separate THC analyzers equipped with flame ionization detectors (FID). Standards of propane in a balance of nitrogen were used to calibrate all THC analyzers, and nitrogen was also used as the dilution gas with the dilution sampling system.
The THC results are reported as a conservative estimate of total VOC concentration. The
total VOC concentration, in ppmw, was averaged over each of three separate sampling intervals achieved for each venting cycle. NMNE VOC concentration results were obtained by subtracting the methane and ethane concentrations (ppmw), equivalent to propane, from the average total VOC concentration (ppmw) measured during a given sampling interval (see Section 3.6 for details). Figure 2-16 presents the instantaneous total VOC concentration results per elapsed time of the venting cycle for all four test runs performed on the Coker Steam Vent 3 gas stream during the Source Test. A 45-minute gap in instantaneous total VOC data occurred during Run 1 due to a temporary power loss to the THC analyzers. It is important to note that this gap in data begins at the 118th minute of the test run. A 5-minute gap in instantaneous total VOC data occurred during Run 2 due to the temporary loss of dilution gas pressure to the dilution sampling system. Table 2-15 presents the average NMNE VOC concentration results per sampling interval during all four test runs. Appendix 2-5 presents raw data from the THC analyzers. 2.5.2 Source Test Results for Non-Methane/Non-Ethane Volatile Organic
Compound Mass Emission Rates NMNE VOC mass emission rates, calculated in lbs/cycle, are presented in Table 2-16 for
all four test runs. Sections 2.2 and 2.3 discuss the development of pollutant mass emission rates from both measured and extrapolated data.

2-35 Source Test Report for the Coker Steam Vent
Figure 2-16. EPA Method 25A/OTM12 Total VOC Concentration vs. Elapsed Time
Total VOC Concentration1 vs. Elapsed Time (Runs 1-4)
0
1,000
2,000
3,000
4,000
5,000
6,000
7,000
8,000
9,000
10,000
0:00:00 0:16:40 0:33:20 0:50:00 1:06:40 1:23:20 1:40:00 1:56:40 2:13:20 2:30:00 2:46:40 3:03:20
Elapsed Time of Venting Cycle (h:min:sec)
Tota
l VO
C C
once
ntra
tion
(ppm
w)
Run 1Run 2Run 3Run 4
1 Total VOC concentrations always peaked during the first two (2) minutes of every test run. This data is an order of magnitude greater than the total VOC concentrations
measured during the remaining sampling period of each venting cycle and is not presented in Figure 2-16. The peak VOC values (ppmw), per test run, were: 126,652; 175,926; 97,270; and 100,902.

2-36 Source Test Report for the Coker Steam Vent
Table 2-15. Source Test Results for Non-Methane/Non-Ethane Volatile Organic Compound Concentrations
Date Venting Cycle
Venting Cycle
Duration (min)
Sampling Interval
Sampling Duration
(min)
Average Total VOC Conc.
(ppmw)
Methane Conc.
(ppmw)
Methane (ppmw as propane)
Ethane Conc.
(ppmw)
Ethane (ppmw as propane)
Average NMNE VOC Conc.
(ppmw)2
600-631 31 4,703 9,624 3,508 1,092 759 436
631-7011 30 4,227 8,359 3,047 926 643 537 Run 1 6/3/2008 600-1018 258
701-910 129 3,470 7,093 2,586 760 528 357
2235-2305 30 6,497 15,264 5,543 1,829 1,280 -3263
2305-2335 30 5,909 10,398 3,776 1,216 851 1,282 Run 2 6/4-5/2008 2235-130 175
2335-115 100 7,304 10,625 3,859 1,223 856 2,589
1408-1438 30 1,982 4,050 1,463 482 339 180
1438-1508 30 2,037 3,767 1,361 450 317 360 Run 3 6/6/2008 1408-1630 142
1508-1630 82 3,246 5,359 1,936 594 396 915
632-702 30 4,282 8,041 2,930 923 653 699
702-732 30 5,326 9,169 3,341 1,028 728 1,257 Run 4 6/8/2008 632-926 174
732-840 68 5,883 12,799 4,663 1,367 968 252
1 No direct measurements for methane and ethane were obtained during this sampling interval (see Section 2.4). 2 NMNE VOC = Total VOC – Methane (as propane) – Ethane (as propane). 3 A NMNE VOC concentration of 0 was used in the development of a NMNE VOC mass emission rate for this venting cycle interval.

2-37 Source Test Report for the Coker Steam Vent
Table 2-16. Source Test Results for Non-Methane/Non-Ethane Volatile Organic Compound Mass Emission Rates
Date Venting Cycle
Venting Cycle
Duration (min)
Venting Cycle
Interval
Venting Cycle
Interval Duration
(min)
Average NMNE
VOC Conc.(ppmw)
Moisture Conc. (%)
Average NMNE VOC Conc.
(ppmd)
Average Volumetric Flow Rate
(dscfm)
NMNE VOC Mass
Emission Rate
(lb/min)
NMNE VOC Mass
Emission Rate
(lb/interval)
NMNE VOC Mass
Emission Rate
(lb/cycle)
600-631 31 436 38,010 236 1.03 31.9
631-701 30 537 46,747 200 1.07 32.2
701-910 129 357 31,122 156 0.557 71.9 Run 1 6/3/2008 600-1018 258
910-10181 68 357
98.85
31,122 120 0.428 29.1
165
2235-2305 30 0 0 353 0 0
2305-2335 30 1,282 78,702 286 2.58 77.3
2335-115 100 2,589 158,978 142 2.58 258 Run 2 6/4-5/2008 2235-130 175
115-1301 15 2,589
98.37
158,978 68.1 1.24 18.6
354
1408-1438 30 180 23,744 150 0.408 12.3
1438-1508 30 360 47,525 71.5 0.389 11.7 Run 3 6/6/2008 1408-1630 142
1508-1630 82 915
99.24
120,727 43.7 0.604 49.5
73.4
632-702 30 699 50,002 293 1.68 50.4
702-732 30 1,257 89,990 160 1.65 49.4
732-840 68 252 18,007 107 0.220 15.0 Run 4 6/8/2008 632-926 174
840-9261 46 252
98.60
18,007 59.1 0.122 5.61
120
1 No direct measurements were obtained during this venting cycle interval. These results have been extrapolated.

2-38 Source Test Report for the Coker Steam Vent
2.6 Source Test Results for Semivolatile Organic Compound Emissions This section presents selected semivolatile organic compound (SVOC) emission results
obtained during the Source Test of the Coker Steam Vent. Selected SVOC compounds were measured according to modified SW-846 Method 0010 and the Protocol conditionally approved by EPA. It is likely that some SVOCs were quantified with the EPA Method 18/25A/OTM12 dilution sampling system and FID analyses and reported as total VOC and NMNE VOC. Therefore, some overlap may exist between the reported NMNE VOC and total SVOC mass emission rates. Total SVOC mass emission rates ranged between 2 and 6% of the NMNE mass emission rates quantified during the Source Test (per test run). A conservative estimate of the degree of overlap between the total SVOC and NMNE mass emission rate data (e.g., the percentage of the NMNE mass emission rate data that is attributed to total SVOCs quantified though the use of the EPA Method 18/25/OTM12 dilution sampling system) is <6%.
Three sampling fractions were extracted separately in accordance with modified SW-846
Method 3542 and the Protocol. The three sampling train extracts were analyzed separately using SW-846 Method 8270D. The three sampling train fractions that were extracted and analyzed are:
• The combined filter and probe and nozzle rinses; • The combined mid-train rinses and pre-XAD sorbent condensate catch; and • The combined XAD sorbent and post-XAD condensate catch.
Many of the following tables contain results as dry vent gas concentrations that require
the application of multiple analytical results. The SVOC analyses resulted in “hits” from some organic compounds (e.g., naphthalene and its derivatives) several orders of magnitude greater than the method detection limits for non-detected analytes. In all cases where multiple measured results are reported for a single sampling train, if one or more individual results of the data set are reported as a non-detect, the results will be treated as zero (0) in the summation of multiple sample fractions for a total dry gas concentration per sampling train. This convention provides the most supportable results and best estimate of actual emissions from the Coker Steam Vent. In addition to the target SVOC analytes defined in the Protocol, a MS library search was conducted and the 20 most concentrated tentatively identified compounds (TICs) in the vent gas, per sample fraction, are reported in Appendix 2-6.
The Protocol acknowledged that analytical detection limits for selected SVOC dry gas
concentrations would be affected by the reduced dry gas sample volumes acquired through the performance of the SW-846 Method 0010 sampling trains on the high-moisture, high-velocity Coker Steam Vent gas stream. In addition, the high concentrations of some selected SVOCs required multiple dilutions prior to laboratory analysis. After comparing the analytical data

2-39 Source Test Report for the Coker Steam Vent
obtained through this Source Test with professional experience using SW-846 Method 0010 on a variety of combustion sources, URS estimates that the SVOC detection limits achieved through this Source Test are generally at least two orders of magnitude higher than those associated with typical source testing. The full laboratory report detailing the analyses of vent gas samples for SVOC emissions is presented in Appendix 2-7.
2.6.1 Source Test Results for Semivolatile Organic Compound Concentrations
This section discusses selected SVOC concentration results obtained during the Source Test of the Coker Steam Vent. At least three SW-846 Method 0010 sampling trains were performed sequentially during each test run to sample for SVOCs during as much of the complete venting cycle as possible. Each SW-846 Method 0010 sampling train was identified with a unique ID (“A”, “B”, “C”, or “D”). Tables 1-8 through 1-11 presents a summary of SW-846 Method 0010 sampling train sampling intervals during each venting cycle tested during the Source Test. Table 2-17 presents a summary of SW-846 Method 0010 sampling train data such as dry gas volumes collected and isokinetic sampling rates achieved.
SW-846 Method 0100 sampling train “C”, operated during Run 1, did not pass a final
leak test; therefore, the sample fractions were not recovered from this train for analysis. However, vent gas velocity data obtained from this sampling train was used for the purpose of volumetric flow rate extrapolation, as described in Sections 2.2 and 2.3. SVOC concentrations measured with SW-846 Method 0100 sampling train “D” was applied to the venting cycle interval corresponding to the operation of the failed sampling train “C.” Selected SVOC concentrations are presented in Tables 2-18 through 2-29. Note that the dry gas concentrations measured for 2-methylnaphthalene and naphthalene exceeded those measured for other selected SVOCs by one order of magnitude. TIC concentrations are presented in Appendix 2-6.
2.6.2 Source Test Results for Semivolatile Organic Compound
Mass Emission Rates Selected and total SVOC mass emission rates, calculated in lbs/cycle, are presented in
Tables 2-30 through 2-49. Only analytes with measured total concentration results above the detection limit are presented in these tables. Note that the individual mass emission rates developed for 2-methylnapthalene and naphthalene contribute to approximately 70% of the total SVOC mass emission rate developed for each test run. Mass emission rates for TICs were also developed for this report and are presented in Appendix 2-6. The total SVOC mass emission rates presented in Tables 1-4, 1-5, 2-34, 2-39, 2-44, and 2-49 do not include the mass emission rates of TICs. Sections 2.2 and 2.3 discuss the development of pollutant mass emission rates from both measured and extrapolated data.

2-40 Source Test Report for the Coker Steam Vent
Table 2-17. SW-846 Method 0010 Sampling Train Data
Date Sampling
Train ID
Venting Cycle
Venting Cycle
Duration (min)
Sampling Train
Interval
Sampling Train
Duration (min)
Moisture Conc. (%)
Dry Gas Sample Volume (dscf)
Isokinetic Sampling
Rate (%)
A 602-632 30 98.98 0.857 93.3 B 633-703 30 98.64 1.052 94.0 C 704-7341 30 - - -
Run 1 6/3/2008
D
600-1018 258
734-826 52 99.07 1.182 136
A 2236-2306 30 98.63 1.112 83.1 B 2307-2337 30 98.40 1.237 90.2 Run 2 6/4-5/2008
C
2235-130 175
2338-035 57 98.21 2.395 150
A 1409-1439 30 99.35 0.517 98.0 C 1442-1532 50 99.45 0.694 186 Run 3 6/6/2008 D
1408-1630 142 1533-1621 48 98.91 1.221 410
A 633-703 30 98.95 0.857 97.1 B 703-733 30 98.46 1.110 142 Run 4 6/8/2008
C
632-926 174
735-831 56 98.29 2.231 194
1 SW-846 Method 0010 sampling train “C” failed a final leak test, and samples were not recovered from this train for SVOC analysis.

2-41 Source Test Report for the Coker Steam Vent
Table 2-18. SW-846 Method 0010 Sampling Train A Concentration Results – Run 1
Date Venting Cycle
Sampling Interval
Sampling Duration
(min)
Sample Volume (dscf)
Run 1 - Sampling Train A 6/3/2008 600-1018 602-632 30 0.857
SVOC Analyte
Probe and Nozzle Rinses/ Filter Mass (μg)
Pre-XAD Condensate/ Mid-Train
Rinses Mass (μg)
XAD/ Post-XAD
Condensate Mass (μg)
Total Mass (μg)
Total Conc.
(μg/dscf)
Acenaphthene <0.5 820 30 850 992 Diethyl phthalate <1.5 6.9 <3.6 6.90 8.06 p-Dimethylaminoazobenzene <0.5 <9.7 <2.5 0 0 7,12-Dimethylbenz(a)anthracene <0.94 <7.7 <2.6 0 0 2,4-Dimethylphenol <2.9 1,300 <32 1,300 1,520 Dimethyl phthalate <0.63 <5 <2.5 0 0 Aniline <0.95 820 <36 820 957 Di-n-octyl phthalate <2.1 <9.6 <2.8 0 0 4,6-Dinitro-2-methylphenol <5 <5.6 <44 0 0 2,4-Dinitrophenol <5.9 <15 <110 0 0 2,4-Dinitrotoluene <1.6 <10 <2.5 0 0 2,6-Dinitrotoluene <1.3 <7.9 <2.5 0 0 Diphenylamine <0.5 <11 <2.5 0 0 1,2-Diphenylhydrazine <0.63 <5.6 <2.5 0 0 Anthracene 2.5 1,800 26 1,830 2,130 Ethyl methanesulfonate <0.79 <9.8 <2.5 0 0 Fluoranthene 1.4 380 <2.7 381 445 Fluorene <0.51 3,700 59 3,760 4,390 Hexachlorobenzene <0.56 <10 <2.5 0 0 Hexachlorobutadiene <1.4 <7.3 <3.7 0 0 Hexachlorocyclopentadiene <10 <25 <50 0 0 Hexachloroethane <2.5 <7.4 <2.7 0 0 Indeno(1,2,3-cd)pyrene 5.6 12 <2.7 17.6 20.5 Isophorone <0.66 <6.8 <2.5 0 0 3-Methylcholanthrene <0.5 <6.8 <2.5 0 0 Methyl methanesulfonate <0.6 <8.6 <2.8 0 0 2-Methylnaphthalene <0.56 44,000 2,600 46,600 54,400 2-Methylphenol <2.3 1,800 <15 1,800 2,100 Naphthalene <0.5 26,000 2,800 28,800 33,600 1-Naphthylamine <0.93 140 <50 140 163

2-42 Source Test Report for the Coker Steam Vent
Table 2-18. SW-846 Method 0010 Sampling Train A Concentration Results - Run 1 (Continued)
Date Venting Cycle
Sampling Interval
Sampling Duration
(min)
Sample Volume (dscf)
Run 1 - Sampling Train A 6/3/2008 600-1018 602-632 30 0.857
SVOC Analyte
Probe and Nozzle Rinses/ Filter Mass (μg)
Pre-XAD Condensate/ Mid-Train
Rinses Mass (μg)
XAD/ Post-XAD
Condensate Mass (μg)
Total Mass (μg)
Total Conc.
(μg/dscf)
2-Naphthylamine <0.81 120 <50 120 140 2-Nitroaniline <0.56 <11 <2.5 0 0 3-Nitroaniline <3.8 <18 <10 0 0 4-Nitroaniline <2.3 <15 <10 0 0 Nitrobenzene <0.73 <6.3 <2.8 0 0 Benzidine <51 <250 <260 0 0 2-Nitrophenol <3.2 <10 <2.5 0 0 4-Nitrophenol <3.3 <15 <16 0 0 N-Nitrosodi-n-butylamine <0.86 <10 <2.5 0 0 N-Nitrosodimethylamine <0.72 <8.3 <2.5 0 0 Benzo(a)anthracene 5.5 270 <2.9 276 322 N-Nitrosodi-n-propylamine <0.73 <8.8 <2.5 0 0 N-Nitrosodiphenylamine <0.6 <5.2 <4.4 0 0 N-Nitrosopiperidine <0.62 <7.3 <2.5 0 0 Benzo(b)fluoranthene 2.5 20 <5.5 22.5 26.3 Benzo(k)fluoranthene 2.1 19 <8 21.1 24.6 Benzoic acid <42 <36 <230 0 0 Benzo(ghi)perylene 17 28 <3.1 45.0 52.5 Pentachlorobenzene <0.52 <8.7 <2.5 0 0 Benzo(a)pyrene 13 83 <2.5 96.0 112 Pentachloronitrobenzene <0.76 <10 <2.5 0 0 Pentachlorophenol <25 <13 <120 0 0 Phenacetin <0.51 <9 <2.5 0 0 Benzyl alcohol <35 <7.6 <180 0 0 Phenanthrene 5 9,400 64 9,470 11,100 Phenol <1.1 2,300 <4.5 2,300 2,690 2-Picoline <0.98 630 <5.5 630 735 Pyrene 5.5 1,200 4 1,210 1,410 Pyridine <0.89 210 <3.7 210 245 Acetophenone <0.77 400 <12 400 467

2-43 Source Test Report for the Coker Steam Vent
Table 2-18. SW-846 Method 0010 Sampling Train A Concentration Results - Run 1 (Continued)
Date Venting Cycle
Sampling Interval
Sampling Duration
(min)
Sample Volume (dscf)
Run 1 - Sampling Train A 6/3/2008 600-1018 602-632 30 0.857
SVOC Analyte
Probe and Nozzle Rinses/ Filter Mass (μg)
Pre-XAD Condensate/ Mid-Train
Rinses Mass (μg)
XAD/ Post-XAD
Condensate Mass (μg)
Total Mass (μg)
Total Conc.
(μg/dscf)
1,2,4,5-Tetrachlorobenzene <0.87 <8.2 <2.5 0 0 2,3,4,6-Tetrachlorophenol <1.1 <13 <3.2 0 0 1,2,4-Trichlorobenzene <0.73 <8.2 <3 0 0 2,4,5-Trichlorophenol <2.3 <8.1 <6.5 0 0 2,4,6-Trichlorophenol <1.4 <9.6 <3.8 0 0 Carbazole 1.2 690 <3.2 691 807 3-Methylphenol & 4-Methylphenol <2.3 1,900 <10 1,900 2,220 bis(2-Chloroethoxy)methane <0.59 <7.6 <2.5 0 0 bis(2-Chloroethyl) ether <0.76 <6.4 <2.8 0 0 bis(2-Chloroisopropyl) ether <1 <6.7 <3.8 0 0 bis(2-Ethylhexyl) phthalate 3.6 <8 <50 3.60 4.20 4-Bromophenyl phenyl ether <0.53 <5.4 <2.5 0 0 Butyl benzyl phthalate <1.1 <8.7 <3 0 0 Acenaphthylene <0.5 63 <2.5 63.0 73.5 4-Chloroaniline <1.2 <30 <30 0 0 4-Chloro-3-methylphenol <1 <25 <3.1 0 0 1-Chloronaphthalene <0.5 <8.9 <2.5 0 0 2-Chloronaphthalene <0.5 <5.3 <2.5 0 0 2-Chlorophenol <0.98 <6.3 <2.5 0 0 4-Chlorophenyl phenyl ether <0.51 <12 <2.5 0 0 Chrysene 6.4 270 <3.2 276 323 Dibenz(a,h)anthracene 7.7 17 <3 24.7 28.8 Dibenzofuran <0.53 470 16 486 567 Di-n-butyl phthalate 2.1 22 <50 24.1 28.1 1,2-Dichlorobenzene <0.84 <6.6 <2.6 0 0 1,3-Dichlorobenzene <1.2 <5.4 <2.8 0 0 1,4-Dichlorobenzene <1.1 <7.7 <2.6 0 0 3,3'-Dichlorobenzidine <2.7 <30 <37 0 0 4-Aminobiphenyl <1.1 <14 <50 0 0 2,4-Dichlorophenol <1.5 <8.9 <2.5 0 0 2,6-Dichlorophenol <0.72 <10 <2.5 0 0

2-44 Source Test Report for the Coker Steam Vent
Table 2-19. SW-846 Method 0010 Sampling Train B Concentration Results - Run 1
Date Venting Cycle
Sampling Interval
Sampling Duration
(min)
Sample Volume (dscf)
Run 1 - Sampling Train B 6/3/2008 600-1018 633-703 30 1.052
SVOC Analyte
Probe and Nozzle Rinses/ Filter Mass (μg)
Pre-XAD Condensate/ Mid-Train
Rinses Mass (μg)
XAD/ Post-XAD
Condensate Mass (μg)
Total Mass (μg)
Total Conc.
(μg/dscf)
Acenaphthene <0.5 310 9.9 320 304 Diethyl phthalate <1.5 5 <3.6 5.00 4.75 p-Dimethylaminoazobenzene <0.5 <4.8 <2.5 0 0 7,12-Dimethylbenz(a)anthracene <0.94 <3.8 <2.6 0 0 2,4-Dimethylphenol <2.9 630 <32 630 599 Dimethyl phthalate <0.63 <2.5 <2.5 0 0 Aniline <0.95 480 <36 480 456 Di-n-octyl phthalate <2.1 <4.8 <2.8 0 0 4,6-Dinitro-2-methylphenol <5 <2.8 <44 0 0 2,4-Dinitrophenol <5.9 <7.6 <110 0 0 2,4-Dinitrotoluene <1.6 <5.2 <2.5 0 0 2,6-Dinitrotoluene <1.3 <4 <2.5 0 0 Diphenylamine <0.5 <5.5 <2.5 0 0 1,2-Diphenylhydrazine <0.63 <2.8 <2.5 0 0 Anthracene 1.6 700 8.2 710 675 Ethyl methanesulfonate <0.79 <4.9 <2.5 0 0 Fluoranthene 0.68 120 <2.7 121 115 Fluorene <0.51 750 18 768 730 Hexachlorobenzene <0.56 <5 <2.5 0 0 Hexachlorobutadiene <1.4 <3.6 <3.7 0 0 Hexachlorocyclopentadiene <10 <12 <50 0 0 Hexachloroethane <2.5 <3.7 <2.7 0 0 Indeno(1,2,3-cd)pyrene <2.1 <4.3 <2.7 0 0 Isophorone <0.66 <3.4 <2.5 0 0 3-Methylcholanthrene <0.5 <3.4 <2.5 0 0 Methyl methanesulfonate <0.6 <4.3 <2.8 0 0 2-Methylnaphthalene <0.56 17,000 880 17,900 17,000 2-Methylphenol <2.3 910 <15 910 865 Naphthalene <0.5 12,000 1,200 13,200 12,500 1-Naphthylamine <0.93 63 <50 63.0 59.9

2-45 Source Test Report for the Coker Steam Vent
Table 2-19. SW-846 Method 0010 Sampling Train B Concentration Results - Run 1 (Continued)
Date Venting Cycle
Sampling Interval
Sampling Duration
(min)
Sample Volume (dscf)
Run 1 - Sampling Train B 6/3/2008 600-1018 633-703 30 1.052
SVOC Analyte
Probe and Nozzle Rinses/ Filter Mass (μg)
Pre-XAD Condensate/ Mid-Train
Rinses Mass (μg)
XAD/ Post-XAD
Condensate Mass (μg)
Total Mass (μg)
Total Conc.
(μg/dscf)
2-Naphthylamine <0.81 56 <50 56.0 53.2 2-Nitroaniline <0.56 <5.3 <2.5 0 0 3-Nitroaniline <3.8 <9 <10 0 0 4-Nitroaniline <2.3 <7.3 <10 0 0 Nitrobenzene <0.73 <3.2 <2.8 0 0 Benzidine <51 <120 <260 0 0 2-Nitrophenol <3.2 <5 <2.5 0 0 4-Nitrophenol <3.3 <7.3 <16 0 0 N-Nitrosodi-n-butylamine <0.86 <5 <2.5 0 0 N-Nitrosodimethylamine <0.72 <4.2 <2.5 0 0 Benzo(a)anthracene 2 74 <2.9 76.0 72.2 N-Nitrosodi-n-propylamine <0.73 <4.4 <2.5 0 0 N-Nitrosodiphenylamine <0.6 <2.6 <4.4 0 0 N-Nitrosopiperidine <0.62 <3.6 <2.5 0 0 Benzo(b)fluoranthene <1.4 <8 <5.5 0 0 Benzo(k)fluoranthene <2.1 <5.5 <8 0 0 Benzoic acid <42 <18 <230 0 0 Benzo(ghi)perylene 5.1 7.7 <3.1 12.8 12.2 Pentachlorobenzene <0.52 <4.4 <2.5 0 0 Benzo(a)pyrene 3.7 18 <2.5 21.7 20.6 Pentachloronitrobenzene <0.76 <5 <2.5 0 0 Pentachlorophenol <25 <6.6 <120 0 0 Phenacetin <0.51 <4.5 <2.5 0 0 Benzyl alcohol <35 <3.8 <180 0 0 Phenanthrene 3.2 3,000 20 3,020 2,870 Phenol <1.1 1,200 <4.5 1,200 1,140 2-Picoline <0.98 480 <5.5 480 456 Pyrene 2.6 420 <2.6 423 402 Pyridine <0.89 180 <3.7 180 171 Acetophenone <0.77 210 <12 210 200

2-46 Source Test Report for the Coker Steam Vent
Table 2-19. SW-846 Method 0010 Sampling Train B Concentration Results - Run 1 (Continued)
Date Venting Cycle
Sampling Interval
Sampling Duration
(min)
Sample Volume (dscf)
Run 1 - Sampling Train B 6/3/2008 600-1018 633-703 30 1.052
SVOC Analyte
Probe and Nozzle Rinses/ Filter Mass (μg)
Pre-XAD Condensate/ Mid-Train
Rinses Mass (μg)
XAD/ Post-XAD
Condensate Mass (μg)
Total Mass (μg)
Total Conc.
(μg/dscf)
1,2,4,5-Tetrachlorobenzene <0.87 <4.1 <2.5 0 0 2,3,4,6-Tetrachlorophenol <1.1 <6.5 <3.2 0 0 1,2,4-Trichlorobenzene <0.73 <4.1 <3 0 0 2,4,5-Trichlorophenol <2.3 <4 <6.5 0 0 2,4,6-Trichlorophenol <1.4 <4.8 <3.8 0 0 Carbazole <0.76 270 <3.2 270 257 3-Methylphenol & 4-Methylphenol <2.3 980 <10 980 931 bis(2-Chloroethoxy)methane <0.59 <3.8 <2.5 0 0 bis(2-Chloroethyl) ether <0.76 <3.2 <2.8 0 0 bis(2-Chloroisopropyl) ether <1 <3.4 <3.8 0 0 bis(2-Ethylhexyl) phthalate 4.2 <4 <50 4.20 3.99 4-Bromophenyl phenyl ether <0.53 <2.7 <2.5 0 0 Butyl benzyl phthalate <1.1 <4.4 <3 0 0 Acenaphthylene <0.5 22 <2.5 22.0 20.9 4-Chloroaniline <1.2 <15 <30 0 0 4-Chloro-3-methylphenol <1 <12 <3.1 0 0 1-Chloronaphthalene <0.5 <4.4 <2.5 0 0 2-Chloronaphthalene <0.5 <2.6 <2.5 0 0 2-Chlorophenol <0.98 <3.2 <2.5 0 0 4-Chlorophenyl phenyl ether <0.51 <6 <2.5 0 0 Chrysene 2.3 69 <3.2 71.3 67.8 Dibenz(a,h)anthracene 2.5 <5.4 <3 2.50 2.38 Dibenzofuran <0.53 190 5.6 196 186 Di-n-butyl phthalate 1.3 5.8 <50 7.10 6.75 1,2-Dichlorobenzene <0.84 <3.3 <2.6 0 0 1,3-Dichlorobenzene <1.2 <2.7 <2.8 0 0 1,4-Dichlorobenzene <1.1 <3.8 <2.6 0 0 3,3'-Dichlorobenzidine <2.7 <15 <37 0 0 4-Aminobiphenyl <1.1 <7 <50 0 0 2,4-Dichlorophenol <1.5 <4.4 <2.5 0 0 2,6-Dichlorophenol <0.72 <5 <2.5 0 0

2-47 Source Test Report for the Coker Steam Vent
Table 2-20. SW-846 Method 0010 Sampling Train D Concentration Results - Run 1
Date Venting Cycle
Sampling Interval
Sampling Duration
(min)
Sample Volume (dscf)
Run 1 - Sampling Train D 6/3/2008 600-1018 704-734 30 1.182
SVOC Analyte
Probe and Nozzle Rinses/ Filter Mass (μg)
Pre-XAD Condensate/ Mid-Train
Rinses Mass (μg)
XAD/ Post-XAD
Condensate Mass (μg)
Total Mass (μg)
Total Conc.
(μg/dscf)
Acenaphthene <0.5 1,000 120 1,120 947 Diethyl phthalate <1.5 <11 <3.6 0 0 p-Dimethylaminoazobenzene <0.5 <19 <2.5 0 0 7,12-Dimethylbenz(a)anthracene <0.94 <15 <2.6 0 0 2,4-Dimethylphenol <2.9 1,400 <32 1,400 1,180 Dimethyl phthalate <0.63 <10 <2.5 0 0 Aniline <0.95 1,100 50 1,150 973 Di-n-octyl phthalate <2.1 <19 <2.8 0 0 4,6-Dinitro-2-methylphenol <5 <11 <44 0 0 2,4-Dinitrophenol <5.9 <30 <110 0 0 2,4-Dinitrotoluene <1.6 <21 <2.5 0 0 2,6-Dinitrotoluene <1.3 <16 <2.5 0 0 Diphenylamine <0.5 <22 <2.5 0 0 1,2-Diphenylhydrazine <0.63 <11 <2.5 0 0 Anthracene <0.51 2,400 350 2,750 2,330 Ethyl methanesulfonate <0.79 <20 <2.5 0 0 Fluoranthene <0.5 540 52 592 501 Fluorene <0.51 2,900 360 3,260 2,760 Hexachlorobenzene <0.56 <20 <2.5 0 0 Hexachlorobutadiene <1.4 <15 <3.7 0 0 Hexachlorocyclopentadiene <10 <50 <50 0 0 Hexachloroethane <2.5 <15 <2.7 0 0 Indeno(1,2,3-cd)pyrene <2.1 <17 <2.7 0 0 Isophorone <0.66 <14 <2.5 0 0 3-Methylcholanthrene <0.5 <14 <2.5 0 0 Methyl methanesulfonate <0.6 <17 <2.8 0 0 2-Methylnaphthalene <0.56 49,000 6,800 55,800 47,200 2-Methylphenol <2.3 2,600 200 2,800 2,370 Naphthalene <0.5 29,000 5,400 34,400 29,100 1-Naphthylamine <0.93 160 <50 160 135
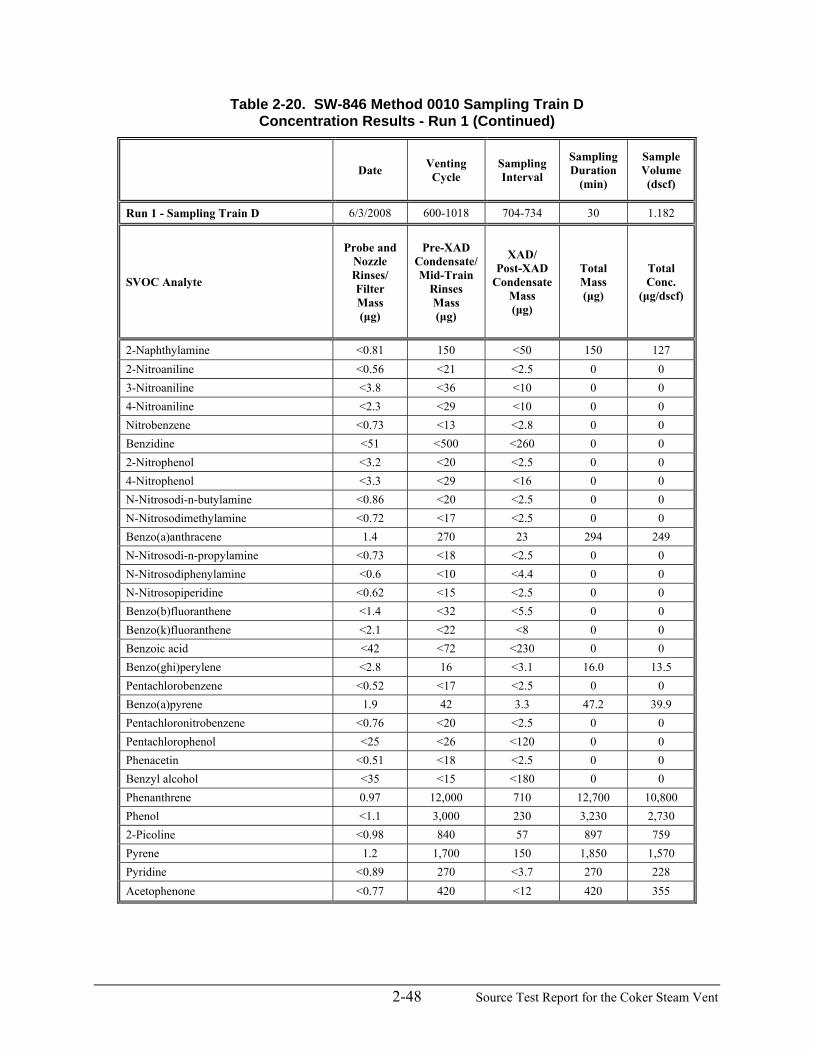
2-48 Source Test Report for the Coker Steam Vent
Table 2-20. SW-846 Method 0010 Sampling Train D Concentration Results - Run 1 (Continued)
Date Venting Cycle
Sampling Interval
Sampling Duration
(min)
Sample Volume (dscf)
Run 1 - Sampling Train D 6/3/2008 600-1018 704-734 30 1.182
SVOC Analyte
Probe and Nozzle Rinses/ Filter Mass (μg)
Pre-XAD Condensate/ Mid-Train
Rinses Mass (μg)
XAD/ Post-XAD
Condensate Mass (μg)
Total Mass (μg)
Total Conc.
(μg/dscf)
2-Naphthylamine <0.81 150 <50 150 127 2-Nitroaniline <0.56 <21 <2.5 0 0 3-Nitroaniline <3.8 <36 <10 0 0 4-Nitroaniline <2.3 <29 <10 0 0 Nitrobenzene <0.73 <13 <2.8 0 0 Benzidine <51 <500 <260 0 0 2-Nitrophenol <3.2 <20 <2.5 0 0 4-Nitrophenol <3.3 <29 <16 0 0 N-Nitrosodi-n-butylamine <0.86 <20 <2.5 0 0 N-Nitrosodimethylamine <0.72 <17 <2.5 0 0 Benzo(a)anthracene 1.4 270 23 294 249 N-Nitrosodi-n-propylamine <0.73 <18 <2.5 0 0 N-Nitrosodiphenylamine <0.6 <10 <4.4 0 0 N-Nitrosopiperidine <0.62 <15 <2.5 0 0 Benzo(b)fluoranthene <1.4 <32 <5.5 0 0 Benzo(k)fluoranthene <2.1 <22 <8 0 0 Benzoic acid <42 <72 <230 0 0 Benzo(ghi)perylene <2.8 16 <3.1 16.0 13.5 Pentachlorobenzene <0.52 <17 <2.5 0 0 Benzo(a)pyrene 1.9 42 3.3 47.2 39.9 Pentachloronitrobenzene <0.76 <20 <2.5 0 0 Pentachlorophenol <25 <26 <120 0 0 Phenacetin <0.51 <18 <2.5 0 0 Benzyl alcohol <35 <15 <180 0 0 Phenanthrene 0.97 12,000 710 12,700 10,800 Phenol <1.1 3,000 230 3,230 2,730 2-Picoline <0.98 840 57 897 759 Pyrene 1.2 1,700 150 1,850 1,570 Pyridine <0.89 270 <3.7 270 228 Acetophenone <0.77 420 <12 420 355

2-49 Source Test Report for the Coker Steam Vent
Table 2-20. SW-846 Method 0010 Sampling Train D Concentration Results - Run 1 (Continued)
Date Venting Cycle
Sampling Interval
Sampling Duration
(min)
Sample Volume (dscf)
Run 1 - Sampling Train D 6/3/2008 600-1018 704-734 30 1.182
SVOC Analyte
Probe and Nozzle Rinses/ Filter Mass (μg)
Pre-XAD Condensate/ Mid-Train
Rinses Mass (μg)
XAD/ Post-XAD
Condensate Mass (μg)
Total Mass (μg)
Total Conc.
(μg/dscf)
1,2,4,5-Tetrachlorobenzene <0.87 <16 <2.5 0 0 2,3,4,6-Tetrachlorophenol <1.1 <26 <3.2 0 0 1,2,4-Trichlorobenzene <0.73 <16 <3 0 0 2,4,5-Trichlorophenol <2.3 <16 <6.5 0 0 2,4,6-Trichlorophenol <1.4 <19 <3.8 0 0 Carbazole <0.76 820 100 920 778 3-Methylphenol & 4-Methylphenol <2.3 2,600 210 2,810 2,380 bis(2-Chloroethoxy)methane <0.59 <15 <2.5 0 0 bis(2-Chloroethyl) ether <0.76 <13 <2.8 0 0 bis(2-Chloroisopropyl) ether <1 <13 <3.8 0 0 bis(2-Ethylhexyl) phthalate <3.3 <16 <50 0 0 4-Bromophenyl phenyl ether <0.53 <11 <2.5 0 0 Butyl benzyl phthalate <1.1 <17 <3 0 0 Acenaphthylene <0.5 54 <2.5 54.0 45.7 4-Chloroaniline <1.2 <61 <30 0 0 4-Chloro-3-methylphenol <1 <50 <3.1 0 0 1-Chloronaphthalene <0.5 <18 <2.5 0 0 2-Chloronaphthalene <0.5 <11 <2.5 0 0 2-Chlorophenol <0.98 <13 <2.5 0 0 4-Chlorophenyl phenyl ether <0.51 <24 <2.5 0 0 Chrysene 1.4 270 22 293 248 Dibenz(a,h)anthracene <2 <22 <3 0 0 Dibenzofuran <0.53 660 74 734 621 Di-n-butyl phthalate 0.94 <17 <50 0.940 0.795 1,2-Dichlorobenzene <0.84 <13 <2.6 0 0 1,3-Dichlorobenzene <1.2 <11 <2.8 0 0 1,4-Dichlorobenzene <1.1 <15 <2.6 0 0 3,3'-Dichlorobenzidine <2.7 <59 <37 0 0 4-Aminobiphenyl <1.1 <28 <50 0 0 2,4-Dichlorophenol <1.5 <18 <2.5 0 0 2,6-Dichlorophenol <0.72 <20 <2.5 0 0
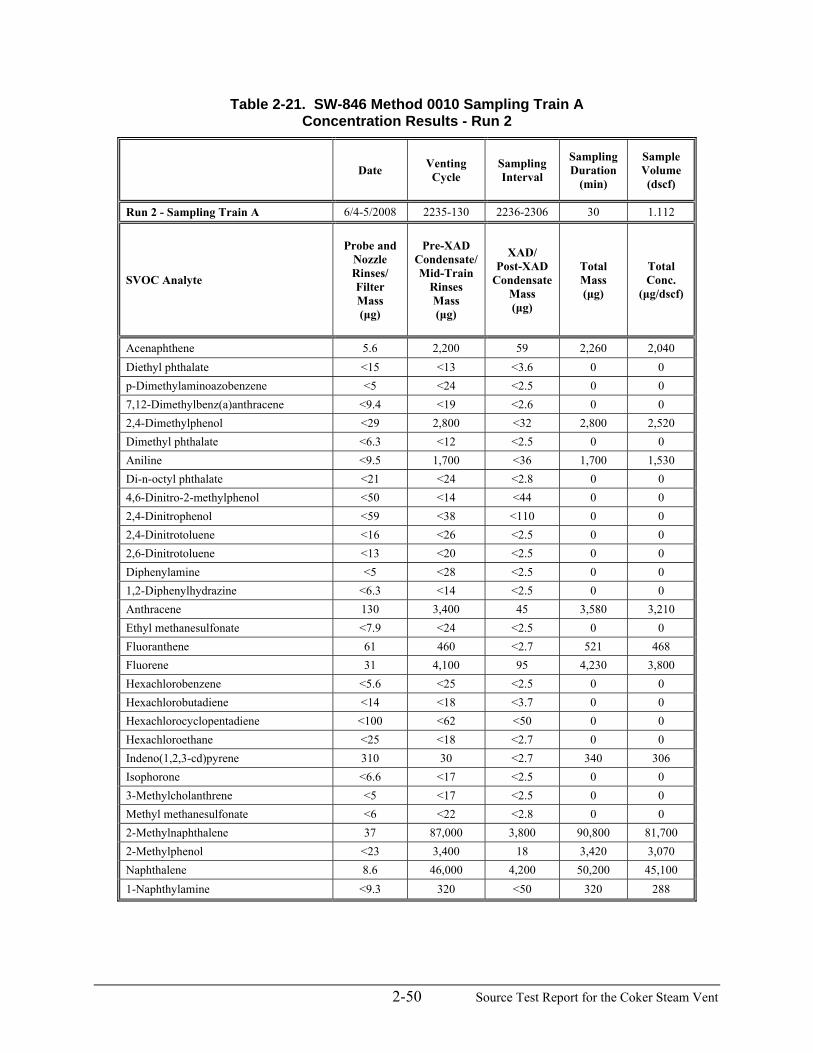
2-50 Source Test Report for the Coker Steam Vent
Table 2-21. SW-846 Method 0010 Sampling Train A Concentration Results - Run 2
Date Venting Cycle
Sampling Interval
Sampling Duration
(min)
Sample Volume (dscf)
Run 2 - Sampling Train A 6/4-5/2008 2235-130 2236-2306 30 1.112
SVOC Analyte
Probe and Nozzle Rinses/ Filter Mass (μg)
Pre-XAD Condensate/ Mid-Train
Rinses Mass (μg)
XAD/ Post-XAD
Condensate Mass (μg)
Total Mass (μg)
Total Conc.
(μg/dscf)
Acenaphthene 5.6 2,200 59 2,260 2,040 Diethyl phthalate <15 <13 <3.6 0 0 p-Dimethylaminoazobenzene <5 <24 <2.5 0 0 7,12-Dimethylbenz(a)anthracene <9.4 <19 <2.6 0 0 2,4-Dimethylphenol <29 2,800 <32 2,800 2,520 Dimethyl phthalate <6.3 <12 <2.5 0 0 Aniline <9.5 1,700 <36 1,700 1,530 Di-n-octyl phthalate <21 <24 <2.8 0 0 4,6-Dinitro-2-methylphenol <50 <14 <44 0 0 2,4-Dinitrophenol <59 <38 <110 0 0 2,4-Dinitrotoluene <16 <26 <2.5 0 0 2,6-Dinitrotoluene <13 <20 <2.5 0 0 Diphenylamine <5 <28 <2.5 0 0 1,2-Diphenylhydrazine <6.3 <14 <2.5 0 0 Anthracene 130 3,400 45 3,580 3,210 Ethyl methanesulfonate <7.9 <24 <2.5 0 0 Fluoranthene 61 460 <2.7 521 468 Fluorene 31 4,100 95 4,230 3,800 Hexachlorobenzene <5.6 <25 <2.5 0 0 Hexachlorobutadiene <14 <18 <3.7 0 0 Hexachlorocyclopentadiene <100 <62 <50 0 0 Hexachloroethane <25 <18 <2.7 0 0 Indeno(1,2,3-cd)pyrene 310 30 <2.7 340 306 Isophorone <6.6 <17 <2.5 0 0 3-Methylcholanthrene <5 <17 <2.5 0 0 Methyl methanesulfonate <6 <22 <2.8 0 0 2-Methylnaphthalene 37 87,000 3,800 90,800 81,700 2-Methylphenol <23 3,400 18 3,420 3,070 Naphthalene 8.6 46,000 4,200 50,200 45,100 1-Naphthylamine <9.3 320 <50 320 288

2-51 Source Test Report for the Coker Steam Vent
Table 2-21. SW-846 Method 0010 Sampling Train A Concentration Results - Run 2 (Continued)
Date Venting Cycle
Sampling Interval
Sampling Duration
(min)
Sample Volume (dscf)
Run 2 - Sampling Train A 6/4-5/2008 2235-130 2236-2306 30 1.112
SVOC Analyte
Probe and Nozzle Rinses/ Filter Mass (μg)
Pre-XAD Condensate/ Mid-Train
Rinses Mass (μg)
XAD/ Post-XAD
Condensate Mass (μg)
Total Mass (μg)
Total Conc.
(μg/dscf)
2-Naphthylamine <8.1 290 <50 290 261 2-Nitroaniline <5.6 <26 <2.5 0 0 3-Nitroaniline <38 <45 <10 0 0 4-Nitroaniline <23 <36 <10 0 0 Nitrobenzene <7.3 <16 <2.8 0 0 Benzidine <510 <620 <260 0 0 2-Nitrophenol <32 <25 <2.5 0 0 4-Nitrophenol <33 <36 <16 0 0 N-Nitrosodi-n-butylamine <8.6 <25 <2.5 0 0 N-Nitrosodimethylamine <7.2 <21 <2.5 0 0 Benzo(a)anthracene 520 640 <2.9 1,160 1,040 N-Nitrosodi-n-propylamine <7.3 <22 <2.5 0 0 N-Nitrosodiphenylamine <6 <13 <4.4 0 0 N-Nitrosopiperidine <6.2 <18 <2.5 0 0 Benzo(b)fluoranthene 200 110 <5.5 310 279 Benzo(k)fluoranthene 160 86 <8 246 221 Benzoic acid <420 <90 <230 0 0 Benzo(ghi)perylene 620 61 <3.1 681 612 Pentachlorobenzene <5.2 <22 <2.5 0 0 Benzo(a)pyrene 900 370 <2.5 1,270 1,140 Pentachloronitrobenzene <7.6 <25 <2.5 0 0 Pentachlorophenol <250 <33 <120 0 0 Phenacetin <5.1 <22 <2.5 0 0 Benzyl alcohol <350 <19 <180 0 0 Phenanthrene 220 5,000 97 5,320 4,780 Phenol <11 3,400 <4.5 3,400 3,060 2-Picoline <9.8 1,300 44 1,340 1,210 Pyrene 270 1,600 6.2 1,880 1,690 Pyridine <8.9 500 <3.7 500 450 Acetophenone <7.7 950 <12 950 854

2-52 Source Test Report for the Coker Steam Vent
Table 2-21. SW-846 Method 0010 Sampling Train A Concentration Results - Run 2 (Continued)
Date Venting Cycle
Sampling Interval
Sampling Duration
(min)
Sample Volume (dscf)
Run 2 - Sampling Train A 6/4-5/2008 2235-130 2236-2306 30 1.112
SVOC Analyte
Probe and Nozzle Rinses/ Filter Mass (μg)
Pre-XAD Condensate/ Mid-Train
Rinses Mass (μg)
XAD/ Post-XAD
Condensate Mass (μg)
Total Mass (μg)
Total Conc.
(μg/dscf)
1,2,4,5-Tetrachlorobenzene <8.7 <20 <2.5 0 0 2,3,4,6-Tetrachlorophenol <11 <32 <3.2 0 0 1,2,4-Trichlorobenzene <7.3 <20 <3 0 0 2,4,5-Trichlorophenol <23 <20 <6.5 0 0 2,4,6-Trichlorophenol <14 <24 <3.8 0 0 Carbazole 64 980 <3.2 1,040 939 3-Methylphenol & 4-Methylphenol <23 3,400 <10 3,400 3,060 bis(2-Chloroethoxy)methane <5.9 <19 <2.5 0 0 bis(2-Chloroethyl) ether <7.6 <16 <2.8 0 0 bis(2-Chloroisopropyl) ether <10 <17 <3.8 0 0 bis(2-Ethylhexyl) phthalate <33 <20 <50 0 0 4-Bromophenyl phenyl ether <5.3 <14 <2.5 0 0 Butyl benzyl phthalate <11 <22 <3 0 0 Acenaphthylene <5 150 <2.5 150 135 4-Chloroaniline <12 <76 <30 0 0 4-Chloro-3-methylphenol <10 <62 <3.1 0 0 1-Chloronaphthalene <5 <22 <2.5 0 0 2-Chloronaphthalene <5 <13 <2.5 0 0 2-Chlorophenol <9.8 <16 <2.5 0 0 4-Chlorophenyl phenyl ether <5.1 <30 <2.5 0 0 Chrysene 530 640 <3.2 1,170 1,050 Dibenz(a,h)anthracene 610 49 <3 659 593 Dibenzofuran <5.3 980 25 1,010 904 Di-n-butyl phthalate <7.1 <22 <50 0 0 1,2-Dichlorobenzene <8.4 <16 <2.6 0 0 1,3-Dichlorobenzene <12 <14 <2.8 0 0 1,4-Dichlorobenzene <11 <19 <2.6 0 0 3,3'-Dichlorobenzidine <27 <74 <37 0 0 4-Aminobiphenyl <11 <35 <50 0 0 2,4-Dichlorophenol <15 <22 <2.5 0 0 2,6-Dichlorophenol <7.2 <25 <2.5 0 0
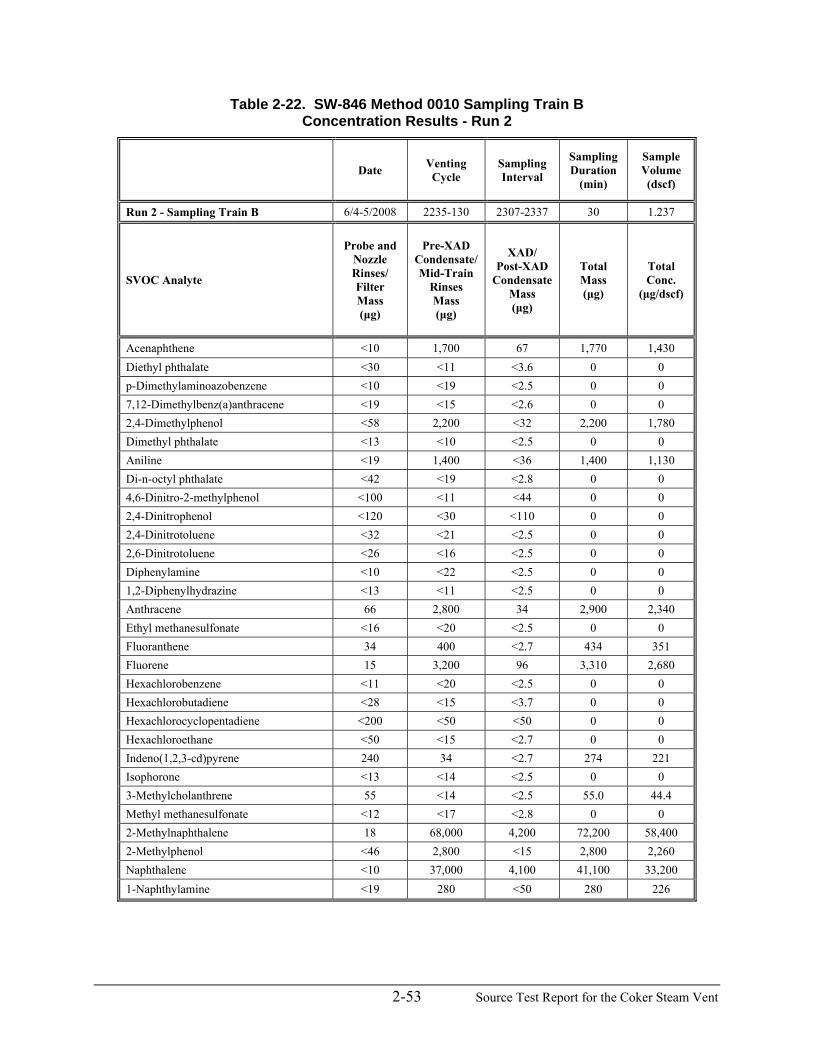
2-53 Source Test Report for the Coker Steam Vent
Table 2-22. SW-846 Method 0010 Sampling Train B Concentration Results - Run 2
Date Venting Cycle
Sampling Interval
Sampling Duration
(min)
Sample Volume (dscf)
Run 2 - Sampling Train B 6/4-5/2008 2235-130 2307-2337 30 1.237
SVOC Analyte
Probe and Nozzle Rinses/ Filter Mass (μg)
Pre-XAD Condensate/ Mid-Train
Rinses Mass (μg)
XAD/ Post-XAD
Condensate Mass (μg)
Total Mass (μg)
Total Conc.
(μg/dscf)
Acenaphthene <10 1,700 67 1,770 1,430 Diethyl phthalate <30 <11 <3.6 0 0 p-Dimethylaminoazobenzene <10 <19 <2.5 0 0 7,12-Dimethylbenz(a)anthracene <19 <15 <2.6 0 0 2,4-Dimethylphenol <58 2,200 <32 2,200 1,780 Dimethyl phthalate <13 <10 <2.5 0 0 Aniline <19 1,400 <36 1,400 1,130 Di-n-octyl phthalate <42 <19 <2.8 0 0 4,6-Dinitro-2-methylphenol <100 <11 <44 0 0 2,4-Dinitrophenol <120 <30 <110 0 0 2,4-Dinitrotoluene <32 <21 <2.5 0 0 2,6-Dinitrotoluene <26 <16 <2.5 0 0 Diphenylamine <10 <22 <2.5 0 0 1,2-Diphenylhydrazine <13 <11 <2.5 0 0 Anthracene 66 2,800 34 2,900 2,340 Ethyl methanesulfonate <16 <20 <2.5 0 0 Fluoranthene 34 400 <2.7 434 351 Fluorene 15 3,200 96 3,310 2,680 Hexachlorobenzene <11 <20 <2.5 0 0 Hexachlorobutadiene <28 <15 <3.7 0 0 Hexachlorocyclopentadiene <200 <50 <50 0 0 Hexachloroethane <50 <15 <2.7 0 0 Indeno(1,2,3-cd)pyrene 240 34 <2.7 274 221 Isophorone <13 <14 <2.5 0 0 3-Methylcholanthrene 55 <14 <2.5 55.0 44.4 Methyl methanesulfonate <12 <17 <2.8 0 0 2-Methylnaphthalene 18 68,000 4,200 72,200 58,400 2-Methylphenol <46 2,800 <15 2,800 2,260 Naphthalene <10 37,000 4,100 41,100 33,200 1-Naphthylamine <19 280 <50 280 226

2-54 Source Test Report for the Coker Steam Vent
Table 2-22. SW-846 Method 0010 Sampling Train B Concentration Results - Run 2 (Continued)
Date Venting Cycle
Sampling Interval
Sampling Duration
(min)
Sample Volume (dscf)
Run 2 - Sampling Train B 6/4-5/2008 2235-130 2307-2337 30 1.237
SVOC Analyte
Probe and Nozzle Rinses/ Filter Mass (μg)
Pre-XAD Condensate/ Mid-Train
Rinses Mass (μg)
XAD/ Post-XAD
Condensate Mass (μg)
Total Mass (μg)
Total Conc.
(μg/dscf)
2-Naphthylamine <16 240 <50 240 194 2-Nitroaniline <11 <21 <2.5 0 0 3-Nitroaniline <76 <36 <10 0 0 4-Nitroaniline <46 <29 <10 0 0 Nitrobenzene <15 <13 <2.8 0 0 Benzidine <1000 <500 <260 0 0 2-Nitrophenol <64 <20 <2.5 0 0 4-Nitrophenol <66 <29 <16 0 0 N-Nitrosodi-n-butylamine <17 <20 <2.5 0 0 N-Nitrosodimethylamine <14 <17 <2.5 0 0 Benzo(a)anthracene 330 660 <2.9 990 800 N-Nitrosodi-n-propylamine <15 <18 <2.5 0 0 N-Nitrosodiphenylamine <12 <10 <4.4 0 0 N-Nitrosopiperidine <12 <15 <2.5 0 0 Benzo(b)fluoranthene 170 120 <5.5 290 234 Benzo(k)fluoranthene 120 110 <8 230 186 Benzoic acid <840 <72 <230 0 0 Benzo(ghi)perylene 580 65 <3.1 645 521 Pentachlorobenzene <10 <17 <2.5 0 0 Benzo(a)pyrene 740 420 <2.5 1,160 937 Pentachloronitrobenzene <15 <20 <2.5 0 0 Pentachlorophenol <500 <26 <120 0 0 Phenacetin <10 <18 <2.5 0 0 Benzyl alcohol <700 <15 <180 0 0 Phenanthrene 120 11,000 74 11,200 9,050 Phenol <22 3,000 <4.5 3,000 2,420 2-Picoline <20 960 <5.5 960 776 Pyrene 150 1,400 4 1,550 1,260 Pyridine <18 360 <3.7 360 291 Acetophenone <15 680 <12 680 550

2-55 Source Test Report for the Coker Steam Vent
Table 2-22. SW-846 Method 0010 Sampling Train B Concentration Results - Run 2 (Continued)
Date Venting Cycle
Sampling Interval
Sampling Duration
(min)
Sample Volume (dscf)
Run 2 - Sampling Train B 6/4-5/2008 2235-130 2307-2337 30 1.237
SVOC Analyte
Probe and Nozzle Rinses/ Filter Mass (μg)
Pre-XAD Condensate/ Mid-Train
Rinses Mass (μg)
XAD/ Post-XAD
Condensate Mass (μg)
Total Mass (μg)
Total Conc.
(μg/dscf)
1,2,4,5-Tetrachlorobenzene <17 <16 <2.5 0 0 2,3,4,6-Tetrachlorophenol <22 <26 <3.2 0 0 1,2,4-Trichlorobenzene <15 <16 <3 0 0 2,4,5-Trichlorophenol <46 <16 <6.5 0 0 2,4,6-Trichlorophenol <28 <19 <3.8 0 0 Carbazole 32 860 <3.2 892 721 3-Methylphenol & 4-Methylphenol <46 2,900 <10 2,900 2,340 bis(2-Chloroethoxy)methane <12 <15 <2.5 0 0 bis(2-Chloroethyl) ether <15 <13 <2.8 0 0 bis(2-Chloroisopropyl) ether <20 <13 <3.8 0 0 bis(2-Ethylhexyl) phthalate <66 <16 <50 0 0 4-Bromophenyl phenyl ether <11 <11 <2.5 0 0 Butyl benzyl phthalate <22 <17 <3 0 0 Acenaphthylene <10 120 <2.5 120 97.0 4-Chloroaniline <24 <61 <30 0 0 4-Chloro-3-methylphenol <20 <50 <3.1 0 0 1-Chloronaphthalene <10 <18 <2.5 0 0 2-Chloronaphthalene <10 <11 <2.5 0 0 2-Chlorophenol <20 <13 <2.5 0 0 4-Chlorophenyl phenyl ether <10 <24 <2.5 0 0 Chrysene 360 710 <3.2 1,070 865 Dibenz(a,h)anthracene 380 48 <3 428 346 Dibenzofuran <11 790 27 817 660 Di-n-butyl phthalate <14 <17 <50 0 0 1,2-Dichlorobenzene <17 <13 <2.6 0 0 1,3-Dichlorobenzene <24 <11 <2.8 0 0 1,4-Dichlorobenzene <22 <15 <2.6 0 0 3,3'-Dichlorobenzidine <54 <59 <37 0 0 4-Aminobiphenyl <22 <28 <50 0 0 2,4-Dichlorophenol <30 <18 <2.5 0 0 2,6-Dichlorophenol <14 <20 <2.5 0 0

2-56 Source Test Report for the Coker Steam Vent
Table 2-23. SW-846 Method 0010 Sampling Train C Concentration Results - Run 2
Date Venting Cycle
Sampling Interval
Sampling Duration
(min)
Sample Volume (dscf)
Run 2 - Sampling Train C 6/4-5/2008 2235-130 2338-035 57 2.395
SVOC Analyte
Probe and Nozzle Rinses/ Filter Mass (μg)
Pre-XAD Condensate/ Mid-Train
Rinses Mass (μg)
XAD/ Post-XAD
Condensate Mass (μg)
Total Mass (μg)
Total Conc.
(μg/dscf)
Acenaphthene <10 2,500 700 3,200 1,340 Diethyl phthalate <30 <26 <15 0 0 p-Dimethylaminoazobenzene <10 <48 <10 0 0 7,12-Dimethylbenz(a)anthracene <19 <38 <10 0 0 2,4-Dimethylphenol <58 3,400 530 3,930 1,640 Dimethyl phthalate <13 <25 <10 0 0 Aniline <19 2,600 240 2,840 1,190 Di-n-octyl phthalate <42 <48 <11 0 0 4,6-Dinitro-2-methylphenol <100 <28 <170 0 0 2,4-Dinitrophenol <120 <76 <440 0 0 2,4-Dinitrotoluene <32 <52 <10 0 0 2,6-Dinitrotoluene <26 <40 <10 0 0 Diphenylamine <10 <55 <10 0 0 1,2-Diphenylhydrazine <13 <28 <10 0 0 Anthracene 130 4,900 1,400 6,430 2,680 Ethyl methanesulfonate <16 <49 <10 0 0 Fluoranthene 64 580 150 794 331 Fluorene 32 5,600 1,600 7,230 3,020 Hexachlorobenzene <11 <50 <10 0 0 Hexachlorobutadiene <28 <36 <15 0 0 Hexachlorocyclopentadiene <200 <120 <200 0 0 Hexachloroethane <50 <37 <11 0 0 Indeno(1,2,3-cd)pyrene 510 76 <11 586 245 Isophorone <13 <34 <10 0 0 3-Methylcholanthrene <10 <34 <10 0 0 Methyl methanesulfonate <12 <43 <11 0 0 2-Methylnaphthalene 46 100,000 28,000 128,000 53,500 2-Methylphenol <46 4,800 670 5,470 2,280 Naphthalene 11 59,000 18,000 77,000 32,200 1-Naphthylamine <19 440 <200 440 184

2-57 Source Test Report for the Coker Steam Vent
Table 2-23. SW-846 Method 0010 Sampling Train C Concentration Results - Run 2 (Continued)
Date Venting Cycle
Sampling Interval
Sampling Duration
(min)
Sample Volume (dscf)
Run 2 - Sampling Train C 6/4-5/2008 2235-130 2338-035 57 2.395
SVOC Analyte
Probe and Nozzle Rinses/ Filter Mass (μg)
Pre-XAD Condensate/ Mid-Train
Rinses Mass (μg)
XAD/ Post-XAD
Condensate Mass (μg)
Total Mass (μg)
Total Conc.
(μg/dscf)
2-Naphthylamine <16 460 <200 460 192 2-Nitroaniline <11 <53 <10 0 0 3-Nitroaniline <76 <90 <40 0 0 4-Nitroaniline <46 <73 <40 0 0 Nitrobenzene <15 <32 <11 0 0 Benzidine <1000 <1200 <1000 0 0 2-Nitrophenol <64 <50 <10 0 0 4-Nitrophenol <66 <73 <66 0 0 N-Nitrosodi-n-butylamine <17 <50 <10 0 0 N-Nitrosodimethylamine <14 <42 <10 0 0 Benzo(a)anthracene 620 1,100 220 1,940 810 N-Nitrosodi-n-propylamine <15 <44 <10 0 0 N-Nitrosodiphenylamine <12 <26 <17 0 0 N-Nitrosopiperidine <12 <36 <10 0 0 Benzo(b)fluoranthene 280 240 25 545 228 Benzo(k)fluoranthene 230 180 <32 410 171 Benzoic acid <840 <180 <920 0 0 Benzo(ghi)perylene 1,000 140 <12 1,140 476 Pentachlorobenzene <10 <44 <10 0 0 Benzo(a)pyrene 1,300 850 78 2,230 930 Pentachloronitrobenzene <15 <50 <10 0 0 Pentachlorophenol <500 <66 <500 0 0 Phenacetin <10 <45 <10 0 0 Benzyl alcohol <700 <38 <700 0 0 Phenanthrene 230 7,600 2,500 10,300 4,310 Phenol <22 4,800 630 5,430 2,270 2-Picoline <20 2,000 200 2,200 918 Pyrene 260 2,200 460 2,920 1,220 Pyridine <18 740 <15 740 309 Acetophenone <15 1,200 <49 1,200 501

2-58 Source Test Report for the Coker Steam Vent
Table 2-23. SW-846 Method 0010 Sampling Train C Concentration Results - Run 2 (Continued)
Date Venting Cycle
Sampling Interval
Sampling Duration
(min)
Sample Volume (dscf)
Run 2 - Sampling Train C 6/4-5/2008 2235-130 2338-035 57 2.395
SVOC Analyte
Probe and Nozzle Rinses/ Filter Mass (μg)
Pre-XAD Condensate/ Mid-Train
Rinses Mass (μg)
XAD/ Post-XAD
Condensate Mass (μg)
Total Mass (μg)
Total Conc.
(μg/dscf)
1,2,4,5-Tetrachlorobenzene <17 <41 <10 0 0 2,3,4,6-Tetrachlorophenol <22 <65 <13 0 0 1,2,4-Trichlorobenzene <15 <41 <12 0 0 2,4,5-Trichlorophenol <46 <40 <26 0 0 2,4,6-Trichlorophenol <28 <48 <15 0 0 Carbazole 62 1,300 340 1,700 711 3-Methylphenol & 4-Methylphenol <46 4,700 620 5,320 2,220 bis(2-Chloroethoxy)methane <12 <38 <10 0 0 bis(2-Chloroethyl) ether <15 <32 <11 0 0 bis(2-Chloroisopropyl) ether <20 <34 <15 0 0 bis(2-Ethylhexyl) phthalate <66 <40 <200 0 0 4-Bromophenyl phenyl ether <11 <27 <10 0 0 Butyl benzyl phthalate <22 <44 <12 0 0 Acenaphthylene <10 160 <10 160 66.8 4-Chloroaniline <24 <150 <120 0 0 4-Chloro-3-methylphenol <20 <120 <12 0 0 1-Chloronaphthalene <10 <44 <10 0 0 2-Chloronaphthalene <10 <26 <10 0 0 2-Chlorophenol <20 <32 <10 0 0 4-Chlorophenyl phenyl ether <10 <60 <10 0 0 Chrysene 640 1,200 220 2,060 860 Dibenz(a,h)anthracene 640 110 <12 750 313 Dibenzofuran <11 1,300 360 1,660 693 Di-n-butyl phthalate <14 <43 <200 0 0 1,2-Dichlorobenzene <17 <33 <10 0 0 1,3-Dichlorobenzene <24 <27 <11 0 0 1,4-Dichlorobenzene <22 <38 <11 0 0 3,3'-Dichlorobenzidine <54 <150 <150 0 0 4-Aminobiphenyl <22 <70 <200 0 0 2,4-Dichlorophenol <30 <44 <10 0 0 2,6-Dichlorophenol <14 <50 <10 0 0
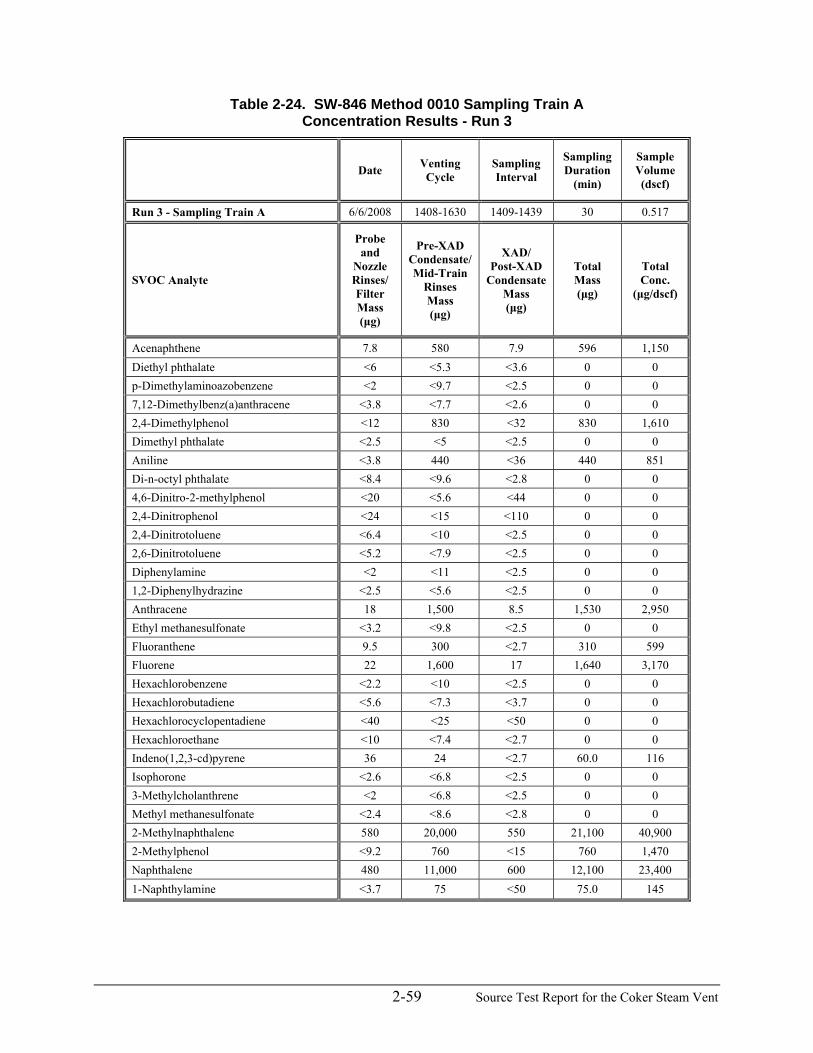
2-59 Source Test Report for the Coker Steam Vent
Table 2-24. SW-846 Method 0010 Sampling Train A Concentration Results - Run 3
Date Venting Cycle
Sampling Interval
Sampling Duration
(min)
Sample Volume (dscf)
Run 3 - Sampling Train A 6/6/2008 1408-1630 1409-1439 30 0.517
SVOC Analyte
Probe and
Nozzle Rinses/ Filter Mass (μg)
Pre-XAD Condensate/ Mid-Train
Rinses Mass (μg)
XAD/ Post-XAD
Condensate Mass (μg)
Total Mass (μg)
Total Conc.
(μg/dscf)
Acenaphthene 7.8 580 7.9 596 1,150 Diethyl phthalate <6 <5.3 <3.6 0 0 p-Dimethylaminoazobenzene <2 <9.7 <2.5 0 0 7,12-Dimethylbenz(a)anthracene <3.8 <7.7 <2.6 0 0 2,4-Dimethylphenol <12 830 <32 830 1,610 Dimethyl phthalate <2.5 <5 <2.5 0 0 Aniline <3.8 440 <36 440 851 Di-n-octyl phthalate <8.4 <9.6 <2.8 0 0 4,6-Dinitro-2-methylphenol <20 <5.6 <44 0 0 2,4-Dinitrophenol <24 <15 <110 0 0 2,4-Dinitrotoluene <6.4 <10 <2.5 0 0 2,6-Dinitrotoluene <5.2 <7.9 <2.5 0 0 Diphenylamine <2 <11 <2.5 0 0 1,2-Diphenylhydrazine <2.5 <5.6 <2.5 0 0 Anthracene 18 1,500 8.5 1,530 2,950 Ethyl methanesulfonate <3.2 <9.8 <2.5 0 0 Fluoranthene 9.5 300 <2.7 310 599 Fluorene 22 1,600 17 1,640 3,170 Hexachlorobenzene <2.2 <10 <2.5 0 0 Hexachlorobutadiene <5.6 <7.3 <3.7 0 0 Hexachlorocyclopentadiene <40 <25 <50 0 0 Hexachloroethane <10 <7.4 <2.7 0 0 Indeno(1,2,3-cd)pyrene 36 24 <2.7 60.0 116 Isophorone <2.6 <6.8 <2.5 0 0 3-Methylcholanthrene <2 <6.8 <2.5 0 0 Methyl methanesulfonate <2.4 <8.6 <2.8 0 0 2-Methylnaphthalene 580 20,000 550 21,100 40,900 2-Methylphenol <9.2 760 <15 760 1,470 Naphthalene 480 11,000 600 12,100 23,400 1-Naphthylamine <3.7 75 <50 75.0 145

2-60 Source Test Report for the Coker Steam Vent
Table 2-24. SW-846 Method 0010 Sampling Train A Concentration Results - Run 3 (Continued)
Date Venting Cycle
Sampling Interval
Sampling Duration
(min)
Sample Volume (dscf)
Run 3 - Sampling Train A 6/6/2008 1408-1630 1409-1439 30 0.517
SVOC Analyte
Probe and
Nozzle Rinses/ Filter Mass (μg)
Pre-XAD Condensate/ Mid-Train
Rinses Mass (μg)
XAD/ Post-XAD
Condensate Mass (μg)
Total Mass (μg)
Total Conc.
(μg/dscf)
2-Naphthylamine <3.2 72 <50 72.0 139 2-Nitroaniline <2.2 <11 <2.5 0 0 3-Nitroaniline <15 <18 <10 0 0 4-Nitroaniline <9.2 <15 <10 0 0 Nitrobenzene <2.9 <6.3 <2.8 0 0 Benzidine <200 <250 <260 0 0 2-Nitrophenol <13 <10 <2.5 0 0 4-Nitrophenol <13 <15 <16 0 0 N-Nitrosodi-n-butylamine <3.4 <10 <2.5 0 0 N-Nitrosodimethylamine <2.9 <8.3 <2.5 0 0 Benzo(a)anthracene 72 320 <2.9 392 758 N-Nitrosodi-n-propylamine <2.9 <8.8 <2.5 0 0 N-Nitrosodiphenylamine <2.4 <5.2 <4.4 0 0 N-Nitrosopiperidine <2.5 <7.3 <2.5 0 0 Benzo(b)fluoranthene 29 44 <5.5 73.0 141 Benzo(k)fluoranthene 23 41 <8 64.0 124 Benzoic acid <170 <36 <230 0 0 Benzo(ghi)perylene 88 58 <3.1 146 282 Pentachlorobenzene <2.1 <8.7 <2.5 0 0 Benzo(a)pyrene 130 160 <2.5 290 561 Pentachloronitrobenzene <3 <10 <2.5 0 0 Pentachlorophenol <100 <13 <120 0 0 Phenacetin <2 <9 <2.5 0 0 Benzyl alcohol <140 <7.6 <180 0 0 Phenanthrene 76 5,400 26 5,500 10,600 Phenol <4.4 560 <4.5 560 1,080 2-Picoline <3.9 360 7.8 368 711 Pyrene 42 920 <2.6 962 1,860 Pyridine <3.6 140 <3.7 140 271 Acetophenone <3.1 <10 <12 0 0

2-61 Source Test Report for the Coker Steam Vent
Table 2-24. SW-846 Method 0010 Sampling Train A Concentration Results - Run 3 (Continued)
Date Venting Cycle
Sampling Interval
Sampling Duration
(min)
Sample Volume (dscf)
Run 3 - Sampling Train A 6/6/2008 1408-1630 1409-1439 30 0.517
SVOC Analyte
Probe and
Nozzle Rinses/ Filter Mass (μg)
Pre-XAD Condensate/ Mid-Train
Rinses Mass (μg)
XAD/ Post-XAD
Condensate Mass (μg)
Total Mass (μg)
Total Conc.
(μg/dscf)
1,2,4,5-Tetrachlorobenzene <3.5 <8.2 <2.5 0 0 2,3,4,6-Tetrachlorophenol <4.4 <13 <3.2 0 0 1,2,4-Trichlorobenzene <2.9 <8.2 <3 0 0 2,4,5-Trichlorophenol <9.2 <8.1 <6.5 0 0 2,4,6-Trichlorophenol <5.6 <9.6 <3.8 0 0 Carbazole 8.4 480 <3.2 488 945 3-Methylphenol & 4-Methylphenol <9.2 660 <10 660 1,280 bis(2-Chloroethoxy)methane <2.4 <7.6 <2.5 0 0 bis(2-Chloroethyl) ether <3 <6.4 <2.8 0 0 bis(2-Chloroisopropyl) ether <4 <6.7 <3.8 0 0 bis(2-Ethylhexyl) phthalate <13 <8 <50 0 0 4-Bromophenyl phenyl ether <2.1 <5.4 <2.5 0 0 Butyl benzyl phthalate <4.4 <8.7 <3 0 0 Acenaphthylene <2 36 <2.5 36.0 69.6 4-Chloroaniline <4.8 <30 <30 0 0 4-Chloro-3-methylphenol <4 <25 <3.1 0 0 1-Chloronaphthalene <2 <8.9 <2.5 0 0 2-Chloronaphthalene <2 <5.3 <2.5 0 0 2-Chlorophenol <3.9 <6.3 <2.5 0 0 4-Chlorophenyl phenyl ether <2 <12 <2.5 0 0 Chrysene 79 340 <3.2 419 810 Dibenz(a,h)anthracene 52 36 <3 88.0 170 Dibenzofuran 4.9 330 3.8 339 655 Di-n-butyl phthalate <2.8 <8.6 <50 0 0 1,2-Dichlorobenzene <3.4 <6.6 <2.6 0 0 1,3-Dichlorobenzene <4.8 <5.4 <2.8 0 0 1,4-Dichlorobenzene <4.4 <7.7 <2.6 0 0 3,3'-Dichlorobenzidine <11 <30 <37 0 0 4-Aminobiphenyl <4.4 <14 <50 0 0 2,4-Dichlorophenol <6 <8.9 <2.5 0 0 2,6-Dichlorophenol <2.9 <10 <2.5 0 0

2-62 Source Test Report for the Coker Steam Vent
Table 2-25. SW-846 Method 0010 Sampling Train C Concentration Results - Run 3
Date Venting Cycle
Sampling Interval
Sampling Duration
(min)
Sample Volume (dscf)
Run 3 - Sampling Train C 6/6/2008 1408-1630 1442-1532 50 0.694
SVOC Analyte
Probe and
Nozzle Rinses/ Filter Mass (μg)
Pre-XAD Condensate/ Mid-Train
Rinses Mass (μg)
XAD/ Post-XAD
Condensate Mass (μg)
Total Mass (μg)
Total Conc.
(μg/dscf)
Acenaphthene <5 740 140 880 1,270 Diethyl phthalate <15 <5.3 <3.6 0 0 p-Dimethylaminoazobenzene <5 <9.7 <2.5 0 0 7,12-Dimethylbenz(a)anthracene <9.4 <7.7 <2.6 0 0 2,4-Dimethylphenol <29 1,100 77 1,180 1,700 Dimethyl phthalate <6.3 <5 <2.5 0 0 Aniline <9.5 660 <36 660 951 Di-n-octyl phthalate <21 <9.6 <2.8 0 0 4,6-Dinitro-2-methylphenol <50 <5.6 <44 0 0 2,4-Dinitrophenol <59 <15 <110 0 0 2,4-Dinitrotoluene <16 <10 <2.5 0 0 2,6-Dinitrotoluene <13 <7.9 <2.5 0 0 Diphenylamine <5 <11 <2.5 0 0 1,2-Diphenylhydrazine <6.3 <5.6 <2.5 0 0 Anthracene 40 1,800 390 2,230 3,210 Ethyl methanesulfonate <7.9 <9.8 <2.5 0 0 Fluoranthene 28 360 54 442 637 Fluorene 8.2 1,900 380 2,290 3,300 Hexachlorobenzene <5.6 <10 <2.5 0 0 Hexachlorobutadiene <14 <7.3 <3.7 0 0 Hexachlorocyclopentadiene <100 <25 <50 0 0 Hexachloroethane <25 <7.4 <2.7 0 0 Indeno(1,2,3-cd)pyrene 240 18 2.9 261 376 Isophorone <6.6 <6.8 <2.5 0 0 3-Methylcholanthrene <5 <6.8 <2.5 0 0 Methyl methanesulfonate <6 <8.6 <2.8 0 0 2-Methylnaphthalene 10 32,000 5,600 37,600 54,200 2-Methylphenol <23 1,000 99 1,100 1,580 Naphthalene <5 18,000 4,100 22,100 31,800 1-Naphthylamine <9.3 110 <50 110 159

2-63 Source Test Report for the Coker Steam Vent
Table 2-25. SW-846 Method 0010 Sampling Train C Concentration Results - Run 3 (Continued)
Date Venting Cycle
Sampling Interval
Sampling Duration
(min)
Sample Volume (dscf)
Run 3 - Sampling Train C 6/6/2008 1408-1630 1442-1532 50 0.694
SVOC Analyte
Probe and
Nozzle Rinses/ Filter Mass (μg)
Pre-XAD Condensate/ Mid-Train
Rinses Mass (μg)
XAD/ Post-XAD
Condensate Mass (μg)
Total Mass (μg)
Total Conc.
(μg/dscf)
2-Naphthylamine <8.1 98 <50 98.0 141 2-Nitroaniline <5.6 <11 <2.5 0 0 3-Nitroaniline <38 <18 <10 0 0 4-Nitroaniline <23 <15 <10 0 0 Nitrobenzene <7.3 <6.3 <2.8 0 0 Benzidine <510 <250 <260 0 0 2-Nitrophenol <32 <10 <2.5 0 0 4-Nitrophenol <33 <15 <16 0 0 N-Nitrosodi-n-butylamine <8.6 <10 <2.5 0 0 N-Nitrosodimethylamine <7.2 <8.3 <2.5 0 0 Benzo(a)anthracene 320 460 54 834 1,200 N-Nitrosodi-n-propylamine <7.3 <8.8 <2.5 0 0 N-Nitrosodiphenylamine <6 <5.2 <4.4 0 0 N-Nitrosopiperidine <6.2 <7.3 <2.5 0 0 Benzo(b)fluoranthene 150 66 7.1 223 322 Benzo(k)fluoranthene 130 57 <8 187 269 Benzoic acid <420 <36 <230 0 0 Benzo(ghi)perylene 490 32 5 527 759 Pentachlorobenzene <5.2 <8.7 <2.5 0 0 Benzo(a)pyrene 680 220 27 927 1,340 Pentachloronitrobenzene <7.6 <10 <2.5 0 0 Pentachlorophenol <250 <13 <120 0 0 Phenacetin <5.1 <9 <2.5 0 0 Benzyl alcohol <350 <7.6 <180 0 0 Phenanthrene 77 6,800 740 7,620 11,000 Phenol <11 900 93 993 1,430 2-Picoline <9.8 530 79 609 878 Pyrene 120 1,100 170 1,390 2,000 Pyridine <8.9 210 <3.7 210 303 Acetophenone <7.7 350 <12 350 504

2-64 Source Test Report for the Coker Steam Vent
Table 2-25. SW-846 Method 0010 Sampling Train C Concentration Results - Run 3 (Continued)
Date Venting Cycle
Sampling Interval
Sampling Duration
(min)
Sample Volume (dscf)
Run 3 - Sampling Train C 6/6/2008 1408-1630 1442-1532 50 0.694
SVOC Analyte
Probe and
Nozzle Rinses/ Filter Mass (μg)
Pre-XAD Condensate/ Mid-Train
Rinses Mass (μg)
XAD/ Post-XAD
Condensate Mass (μg)
Total Mass (μg)
Total Conc.
(μg/dscf)
1,2,4,5-Tetrachlorobenzene <8.7 <8.2 <2.5 0 0 2,3,4,6-Tetrachlorophenol <11 <13 <3.2 0 0 1,2,4-Trichlorobenzene <7.3 <8.2 <3 0 0 2,4,5-Trichlorophenol <23 <8.1 <6.5 0 0 2,4,6-Trichlorophenol <14 <9.6 <3.8 0 0 Carbazole 19 600 92 711 1,020 3-Methylphenol & 4-Methylphenol <23 970 91 1,060 1,530 bis(2-Chloroethoxy)methane <5.9 <7.6 <2.5 0 0 bis(2-Chloroethyl) ether <7.6 <6.4 <2.8 0 0 bis(2-Chloroisopropyl) ether <10 <6.7 <3.8 0 0 bis(2-Ethylhexyl) phthalate <33 <8 <50 0 0 4-Bromophenyl phenyl ether <5.3 <5.4 <2.5 0 0 Butyl benzyl phthalate <11 <8.7 <3 0 0 Acenaphthylene <5 66 11 77.0 111 4-Chloroaniline <12 <30 <30 0 0 4-Chloro-3-methylphenol <10 <25 <3.1 0 0 1-Chloronaphthalene <5 <8.9 <2.5 0 0 2-Chloronaphthalene <5 <5.3 <2.5 0 0 2-Chlorophenol <9.8 <6.3 <2.5 0 0 4-Chlorophenyl phenyl ether <5.1 <12 <2.5 0 0 Chrysene 350 450 55 855 1,230 Dibenz(a,h)anthracene 290 25 3.4 318 459 Dibenzofuran <5.3 430 78 508 732 Di-n-butyl phthalate <7.1 <8.6 <50 0 0 1,2-Dichlorobenzene <8.4 <6.6 <2.6 0 0 1,3-Dichlorobenzene <12 <5.4 <2.8 0 0 1,4-Dichlorobenzene <11 <7.7 <2.6 0 0 3,3'-Dichlorobenzidine <27 <30 <37 0 0 4-Aminobiphenyl <11 <14 <50 0 0 2,4-Dichlorophenol <15 <8.9 <2.5 0 0 2,6-Dichlorophenol <7.2 <10 <2.5 0 0

2-65 Source Test Report for the Coker Steam Vent
Table 2-26. SW-846 Method 0010 Sampling Train D Concentration Results - Run 3
Date Venting Cycle
Sampling Interval
Sampling Duration
(min)
Sample Volume (dscf)
Run 3 - Sampling Train D 6/6/2008 1408-1630 1533-1621 48 1.221
SVOC Analyte
Probe and
Nozzle Rinses/ Filter Mass (μg)
Pre-XAD Condensate/ Mid-Train
Rinses Mass (μg)
XAD/ Post-XAD
Condensate Mass (μg)
Total Mass (μg)
Total Conc.
(μg/dscf)
Acenaphthene <0.5 680 19 699 572 Diethyl phthalate <1.5 <5.3 <3.6 0 0 p-Dimethylaminoazobenzene <0.5 <9.7 <2.5 0 0 7,12-Dimethylbenz(a)anthracene <0.94 <7.7 <2.6 0 0 2,4-Dimethylphenol <2.9 630 <32 630 516 Dimethyl phthalate <0.63 <5 <2.5 0 0 Aniline <0.95 360 <36 360 295 Di-n-octyl phthalate <2.1 <9.6 <2.8 0 0 4,6-Dinitro-2-methylphenol <5 <5.6 <44 0 0 2,4-Dinitrophenol <5.9 <15 <110 0 0 2,4-Dinitrotoluene <1.6 <10 <2.5 0 0 2,6-Dinitrotoluene <1.3 <7.9 <2.5 0 0 Diphenylamine <0.5 <11 <2.5 0 0 1,2-Diphenylhydrazine <0.63 <5.6 <2.5 0 0 Anthracene 2.6 1,600 11 1,610 1,320 Ethyl methanesulfonate <0.79 <9.8 <2.5 0 0 Fluoranthene 1 330 <2.7 331 271 Fluorene 0.65 1,700 31 1,730 1,420 Hexachlorobenzene <0.56 <10 <2.5 0 0 Hexachlorobutadiene <1.4 <7.3 <3.7 0 0 Hexachlorocyclopentadiene <10 <25 <50 0 0 Hexachloroethane <2.5 <7.4 <2.7 0 0 Indeno(1,2,3-cd)pyrene 13 39 <2.7 52.0 42.6 Isophorone <0.66 <6.8 <2.5 0 0 3-Methylcholanthrene <0.5 <6.8 <2.5 0 0 Methyl methanesulfonate <0.6 <8.6 <2.8 0 0 2-Methylnaphthalene 1.8 33,000 2,100 35,100 28,700 2-Methylphenol <2.3 570 <15 570 467 Naphthalene 0.9 20,000 3,000 23,000 18,800 1-Naphthylamine <0.93 65 <50 65.0 53.2

2-66 Source Test Report for the Coker Steam Vent
Table 2-26. SW-846 Method 0010 Sampling Train D Concentration Results - Run 3 (Continued)
Date Venting Cycle
Sampling Interval
Sampling Duration
(min)
Sample Volume (dscf)
Run 3 - Sampling Train D 6/6/2008 1408-1630 1533-1621 48 1.221
SVOC Analyte
Probe and
Nozzle Rinses/ Filter Mass (μg)
Pre-XAD Condensate/ Mid-Train
Rinses Mass (μg)
XAD/ Post-XAD
Condensate Mass (μg)
Total Mass (μg)
Total Conc.
(μg/dscf)
2-Naphthylamine <0.81 58 <50 58.0 47.5 2-Nitroaniline <0.56 <11 <2.5 0 0 3-Nitroaniline <3.8 <18 <10 0 0 4-Nitroaniline <2.3 <15 <10 0 0 Nitrobenzene <0.73 <6.3 <2.8 0 0 Benzidine <51 <250 <260 0 0 2-Nitrophenol <3.2 <10 <2.5 0 0 4-Nitrophenol <3.3 <15 <16 0 0 N-Nitrosodi-n-butylamine <0.86 <10 <2.5 0 0 N-Nitrosodimethylamine <0.72 <8.3 <2.5 0 0 Benzo(a)anthracene 8 350 <2.9 358 293 N-Nitrosodi-n-propylamine <0.73 <8.8 <2.5 0 0 N-Nitrosodiphenylamine <0.6 <5.2 <4.4 0 0 N-Nitrosopiperidine <0.62 <7.3 <2.5 0 0 Benzo(b)fluoranthene 5.4 52 <5.5 57.4 47.0 Benzo(k)fluoranthene 4.3 49 <8 53.3 43.6 Benzoic acid <42 <36 <230 0 0 Benzo(ghi)perylene 36 96 <3.1 132 108 Pentachlorobenzene <0.52 <8.7 <2.5 0 0 Benzo(a)pyrene 28 220 <2.5 248 203 Pentachloronitrobenzene <0.76 <10 <2.5 0 0 Pentachlorophenol <25 <13 <120 0 0 Phenacetin <0.51 <9 <2.5 0 0 Benzyl alcohol <35 <7.6 <180 0 0 Phenanthrene 5.2 6,000 39 6,040 4,950 Phenol <1.1 510 11 521 427 2-Picoline <0.98 380 <5.5 380 311 Pyrene 4.2 1,000 2.8 1,010 824 Pyridine <0.89 160 <3.7 160 131 Acetophenone <0.77 <10 <12 0 0

2-67 Source Test Report for the Coker Steam Vent
Table 2-26. SW-846 Method 0010 Sampling Train D Concentration Results - Run 3 (Continued)
Date Venting Cycle
Sampling Interval
Sampling Duration
(min)
Sample Volume (dscf)
Run 3 - Sampling Train D 6/6/2008 1408-1630 1533-1621 48 1.221
SVOC Analyte
Probe and
Nozzle Rinses/ Filter Mass (μg)
Pre-XAD Condensate/ Mid-Train
Rinses Mass (μg)
XAD/ Post-XAD
Condensate Mass (μg)
Total Mass (μg)
Total Conc.
(μg/dscf)
1,2,4,5-Tetrachlorobenzene <0.87 <8.2 <2.5 0 0 2,3,4,6-Tetrachlorophenol <1.1 <13 <3.2 0 0 1,2,4-Trichlorobenzene <0.73 <8.2 <3 0 0 2,4,5-Trichlorophenol <2.3 <8.1 <6.5 0 0 2,4,6-Trichlorophenol <1.4 <9.6 <3.8 0 0 Carbazole <0.76 450 <3.2 450 368 3-Methylphenol & 4-Methylphenol <2.3 500 <10 500 409 bis(2-Chloroethoxy)methane <0.59 <7.6 <2.5 0 0 bis(2-Chloroethyl) ether <0.76 <6.4 <2.8 0 0 bis(2-Chloroisopropyl) ether <1 <6.7 <3.8 0 0 bis(2-Ethylhexyl) phthalate <3.3 11 <50 11.0 9.01 4-Bromophenyl phenyl ether <0.53 <5.4 <2.5 0 0 Butyl benzyl phthalate <1.1 <8.7 <3 0 0 Acenaphthylene <0.5 65 <2.5 65.0 53.2 4-Chloroaniline <1.2 <30 <30 0 0 4-Chloro-3-methylphenol <1 <25 <3.1 0 0 1-Chloronaphthalene <0.5 <8.9 <2.5 0 0 2-Chloronaphthalene <0.5 <5.3 <2.5 0 0 2-Chlorophenol <0.98 <6.3 <2.5 0 0 4-Chlorophenyl phenyl ether <0.51 <12 <2.5 0 0 Chrysene 9.4 340 <3.2 349 286 Dibenz(a,h)anthracene 18 56 <3 74.0 60.6 Dibenzofuran <0.53 380 9.4 389 319 Di-n-butyl phthalate 1.3 <8.6 <50 1.30 1.06 1,2-Dichlorobenzene <0.84 <6.6 <2.6 0 0 1,3-Dichlorobenzene <1.2 <5.4 <2.8 0 0 1,4-Dichlorobenzene <1.1 <7.7 <2.6 0 0 3,3'-Dichlorobenzidine <2.7 <30 <37 0 0 4-Aminobiphenyl <1.1 <14 <50 0 0 2,4-Dichlorophenol <1.5 <8.9 <2.5 0 0 2,6-Dichlorophenol <0.72 <10 <2.5 0 0

2-68 Source Test Report for the Coker Steam Vent
Table 2-27. SW-846 Method 0010 Sampling Train A Concentration Results - Run 4
Date Venting Cycle
Sampling Interval
Sampling Duration
(min)
Sample Volume (dscf)
Run 4 - Sampling Train A 6/8/2008 632-926 633-703 30 0.857
SVOC Analyte
Probe and
Nozzle Rinses/ Filter Mass (μg)
Pre-XAD Condensate/ Mid-Train
Rinses Mass (μg)
XAD/ Post-XAD
Condensate Mass (μg)
Total Mass (μg)
Total Conc.
(μg/dscf)
Acenaphthene <1.5 1,200 31 1,230 1,440 Diethyl phthalate <4.5 <5.3 <3.6 0 0 p-Dimethylaminoazobenzene <1.5 <9.7 <2.5 0 0 7,12-Dimethylbenz(a)anthracene <2.8 <7.7 <2.6 0 0 2,4-Dimethylphenol <8.7 1,400 <32 1,400 1,630 Dimethyl phthalate <1.9 <5 <2.5 0 0 Aniline <2.8 720 <36 720 841 Di-n-octyl phthalate <6.3 <9.6 <2.8 0 0 4,6-Dinitro-2-methylphenol <15 <5.6 <44 0 0 2,4-Dinitrophenol <18 <15 <110 0 0 2,4-Dinitrotoluene <4.8 <10 <2.5 0 0 2,6-Dinitrotoluene <3.9 <7.9 <2.5 0 0 Diphenylamine <1.5 <11 <2.5 0 0 1,2-Diphenylhydrazine <1.9 <5.6 <2.5 0 0 Anthracene 20 3,100 21 3,140 3,670 Ethyl methanesulfonate <2.4 <9.8 <2.5 0 0 Fluoranthene 12 360 <2.7 372 434 Fluorene 3.2 4,400 50 4,450 5,200 Hexachlorobenzene <1.7 <10 <2.5 0 0 Hexachlorobutadiene <4.2 <7.3 <3.7 0 0 Hexachlorocyclopentadiene <30 <25 <50 0 0 Hexachloroethane <7.5 <7.4 <2.7 0 0 Indeno(1,2,3-cd)pyrene 44 20 <2.7 64.0 74.7 Isophorone <2 <6.8 <2.5 0 0 3-Methylcholanthrene <1.5 <6.8 <2.5 0 0 Methyl methanesulfonate <1.8 <8.6 <2.8 0 0 2-Methylnaphthalene 3.9 48,000 2,400 50,400 58,800 2-Methylphenol <6.9 1,100 <15 1,100 1,280 Naphthalene <1.5 25,000 2,700 27,700 32,300 1-Naphthylamine <2.8 110 <50 110 128

2-69 Source Test Report for the Coker Steam Vent
Table 2-27. SW-846 Method 0010 Sampling Train A Concentration Results - Run 4 (Continued)
Date Venting Cycle
Sampling Interval
Sampling Duration
(min)
Sample Volume (dscf)
Run 4 - Sampling Train A 6/8/2008 632-926 633-703 30 0.857
SVOC Analyte
Probe and
Nozzle Rinses/ Filter Mass (μg)
Pre-XAD Condensate/ Mid-Train
Rinses Mass (μg)
XAD/ Post-XAD
Condensate Mass (μg)
Total Mass (μg)
Total Conc.
(μg/dscf)
2-Naphthylamine <2.4 100 <50 100 117 2-Nitroaniline <1.7 <11 <2.5 0 0 3-Nitroaniline <11 <18 <10 0 0 4-Nitroaniline <6.9 <15 <10 0 0 Nitrobenzene <2.2 <6.3 <2.8 0 0 Benzidine <150 <250 <260 0 0 2-Nitrophenol <9.6 <10 <2.5 0 0 4-Nitrophenol <9.9 <15 <16 0 0 N-Nitrosodi-n-butylamine <2.6 <10 <2.5 0 0 N-Nitrosodimethylamine <2.2 <8.3 <2.5 0 0 Benzo(a)anthracene 110 290 <2.9 400 467 N-Nitrosodi-n-propylamine <2.2 <8.8 <2.5 0 0 N-Nitrosodiphenylamine <1.8 <5.2 <4.4 0 0 N-Nitrosopiperidine <1.9 <7.3 <2.5 0 0 Benzo(b)fluoranthene 40 36 <5.5 76.0 88.7 Benzo(k)fluoranthene 35 33 <8 68.0 79.4 Benzoic acid <130 <36 <230 0 0 Benzo(ghi)perylene 110 44 <3.1 154 180 Pentachlorobenzene <1.6 <8.7 <2.5 0 0 Benzo(a)pyrene 170 120 <2.5 290 339 Pentachloronitrobenzene <2.3 <10 <2.5 0 0 Pentachlorophenol <75 <13 <120 0 0 Phenacetin <1.5 <9 <2.5 0 0 Benzyl alcohol <100 <7.6 <180 0 0 Phenanthrene 36 8,800 52 8,890 10,400 Phenol <3.3 820 6 826 964 2-Picoline <2.9 790 <5.5 790 922 Pyrene 54 1,100 4 1,160 1,350 Pyridine <2.7 270 <3.7 270 315 Acetophenone <2.3 510 <12 510 595
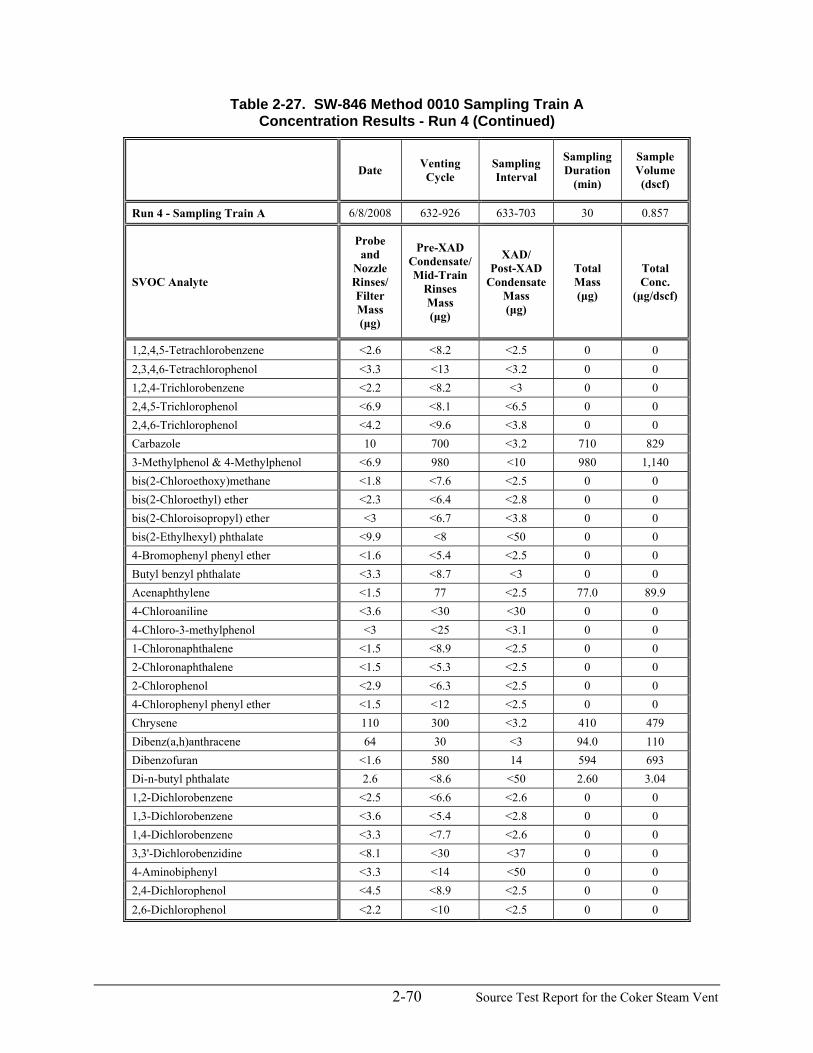
2-70 Source Test Report for the Coker Steam Vent
Table 2-27. SW-846 Method 0010 Sampling Train A Concentration Results - Run 4 (Continued)
Date Venting Cycle
Sampling Interval
Sampling Duration
(min)
Sample Volume (dscf)
Run 4 - Sampling Train A 6/8/2008 632-926 633-703 30 0.857
SVOC Analyte
Probe and
Nozzle Rinses/ Filter Mass (μg)
Pre-XAD Condensate/ Mid-Train
Rinses Mass (μg)
XAD/ Post-XAD
Condensate Mass (μg)
Total Mass (μg)
Total Conc.
(μg/dscf)
1,2,4,5-Tetrachlorobenzene <2.6 <8.2 <2.5 0 0 2,3,4,6-Tetrachlorophenol <3.3 <13 <3.2 0 0 1,2,4-Trichlorobenzene <2.2 <8.2 <3 0 0 2,4,5-Trichlorophenol <6.9 <8.1 <6.5 0 0 2,4,6-Trichlorophenol <4.2 <9.6 <3.8 0 0 Carbazole 10 700 <3.2 710 829 3-Methylphenol & 4-Methylphenol <6.9 980 <10 980 1,140 bis(2-Chloroethoxy)methane <1.8 <7.6 <2.5 0 0 bis(2-Chloroethyl) ether <2.3 <6.4 <2.8 0 0 bis(2-Chloroisopropyl) ether <3 <6.7 <3.8 0 0 bis(2-Ethylhexyl) phthalate <9.9 <8 <50 0 0 4-Bromophenyl phenyl ether <1.6 <5.4 <2.5 0 0 Butyl benzyl phthalate <3.3 <8.7 <3 0 0 Acenaphthylene <1.5 77 <2.5 77.0 89.9 4-Chloroaniline <3.6 <30 <30 0 0 4-Chloro-3-methylphenol <3 <25 <3.1 0 0 1-Chloronaphthalene <1.5 <8.9 <2.5 0 0 2-Chloronaphthalene <1.5 <5.3 <2.5 0 0 2-Chlorophenol <2.9 <6.3 <2.5 0 0 4-Chlorophenyl phenyl ether <1.5 <12 <2.5 0 0 Chrysene 110 300 <3.2 410 479 Dibenz(a,h)anthracene 64 30 <3 94.0 110 Dibenzofuran <1.6 580 14 594 693 Di-n-butyl phthalate 2.6 <8.6 <50 2.60 3.04 1,2-Dichlorobenzene <2.5 <6.6 <2.6 0 0 1,3-Dichlorobenzene <3.6 <5.4 <2.8 0 0 1,4-Dichlorobenzene <3.3 <7.7 <2.6 0 0 3,3'-Dichlorobenzidine <8.1 <30 <37 0 0 4-Aminobiphenyl <3.3 <14 <50 0 0 2,4-Dichlorophenol <4.5 <8.9 <2.5 0 0 2,6-Dichlorophenol <2.2 <10 <2.5 0 0

2-71 Source Test Report for the Coker Steam Vent
Table 2-28. SW-846 Method 0010 Sampling Train B Concentration Results - Run 4
Date Venting Cycle
Sampling Interval
Sampling Duration
(min)
Sample Volume (dscf)
Run 4 - Sampling Train B 6/8/2008 632-926 703-733 30 1.110
SVOC Analyte
Probe and
Nozzle Rinses/ Filter Mass (μg)
Pre-XAD Condensate/ Mid-Train
Rinses Mass (μg)
XAD/ Post-XAD
Condensate Mass (μg)
Total Mass (μg)
Total Conc.
(μg/dscf)
Acenaphthene <1.5 1,000 33 1,030 931 Diethyl phthalate <4.5 <5.3 <3.6 0 0 p-Dimethylaminoazobenzene <1.5 <9.7 <2.5 0 0 7,12-Dimethylbenz(a)anthracene <2.8 <7.7 <2.6 0 0 2,4-Dimethylphenol <8.7 1,200 <32 1,200 1,080 Dimethyl phthalate <1.9 <5 <2.5 0 0 Aniline <2.8 620 <36 620 559 Di-n-octyl phthalate <6.3 <9.6 <2.8 0 0 4,6-Dinitro-2-methylphenol <15 <5.6 <44 0 0 2,4-Dinitrophenol <18 <15 <110 0 0 2,4-Dinitrotoluene <4.8 <10 <2.5 0 0 2,6-Dinitrotoluene <3.9 <7.9 <2.5 0 0 Diphenylamine <1.5 <11 <2.5 0 0 1,2-Diphenylhydrazine <1.9 <5.6 <2.5 0 0 Anthracene 8.1 2,000 22 2,030 1,830 Ethyl methanesulfonate <2.4 <9.8 <2.5 0 0 Fluoranthene 3.9 310 <2.7 314 283 Fluorene <1.5 2,300 56 2,360 2,120 Hexachlorobenzene <1.7 <10 <2.5 0 0 Hexachlorobutadiene <4.2 <7.3 <3.7 0 0 Hexachlorocyclopentadiene <30 <25 <50 0 0 Hexachloroethane <7.5 <7.4 <2.7 0 0 Indeno(1,2,3-cd)pyrene 20 22 <2.7 42.0 37.9 Isophorone <2 <6.8 <2.5 0 0 3-Methylcholanthrene <1.5 <6.8 <2.5 0 0 Methyl methanesulfonate <1.8 <8.6 <2.8 0 0 2-Methylnaphthalene <1.7 18,000 2,500 20,500 18,500 2-Methylphenol <6.9 1,000 <15 1,000 901 Naphthalene <1.5 12,000 2,800 14,800 13,300 1-Naphthylamine <2.8 99 <50 99.0 89.2

2-72 Source Test Report for the Coker Steam Vent
Table 2-28. SW-846 Method 0010 Sampling Train B Concentration Results - Run 4 (Continued)
Date Venting Cycle
Sampling Interval
Sampling Duration
(min)
Sample Volume (dscf)
Run 4 - Sampling Train B 6/8/2008 632-926 703-733 30 1.110
SVOC Analyte
Probe and
Nozzle Rinses/ Filter Mass (μg)
Pre-XAD Condensate/ Mid-Train
Rinses Mass (μg)
XAD/ Post-XAD
Condensate Mass (μg)
Total Mass (μg)
Total Conc.
(μg/dscf)
2-Naphthylamine <2.4 95 <50 95.0 85.6 2-Nitroaniline <1.7 <11 <2.5 0 0 3-Nitroaniline <11 <18 <10 0 0 4-Nitroaniline <6.9 <15 <10 0 0 Nitrobenzene <2.2 <6.3 <2.8 0 0 Benzidine <150 <250 <260 0 0 2-Nitrophenol <9.6 <10 <2.5 0 0 4-Nitrophenol <9.9 <15 <16 0 0 N-Nitrosodi-n-butylamine <2.6 <10 <2.5 0 0 N-Nitrosodimethylamine <2.2 <8.3 <2.5 0 0 Benzo(a)anthracene 44 260 <2.9 304 274 N-Nitrosodi-n-propylamine <2.2 <8.8 <2.5 0 0 N-Nitrosodiphenylamine <1.8 <5.2 <4.4 0 0 N-Nitrosopiperidine <1.9 <7.3 <2.5 0 0 Benzo(b)fluoranthene 17 36 <5.5 53.0 47.8 Benzo(k)fluoranthene 15 34 <8 49.0 44.2 Benzoic acid <130 <36 <230 0 0 Benzo(ghi)perylene 47 49 <3.1 96.0 86.5 Pentachlorobenzene <1.6 <8.7 <2.5 0 0 Benzo(a)pyrene 75 130 <2.5 205 185 Pentachloronitrobenzene <2.3 <10 <2.5 0 0 Pentachlorophenol <75 <13 <120 0 0 Phenacetin <1.5 <9 <2.5 0 0 Benzyl alcohol <100 <7.6 <180 0 0 Phenanthrene 14 3,100 56 3,170 2,860 Phenol <3.3 730 7.4 737 665 2-Picoline <2.9 570 <5.5 570 514 Pyrene 17 920 3.4 940 848 Pyridine <2.7 180 <3.7 180 162 Acetophenone <2.3 510 <12 510 460

2-73 Source Test Report for the Coker Steam Vent
Table 2-28. SW-846 Method 0010 Sampling Train B Concentration Results - Run 4 (Continued)
Date Venting Cycle
Sampling Interval
Sampling Duration
(min)
Sample Volume (dscf)
Run 4 - Sampling Train B 6/8/2008 632-926 703-733 30 1.110
SVOC Analyte
Probe and
Nozzle Rinses/ Filter Mass (μg)
Pre-XAD Condensate/ Mid-Train
Rinses Mass (μg)
XAD/ Post-XAD
Condensate Mass (μg)
Total Mass (μg)
Total Conc.
(μg/dscf)
1,2,4,5-Tetrachlorobenzene <2.6 <8.2 <2.5 0 0 2,3,4,6-Tetrachlorophenol <3.3 <13 <3.2 0 0 1,2,4-Trichlorobenzene <2.2 <8.2 <3 0 0 2,4,5-Trichlorophenol <6.9 <8.1 <6.5 0 0 2,4,6-Trichlorophenol <4.2 <9.6 <3.8 0 0 Carbazole 3.5 620 <3.2 624 562 3-Methylphenol & 4-Methylphenol <6.9 880 <10 880 793 bis(2-Chloroethoxy)methane <1.8 <7.6 <2.5 0 0 bis(2-Chloroethyl) ether <2.3 <6.4 <2.8 0 0 bis(2-Chloroisopropyl) ether <3 <6.7 <3.8 0 0 bis(2-Ethylhexyl) phthalate <9.9 <8 <50 0 0 4-Bromophenyl phenyl ether <1.6 <5.4 <2.5 0 0 Butyl benzyl phthalate <3.3 <8.7 <3 0 0 Acenaphthylene <1.5 76 4.4 80.4 72.5 4-Chloroaniline <3.6 <30 <30 0 0 4-Chloro-3-methylphenol <3 <25 <3.1 0 0 1-Chloronaphthalene <1.5 <8.9 <2.5 0 0 2-Chloronaphthalene <1.5 <5.3 <2.5 0 0 2-Chlorophenol <2.9 <6.3 <2.5 0 0 4-Chlorophenyl phenyl ether <1.5 <12 <2.5 0 0 Chrysene 46 260 <3.2 306 276 Dibenz(a,h)anthracene 29 30 <3 59.0 53.2 Dibenzofuran <1.6 510 15 525 473 Di-n-butyl phthalate <2.1 <8.6 <50 0 0 1,2-Dichlorobenzene <2.5 <6.6 <2.6 0 0 1,3-Dichlorobenzene <3.6 <5.4 <2.8 0 0 1,4-Dichlorobenzene <3.3 <7.7 <2.6 0 0 3,3'-Dichlorobenzidine <8.1 <30 <37 0 0 4-Aminobiphenyl <3.3 <14 <50 0 0 2,4-Dichlorophenol <4.5 <8.9 <2.5 0 0 2,6-Dichlorophenol <2.2 <10 <2.5 0 0

2-74 Source Test Report for the Coker Steam Vent
Table 2-29. SW-846 Method 0010 Sampling Train C Concentration Results - Run 4
Date Venting Cycle
Sampling Interval
Sampling Duration
(min)
Sample Volume (dscf)
Run 4 - Sampling Train C 6/8/2008 632-926 735-831 56 2.231
SVOC Analyte
Probe and
Nozzle Rinses/ Filter Mass (μg)
Pre-XAD Condensate/ Mid-Train
Rinses Mass (μg)
XAD/ Post-XAD
Condensate Mass (μg)
Total Mass (μg)
Total Conc.
(μg/dscf)
Acenaphthene <1 1,400 380 1,780 798 Diethyl phthalate <3 <11 <3.6 0 0 p-Dimethylaminoazobenzene <1 <19 <2.5 0 0 7,12-Dimethylbenz(a)anthracene <1.9 <15 <2.6 0 0 2,4-Dimethylphenol <5.8 1,400 <32 1,400 628 Dimethyl phthalate <1.3 <10 <2.5 0 0 Aniline <1.9 750 <36 750 336 Di-n-octyl phthalate <4.2 <19 <2.8 0 0 4,6-Dinitro-2-methylphenol <10 <11 <44 0 0 2,4-Dinitrophenol <12 <30 <110 0 0 2,4-Dinitrotoluene <3.2 <21 <2.5 0 0 2,6-Dinitrotoluene <2.6 <16 <2.5 0 0 Diphenylamine <1 <22 <2.5 0 0 1,2-Diphenylhydrazine <1.3 <11 <2.5 0 0 Anthracene 5 2,600 840 3,450 1,540 Ethyl methanesulfonate <1.6 <20 <2.5 0 0 Fluoranthene 2.6 400 99 502 225 Fluorene 1.6 3,400 850 4,250 1,910 Hexachlorobenzene <1.1 <20 <2.5 0 0 Hexachlorobutadiene <2.8 <15 <3.7 0 0 Hexachlorocyclopentadiene <20 <50 <50 0 0 Hexachloroethane <5 <15 <2.7 0 0 Indeno(1,2,3-cd)pyrene 24 40 <2.7 64.0 28.7 Isophorone <1.3 <14 <2.5 0 0 3-Methylcholanthrene <1 <14 <2.5 0 0 Methyl methanesulfonate <1.2 <17 <2.8 0 0 2-Methylnaphthalene 1.7 26,000 18,000 44,000 19,700 2-Methylphenol <4.6 1,200 130 1,330 596 Naphthalene <1 19,000 11,000 30,000 13,400 1-Naphthylamine <1.9 120 <50 120 53.8
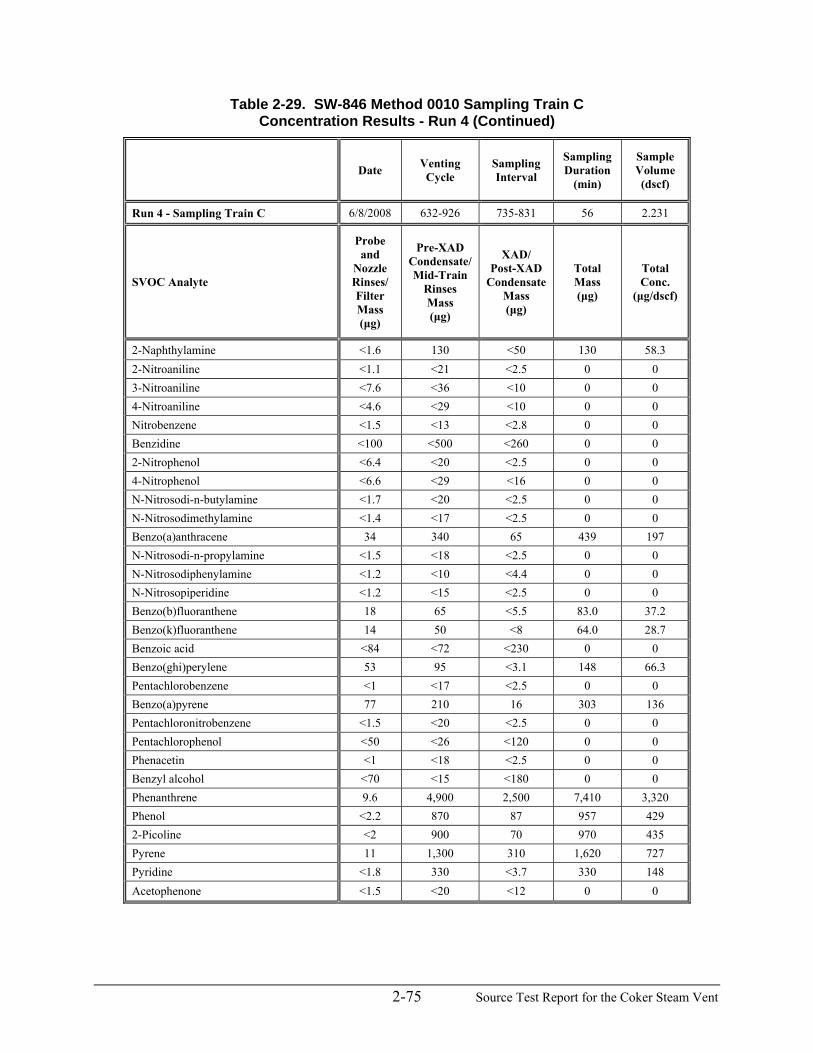
2-75 Source Test Report for the Coker Steam Vent
Table 2-29. SW-846 Method 0010 Sampling Train C Concentration Results - Run 4 (Continued)
Date Venting Cycle
Sampling Interval
Sampling Duration
(min)
Sample Volume (dscf)
Run 4 - Sampling Train C 6/8/2008 632-926 735-831 56 2.231
SVOC Analyte
Probe and
Nozzle Rinses/ Filter Mass (μg)
Pre-XAD Condensate/ Mid-Train
Rinses Mass (μg)
XAD/ Post-XAD
Condensate Mass (μg)
Total Mass (μg)
Total Conc.
(μg/dscf)
2-Naphthylamine <1.6 130 <50 130 58.3 2-Nitroaniline <1.1 <21 <2.5 0 0 3-Nitroaniline <7.6 <36 <10 0 0 4-Nitroaniline <4.6 <29 <10 0 0 Nitrobenzene <1.5 <13 <2.8 0 0 Benzidine <100 <500 <260 0 0 2-Nitrophenol <6.4 <20 <2.5 0 0 4-Nitrophenol <6.6 <29 <16 0 0 N-Nitrosodi-n-butylamine <1.7 <20 <2.5 0 0 N-Nitrosodimethylamine <1.4 <17 <2.5 0 0 Benzo(a)anthracene 34 340 65 439 197 N-Nitrosodi-n-propylamine <1.5 <18 <2.5 0 0 N-Nitrosodiphenylamine <1.2 <10 <4.4 0 0 N-Nitrosopiperidine <1.2 <15 <2.5 0 0 Benzo(b)fluoranthene 18 65 <5.5 83.0 37.2 Benzo(k)fluoranthene 14 50 <8 64.0 28.7 Benzoic acid <84 <72 <230 0 0 Benzo(ghi)perylene 53 95 <3.1 148 66.3 Pentachlorobenzene <1 <17 <2.5 0 0 Benzo(a)pyrene 77 210 16 303 136 Pentachloronitrobenzene <1.5 <20 <2.5 0 0 Pentachlorophenol <50 <26 <120 0 0 Phenacetin <1 <18 <2.5 0 0 Benzyl alcohol <70 <15 <180 0 0 Phenanthrene 9.6 4,900 2,500 7,410 3,320 Phenol <2.2 870 87 957 429 2-Picoline <2 900 70 970 435 Pyrene 11 1,300 310 1,620 727 Pyridine <1.8 330 <3.7 330 148 Acetophenone <1.5 <20 <12 0 0

2-76 Source Test Report for the Coker Steam Vent
Table 2-29. SW-846 Method 0010 Sampling Train C Concentration Results - Run 4 (Continued)
Date Venting Cycle
Sampling Interval
Sampling Duration
(min)
Sample Volume (dscf)
Run 4 - Sampling Train C 6/8/2008 632-926 735-831 56 2.231
SVOC Analyte
Probe and
Nozzle Rinses/ Filter Mass (μg)
Pre-XAD Condensate/ Mid-Train
Rinses Mass (μg)
XAD/ Post-XAD
Condensate Mass (μg)
Total Mass (μg)
Total Conc.
(μg/dscf)
1,2,4,5-Tetrachlorobenzene <1.7 <16 <2.5 0 0 2,3,4,6-Tetrachlorophenol <2.2 <26 <3.2 0 0 1,2,4-Trichlorobenzene <1.5 <16 <3 0 0 2,4,5-Trichlorophenol <4.6 <16 <6.5 0 0 2,4,6-Trichlorophenol <2.8 <19 <3.8 0 0 Carbazole 2.3 720 170 892 400 3-Methylphenol & 4-Methylphenol <4.6 1,000 110 1,110 498 bis(2-Chloroethoxy)methane <1.2 <15 <2.5 0 0 bis(2-Chloroethyl) ether <1.5 <13 <2.8 0 0 bis(2-Chloroisopropyl) ether <2 <13 <3.8 0 0 bis(2-Ethylhexyl) phthalate <6.6 <16 <50 0 0 4-Bromophenyl phenyl ether <1.1 <11 <2.5 0 0 Butyl benzyl phthalate <2.2 <17 <3 0 0 Acenaphthylene <1 76 35 111 49.8 4-Chloroaniline <2.4 <61 <30 0 0 4-Chloro-3-methylphenol <2 <50 <3.1 0 0 1-Chloronaphthalene <1 <18 <2.5 0 0 2-Chloronaphthalene <1 <11 <2.5 0 0 2-Chlorophenol <2 <13 <2.5 0 0 4-Chlorophenyl phenyl ether <1 <24 <2.5 0 0 Chrysene 36 370 64 470 211 Dibenz(a,h)anthracene 31 57 <3 88.0 39.5 Dibenzofuran <1.1 780 200 980 439 Di-n-butyl phthalate <1.4 <17 <50 0 0 1,2-Dichlorobenzene <1.7 <13 <2.6 0 0 1,3-Dichlorobenzene <2.4 <11 <2.8 0 0 1,4-Dichlorobenzene <2.2 <15 <2.6 0 0 3,3'-Dichlorobenzidine <5.4 <59 <37 0 0 4-Aminobiphenyl <2.2 <28 <50 0 0 2,4-Dichlorophenol <3 <18 <2.5 0 0 2,6-Dichlorophenol <1.4 <20 <2.5 0 0

2-77 Source Test Report for the Coker Steam Vent
Table 2-30. SW-846 Method 0010 Sampling Train A Mass Emission Rate Results - Run 1
Date Venting Cycle
Venting Cycle
Interval
Venting Cycle
Duration (min)
Volumetric Flow Rate
(dscfm)
Run 1 - Sampling Train A 6/3/2008 600-1018 600-632 32 236
SVOC Analyte Total Conc.
(μg/dscf)
Molecular Weight
(g/g-mol)
Boiling Point (°F)
Total Mass Emission
Rate (lbs/min)
Total Mass Emission
Rate (lbs/interval)
Acenaphthene 992 154.2 534 5.17E-04 1.66E-02 Diethyl phthalate 8.06 222.2 568 4.20E-06 1.34E-04 2,4-Dimethylphenol 1,520 122.2 412 7.91E-04 2.53E-02 Aniline 957 93.1 363 4.99E-04 1.60E-02 Anthracene 2,130 178.2 644 1.11E-03 3.56E-02 Fluoranthene 445 202.3 707 2.32E-04 7.43E-03 Fluorene 4,390 166.2 563 2.29E-03 7.32E-02 Indeno(1,2,3-cd)pyrene 20.5 276.3 997 1.07E-05 3.43E-04 2-Methylnaphthalene 54,400 142.2 466 2.84E-02 9.07E-01 2-Methylphenol 2,100 108.1 376 1.10E-03 3.51E-02 Naphthalene 33,600 128.2 424 1.75E-02 5.61E-01 1-Naphthylamine 163 143.2 572 8.52E-05 2.73E-03 2-Naphthylamine 140 143.2 583 7.30E-05 2.34E-03 Benzo(a)anthracene 322 228.3 820 1.68E-04 5.36E-03 Benzo(b)fluoranthene 26.3 252.3 675 1.37E-05 4.38E-04 Benzo(k)fluoranthene 24.6 252.3 896 1.28E-05 4.11E-04 Benzo(ghi)perylene 52.5 276.3 932 2.74E-05 8.76E-04 Benzo(a)pyrene 112 252.3 923 5.84E-05 1.87E-03 Phenanthrene 11,100 178.2 644 5.76E-03 1.84E-01 Phenol 2,690 94.1 359 1.40E-03 4.48E-02 2-Picoline 735 93.1 265 3.83E-04 1.23E-02 Pyrene 1,410 202.3 759 7.36E-04 2.36E-02 Pyridine 245 79.1 239 1.28E-04 4.09E-03 Acetophenone 467 120.2 395 2.43E-04 7.79E-03 Carbazole 807 167.2 677 4.21E-04 1.35E-02 3-Methylphenol & 4-Methylphenol 2,220 108.1 396 1.16E-03 3.70E-02 bis(2-Ethylhexyl) phthalate 4.20 390.6 728 2.19E-06 7.01E-05 Acenaphthylene 73.5 152.2 509 3.83E-05 1.23E-03 Chrysene 323 228.3 838 1.68E-04 5.38E-03 Dibenz(a,h)anthracene 28.8 278.4 975 1.50E-05 4.81E-04 Dibenzofuran 567 168.2 545 2.96E-04 9.46E-03 Di-n-butyl phthalate 28.1 278.3 644 1.47E-05 4.69E-04

2-78 Source Test Report for the Coker Steam Vent
Table 2-31. SW-846 Method 0010 Sampling Train B Mass Emission Rate Results - Run 1
Date Venting Cycle
Venting Cycle
Interval
Venting Cycle
Duration (min)
Volumetric Flow Rate
(dscfm)
Run 1 - Sampling Train B 6/3/2008 600-1018 632-703 31 200
SVOC Analyte Total Conc.
(μg/dscf)
Molecular Weight
(g/g-mol)
Boiling Point (°F)
Total Mass Emission
Rate (lbs/min)
Total Mass Emission
Rate (lbs/interval)
Acenaphthene 304 154.2 534 1.34E-04 4.15E-03 Diethyl phthalate 4.75 222.2 568 2.09E-06 6.48E-05 2,4-Dimethylphenol 599 122.2 412 2.64E-04 8.17E-03 Aniline 456 93.1 363 2.01E-04 6.23E-03 Anthracene 675 178.2 644 2.97E-04 9.21E-03 Fluoranthene 115 202.3 707 5.05E-05 1.57E-03 Fluorene 730 166.2 563 3.21E-04 9.96E-03 2-Methylnaphthalene 17,000 142.2 466 7.48E-03 2.32E-01 2-Methylphenol 865 108.1 376 3.81E-04 1.18E-02 Naphthalene 12,500 128.2 424 5.52E-03 1.71E-01 1-Naphthylamine 59.9 143.2 572 2.64E-05 8.17E-04 2-Naphthylamine 53.2 143.2 583 2.34E-05 7.26E-04 Benzo(a)anthracene 72.2 228.3 820 3.18E-05 9.86E-04 Benzo(ghi)perylene 12.2 276.3 932 5.35E-06 1.66E-04 Benzo(a)pyrene 20.6 252.3 923 9.08E-06 2.81E-04 Phenanthrene 2,870 178.2 644 1.26E-03 3.92E-02 Phenol 1,140 94.1 359 5.02E-04 1.56E-02 2-Picoline 456 93.1 265 2.01E-04 6.23E-03 Pyrene 402 202.3 759 1.77E-04 5.48E-03 Pyridine 171 79.1 239 7.53E-05 2.33E-03 Acetophenone 200 120.2 395 8.79E-05 2.72E-03 Carbazole 257 167.2 677 1.13E-04 3.50E-03 3-Methylphenol & 4-Methylphenol 931 108.1 396 4.10E-04 1.27E-02 bis(2-Ethylhexyl) phthalate 3.99 390.6 728 1.76E-06 5.45E-05 Acenaphthylene 20.9 152.2 509 9.20E-06 2.85E-04 Chrysene 67.8 228.3 838 2.98E-05 9.25E-04 Dibenz(a,h)anthracene 2.38 278.4 975 1.05E-06 3.24E-05 Dibenzofuran 186 168.2 545 8.18E-05 2.54E-03 Di-n-butyl phthalate 6.75 278.3 644 2.97E-06 9.21E-05

2-79 Source Test Report for the Coker Steam Vent
Table 2-32. SW-846 Method 0010 Sampling Train D Mass Emission Rate Results - Run 1
Date Venting Cycle
Venting Cycle
Interval
Venting Cycle
Duration (min)
Volumetric Flow Rate
(dscfm)
Run 1 - Sampling Train D 6/3/2008 600-1018 703-826 83 166
SVOC Analyte Total Conc.
(μg/dscf)
Molecular Weight
(g/g-mol)
Boiling Point (°F)
Total Mass Emission
Rate (lbs/min)
Total Mass Emission
Rate (lbs/interval)
Acenaphthene 947 154.2 534 3.46E-04 2.87E-02 2,4-Dimethylphenol 1,180 122.2 412 4.32E-04 3.59E-02 Aniline 973 93.1 363 3.55E-04 2.95E-02 Anthracene 2,330 178.2 644 8.50E-04 7.05E-02 Fluoranthene 501 202.3 707 1.83E-04 1.52E-02 Fluorene 2,760 166.2 563 1.01E-03 8.36E-02 2-Methylnaphthalene 47,200 142.2 466 1.72E-02 1.43E00 2-Methylphenol 2,370 108.1 376 8.65E-04 7.18E-02 Naphthalene 29,100 128.2 424 1.06E-02 8.82E-01 1-Naphthylamine 135 143.2 572 4.94E-05 4.10E-03 2-Naphthylamine 127 143.2 583 4.63E-05 3.85E-03 Benzo(a)anthracene 249 228.3 820 9.09E-05 7.55E-03 Benzo(ghi)perylene 13.5 276.3 932 4.94E-06 4.10E-04 Benzo(a)pyrene 39.9 252.3 923 1.46E-05 1.21E-03 Phenanthrene 10,800 178.2 644 3.93E-03 3.26E-01 Phenol 2,730 94.1 359 9.98E-04 8.28E-02 2-Picoline 759 93.1 265 2.77E-04 2.30E-02 Pyrene 1,570 202.3 759 5.72E-04 4.75E-02 Pyridine 228 79.1 239 8.34E-05 6.92E-03 Acetophenone 355 120.2 395 1.30E-04 1.08E-02 Carbazole 778 167.2 677 2.84E-04 2.36E-02 3-Methylphenol & 4-Methylphenol 2,380 108.1 396 8.68E-04 7.21E-02 Acenaphthylene 45.7 152.2 509 1.67E-05 1.38E-03 Chrysene 248 228.3 838 9.06E-05 7.52E-03 Dibenzofuran 621 168.2 545 2.27E-04 1.88E-02 Di-n-butyl phthalate 0.795 278.3 644 2.90E-07 2.41E-05

2-80 Source Test Report for the Coker Steam Vent
Table 2-33. SW-846 Method 0010 Extrapolated Mass Emission Rate Results - Run 1
Date Venting Cycle
Venting Cycle
Interval
Venting Cycle
Duration (min)
Volumetric Flow Rate
(dscfm)
Run 1 - Extrapolated1 6/3/2008 600-1018 826-1018 112 127
SVOC Analyte Total Conc.
(μg/dscf)
Molecular Weight
(g/g-mol)
Boiling Point (°F)
Total Mass Emission
Rate (lbs/min)
Total Mass Emission
Rate (lbs/interval)
Acenaphthene 947 154.2 534 2.65E-04 2.97E-02 2,4-Dimethylphenol 1,180 122.2 412 3.32E-04 3.71E-02 Aniline 973 93.1 363 2.72E-04 3.05E-02 Anthracene 2,330 178.2 644 6.51E-04 7.29E-02 Fluoranthene 501 202.3 707 1.40E-04 1.57E-02 Fluorene 2,760 166.2 563 7.72E-04 8.65E-02 2-Methylnaphthalene 47,200 142.2 466 1.32E-02 1.48E00 2-Methylphenol 2,370 108.1 376 6.63E-04 7.43E-02 Naphthalene 29,100 128.2 424 8.15E-03 9.12E-01 1-Naphthylamine 135 143.2 572 3.79E-05 4.24E-03 2-Naphthylamine 127 143.2 583 3.55E-05 3.98E-03 Benzo(a)anthracene 249 228.3 820 6.97E-05 7.81E-03 Benzo(ghi)perylene 13.5 276.3 932 3.79E-06 4.24E-04 Benzo(a)pyrene 39.9 252.3 923 1.12E-05 1.25E-03 Phenanthrene 10,800 178.2 644 3.01E-03 3.37E-01 Phenol 2,730 94.1 359 7.65E-04 8.57E-02 2-Picoline 759 93.1 265 2.12E-04 2.38E-02 Pyrene 1,570 202.3 759 4.38E-04 4.91E-02 Pyridine 228 79.1 239 6.39E-05 7.16E-03 Acetophenone 355 120.2 395 9.95E-05 1.11E-02 Carbazole 778 167.2 677 2.18E-04 2.44E-02 3-Methylphenol & 4-Methylphenol 2,380 108.1 396 6.65E-04 7.45E-02 Acenaphthylene 45.7 152.2 509 1.28E-05 1.43E-03 Chrysene 248 228.3 838 6.95E-05 7.78E-03 Dibenzofuran 621 168.2 545 1.74E-04 1.95E-02 Di-n-butyl phthalate 0.795 278.3 644 2.23E-07 2.49E-05
1 No direct measurements were obtained during this venting cycle interval.

2-81 Source Test Report for the Coker Steam Vent
Table 2-34. SW-846 Method 0010 Total SVOC Mass Emission Rate Results - Run 1
SVOC Analyte
Sampling Train A
Mass Emission
Rate (lbs/interval)
Sampling Train B
Mass Emission
Rate (lbs/interval)
Sampling Train D
Mass Emission
Rate (lbs/interval)
Extrapolated1 Mass
Emission Rate
(lbs/interval)
Run 1 Total Mass
Emission Rate
(lbs/cycle)
Acenaphthene 1.66E-02 4.15E-03 2.87E-02 2.97E-02 7.91E-02 Diethyl phthalate 1.34E-04 6.48E-05 0 0 1.99E-04 2,4-Dimethylphenol 2.53E-02 8.17E-03 3.59E-02 3.71E-02 1.07E-01 Aniline 1.60E-02 6.23E-03 2.95E-02 3.05E-02 8.22E-02 Anthracene 3.56E-02 9.21E-03 7.05E-02 7.29E-02 1.88E-01 Fluoranthene 7.43E-03 1.57E-03 1.52E-02 1.57E-02 3.99E-02 Fluorene 7.32E-02 9.96E-03 8.36E-02 8.65E-02 2.53E-01 Indeno(1,2,3-cd)pyrene 3.43E-04 0 0 0 3.43E-04 2-Methylnaphthalene 9.07E-01 2.32E-01 1.43E00 1.48E00 4.05E00 2-Methylphenol 3.51E-02 1.18E-02 7.18E-02 7.43E-02 1.93E-01 Naphthalene 5.61E-01 1.71E-01 8.82E-01 9.12E-01 2.53E00 1-Naphthylamine 2.73E-03 8.17E-04 4.10E-03 4.24E-03 1.19E-02 2-Naphthylamine 2.34E-03 7.26E-04 3.85E-03 3.98E-03 1.09E-02 Benzo(a)anthracene 5.36E-03 9.86E-04 7.55E-03 7.81E-03 2.17E-02 Benzo(b)fluoranthene 4.38E-04 0 0 0 4.38E-04 Benzo(k)fluoranthene 4.11E-04 0 0 0 4.11E-04 Benzo(ghi)perylene 8.76E-04 1.66E-04 4.10E-04 4.24E-04 1.88E-03 Benzo(a)pyrene 1.87E-03 2.81E-04 1.21E-03 1.25E-03 4.61E-03 Phenanthrene 1.84E-01 3.92E-02 3.26E-01 3.37E-01 8.87E-01 Phenol 4.48E-02 1.56E-02 8.28E-02 8.57E-02 2.29E-01 2-Picoline 1.23E-02 6.23E-03 2.30E-02 2.38E-02 6.53E-02 Pyrene 2.36E-02 5.48E-03 4.75E-02 4.91E-02 1.26E-01 Pyridine 4.09E-03 2.33E-03 6.92E-03 7.16E-03 2.05E-02 Acetophenone 7.79E-03 2.72E-03 1.08E-02 1.11E-02 3.24E-02 Carbazole 1.35E-02 3.50E-03 2.36E-02 2.44E-02 6.50E-02 3-Methylphenol & 4-Methylphenol 3.70E-02 1.27E-02 7.21E-02 7.45E-02 1.96E-01 bis(2-Ethylhexyl) phthalate 7.01E-05 5.45E-05 0 0 1.25E-04 Acenaphthylene 1.23E-03 2.85E-04 1.38E-03 1.43E-03 4.33E-03 Chrysene 5.38E-03 9.25E-04 7.52E-03 7.78E-03 2.16E-02 Dibenz(a,h)anthracene 4.81E-04 3.24E-05 0 0 5.13E-04 Dibenzofuran 9.46E-03 2.54E-03 1.88E-02 1.95E-02 5.03E-02 Di-n-butyl phthalate 4.69E-04 9.21E-05 2.41E-05 2.49E-05 6.10E-04
Total SVOC 2.04 0.549 3.29 3.40 9.27
1 No direct measurements were obtained during this venting cycle interval.

2-82 Source Test Report for the Coker Steam Vent
Table 2-35. SW-846 Method 0010 Sampling Train A Mass Emission Rate Results - Run 2
Date Venting Cycle
Venting Cycle
Interval
Venting Cycle
Duration (min)
Volumetric Flow Rate
(dscfm)
Run 2 - Sampling Train A 6/4-5/2008 2235-130 2235-2306 31 351
SVOC Analyte Total Conc.
(μg/dscf)
Molecular Weight
(g/g-mol)
Boiling Point (°F)
Total Mass Emission
Rate (lbs/min)
Total Mass Emission
Rate (lbs/interval)
Acenaphthene 2,040 154.2 534 1.58E-03 4.89E-02 2,4-Dimethylphenol 2,520 122.2 412 1.95E-03 6.05E-02 Aniline 1,530 93.1 363 1.18E-03 3.67E-02 Anthracene 3,210 178.2 644 2.49E-03 7.72E-02 Fluoranthene 468 202.3 707 3.63E-04 1.13E-02 Fluorene 3,800 166.2 563 2.94E-03 9.13E-02 Indeno(1,2,3-cd)pyrene 306 276.3 997 2.37E-04 7.34E-03 2-Methylnaphthalene 81,700 142.2 466 6.33E-02 1.96E00 2-Methylphenol 3,070 108.1 376 2.38E-03 7.38E-02 Naphthalene 45,100 128.2 424 3.50E-02 1.08E00 1-Naphthylamine 288 143.2 572 2.23E-04 6.91E-03 2-Naphthylamine 261 143.2 583 2.02E-04 6.26E-03 Benzo(a)anthracene 1,040 228.3 820 8.08E-04 2.51E-02 Benzo(b)fluoranthene 279 252.3 675 2.16E-04 6.70E-03 Benzo(k)fluoranthene 221 252.3 896 1.71E-04 5.31E-03 Benzo(ghi)perylene 612 276.3 932 4.75E-04 1.47E-02 Benzo(a)pyrene 1,140 252.3 923 8.85E-04 2.74E-02 Phenanthrene 4,780 178.2 644 3.70E-03 1.15E-01 Phenol 3,060 94.1 359 2.37E-03 7.34E-02 2-Picoline 1,210 93.1 265 9.37E-04 2.90E-02 Pyrene 1,690 202.3 759 1.31E-03 4.05E-02 Pyridine 450 79.1 239 3.48E-04 1.08E-02 Acetophenone 854 120.2 395 6.62E-04 2.05E-02 Carbazole 939 167.2 677 7.27E-04 2.26E-02 3-Methylphenol & 4-Methylphenol 3,060 108.1 396 2.37E-03 7.34E-02 Acenaphthylene 135 152.2 509 1.05E-04 3.24E-03 Chrysene 1,050 228.3 838 8.15E-04 2.53E-02 Dibenz(a,h)anthracene 593 278.4 975 4.59E-04 1.42E-02 Dibenzofuran 904 168.2 545 7.00E-04 2.17E-02

2-83 Source Test Report for the Coker Steam Vent
Table 2-36. SW-846 Method 0010 Sampling Train B Mass Emission Rate Results - Run 2
Date Venting Cycle
Venting Cycle
Interval
Venting Cycle
Duration (min)
Volumetric Flow Rate
(dscfm)
Run 2 - Sampling Train B 6/4-5/2008 2235-130 2306-2337 31 284
SVOC Analyte Total Conc.
(μg/dscf)
Molecular Weight
(g/g-mol)
Boiling Point (°F)
Total Mass Emission
Rate (lbs/min)
Total Mass Emission
Rate (lbs/interval)
Acenaphthene 1,430 154.2 534 8.93E-04 2.77E-02 2,4-Dimethylphenol 1,780 122.2 412 1.11E-03 3.45E-02 Aniline 1,130 93.1 363 7.08E-04 2.19E-02 Anthracene 2,340 178.2 644 1.47E-03 4.54E-02 Fluoranthene 351 202.3 707 2.19E-04 6.80E-03 Fluorene 2,680 166.2 563 1.67E-03 5.19E-02 Indeno(1,2,3-cd)pyrene 221 276.3 997 1.38E-04 4.29E-03 3-Methylcholanthrene 44.4 268.4 536 2.78E-05 8.62E-04 2-Methylnaphthalene 58,400 142.2 466 3.65E-02 1.13E00 2-Methylphenol 2,260 108.1 376 1.42E-03 4.39E-02 Naphthalene 33,200 128.2 424 2.08E-02 6.44E-01 1-Naphthylamine 226 143.2 572 1.42E-04 4.39E-03 2-Naphthylamine 194 143.2 583 1.21E-04 3.76E-03 Benzo(a)anthracene 800 228.3 820 5.00E-04 1.55E-02 Benzo(b)fluoranthene 234 252.3 675 1.47E-04 4.54E-03 Benzo(k)fluoranthene 186 252.3 896 1.16E-04 3.60E-03 Benzo(ghi)perylene 521 276.3 932 3.26E-04 1.01E-02 Benzo(a)pyrene 937 252.3 923 5.86E-04 1.82E-02 Phenanthrene 9,050 178.2 644 5.66E-03 1.75E-01 Phenol 2,420 94.1 359 1.52E-03 4.70E-02 2-Picoline 776 93.1 265 4.85E-04 1.50E-02 Pyrene 1,260 202.3 759 7.85E-04 2.43E-02 Pyridine 291 79.1 239 1.82E-04 5.64E-03 Acetophenone 550 120.2 395 3.44E-04 1.07E-02 Carbazole 721 167.2 677 4.51E-04 1.40E-02 3-Methylphenol & 4-Methylphenol 2,340 108.1 396 1.47E-03 4.54E-02 Acenaphthylene 97.0 152.2 509 6.06E-05 1.88E-03 Chrysene 865 228.3 838 5.41E-04 1.68E-02 Dibenz(a,h)anthracene 346 278.4 975 2.16E-04 6.71E-03 Dibenzofuran 660 168.2 545 4.13E-04 1.28E-02

2-84 Source Test Report for the Coker Steam Vent
Table 2-37. SW-846 Method 0010 Sampling Train C Mass Emission Rate Results - Run 2
Date Venting Cycle
Venting Cycle
Interval
Venting Cycle
Duration (min)
Volumetric Flow Rate
(dscfm)
Run 2 - Sampling Train C 6/4-5/2008 2235-130 2337-0035 58 172
SVOC Analyte Total Conc.
(μg/dscf)
Molecular Weight
(g/g-mol)
Boiling Point (°F)
Total Mass Emission
Rate (lbs/min)
Total Mass Emission
Rate (lbs/interval)
Acenaphthene 1,340 154.2 534 5.06E-04 2.93E-02 2,4-Dimethylphenol 1,640 122.2 412 6.21E-04 3.60E-02 Aniline 1,190 93.1 363 4.49E-04 2.60E-02 Anthracene 2,680 178.2 644 1.02E-03 5.90E-02 Fluoranthene 331 202.3 707 1.26E-04 7.28E-03 Fluorene 3,020 166.2 563 1.14E-03 6.63E-02 Indeno(1,2,3-cd)pyrene 245 276.3 997 9.27E-05 5.37E-03 2-Methylnaphthalene 53,500 142.2 466 2.02E-02 1.17E00 2-Methylphenol 2,280 108.1 376 8.65E-04 5.02E-02 Naphthalene 32,200 128.2 424 1.22E-02 7.06E-01 1-Naphthylamine 184 143.2 572 6.96E-05 4.04E-03 2-Naphthylamine 192 143.2 583 7.27E-05 4.22E-03 Benzo(a)anthracene 810 228.3 820 3.07E-04 1.78E-02 Benzo(b)fluoranthene 228 252.3 675 8.62E-05 5.00E-03 Benzo(k)fluoranthene 171 252.3 896 6.48E-05 3.76E-03 Benzo(ghi)perylene 476 276.3 932 1.80E-04 1.05E-02 Benzo(a)pyrene 930 252.3 923 3.52E-04 2.04E-02 Phenanthrene 4,310 178.2 644 1.63E-03 9.47E-02 Phenol 2,270 94.1 359 8.59E-04 4.98E-02 2-Picoline 918 93.1 265 3.48E-04 2.02E-02 Pyrene 1,220 202.3 759 4.62E-04 2.68E-02 Pyridine 309 79.1 239 1.17E-04 6.79E-03 Acetophenone 501 120.2 395 1.90E-04 1.10E-02 Carbazole 711 167.2 677 2.69E-04 1.56E-02 3-Methylphenol & 4-Methylphenol 2,220 108.1 396 8.41E-04 4.88E-02 Acenaphthylene 66.8 152.2 509 2.53E-05 1.47E-03 Chrysene 860 228.3 838 3.26E-04 1.89E-02 Dibenz(a,h)anthracene 313 278.4 975 1.19E-04 6.88E-03 Dibenzofuran 693 168.2 545 2.62E-04 1.52E-02
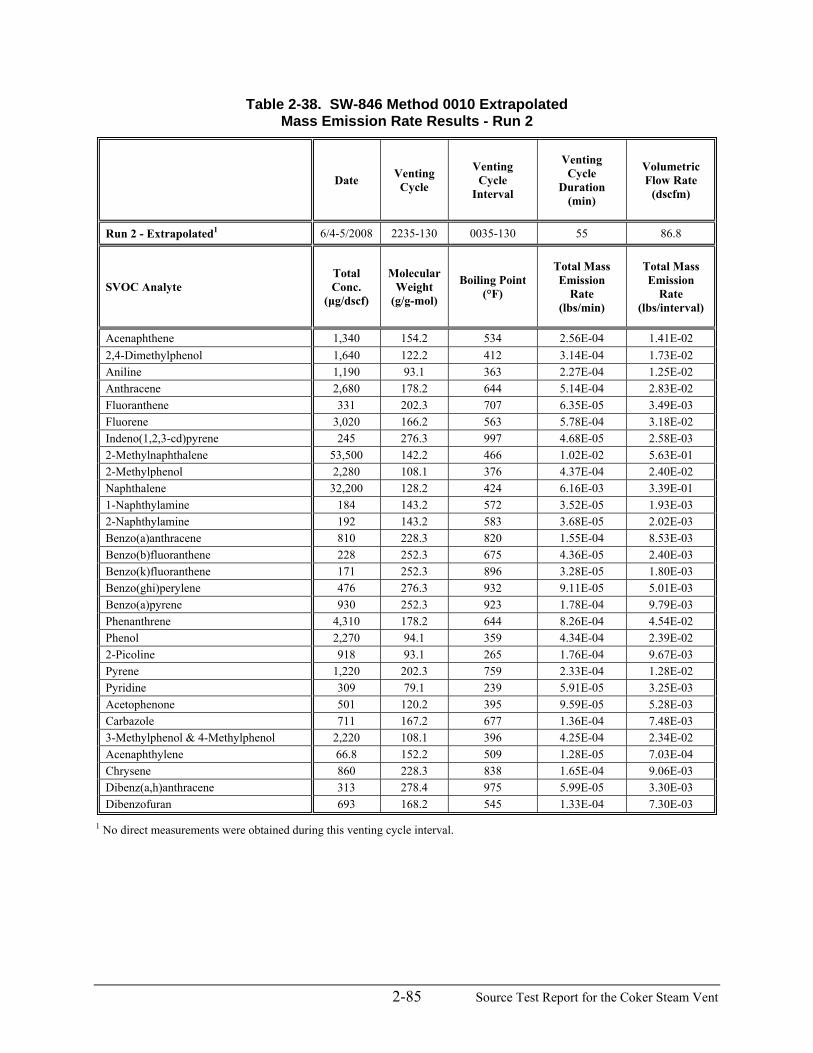
2-85 Source Test Report for the Coker Steam Vent
Table 2-38. SW-846 Method 0010 Extrapolated Mass Emission Rate Results - Run 2
Date Venting Cycle
Venting Cycle
Interval
Venting Cycle
Duration (min)
Volumetric Flow Rate
(dscfm)
Run 2 - Extrapolated1 6/4-5/2008 2235-130 0035-130 55 86.8
SVOC Analyte Total Conc.
(μg/dscf)
Molecular Weight
(g/g-mol)
Boiling Point (°F)
Total Mass Emission
Rate (lbs/min)
Total Mass Emission
Rate (lbs/interval)
Acenaphthene 1,340 154.2 534 2.56E-04 1.41E-02 2,4-Dimethylphenol 1,640 122.2 412 3.14E-04 1.73E-02 Aniline 1,190 93.1 363 2.27E-04 1.25E-02 Anthracene 2,680 178.2 644 5.14E-04 2.83E-02 Fluoranthene 331 202.3 707 6.35E-05 3.49E-03 Fluorene 3,020 166.2 563 5.78E-04 3.18E-02 Indeno(1,2,3-cd)pyrene 245 276.3 997 4.68E-05 2.58E-03 2-Methylnaphthalene 53,500 142.2 466 1.02E-02 5.63E-01 2-Methylphenol 2,280 108.1 376 4.37E-04 2.40E-02 Naphthalene 32,200 128.2 424 6.16E-03 3.39E-01 1-Naphthylamine 184 143.2 572 3.52E-05 1.93E-03 2-Naphthylamine 192 143.2 583 3.68E-05 2.02E-03 Benzo(a)anthracene 810 228.3 820 1.55E-04 8.53E-03 Benzo(b)fluoranthene 228 252.3 675 4.36E-05 2.40E-03 Benzo(k)fluoranthene 171 252.3 896 3.28E-05 1.80E-03 Benzo(ghi)perylene 476 276.3 932 9.11E-05 5.01E-03 Benzo(a)pyrene 930 252.3 923 1.78E-04 9.79E-03 Phenanthrene 4,310 178.2 644 8.26E-04 4.54E-02 Phenol 2,270 94.1 359 4.34E-04 2.39E-02 2-Picoline 918 93.1 265 1.76E-04 9.67E-03 Pyrene 1,220 202.3 759 2.33E-04 1.28E-02 Pyridine 309 79.1 239 5.91E-05 3.25E-03 Acetophenone 501 120.2 395 9.59E-05 5.28E-03 Carbazole 711 167.2 677 1.36E-04 7.48E-03 3-Methylphenol & 4-Methylphenol 2,220 108.1 396 4.25E-04 2.34E-02 Acenaphthylene 66.8 152.2 509 1.28E-05 7.03E-04 Chrysene 860 228.3 838 1.65E-04 9.06E-03 Dibenz(a,h)anthracene 313 278.4 975 5.99E-05 3.30E-03 Dibenzofuran 693 168.2 545 1.33E-04 7.30E-03
1 No direct measurements were obtained during this venting cycle interval.

2-86 Source Test Report for the Coker Steam Vent
Table 2-39. SW-846 Method 0010 Total SVOC Mass Emission Rate Results - Run 2
SVOC Analyte
Sampling Train A
Mass Emission
Rate (lbs/interval)
Sampling Train B
Mass Emission
Rate (lbs/interval)
Sampling Train C
Mass Emission
Rate (lbs/interval)
Extrapolated1 Mass
Emission Rate
(lbs/interval)
Run 2 Total Mass
Emission Rate
(lbs/cycle)
Acenaphthene 4.89E-02 2.77E-02 2.93E-02 1.41E-02 1.20E-01 2,4-Dimethylphenol 6.05E-02 3.45E-02 3.60E-02 1.73E-02 1.48E-01 Aniline 3.67E-02 2.19E-02 2.60E-02 1.25E-02 9.72E-02 Anthracene 7.72E-02 4.54E-02 5.90E-02 2.83E-02 2.10E-01 Fluoranthene 1.13E-02 6.80E-03 7.28E-03 3.49E-03 2.88E-02 Fluorene 9.13E-02 5.19E-02 6.63E-02 3.18E-02 2.41E-01 Indeno(1,2,3-cd)pyrene 7.34E-03 4.29E-03 5.37E-03 2.58E-03 1.96E-02 3-Methylcholanthrene 0 8.62E-04 0 0 8.62E-04 2-Methylnaphthalene 1.96E00 1.13E00 1.17E00 5.63E-01 4.83E00 2-Methylphenol 7.38E-02 4.39E-02 5.02E-02 2.40E-02 1.92E-01 Naphthalene 1.08E00 6.44E-01 7.06E-01 3.39E-01 2.77E00 1-Naphthylamine 6.91E-03 4.39E-03 4.04E-03 1.93E-03 1.73E-02 2-Naphthylamine 6.26E-03 3.76E-03 4.22E-03 2.02E-03 1.63E-02 Benzo(a)anthracene 2.51E-02 1.55E-02 1.78E-02 8.53E-03 6.69E-02 Benzo(b)fluoranthene 6.70E-03 4.54E-03 5.00E-03 2.40E-03 1.86E-02 Benzo(k)fluoranthene 5.31E-03 3.60E-03 3.76E-03 1.80E-03 1.45E-02 Benzo(ghi)perylene 1.47E-02 1.01E-02 1.05E-02 5.01E-03 4.03E-02 Benzo(a)pyrene 2.74E-02 1.82E-02 2.04E-02 9.79E-03 7.58E-02 Phenanthrene 1.15E-01 1.75E-01 9.47E-02 4.54E-02 4.30E-01 Phenol 7.34E-02 4.70E-02 4.98E-02 2.39E-02 1.94E-01 2-Picoline 2.90E-02 1.50E-02 2.02E-02 9.67E-03 7.39E-02 Pyrene 4.05E-02 2.43E-02 2.68E-02 1.28E-02 1.04E-01 Pyridine 1.08E-02 5.64E-03 6.79E-03 3.25E-03 2.65E-02 Acetophenone 2.05E-02 1.07E-02 1.10E-02 5.28E-03 4.75E-02 Carbazole 2.26E-02 1.40E-02 1.56E-02 7.48E-03 5.96E-02 3-Methylphenol & 4-Methylphenol 7.34E-02 4.54E-02 4.88E-02 2.34E-02 1.91E-01 Acenaphthylene 3.24E-03 1.88E-03 1.47E-03 7.03E-04 7.29E-03 Chrysene 2.53E-02 1.68E-02 1.89E-02 9.06E-03 7.00E-02 Dibenz(a,h)anthracene 1.42E-02 6.71E-03 6.88E-03 3.30E-03 3.11E-02 Dibenzofuran 2.17E-02 1.28E-02 1.52E-02 7.30E-03 5.70E-02
Total SVOC 4.00 2.45 2.54 1.22 10.2
1 No direct measurements were obtained during this venting cycle interval.

2-87 Source Test Report for the Coker Steam Vent
Table 2-40. SW-846 Method 0010 Sampling Train A Mass Emission Rate Results - Run 3
Date Venting Cycle
Venting Cycle
Interval
Venting Cycle
Duration (min)
Volumetric Flow Rate
(dscfm)
Run 3 - Sampling Train A 6/6/2008 1408-1630 1408-1439 31 150
SVOC Analyte Total Conc.
(μg/dscf)
Molecular Weight
(g/g-mol)
Boiling Point (°F)
Total Mass Emission
Rate (lbs/min)
Total Mass Emission
Rate (lbs/interval)
Acenaphthene 1,150 154.2 534 3.81E-04 1.18E-02 2,4-Dimethylphenol 1,610 122.2 412 5.31E-04 1.65E-02 Aniline 851 93.1 363 2.82E-04 8.73E-03 Anthracene 2,950 178.2 644 9.77E-04 3.03E-02 Fluoranthene 599 202.3 707 1.98E-04 6.14E-03 Fluorene 3,170 166.2 563 1.05E-03 3.25E-02 Indeno(1,2,3-cd)pyrene 116 276.3 997 3.84E-05 1.19E-03 2-Methylnaphthalene 40,900 142.2 466 1.35E-02 4.19E-01 2-Methylphenol 1,470 108.1 376 4.87E-04 1.51E-02 Naphthalene 23,400 128.2 424 7.74E-03 2.40E-01 1-Naphthylamine 145 143.2 572 4.80E-05 1.49E-03 2-Naphthylamine 139 143.2 583 4.61E-05 1.43E-03 Benzo(a)anthracene 758 228.3 820 2.51E-04 7.78E-03 Benzo(b)fluoranthene 141 252.3 675 4.67E-05 1.45E-03 Benzo(k)fluoranthene 124 252.3 896 4.10E-05 1.27E-03 Benzo(ghi)perylene 282 276.3 932 9.35E-05 2.90E-03 Benzo(a)pyrene 561 252.3 923 1.86E-04 5.76E-03 Phenanthrene 10,600 178.2 644 3.52E-03 1.09E-01 Phenol 1,080 94.1 359 3.59E-04 1.11E-02 2-Picoline 711 93.1 265 2.36E-04 7.30E-03 Pyrene 1,860 202.3 759 6.16E-04 1.91E-02 Pyridine 271 79.1 239 8.96E-05 2.78E-03 Carbazole 945 167.2 677 3.13E-04 9.69E-03 3-Methylphenol & 4-Methylphenol 1,280 108.1 396 4.23E-04 1.31E-02 Acenaphthylene 69.6 152.2 509 2.31E-05 7.15E-04 Chrysene 810 228.3 838 2.68E-04 8.32E-03 Dibenz(a,h)anthracene 170 278.4 975 5.63E-05 1.75E-03 Dibenzofuran 655 168.2 545 2.17E-04 6.72E-03
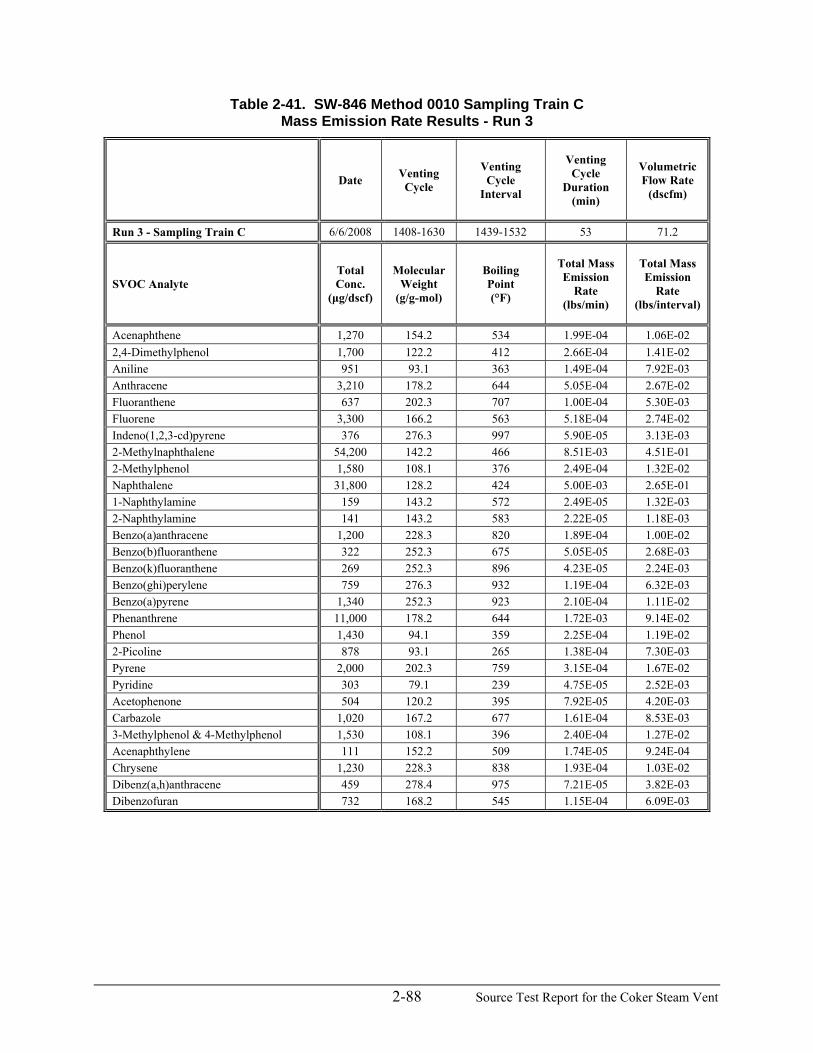
2-88 Source Test Report for the Coker Steam Vent
Table 2-41. SW-846 Method 0010 Sampling Train C Mass Emission Rate Results - Run 3
Date Venting Cycle
Venting Cycle
Interval
Venting Cycle
Duration (min)
Volumetric Flow Rate
(dscfm)
Run 3 - Sampling Train C 6/6/2008 1408-1630 1439-1532 53 71.2
SVOC Analyte Total Conc.
(μg/dscf)
Molecular Weight
(g/g-mol)
Boiling Point (°F)
Total Mass Emission
Rate (lbs/min)
Total Mass Emission
Rate (lbs/interval)
Acenaphthene 1,270 154.2 534 1.99E-04 1.06E-02 2,4-Dimethylphenol 1,700 122.2 412 2.66E-04 1.41E-02 Aniline 951 93.1 363 1.49E-04 7.92E-03 Anthracene 3,210 178.2 644 5.05E-04 2.67E-02 Fluoranthene 637 202.3 707 1.00E-04 5.30E-03 Fluorene 3,300 166.2 563 5.18E-04 2.74E-02 Indeno(1,2,3-cd)pyrene 376 276.3 997 5.90E-05 3.13E-03 2-Methylnaphthalene 54,200 142.2 466 8.51E-03 4.51E-01 2-Methylphenol 1,580 108.1 376 2.49E-04 1.32E-02 Naphthalene 31,800 128.2 424 5.00E-03 2.65E-01 1-Naphthylamine 159 143.2 572 2.49E-05 1.32E-03 2-Naphthylamine 141 143.2 583 2.22E-05 1.18E-03 Benzo(a)anthracene 1,200 228.3 820 1.89E-04 1.00E-02 Benzo(b)fluoranthene 322 252.3 675 5.05E-05 2.68E-03 Benzo(k)fluoranthene 269 252.3 896 4.23E-05 2.24E-03 Benzo(ghi)perylene 759 276.3 932 1.19E-04 6.32E-03 Benzo(a)pyrene 1,340 252.3 923 2.10E-04 1.11E-02 Phenanthrene 11,000 178.2 644 1.72E-03 9.14E-02 Phenol 1,430 94.1 359 2.25E-04 1.19E-02 2-Picoline 878 93.1 265 1.38E-04 7.30E-03 Pyrene 2,000 202.3 759 3.15E-04 1.67E-02 Pyridine 303 79.1 239 4.75E-05 2.52E-03 Acetophenone 504 120.2 395 7.92E-05 4.20E-03 Carbazole 1,020 167.2 677 1.61E-04 8.53E-03 3-Methylphenol & 4-Methylphenol 1,530 108.1 396 2.40E-04 1.27E-02 Acenaphthylene 111 152.2 509 1.74E-05 9.24E-04 Chrysene 1,230 228.3 838 1.93E-04 1.03E-02 Dibenz(a,h)anthracene 459 278.4 975 7.21E-05 3.82E-03 Dibenzofuran 732 168.2 545 1.15E-04 6.09E-03

2-89 Source Test Report for the Coker Steam Vent
Table 2-42. SW-846 Method 0010 Sampling Train D Mass Emission Rate Results - Run 3
Date Venting Cycle
Venting Cycle
Interval
Venting Cycle
Duration (min)
Volumetric Flow Rate
(dscfm)
Run 3 - Sampling Train D 6/6/2008 1408-1630 1532-1621 49 31.9
SVOC Analyte Total Conc.
(μg/dscf)
Molecular Weight
(g/g-mol)
Boiling Point (°F)
Total Mass Emission
Rate (lbs/min)
Total Mass Emission
Rate (lbs/interval)
Acenaphthene 572 154.2 534 4.03E-05 1.97E-03 2,4-Dimethylphenol 516 122.2 412 3.63E-05 1.78E-03 Aniline 295 93.1 363 2.08E-05 1.02E-03 Anthracene 1,320 178.2 644 9.30E-05 4.56E-03 Fluoranthene 271 202.3 707 1.91E-05 9.35E-04 Fluorene 1,420 166.2 563 9.98E-05 4.89E-03 Indeno(1,2,3-cd)pyrene 42.6 276.3 997 3.00E-06 1.47E-04 2-Methylnaphthalene 28,700 142.2 466 2.02E-03 9.91E-02 2-Methylphenol 467 108.1 376 3.29E-05 1.61E-03 Naphthalene 18,800 128.2 424 1.33E-03 6.50E-02 1-Naphthylamine 53.2 143.2 572 3.75E-06 1.84E-04 2-Naphthylamine 47.5 143.2 583 3.34E-06 1.64E-04 Benzo(a)anthracene 293 228.3 820 2.06E-05 1.01E-03 Benzo(b)fluoranthene 47.0 252.3 675 3.31E-06 1.62E-04 Benzo(k)fluoranthene 43.6 252.3 896 3.07E-06 1.51E-04 Benzo(ghi)perylene 108 276.3 932 7.61E-06 3.73E-04 Benzo(a)pyrene 203 252.3 923 1.43E-05 7.00E-04 Phenanthrene 4,950 178.2 644 3.48E-04 1.71E-02 Phenol 427 94.1 359 3.00E-05 1.47E-03 2-Picoline 311 93.1 265 2.19E-05 1.07E-03 Pyrene 824 202.3 759 5.80E-05 2.84E-03 Pyridine 131 79.1 239 9.22E-06 4.52E-04 Carbazole 368 167.2 677 2.59E-05 1.27E-03 3-Methylphenol & 4-Methylphenol 409 108.1 396 2.88E-05 1.41E-03 bis(2-Ethylhexyl) phthalate 9.01 390.6 728 6.34E-07 3.11E-05 Acenaphthylene 53.2 152.2 509 3.75E-06 1.84E-04 Chrysene 286 228.3 838 2.01E-05 9.87E-04 Dibenz(a,h)anthracene 60.6 278.4 975 4.27E-06 2.09E-04 Dibenzofuran 319 168.2 545 2.24E-05 1.10E-03 Di-n-butyl phthalate 1.06 278.3 644 7.49E-08 3.67E-06

2-90 Source Test Report for the Coker Steam Vent
Table 2-43. SW-846 Method 0010 Extrapolated Mass Emission Rate Results - Run 3
Date Venting Cycle
Venting Cycle
Interval
Venting Cycle
Duration (min)
Volumetric Flow Rate
(dscfm)
Run 3 - Extrapolated1 6/6/2008 1408-1630 1621-1630 9 21.3
SVOC Analyte Total Conc.
(μg/dscf)
Molecular Weight
(g/g-mol)
Boiling Point (°F)
Total Mass Emission
Rate (lbs/min)
Total Mass Emission
Rate (lbs/interval)
Acenaphthene 572 154.2 534 2.69E-05 2.42E-04 2,4-Dimethylphenol 516 122.2 412 2.42E-05 2.18E-04 Aniline 295 93.1 363 1.38E-05 1.25E-04 Anthracene 1,320 178.2 644 6.21E-05 5.59E-04 Fluoranthene 271 202.3 707 1.27E-05 1.15E-04 Fluorene 1,420 166.2 563 6.66E-05 5.99E-04 Indeno(1,2,3-cd)pyrene 42.6 276.3 997 2.00E-06 1.80E-05 2-Methylnaphthalene 28,700 142.2 466 1.35E-03 1.22E-02 2-Methylphenol 467 108.1 376 2.19E-05 1.97E-04 Naphthalene 18,800 128.2 424 8.85E-04 7.96E-03 1-Naphthylamine 53.2 143.2 572 2.50E-06 2.25E-05 2-Naphthylamine 47.5 143.2 583 2.23E-06 2.01E-05 Benzo(a)anthracene 293 228.3 820 1.38E-05 1.24E-04 Benzo(b)fluoranthene 47.0 252.3 675 2.21E-06 1.99E-05 Benzo(k)fluoranthene 43.6 252.3 896 2.05E-06 1.84E-05 Benzo(ghi)perylene 108 276.3 932 5.08E-06 4.57E-05 Benzo(a)pyrene 203 252.3 923 9.54E-06 8.58E-05 Phenanthrene 4,950 178.2 644 2.32E-04 2.09E-03 Phenol 427 94.1 359 2.00E-05 1.80E-04 2-Picoline 311 93.1 265 1.46E-05 1.32E-04 Pyrene 824 202.3 759 3.87E-05 3.49E-04 Pyridine 131 79.1 239 6.15E-06 5.54E-05 Carbazole 368 167.2 677 1.73E-05 1.56E-04 3-Methylphenol & 4-Methylphenol 409 108.1 396 1.92E-05 1.73E-04 bis(2-Ethylhexyl) phthalate 9.01 390.6 728 4.23E-07 3.81E-06 Acenaphthylene 53.2 152.2 509 2.50E-06 2.25E-05 Chrysene 286 228.3 838 1.34E-05 1.21E-04 Dibenz(a,h)anthracene 60.6 278.4 975 2.85E-06 2.56E-05 Dibenzofuran 319 168.2 545 1.50E-05 1.35E-04 Di-n-butyl phthalate 1.06 278.3 644 5.00E-08 4.50E-07
1 No direct measurements were obtained during this venting cycle interval.

2-91 Source Test Report for the Coker Steam Vent
Table 2-44. SW-846 Method 0010 Total SVOC Mass Emission Rate Results - Run 3
SVOC Analyte
Sampling Train A
Mass Emission
Rate (lbs/interval)
Sampling Train C
Mass Emission
Rate (lbs/interval)
Sampling Train D
Mass Emission
Rate (lbs/interval)
Extrapolated Mass
Emission1 Rate
(lbs/interval)
Run 3 Total Mass
Emission Rate
(lbs/cycle)
Acenaphthene 1.18E-02 1.06E-02 1.97E-03 2.42E-04 2.46E-02 2,4-Dimethylphenol 1.65E-02 1.41E-02 1.78E-03 2.18E-04 3.26E-02 Aniline 8.73E-03 7.92E-03 1.02E-03 1.25E-04 1.78E-02 Anthracene 3.03E-02 2.67E-02 4.56E-03 5.59E-04 6.22E-02 Fluoranthene 6.14E-03 5.30E-03 9.35E-04 1.15E-04 1.25E-02 Fluorene 3.25E-02 2.74E-02 4.89E-03 5.99E-04 6.55E-02 Indeno(1,2,3-cd)pyrene 1.19E-03 3.13E-03 1.47E-04 1.80E-05 4.49E-03 2-Methylnaphthalene 4.19E-01 4.51E-01 9.91E-02 1.22E-02 9.82E-01 2-Methylphenol 1.51E-02 1.32E-02 1.61E-03 1.97E-04 3.01E-02 Naphthalene 2.40E-01 2.65E-01 6.50E-02 7.96E-03 5.78E-01 1-Naphthylamine 1.49E-03 1.32E-03 1.84E-04 2.25E-05 3.01E-03 2-Naphthylamine 1.43E-03 1.18E-03 1.64E-04 2.01E-05 2.79E-03 Benzo(a)anthracene 7.78E-03 1.00E-02 1.01E-03 1.24E-04 1.89E-02 Benzo(b)fluoranthene 1.45E-03 2.68E-03 1.62E-04 1.99E-05 4.31E-03 Benzo(k)fluoranthene 1.27E-03 2.24E-03 1.51E-04 1.84E-05 3.68E-03 Benzo(ghi)perylene 2.90E-03 6.32E-03 3.73E-04 4.57E-05 9.64E-03 Benzo(a)pyrene 5.76E-03 1.11E-02 7.00E-04 8.58E-05 1.77E-02 Phenanthrene 1.09E-01 9.14E-02 1.71E-02 2.09E-03 2.20E-01 Phenol 1.11E-02 1.19E-02 1.47E-03 1.80E-04 2.47E-02 2-Picoline 7.30E-03 7.30E-03 1.07E-03 1.32E-04 1.58E-02 Pyrene 1.91E-02 1.67E-02 2.84E-03 3.49E-04 3.90E-02 Pyridine 2.78E-03 2.52E-03 4.52E-04 5.54E-05 5.81E-03 Acetophenone 0 4.20E-03 0 0 4.20E-03 Carbazole 9.69E-03 8.53E-03 1.27E-03 1.56E-04 1.96E-02 3-Methylphenol & 4-Methylphenol 1.31E-02 1.27E-02 1.41E-03 1.73E-04 2.74E-02 bis(2-Ethylhexyl) phthalate 0 0 3.11E-05 3.81E-06 3.49E-05 Acenaphthylene 7.15E-04 9.24E-04 1.84E-04 2.25E-05 1.84E-03 Chrysene 8.32E-03 1.03E-02 9.87E-04 1.21E-04 1.97E-02 Dibenz(a,h)anthracene 1.75E-03 3.82E-03 2.09E-04 2.56E-05 5.80E-03 Dibenzofuran 6.72E-03 6.09E-03 1.10E-03 1.35E-04 1.41E-02 Di-n-butyl phthalate 0 0 3.67E-06 4.50E-07 4.12E-06
Total SVOC 0.993 1.04 0.212 0.0260 2.27
1 No direct measurements were obtained during this venting cycle interval.

2-92 Source Test Report for the Coker Steam Vent
Table 2-45. SW-846 Method 0010 Sampling Train A Mass Emission Rate Results - Run 4
Date Venting Cycle
Venting Cycle
Interval
Venting Cycle
Duration (min)
Volumetric Flow Rate
(dscfm)
Run 4 - Sampling Train A 6/8/2008 632-926 632-703 31 291
SVOC Analyte Total Conc.
(μg/dscf)
Molecular Weight
(g/g-mol)
Boiling Point (°F)
Total Mass Emission
Rate (lbs/min)
Total Mass Emission
Rate (lbs/interval)
Acenaphthene 1,440 154.2 534 9.24E-04 2.86E-02 2,4-Dimethylphenol 1,630 122.2 412 1.05E-03 3.26E-02 Aniline 841 93.1 363 5.40E-04 1.67E-02 Anthracene 3,670 178.2 644 2.36E-03 7.31E-02 Fluoranthene 434 202.3 707 2.79E-04 8.65E-03 Fluorene 5,200 166.2 563 3.34E-03 1.04E-01 Indeno(1,2,3-cd)pyrene 74.7 276.3 997 4.80E-05 1.49E-03 2-Methylnaphthalene 58,800 142.2 466 3.78E-02 1.17E00 2-Methylphenol 1,280 108.1 376 8.25E-04 2.56E-02 Naphthalene 32,300 128.2 424 2.08E-02 6.44E-01 1-Naphthylamine 128 143.2 572 8.25E-05 2.56E-03 2-Naphthylamine 117 143.2 583 7.50E-05 2.33E-03 Benzo(a)anthracene 467 228.3 820 3.00E-04 9.30E-03 Benzo(b)fluoranthene 88.7 252.3 675 5.70E-05 1.77E-03 Benzo(k)fluoranthene 79.4 252.3 896 5.10E-05 1.58E-03 Benzo(ghi)perylene 180 276.3 932 1.16E-04 3.58E-03 Benzo(a)pyrene 339 252.3 923 2.18E-04 6.74E-03 Phenanthrene 10,400 178.2 644 6.67E-03 2.07E-01 Phenol 964 94.1 359 6.19E-04 1.92E-02 2-Picoline 922 93.1 265 5.93E-04 1.84E-02 Pyrene 1,350 202.3 759 8.69E-04 2.69E-02 Pyridine 315 79.1 239 2.03E-04 6.28E-03 Acetophenone 595 120.2 395 3.83E-04 1.19E-02 Carbazole 829 167.2 677 5.33E-04 1.65E-02 3-Methylphenol & 4-Methylphenol 1,140 108.1 396 7.35E-04 2.28E-02 Acenaphthylene 89.9 152.2 509 5.78E-05 1.79E-03 Chrysene 479 228.3 838 3.08E-04 9.54E-03 Dibenz(a,h)anthracene 110 278.4 975 7.05E-05 2.19E-03 Dibenzofuran 693 168.2 545 4.46E-04 1.38E-02 Di-n-butyl phthalate 3.04 278.3 644 1.95E-06 6.05E-05

2-93 Source Test Report for the Coker Steam Vent
Table 2-46. SW-846 Method 0010 Sampling Train B Mass Emission Rate Results - Run 4
Date Venting Cycle
Venting Cycle
Interval
Venting Cycle
Duration (min)
Volumetric Flow Rate
(dscfm)
Run 4 - Sampling Train B 6/8/2008 632-926 703-733 30 158
SVOC Analyte Total Conc.
(μg/dscf)
Molecular Weight
(g/g-mol)
Boiling Point (°F)
Total Mass Emission
Rate (lbs/min)
Total Mass Emission
Rate (lbs/interval)
Acenaphthene 931 154.2 534 3.25E-04 9.75E-03 2,4-Dimethylphenol 1,080 122.2 412 3.78E-04 1.13E-02 Aniline 559 93.1 363 1.95E-04 5.85E-03 Anthracene 1,830 178.2 644 6.39E-04 1.92E-02 Fluoranthene 283 202.3 707 9.88E-05 2.96E-03 Fluorene 2,120 166.2 563 7.41E-04 2.22E-02 Indeno(1,2,3-cd)pyrene 37.9 276.3 997 1.32E-05 3.96E-04 2-Methylnaphthalene 18,500 142.2 466 6.45E-03 1.93E-01 2-Methylphenol 901 108.1 376 3.15E-04 9.44E-03 Naphthalene 13,300 128.2 424 4.66E-03 1.40E-01 1-Naphthylamine 89.2 143.2 572 3.11E-05 9.34E-04 2-Naphthylamine 85.6 143.2 583 2.99E-05 8.97E-04 Benzo(a)anthracene 274 228.3 820 9.56E-05 2.87E-03 Benzo(b)fluoranthene 47.8 252.3 675 1.67E-05 5.00E-04 Benzo(k)fluoranthene 44.2 252.3 896 1.54E-05 4.62E-04 Benzo(ghi)perylene 86.5 276.3 932 3.02E-05 9.06E-04 Benzo(a)pyrene 185 252.3 923 6.45E-05 1.93E-03 Phenanthrene 2,860 178.2 644 9.97E-04 2.99E-02 Phenol 665 94.1 359 2.32E-04 6.96E-03 2-Picoline 514 93.1 265 1.79E-04 5.38E-03 Pyrene 848 202.3 759 2.96E-04 8.88E-03 Pyridine 162 79.1 239 5.66E-05 1.70E-03 Acetophenone 460 120.2 395 1.60E-04 4.81E-03 Carbazole 562 167.2 677 1.96E-04 5.89E-03 3-Methylphenol & 4-Methylphenol 793 108.1 396 2.77E-04 8.31E-03 Acenaphthylene 72.5 152.2 509 2.53E-05 7.59E-04 Chrysene 276 228.3 838 9.63E-05 2.89E-03 Dibenz(a,h)anthracene 53.2 278.4 975 1.86E-05 5.57E-04 Dibenzofuran 473 168.2 545 1.65E-04 4.96E-03

2-94 Source Test Report for the Coker Steam Vent
Table 2-47. SW-846 Method 0010 Sampling Train C Mass Emission Rate Results - Run 4
Date Venting Cycle
Venting Cycle
Interval
Venting Cycle
Duration (min)
Volumetric Flow Rate
(dscfm)
Run 4 - Sampling Train C 6/8/2008 632-926 733-831 58 110
SVOC Analyte Total Conc.
(μg/dscf)
Molecular Weight
(g/g-mol)
Boiling Point (°F)
Total Mass Emission
Rate (lbs/min)
Total Mass Emission
Rate (lbs/interval)
Acenaphthene 798 154.2 534 1.93E-04 1.12E-02 2,4-Dimethylphenol 628 122.2 412 1.52E-04 8.80E-03 Aniline 336 93.1 363 8.13E-05 4.71E-03 Anthracene 1,540 178.2 644 3.73E-04 2.16E-02 Fluoranthene 225 202.3 707 5.43E-05 3.15E-03 Fluorene 1,910 166.2 563 4.61E-04 2.67E-02 Indeno(1,2,3-cd)pyrene 28.7 276.3 997 6.93E-06 4.02E-04 2-Methylnaphthalene 19,700 142.2 466 4.77E-03 2.77E-01 2-Methylphenol 596 108.1 376 1.44E-04 8.36E-03 Naphthalene 13,400 128.2 424 3.25E-03 1.89E-01 1-Naphthylamine 53.8 143.2 572 1.30E-05 7.54E-04 2-Naphthylamine 58.3 143.2 583 1.41E-05 8.17E-04 Benzo(a)anthracene 197 228.3 820 4.76E-05 2.76E-03 Benzo(b)fluoranthene 37.2 252.3 675 8.99E-06 5.22E-04 Benzo(k)fluoranthene 28.7 252.3 896 6.93E-06 4.02E-04 Benzo(ghi)perylene 66.3 276.3 932 1.60E-05 9.30E-04 Benzo(a)pyrene 136 252.3 923 3.28E-05 1.90E-03 Phenanthrene 3,320 178.2 644 8.03E-04 4.66E-02 Phenol 429 94.1 359 1.04E-04 6.01E-03 2-Picoline 435 93.1 265 1.05E-04 6.10E-03 Pyrene 727 202.3 759 1.76E-04 1.02E-02 Pyridine 148 79.1 239 3.58E-05 2.07E-03 Carbazole 400 167.2 677 9.67E-05 5.61E-03 3-Methylphenol & 4-Methylphenol 498 108.1 396 1.20E-04 6.98E-03 Acenaphthylene 49.8 152.2 509 1.20E-05 6.98E-04 Chrysene 211 228.3 838 5.09E-05 2.95E-03 Dibenz(a,h)anthracene 39.5 278.4 975 9.53E-06 5.53E-04 Dibenzofuran 439 168.2 545 1.06E-04 6.16E-03

2-95 Source Test Report for the Coker Steam Vent
Table 2-48. SW-846 Method 0010 Extrapolated Mass Emission Rate Results - Run 4
Date Venting Cycle
Venting Cycle
Interval
Venting Cycle
Duration (min)
Volumetric Flow Rate
(dscfm)
Run 4 - Extrapolated1 6/8/2008 632-926 831-926 55 63.0
SVOC Analyte Total Conc.
(μg/dscf)
Molecular Weight
(g/g-mol)
Boiling Point (°F)
Total Mass Emission
Rate (lbs/min)
Total Mass Emission
Rate (lbs/interval)
Acenaphthene 798 154.2 534 1.11E-04 6.09E-03 2,4-Dimethylphenol 628 122.2 412 8.71E-05 4.79E-03 Aniline 336 93.1 363 4.67E-05 2.57E-03 Anthracene 1,540 178.2 644 2.14E-04 1.18E-02 Fluoranthene 225 202.3 707 3.12E-05 1.72E-03 Fluorene 1,910 166.2 563 2.65E-04 1.46E-02 Indeno(1,2,3-cd)pyrene 28.7 276.3 997 3.98E-06 2.19E-04 2-Methylnaphthalene 19,700 142.2 466 2.74E-03 1.51E-01 2-Methylphenol 596 108.1 376 8.28E-05 4.55E-03 Naphthalene 13,400 128.2 424 1.87E-03 1.03E-01 1-Naphthylamine 53.8 143.2 572 7.47E-06 4.11E-04 2-Naphthylamine 58.3 143.2 583 8.09E-06 4.45E-04 Benzo(a)anthracene 197 228.3 820 2.73E-05 1.50E-03 Benzo(b)fluoranthene 37.2 252.3 675 5.17E-06 2.84E-04 Benzo(k)fluoranthene 28.7 252.3 896 3.98E-06 2.19E-04 Benzo(ghi)perylene 66.3 276.3 932 9.21E-06 5.07E-04 Benzo(a)pyrene 136 252.3 923 1.89E-05 1.04E-03 Phenanthrene 3,320 178.2 644 4.61E-04 2.54E-02 Phenol 429 94.1 359 5.96E-05 3.28E-03 2-Picoline 435 93.1 265 6.04E-05 3.32E-03 Pyrene 727 202.3 759 1.01E-04 5.55E-03 Pyridine 148 79.1 239 2.05E-05 1.13E-03 Carbazole 400 167.2 677 5.55E-05 3.05E-03 3-Methylphenol & 4-Methylphenol 498 108.1 396 6.91E-05 3.80E-03 Acenaphthylene 49.8 152.2 509 6.91E-06 3.80E-04 Chrysene 211 228.3 838 2.93E-05 1.61E-03 Dibenz(a,h)anthracene 39.5 278.4 975 5.48E-06 3.01E-04 Dibenzofuran 439 168.2 545 6.10E-05 3.35E-03
1 No direct measurements were obtained during this venting cycle interval.

2-96 Source Test Report for the Coker Steam Vent
Table 2-49. SW-846 Method 0010 Total SVOC Mass Emission Rate Results - Run 4
SVOC Analyte
Sampling Train A
Mass Emission
Rate (lbs/interval)
Sampling Train B
Mass Emission
Rate (lbs/interval)
Sampling Train C
Mass Emission
Rate (lbs/interval)
Extrapolated Mass
Emission1 Rate
(lbs/interval)
Run 4 Total Mass
Emission Rate
(lbs/cycle)
Acenaphthene 2.86E-02 9.75E-03 1.12E-02 6.09E-03 5.57E-02 2,4-Dimethylphenol 3.26E-02 1.13E-02 8.80E-03 4.79E-03 5.75E-02 Aniline 1.67E-02 5.85E-03 4.71E-03 2.57E-03 2.99E-02 Anthracene 7.31E-02 1.92E-02 2.16E-02 1.18E-02 1.26E-01 Fluoranthene 8.65E-03 2.96E-03 3.15E-03 1.72E-03 1.65E-02 Fluorene 1.04E-01 2.22E-02 2.67E-02 1.46E-02 1.67E-01 Indeno(1,2,3-cd)pyrene 1.49E-03 3.96E-04 4.02E-04 2.19E-04 2.51E-03 2-Methylnaphthalene 1.17E00 1.93E-01 2.77E-01 1.51E-01 1.79E00 2-Methylphenol 2.56E-02 9.44E-03 8.36E-03 4.55E-03 4.79E-02 Naphthalene 6.44E-01 1.40E-01 1.89E-01 1.03E-01 1.08E00 1-Naphthylamine 2.56E-03 9.34E-04 7.54E-04 4.11E-04 4.66E-03 2-Naphthylamine 2.33E-03 8.97E-04 8.17E-04 4.45E-04 4.48E-03 Benzo(a)anthracene 9.30E-03 2.87E-03 2.76E-03 1.50E-03 1.64E-02 Benzo(b)fluoranthene 1.77E-03 5.00E-04 5.22E-04 2.84E-04 3.07E-03 Benzo(k)fluoranthene 1.58E-03 4.62E-04 4.02E-04 2.19E-04 2.67E-03 Benzo(ghi)perylene 3.58E-03 9.06E-04 9.30E-04 5.07E-04 5.92E-03 Benzo(a)pyrene 6.74E-03 1.93E-03 1.90E-03 1.04E-03 1.16E-02 Phenanthrene 2.07E-01 2.99E-02 4.66E-02 2.54E-02 3.09E-01 Phenol 1.92E-02 6.96E-03 6.01E-03 3.28E-03 3.54E-02 2-Picoline 1.84E-02 5.38E-03 6.10E-03 3.32E-03 3.32E-02 Pyrene 2.69E-02 8.88E-03 1.02E-02 5.55E-03 5.15E-02 Pyridine 6.28E-03 1.70E-03 2.07E-03 1.13E-03 1.12E-02 Acetophenone 1.19E-02 4.81E-03 0 0 1.67E-02 Carbazole 1.65E-02 5.89E-03 5.61E-03 3.05E-03 3.11E-02 3-Methylphenol & 4-Methylphenol 2.28E-02 8.31E-03 6.98E-03 3.80E-03 4.19E-02 Acenaphthylene 1.79E-03 7.59E-04 6.98E-04 3.80E-04 3.63E-03 Chrysene 9.54E-03 2.89E-03 2.95E-03 1.61E-03 1.70E-02 Dibenz(a,h)anthracene 2.19E-03 5.57E-04 5.53E-04 3.01E-04 3.60E-03 Dibenzofuran 1.38E-02 4.96E-03 6.16E-03 3.35E-03 2.83E-02 Di-n-butyl phthalate 6.05E-05 0 0 0 6.05E-05
Total SVOC 2.49 0.504 0.652 0.355 4.00
1 No direct measurements were obtained during this venting cycle interval.

2-97 Source Test Report for the Coker Steam Vent
2.7 Source Test Results for Particulate Matter Emissions This section presents particulate matter (PM) emissions results obtained during the
Source Test of the Coker Steam Vent. PM was measured according to modified EPA Methods 5 and 202 and the Protocol conditionally approved by EPA. Four sampling fractions were analyzed gravimetrically, after desiccation, for total PM:
• Front-half (nozzle, probe liner, cyclone with knockout flask, and front-half of the
filter holder) rinse with acetone; • The pre-weighed quartz-fiber filter; • Contents of the impingers, including a water rinse of the impingers, the back-half of
the filter holder, the glass coiled condenser, and the Teflon transfer line between the back-half of the filter holder and the inlet to the condenser; and
• Methylene chloride rinse of the impingers, the back half of the filter holder, the glass coiled condenser, and the Teflon transfer line between the back half of the filter holder and the inlet to the condenser.
The full laboratory report detailing the analyses of vent gas samples for PM emissions is
presented in Appendix 2-8.
2.7.1 Source Test Results for Particulate Matter Concentrations This section discusses PM concentration results obtained during the Source Test of the
Coker Steam Vent. Three EPA Method 5/202 sampling trains were performed sequentially during each test run to sample for total PM during as much of the complete venting cycle as possible. Each EPA Method 5/202 sampling train was identified with a unique ID (“1”, “2”, “3”, or “4”). Tables 1-8 through 1-11 presents a summary of EPA Method 5/202 sampling train sampling intervals during each venting cycle tested during the Source Test. Table 2-50 presents a summary of EPA Method 5/202 sampling train data such as dry gas volume collected and isokinetic sampling rate achieved. PM concentrations are presented in Tables 2-51 through 2-54. Condensible PM, recovered in the “back-half” fractions of the EPA Method 5/202 sampling trains, contributed to the majority of total measured PM.
2.7.2 Source Test Results for Particulate Matter Mass Emission Rates
Total PM mass emission rates, calculated in lbs/cycle, are presented in Tables 2-55 through 2-58, and Sections 2.2 and 2.3 discuss the development of pollutant mass emission rates from both measured and extrapolated data.

2-98 Source Test Report for the Coker Steam Vent
Table 2-50. EPA Method 5/202 Sampling Train Data
Date Sampling
Train ID
Venting Cycle
Venting Cycle
Duration (min)
Sampling Train
Interval
Sampling Train
Duration (min)
Moisture Conc. (%)
Dry Gas Sample Volume (dscf)
Isokinetic Sampling
Rate (%)
2 607-637 30 98.80 0.905 92.1 3 638-708 30 98.63 0.977 122 Run 1 6/3/2008 4
600-1018 258 708-822 681 99.00 1.735 111
1 2237-2308 31 98.56 1.184 94.9 2 2309-2339 30 98.41 1.181 102 Run 2 6/4-5/2008
3
2235-130 175
2340-040 60 97.83 2.649 158
1 1410-1443 33 99.58 0.367 114 2 1444-1533 49 99.36 0.778 176 Run 3 6/6/2008 3
1408-1630 142 1538-1622 44 98.81 1.254 451
1 633-705 32 99.17 0.703 100 2 706-736 30 98.40 1.096 131 Run 4 6/8/2008
3
632-926 174
737-834 57 98.25 2.254 255
1 EPA Method 5/202 sampling train “4” was not operated for six (6) minutes of this sampling train interval due to equipment malfunction.

2-99 Source Test Report for the Coker Steam Vent
Table 2-51. Source Test Results for Particulate Matter Concentrations – Run 1
Front-Half Fraction Back-Half Fraction: Condensible PM
Date Venting Cycle
Sampling Interval
Sampling Duration
(min)
Probe and
Nozzle Rinse PM
Mass (mg)
Filter PM
Mass (mg)
Condensate PM Mass
(mg)
MeCl2 Rinse PM
Mass (mg)
Total PM
Mass (mg)
SampleVolume(dscf)
Total PMConc.
(mg/dscm)
Total PM
Conc. (gr/dscf)
607-637 30 19.8 7.0 218 512 757 0.905 29,544 12.9 638-708 30 5.3 3.4 215 483 707 0.977 25,543 11.2 Run 1 6/3/2008 600-1018
708-822 681 7.0 2.4 519 839 1,367 1.735 27,839 12.2
1 EPA Method 5/202 sampling train “4” was not operated for six minutes of this sampling train interval due to equipment malfunction.
Table 2-52. Source Test Results for Particulate Matter Concentrations – Run 2
Front-Half Fraction Back-Half Fraction: Condensible PM
Date Venting Cycle
Sampling Interval
Sampling Duration
(min)
Probe and
Nozzle Rinse PM
Mass (mg)
Filter PM
Mass (mg)
Condensate PM Mass
(mg)
MeCl2 Rinse PM
Mass (mg)
Total PM
Mass (mg)
SampleVolume(dscf)
Total PMConc.
(mg/dscm)
Total PM
Conc. (gr/dscf)
2237-2308 31 150.0 114.0 186 1,360 1,810 1.184 53,978 23.6 2309-2339 30 148.0 138.0 142 1,020 1,448 1.181 43,301 18.9 Run 2 6/4-5/2008 2235-130
2340-040 60 501.0 183.0 425 1,710 2,819 2.649 37,580 16.4

2-100 Source Test Report for the Coker Steam Vent
Table 2-53. Source Test Results for Particulate Matter Concentrations – Run 3
Front-Half Fraction Back-Half Fraction: Condensible PM
Date Venting Cycle
Sampling Interval
Sampling Duration
(min)
Probe and
Nozzle Rinse PM
Mass (mg)
Filter PM
Mass (mg)
Condensate PM Mass
(mg)
MeCl2 Rinse PM
Mass (mg)
Total PM
Mass (mg)
SampleVolume(dscf)
Total PMConc.
(mg/dscm)
Total PM
Conc. (gr/dscf)
1410-1443 33 114.0 19.6 136 387 657 0.367 63,160 27.6 1444-1533 49 110.0 50.9 136 569 866 0.778 39,280 17.2 Run 3 6/6/2008 1408-1630
1538-1622 44 73.8 11.2 206 478 769 1.254 21,662 9.46
Table 2-54. Source Test Results for Particulate Matter Concentrations – Run 4
Front-Half Fraction Back-Half Fraction: Condensible PM
Date Venting Cycle
Sampling Interval
Sampling Duration
(min)
Probe and
Nozzle Rinse PM
Mass (mg)
Filter PM
Mass (mg)
Condensate PM Mass
(mg)
MeCl2 Rinse PM
Mass (mg)
Total PM
Mass (mg)
SampleVolume(dscf)
Total PMConc.
(mg/dscm)
Total PM
Conc. (gr/dscf)
633-705 32 47.8 10.7 261 695 1,015 0.703 50,956 22.3 706-736 30 18.7 8.8 291 464 783 1.096 25,211 11.0 Run 4 6/8/2008 632-926
737-834 57 46.5 12.6 362 580 1,001 2.254 15,688 6.85

2-101 Source Test Report for the Coker Steam Vent
Table 2-55. Source Test Results for Particulate Matter Mass Emission Rates – Run 1
Date Venting Cycle
Venting Cycle
Interval
Venting Cycle
Interval Duration
(min)
Total PM Conc.
(mg/dscm)
Volumetric Flow Rate
(dscfm)
Total PM Mass
Emission Rate
(lbs/min)
Total PM Mass Emission
Rate (lbs/interval)
Total PM Mass
Emission Rate
(lbs/cycle)
600-637 37 29,544 228 0.421 15.6 637-708 31 25,543 200 0.318 9.9 708-822 74 27,839 166 0.288 21.3
Run 1 6/3/2008 600-1018
822-10181 116 27,839 128 0.222 25.7
72.5
1 No direct measurements were obtained during this venting cycle interval. These results have been extrapolated.
Table 2-56. Source Test Results for Particulate Matter Mass Emission Rates – Run 2
Date Venting Cycle
Venting Cycle
Interval
Venting Cycle
Interval Duration
(min)
Total PM Conc.
(mg/dscm)
Volumetric Flow Rate
(dscfm)
Total PM Mass
Emission Rate
(lbs/min)
Total PM Mass
Emission Rate
(lbs/interval)
Total PM Mass
Emission Rate
(lbs/cycle)
2235-2308 33 53,978 351 1.18 39.0 2308-2339 31 43,301 280 0.757 23.5 2339-040 61 37,580 163 0.383 23.4
Run 2 6/4-5/2008 2235-130
040-1301 50 37,580 84.6 0.199 9.93
95.8
1 No direct measurements were obtained during this venting cycle interval. These results have been extrapolated.
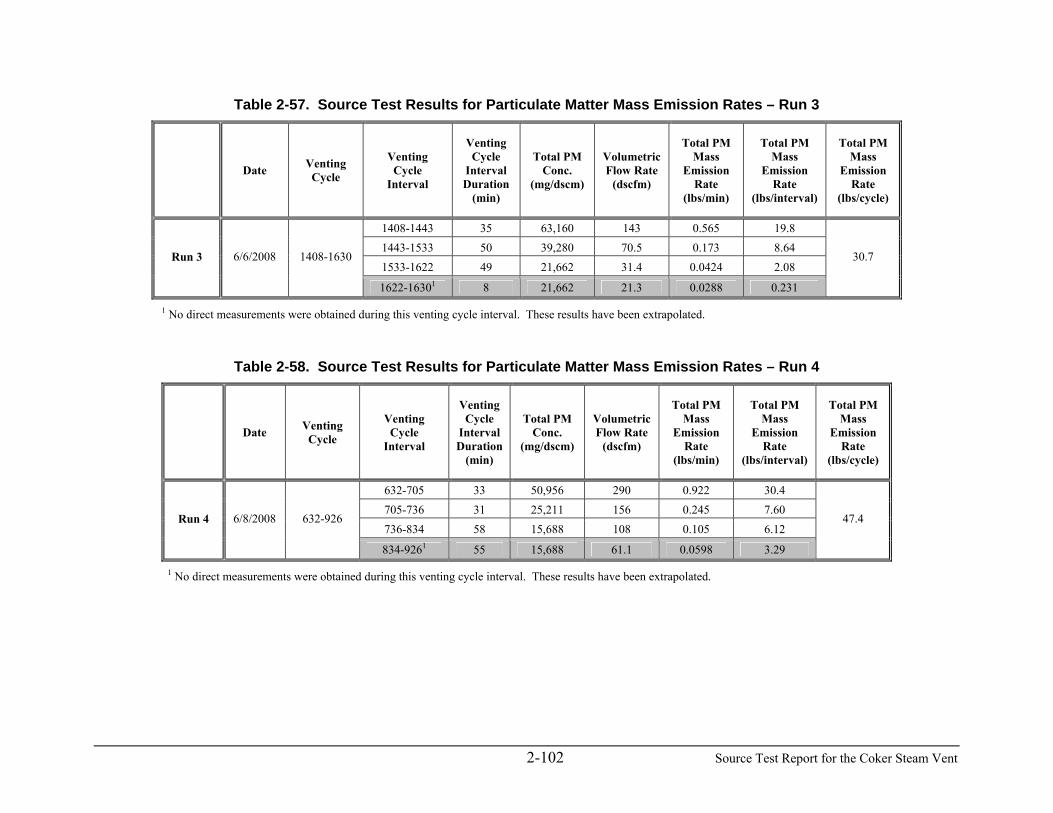
2-102 Source Test Report for the Coker Steam Vent
Table 2-57. Source Test Results for Particulate Matter Mass Emission Rates – Run 3
Date Venting Cycle
Venting Cycle
Interval
Venting Cycle
Interval Duration
(min)
Total PM Conc.
(mg/dscm)
Volumetric Flow Rate
(dscfm)
Total PM Mass
Emission Rate
(lbs/min)
Total PM Mass
Emission Rate
(lbs/interval)
Total PM Mass
Emission Rate
(lbs/cycle)
1408-1443 35 63,160 143 0.565 19.8 1443-1533 50 39,280 70.5 0.173 8.64 1533-1622 49 21,662 31.4 0.0424 2.08
Run 3 6/6/2008 1408-1630
1622-16301 8 21,662 21.3 0.0288 0.231
30.7
1 No direct measurements were obtained during this venting cycle interval. These results have been extrapolated.
Table 2-58. Source Test Results for Particulate Matter Mass Emission Rates – Run 4
Date Venting Cycle
Venting Cycle
Interval
Venting Cycle
Interval Duration
(min)
Total PM Conc.
(mg/dscm)
Volumetric Flow Rate
(dscfm)
Total PM Mass
Emission Rate
(lbs/min)
Total PM Mass
Emission Rate
(lbs/interval)
Total PM Mass
Emission Rate
(lbs/cycle)
632-705 33 50,956 290 0.922 30.4 705-736 31 25,211 156 0.245 7.60 736-834 58 15,688 108 0.105 6.12
Run 4 6/8/2008 632-926
834-9261 55 15,688 61.1 0.0598 3.29
47.4
1 No direct measurements were obtained during this venting cycle interval. These results have been extrapolated.

3-1 Source Test Report for the Coker Steam Vent
3.0 Sampling and Analytical Procedures
The Pre-Survey was conducted during three separate venting cycles of Coker Steam Vent 3, where one valid sampling run was performed during each venting cycle. The Source Test was conducted during four separate venting cycles of Coker Steam Vent 3, where one valid sampling run (comprised by several individual sampling trains) was performed during each venting cycle. During the Source Test, all sampling began as soon as possible (see Section 1.4) after Coker Steam Vent 3 activation and continued for as long as sampling equipment remained operable within acceptable performance ranges and until health and safety limitations were encountered.
The source testing of the Coker Steam Vent 3 gas stream for all of the parameters
requested by EPA was a challenging project that required much more than the simple performance of standard source testing methodologies for pollutants in a matrix of air. The accurate and precise measurement of the mass emission rates of benzene, toluene, NMNE VOCs, SVOCs, and PM from the Coker Steam Vent could not be performed without significantly modifying the methods prescribed in EPA’s request. The modified sampling and analytical procedures that are described in the Protocol and conditionally approved by EPA are briefly discussed in this section. Any deviations from the EPA-approved modified test methods during the source testing are also identified in this section and discussed in Section 5.0. Table 3-1 provides a summary of the sampling and analytical methods used in the measurement of the target pollutant emissions as well as vent gas volumetric flow rates from the Coker Steam Vent. Appendix 3-1 presents the field sample logbook. Appendices 3-2 through 3-5 present the vent gas sampling data sheets and the isokinetic and volumetric flow rate calculations. 3.1 Coker Steam Vent 3 Sampling Locations
HOVENSA installed six sampling ports on the Coker Steam Vent 3 pipe to facilitate the simultaneous sampling of methane, ethane, benzene, toluene, NMNE VOC, SVOC, and PM emissions during the Source Test. Figure 3-1 presents a schematic of the Coker Steam Vent 3 sampling ports. Each sampling port was located at least two pipe diameters downstream and at least ½ pipe diameters upstream from any outlet, disturbance, or adjacent sampling port that was actively used for EPA Method 2/4, EPA Method 5/202, or SW-846 Method 0010 sampling. The Coker Steam Vent 3 pipe has a diameter of 12 inches. Of the six sampling ports, two adjacent ports (“3” and “4”) were dedicated for the operation of sequential EPA Method 5/202 sampling trains and two adjacent ports (“5” and “6”) were dedicated for the operation of sequential SW-846 Method 0010 sampling trains during the Source Test. The EPA Method 2/4 sampling train and the EPA Method 18/25A/OTM12 sampling system were operated on the remaining two sampling ports (“1” and “2”, respectively) during the Source Test. The EPA Method 5/TO-14 sampling train was operated on Port “3” during the Pre-Survey.

3-2 Source Test Report for the Coker Steam Vent
Table 3-1. Summary of Sampling and Analytical Methods
Test Program Parameter Modified1 Sampling Methodology
Modified1 Analytical Methodology
Pre-Survey Speciated VOCs EPA Methods 5 and TO-14 GC/MS by EPA Method TO-14 and SW-846 Method 8260B
Pre-Survey and Source Test Moisture EPA Method 4 Gravimetric by EPA Method 4
Source Test Volumetric Flow Rate EPA Methods 2, 3, and 4 N/A
Source Test Methane, Ethane, Benzene, and Toluene
EPA Methods 18 and Other Test Method 12 GC/FID by EPA Method 18
Source Test NMNE VOCs EPA Methods 18, 25A, and Other Test Method 12
GC/FID by EPA Methods 18 and 25A
Source Test SVOCs SW-846 Method 0010 GC/MS by SW-846 Methods 3542 and 8270C
Source Test PM EPA Methods 5 and 202 Gravimetric by EPA Methods 5 and 202
1 The Protocol described the modified sampling and analytical methodologies used to conduct the Pre-Survey and Source Test of Coker Steam Vent 3. The Protocol was submitted to EPA on February 29. 2008 and conditionally approved on March 21, 2008.
Figure 3-1. Coker Steam Vent 3 Sampling Location Diagram
3-3 Source Test Report for the Coker Steam Vent
3.2 Speciated Volatile Organic Compound Concentrations by EPA Methods 5 and TO-14 The Pre-Survey was conducted to determine the target analytes for emissions testing
using EPA Method 18. The Pre-Survey results were previously provided to EPA in a letter report dated May 5, 2008. EPA Method 18 recommends the performance of optional pre-survey screening on sources where the target pollutants are not generally known. As such, the primary intent of the Pre-Survey was to identify any organic analytes (in addition to methane, ethane, benzene, and toluene) measured in excess of 100 ppmw in the Coker Steam Vent 3 gas stream. Section 16.1.3 of EPA Method 18 presents sampling procedures for conducting an optional pre-survey using either glass flasks or flexible bags; however, neither of these sampling procedures is suitable for testing the high-moisture, high-velocity Coker Steam Vent source. Selected VOC concentrations were speciated during the Pre-Survey according to sampling procedures based upon EPA Methods 5, 25, TO-14 and the Protocol. The analytical procedures were based upon EPA Method TO-14 and SW-846 Method 8260B.
The modified EPA Method 5/TO-14 sampling train consisted of the following
components: • Stainless steel nozzle; • Sampling probe with stainless steel liner (the probe was also equipped with a Type-S
pitot tube); • Heated quartz fiber filter; • Teflon transfer line; • Glass coiled condenser; • Large glass impinger (3-liter), with knockout stem, empty; • Large glass impinger (3-liter), with modified Greenburg-Smith stem, containing 100
ml D.I. H2O; • Large glass impinger (3-liter), with Greenburg-Smith stem, containing 100 ml D.I.
H2O; • Two standard impingers, with knockout stems, empty; • Two standard glass impingers, with Greenburg-Smith stems, each containing 100 ml
5% zinc acetate solution; • One standard glass impinger, with modified Greenburg-Smith stem, containing 100
ml 1.0N potassium hydroxide; • Teflon union to allow a sample gas slipstream to a:
— Teflon valve; — Mass flow meter; — Stainless steel valve; and — Evacuated Summa canister;

3-4 Source Test Report for the Coker Steam Vent
• One standard glass impinger, with modified Greenburg-Smith stem, containing approximately 300 g of silica gel desiccant;
• Air-tight sample pump; • Dry gas meter; and • Orifice.
Sample gas was collected in up to three 1-liter Summa canisters per test run once a sufficient amount of dry sample gas had passed through the entire sampling train. A precision vacuum gauge was used to measure the initial vacuum of the evacuated Summa canister prior to sampling. Mass flow meter and canister vacuum readings were recorded every two minutes during Summa canister sampling. Sampling train operators ensured that the canister vacuum remained higher than the total sampling system vacuum during the entire canister-sampling period. Once a sufficient amount of sample gas had been collected in a given canister, a precision vacuum gauge was used to measure the final vacuum of the canister.
Upon completion of a given sampling period a final leak check of the sampling system was performed. In the event that any leak rates exceeded 4% of the average sampling rate, the dry gas sample volume was corrected according to the applicable calculations presented in EPA Method 5. The total dry gas sample volume collected in the Summa canister was added to the dry gas sample volume recorded by the dry gas meter prior to performing calculations for the dry gas concentrations of VOCs captured in the sampling train upstream of the Summa canister sampling manifold.
Several Summa canister samples were collected over the duration of a given test run while only one condensate sample was collected during each test run. The 1-liter Summa canisters were analyzed according to EPA Method TO-14. The moisture content of the vent gas was determined from the total weight gain of the sampling train impingers. After the gravimetric determination of moisture concentration, the contents of the first three large glass impingers were recovered as a “condensate catch” sample fraction. The condenser, the first three impingers, and all connecting glassware between the impingers were then rinsed three times with D.I. H2O into the “condensate catch” sample bottles. The condenser, the first three impingers, and all connecting glassware between the impingers were then rinsed three times with methanol into the “methanol rinse” sample bottles. The “condensate catch” and “methanol rinse” samples were combined in the laboratory into one fraction for single analysis according to SW-846 Method 8260B. The entire list of Pre-Survey VOC analytes was drawn from EPA Method TO-14 and SW-846 Method 8260B and is presented in Tables 3-2 and 3-3.

3-5 Source Test Report for the Coker Steam Vent
Table 3-2. List of Pre-Survey Volatile Organic Compound Analytes for EPA Method TO-14
EPA Method TO-14 Analytes
Methane Benzene n-Decane Chloromethane Ethane Acetonitrile n-Dodecane 3-Chloropropene Butane, 2-methyl- n-Octane n-Undecane Cyclohexane Butane, 2,3-dimethyl- Pentane Chlorodifluoromethane Dibromomethane Cyclopropane, 1,2-dimethyl-, trans- Benzyl chloride Nonane 1,2-Dichlorobenzene Isobutane n-Propylbenzene m-Xylene & p-Xylene 1,3-Dichlorobenzene cis-1,3-Dichloropropene Styrene Bromodichloromethane 1,4-Dichlorobenzene 1-Propene, 2-methyl- 1,1,2,2-Tetrachloroethane 1,2-Dibromoethane (EDB) Dichlorodifluoromethane 1-Propene, 2-methyl- Tetrachloroethene 2-Butanone (MEK) 1,1-Dichloroethane trans-1,3-Dichloropropene Toluene 4-Methyl-2-pentanone (MIBK) 1,2-Dichloroethane 1,2-Dichloro-1,1,2,2-tetrafluoroethane 1,2,4-Trichlorobenzene cis-1,2-Dichloroethene 1,1-Dichloroethene Acetone 1,1,1-Trichloroethane n-Butane Ethylbenzene 1,1,2-Trichloroethane Bromoform Ethyl ether Trichloroethene Bromomethane Trichlorofluoromethane 1,1,2-Trichloro-1,2,2-trifluoroethane 1,3-Butadiene n-Heptane 1,2,4-Trimethylbenzene 1-Butanol Hexachlorobutadiene 1,3,5-Trimethylbenzene Acrolein n-Hexane Vinyl acetate Carbon disulfide 2-Hexanone Vinyl chloride Acrylonitrile Cumene o-Xylene Carbon tetrachloride Methanol trans-1,2-Dichloroethene Chlorobenzene Methylene chloride 1,2-Dichloropropane Dibromochloromethane Naphthalene Methyl tert-butyl ether Chloroethane Benzene alpha-Methylstyrene Chloroform

3-6 Source Test Report for the Coker Steam Vent
Table 3-3. List of Pre-Survey Volatile Organic Compound Analytes for SW-846 Method 8260B
SW-846 Method 8260B Analytes
Benzene, 1-ethyl-3-methyl- 1,2,3-Trichlorobenzene Carbon disulfide trans-1,2-Dichloroethene Naphthalene, 2-methyl- 1,2,4-Trichlorobenzene Carbon tetrachloride 1,2-Dichloropropane trans-1,3-Dichloropropene 1,1,1-Trichloroethane Chlorobenzene 1,3-Dichloropropane Acetone 1,1,2-Trichloroethane Chlorodibromomethane 2,2-Dichloropropane Ethylbenzene Trichloroethene 1,2-Dibromo-3-chloropropane 1,1-Dichloropropene Trichlorofluoromethane 1,2,3-Trichloropropane Chloroethane cis-1,3-Dichloropropene Hexachlorobutadiene 1,2,4-Trimethylbenzene Chloroform 2-Hexanone 1,3,5-Trimethylbenzene Chloromethane Isopropylbenzene Vinyl chloride 2-Chlorotoluene p-Isopropyltoluene o-Xylene 4-Chlorotoluene Methylene chloride m-Xylene & p-Xylene 1,2-Dibromoethane 4-Methyl-2-pentanone Bromobenzene Dibromomethane Naphthalene Bromochloromethane 1,2-Dichlorobenzene Benzene Bromodichloromethane 1,3-Dichlorobenzene n-Propylbenzene Bromoform 1,4-Dichlorobenzene Styrene Bromomethane Dichlorodifluoromethane 1,1,1,2-Tetrachloroethane 2-Butanone 1,1-Dichloroethane 1,1,2,2-Tetrachloroethane n-Butylbenzene 1,2-Dichloroethane Tetrachloroethene sec-Butylbenzene 1,1-Dichloroethene Toluene tert-Butylbenzene cis-1,2-Dichloroethene

3-7 Source Test Report for the Coker Steam Vent
Speciated VOC concentrations obtained for both the canister and condensate/rinse fractions were corrected from a dry basis to a wet basis using the average of the moisture concentrations (99%) measured from all three Pre-Survey test runs. 3.2.1 Deviations from the Protocol Two deviations from the Protocol occurred during the Pre-Survey sampling, and their respective impacts on quality control/quality assurance are discussed further in Section 5.0:
• Methanol rinses were not performed on the connecting glassware between the glass condenser and the filter media; and
• Two sample fractions recovered from each EPA Method 5/TO-14 sampling train – the “condensate catch” and the “methanol rinse” – were not analyzed separately; they were combined for single analysis in the laboratory.
3.3 Volumetric Flow Rate by EPA Methods 2, 3, and 4 The vent gas volumetric flow rate was determined during the Source Test according to
procedures based upon EPA Methods 2, 3, and 4. The sequential EPA Method 5/202 and SW-846 Method 0010 sampling trains and the redundant EPA Method 2/4 sampling train were used to quantify instantaneous volumetric flow rates for as long as possible during each venting cycle. The modified procedures by which volumetric flow rate data was obtained on the high-moisture, high velocity Coker Steam Vent gas stream have already been described in detail in the Protocol. Any deviations from those modified procedures are discussed in this section.
The EPA Method 2/4 sampling train consisted of the following components:
• Stainless steel nozzle; • Sampling probe with stainless steel liner (the probe was also equipped with a
Type-S pitot tube); • Heated quartz fiber filter; • Teflon transfer line; • Glass coiled condenser; • Two large glass impingers (3-liter), with knockout stem, empty; • Two large glass impingers (3-liter), with modified Greenburg-Smith stem, each
containing 200 ml D.I. H2O; • Two standard glass impingers, with Greenburg-Smith stems, each containing 200
ml 5% zinc acetate solution; • One standard glass impinger, with modified Greenburg-Smith stem, containing
200 ml 5% zinc acetate solution;

3-8 Source Test Report for the Coker Steam Vent
• One standard glass impinger, with knockout stem, empty (optional); • One standard glass impinger, with modified Greenburg-Smith stem, containing
approximately 300 g of silica gel desiccant; • Air-tight sample pump; • Dry gas meter; and • Orifice.
The configurations of the SW-846 Method 0010 and EPA Method 5/202 sampling trains
are described in Sections 3.7 and 3.8, respectively.
During the EPA Method 2 sampling, differential pressure measurements across a Type-S pitot tube were recorded to determine the vent gas velocity. These measurements were made with digital manometers rather than a gauge-oil manometer due to the high vent gas differential pressure (>100 inches of H2O) encountered in Coker Steam Vent 3. A calibration check was performed on the digital manometers according to EPA Method 2, Section 6.2.1. This calibration check data as well as other calibration information associated with equipment used in the EPA Method 2/4 sampling train is included in Appendix 3-6.
The differential pressure readings, vent temperature readings, dry gas meter readings, and
other applicable sampling system operating parameters were generally recorded every two minutes during the operation of each EPA Method 2/4, EPA Method 5/202, and SW-846 Method 0010 sampling train. Some deviations to this criterion occurred during the Source Test and are discussed in Section 5.0. Static pressure measurements for use in the determination of vent gas velocity were obtained with a magnehelic gauge and stainless steel sampling probe attached to each EPA Method 2/4, EPA Method 5/202, and SW-846 Method 0010 sampling train.
EPA Method 3 was used to determine the dry gas molecular weight of the Coker Steam
Vent 3 gas stream. Three single-point grab samples were collected during each test run in Tedlar bags attached to the dry gas meter outlet of the EPA Method 2/4 sampling train, except during Run 3, where only one grab sample was collected due to the lower dry gas content of the vent gas stream during that venting cycle. A Fyrite combustion analyzer was used to measure the oxygen and carbon dioxide concentrations (in %) of the Tedlar bag samples. Average oxygen and carbon dioxide concentrations were developed from all of the samples collected during a test run. In addition, speciated VOC data obtained with the EPA Method 18 analysis of vent gas samples, averaged throughout the test run, were used to quantify major contributors (>1%) to dry gas molecular weight. The remaining balance in the dry gas fraction of the vent gas was designated as nitrogen. Average vent gas molecular weights are presented in Table 2-3 for each test run.

3-9 Source Test Report for the Coker Steam Vent
Upon completion of a sampling period a final leak check was performed. In the event that any leak rates exceeded 4% of the average sampling rate, the dry gas sample volume was corrected according to the applicable calculations presented in EPA Method 5. One of the consequences of low sampling rates acquired with sampling trains composed of several large knockout impingers, joints, and unions is the possibility of a post-test leak check rate exceeding 4% of the average sampling rate achieved during the test run. In such a case, EPA Method 5 requires dry gas volume correction according to EPA Equation 5-1(a) Case I. During the Source Test, most of the EPA Method 2/4, EPA Method 5/202, and SW-846 Method 0010 sampling trains performed on Coker Steam Vent 3 required dry gas volume correction according to this equation.
The moisture content of the gas stream was determined from the total weight gain of the
sampling train impingers according to EPA Method 4. A significant organic layer was not present in the condensate catch upon visual inspection of the impingers, and a separatory funnel was not used after any of the test runs to remove the organic layer prior to the gravimetric determination of condensed water.
A database consisting of the instantaneous volumetric flow rates and moisture
concentrations measured by each individual sampling train operated during a given venting cycle was used to develop average volumetric flow rates (in dscfm) for a given venting cycle interval (defined in Section 2.2). This approach was used to maintain the highest level of consistency in the development of pollutant mass emission rates, as well as to incorporate the averaging of data as often as possible.
3.3.1 Deviations from the Protocol Two deviations from the Protocol occurred during the sampling for vent gas volumetric flow rate, and their respective impacts on quality control/quality assurance are discussed further in Section 5.0.
• The redundant EPA Method 2/4 sampling train conducted during Run 1 was not inserted completely into the Coker Steam Vent 3 pipe until approximately 40 minutes after venting cycle activation, therefore moisture and volumetric flow rate data obtained with this sampling train was not used in any calculations. However, Tedlar bag samples for the determination of oxygen and carbon dioxide concentrations were collected from this sampling train after the sampling probe nozzle had been appropriately positioned in the center of the pipe.
• Data points critical to the development of vent gas volumetric flow rates were not recorded every two minutes during various sampling intervals of EPA Method 2/4, EPA Method 5/202, and SW-846 Method 0010 sampling train operation during all four test runs. This deviation occurred because sampling train operators were

3-10 Source Test Report for the Coker Steam Vent
preoccupied with other sampling train quality assurance/quality control activities, such as the application of ice to maintain acceptable sampling train operating temperatures.
3.4 Methane, Ethane, Benzene, and Toluene Concentrations by EPA Method 18
and Other Test Method 12 The concentrations of methane, ethane, benzene, and toluene in the Coker Steam Vent 3
gas stream were measured during the Source Test using a gas chromatograph (GC) and FID. A diluted sample of the Coker Steam Vent 3 gas stream was extracted via the EPA Method 18/25A/OTM12 dilution sampling system to a Tedlar bag. An integrated bag sample was collected during each of three sampling intervals achieved during each venting cycle. The Tedlar bag samples were then transported to a laboratory until analysis by GC/FID.
Methane, ethane, benzene, and toluene concentrations in the diluted Tedlar bag samples
were measured on a wet basis by the GC/FID. EPA’s request for information did not require the speciation by GC/FID of all C1-C6 hydrocarbons; however, the calibration gas standards used for the performance of EPA Method 18 included a mixture of C1-C6 compounds. The concentrations of propane, butane, pentane, and hexane were measured during the Source Test and reported as supplementary data.
It is important to note that with an average EPA Method 18/25/OTM12 sampling system
dilution ratio (DR) of approximately 30:1 during each test run, the moisture concentrations in the Tedlar bag samples were approximately 3%. Each Tedlar bag sample was analyzed at least in triplicate and the final speciated VOC concentration result was calculated as the average of all separate analyses of the sample. The average dilution ratios developed on a run-by-run basis through the operation of the EPA Method 18/25A/OTM dilution sampling system (see Section 3.5) were incorporated into the EPA Method 18 analyses. Prior to the start of sampling, the GC/FID analyzer was calibrated using Master Class (+/- 2% accuracy) calibration gas standards containing the target analytes in a balance of nitrogen. The analyte-specific method detection limits established through the calibration of the GC/FID are presented in Table 3-4. The following calibration and QA procedures presented in EPA Method 18 were followed:
• The instrument was calibrated at three points before sample analysis and at one point after analysis; and
• A recovery study showed 90-110% recovery of a gas sample introduced as close to the probe as possible.

3-11 Source Test Report for the Coker Steam Vent
Table 3-4. EPA Method 18 Analyte Detection Limits
Met
hane
Eth
ane
Prop
ane
But
ane
Pent
ane
Hex
ane
Ben
zene
Tol
uene
Injection 1 526 521 522 522 523 233 25.6 25.6
Injection 2 522 517 518 518 518 231 25.6 25.4
Injection 3 520 516 517 517 517 230 25.5 25.3
Injection 4 522 518 519 519 519 231 25.3 25.1
Injection 5 522 518 519 518 519 231 25.7 25.8
Injection 6 523 519 519 519 519 232 25.7 25.7
Injection 7 532 528 529 529 529 236 26.1 25.9
Result (ppm)
Average 524 520 520 520 520 232 25.7 25.5
Standard Deviation (ppm) 3.97 4.10 4.10 4.15 4.18 1.94 0.246 0.282
Method Detection Limit (ppm) 12.5 12.9 12.9 13.0 13.1 6.10 0.774 0.885
The recovery study was not performed exactly as described in EPA Method 18 because this method does not specify a procedure for performing a recovery study using both a dilution sampling system and bag sampling. Elements of both Sections 8.4.1 and 8.4.2 of EPA Method 18 were followed to perform the recovery study during the Source Test. Calibration gas was introduced upstream of the dilution sampling system and subsequently collected in Tedlar bag samples for GC/FID analyses. Raw data and calibration information associated with the performance of EPA Method 18 is included in Appendices 2-4 and 3-7.
Detection limits were developed using the approach described in 40 CFR 136,
Appendix B. According to this methodology, each calibration standard is analyzed multiple times, and the method detection limit is defined as the standard deviation times the student’s T value at the 99% confidence limit. The student’s T value for 7 replicates is 3.143. This method detection limit was developed at the instrument, using direct injection of calibration gas.
3.4.1 Deviations from the Protocol Two deviations from the Protocol occurred during the sampling for methane, ethane, benzene and toluene concentrations in the vent gas, and their respective impacts on quality control/quality assurance are discussed further in Section 5.0:
• The Tedlar bag sample obtained during Run 2, sampling interval 2335-0115, was analyzed in duplicate; and
• A valid Tedlar bag sample was not obtained during the second sampling interval of Run 1 (631-701).

3-12 Source Test Report for the Coker Steam Vent
3.5 Total Volatile Organic Compound Concentration by EPA Method 25A and Other Test Method 12 The total VOC concentration in the Coker Steam Vent 3 gas stream was measured during
the Source Test as total hydrocarbons (THC) using two THC analyzers that were calibrated at different yet complementary ranges. One of these THC analyzers was operated in a dual-range mode, producing a total of three separate measurement ranges for the quantification of THC concentrations. A sample of the Coker Steam Vent 3 gas stream was extracted from Coker Steam Vent 3 using a dilution sampling probe equipped with a glass critical orifice and immediately diluted with high-purity nitrogen at a known dilution factor (approximately 30:1). The diluted sample gas passed from the dilution sampling probe to the two Thermo-Electron 51C-HT THC analyzers via a single 100-foot heated Teflon sample line. Both THC analyzers were operated in accordance with EPA Method 25A and Other Test Method 12 for as long as possible during the complete venting cycle.
An EPM Dilution Probe and CAE Exemplar Flow Panel were used as part of the dilution
sampling system. A stable dilution air pressure was maintained through all calibrations as well as the sampling period for all test runs. A critical orifice vacuum greater than 14.7” Hg (manufacturer’s specification) was also maintained through all calibrations as well as the sampling period for all test runs.
THC concentrations in the diluted sample gas were measured on a wet basis by two THC
analyzers using FIDs. An FID operates by ionizing organic compounds in the sample stream using the energy of a hydrogen/helium flame. The flame oxidizes organic compounds to generate carbon dioxide and water, and in the process, ions are formed in an electrical field between a polarized jet and collector electrode. When negative ions migrate to the collector electrode, a current is produced proportional to the concentration of carbon atoms in the sample gas. The analog voltage output reading from each THC analyzer was recorded by a data acquisition system every ten seconds.
When instantaneous THC concentrations were within the scale of a defined measurement
range (THC1, THC2, or THC4), the results were used in the calculation of the average THC concentration per sampling interval. Though not specifically required by EPA Method 25A, a conservative lower detection limit of 2% of a given actual THC measurement range was calculated by multiplying 2% X the instrument operating range X the DR. This conservative approach for determining minimum detection limits for each THC analyzer was developed exclusively for the testing of the Coker Steam Vent source. Dilution ratios, detection limits, and measurement ranges established for each THC analyzer during each test run are described in Section 3.5.4 and presented in Table 3-5.

3-13 Source Test Report for the Coker Steam Vent
Table 3-5. THC Analyzer Calibration Summary
Effective Analyzer Measurement Range
(with Dilution) Analyzer
ID
Actual Analyzer
Operating Range
(ppmw)
Dilution Ratio Lower
Detection Limit
(ppmw)
Upper Detection
Limit (ppmw)
THC1 0-100 30.25 60.5 3,025 THC2 0-1,000 30.53 611 30,535 Run 1
THC4 0-10,000 30.39 6,079 303,934
THC1 0-100 32.93 65.9 3,293 THC2 0-1,000 31.41 628 31,412 Run 2
THC4 0-10,000 32.17 6,434 321,703
THC1 0-100 32.78 65.6 3,278 THC2 0-1,000 32.36 647 32,357 Run 3
THC4 0-10,000 32.57 6,514 325,688
THC1 0-100 34.90 69.8 3,490
THC2 0-1,000 33.38 668 33,383 Run 4
THC4 0-10,000 34.14 6,828 341,403
Each measurement range (THC1, THC2, and THC4) was calibrated as a separate analyzer. The low-range THC analyzer (0-100 ppmw, THC1) was calibrated according to EPA Method 25A and the dilution system procedures described in Other Method 12. In accordance with these requirements, EPA Protocol calibration gases of propane in nitrogen were introduced to THC1 through the tip of the dilution probe (upstream of the dilution system). The mid-range THC analyzer (0-1,000 ppmw, THC2) was calibrated in an identical manner, upstream of the dilution system. However, unlike THC1, THC2 was operated in a dual-range mode and calibrated at an additional high-range (0-10,000 ppmw, THC4). THC4 was calibrated according to EPA Method 25A and calibration gases were only introduced downstream of the dilution system.
EPA Method 25A requires that a THC analyzer be calibrated using four calibration gases: • A zero gas, such as high-purity nitrogen; • A low-level calibration gas, containing propane at a concentration of 25-35% of the
span concentration (the range of the analyzer); • A mid-level calibration gas, containing propane at a concentration of 45-55% of the
span concentration (the range of the analyzer); and

3-14 Source Test Report for the Coker Steam Vent
• A high-level calibration gas, containing propane at a concentration of 80-90% of the span concentration (the range of the analyzer).
EPA Method 25A requires that initial calibration error testing be performed on a THC
analyzer within two hours of the beginning of a test run. Due to the atypical time constraints involved with the calibration of three THC analyzers using a single dilution sampling system, calibration error tests were performed on each THC analyzer within four hours of Run 1and within three hours of Runs 2-4. 3.5.1 Low-Range THC Analyzer Calibration (THC1)
The calibration error test was performed upstream of the dilution probe according to Other Test Method 12. High-, mid-, and low-range pressurized calibration gases were introduced at the dilution probe tip to establish linearity for an effective measurement span of approximately 3,000 ppmw. An average DR for the dilution sampling system using THC1 was determined following the calibration error test through the dilution system. The instrument responses for each of these gases (after dilution) met method requirements and were no more than ±5% of the respective calibration gas value divided by the average DR during all test runs. Zero gas was introduced to the THC1 analyzer upstream of the dilution probe as high-purity nitrogen. There is no analyzer response criteria for zero gas specified in EPA Method 25A.
Following the completion of a test run, a zero gas and mid-level was reintroduced to the
sampling system upstream of the dilution probe to check the calibration drift over the test period according to the procedures specified in EPA Method 25A and Other Test Method 12. The drift between the pre-run THC1 analyzer responses and the post-run analyzer responses for the mid-level calibration gas met method requirements and was ≤3% of the instrument span (with dilution) during all test runs. The drift between the pre-run analyzer responses and the post-run analyzer responses for the zero calibration gas was also ≤3% of the instrument span (with dilution) during all test runs. All supporting documentation regarding the calibration of THC1 is documented in Appendix 3-8. 3.5.2 Mid-Range THC Analyzer Calibration (THC2)
The calibration error test was performed upstream of the dilution probe according to Other Test Method 12. High-, mid-, and low-range pressurized calibration gases were introduced at the dilution probe tip to establish linearity for an effective measurement span of approximately 30,000 ppmw. An average DR for the dilution sampling system using THC2 was determined following the calibration error test through the dilution system. The instrument responses for the mid- and high-range gases (after dilution) met method requirements and were no more than ±5% of the respective calibration gas value divided by the average DR during all test runs. Zero gas was introduced to the THC2 analyzer upstream of the dilution probe as

3-15 Source Test Report for the Coker Steam Vent
high-purity nitrogen. There is no analyzer response criteria for zero gas specified in EPA Method 25A.
The instrument response for the low-range gas (after dilution) did not meet the method
requirement for calibration error during all test runs. This deviation from EPA Method 25A performance criteria occurred because the high- and mid-range gases used prior to each test run for THC2 calibration were classified as “Primary Standard,” rather than “EPA Protocol,” and were subjected to different analytical criteria during the vendor’s NIST-certification. A limited number of Primary Standards (+/- 1% accuracy) were used during the Source Test because EPA Protocol calibration gases of propane in a balance of nitrogen at concentrations >15,000 ppm were not commercially available due to the health and safety issues involved with their preparation and certification (i.e., flammability and risk of explosion). The low-range gas was certified as an “EPA Protocol” gas, however, and the use of two different types of standards during the calibration error procedure demonstrated the instrument linearity out of EPA Method 25A specifications. The calibration error responses for the low-range gas standard were between 5 and 6% of the respective calibration gas value (as opposed to the EPA Method 25A criterion of ≤5% of the calibration gas value) divided by the average DR during all test runs.
Following the completion of a test run, a zero and mid-level calibration gas was
reintroduced to the sampling system upstream of the dilution probe to check the calibration drift over the test period according to the procedures specified in EPA Method 25A and Other Test Method 12. The drift between the pre-run THC2 analyzer responses and the post-run analyzer responses for the mid-level calibration gas met method requirements and was ≤3% of the instrument span (with dilution) during Runs 2-4. The analyzer drift during Run 1 was 4.3%. This deviation from EPA Method 25A performance criteria probably occurred because of a temporary power loss to the THC2 analyzer between 758 and 843 during Run 1. The loss of power to a FID can detrimentally affect the instrument’s linearity, established during the calibration error procedure. The drift between the pre-run analyzer responses and the post-run analyzer responses for the zero calibration gas were ≤3% of the instrument span (with dilution) during all test runs. All supporting documentation regarding the calibration of THC2 is documented in Appendix 3-8. 3.5.3 High-Range THC Analyzer Calibration (THC4)
The calibration error test was performed downstream of the dilution probe according to EPA Method 25A because an acceptable THC analyzer with an operating range over 10,000 ppmw was not readily available. High-, mid-, and low-range pressurized calibration gases were introduced at a calibration valve assembly downstream of the dilution probe to establish linearity for the instrument operating range of 10,000 ppmw. The instrument responses for each of these gases (without dilution) met method requirements and were no more than ±5% of the respective

3-16 Source Test Report for the Coker Steam Vent
calibration gas value during all test runs. Zero gas was introduced to the THC4 analyzer downstream of the dilution probe as high-purity nitrogen. There is no analyzer response criteria for zero gas specified in EPA Method 25A.
Following the completion of a test run, a zero gas and mid-level was reintroduced to the
sampling system downstream of the dilution probe to check the calibration drift over the test period according to the procedures specified in EPA Method 25A. The drift between the pre-run THC4 analyzer responses and the post-run analyzer responses for the mid-level calibration gas met method requirements and was ≤3% of the instrument span (without dilution) during all test runs. The drift between the pre-run analyzer responses and the post-run analyzer responses for the zero calibration gas was also ≤3% of the instrument span (without dilution) during all test runs. All supporting documentation regarding the calibration of THC4 is documented in Appendix 3-8.
A DR for the dilution sampling system using THC4 was determined by averaging the
DRs developed during the calibration error procedure for THC1 and THC2. The use of an average DR with the THC concentration results measured with THC4 established an effective measurement span of approximately 300,000 ppmw. 3.5.4 Dilution Ratios and Method Detection Limits
DRs for the dilution sampling system were developed using data obtained during the calibration error procedures performed on both THC1 and THC2. The DR obtained with a given THC analyzer was applied as a multiplier to all of the measurements obtained with that analyzer, except for THC4, where the average of the DRs obtained using THC1 and THC2 was applied.
The three effective measurement ranges and average DRs were determined on a per run
basis. Lower detection limits were calculated for all THC analyzers by multiplying the run-specific DR by a conservative instrument sensitivity of 2% of the instrument operating ranges (0-100 ppmw, 0-1,000, and 0-10,000 ppmw, respectively). Upper detection limits were calculated for all THC analyzers by multiplying the run-specific DR by the instrument span. All three measurement ranges overlapped during each test run, and the only data substitution applied during the Source Test involved the conservative rounding up of a limited amount of measured THC concentrations to the lower detection limits calculated for THC1. When instantaneous THC concentration results were within the scale of a defined measurement range (THC1, THC2, or THC4), the results were used in the calculation of average THC concentration. Table 3-5 presents a summary of the actual and effective THC analyzer measurement ranges, DRs, and detection limits for established for each test run.

3-17 Source Test Report for the Coker Steam Vent
3.5.5 Methane and Ethane Response Factors The response factor (RF) per carbon in an FID is usually higher for methane and ethane
than propane per carbon. Since the FIDs in the two THC analyzers were calibrated with standards of propane in nitrogen, average RFs for methane (RFM) and ethane (RFE) were determined experimentally by directly introducing both a methane and ethane calibration standard (with a balance of nitrogen) to each THC analyzer (and all 3 measurement ranges) prior to sampling the Coker Steam Vent 3 gas stream. The methane and ethane RFs for each THC analyzer’s measurement range were calculated according to Equation 25Aap-1 in Other Test Method 12. Methane and ethane RFs were obtained for THC1 and THC2 by introducing the gas standards upstream of the dilution system. An ethane RF for THC1 was not obtained because the response for the ethane gas standard used during the Source Test was outside the instrument’s operating range. A methane and ethane RF for THC4 was obtained by introducing the gas standards downstream of the dilution system. Individual and average RFs for methane and ethane are presented in Table 3-6.
Table 3-6. Methane and Ethane Response Factors
Analyzer Response Response
Factor THC1 THC2 THC4 Average
RFM 1.079 1.107 1.095 1.094 Run 1
RFE - 1.050 1.034 1.042
RFM 1.090 1.097 1.082 1.089 Run 2
RFE - 1.045 1.055 1.050
RFM 1.048 1.105 1.098 1.084 Run 3
RFE - 1.057 1.051 1.054
RFM 1.061 1.107 1.111 1.093 Run 4
RFE - 1.060 1.064 1.062
3.5.6 Deviations from the Protocol
Several deviations from methodology specified in the Protocol and/or Other Test Method 12 and EPA Method 25A were encountered during the Source Test. The relative impacts of these deviations on data quality are discussed in Section 5.0. The deviations are as follows:
• The THC2 analyzer response for the low-range gas (after dilution) did not meet the
method requirement for calibration error during all test runs; and • The drift between the pre-run THC2 analyzer responses and the post-run analyzer
responses for the mid-level calibration gas did not meet method requirements during Run 1.

3-18 Source Test Report for the Coker Steam Vent
3.6 Non-Methane/Non-Ethane Volatile Organic Compound Concentration by EPA Methods 18, 25A, and Other Test Method 12 The precise and accurate quantification of methane and ethane concentrations in the
Coker Steam Vent gas stream is related to the measurement of VOC emissions because methane and ethane have been determined by EPA to have negligible atmospheric photochemical reactivity. As such, the concentrations of methane and ethane can be subtracted from the measurement of total VOCs, quantified through the use of a THC analyzer(s), prior to the development of VOC mass emission rates. VOC results determined in this matter are referred to as non-methane/non-ethane VOC emissions (NMNE VOC).
Methane (as propane) and ethane (as propane) equivalencies for use in the development
of NMNE VOC concentrations were calculated using the methane and ethane concentrations measured by GC/FID using EPA Method 18 and the appropriate average RFs. The concentration of NMNE VOCs in the Coker Steam Vent 3 gas stream during the Source Test was calculated by subtracting the propane-equivalent concentrations of methane and ethane from the average concentration of total VOCs measured with the THC analyzers during each sampling interval of the venting cycle. 3.6.1 Deviations from the Protocol
Two deviations from the Protocol occurred during the sampling for NMNE VOC concentrations in the vent gas, and their respective impacts on quality control/quality assurance are discussed further in Section 5.0.
• The Tedlar bag sample obtained during Run 2, sampling interval 2335-0115, was analyzed in duplicate.
• A valid Tedlar bag sample was not obtained during the second sampling interval of Run 1 (631-701).
3.7 Semivolatile Organic Compound Concentrations by SW-846 Method 0010
Samples for the determination of selected SVOCs in stack gas were collected during the Source Test using an isokinetic sampling train meeting the requirements of SW-846 Method 0010 with modifications addressed in the Protocol.
The SW-846 Method 0010 sampling train consisted of the following components:
• Stainless steel nozzle; • Sampling probe with stainless steel liner (the probe was also equipped with a Type-S
pitot tube); • Heated quartz fiber filter;

3-19 Source Test Report for the Coker Steam Vent
• Heated Teflon transfer line; • Glass coiled condenser; • One large glass impinger (3-liter), with knockout stem, empty; • XAD sorbent trap; • One large glass impinger (3-liter), with modified Greenburg-Smith stem, containing
200 ml D.I. H2O; • Two large glass impingers (3-liter), with knockout stems, empty; • Two standard glass impingers, with Greenburg-Smith stems, each containing 200 ml
5% zinc acetate solution; • One standard glass impinger, with modified Greenburg-Smith stem, containing 200
ml 5% zinc acetate solution; • One standard glass impinger, with knockout stem, empty (optional); • One standard glass impinger, with modified Greenburg-Smith stem, containing
approximately 300 g of silica gel desiccant; • Air-tight sample pump; • Dry gas meter; and • Orifice.
SVOC samples were prepared in the laboratory for analysis using SW-846 Method 3542.
The three analytical fractions analyzed separately in the laboratory by GC/MS were:
• Combined filter, cyclone, and probe and nozzle rinses; • Combined mid-train rinses and pre-XAD sorbent condensate catch; and • Combined XAD sorbent and post-XAD condensate catch.
3.7.1 Deviations from the Protocol
Two deviations from the Protocol occurred during the sampling for selected SVOC concentrations in the vent gas, and their respective impacts on quality control/quality assurance are discussed further in Section 5.0.
• The analytical fractions recovered during the Source Test and analyzed separately in the laboratory were different than those presented in the Protocol.
• Data points critical to the development of vent gas volumetric flow rates were not recorded every two minutes during various sampling intervals of SW-846 Method 0010 sampling train operation during all four test runs. This deviation occurred because sampling train operators were preoccupied with other sampling train quality assurance/quality control activities, such as the application of ice to maintain acceptable sampling train operating temperatures.

3-20 Source Test Report for the Coker Steam Vent
3.8 Particulate Matter Concentrations by EPA Methods 5 and 202 Samples for the determination of PM in stack gas were collected during the Source Test
using an isokinetic sampling train meeting the requirements of EPA Methods 5 and 202 with modifications addressed in the Protocol.
The EPA Method 5/202 sampling train consisted of the following components:
• Stainless steel nozzle; • Sampling probe with stainless steel liner (the probe was also equipped with a Type-S
pitot tube); • Heated quartz fiber filter; • Teflon transfer line; • Glass coiled condenser; • One large glass impinger (3-liter), with knockout stem, empty; • One large glass impinger (3-liter), with modified Greenburg-Smith stem, containing
200 ml D.I. H2O; • Two large glass impingers (3-liter), with knockout stems or modified Greenburg-
Smith stems, empty; • Two standard glass impingers, with Greenburg-Smith stems, each containing 200 ml
5% zinc acetate solution; • One standard glass impinger, with modified Greenburg-Smith stem, containing 200
ml 5% zinc acetate solution; • One standard glass impinger, with knockout stem, empty (optional); • One standard glass impinger, with modified Greenburg-Smith stem, containing
approximately 300 g of silica gel desiccant; • Air-tight sample pump; • Dry gas meter; and • Orifice.
After the completion of each test run, the impinger contents of the sampling trains were
immediately purged with nitrogen according the EPA Method 202. Following the purge, the PM samples from each of the EPA Method 5/202 sampling trains utilized during the venting cycle were recovered separately into the following components:
• Front-half (nozzle, probe liner, cyclone with knockout flask, and front-half filter holder) rinse with acetone;
• Quartz-fiber filter;

3-21 Source Test Report for the Coker Steam Vent
• Contents of the first two impingers, including a water rinse of the impingers, the back-half of filter holder, the Teflon transfer line, and the coiled condenser; and
• A methylene chloride rinse of the first two impingers, the back-half of the filter holder, the Teflon transfer line, and the coiled condensers.
Front-half PM determinations were performed according to EPA Method 5. After submittal to the laboratory, the filter and the front-half sampling train rinse fractions were dried to constant weight. The weight gains from the filter and front-half rinse fractions were related to the dry gas volume collected and are reported as front-half particulate loading. The amount of condensible material found in the impingers was determined according to EPA Method 202. According to EPA Method 202, the impinger solutions were extracted with methylene chloride, and the methylene chloride extract was combined with the methylene chloride rinse in the field. Both fractions (water and methylene chloride) were reduced to dryness, and the weight gain determined. These masses were related to the dry gas volume sampled and were reported as “back-half” particulate loading. A total PM (front-half plus back-half) concentration was quantified for each EPA Method 5/202 sampling train performed during a given venting cycle. 3.8.1 Deviations from the Protocol
Two deviations from the Protocol occurred during the sampling for PM concentrations in the vent gas, and the impact on quality control/quality assurance are discussed further in Section 5.0:
• Data points critical to the development of vent gas volumetric flow rates were not recorded every two minutes during various sampling intervals of EPA Method 5/202 sampling train operation during all four test runs. This deviation occurred because sampling train operators were preoccupied with other sampling train quality assurance/quality control activities, such as the application of ice to maintain acceptable sampling train operating temperatures.
• Sampling train “3”, performed during Run 2, measured a moisture concentration of 97.8% and was operated at an isokinetic sampling rate of 158%. The Protocol specifies that the isokinetic sampling acceptance criterion for the Source Test program is 50-150% if the measured moisture is <98%.


4-1 Source Test Report for the Coker Steam Vent
4.0 Calculations This section presents calculations used in the determination of speciated VOC, NMNE VOC, SVOC, and PM concentrations in the Coker Steam Vent 3 gas stream during the Pre-Survey and Source Test. This section also presents calculations used in the determination of vent gas volumetric flow rates and benzene, toluene, NMNE VOC, SVOC, and PM mass emission rates during the Source Test. The calculation of pollutant mass emission rates in a measurement unit of lbs/cycle rather than the typical lbs/hour is an approach developed specifically for this project and the Coker Steam Vent 3 source. Each complete venting cycle that was sampled was separated into four distinct time intervals (see Section 2.2) for the calculation of pollutant mass emission rates to most accurately characterize the emissions from the batch process of the Coker. Pollutant mass emission rates from the last venting cycle interval during each test run were extrapolated using a project-specific data reduction strategy. Example calculations are presented in Appendix 4-1.
A database consisting of the instantaneous volumetric flow rates and moisture concentrations measured by every sampling train operated during a given venting cycle was used to develop average velocity and associated volumetric flow rates (in dscfm) for a given venting cycle interval. This approach was used to achieve the highest level of consistency in the development of pollutant mass emission rates, as well as to incorporate the averaging of data as often as possible.
4.1 Vent Gas Dry Molecular Weight The average molecular weight of the dry gas fraction of the vent gas exiting Coker Steam Vent 3 was calculated per test run according to the following equation, based upon EPA Equation 3-1:
)N(%28.0)CH(%16.0)HC(%30.0)O(%32.0)CO(%44.0M 246222d ++++= Where: Md = Dry gas molecular weight, lb/lb-mol; %CO2 = Average percent carbon dioxide by volume, dry basis, per test run; %O2 = Average percent oxygen by volume, dry basis, per test run; %C2H6 = Average percent ethane by volume, dry basis, per test run; %CH4 = Average percent methane by volume, dry basis, per test run; %N2 = Average percent nitrogen by volume, dry basis, per test run; 0.44 = Molecular weight of carbon dioxide, divided by 100, lb/lb-mol; 0.32 = Molecular weight of oxygen, divided by 100, lb/lb-mol; 0.30 = Molecular weight of ethane, divided by 100, lb/lb-mol; 0.16 = Molecular weight of methane, divided by 100, lb/lb-mol; and 0.28 = Molecular weight of nitrogen (balance), divided by 100, lb/lb-mol.

4-2 Source Test Report for the Coker Steam Vent
4.2 Vent Gas Velocity The velocity of the vent gas exiting Coker Steam Vent 3 was calculated according to
EPA Equation 2-7. Instantaneous vent gas velocity was calculated nominally every two minutes during the venting cycle as:
))(M(P)(T
C85.49VWS
SPS PΔ=
Where: VS = Instantaneous velocity of the vent gas (ft/sec); ΔP = Instantaneous differential pressure measured by Type S pitot (inches H2O); Ts = Instantaneous vent gas temperature (°R); Ps = Absolute vent pressure, per interval (inches Hg); Mw = Wet gas molecular weight, per venting cycle (lb/lb-mole); Cp = Type-S pitot correction factor (0.84); and 85.49 = Conversion constant, per Equation 2-7 of EPA Method 2. Average vent gas velocity was calculated from data measured by a single EPA Method 5/202 or SW-846 Method 0010 sampling train to determine that train’s specific isokinetic sampling rate according to EPA Equation 5-8. 4.3 Vent Gas Volumetric Flow Rate - Standard Conditions The volumetric flow rate of the Coker Steam Vent 3 gas, corrected to standard conditions, was calculated according to procedures based upon EPA Method 2. Instantaneous vent gas volumetric flow rate was calculated nominally every two minutes during the venting cycle as:
⎟⎠
⎞⎜⎝
⎛⎟⎟⎠
⎞⎜⎜⎝
⎛××=
29.92P
T528A) V (60Q S
Sss
Where: Qs = Instantaneous volumetric flow rate, corrected to standard conditions (scfm); Vs = Instantaneous velocity of the vent gas (ft/sec); A = Cross-sectional area of the vent (ft2); 60 = Conversion from second to minutes; 528 = Standard temperature (°R); Ts = Instantaneous vent gas temperature (°R); 29.92 = Standard pressure (inches Hg); and Ps = Instantaneous absolute vent pressure (inches Hg).

4-3 Source Test Report for the Coker Steam Vent
4.4 Vent Gas Volumetric Flow Rate - Dry Standard Conditions The average volumetric flow rate of the Coker Steam Vent 3 gas, corrected to dry standard conditions, was calculated according to procedures based upon EPA Method 2. The average venting cycle moisture concentration, developed from moisture concentrations quantified by each individual sampling train operated during a given venting cycle, and the average volumetric flow rate (corrected to standard conditions) were used to calculate average dry vent gas volumetric flow rates (dscfm) for each venting cycle interval as:
)(Q)B(1Q sWsd −= Where:
Qsd = Average dry volumetric flow rate at standard conditions, per venting cycle interval (dscfm);
Qs = Average actual volumetric flow rate, per venting cycle interval (acfm); and Bw = Average moisture fraction of vent gas, per complete venting cycle.
4.5 Standard Dry Gas Meter Sample Volume The dry gas meter volume at standard conditions was calculated as:
⎟⎟⎟⎟⎟
⎠
⎞
⎜⎜⎜⎜⎜
⎝
⎛⎟⎠
⎞⎜⎝
⎛+
⎟⎟⎠
⎞⎜⎜⎝
⎛=
29.9213.6P
BP
T528)(VV
m
macsd
Where:
Vsd = Dry gas meter volume at standard conditions (dscf); Vac = Actual dry gas meter volume (dcf); 13.6 = Conversion from inches H2O to inches Hg (inches H2O/inches Hg); 528 = Standard temperature (°R); Tm = Average dry gas meter temperature (°R); 29.92 = Standard pressure (inches Hg); Pm = Dry gas meter pressure (inches H2O); and BP = Barometric pressure at the dry gas meter location (inches Hg).
As previously explained, the amount of dry gas that passed through the EPA Method 2/4,
EPA Method 5/202, and SW-846 Method 0010 sampling trains to the dry gas meters were very small, and average dry gas sampling rates were on the order of 0.5 to 2 liters per minute.

4-4 Source Test Report for the Coker Steam Vent
Because of the relatively small dry gas sample volumes acquired, the leak rates exceeded 4% of the average sampling rate for most of the sampling trains performed during the Pre-Survey and Source Test, and corrections to the dry gas volume were made according to EPA Equation 5-1(a), Case I:
]T)LL[(VV' apacac ×−−=
Where:
V′ac = Actual dry gas meter sample volume, corrected (dcf); Vac = Actual dry gas meter sample volume, uncorrected (dcf); Lp = Leakage rate observed during the post-test leak check (cfm); La = 4% of the average sampling rate (cfm); and T = Operating duration of sampling train (min). The volume of dry gas sampled with the EPA Method 5/TO-14 sampling train used
during the Pre-Survey was also corrected by adding the volume of dry gas collected in the evacuated Summa canisters to the volume of dry gas recorded with the dry gas meter. For each canister, the sample volume collected was calculated by multiplying the known volume of the canister (1 liter) by the vacuum of the sample in the canister according to the equation:
itit
finalinitcanac Vac
VacVacVolVol
−×=
Where:
Volac = Actual canister sample volume (liters); Volcan = Volume of canister (liters); Vacinit = Initial vacuum of canister, before sampling (inches Hg); and Vacfinal = Final vacuum of canister, after sampling (inches Hg).
The actual canister sample volume (liters) was corrected to standard temperature conditions by using the average temperature recorded during the sampling interval with a thermocouple placed near the Teflon valve assembly in the EPA Method 5/TO-14 sampling train. 4.6 Concentration of Non-Methane/Non-Ethane Volatile Organic Compounds in
the Vent Gas (Per Venting Cycle Interval) The concentration of THC (as propane) in the Coker Steam Vent 3 gas was continuously measured throughout the venting cycle in units of parts per million volume, on a wet basis

4-5 Source Test Report for the Coker Steam Vent
(ppmvw). The NMNE VOC concentration was calculated by subtracting the concentrations of methane and ethane (as determined by EPA Method 18) from the concentration of THC (as determined by EPA Method 25A). The average concentration of NMNE VOC was calculated during each of the four venting cycle intervals as:
[ ] [ ] [ ]3
RFC23
RFCC]C[ EEMM
THCVOC×
−×
−=
Where: [C]VOC = Average concentration of NMNE VOC, as propane, per venting cycle
interval (ppmw); [C]THC = Average concentration of THC measured, per venting cycle interval
(ppmw); [C]M = Concentration of methane, per venting cycle interval (ppmw); RFM = Average FID response factor for methane, determined directly from
THC1, THC2, and THC4 (unit-less); [C]E = Concentration of ethane, per venting cycle interval (ppmw); and RFE = Average FID response factor for ethane, determined directly from THC2
and THC4 (unit-less).
All average NMNE VOC concentrations calculated per venting cycle interval were corrected to a dry basis (ppmd) using the average of the moisture concentrations quantified by each individual sampling train operated during a given venting cycle. Conversion of NMNE VOC concentration results from ppmd to grams per dry standard cubic foot were calculated using this equation:
( )( ) ( )
( )( )385 10453.59 44.1 [C]
]C[ 6VOC
dscf/g =
Where: [C]g/dscf = Concentration of NMNE VOCs as propane, per venting cycle interval
(g/dscf); [C]VOC = Concentration of NMNE VOCs as propane, per venting cycle interval
(ppmd, expressed as scf/106 scf for the purposes of this calculation); 44.1 = Molecular weight of propane (lb/lb-mol); 453.59 = Conversion from pounds to grams (g/lb); 106 = Conversion from ppmd to scf/scf (unit-less); and 385 = Ideal gas law constant (scf/lb-mol).

4-6 Source Test Report for the Coker Steam Vent
The measured concentrations of benzene and toluene were also converted from ppmd to g/dscf using the equation presented above and the appropriate molecular weight. 4.7 Concentration of Particulate Matter and Selected Semivolatile Organic
Compounds in the Vent Gas (Per Venting Cycle Interval) The concentration of PM or selected SVOCs were calculated for each EPA Method 5/202 or SW-846 Method 0010 sampling train conducted during the complete venting cycle as:
sddscf/g V
M[C] =
Where: [C]g/dscf = Concentration of PM or selected SVOCs, per venting cycle interval
(g/dscf); M = Mass of PM collected in the EPA Method 5/202 sampling train (g) or
mass of selected SVOC collected in the SW-846 Method 0010 sampling train (g); and
Vsd = Dry gas meter volume collected with the EPA Method 5/202 or SW-846 Method 0010 sampling train, at standard conditions (dscf).
4.8 Mass Emission Rate of Pollutant (Per Venting Cycle Interval)
The mass emissions rate for benzene, toluene, NMNE VOCs, selected SVOCs, and PM, in lbs/min, were calculated during four venting cycle intervals of each test run as:
Where: MERi = Mass emission rate of pollutant, per venting cycle interval (lbs/min); [C] g/dscf = Concentration of pollutant, per venting cycle interval (g/dscf); 453.59 = Conversion from grams to pounds (g/lb); and Qsd = Average dry volumetric flow rate at standard conditions (dscfm), per
venting cycle interval.
⎟⎠
⎞⎜⎝
⎛=453.59
Q]C[MER sd
dscf/gi
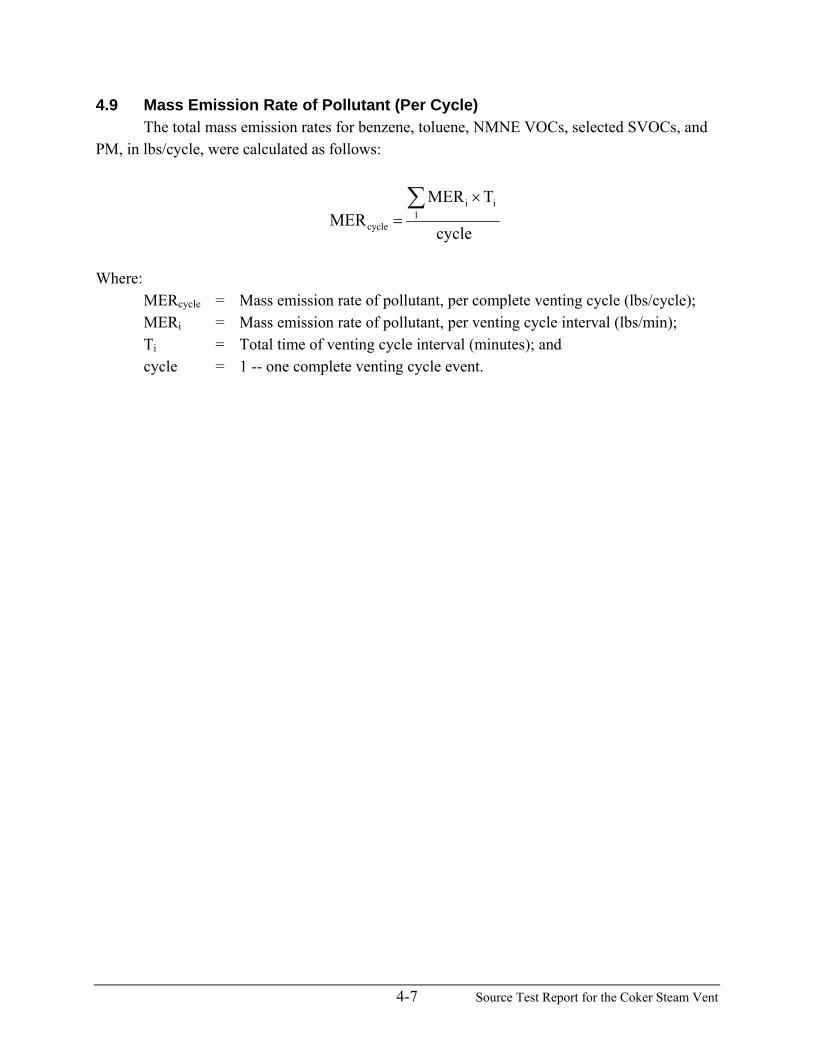
4-7 Source Test Report for the Coker Steam Vent
4.9 Mass Emission Rate of Pollutant (Per Cycle) The total mass emission rates for benzene, toluene, NMNE VOCs, selected SVOCs, and PM, in lbs/cycle, were calculated as follows:
Where: MERcycle = Mass emission rate of pollutant, per complete venting cycle (lbs/cycle); MERi = Mass emission rate of pollutant, per venting cycle interval (lbs/min); Ti = Total time of venting cycle interval (minutes); and cycle = 1 -- one complete venting cycle event.
cycle
TMERMER 1
ii
cycle
∑ ×=


5-1 Source Test Report for the Coker Steam Vent
5.0 Quality Assurance Objectives for Measurement Data The Pre-Survey and Source Test programs conducted on HOVENSA’s Coker Steam
Vent 3 are part of ongoing research of the potential emissions associated with delayed coker depressurization vent sources, which is currently being performed at similar, select sources around the United States. Quality assurance/quality control (QA/QC) activities were performed as an integral part of these sampling and analysis measurement programs to ensure that results are of known quality. The emissions tests were conducted in accordance with the Protocol conditionally approved by EPA. Any deviations from the Protocol were previously presented in Section 3.0 and summarized in Tables 1-12 through 1-16. The potential impact of these deviations on the test results is discussed in this section.
The results of the QA/QC activities demonstrate that the quality of the Coker
Steam Vent 3 project measurement data is well documented and that the data are reliable, defensible, and meet project objectives.
The primary objectives of the QA/QC effort were to control, assess, and document data quality. To accomplish these objectives, the QA/QC approach consisted of the following key elements:
• Definition of data quality objectives that reflect the overall technical objectives of the measurement program;
• Design of a sampling, analytical, QA/QC and data analysis system to meet those objectives;
• Evaluation of the performance of the measurement system; and • Initiation of corrective action when measurement system performance does not meet
the specifications. The QA procedures described in the Protocol include the use of sampling and analytical procedures, along with specified calibration requirements, QC checks, data reduction and validation procedures, and sample tracking. A review of analytical results for QA/QC samples and assessment of overall data quality is presented in this section. Detailed QC information is presented in Appendices 5-1 through 5-7 of this report. Sample Chain-of-Custody forms are included in Appendix 5-8.
The following subsections present discussions of the QA/QC activities associated with
each of the following project tasks:

5-2 Source Test Report for the Coker Steam Vent
• Collection and analysis of vent gas samples for speciated VOC concentrations (Pre-Survey);
• Collection and analysis of vent gas samples for methane, ethane, benzene, and toluene concentrations;
• Collection and analysis of vent gas samples for THC concentration; • Collection of vent gas samples for EPA Method 2/4, EPA Method 5/202, and SW-
846 analyses; • Analysis of vent gas samples for selected SVOC concentrations; and • Analysis of vent gas samples for PM concentrations.
Several minor issues associated with sampling and analysis are identified and discussed
below. Due to the difficulty associated with sampling this type of atypical source, the non-traditional use and application of the sampling methodology and equipment, and the “unknowns” of any given research project, these issues were not entirely unexpected. Nevertheless, the overall conclusion of the data quality assessment is that the results of the Pre-Survey and Source Test are valid, and are appropriate for their intended use. 5.1 Expected Deviations from the Protocol
Some deviations from the Protocol were expected prior to the performance of the Source Test and were previously conveyed to EPA in HOVENSA’s Pre-Survey results letter dated May 5, 2008. These deviations, reproduced below, are not discussed in detail in this report.
• Section 2.3 of the Protocol mistakenly represents that the venting cycle on a given coke drum occurs nominally every 20 hours. The typical frequency of a venting cycle on a given coke drum is 40 hours.
• Section 3.0 of the Protocol specifies that EPA Method 5/202 and SW-846 Method 0010 sampling trains would begin at approximately the 1st, 15th, and 30th minute of the venting cycle and that a 4th set of sampling trains would be utilized if time permits. After verifying that the actual duration of a typical venting cycle is in excess of an hour, HOVENSA proposed to collect two 15-minute samples, followed by a 30-minute sample, followed by a 4th sample to be collected throughout as much of the venting cycle as possible with the EPA Method 5/202 and SW-846 Method 0010 sampling trains (for at total sampling time of at least one hour). During the Source Test, URS typically collected two 30-minute samples followed by a 3rd sample collected throughout as much of the remainder of the venting cycle as possible (for a total sampling time of approximately two hours). Through the Pre-Survey and Practice Run testing efforts, URS determined that a minimum duration of 30 minutes was required to collect an acceptable dry gas sample volume from the Coker Steam Vent 3 with the EPA Method 5/202 and SW-846 Method 0010 sampling trains. URS and HOVENSA anticipated that these modifications to the sampling strategy would occur as part of an ongoing research effort and communicated to EPA

5-3 Source Test Report for the Coker Steam Vent
that all sampling train durations were nominal and subject to adjustment on a run-by-run basis.
• Hourly calibration drift determinations were not performed according to EPA Method 25A. Instead, URS performed THC analyzer calibration drift determinations before and after each test run to acquire the most “complete” set of VOC emissions data. This deviation had a minimal impact on overall data quality associated with the measurement of THC concentrations, as described in Section 5.4.
• Glass impingers containing solutions of 5% zinc acetate were used with the EPA Method 2/4, EPA Method 5/202, and SW-846 Method 0010 sampling trains to protect sensitive sampling equipment as well as URS testing personnel from any pollutants exhausting out of the dry gas meters.
5.1.2 Isokinetic Sampling Criteria
Section 3.1.3 of the Protocol describes the difficulty involved in achieving 90-110% isokinetic sampling rates on the Coker Steam Vent source and prescribes an isokinetic sampling acceptance criterion for the Source Test of 50-150% if the measured moisture is <98%, and abandons a specific criterion if the measured moisture is ≥98%. In addition, the Protocol specifies that an isokinetic sampling percentage outside the 50-150% range will not invalidate a test run.
Isokinetic sampling train operating parameters such as the sampling nozzle orifice size
were determined during preliminary project activities to achieve isokinetic sampling percentages as close to 100% as possible during the Source Test. Out of a total of 24 isokinetic EPA Method 5/202 and SW-846 Method 0010 sampling trains performed during Source Test, only EPA Method 5/202 sampling train “3”, performed during Run 2, failed the isokinetic sampling criteria presented in the Protocol (see Section 5.5).
It is important to note that the isokinetic sampling percentages achieved with the first
EPA Method 5/202 sampling trains performed at the beginning of Runs 1-4, and operated for approximately 30 minutes, were 92.1, 94.9, 114, and 100%, respectively (see Table 2-50). In addition, the isokinetic sampling percentages achieved with the first SW-846 Method 0010 sampling trains performed at the beginning of Runs 1-4, also operated for approximately 30 minutes, were 93.3, 83.1, 98.0, and 97.1, respectively (see Table 2-17).
It is difficult to estimate the degree of bias associated with the measurement of PM and
selected SVOC concentrations when achieving isokinetic sampling rates outside the traditional criteria of 90-110%, or the project-specific criteria described above, without conducting further research and testing on high-moisture, high-velocity Coker Steam Vent sources. Generally, isokinetic sampling rates >100% have been demonstrated to bias pollutant concentration results low because the gas velocity at the sampling train nozzle orifice exceeds the velocity of the vent gas stream and a greater than representative number of small particles, aerosols, or droplets, which follow the gas flow pattern into the nozzle orifice, are collected in the sampling train.

5-4 Source Test Report for the Coker Steam Vent
5.2 Collection and Analysis of Vent Gas Samples for Speciated Volatile Organic Compound Concentrations (Pre-Survey) QA/QC activities associated with the collection of vent gas samples using modified EPA
Method 5/TO-14 sampling trains include:
• Use of pre-printed sampling data sheets; • Use of calibrated sampling equipment; • Collection of samples at appropriate operating conditions; • Collection of acceptable sample volumes; • Performance of sampling system leak checks; and • Collection of samples per the Protocol and applicable EPA methods.
QA/QC activities associated with the analysis of vent gas samples for speciated VOC
concentrations include:
• Use of pre-printed recovery data sheets; • Calibration of the analytical instrumentation; • Use of documented calibration standards; • Sample handling and preservation; • Preparation and analysis of samples within specified holding times; • Preparation and analysis of laboratory blanks; • Collection and analysis of field blanks; • Preparation and analysis of media check samples; • Preparation and analysis of laboratory control samples (LCS) and laboratory control
sample duplicates (LCSD); • Addition of surrogate spikes to every sample; and • Analyses of samples per the Protocol and applicable EPA methods. A review of the data quality associated with these measurements indicates that these data
are supportable and usable for the purpose intended. Refer to the detailed quality assessments in Appendices 5-1 and 5-2. The issues identified during the data quality review are detailed below.
• For the canister analyses, several compounds were observed in the field blank at levels above the detection limit: These included n-dodecane, ethylbenzene, n-heptane, n-hexane, methanol, methylene chloride, naphthalene, nonane, n-octane, pentane, n-propylbenzene, toluene, 1,2,4-trimethylbenzene, 1,3,5-trimethylbenzene, n-undecane, o-xylene, m xylene and p-xylene. The field blank results and range of field sample results are presented in Table 5-1 for only the compounds which were

5-5 Source Test Report for the Coker Steam Vent
detected in the field blank. The field blank results are negligible compared to the field samples and have no impact on the interpretation of the Pre-Survey VOC emissions data for the use intended.
• For the condensate analyses, several compounds were observed in the field blank above the detection limit. These included acetone, 2-butanone, and methylene chloride. The laboratory blank had detected amounts of methylene chloride. All other results for the field and laboratory blanks were below or near the detection limit. The field blank results and range of field sample results are presented in Table 5-2 for only the compounds which were detected in the field blank. The field blank results for acetone and methylene chloride were well below the amounts found in the field samples and have no impact on the results. The field blank result for 2-butanone is below the amount in the field sample and may indicate a positive bias.
• Methanol rinses were not performed on the connecting glassware between the large glass condenser and the filter media according to the Protocol. The vast majority of condensate was collected in the first two impingers used in the modified EPA Method 5/TO-14 sampling train, and the moisture concentrations measured during the Pre-Survey are comparable to those measured during the Source Test. Upon visual inspection of the Teflon transfer line and back-half of the filter holder during each test run, URS operators did not observe evidence of significant moisture condensation inside these sampling train components. Based upon the range of boiling points of the target analytes, the operating temperature of the sampling train components, and the temperature of the vent gas, the amount of material potentially caught in the back-half of the filter holder and the Teflon transfer line is negligible compared with the masses found in the condensate and Summa canister sample fractions.
• Two sample fractions recovered from each modified EPA Method 5/TO-14 sampling train – the “condensate catch” and the “methanol rinse” – were not analyzed separately according to the Protocol; they were combined for single analysis in the laboratory. However, the collection of data related to the deposition of various VOCs within specific fractions of the modified sampling train was not a primary objective of the Pre-Survey, and the combination of these analytical fractions provides acceptable and meaningful data for the composition of the vent gas stream.
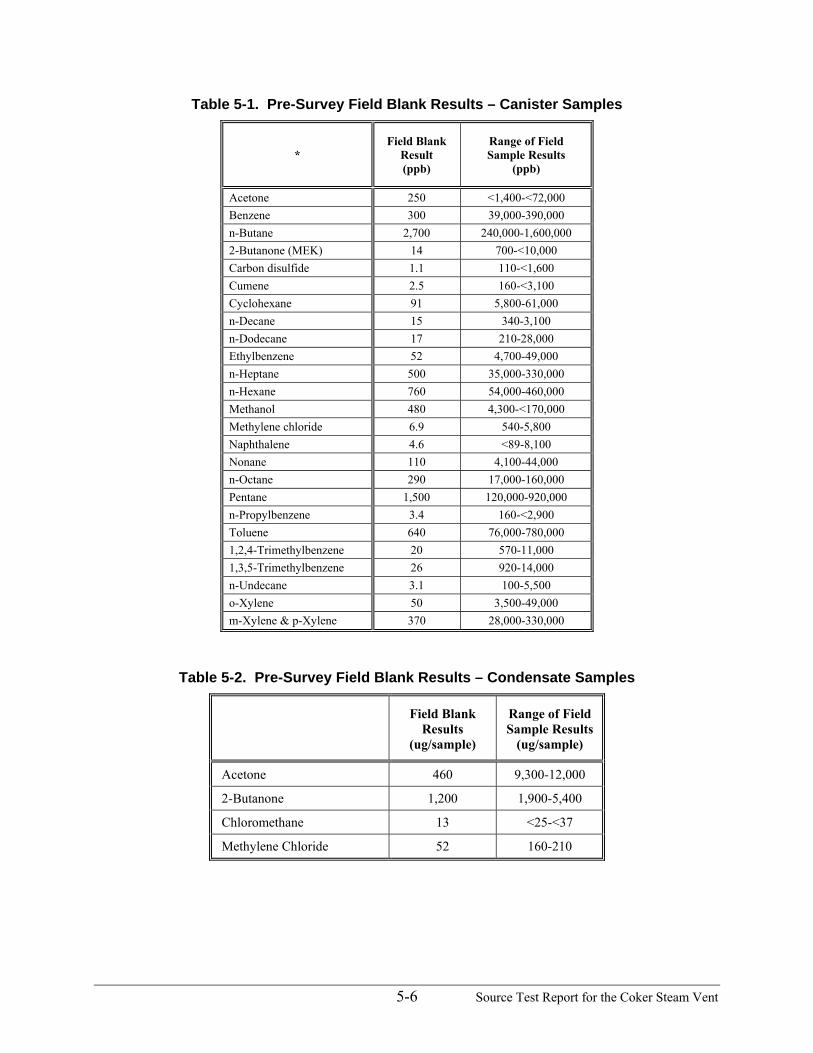
5-6 Source Test Report for the Coker Steam Vent
Table 5-1. Pre-Survey Field Blank Results – Canister Samples
* Field Blank
Result (ppb)
Range of Field Sample Results
(ppb)
Acetone 250 <1,400-<72,000 Benzene 300 39,000-390,000 n-Butane 2,700 240,000-1,600,000 2-Butanone (MEK) 14 700-<10,000 Carbon disulfide 1.1 110-<1,600 Cumene 2.5 160-<3,100 Cyclohexane 91 5,800-61,000 n-Decane 15 340-3,100 n-Dodecane 17 210-28,000 Ethylbenzene 52 4,700-49,000 n-Heptane 500 35,000-330,000 n-Hexane 760 54,000-460,000 Methanol 480 4,300-<170,000 Methylene chloride 6.9 540-5,800 Naphthalene 4.6 <89-8,100 Nonane 110 4,100-44,000 n-Octane 290 17,000-160,000 Pentane 1,500 120,000-920,000 n-Propylbenzene 3.4 160-<2,900 Toluene 640 76,000-780,000 1,2,4-Trimethylbenzene 20 570-11,000 1,3,5-Trimethylbenzene 26 920-14,000 n-Undecane 3.1 100-5,500 o-Xylene 50 3,500-49,000 m-Xylene & p-Xylene 370 28,000-330,000
Table 5-2. Pre-Survey Field Blank Results – Condensate Samples
Field Blank
Results (ug/sample)
Range of Field Sample Results
(ug/sample)
Acetone 460 9,300-12,000
2-Butanone 1,200 1,900-5,400
Chloromethane 13 <25-<37
Methylene Chloride 52 160-210

5-7 Source Test Report for the Coker Steam Vent
5.3 Collection and Analysis of Vent Gas Samples for Methane, Ethane, Benzene, and Toluene Concentrations QA/QC activities associated with the collection of the vent gas samples using the EPA
Method 18/25A/OTM12 sampling system include:
• Use of calibrated sampling equipment; • Use of calibration and dilution gas of appropriate and documented quality; • Collection of samples at appropriate operating conditions; • Proper operation of the dilution sampling system; • Performance of sampling system leak checks; and • Collection of samples per the Protocol and applicable EPA methods.
QA/QC activities associated with the analysis of vent gas samples for methane, ethane,
benzene, and toluene concentrations include: • Calibration of the analytical instrumentation; • Use of documented calibration standards; • Replicate analyses; and • Analyses of samples per the Protocol and applicable EPA methods. A review of the data quality associated with these measurements indicates that these data
are supportable and usable for the purpose intended for all test runs. Refer to the detailed quality assessment in Appendix 5-3. The issues identified during the data quality review are detailed below.
• The Tedlar bag sample obtained during Run 2, sampling interval 2335-0115, was
analyzed in duplicate instead of triplicate. These results are consistent with the results for all other samples, and the relative standard deviations (RSD) (indicating precision) for the duplicate sample analyses are acceptable (2.23 and 2.67 for methane and ethane, respectively). Benzene and toluene were not detected over the method detection limits for either analysis of this sample. This deviation has no impact on the usability of this data.
• A valid Tedlar bag sample was not obtained during the second sampling interval of Run 1 (631-701). The average of the concentration results for methane, ethane, benzene, and toluene measured during the first and third sampling intervals of Run 1 were applied to the second sampling interval for use in further calculations of average dry vent gas molecular weight, benzene and toluene mass emission rates, and NMNE mass emission rates. The results for Run 1 are consistent with the results from Runs 2, 3, and 4, and the results for the first and third Tedlar bag sample represent data before and after the missing data point. This data-substitution approach using averages provides a reasonable estimate of the concentration for the missing data.

5-8 Source Test Report for the Coker Steam Vent
5.4 Collection and Analysis of Vent Gas Samples for Total Hydrocarbon Concentration QA/QC activities associated with the collection of vent gas samples using the EPA
Method 18/25A/OTM12 sampling system include:
• Use of pre-printed data sheets; • Use of dilution gas of appropriate and documented quality; • Collection of samples at appropriate operating conditions; • Proper operation of the dilution sampling system; • Collection of samples per the Protocol and applicable EPA methods. QA/QC activities associated with the analysis of vent gas samples for THC concentration
include: • Use of calibrated sampling equipment; • Performance of calibration error checks; • Performance of drift checks; • Use of documented calibration standards; and • Analyses of samples per the Protocol and applicable EPA methods A review of the data quality associated with these measurements indicates that these data
are supportable and usable for the purpose intended for all test runs. The use of the detection limit strategy developed exclusively for this project also provides a conservative estimate of total VOC concentrations in the vent gas. Refer to the detailed quality assessment in Appendix 5-4. The issues identified during the data quality review are detailed below.
• The THC2 analyzer response for the low-range calibration gas standard (after
dilution) did not meet the EPA Method 25A performance requirement for calibration error during all test runs. The systematic recovery of the one calibration standard on THC2 may be associated with an inconsistency in the preparation of gas standards. Since the response was greater than the quoted value for the calibration gas, the error indicates a potential positive bias in the field results, which is conservative, relative to estimating emissions. Since the calibration error was consistently 5-6%, the magnitude for this bias is no greater than 5-6%, which is insignificant.
• The drift between the pre-run THC2 analyzer responses and the post-run analyzer responses for the mid-level calibration gas did not meet method performance requirements during Run 1. This deviation occurred because power was lost to the THC2 analyzer between 758 and 843. Power losses may have a detrimental effect on FID-based analyzers, because instrument temperatures may drop below operating specifications and the internal flame must be “re-lit.” As a consequence, the

5-9 Source Test Report for the Coker Steam Vent
established calibration curve may shift. In this case, the calibration drift was outside method specifications. However, the calibration drift was -4.3%, indicating that any bias would be no greater than 4.3% low. This amount of bias is insignificant.
5.5 Collection of Vent Gas Samples for EPA Method 2/4, EPA Method 5/202,
and SW-846 Method 0010 Analyses QA/QC activities associated with the collection of vent gas samples using modified EPA
Method 2/4, EPA Method 5/202, and SW-846 Method 0010 sampling trains include:
• Use of pre-printed sampling data sheets; • Use of calibrated sampling equipment; • Collection of samples at appropriate operating conditions; • Collection of acceptable sample volumes; • Performance of sampling system leak checks; and • Collection of samples per the Protocol and applicable EPA methods.
QA/QC activities associated with the analysis of vent gas samples for moisture
concentration, velocity, temperature, differential pressure, and static pressure include:
• Use of pre-printed recovery data sheets; • Calibration of the analytical instrumentation; • Use of documented calibration standards; and • Analyses of samples per the Protocol and applicable EPA methods. A review of the data quality associated with these measurements indicates that these data
are supportable and usable for the purpose intended. Refer to the detailed quality assessment in Appendix 5-5. The issues identified during the data quality review are detailed below.
• The measured XAD sorbent inlet temperature exceeded 68°F during most of the
operation of the SW-846 Method 0010 sampling trains. These operating temperatures are attributed to the very slow rate of dry gas passing through the sampling train. As the condenser exit temperature (upstream of the inlet of the XAD sorbent) met the method performance specification, this is considered to be a project-specific measurement anomaly.
• The measured final impinger exit temperature exceeded 68°F during most of the
operation of the EPA Method 2/4, EPA Method 5/202, and SW-846 Method 0010 sampling trains. These temperatures are attributed to the very slow rate of dry gas passing through the sampling train, which the applicable test methods are not designed to address. Every effort was made to keep the sampling trains fully

5-10 Source Test Report for the Coker Steam Vent
immersed in an ice bath continuously and throughout each test run, rendering these final impinger exit temperatures unavoidable. As the condenser exit temperature (upstream of the final impinger exit) met the method performance specification, this is considered to be a project-specific measurement anomaly.
• The XAD sorbent and final impinger exit temperature deviations above the specifications may indicate that the target analytes condensed or were otherwise deposited in fractions of the sampling train where they are not usually collected. However, since the applicable sampling train components were recovered in their entirety, the overall results are unaffected. The interpretation of results for separate fractions may require additional scrutiny.
• The redundant EPA Method 2/4 sampling train conducted during Run 1 was not inserted completely into the Coker Steam Vent 3 pipe until approximately 40 minutes after venting cycle activation, therefore moisture and volumetric flow rate data obtained with this sampling train was not used in any calculations. Redundant volumetric flow rate data was already obtained with the use of both the EPA Method 5/202 and SW-846 Method 0010 sampling trains. As volumetric flow rate data was collected for the whole program and shown to have consistency, the loss of one piece of redundant data does not impact the usability of the results.
• Data points critical to the development of vent gas volumetric flow rates were not recorded every two minutes during various sampling intervals of EPA Method 2/4, EPA Method 5/202, and SW-846 Method 0010 sampling train operation during all four test runs. This deviation occurred because sampling train operators were preoccupied with other sampling train quality assurance/quality control activities, such as the application of ice to maintain acceptable sampling train operating temperatures. However, upon review of the proportion of valid 2-minute data points recorded per sampling train, any unrecorded data points represented only a loss in redundancy for the database and not in the overall data itself, and the impact on the data quality associated with the overall volumetric flow rate results is negligible. The proportion of valid 2-minute data points per sampling train per test run is presented in Table 5-3. The loss of an occasional data point for sampling parameters not critical to the development of instantaneous volumetric flow rate, such as sampling system operating temperatures and vacuum, is also negligible. In these cases, any data used in further calculations is interpreted from nearby sampling points.
• The SW-846 Method 0010 sampling train “C” operated during Run 1 failed its final leak check and was not recovered for analysis. However, the measurements for vent gas velocity made with this sampling train are used in further calculations. The failed final leak check rendered the sample unusable, but the measurements made during the test run; temperature, differential pressure, etc. are valid.
• EPA Method 5/202 sampling train “3”, performed during for Run 2, measured 97.8% moisture concentration and was operated with an isokinetic sampling rate of 158%. Per the Protocol, the PM concentration results obtained with this sampling train are not invalidated. As these data are consistent with all other data from the source test, the results for this sampling train are usable and are reported.

5-11 Source Test Report for the Coker Steam Vent
Table 5-3. Proportion of Valid Data Points for the Volumetric Flow Rate Database
Sampling Train Sampling
Train ID
Sampling Train
Interval (h:min)
Proportion of Valid
Data Points
(%)
2 607-637 100 3 638-708 100 EPA Methods 5/202 4 708-822 87.9 A 602-632 100 B 633-703 100 C 704-734 100
Run 1
SW-846 Method 0010
D 734-826 100 EPA Methods 2/4 - 2236-0038 100
1 2237-2308 100 2 2309-2339 100 EPA Methods 5/202 3 2340-040 100 A 2236-2306 62.5 B 2307-2337 75.0
Run 2
SW-846 Method 0010 C 2338-035 96.6
EPA Methods 2/4 - 1408-1621 97.1 1 1410-1443 100 2 1444-1533 96.0 EPA Methods 5/202 3 1538-1622 100 A 1409-1439 87.5 C 1442-1532 100
Run 3
SW-846 Method 0010 D 1533-1621 76.0
EPA Methods 2/4 - 632-834 100 1 633-705 100 2 706-736 100 EPA Methods 5/202 3 737-834 100 A 633-703 100 B 703-733 87.5
Run 4
SW-846 Method 0010 C 735-831 96.4

5-12 Source Test Report for the Coker Steam Vent
5.6 Analysis of Vent Gas Samples for Selected Semivolatile Organic Compound Concentrations QA/QC activities associated with the analysis of vent gas samples for selected SVOC
concentrations include: • Sample handling and preservation; • Preparation and analysis of samples within specified holding times; • Preparation and analysis of laboratory blanks; • Collection and analysis of field blanks; • Preparation and analysis of media check samples; • Preparation and analysis of laboratory control samples (LCS) and laboratory control
sample duplicates (LCSD); • Addition of surrogate spikes to every sample; and • Analyses of samples per the Protocol and applicable EPA methods. A review of the data quality associated with these measurements indicates that these data
are supportable and usable for the purpose intended for all test runs. Refer to the detailed quality assessment in Appendix 5-6. The issues identified during the data quality review are detailed below.
• All samples were received intact by the laboratory. Some XAD sorbent trap and filter
samples arrived at temperatures between 3 and 16°C. All other samples arrived at temperatures below 4°C. However, the XAD sorbent traps are spiked with a surrogate compound before sampling. Recovery of that surrogate compound met specification in all cases, indicating that there was no loss from these samples during any aspect of the program, including sample collection and shipping.
• 328 of 335 surrogate spike recoveries met the laboratory specification. The 7 outliers were low recoveries of 2-fluorophenol from the XAD/post-XAD condensate sample fractions. The laboratory has noted that these were spectral interferences associated with co-eluting target analytes. The few surrogate recoveries outside laboratory specification have negligible impact, considering the overwhelming number of surrogate recoveries met all specifications, and the identification of interferences with target analytes.
• The analytical fractions recovered during the Source Test and analyzed separately in the laboratory were different than those presented in the Protocol. All of the applicable components of the SW-846 Method 0010 sampling train were recovered for analysis, and the results of these analyses present a supportable and usable measurement of the target analytes collected in the SW-846 Method 0010 sampling trains. There is no impact on the usability of these results by the use of alternative sample fractions.

5-13 Source Test Report for the Coker Steam Vent
5.7 Analysis of Vent Gas Samples for Particulate Matter Concentrations QA/QC activities associated with the analysis of vent gas samples for PM concentrations
include: • Sample handling and preservation; • Preparation and analysis of samples within specified holding times; • Collection and analysis of field blanks; • Preparation and analysis of media check samples; and • Analyses of samples per the Protocol and applicable EPA methods. A review of the data quality associated with these measurements indicates that these data
are supportable and usable for the purpose intended for all test runs. Refer to the detailed quality assessment in Appendix 5-7. The issues identified during the data quality review are detailed below.
• In some cases, data was not collected at the identified data points. As data was being
collected at 2-minute intervals, the loss of an occasional data point is negligible. In all cases, the data used in further calculations was interpolated from nearby sampling points. This is discussed in Section 5.4, above.
