solutions for upper mid-rise and high-rise mass timber
TRANSCRIPT

Solutions for Upper Mid-Rise and High-Rise Mass Timber Construction: Numerical Models for Post-Tensioned Shear Wall System with Energy Dissipators
Natural Resources Canada
Canadian Forest Service
Ressources naturelles Canada
Service canadien des forêts
May 2019
[email protected] www.fpinnovations.ca
Zhiyong Chen
Marjan Popovski
PROJECT NUMBER: 301013068

Project number 301013068 2 of 43
2
301013068: ADOPTION OF POST-TENSIONING SYSTEMS
TRANSFORMATIVE TECHNOLOGY
ACKNOWLEDGEMENTS This project was financially supported by the National
Resources Canada (NRCan) under the Contribution Agreement
existing between the Government of Canada and
FPInnovations.
REVIEWERS Chun Ni, Ph.D., P.Eng., Principal Scientist, Building Systems
AUTHOR CONTACT INFORMATION Marjan Popovski, Ph.D., P.Eng.
Principal Scientist
Building Systems
(604)222-5739
Disclaimer to any person or entity as to the accuracy, correctness, or
completeness of the information, data, or of any analysis thereof
contained in this report, or any other recommendation,
representation, or warranty whatsoever concerning this report.
Follow us:
The prestressed-laminated timber system, Pres-Lam, developed in New Zealand, is a low
damage innovative wood-hybrid system that utilizes post-tensioned (PT) mass timber
components along with various types of energy dissipators. For implementation of the Pres-
Lam system in North America, the response of PT only and Pres-Lam Cross Laminated Timber
(CLT) shear walls under lateral loads was investigated at FPInnovations.
This year, material-based numerical models of PT only and Pres-Lam CLT walls were
developed in the finite element program ABAQUS. These models differ from others
developed so far as they do not require wall test results for their calibration, thus provide
savings in time and resources. The response of the models agreed well with the experimental
results of the tested wall configurations from last year. The influence of PT force level, aspect
ratio of the wall panels, and spacing and number of energy dissipating devices on the
response of the system was investigated using the developed models. The results gave
valuable insight on the behaviour of the Pres-Lam CLT shear walls and will form the basis for
developing future design guidelines for PT and Pres-Lam mass timber systems.
APPROVER CONTACT INFORMATION Rod Stirling, Ph.D.
Acting Manager, Building Systems

Project number 301013068 3 of 43
3
1. INTRODUCTION ..............................................................................................................4
2. OBJECTIVES ....................................................................................................................6
3. STAFF .............................................................................................................................6
4. ANALYTICAL MODELS DEVELOPMENT .............................................................................7
4.1 MATERIAL-BASED APPROACH ......................................................................................... 7
4.2 MODEL VERIFICATION ................................................................................................... 11
5. INFLUENCE OF KEY PARAMETERS ON THE SEISMIC RESPONSE ........................................ 24
5.1 INFLUENCE OF THE INITIAL PT FORCE LEVEL ................................................................. 26
5.2 INFLUENCE OF THE ASPECT RATIO OF WALL PANELS ................................................... 29
5.3 INFLUENCE OF AXIAL DISSIPATOR (FUSE) PROPERTIES ................................................. 31
5.4 INFLUENCE OF UFP PROPERTIES ................................................................................... 36
6. CONCLUSIONS .............................................................................................................. 40
7. REFERENCES ................................................................................................................. 41
TABLE OF CONTENTS

Project number 301013068 4 of 43
4 1. INTRODUCTION The latest developments in seismic design philosophy in modern urban centers have moved
towards the development of new types of so called “resilient” or “low damage” structural
systems. Such systems reduce the damage to the structure during an earthquake while offering
the same or higher levels of safety to occupants. One such structural system in mass timber
construction is the “Pres-Lam” system developed by Structural Timber Innovation Company
(STIC) and Prestressed Timber Limited (PTL), both from New Zealand. FPInnovations has
acquired the Intellectual Property rights for the Pres-Lam system for use in Canada and the
United States. In addition to energy dissipators placed at specific locations, the system utilizes
post-tensioned (PT) mass timber beams and columns in moment resisting frames (Figure 1.a), or
PT shear walls in wall-based buildings (Figure 1.b) (Popovski 2017).
(a) (b)
Figure 1. Examples of Pres-Lam system used in: (a) Moment resisting frame; and (b) Wall based system (adapted from Pampanin et al. 2013a).
Note: The PT cables and energy dissipators are shown in blue and red, respectively.
As presented by Popovski and Karacabeyli (2017), a wide range of structural testing on the Pres-
Lam system has been carried out over the past twelve years in New Zealand. Due to the
presence of post-tensioning, some design and performance aspects of the Pres-Lam frame and
wall-based systems depend on the material properties. Considering that most of the testing
conducted so far has been conducted using New Zealand LVL, determining the performance of
the system built of Canadian and US engineered wood products is of primary importance in
order for this system to be widely adopted and used in Canada and the U.S. During last fiscal
year, a comprehensive series of testing (Chen et al. 2018) was carried out at the Building
Systems Laboratory of FPInnovations in Vancouver, to quantify the structural performance of
the Pres-Lam mass timber shear walls under in-plane lateral loads. A total of 110 tests with ten

Project number 301013068 5 of 43
5
replicates of each material in each of the directions were conducted to determine the load-
deformation properties of four different engineered wood products (LVL, LSL, Glulam and CLT)
under compression loads in various directions. Tests on axial mild steel energy dissipators (fuses)
with two different designs were also conducted to determine their load-displacement and
energy dissipation properties. A total of 17 different single and coupled Pres-Lam walls with six
different configurations were tested under monotonic and reversed cyclic loading to investigate
the overall system performance under gravity and lateral loads. More details on the tests are
provided in Chen et al. (2018).
The analytical models play a crucial role in the seismic design of Pres-Lam system (Pampanin et
al. 2013a, b; Sarti et al. 2016b). Two general models (Figure 2) are used for the Pres-Lam system
(Kovacs 2016): a rotational spring model (lumped/concentrated plasticity model) and the multi-
spring model (Sarti 2015). The former allows for an understanding of general system responses
only; more system behaviour can only be captured by using the multi-spring model (Palermo
2005). Two types of multi-spring models were developed by using monolithic beam analogy
(Newcombe 2007) and Winkler spring analogy (Newcombe 2011 & 2015; Akbas et al. 2017),
respectively. However, monolithic beam analogy method tends to underestimate the response
of the Pres-Lam system (Newcombe 2011 and 2015), while Winkler spring analogy method
tends to overestimate the response (Kovacs & Wiebe 2016). Moreover, both models require
additional calibration to either experimental data or numerical simulation results (Kovacs and
Wiebe 2016; Palermo 2005; Sarti 2015).
(a) (b)
Figure 2. Spring models for Pres-Lam system: (a) Rotational spring model; and (b) Multi-spring model (Sati 2015).
In this study, material-based finite element (FE) models for the post-tensioned CLT shear walls
were developed. Only the material properties, such as those obtained from tests conducted last
year, are required as input for the model. These models differ from the models mentioned
above as they do not require wall test results for their calibration thus saving valuable time and

Project number 301013068 6 of 43
6
resources. The experimental results of the tested wall configurations in last fiscal year were
utilized to validate the developed models. The influence of initial PT force level, aspect ratio of
the wall panel, and spacing and number of energy dissipating devices on the response of the
system was investigated using the developed models. The testing and modelling results gave
valuable insight on the behaviour of the PT-only and Pres-Lam CLT shear walls under lateral
loads. They will form the basis for developing future design guidelines for PT-only and Pres-Lam
mass timber systems.
2. OBJECTIVES The main objectives of the research work presented in this report were to:
develop material-based FE models for the post-tensioned CLT shear walls; and
Investigate the influence of important design parameters (initial PT force level, aspect
ratio of wall panel, spacing and number of energy dissipating devices) on the response
of the PT-only and the Pres-Lam wall system.
The developed analytical models are the first of their kind developed for Pres-Lam walls. These
models can be used by practicing engineers and researchers as a material-based approach for
investigating the seismic performance of Pres-Lam wall system. These models are different from
other current models by the fact that they can eliminate the time- and resource-consuming wall
tests for the models’ calibration. The developed models will be used to quantify the
performance of a wider range of Pres-Lam wall configurations. This information will also be used
to develop design guidelines to facilitate greater acceptance of the system by the design
community.
3. STAFF Marjan Popovski, Ph.D., P.Eng., Principal Scientist, Building Systems
Zhiyong Chen, Ph.D., P.Eng., Scientist, Building Systems

Project number 301013068 7 of 43
7 4. ANALYTICAL MODELS DEVELOPMENT
4.1 Material-Based Approach A typical coupled Pres-Lam CLT shear wall is shown in Figure 3. Bracketed steel plates for
connecting the axial energy dissipators (also called fuses) to the wall and brackets for connecting
the U-shaped Flexural Plates (UFPs) to the CLT panels were installed on each CLT panel using
VGS self-taping screws and VGU washers, as illustrated in Figures 4a and 5a, respectively. The
bracketed steel plates and brackets were designed with sufficient stiffness and strength to
transfer the loads from fuses or UFPs to the panels efficiently following capacity design method.
After positioning the wall panels on the steel foundation beam, the PT cables were pulled to the
target force. Axial fuses (Figure 4b) and UFPs (Figure 5b) were installed on each panel or
between panels to improve the wall behavior and energy dissipation. Two shear keys at the
bottom of both ends for each panel were used to prevent the sliding between the wall and the
foundation beam. A steel tube was installed at the top of the two panels to transfer lateral load
between panels. More details on the tested walls are provided in Chen et al. (2018).
Figure 3. Coupled Pres-Lam CLT shear wall specimen with axial fuses and UFPs.

Project number 301013068 8 of 43
8
(a)
(b)
Figure 4. Modified “plug and play” axial fuses filled with two half-steel-tubes: (a) Locations and Installation; and (b) Components and details (all dimensions in mm unless specified otherwise).
ø3/4”×1/2” tube (L=215)
ø1-1/4”×3/4” tube (L=250)

Project number 301013068 9 of 43
9
(a)
(b)
Figure 5. UFPs: (a) Installation between the wall panels; and (b) Dimensions (in mm, unless specified otherwise).

Project number 301013068 10 of 43
10
In this study, comprehensive analytical models for PT-only and Pres-Lam mass timber shear wall
systems were developed using a material-based FE modelling approach in general-purpose finite
element program ABAQUS V6.14 (Dassault Systèmes Simulia Corp. 2016). Figure 6 shows a FE
model for the typical coupled Pres-Lam CLT shear wall shown in Figure 3.
Figure 6. FE model for coupled Pres-Lam CLT shear wall with axial fuses and UFPs.
In the FE model shown in Figure 6, the CLT panels were modelled using shell elements with
adequate strength and stiffness properties in each orthogonal direction. The steel post-
tensioning cables and the U-shaped flexural steel plates (UFPs) were modeled using truss and
beam elements, respectively, with the strength and the stiffness properties of the steel used in
the testing program. The hysteretic loops of the fuses and UFPs can be obtained by conducting a
refined FE simulation (Rahmzadeh and Iqbal 2018). Alternatively, the fuses were modelled using
connector elements with the hysteretic behaviour obtained from the tests. The foundation was
modeled using rigid elements. “Softened” contact with friction was adopted in the interaction
between the CLT panels and the foundation. The fuses were connected to the CLT panels and
the foundation using multiple point constraints (MPC) technique. The same MPC technique was
used for connecting the UFPs to the CLT panels in the coupled wall configurations. The PT force
applied to the wall was achieved by lowering the temperature of the PT cable which will shorten
correspondingly (Dang et al. 2014).
With the developed analytical models, only the physical and mechanical properties of mass
timber and steel (PT cables, UFPs and fuses) or with the hysteresis loops of fuses, were required
as the model input. The developed models are also able to predict the structural performance of

Project number 301013068 11 of 43
11
the Pres-Lam CLT shear walls with the PT force being close to or even over the yield level of the
cables, e.g. close to collapse, a state that could not be achieved during the testing due to safety
concerns. P-Delta effect can be considered in the developed models. Artificial columns for spring
models (Kovacs and Wiebe 2016; Sarti et al. 2016b) are not necessary.
4.2 Model Verification A series of 17 “Pres-Lam” CLT walls in six (6) different configurations were tested under
monotonic and reversed cyclic loading by Chen et al. (2018). The experimental results obtained
from six shear walls (W04-06, W10, W15 and W16) in four (4) configurations (C1, C2, C5 and C6,
Figures 7 to 10) were used to verify the developed FE models.
Figure 7. Post-tensioned CLT shear wall configuration C1, with three levels of post-tensioning force.

Project number 301013068 12 of 43
12
Figure 8. Pres-Lam CLT shear wall configuration C2, with three levels of PT force and varying distance between fuses.
Figure 9. Pres-Lam coupled CLT shear wall configuration C5, with two UFPs only.

Project number 301013068 13 of 43
13
Figure 10. Pres-Lam coupled CLT shear wall configuration C6, with eight fuses and variable number of UFPs.
The single-panel wall configurations (C1 and C2) had a height of 3 m and a length of 1 m (Figures
7 and 8), while the coupled-panel configurations (C5 and C6) consisted of two single-panel walls
connected with UFPs (Figures 9 and 10). Axial fuses were used in wall configurations C2 and C6
(Figures 8 and 10). All walls were made of five-ply E1 grade CLT panels with a thickness of
143mm where the thicknesses of longitudinal and transversal layers were 35mm and 19mm,
respectively. The PT cables had a nominal diameter of 20 mm, a cross section area of 316 mm2,
modulus of elasticity of 205 GPa, yield strength of 900 MPa, a yield force of 284 kN, an ultimate
strength of 1100 MPa and an ultimate force of 348 kN. Initially applied PT forces of 44.5, 89.0
and 133.5 kN therefore correspond to force levels of 15.7, 31.3 and 47.0 % of yielding,
respectively. As shown in Figure 4b, the fuses were composed of a steel cable that had a
reduced cross-section in the center part for yielding, a steel tube covering the steel cable, and
two half-steel-tubes filling the gap between the reduced section of the steel cable and the outer
tube. The steel cables were fabricated using mild steel with modulus of elasticity of 200 GPa and
yield strength of 300 MPa. UFPs were fabricated with mild steel plates with a thickness of 6.35
mm, as shown in Figure 5b.
Two-dimensional FE models for the six PT-only and Pres-Lam CLT shear walls were developed in
ABAQUS. An FE model for a typical coupled Pres-Lam CLT shear wall with fuses and UFPs (W16)
is shown in Figure 6. The CLT panels were modeled (meshed) using 4-node bilinear plane stress
quadrilateral shell elements with reduced integration and hourglass control, CPS4R, with typical
dimensions of 30 x 30 mm. The material of the CLT panels was assumed to be an orthogonal
elastic-plastic with the mechanical properties listed in Table 1. The material properties were

Project number 301013068 14 of 43
14
derived by converting the corresponding results of 3-ply CLT specimens tested by Chen et al.
(2018). The steel PT cables were meshed using 2-node 2-D thermally coupled truss element,
T2D2T, with an element length equal to the wall height and the corresponding stiffness and
strength properties of the steel used in the testing program. The PT force applied to the wall
was achieved by lowering the temperature of the PT cable that caused the corresponding
shortening (Dang et al. 2014). The physical and thermal properties of the PT cable were taken
according to EN 1993-1-2 (2005) and are given in Table 2. The foundation, the steel plates on
the panels for applying PT force, and the roller between two panels were meshed using 2-node
2-D linear rigid link elements, R2D2, with a typical length of 15 mm. The fuses were modelled
using 2-node 2-D connector elements, CONN2D2, with specific stiffness and strength properties.
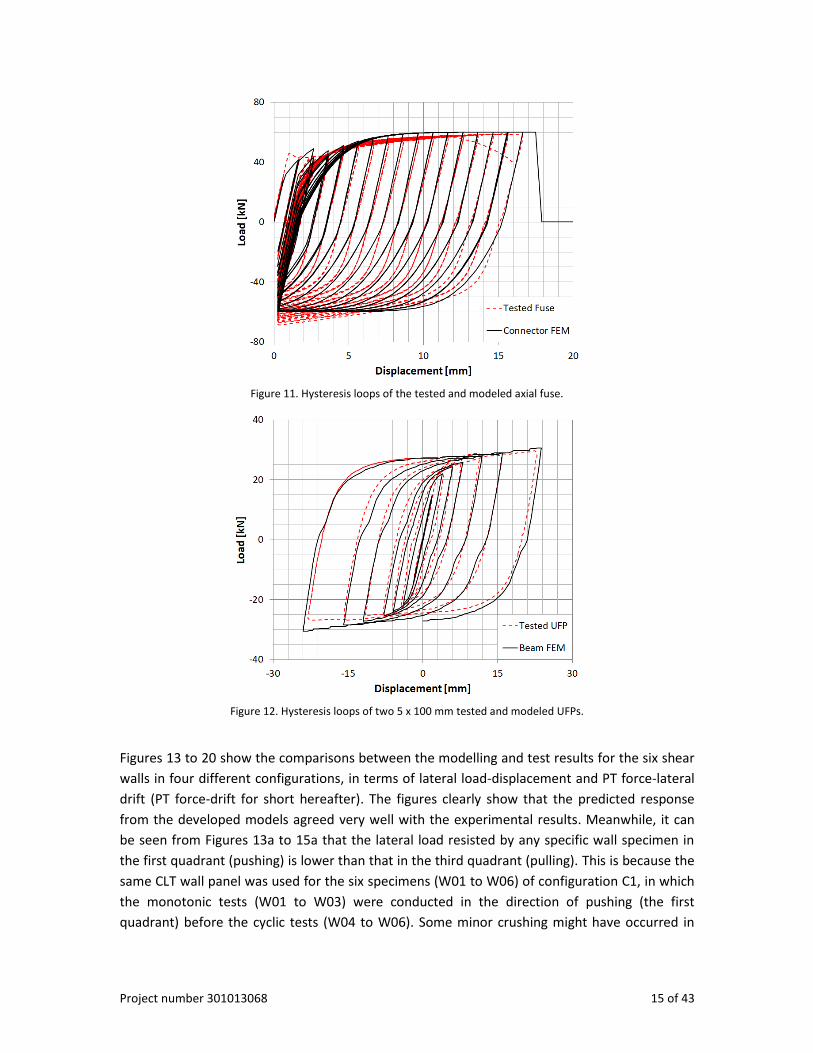
The hysteresis loops generated using the CONN2D2 elements were compared to those obtained
during the testing program (Chen et al. 2018) in Figure 11. The UFPs were meshed using 2-node
linear in-plane beam elements, B21, with a typical length of 5 mm and the corresponding
stiffness and strength properties of the mild steel used in the testing program. A comparison
between the modelling and the testing results of UFP tested by Iqbal et al. (2015) is shown in
Figure 12. “Softened” contact with friction was adopted in the interaction between the CLT
panels and the foundation. The fuses were connected to the CLT panels and the foundation
using multiple point constraints (MPC) technique. The same MPC technique was used for
connecting the UFPs to the CLT panels in the coupled wall configurations.
Table 1. Mechanical properties of 5-ply CLT panel with thickness of 143 mm used in the model validations
Stiffness Property Strength property
Epara [MPa] Eperp [MPa] n G [MPa] fyc,para [MPa] fyc,perp [MPa]
5564 2178 0.4 348 30.9 17.8
Table 2. Physics-thermal properties of PT cable used in the model validations
Density Thermal Conductivity Specific Heat Expansion
[kg/m3] [W/(m∙K)] [J/(kg∙K)] [%]
7850 53.3 425 0.0012
Project number 301013068 15 of 43
15
Figure 11. Hysteresis loops of the tested and modeled axial fuse.
Figure 12. Hysteresis loops of two 5 x 100 mm tested and modeled UFPs.
Figures 13 to 20 show the comparisons between the modelling and test results for the six shear
walls in four different configurations, in terms of lateral load-displacement and PT force-lateral
drift (PT force-drift for short hereafter). The figures clearly show that the predicted response
from the developed models agreed very well with the experimental results. Meanwhile, it can
be seen from Figures 13a to 15a that the lateral load resisted by any specific wall specimen in
the first quadrant (pushing) is lower than that in the third quadrant (pulling). This is because the
same CLT wall panel was used for the six specimens (W01 to W06) of configuration C1, in which
the monotonic tests (W01 to W03) were conducted in the direction of pushing (the first
quadrant) before the cyclic tests (W04 to W06). Some minor crushing might have occurred in

Project number 301013068 16 of 43
16
the wall panel at the bottom after the monotonic tests, even though it could not be identified
visually.
(a)
(b) Figure 13. Comparison of the response of modeled and tested W04 from configurations C1: (a) Lateral load-
displacement relationship; and (b) PT load-drift relationship.

Project number 301013068 17 of 43
17
(a)
(b) Figure 14. Comparison of the response of modeled and tested W04 from configurations C1: (a) Lateral load-
displacement relationship; and (b) PT load-drift relationship.

Project number 301013068 18 of 43
18
(a)
(b) Figure 15. Comparison of the response of modeled and tested W04 from configurations C1: (a) Lateral load-
displacement relationship; and (b) PT load-drift relationship.

Project number 301013068 19 of 43
19
(a)
(b)
Figure 16. Comparison of the response of modeled and tested walls from Configuration C2: (a) Lateral load-displacement relationship; and (b) PT load-drift relationship.

Project number 301013068 20 of 43
20
Figure 17. Comparison of the lateral load-displacement relationship of modeled and tested wall from Configuration C5.

Project number 301013068 21 of 43
21
(a)
(b)
Figure 18. Comparison of the PT load-drift relationship of modeled and tested wall from Configuration C5: (a) Left
panel; and (b) Right panel.

Project number 301013068 22 of 43
22
(a)
Figure 19. Comparison of the lateral load-displacement relationship of modeled and tested wall from Configuration C6.

Project number 301013068 23 of 43
23
(a)
(b)
Figure 20. Comparison of the PT load-drift relationship of modeled and tested wall from Configuration C6: (a) Left panel; and (b) Right panel.

Project number 301013068 24 of 43
24 5. INFLUENCE OF KEY PARAMETERS ON THE SEISMIC RESPONSE
Figure 21 shows the forces developed in a typical coupled Pres-Lam wall with axial fuses and
UFPs that is under lateral load. The typical push-over curve of a properly designed coupled Pres-
Lam wall is shown in Figure 22, for different return periods of the earthquake. The figure also
includes the system performance zones for Service Limit State (SLS), Ultimate Limit State (ULS)
and Maximum Considered Earthquake (MCE). Since the structural system consists of mass
timber panels, PT cables, fuses and UFPs, the response of the system under lateral loads is
usually complex. It involves uplift (decompression) and rocking of the MT panels with some
crushing in the corners, extension of the PT cables, yielding of the axial fuses and the UFPs
(Figures 23 and 24). Each of these response parameters may also affect the performance of
other ones, making the design of this system very challenging without suitable verified analytical
models. In addition, the influence of the key design parameters on the overall system
performance made of North American MT panels has not been investigated so far. In this
section, the influence of initial PT force level, aspect ratio of wall panels, spacing and number of
energy dissipating devices on the system response was investigated using the developed
models.
Figure 21. Controlled rocking wall with additional forces and complexity imposed by energy dissipating elements
(Kovacs 2016).
P

Project number 301013068 25 of 43
25
Figure 22. Qualitative push-over curve and performance limits for Pres-Lam systems for different return periods of
design earthquakes (Sarti 2015).
Figure 23. PT rocking mechanism: (a) Initial state; (b) Decompression; (c) Non-linearity; and (d) Tendon elongation
(Sarti 2015).
Note: F, Tpt0 and Tpt represent the lateral load on the wall, the initial post-tensioning force, and the post-tensioning
force in the rod, respectively. M and Mdec represent the moment applied at the bottom of the wall and the
decompression moment, respectively. C and h represent the neutral axis depth and the length of the wall,
respectively. The deflection of the wall is designated as while is the wall rotation.

Project number 301013068 26 of 43
26
Figure 24. Pres-Lam rocking mechanism: (a) Decompression; (b) Tensile yielding; (c) Tendon elongation; (d) Compressive yielding; and (e) Re-centering (Sarti 2015).
Note: F and Tpt represent the lateral load on the wall and the post-tensioning force in the rod, respectively. C
represents the neutral axis depth of the wall, while Fs represents the force resisted by the fuses. The deflection of the
wall is designated as while is the wall rotation.
5.1 Influence of the Initial PT Force Level The influence of initial PT force level was investigated with single PT-only CLT wall models
(Configuration C1 shown in Figure 7) using six force levels, Table 3. All walls were assumed to be
made of five-ply E1 grade CLT panels with a thickness of 175mm where the thicknesses of
longitudinal and transversal layers are 35mm. The length and height of the wall panels were 1.5
and 6.0 m, respectively. The CLT panels were modelled as orthogonal elastic-plastic material
with the mechanical properties listed in Table 4. The material properties were derived by

Project number 301013068 27 of 43
27
converting the corresponding results of 3-ply CLT specimens tested by Chen et al. (2018). The PT
cables had a nominal diameter of 46 mm, a cross section area of 1665 mm2, modulus of
elasticity of 205 GPa, yield strength of 900 MPa, and a yield force of 1378 kN. The PT cables
were modelled as isotropic elastic-plastic material. The physics-thermal properties of the PT
cable are given in Table 2. According to the research conducted by Sarti et al. (2016), the initial
timber stress (proportional to the initial PT force) shall not exceed 10% of the timber
compressive strength. This stress limit was set to allow the wall to develop the gap opening at
both ends to allow adequate depth of the neutral axis of the wall cross-section, and provide
efficient activation of the dissipators. An initial PT force was varied from 0.0 to 597.3 kN in this
study. Correspondingly, the initial stress ratio for the wall panels was in the range from 0 % to
15 %, while the range of the initial PT force in the cables was varied from 0 to 72.2 % of the yield
load.
Table 3. Initial PT stress levels (% of yield stress) and corresponding PT forces for CLT wall models
Compression Stress Level [%] 0.0 2.5 5.0 7.5 10.0 15.0
PT Cable Stress Level [%] 0.0 12.0 24.1 36.1 48.1 72.2
Initial PT force [kN] 0.0 165.7 331.4 497.1 663.1 597.3
Table 4. Mechanical properties of 5-ply CLT panel (175 mm thick) used in the analyses
Stiffness Property Strength Property
Epara [MPa] Eperp [MPa] n G [MPa] fyc,para [MPa] fyc,perp [MPa]
4547 1780 0.4 284 25.3 14.5
Figure 25 shows the lateral load-drift curves and PT force-drift curves of PT-only CLT walls with
different initial PT force ratios. The lateral load-drift curves shown in Figure 25a are similar to
the typical one shown in Figure 22 and they end with a platform segment on the right side,
which indicates yielding of the PT cable (Figure 25b). With increase in the initial PT force, the
stiffness and the decompression (uplift) point load of the PT-only CLT walls also increased, while
the lateral drift when the PT cables started yielding decreased. All PT-only CLT wall models,
however, yielded the same maximum load of 140 kN. This means that a single PT-only CLT wall
with a higher initial PT force level was stiffer but less deformable. The maximum lateral load of
the PT-only CLT walls was governed by the yielding of PT cables and was the same for different
initial PT force levels.

Project number 301013068 28 of 43
28
(a)
(b)
Figure 25. Performance of PT-only CLT walls with different initial PT force levels: (a) Lateral load-drift relationship; and (b) PT force-drift relationship.
Figure 25 shows the relationships between the lateral load and PT force for the CLT walls with
different initial PT force levels. Except the wall without initial PT force, the lateral loads of other
CLT walls increased linearly without change in the PT forces (almost vertically) at the beginning,
while this increase started to become non-linear after the decompression point (lifting of the
wall panels) was reached. At the end, however, all the curves gravitated to the same path where
the overturning resistance provided by the PT force and the overturning moment caused by the
lateral load were in a state of balance.

Project number 301013068 29 of 43
29
Figure 26. Relationships between lateral load and PT force for CLT walls with different initial PT force levels.
5.2 Influence of the Aspect Ratio of Wall Panels The influence of aspect ratio of panels was investigated with single PT-only CLT wall models
(Configuration C1 shown in Figure 7) with a length of 1.5 m and four aspect ratios (Table 5). All
walls were assumed to be made of five-ply E1 grade CLT panels with a thickness of 175 mm
similar to those in Section 5.1. The CLT panels were modelled as orthogonal elastic-plastic
material with the mechanical properties listed in Table 4. An initial PT force of 331.4 kN was
applied to all models by using a PT cable with a nominal diameter of 46 mm. Correspondingly,
the initial timber stress ratio for 1.5 m long wall models was 5.0 %.
Table 5. Heights and aspect ratios of the analysed CLT wall models
Aspect Ratio 3:1 4:1 5:1 6:1
Wall Height [m] 4.5 6.0 7.5 9.0
Figure 27 shows the lateral load-drift curves and PT force-drift curves of PT-only CLT walls with a
length of 1.5 m and different aspect ratios. The lateral load-drift curves shown in Figure 27a are
similar to the typical one shown in Figure 22 and end with a platform segment which indicates
the yield of PT cable. The decompression point and the maximum lateral load decreased with an
increase in the aspect ratio, while the lateral drift increased with an increase in the aspect ratio.
The increase in the PT force until the yield load of the cable was reached was slower for walls
with a larger aspect ratio due to longer moment arms. While the walls with smallest aspect ratio

Project number 301013068 30 of 43
30
analysed (3:1) reached the yield point of the cable at just over 5 % lateral drift, the most slender
walls (with aspect ratio 6:1) reached this just before the 10 % drift. This means that a single PT-
only CLT wall with a lower aspect ratio is stiffer and stronger but less ductile.
(a)
(b) Figure 27. Performance of PT-only CLT walls with different aspect ratios: (a) Lateral load-drift relationship; and (b) PT
force-drift relationship.

Project number 301013068 31 of 43
31
5.3 Influence of Axial Dissipator (Fuse) Properties The influence of the axial fuse (Figures 4 and 28) was investigated using single Pres-Lam CLT wall
models (Configuration C2, Figure 8) with four different spacing and lengths of the fuses (Table 6,
the diameter was 22 mm). All walls were assumed to be made of five-ply E1 grade CLT panels
with dimensions of 1.5 x 6.0 x 0.175 m. An initial PT force of 331.4 kN (initial timber stress ratio
= 5%) was applied to all models by using a PT cable with a nominal diameter of 46 mm.
A key design parameter of Pres-Lam systems is given by the re-centering ratio, β, defined as the
ratio between the (re-centering) moment resistance provided by the post-tensioning Mpt (and
by the axial load component MN for walls) divided by the total moment resistance of the system,
Mtotal (Pampanin et al. 2013 a, b), see Eq(1).
β =𝑀𝑝𝑡+𝑀𝑁
𝑀𝑡𝑜𝑡𝑎𝑙 (1)
During standard design, ratios of β will normally range between 0.6 and 0.7. In simple design
terms this means that the “balance” between post-tensioning and mild steel will be between
60:40 and 70:30, respectively. Ratio of β should not be less than 0.55 to ensure re-centering. As
suggested by Pampanin et al., (2013 a, b), a re-centering ratio of the wall, β, was taken as 0.6 for
the standard fuse case that has a diameter d = 22 mm, length L = 190 mm, and spaced between
each other at 50 % of the wall length (0.5 LW), with a corresponding lateral drift of 2.5 % (the
stage for calculating the moment resistance). The model inputs of the fuses, hysteresis loops,
can be obtained by conducting detailed numerical simulation (Rahmzadeh and Iqbal 2018) or
converting the test results. In this study, the hysteresis loops of a fuse tested in Chen et al. (2018)
were converted to those for the different fuses listed in Table 6 by scaling the stiffness, force
and deformation based on the design parameters.
Figure 28. Details of a typical axial dissipator (Sarti 2015).
Table 6. Length [mm] of fuses with a diameter of 22 mm
Spacing between fuses 0.3LW 0.5LW 0.75LW 1.0LW
Fuse Length [mm] 115 190* 285 375
* indicates the case that has a re-centering ratio (β) of 0.6.
Figures 29 to 32 show the lateral load-drift curves and PT force-drift curves of the same CLT wall
using fuses with d = 22 mm, with different lengths and spacing between them. By comparing the

Project number 301013068 32 of 43
32
shape of the lateral load-drift curves (Figures 29a to 32a), it can be seen that the loads at the
decompression point, loads at the 2.5% drift, and the energy dissipation, increased with an
increase in the spacing of the fuses. For a shorter spacing of the fuses, as shown in Figures 29b
to 32b, the re-centering V-shape curve has a sharper bottom, while a rounder bottom was
observed in case of a larger fuse spacing. This is because with larger spacing of fuses, the
initial overturning resistance at the wall base was larger, thus it took higher lateral load
and also larger lateral drift to overcome the initial overturning resistance.
(a)
(b)
Figure 29. Performance of Pres-Lam CLT walls with fuses of ɸ22×[email protected] under cyclic loading: (a) Lateral load-displacement; and (b) PT force-drift.

Project number 301013068 33 of 43
33
(a)
(b)
Figure 30. Performance of Pres-Lam CLT walls with fuses of ɸ22×[email protected] under cyclic loading: (a) Lateral load-displacement; and (b) PT force-drift.

Project number 301013068 34 of 43
34
(a)
(b)
Figure 31. Performance of Pres-Lam CLT walls with fuses of ɸ22×[email protected] under cyclic loading: (a) Lateral load-displacement; and (b) PT force-drift.

Project number 301013068 35 of 43
35
(a)
(b)
Figure 32. Performance of Pres-Lam CLT walls with fuses of ɸ22×[email protected] under cyclic loading: (a) Lateral load-displacement; and (b) PT force-drift.

Project number 301013068 36 of 43
36
5.4 Influence of UFP Properties The influence of the UFPs (Figure 33) was investigated using coupled Pres-Lam CLT wall models
(Configuration C3, Figure 9) with different numbers of UFPs as shown in Table 7. All walls were
assumed to be made of five-ply E1 grade CLT panels with dimensions of 1.5 x 6.0 x 0.175 m. An
initial PT force of 331.4 kN (initial timber stress ratio of 5%) was applied to all wall models by
using a PT cable with a nominal diameter of 46 mm. As recommend by Iqbal et al. (2015), the re-
centering ratio, β, for coupled Pres-Lam walls with UFPs was taken as 0.8 for standard cases (for
8 UFPs with a diameter of 95 mm, a thickness of 9.5 mm and a width of 150 mm) with a
corresponding lateral drift of 2.5 % (the stage for calculating the moment resistance). The UFPs
were fabricated using mild steel with modulus of elasticity of 200 GPa and yield strength of 300
MPa. The model inputs of the UFPs, hysteresis loops, can be obtained by conducting detailed
numerical simulation (Baird et al. 2014) or converting the test results. The UFPs were modeled
using beam elements with a cross-section of 150 × 9.5 mm.
Figure 33. UFP yielding mechanism and developed forces and moments (Sarti 2016a).
Table 7. Number of UFPs
Number of UFP, nUFP 6 8 12
nUFP/meter 1 1.33* 2
a All UFPs have the same width (150 mm), thickness (9.5 mm) and radium (95 mm).
* indicates the case that achieved a re-centering ratio (β) of 0.8.
Figures 34 to 36 show the lateral load-drift curves and PT force-drift curves (for the left and right
panels) of the same Pres-Lam CLT wall using different numbers of UFPs. By comparing the shape
of the lateral load-drift curves (Figures 34a to 36a), it can be seen that the loads at the
decompression point, loads at the 2.5% drift, and the energy dissipation, all increased with the
increase of the number of the UFPs. For lower number of UFPs, as shown in Figures 34b to 36b,

Project number 301013068 37 of 43
37
the re-centering V-shape curve has a sharper bottom, while a rounder bottom was observed in
case of more UFPs. This is because with more UFPs, the initial overturning resistance at
the wall base was larger, thus it took higher lateral load and also larger lateral drift to
overcome the initial overturning resistance.
(a)
(b)
Figure 34. Performance of Pres-Lam CLT walls with 6 UFPs of ɸ95×9.5 mm: (a) Lateral load-displacement; and (b) PT force-drift.

Project number 301013068 38 of 43
38
(a)
(b)
Figure 35. Performance of Pres-Lam CLT walls with 8 UFP of ɸ95×9.5 mm: (a) Lateral load-displacement; and (b) PT force-drift.

Project number 301013068 39 of 43
39
(a)
(b)
Figure 36. Performance of Pres-Lam CLT walls with 12 UFPs of ɸ95×9.5 mm: (a) Lateral load-displacement; and (b) PT force-drift.

Project number 301013068 40 of 43
40 6. CONCLUSIONS
The material-based numerical models of PT-only walls and Pres-Lam CLT walls were developed
in general purpose finite element program, ABAQUS. These models differentiate from other
models developed so far by saving the time and resource-consuming wall tests for calibration of
the models.
The response of the developed models agreed well with the experimental results of the tested
wall configurations. The influence of initial PT force level, aspect ratio of the wall panel, the
spacing and number of energy dissipating devices on the response of the system was
investigated using the verified models.
The modelling results gave valuable insight on the behaviour of the PT-only and Pres-Lam CLT
shear walls under lateral loads. These findings along with additional analyses which will panned
in future will be very useful for developing future design guidelines for PT-only and Pres-Lam
mass timber systems.

Project number 301013068 41 of 43
41 7. REFERENCES
Akbas, T., Sause, R., Ricles, J., Ganey, R., Berman, J., Loftus, S., Dolan, J., Pei, S., van deLindt, J.,
and Blomgren, H. (2017). “Analytical and Experimental Lateral-Load Response of Self-
Centering Posttensioned CLT Walls.” Journal of Structural Engineering, 2017, 143(6),
04017019.
Baird, A., Smith, T., Palermo, A., and Pampanin, S. (2014). “Experimental and Numerical Study of
U-shape Flexural Plate (UFP) Dissipators.” In conference of 2014 New Zealand Society for
Earthquake Engineering (2014 NZSEE), Auckland, New Zealand.
Chen, Z., Popovski, M., Symons, P. (2018). “Advanced Wood-Based Solutions for Mid-Rise and
High-Rise Construction: Structural Performance of Post-Tensioned CLT Shear Walls with
Energy Dissipators.” FPInnovations Technical Report (301012204), Vancouver, Canada
Dang, X., Lu, X., Qiang, J., and Jiang, H. (2014). “Finite Element Analysis with Solid and Plane
Element of Seismic Performance of Self-Centering Pre-Stressed Shear Walls.” Journal of
Building Structures, 2014, 35(5), 17-24.
Dassault Systèmes Simulia Corp. (2016). “ABAQUS Analysis User’s Manual (Version 6.14).”
Dassault Systèmes Simulia Corp., Providence, USA.
DSI. (2018). “Dywidag Theadbars – Technical Data [Metric Units].” Dywidag-Systems
International (DSI). www.dsicanda.ca.
EN 1993-1-2. (2005). Eurocode 3: Design of Steel Structures – Part 1-2: General Rules –
Structural Fire Design. European Committee for Standardization, Brussels, Belgium.
Iqbal, A., Pampanin, S., Palermo, A., and Buchanan, A. (2015). “Performance and Design of LVL
Walls Coupled with UFP Dissipaters.” Journal of Earthquake Engineering, 19, 383-409.
Kovacs, M. (2016). “Design of Controlled Rocking Heavy Timber Walls for Low-to-Moderate
Seismic Hazard Regions.” Master Thesis, McMaster University, Hamilton, Canada.
Kovacs, M., and Wiebe, L. (2016). “Controlled Rocking Cross-Laminated Timber Walls for Regions
of Low-to-Moderate Seismicity.” World Conference on Timber Engineering, Vienna, Austria.
Newcombe, M. (2007). “Seismic design of Multistorey Post-Tensioned Timber Buildings.” Master
Thesis, Istituto Universitario di Studi Superiori di Pavia, Italy.
Newcombe, M. (2011). “Seismic design of Post-Tensioned Timber Frame and Wall Buildings.”
Ph.D Dissertation, University of Canterbury, Canterbury, New Zealand.
Newcombe, M. (2015). “The Connection Response of Rocking Timber Walls.” SESOC Journal,
28(1), 46-53.

Project number 301013068 42 of 43
42
Palermo, A. (2005). “Efficiency of Simplified Alternative Modelling Approaches to Predict the
Seismic Response of Precast Concrete Hybrid Systems.” Fib Symposium “Keep Concrete
Attractive”, Budapest.
Pampanin, S., Palermo, A., and Buchanan, A. (2013a). “Post-Tensioned Timber Buildings – Part 1
Overview.” Structural Timber Innovation Company, Christchurch, New Zealand.
Pampanin, S., Palermo, A., and Buchanan, A. (2013b). “Post-Tensioned Timber Buildings – Part 2
Seismic Design.” Structural Timber Innovation Company, Christchurch, New Zealand.
Popovski, M. (2018). “Introduction of Post-Tensioned Pres-Lam System.” FPInnovations.
Technical Report (301011260), Vancouver, Canada.
Popovski, M. and Karacabeyli, E. (2017). “Strategy for Implementing Pres-Lam System in Canada
and the US.” FPInnovations’ Project Report (301011260), Vancouver, Canada.
Rahmzadeh, A., and Iqbal, A. (2018). “Study of Replaceable Energy Dissipators for Self-Centering
Structures.” Eleventh U.S. National Conference on Earthquake Engineering, Integrating
Science, Engineering & Policy, Los Angeles, USA.
Sarti, F. (2015). “Seismic Design of Low-Damage Post-Tensioned Timber Wall Systems.” Ph.D
Dissertation, University of Canterbury, Canterbury, New Zealand.
Sarti, F., Palermo, A., and Pampanin, S. (2016a). “Development and testing of an alternative
dissipative posttensioned rocking timber wall with boundary columns.” J. Struct. Eng.,
142(4): E4015011.
Sarti, F., Palermo, A., Pampanin, S., and Berman, J. (2016b). “Determination of the Seismic
Performance Factors for Post-Tensioned Rocking Timber Walls Systems.” Earthquake Engng
Struct. Dyn., 46(2): 10.1002/eqe.2784.

Project number 301013068 43 of 43
43
OUR OFFICES
Pointe-Claire
570 Saint-Jean Blvd.
Pointe-Claire, QC
Canada H9R 3J9
(514) 630-4100
Vancouver
2665 East Mall
Vancouver, BC
Canada V6T 1Z4
(604) 224-3221
Québec
1055 rue du P.E.P.S.
Québec, QC
Canada G1V 4C7
(418) 659-2647
[email protected] www.fpinnovations.ca