seismic performance of mid rise timber structures
TRANSCRIPT

UBC TEAM Test Report No: TEAM 2011-007
Timber Engineering and Applied Mechanics (TEAM) Laboratory
#1901 - 2424 Main Mall, Vancouver, B.C. Canada V6T 1Z4; Tel: (604) 822-8137 Fax: (604) 822-9159
Seismic performance of mid rise timber structures -
collapse prevention
By
Yuan Li
Frank C.F. Lam
Wood Science Department
Faculty of Forestry
University of British Columbia
Vancouver, B. C., Canada
March 31, 2012
Report Prepared for
Forestry Innovation Investment Ltd.
Vancouver, British Columbia
Canada

UBC TEAM Test Report No: TEAM-2011-007 March 31, 2011
Page 2 of 21
EXECUTIVE SUMMARY
In this project a method has been developed to quantify and study the collapse potential of
tall, mid-rise wood frame building. The method has been applied to quantify the collapse
potential of six story buildings under a maximum credible earthquake: the Great Hanshin
earthquake, or Kobe earthquake.
Time series responses of six storey timber buildings with various ratios of shear walls in the
first and second stories were obtained from a sophisticated computer model developed at
UBC - Wall3D. The maximum displacement and drift ratio of different models were
different, considering the different additional shear wall units design. Collapse index concept
and analysis method were proposed. By establishing collapse index based on the computer
predicted response, evaluation of the collapse potential of the structures was performed based
on the collapse index in the time domain. The results of this study provides support and
guidance to building officials and design communities on the issue of designing to prevent
building collapses.
Reviewed by:
______________________
Frank C. F. Lam, Ph.D., P. Eng.
Professor

UBC TEAM Test Report No: TEAM-2011-007 March 31, 2011
Page 3 of 21
Table of Content
Page
EXECUTIVE SUMMARY ...................................................................................................... 2
Table of Content ....................................................................................................................... 3
List of Tables ............................................................................................................................ 4
List of Figures ........................................................................................................................... 5
ACKNOWLEDGEMENT ........................................................................................................ 6
1 INTRODUCTION ................................................................................................................. 7
2 METHODS .......................................................................................................................... 10
3 RESULTS AND DISCUSSION .......................................................................................... 13
4 CONCLUSIONS.................................................................................................................. 21

UBC TEAM Test Report No: TEAM-2011-007 March 31, 2011
Page 4 of 21
List of Tables
Page
Table 1 The configurations of four different models in Wall3D ............................................ 13
Table 2 The maximum displacement and drift ratio in first floor of four different models ... 13

UBC TEAM Test Report No: TEAM-2011-007 March 31, 2011
Page 5 of 21
List of Figures
Page
Figure 1 Gravity moment and resistant moment ..................................................................... 10
Figure 2 Six story model in Wall3D ....................................................................................... 11
Figure 3 The input ground acceleration in Wall3D ................................................................ 12
Figure 4 Frame model and lumped mass model ..................................................................... 12
Figure 5 The displacement of the first story in Model 1 ......................................................... 14
Figure 6 The displacement of the first story in Model 2 ......................................................... 14
Figure 7 The displacement of the first story in Model 3 ......................................................... 14
Figure 8 The displacement of the first story in Model 4 ......................................................... 15
Figure 9 The collapse index in Model 1 ................................................................................. 15
Figure 10 The collapse index after applied index filter in Model 1 ........................................ 15
Figure 11 The collapse index after applied index filter in Model 4 ........................................ 16
Figure 12 The collapse index after applied drift limit of 0.5% in Model 1 ............................ 16
Figure 13 The collapse index after applied drift limit of 1.0% in Model 1 ............................ 17
Figure 14 The collapse index after applied drift limit of 1.5% in Model 1 ............................ 17
Figure 15 The collapse index after applied drift limit of 2.0% in Model 1 ............................ 17
Figure 16 The collapse index after applied drift limit of 2.5% in Model 1 ............................ 18
Figure 17 The collapse index after applied drift limit of 0.5% in Model 4 ............................ 18
Figure 18 The collapse index after applied drift limit of 1.0% in Model 4 ............................ 19
Figure 19 The collapse index after applied drift limit of 1.5% in Model 4 ............................ 19
Figure 20 The collapse index after applied drift limit of 2.0% in Model 4 ............................ 19

UBC TEAM Test Report No: TEAM-2011-007 March 31, 2011
Page 6 of 21
ACKNOWLEDGEMENT
We would like to thank Forestry Innovation Investment Ltd. for funding the research project.
UBC TEAM Test Report No: TEAM-2011-007 March 31, 2011
Page 7 of 21
1 INTRODUCTION
Well designed and constructed wood frame structures are recognized to exhibit very
favorable earthquake resistance features. This is supported by strong evidence from results
of comprehensive full scale static and shake table test programs of shear walls and buildings,
sophisticated computer modeling efforts, and historical in-service performance record.
However, in some buildings, designed under poor structural concept, soft storey behaviour
has resulted in collapses and loss of lives. As modern building codes are moving towards
expansion of the boundary of structural use wood by allowing taller and larger timber
structures to be built, there is a need to gain better understanding of the collapse phenomenon
of buildings subject to earthquake forces.
Construction of mid rise wood frame structures up to six stories have been approved in BC
building codes. The technical work needed to allow for code change to take place was
completed within one year. At such a pace of development, some of the intricate and
complicated details required justifications based on engineering judgment with conservative
principles. In order to expand the knowledge envelope, more detailed studies are needed.
One of the most critical areas of concern is the seismic behavior of mid rise timber structures
on the possible development of soft story. This is a life safety and property damage issue.
Rational design provisions are needed that take into consideration of both safety as well as
efficiency. On one hand excessive safety increases the construction cost and reduce the
competitiveness of the building material. On the other hand, too liberal design rules can lead
to inadequate performance that can have life safety and building damage consequences and
erode consumer confidence. In general, consumer confidence is built upon good
performance history or strong and reliable scientific evidence. In the case of tall wood frame
structures, this type of information is unfortunately sparse.
The formation of soft story in a structure during an earthquake is one of the most feared
consequences of a seismic event. Soft story can form when the strength and ductility of a
lower story is exceeded by the demand of the earthquake. With the excessive drift or lean in
the soft story, the weight of the upper story can create a secondary and nonlinear p-delta
UBC TEAM Test Report No: TEAM-2011-007 March 31, 2011
Page 8 of 21
effect causing the upper story to "pancake" onto the lower ones which can result in heavy
causalities. Current codes use the concept of different levels of relative inter-story
deformation as a means to quantify performance of structures. While this is an important
measure, such limits were typically set based on experience of structural systems with
heavier building material such as concrete and steel and in case of wood structures based on
experimental results of single wall units.
As the concept of tall, wood frame structures is relatively new, and the study of the seismic
performance of large structures is not only expensive but technically challenging, there are
only few studies available in the literature on the subject. In support of the BC building code
development process, the BC government commissioned working groups and studies to
consider the seismic performance of 6-story wood frame structures. FPInnovations
performed time series analyses of several 6- and 4- story buildings subject to 20
representative earthquake records. The peak ground accelerations of these records were
scaled so that their average pseudo spectral velocity matched that of the uniform hazard
spectrum in the 2005 NBCC within the natural period range of 0.5s to 1.5s. Two different
computer models were used in the analysis. The conclusion was that 6- story buildings
designed with the proposed BC building code changes would behave similarly to the 4- story
buildings without exceeding the drift requirement of 2.5% of the inter-story height.
Concurrently, another independent study was performed considering time series computer
analyses of a stick model where each floor is treated as a lumped mass. Along with the lack
of redundancy in the model compared to a real building, the lateral resistance elements were
modeled with relatively crude hysteresis rules. The results of the study indicate that there is a
potential to develop soft story in the bottom two stories in case of earthquakes. Combined
with engineering judgments, recommendations were made and accepted by BC building
officials requiring the provision of additional shear wall units (+20%) in the lower two stories.
While this appears to be conservative, there are some inconsistencies with the design
approach. Furthermore, the provision of additional shear walls can change the natural period
and mode shape of the building resulting in different dynamic responses. It is unclear
whether additional studies have been performed to evaluate the seismic response of tall wood
frame structures with additional shear wall units. Finally, the phenomenon of soft story

UBC TEAM Test Report No: TEAM-2011-007 March 31, 2011
Page 9 of 21
development in terms of collapse of the building has not been fully considered in either
studies.
Although collapse prevention is one of the most important principles of earthquake resistant
design of structures, the phenomena of collapse however are complicated and difficult to
quantify. For example the load distribution and load sharing behaviour between various
lateral resistant elements in structures is not well understood especially in situation of high
nonlinearity under dynamic loading. Furthermore experimental studies of the structural
collapse phenomenon under seismic loading are rare because of the high cost involved.
Japan is perhaps one country that has collapsed many timber buildings in shake table tests
but details of the results with focus on collapse mechanism are typically not available.
In this project a method has been developed to quantify and study the collapse potential of
tall, mid-rise wood frame building. The method has been applied to quantify the collapse
potential of six story buildings under a maximum credible earthquake: the Great Hanshin
earthquake, or Kobe earthquake. This near fault earthquake with a return period of ~2500
years , occurred on Tuesday, January 17, 1995, at 05:46 JST (January 16 at 20:46 UTC) in
the southern part of Hyōgo Prefecture, Japan. This earthquake measured 6.8 on the moment
magnitude scale and Mj7.3 on JMA magnitude scale.
Time series responses of six storey buildings with various ratios of shear walls in the first and
second stories were obtained from a sophisticated computer model developed at UBC -
Wall3D. Stability analysis were further conducted using the computer predicted drift
response, lateral restoring forces, and inertia forces to establish collapse index to evaluate the
collapse potential of the structures. The results of this study can provide support and
guidance to building officials and design communities on the issue of designing to prevent
building collapses.

UBC TEAM Test Report No: TEAM-2011-007 March 31, 2011
Page 10 of 21
2 METHODS
Collapse of a timber frame structure is defined as the loss of ability of the structure to resist
gravity loads in the presence of dynamic load effect, such as earthquake load. As shown in
Figure 1, when horizontal displacement occurred in structure a corresponding moment (M1)
is induced from gravity load. A resistant moment (M2), provided from the lateral resistance
of structural members, is needed to meet the principle of equilibrium of moment in the
structure system.
Figure 1 Gravity moment and resistant moment
In this study, a Collapse Index (CI) was defined as the absolutely value of the ratio between
the resistant moment (M2) and the gravity moment (M1) at each time step in a dynamic
analysis. The value of CI, as a function of time t, can be obtained from time series dynamic
analysis.
( ) ( ) |
( )
( )|
Where
( )
( )

UBC TEAM Test Report No: TEAM-2011-007 March 31, 2011
Page 11 of 21
When the resistant moment (M2) could not meet the requirement of gravity moment (M1) to
certain level, due to the stiffness degradation of the structure member, the collapse of the
frame was triggered. At this time point, the range of collapse index (CI) was between 0 and
1.0.
( )
( )
( ) | ( )
( )|
The purpose of the work was to investigate the CI and its relationship with the potential of
collapse of the timber frame structure. The timber frame structure performance under seismic
effect was stimulated by Wall3D code based on finite element method (FEM), developed by
TEAM, UBC. CI was calculated from the data in Wall3D. Analysis on CI was carried out,
and discussion on its relationship with the floor drift limit and the potential of collapse was
included.
A six story timber frame building was studied under Kobe earthquake JMA station NS
component full scale, as shown in Figure 2. The damping of the structure was assumed to be
0.05, and only one direction of ground acceleration (NS) was considered.
Figure 2 Six story model in Wall3D

UBC TEAM Test Report No: TEAM-2011-007 March 31, 2011
Page 12 of 21
The ground acceleration input was shown in Figure 3. As shown in the Figure 3, there was
another identical input of ground acceleration after 25 second in order to hit the stiffness-
deteriorated timber building after the first input. This is an extremely unlikely event as the
original event was already classified as a maximum credible earthquake with 2500 year
return period. We chose to excite the "damaged" building with a second maximum credible
earthquake to check whether the concept of CI can indeed detect potential collapse.
Figure 3 The input ground acceleration in Wall3D
Four different types of six story building model were analyzed in Wall3D. The
configurations of these four models are shown in Table 1. Two of the four models were
analyzed to generate CI values in the time domain. The definitions of the first floor and
second floor are shown in the Figure 4.
Figure 4 Frame model and lumped mass model
UBC TEAM Test Report No: TEAM-2011-007 March 31, 2011
Page 13 of 21
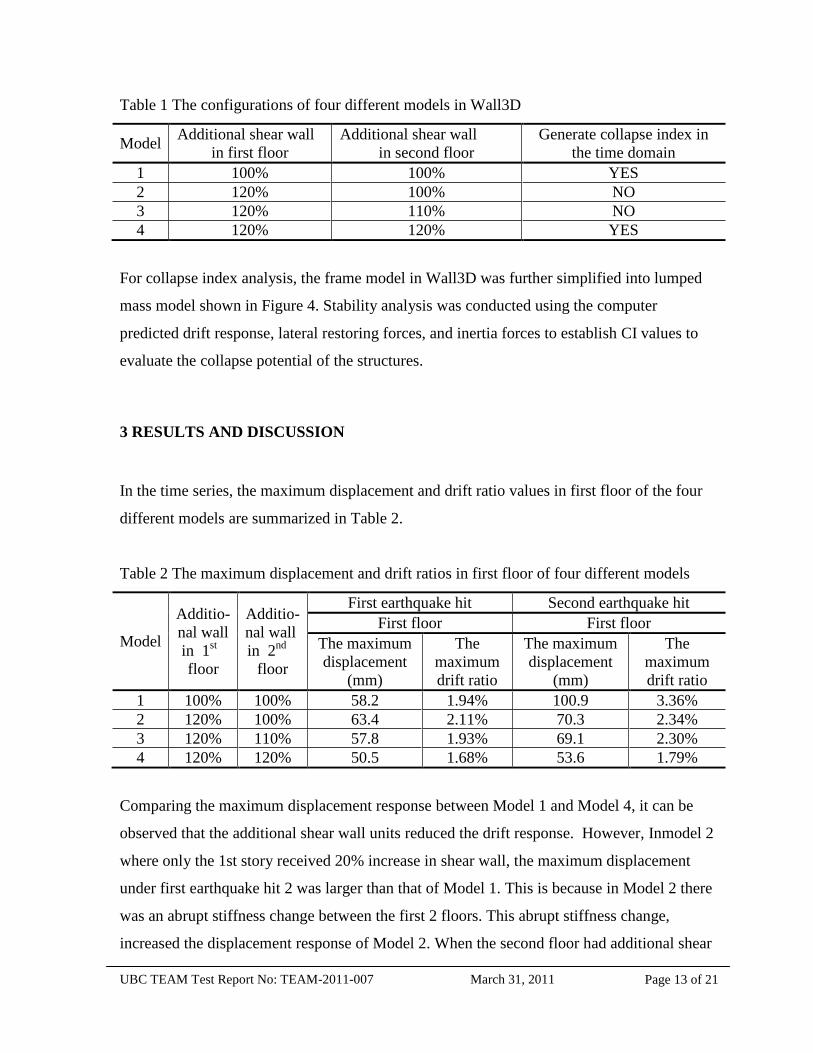
Table 1 The configurations of four different models in Wall3D
Model Additional shear wall
in first floor
Additional shear wall
in second floor
Generate collapse index in
the time domain
1 100% 100% YES
2 120% 100% NO
3 120% 110% NO
4 120% 120% YES
For collapse index analysis, the frame model in Wall3D was further simplified into lumped
mass model shown in Figure 4. Stability analysis was conducted using the computer
predicted drift response, lateral restoring forces, and inertia forces to establish CI values to
evaluate the collapse potential of the structures.
3 RESULTS AND DISCUSSION
In the time series, the maximum displacement and drift ratio values in first floor of the four
different models are summarized in Table 2.
Table 2 The maximum displacement and drift ratios in first floor of four different models
Model
Additio-
nal wall
in 1st
floor
Additio-
nal wall
in 2nd
floor
First earthquake hit Second earthquake hit
First floor First floor
The maximum
displacement
(mm)
The
maximum
drift ratio
The maximum
displacement
(mm)
The
maximum
drift ratio
1 100% 100% 58.2 1.94% 100.9 3.36%
2 120% 100% 63.4 2.11% 70.3 2.34%
3 120% 110% 57.8 1.93% 69.1 2.30%
4 120% 120% 50.5 1.68% 53.6 1.79%
Comparing the maximum displacement response between Model 1 and Model 4, it can be
observed that the additional shear wall units reduced the drift response. However, Inmodel 2
where only the 1st story received 20% increase in shear wall, the maximum displacement
under first earthquake hit 2 was larger than that of Model 1. This is because in Model 2 there
was an abrupt stiffness change between the first 2 floors. This abrupt stiffness change,
increased the displacement response of Model 2. When the second floor had additional shear

UBC TEAM Test Report No: TEAM-2011-007 March 31, 2011
Page 14 of 21
wall units (+10%) in Model 3, the maximum displacement under first earthquake hit was
reduced when compared with that of Model 1 and Model 2. Although the maximum
displacement of Model 3 and Model 1 under the first earthquake hit was slightly different,
the maximum displacement difference under the second earthquake between Model 3 and
Model 1 was obvious considering the additional shear wall units difference.
Illustrations of the displacement of the first story of four types of model are shown in Figure
5 to Figure 8.
Figure 5 The displacement of the first story in Model 1
Figure 6 The displacement of the first story in Model 2
Figure 7 The displacement of the first story in Model 3

UBC TEAM Test Report No: TEAM-2011-007 March 31, 2011
Page 15 of 21
Figure 8 The displacement of the first story in Model 4
The CI values in time series varied from 0 to 40000 as shown in Figure 9. In order to look
into the CI values between 0 and 1.8, a low pass filter was applied where values at one time
step larger than 1.8 were set to 1.8. The filtered CI results of Model 1 are shown in Figure 10.
Each point represented the CI value at that time step.
Figure 9 The CI values in Model 1
Figure 10 The filtered CI values in Model 1
The filtered CI results of Model 4 are shown in Figure 11. Each point represented the CI
value at that time step.

UBC TEAM Test Report No: TEAM-2011-007 March 31, 2011
Page 16 of 21
Figure 11 The filtered CI values in Model 4
In the analysis even under very low drifts, some CI values were observed to be between 0
and 1 which means that the structure failed the moment equilibrium condition. Physically
this is not possible. The problem is primarily due to the fact that Wall-3D is a pancake
model which ignores the vertical degree of freedom of the structure. When a moment
equilibrium check involving the gravity loads was imposed, there are possibilities that that
the moment equilibrium is violated even at small drift level. Therefore there is a need to
apply additional drift limit criterion in the CI analysis.
When applying the drift limit to certain value, for example 1.0%, it meant that when drift
ratio of the first story was under 1.0%, the collapse index at that time step was set to equal to
1.0. The application of the drift limit of 1.0% indicated that there was no potential of collapse
when the drift ratio of the first story was under 1.0%.
The results of the collapse index analysis of Model 1 with different drift limit applications
are shown in Figure 12 to Figure 16.
Figure 12 The collapse index after applied drift limit of 0.5% in Model 1

UBC TEAM Test Report No: TEAM-2011-007 March 31, 2011
Page 17 of 21
Figure 13 The collapse index after applied drift limit of 1.0% in Model 1
Figure 14 The collapse index after applied drift limit of 1.5% in Model 1
Figure 15 The collapse index after applied drift limit of 2.0% in Model 1

UBC TEAM Test Report No: TEAM-2011-007 March 31, 2011
Page 18 of 21
Figure 16 The collapse index after applied drift limit of 2.5% in Model 1
When the resistant moment (M2) cannot meet the requirement of gravity moment (M1) due to
the stiffness degradation of the structure members, the range of collapse index (CI) is
between 0 and 1.0. For Model 1, as the drift limit was increasing, the number of collapse
index points under 1.0 was becoming less. When the drift limit was 2.0% or 2.5%, there were
no collapse index points under 1.0 during the first earthquake hit; however, there were
collapse index points under 1.0 during the second earthquakes strike.
The results of the collapse index analysis of Model 4 with different drift limit applications
are shown in Figure 17 to Figure 20.
Figure 17 The collapse index after applied drift limit of 0.5% in Model 4

UBC TEAM Test Report No: TEAM-2011-007 March 31, 2011
Page 19 of 21
Figure 18 The collapse index after applied drift limit of 1.0% in Model 4
Figure 19 The collapse index after applied drift limit of 1.5% in Model 4
Figure 20 The collapse index after applied drift limit of 2.0% in Model 4
For Model 4, as the drift limit was increasing, the number of collapse index points under 1.0
was becoming less. When the drift limit was 2.0%, there were no collapse index points under
1.0 during the first and second earthquake hits.
UBC TEAM Test Report No: TEAM-2011-007 March 31, 2011
Page 20 of 21
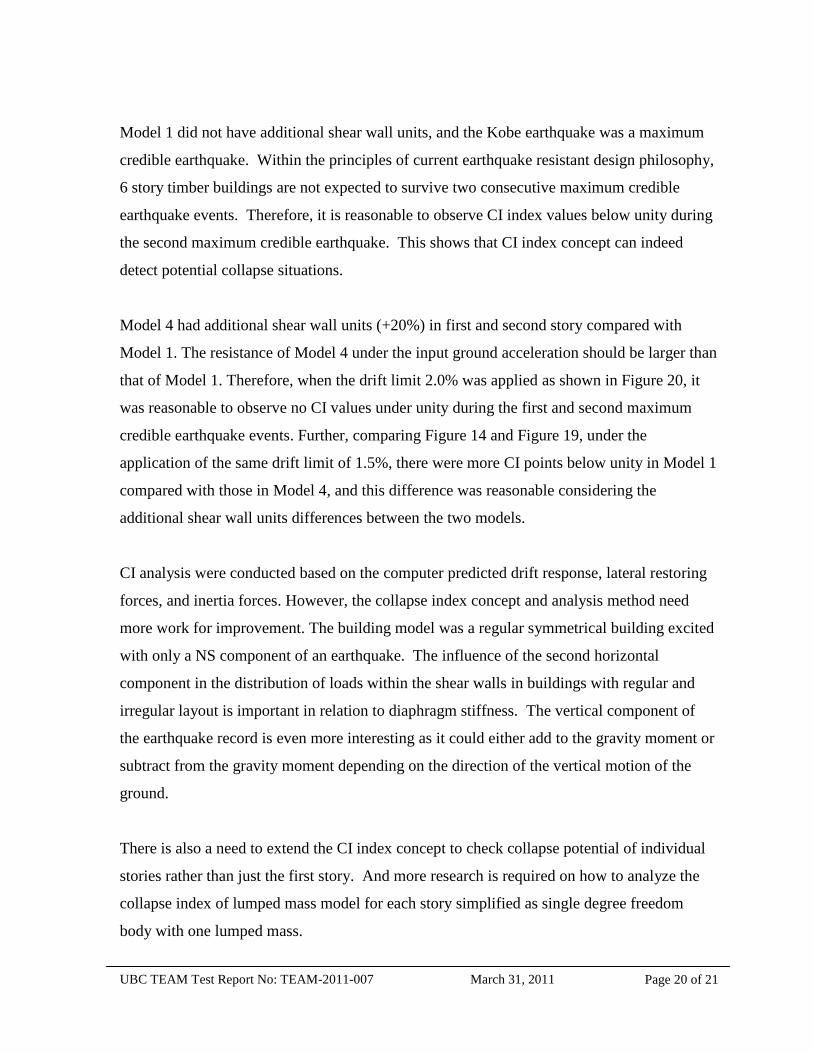
Model 1 did not have additional shear wall units, and the Kobe earthquake was a maximum
credible earthquake. Within the principles of current earthquake resistant design philosophy,
6 story timber buildings are not expected to survive two consecutive maximum credible
earthquake events. Therefore, it is reasonable to observe CI index values below unity during
the second maximum credible earthquake. This shows that CI index concept can indeed
detect potential collapse situations.
Model 4 had additional shear wall units (+20%) in first and second story compared with
Model 1. The resistance of Model 4 under the input ground acceleration should be larger than
that of Model 1. Therefore, when the drift limit 2.0% was applied as shown in Figure 20, it
was reasonable to observe no CI values under unity during the first and second maximum
credible earthquake events. Further, comparing Figure 14 and Figure 19, under the
application of the same drift limit of 1.5%, there were more CI points below unity in Model 1
compared with those in Model 4, and this difference was reasonable considering the
additional shear wall units differences between the two models.
CI analysis were conducted based on the computer predicted drift response, lateral restoring
forces, and inertia forces. However, the collapse index concept and analysis method need
more work for improvement. The building model was a regular symmetrical building excited
with only a NS component of an earthquake. The influence of the second horizontal
component in the distribution of loads within the shear walls in buildings with regular and
irregular layout is important in relation to diaphragm stiffness. The vertical component of
the earthquake record is even more interesting as it could either add to the gravity moment or
subtract from the gravity moment depending on the direction of the vertical motion of the
ground.
There is also a need to extend the CI index concept to check collapse potential of individual
stories rather than just the first story. And more research is required on how to analyze the
collapse index of lumped mass model for each story simplified as single degree freedom
body with one lumped mass.

UBC TEAM Test Report No: TEAM-2011-007 March 31, 2011
Page 21 of 21
Lastly, due to the uncertainty in the seismic acceleration, the variability of wood material and
connection, which affected the shear wall performance in timber structure, and the error
introduced from the FEM, reliability analysis method should be adopted for further analysis,
based on different responses of timber frame models from Wall3D and analysis of collapse
index under different seismic excitations.
4 CONCLUSIONS
Time series responses of six storey timber buildings with various ratios of shear walls in the
first and second stories were obtained from a sophisticated computer model developed at
UBC - Wall3D. The maximum displacement and drift ratio of different models were different,
considering the different additional shear wall units design. Collapse index concept and
analysis method were proposed. By establishing collapse index based on the computer
predicted response, evaluation of the collapse potential of the structures was performed based
on the collapse index in the time domain. The results of this study provides support and
guidance to building officials and design communities on the issue of designing to prevent
building collapses.
END