solar pv-diesel hybrid business planning checklist · pdf filethis study does in no sense...
TRANSCRIPT

Solar PV-diesel hybrid business planning checklist
For applications in local power distribution systems
in off-grid areas in the Philippines
February 2015
Imprint
This publication is by the Deutsche Gesellschaft für Internationale Zusammenarbeit (GIZ) GmbH through the Support to the Climate Change Commission in the Implementation of the National Framework Strategy on Climate Change and the National Climate Change Action Plan Project (SupportCCC), funded by the German Federal Ministry for the Environment, Nature Conservation, Building and Nuclear Safety (BMUB) under its International Climate Initiative. BMUB supports this initiative based on a decision of the German Parliament. For more information, see http://www.international-climate-initiative.com.
As a federally owned enterprise, GIZ supports the German Government in achieving its objectives in the field of international cooperation for sustainable development. Items from named contributors do not necessarily reflect the views of the publisher. Published by Deutsche Gesellschaft für Internationale Zusammenarbeit (GIZ) GmbH Registered offices Bonn and Eschborn, Germany T +49 228 44 60-0 (Bonn) T +49 61 96 79-0 (Eschborn) Editors Hendrik Meller, Ferdinand P. Larona
Authos Michael Wollny, Bruno Wilhelm – Integration Consulting Group
Layout
Frances Mara Mendoza
Responsible
Mr. Mario C. Marasigan Director Renewable Energy Management Bureau Department of Energy T: +63 2 840 2268 E: [email protected] Dr. Bernd-Markus Liss Principal Advisor Support to the Climate Change Commission in the Implementation of the National Framework Strategy on Climate Change (SupportCCC) Project Email: [email protected] 9th Floor PDCP Bank Centre, Rufino corner Leviste Streets, Salcedo Village, 1227 Makati City, Philippines T +63 2 6515100 F +63 2 7531441
Source and Copyrights © 2015 Deutsche Gesellschaft für Internationale Zusammenarbeit (GIZ) GmbH Place and date of publication Manila, Philippines February, 2015
Disclaimer This study does in no sense claim to be complete or error free. Neither GIZ nor the authors will accept any liability for any kind of damage or loss that might occur to anybody from referring to this study.

Contents
Abbreviations ....................................................................................................................... IV
List of Figures ........................................................................................................................ V
List of Tables ........................................................................................................................ VI
List of Formulas .................................................................................................................... VI
List of Photos ....................................................................................................................... VI
I. Introduction ................................................................................................................... 1
II. Background information ................................................................................................ 3
III. Business planning checklist ........................................................................................... 8
IV. How to develop a SPV-hybrid business case for off-grid power supply in the Philippines along the business planning checklist ....................................................... 13
1. Identification of potential business cases............................................................ 13
1.1 Solar resource potential .......................................................................... 14
1.2 Load profiles ........................................................................................... 15
1.3 Demand survey ....................................................................................... 17
1.4 Load and demand forecast ..................................................................... 18
1.5 Current power generation costs .............................................................. 19
1.6 Present state of power generation and distribution system ..................... 20
1.7 Socio‐economic assessment .................................................................. 20
2. Assessment of technical feasibility ..................................................................... 21
2.1 Selection of appropriate components ...................................................... 21
2.2 System design options ............................................................................ 25
2.3 Operation conditions ............................................................................... 32
3. Modelling of optimum system configuration ........................................................ 34
3.1 Economic optimization and sensitivity analysis ....................................... 36
3.2 Performance modeling ............................................................................ 37
3.3 Levelized costs of electricity (LCOE) ....................................................... 40
4. Bankable project documentation ........................................................................ 41
4.1 Investment costs ..................................................................................... 42
4.2 Operation and maintenance costs........................................................... 43
4.3 Cash flow ................................................................................................ 44
4.4 Internal rate of return .............................................................................. 45
5. Selection of appropriate market option ............................................................... 45
5.1 New Power Provider (NPP)..................................................................... 46
5.2 Qualified Third Party (QTP)..................................................................... 47
5.3 Joint Venture (JV) ................................................................................... 48
5.4 Incentives ............................................................................................... 48
V. References .................................................................................................................. 51
VI. Appendix - Fact Sheet - Carabao Island ...................................................................... 52
VII. Appendix - Fact Sheet - Isla Gigantes Norte................................................................ 57
VIII. Appendix - Fact Sheet - San Vicente, Palawan ........................................................... 62

Abbreviations
COE ............. Cost of electricity in PHP/kWh or USD/kWh CSP .............. Competitive selection process DOE ............. Department of Energy EC . ............... Electric Cooperative EPIRA .......... Electric Power Industry Reform Act ERC ............. Energy Regulatory Commission FCRR ........... Full Cost Recovery Rate FSC .............. Fuel Saver Controller GWh ............. Gigawatt hour IEC ............... International Energy Consultants HOMER ........ Hybrid Optimization of Multiple Energy Resources IRR ............... Implementing Rules and Regulations KW ............... Kilowatt kWh .............. Kilowatt hour KWp ............. Kilowatt peak LCOE ........... Levelized Cost of Electricity MEDP ........... Missionary Electrification Development Plan ME ................ Missionary Electrification MERALCO ... Manila Electric Company MHP ............. Micro hydro power MW ............... Megawatt MWh ............. Megawatt hour MWp ............. Megawatt peak NEA .............. National Electrification Administration NPC-SPUG .. National Power Corporation - Small Power Utilities Group NPP .............. New Power Producer NREL ........... National Renewable Energy Laboratory ORED ........... Office of Renewable Energy Development PALECO ....... Palawan Electric Cooperative, Inc. PHP .............. Philippine Peso PSA .............. Power Supply Agreement PSALM ......... Power Sector Assets and Liabilities Management Corporation PSP .............. Private Sector Participation QTP .............. Qualified Third Party RE ................ Renewable Energy RE Act .......... Renewable Energy Act of 2008 REMB ........... Renewable Energy Management Bureau RESC ........... Renewable Energy Service Contract SAGR ........... Subsidised/Approved Generation Rate SARR ........... Subsidized/Approved Retail Rate SFS .............. Solar Fuel Saver SGG ............. Small Grid Guidelines SPV .............. Solar photovoltaic

TCGR ........... True Cost Generation Rate UCME .......... Universal Charge for Missionary Electrification USD ............. US-Dollar /d .................. per day /h .................. per hour /y .................. per year /yr ................. per year
List of Figures
Figure 1: Structure of the SPV-hybrid business planning checklist ...................................... 2
Figure 2: Projected UCME requirements 2012-2021 ........................................................... 3
Figure 3: Overview on diesel generation, cost of generation, predictions for 2020 and selling rates in NPC-SPUG areas ......................................................................... 4
Figure 4: Solar potential in the Philippines (Source: NREL 2000) ...................................... 14
Figure 5: Typically daily load profile in rural areas ............................................................. 15
Figure 6: Daily load profile in a SPUG area ....................................................................... 16
Figure 7: Average daily load curve, solar output, battery and genset use .......................... 16
Figure 8: Demand side management (DSM) techniques ................................................... 17
Figure 9: Different module technologies and the required surface (Source: SMA) ............. 22
Figure 10: PV inverter operation diagram ............................................................................ 23
Figure 11: Battery inverter operation diagram ..................................................................... 23
Figure 12: Diesel generator ................................................................................................. 24
Figure 13: Intelligent control unit (solar fuel saver) operation diagram (Source: Juwi) ......... 25
Figure 14: PV diesel hybridization with up to 20% penetration rate of PV ............................ 26
Figure 15: Intelligent and fast interfacing between load, genset and PV inverter, Fuel Save Controller (Source: SMA) .......................................................................... 27
Figure 16: Interaction between the diesel generator and the solar power output as regulated by the SFS controller (Source: JUWI) ................................................. 27
Figure 17: PV-Diesel hybridization with storage and DC-coupled PV .................................. 29
Figure 18: PV-Diesel hybridization with storage and AC-coupled PV .................................. 29
Figure 19: PV-Diesel hybridization solution with storage ..................................................... 30
Figure 20: RE hybrid power solution with storage from SIEMENS ....................................... 31
Figure 21: PV-Diesel hybrid power plant with storage from SMA......................................... 31
Figure 22: Increase in fuel consumption for genets run at low load factor ........................... 32
Figure 23: Lifespan according to depth of discharge (for 2V cells OPzS and OPzV) ........... 33
Figure 24: Start-up window of HOMER ............................................................................... 36
Figure 25: Sensitivity results from HOMER ......................................................................... 37
Figure 26: Start-up window of PV hybrid web design tool (SMA) ......................................... 38
Figure 27: Comparing the levelized cost of various electrification option (Source: Norplan 2012) .................................................................................................... 40

Figure 28: PV generation cost today and trends in diesel generation costs ......................... 41
Figure 29: Financially attractive area for PV diesel operation in remote areas (Source: SMA) .................................................................................................................. 42
Figure 30: Typical cost structure of a PV / diesel hybrid system .......................................... 43
Figure 31: Options for RE projects in rural and missionary areas ........................................ 46
List of Tables
Table 1: Institutions and their roles regarding Missionary Electrification (ME), Private Sector Participation (PSP) and Renewable Energy (RE) ...................................... 7
Table 2: Business planning checklist ................................................................................... 8
Table 3: Advantages and constraints of storage technologies (Source: IRENA) ................ 24
Table 4: Summary of commercially available storage technologies (Source: IRENA) ........ 34
Table 5: Sensitivity analysis for different hybrid configurations (Source: ARE, Brussels) ............................................................................................................ 40
Table 6: O&M costs of Solar PV without storage technology (Source: EPRC) ................... 44
List of Formulas
Formula 1: Formula for cash generation-based incentive ..................................................... 49
List of Photos
Photo 1: Local power distribution and generation facilities on Carabao Island ................... 20

I. Introduction
Primarily based on diesel fuels, electricity generation in the Philippine off-grid areas is foremost an expensive undertaking. With true cost generation rates (TCGR) of diesel generators many times well over 20 pesos per kWh, the price for often poor and interrupting power supply is far higher than the average generation rate for on-grid electricity (5-6 PHP/kWh). Considering the high and continuously increasing cost of diesel-based electricity production, renewable energies (RE) represent an economic alternative for power supply in off-grid areas today and in the future.
RE investors and developers, when preparing investments in off-grid power supply in the Philippines are facing the challenge of improving availability and reliability of power supply, while reducing the overall cost of power generation by means of applying climate-friendly technologies. The economic rationale of introducing RE in off-grid power supply is among other things to help reducing the universal charge for missionary electrification (UCME), which is paid through a levy by grid-connected electricity consumers in the Philippines, and which has to cover the difference between the true cost of generation (TCGR) of NPC-SPUG and the subsidised approved generation rate (SAGR) charged to power consumers in off-grid areas through the local distribution networks.
Triggering investments in renewable energies in NPC-SPUG areas needs technically sound hybridization schemes and commercially viable, replicable business models. Therefore, the Department of Energy (DOE), the Climate Change Commission (CCC) and the Deutsche Gesellschaft für Internationale Zusammenarbeit (GIZ) as part of their joint “SupportCCC” project funded by the German Federal Environment Ministry under its International Climate Initiative developed the Solar PV-diesel-hybrid business-planning checklist. It is meant to provide a systematic approach on how to asses and develop PV diesel hybrid applications. The aim is to guide interested RE developers and energy sector stakeholders through the planning process of technically sound and commercially viable hybrid schemes.
Before entering into the development of a business case for investments SPV-hybrid systems for power generation in off-grid areas, potential investors should be aware of the existing market conditions of power supply in off-grid areas in the Philippines (chapter II.a), the legal framework conditions for investments in this sector (chapter II.b), and the roles of involved government authorities in the complex licensing and permitting procedures (chapter II.c).
On the basis of this information, the here presented business planning checklist (section III) aims at providing guidance to potential project developers through the process of developing and designing an optimum business case of SPV-hybrid applications for off-grid power supply in the Philippines. It is structured in 5 major steps.
1) Identification of potential business cases 2) Assessment of technical feasibility 3) Modelling of optimum systems designs 4) Bankable project documentation

2
5) Selection of appropriate market option
Each of these 5 steps is subdivided into a number of subsequent tasks as illustrated in the following chart.
Planning and implementation of SPV-diesel hybrid sy stems
1. Identification of potential business cases
1.1 Solar resource potentials 1.2 Load profiles 1.3 Demand survey 1.4 Load and demand forecast 1.5 Current power generation costs 1.6 Present state of power generation and distribution system 1.7 Socio-economic assessment
2. Assessment of technical feasibility
2.1 Selection of appropriate components 2.2 System design options 2.3 Operation conditions
3. Modelling of optimum system configuration
3.1 Economic optimization and sensitivity analysis 3.2 Performance modelling 3.3 Levelized cost of electricity (LCOE)
4. Bankable project documentation
4.1 Investment costs 4.2 Operation and maintenance costs 4.3 Cash flow 4.4 Internal rate of return
5. Selection of appropriate market option
5.1 New Power Provider (NPP)
5.2 Qualified Third Party (QTP) 5.3 Joint Venture (JV) 5.4 Incentives
Figure 1: Structure of the SPV-hybrid business planning checklist
A comprehensive overview of the checklist is presented in section III. More detailed instructions on how to develop an SPV-hybrid business cases along this checklist are given in section IV.

3
II. Background information
Investments in SPV-hybrid power generation systems for power supply to off-grid areas in the Philippines should always be based on a sound analysis of:
� Market conditions in the Philippine off-grid sector
� Legal and institutional frameworks for private investments in the sector
� Relevant government authorities and their roles and responsibilities
An introductory overview of these fields is given in the following paragraphs.
a) Market conditions in the Philippine off-grid sector
In the Philippines, 30% of rural households are situated in off-grid areas, which are not connected to the national transmission grid. Power supply in these off-grid areas is mandated to electric cooperativces (EC) operating local distribution grids. Power is usually supplied from diesel generators operated by the Small Power Utilities Group of the National Power Corporation (NPC-SPUG).
Figure 2: Projected UCME requirements 2012-2021

4
Figure 2 above presents the NPC-SPUG projection of the expected increase of the need for UCME subsidies for the next 7 years. The economic rationale of mobilizing private investments for RE-hybrid power generation applications is thus mainly to reduce the need for subsidies from the UCME for power supplied to off-grid areas.
As of May 2014, 296 off-grid areas being served by NPC-SPUG as part of its mandate to implement missionary electrification (ME). Diesel generators operated by NPC-SPUG today are often old and low in power generation efficiency. Figure 3 gives examples of diesel generation costs in Philippine off-grid areas. It shows that the true cost of generation (TCGR) are much higher than effective selling rates, and are expected to increase dramatically until 2020.
Rounded to MWh; ** rounded to Th PHP; *** rounded to two decimal figures.,
Source: http://www.spug.ph/MEP2012-2021.asp (May 9, 2013).
Figure 3: Overview on diesel generation, cost of generation, predictions for 2020 and electricity rates in NPC-SPUG areas
Those areas within an EC's franchise, which are declared unviable by this EC, are usually not connected to any power distributioin grid yet. Power supply, if any, is in these areas based on privately owned and operated diesel generators.
Only 15 off-grid areas are so far served by the private sector represented by New Power Producers (NPPs) or Qualified Third Parties (QTPs), depending on whether a service area is served by an EC through a local distribution network (NPP), or whether this area is declared

5
unviable by the lcoal EC. The major differences between these two models for private sector participation in off-grid power supply are explained more in detail in chapter IV.5.
True current true cost of generation (TCGR) in NPC-SPUG diesel generator plants are typically in the range from 13 to 28 PHP/kWh. The subsidized approved generation rates (SAGR), which is billed by the ECs to their customers, amount to only 5-6 PHP/kWh today. The difference has to be sourced from the universal charge for missionary electrification (UCME), which is levied to all power consumers in the country.
b) Legal and institutional frameworks for private investments in the sector
Rural electrification is a government’s priority because it is seen as a means to spur countryside socio-economic growth. In the RE Act, rural electrification is defined as the delivery of basic electricity services, consisting of power generation, sub-transmission, and/or extension of associated power delivery system that would bring about important social and economic benefits to the countryside.
RE Act specifies:
� NPC-SPUG and/or QTPs in off-grid areas shall source a minimum percentage of total annual generation from available RE resources. The definition of the minimum percentage of RE is still pending.
� Eligible RE generation in off-grid and missionary areas shall be eligible for the provision of RE Certificates.
� RE developers in off-grid and missionary areas shall be entitled to specific incentives.
� Thus, part of rural electrification is the servicing of the unviable areas and the missionary electrification areas. The Electric Power Industry Reform Act of 2001 (EPIRA) and likewise the ERC define unviable area as a geographical area within the franchise area of a Distribution Utility (DU) where immediate extension of distribution line is not feasible.
It shall also include those areas that are currently served by the DUs but are deemed unviable and subsequently declared by the DOE as open for participation by qualified third parties (QTP).
RE Act and EPIRA define Off-Grid systems as:
� Electrical systems not connected to the wires and related facilities of the transmission lines, distribution lines, substations, and related facilities for the purpose of conveyance of bulk power on the grid of the Philippines (not feeding into the three main grids of Luzon, Visayas and Mindanao).
These off-grid areas are served by NPC-SPUG’s missionary generation (MG) program, while in most areas the distribution is managed by the electric cooperatives.

6
For off-grid RE applications, the RE Act specifies the supervisory and oversight functions of the National Electrification Administration (NEA) to both stock and non-stock electric cooperatives. The law grants new power to electric cooperatives to improve their corporate fate.
The NEA recently created the Office of Renewable Energy Development (ORED) to assist electric cooperatives that aim to venture in power generation using renewable energy resources.
The Small Grid Guidelines (SGG) establish the basic rules, procedures, requirements and standards that govern the operation, maintenance and development of the small grid systems that are not connected to the National Grid. The SGG ensures the safe, reliable and efficient operation of the small grid systems in the Philippines.
Electric cooperatives are empowered:
� To participate in a bid on an existing NPC-SUG generating facility.
� To enter into business cooperation models such as a joint venture.
� To become QTPs, as long as they have created an affiliate or subsidiary that has a complete business, operational and functional separation.
The SGG defines the technical aspects of the working relationship between and among NPC-SPUG, generators, distributors and all users of the high voltage and medium voltage lines outside the national grid. NPC-SPUG, generators and distributors must deliver electric energy to the users at acceptable levels of power quality and customer service performance. The SGG has no mention of renewable energy as a power source in small grid areas.
c) Relevant government authorities and their roles and responsibilities
The private sector program in delivery of services in the off-grid areas stemmed from the reform of institutional arrangements in the electricity sector through the EPIRA and RE Laws. An
overview of the resulting institutions and their roles is given in the Table 1.1
1 Rural Electrification with PV Hybrid Systems, Overview and recommendations for further deployment, Report IEA-PVPS T9-13,
CLUB-ER Thematic Paper, July 2013

7
Table 1: Institutions and their roles regarding Missionary Electrification (ME), Private Sector Participation (PSP) and Renewable Energy (RE)
National Power Corporation – Small Power Utilities Group (NPC-SPUG)
In the event that no QTP qualifies to provide electricity service to a declared unviable area, ERC Resolution No. 22, Series of 2006 mandates NPC-SPUG to perform the functions of a QTP.

8
Distribution Utilities/Electric Cooperatives (EC)
Electric cooperatives like PALECO may participate in a bid on an existing NPC-SUG generating facility and their qualified bid shall be given preference in case of a tie. Further, a cooperative can enter into business cooperation models such as a joint venture, if it creates a subsidiary.
In the ERC QTP Guidelines, ERC has allowed the DUs to become QTPs as long as the DUs create a subsidiary that has a complete business, operational and functional separation. The NEA recently created the Office of Renewable Energy Development (ORED) to assist electric cooperatives that want to venture in power generation using RE resources.
III. Business planning checklist
Based on the structure presented in Figure 1 on page 2, the following checklists elaborates for the major parameters related to the development of technically feasible and economically viable SPV-hybrid business cases for power generation in off-grid areas. For each of these parameters, this checklist presents general specifications and critical issues/recommendations, which should be taken into consideration.
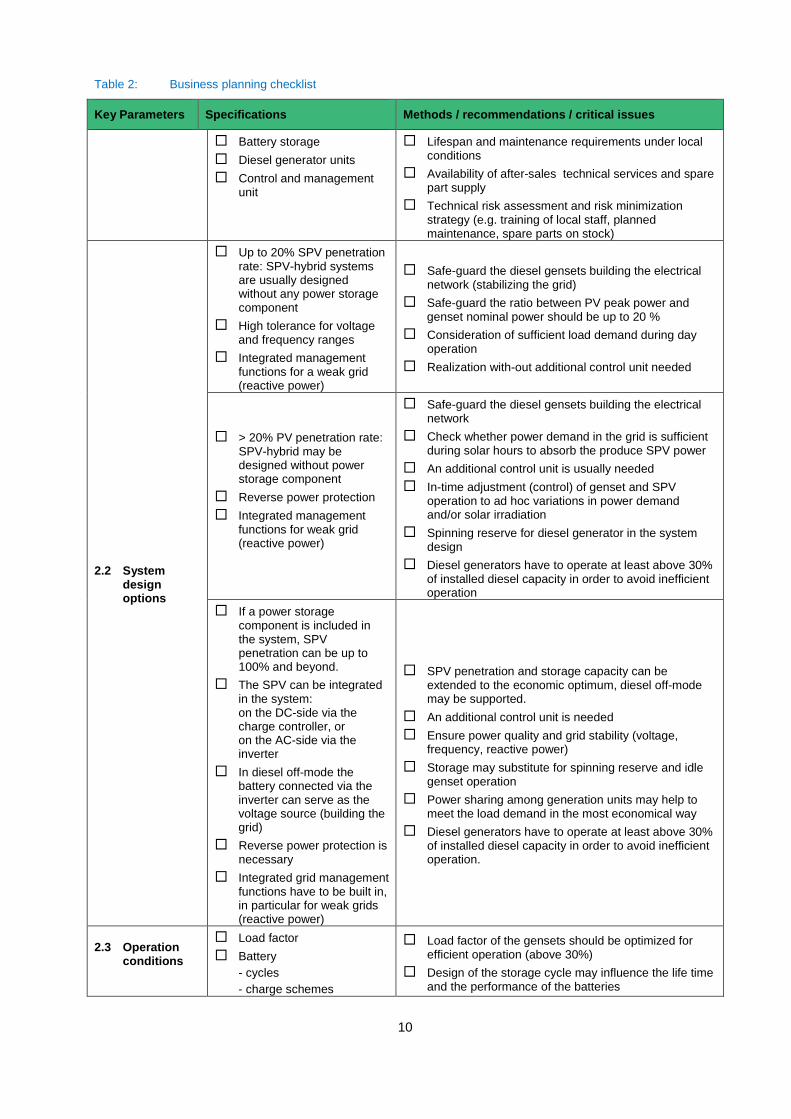
Table 2: Business planning checklist
Key Parameters Specifications Methods / recommendations / critical issues
1. Identification of potential business cases
1.1 Solar resource potential
� Annual solar irradiation per sqm
� Monthly solar irradiation per sqm
� Daily solar irradiation per sqm
� Under optimum conditions (0° South, 10-15° tilt angle)
� Acquisition of satellite-based solar irradiation data (e.g. Meteonorm or NASA) referring to a close location
� Collection and evaluation of data from neighboring weather stations, if available
If significant solar irradiation data are not available, own measurements should be carried out.
1.2 Load profiles
� Daily load profiles
� Daily peak load
� Daily base load
� Daily energy consumption
� Seasonal/weekly/daily variations
� Match the daily load curve of the grid and the daily profile of PV power generation
� Load profiles must cover 24/7 operation (legal requuirement on NPPs and QTPs)
� Average daily energy demand in the grid (kWh)
� Time and value of daily/weekly/monthly/annual peak load (kW)
� Average and maximum power demand (kW) during solar irradiation hours
� Power demand during the night hours (kW)
1.3 Demand survey
� Current total energy demand of all consumer groups
� Spatial distribution of consumers
� Demand side management potentials - load shifting
� Load curves and power demand of specific consumer groups (e.g. private, productive, commercial, administrative, public services, tourism)
� Demand side management potentials
� Consumer-group specific questionnaires
� Personal interviews

9
Table 2: Business planning checklist
Key Parameters Specifications Methods / recommendations / critical issues
- peak shaving - energy savings
1.4 Load and demand forecast
� Number of households connected
� Number of households not yet connected
� Classification of typical load profiles of specific consumers / consumer groups
� Forecast scenarios on future electricity and peak demand development provided e.g. by DOE, NPC-SPUG or the local DU
� Energy master plans or future development plans compiled by local government units (LGU)
� Verification of up-coming productive uses of energy
� Projections on yearly growth of population and income
� Connection rates in the grid-connected area and in neighboring not yet connected areas
� Personal interviews
1.5 Current power generation cost
� True cost of generation rate (TCGR)
� Subsidised approved generation rate (SAGR)
� Daily service hours
� Fuel cost on site
� Connection rates
� Potential cost drivers are: - Increase of connection rate - Increase of daily service hours - Changes of consumer behavior - Development of productive activities and uses - Increasing fuel cost and demand - De-rating of worn-out diesel gensets - Replacement of outdated diesel gensets
1.6 Present state of power generation and distribution system
� Output power of the existing diesel generator plant
� Fuel consumption
� Remaining lifespan of installed diesel generators
� Retrofit efforts required
� Operating hours of the gensets Grid voltage, current and frequency
� Overhead lines and connection points
� Grid infrastructure design
� Quality inspection of the existing power generation infrastructure
� Estimation of retrofitting efforts and costs
� Execution of quality measurements for voltage, frequency and power quality fare-out connection points
� Examination of grid transformer technical specification and lifespan
� Quality inspection of overhead lines and connection points
� Identification of suitable land/roof space to build up a PV solar power system
1.7 Socio-economic assessment
� Population
� Income and ability to pay
� Willingness to pay
� Property ownership
� Livelihood sources
� Number of households with members working out of town/overseas
� Relevant information for identification of different user groups: - Size of family, education level, occupation - Income and expenditures - Sex, ethnics and religions - Age groups, gender issues
� Current energy consumption and expenditures
� Expectation and impacts of the introduction of electricity supply (energy consumption, energy mix, productive use of electricity)
� Acceptance of the proposed hybrid system
� Ability and willingness to pay for energy
� Consumers' preferred billing and collection methods
� Ownership and management of existing diesel generators and/or the proposed new RE-hybrid system
2. Assessment of technical feasibility
2.1 Selection of appropriate components
� PV modules
� PV inverter
� Battery inverter
� Quality and operation behavior of the components
� Ability to operate in harsh environmental conditions in remote areas
10
Table 2: Business planning checklist
Key Parameters Specifications Methods / recommendations / critical issues
� Battery storage
� Diesel generator units
� Control and management unit
� Lifespan and maintenance requirements under local conditions
� Availability of after-sales technical services and spare part supply
� Technical risk assessment and risk minimization strategy (e.g. training of local staff, planned maintenance, spare parts on stock)
2.2 System design options
� Up to 20% SPV penetration rate: SPV-hybrid systems are usually designed without any power storage component
� High tolerance for voltage and frequency ranges
� Integrated management functions for a weak grid (reactive power)
� Safe-guard the diesel gensets building the electrical network (stabilizing the grid)
� Safe-guard the ratio between PV peak power and genset nominal power should be up to 20 %
� Consideration of sufficient load demand during day operation
� Realization with-out additional control unit needed
� > 20% PV penetration rate: SPV-hybrid may be designed without power storage component
� Reverse power protection
� Integrated management functions for weak grid (reactive power)
� Safe-guard the diesel gensets building the electrical network
� Check whether power demand in the grid is sufficient during solar hours to absorb the produce SPV power
� An additional control unit is usually needed
� In-time adjustment (control) of genset and SPV operation to ad hoc variations in power demand and/or solar irradiation
� Spinning reserve for diesel generator in the system design
� Diesel generators have to operate at least above 30% of installed diesel capacity in order to avoid inefficient operation
� If a power storage component is included in the system, SPV penetration can be up to 100% and beyond.
� The SPV can be integrated in the system: on the DC-side via the charge controller, or on the AC-side via the inverter
� In diesel off-mode the battery connected via the inverter can serve as the voltage source (building the grid)
� Reverse power protection is necessary
� Integrated grid management functions have to be built in, in particular for weak grids (reactive power)
� SPV penetration and storage capacity can be extended to the economic optimum, diesel off-mode may be supported.
� An additional control unit is needed
� Ensure power quality and grid stability (voltage, frequency, reactive power)
� Storage may substitute for spinning reserve and idle genset operation
� Power sharing among generation units may help to meet the load demand in the most economical way
� Diesel generators have to operate at least above 30% of installed diesel capacity in order to avoid inefficient operation.
2.3 Operation conditions
� Load factor
� Battery - cycles - charge schemes
� Load factor of the gensets should be optimized for efficient operation (above 30%)
� Design of the storage cycle may influence the life time and the performance of the batteries

11
Table 2: Business planning checklist
Key Parameters Specifications Methods / recommendations / critical issues
- lifespan - dept of discharge
� Battery inverter - system manager
� Batteries (lead acid) must be protected against deep discharge and must not stay in low state of charge over longer periods.
� Temperature restrictions for lead acid batteries must be taken into consideration.
� Inverters or charge controllers must be able to manage the battery, including regular equalization and float charge to maximize storage lifespan
3. Modelling of optimum system designs
3.1 Economic optimization and sensitivity analysis
Modelling input data (HOMER)
� System structure configuration
� PV Module
� PV Inverter
� Charge Controller
� Storage technology
� Diesel generator
� Load profile
� Load factor
� Solar irradiation
� Project lifetime
� Cost of components
� Fuel cost
� O&M costs
� Lifespan of components
� Interest rate
� Chronological simulation and optimization of a project over the entire project life cycle
� Modelling technical and economic options
� Comparison of cost and feasibility of different configurations
� Sensitivity analysis of levelized cost of electricity (LCOE)
� Sensitivity analysis of uncertain factor such as fuel prices, lifespan of components, O&M costs, interest rates
3.2 Performance modelling
PV-hybrid webtool input data (SMA)
� PV Module
� PV Inverter
� Diesel generator
� Load profile
� Load factor
� Solar irradiation
� Cable loses
� Project lifetime
� PV investment costs
� Fuel cost
� OpEx PV as a percentage of CapEx/year
� Equity ratio
� Debt ratio
� Interest rate
� Collection and evaluation of meteorological input data for the project location, or to another location close by
� Modelling technical and economic options
� Sensitivity analysis of uncertain factor such as fuel prices, PV investment, O&M costs, interest rates, debt ratio
� Assessment of the return of investment
� Determination of levelized cost of electricity (LCOE) with sensitivity analysis
3.3 Levelized costs of electricity (LCOE)
� All cost over lifetime
� Initial investment
� Operations and maintenance
� Cost of fuel
� Estimation of true cost of generation rate per kWh for the entire hybrid system

12
Table 2: Business planning checklist
Key Parameters Specifications Methods / recommendations / critical issues
� Cost of capital
4. Bankable project documentation
4.1 Investment costs
� PV-System
� Retrofitting of diesel generator
� New diesel generator
� Balance of system (BOS)
� Grid infrastructure
� Storage technology
� Intelligent control unit
� Monitoring
� Include storage replacement during project lifetime in the calculations
� Due to small project volume and uncertain framework conditions transaction cost may be relatively high
� Fiscal incentives should be taken into consideration for the assessment of economic feasbility, probable delays in availing these incentives should be taken into consideration
� Deviations from the optimum technical systems design may be reasonble if they help treduce investment cost and resulting LCOE substantially
� Establishing SPV installations on commercial land or on existing roofs may help avoid delays in project development due to land-use or IP issues.
4.2 Operation and maintenance costs
� Labor costs
� Travel expenses
� Spare parts
� Repair costs
� Transport costs
� Communication costs
� Head office staff support costs
� Ensure sufficient cash flow over the entire project life cycle
� Involve local capacities in O&M
� Employ and train local staff for the operation of all components of the SPV-hybrid plant
� Establish lean and efficient billing and collection system
� Ensure a realistic assessment of O&M cost for SPV arrays, inverters, chargers and storage, and avoid overestimations of the relevant cost.
� Implement an adapted planned maintenance concept in order to avoid system outages and to reduce unplanned repair cost
4.3 Cash flow
� Investment cost
� Transaction cost
� Personnel cost
� Administration cost
� Billing and collection cost
� Planned maintenance cost
� Repair cost
� Cost for replacements,
� Fuel cost
� Tax, levies, fees etc.
� Revenues from power sales (SAGR)
� Transmission fees (QTPs), UCME, generation-based cash incentive
� Cash effects of increasing demand (forecasts)
� Cash effects of inflation and in particular of the increase of fuel cost
� Expenses for the continuous upgrade and extension of the local grid
� Comprehensive cash flow analysis has to include all foreseeable cash in- and outflows over the project lifetime
� Economic risk assessment and risk mitigation strategy is requested in order being able to avoid illiquidity and other disturbance of the cash flow

13
Table 2: Business planning checklist
Key Parameters Specifications Methods / recommendations / critical issues
4.4 Internal rate of return
� Profitability of the investment
� Pay back time
� Preparation of financial concept with sufficient high internal rate of return
� Elaborate a comprehensive risk analysis and risk mitigation strategy, to avoid illiquidity and all potential disturbances of the cash flow
5. Selection of appropriate market option
5.1 New Power Producer (NPP)
� Provide services (generation) in NPC-SPUG areas
� Register with the DOE as a RE developer
� Qualify as New Power Producer (NPP)
� For foreign companies - selection of local partner (which will own majority or 60 % of the paartnership)
� Determination of an appropriate range of NPP services
� Enter into appropriate contractual setting with the EC/DU and NPC-SPUG (including UCME)
� Develop an appropriate investment strategy
5.2 Qualified Third Party (QTP)
� Provide services (generation and distribution) in areas declared unviable or remote by an EC
� Register with the DOE as a RE developer
� Qualify as Qualified Third Party (QTP)
� For foreign companies - selection of local partner (which will own 60 % of the partnership)
� Develop an integrated business model for both power generation and distribution, including establishment of the grid
� Determinate an appropriate investment strategy
� Enter into appropriate contractual setting with the EC/DU and NPC-SPUG (including cash incentive and/or UCME)
5.3 Joint Venture (JV)
� JV agreement between private investor and the Electric cooperatives (EC)
� The JV has to act as a private NPP or QTP
� Willingness of EC to enter into JV with the private sector is the critical issue
5.4 Incentives
� Fiscal and non-fiscal incentives from RE Law
� Cash generation-based incentive
� UCME
� Registration with the DOE and enter into an RE service contract (RESC) with the DOE in order to qualify for the availing of fiscal and other incentives
� Enter into contractual setting with the NPC-SPUG for availing of the cash incentive and/or UCME)
IV. How to develop a SPV-hybrid business case for o ff-grid power supply in the Philippines along the business planni ng checklist
1. Identification of potential business cases
Special emphasis should be given on identifying and using key economic and technical parameters that are needed to design feasible business cases for PV hybrid power plants. This includes, solar resource, power needs, socio-economic conditions and technical parameters.

14
1.1 Solar resource potential
The Philippines' position just above the equator provides vast potential for solar energy applications. The daily solar irradiation varies between 4.5 and 5.5 kWh/m²*day (see Figure 4). The average value for the country is 5.1 kWh/m²*day.
Figure 4: Solar potential in the Philippines (Source: NREL 2000)

15
The solar data can also be collected from diffent databases available on internet platforms.
The following methods are recommended:
� Acquisition of satellite-based solar irradiation data (e.g. Meteonorm or NASA) referring to a close location
� Collection and evaluation of data from neighboring weather stations, if available
If significant solar irradiation data are not available, measurements should to be carried out.
1.2 Load profiles
Reliable information on the local load curve is essential, because the load curve determines in most cases he design of the SPV-diesel hybrid system in off-grid applications.
Compared to interconnected national grids, local distribution grids (mini-grids) have a relatively small number of customers, often with similar consumer behaviour. This means that the concurrency of demand may be high and the load profile highly volatile with steep peaks in demand. A typical mini-grid load curve is presented in Figure 5, with some productive use of power during the day, a peak from lighting and TV during the evening hours, and little demand during ealry morning hours.
Figure 5: Typically daily load profile in rural areas
Different to the above presented schematic overview, in many local distribution grids in the Philippines, there is no constant base load. Figure 6 shows the daily load profile for one of the NPC-SPUG areas in the Philiipines, where the diesel generators operate 4 am to 7 am in the morning and 2 pm to 9 pm at night.

16
Figure 6: Daily load profile in a SPUG area
Figure 7 shows an exempalry load profile of a mini-grid operating in 24/7 mode. SPV power can in this situation substitute for power generated in diesel gensets. If there is a surplus power production from the SPV plant (mismatch) during the day, this can be used to charge a battery and to use the stored power during night hours. With sufficient storage capacity, the operation of a diesel genset can be reduced or even stopped during night hours.
Figure 7: Average daily load curve, solar output, battery and genset use
When designing a hybrid system, more data on the load profile are required than for a simple genset-based power plant.
The following methods are recommended:
� Match the daily load curve of the grid and the daily profile of PV power generation
� Load profiles must cover 24/7 operation (legal requirements on NPPs and QTPs)
� Average daily energy demand in the grid (kWh)
� Time and value of daily/weekly/monthly/annual peak load (kW)
� Average and maximum power demand (kW) during solar irradiation hours

17
� Power demand during the night hours (kW)
1.3 Demand survey
If there is no reliable information on the actual local load profile, a demand survey should be carried out.
To ensure that the achieved data is representative, the demand and load survey should inlcude at least 30% of the households selected at random and all public facilities connected to the current grid. The energy demand of each consumer group has to be classified according to the amount and type of energy used. The spatial distribution of consumers is of interest for the
mapping of loads ‐ whether centralized, semi‐centralized, or distributed.
A proper demand survey will provide a sound basis also for demand side management (DSM, see Figure 8). Load control and demand side management can contribute to a better rate of utilization of the available power station capacity. This in turn improves the efficiency of the overall plant and thus, limits the need for an oversized power station capacity and stabilizes electricity costs and prices. Sound demand side management may contribute in different ways to a reduction of total power demand and to the reduction of peak loads:
� Peak Shaving refers to the reduction of utility loads during peak demand periods. This can delay the need for additional generation capacity. The net effect is a reduction in both peak demand and total energy consumption. Peak clipping can be achieved by direct control of customers’ appliances
Figure 8: Demand side management (DSM) techniques
� Conservation refers to reduction in consumption by consumers. This leads to a net reduction in both demand and total energy consumption. Strategic conservation can be implemented by motivating customers to use more energy-efficient appliances. The promotion of energy efficient appliances and customer information regarding rational use of energy should be a part of any mini-grid project.

18
� Load Shifting involves shifting loads from on-peak to off-peak periods. The net effect is a decrease in peak demand, but not a change in total energy consumption. - See more at: http://www.powerwise.gov.ae/en/research/programmes-projects/demand-side-management.
The following methods are recommended:
� Load curves and power demand of specific consumer groups (e.g. private, productive, commercial, administrative, public services, tourism)
� Demand side management potentials
� Consumer-group specific questionnaires
� Personal interviews
1.4 Load and demand forecast
Knowing the characteristics of demand and supply and their future development is vital in planning, optimization and operation of technically and economically sustainable RE-hybrid off-grid systems. One of the main risks for mini-grid systems is an unplanned increase of the load. The forecast of the power demand should therefore be done as accurately as possible. A poor forecast readily leads to designing inadequate systems that will face early obsolescence. Normally, there are two different types of demand forecast scenarios available:
� Forecast scenarios on future peak load
� Forecast scenario on future electricity demand
Analyzing these scenarios with regard to their plausibility and validity needs a sound understanding of major local developments and trends.
The interest in being connected to electricity grid supply is usually high among people who are not yet connected to a local distribution grid.
The following methods are recommended:
� Forecast scenarios on future electricity and peak demand development provided e.g. by DOE, NPC-SPUG or the local DU
� Energy master plans or future development plans compiled by local govern¬ment units (LGU)
� Verification of up-coming productive uses of energy
� Projections on yearly growth of population and income
� Connection rates in the grid-connected area and in neighbouring not yet connected areas
� Personal interviews

19
1.5 Current power generation costs
The most critical issues for the future development of power generation cost without the use of solar source are expected increases of power demand in the local distribution grid and an increase of the fuel cost for diesel generators.
To be taken into consideration:
� Potential cost drivers are: - Increase of connection rate - Increase of daily service hours - Changes of consumer behavior - Development of productive activities and uses - Increasing fuel cost and demand - De-rating of worn-out diesel gensts - Replacement of outdated diesel gensets
a) Impact of rising fuel costs
The price for diesel fuel on site is higher than the price for fuel on filling stations in the cities. The true cost of fuel on site includes additional cost for transport to the site, which may be exceptionally high in off-grid areas. In NPC-SPUG areas the actual fuel cost on site may
amount to up to 12 PHP2 per kWh of generated electricity, which is actually close to an
equivalent of 1 USD per litre.
Uncertainty regarding the future development of the fuel cost of diesel generators is high but have to be taken into consideration.
The GIZ International Fuel Prices Data Base indicates for the Philippines during the period of
2002-2012 an average annual increase of the diesel price by 12.75%3. As no reliable forecast
on the future development of fuel prices is possible, it may be assumed that the past trend in the increase of fuel prices will continue.
b) Impact of rising energy demand
The forecast of the energy demand should be done as accurately as possible and the results should be considered when designing the system solution. The future development of the local load curve has to be assessed, taking into account the expected increase of connected consumers on site, their potential increase of individual power consumption, and new demand emerging e.g. as a consequence of the development of additional productive uses of power.
Every forecast on the development of local peak load or power demand should be extended to at least 5-10 years after a system’s installation date.
2 Data referring to San Vicente, data source: NPC-SPUG, see also GIZ case study: Technical-Economical Analysis of the
Integration of Renewable Energies in the Power Supply System of San Vicente, Palawan, Published in October 2014 3 See https://energypedia.info/wiki/Fuel_Price_Data_Philippines)

20
1.6 Present state of power generation and distribut ion system
Usually, diesel gensets in remote areas are run on a limited time per day and during additional operating hours on weekends and special occasions and holidays. The technical equipment of the power generation is usually positioned in a powerhouse at the centre of a village. The generators produce three-phase alternating current (AC) electricity with a nominal frequency of 60 Hz. The use of three-phase data loggers enables measurement of the most important values (voltage, current, frequency, power, power factor) and associated values for the evaluation of the existing infrastructure and their quality, availability and robustness. Comprehensive information about the current condition of the infrastructure is of relevance to optimize and implement energy saving strategies. Photo 1 shows a typical local power distribution and diesel power supply infrastructure in remote areas.
Photo 1: Local power distribution and generation facilities on Carabao Island
The following methods are recommended:
� Quality inspection of the existing power generation infrastructure
� Estimation of retrofitting efforts and costs
� Execution of quality measurements for voltage, frequency and power quality fare-out connection points
� Examination of grid transformer technical specification and lifespan
� Quality inspection of overhead lines and connection points
� Identification of suitable available land/roof space to build up a PV solar power system
1.7 Socio ‐economic assessment
The primary objectives of the socio‐economic assessment is to ensure the provision of econo-
mically viable, socially acceptable and well‐managed PV hybrid power generation systems. The
assessment of socio‐economic conditions in the off-grid area should rely on both secondary and
primary data. Secondary data may be available at the LGU Planning and Development offices, while primary data is to be obtained from surveys and interviews.

21
To be taken into consideration:
� Relevant information for identification of different user groups:
o Size of family, education level, occupation
o Income and expenditures
o Sex, ethnics and religions
o Age groups, gender issues
o Livelihood sources
o Number of OCW/migrant workers
� Current energy consumption and expenditures
� Expectation and impacts of the introduction of electricity supply (energy consumption, energy mix, productive use of electricity)
� Acceptance of the proposed hybrid system
� Ability and willingness to pay for energy
� Consumers' preferred billing and collection methods
� Ownership and management of existing diesel generators and/or the proposed new RE-hybrid system
The assessment looks also at the management aspects of the current and proposed power generating system, such as the owner and the operational practices of the current system, as well the respondent’s preference on ownership andoperational practices of the proposed system.
2. Assessment of technical feasibility
2.1 Selection of appropriate components
a) PV modules
Solar PV modules are made up of PV cells, which are most commonly manufactured from silicon. Cells can be based on either wafers (manufactured by cutting wafers from a solid ingot block of material) or “thin film” deposition of material over low cost substrates. The decision whether to use the more expensive crystalline modules or less expensive thin film modules is often depending on the available space, as thin film modules need more space per installed kWp (see Figure 9).
In any case, only PV panels certified according to the IEC 61215 (crystalline silicon PV modules) or IEC 61646 (thinfilm modules) should be selected.

22
Figure 9: Different module technologies and the required surface (Source: SMA)
Solar PV panels have a long lifespan (more than 20 years), but their yield gets slightly reduced over time. This parameter has to be computed in the economic analysis across the project timeframe. PV panel manufacturers generally guarantee 90% of initial performance after 10 years and 80% after 25 years. The actual possibility of resorting to the guarantee, if needed after a few years, remains critical in areas where distributors are not established in the close vicinity.
b) PV inverter
In general, there are two main classes of inverters: central inverters and individual string inverters. Central inverters are connected to a number of parallel strings of modules, while individual string inverters are connected to one or more series of strings. Even though central inverters remain the preferred configuration for most utility-scale PV projects, both configurations have their pros and cons. The key advantages of the individual string inverters are that they are smaller and easier to maintain than a central inverter. If one string inverter fails the others remain on the grid. Numerous individual string inverters are required when setting up a large plant. Both inverter types can give enhanced power plant performance on sites. PV inverters do not utilize the grid and therefore, a voltage source (diesel generator of public grid) for proper operation is needed. Figure 10 shows the operational diagram of the PV inverter. The PV inverter converts the DC energy from the PV module to grid compatible AC current.
An PV inverter’s lifespan can reach more than ten years. The replacement of a failing component has to be undertaken by a technician from the supplying company. Risks associated

23
with the failure of an inverter should be considered, especially in remote locations or countries with very limited presence of specialized suppliers.
Figure 10: PV inverter operation diagram
c) Battery inverter
The battery or stand-alone power inverter is the heart of the AC coupled system with storage battery. It ensures that generated energy and load power are balanced at all times. If too much energy is generated, the inverter stores this surplus energy in the batteries. If energy demand exceeds supply, the inverter discharges energy from the batteries. Figure 11 shows the operational diagram of this type of inverter.
A battery inverter’s lifespan can reach up to ten years, but this component is a high-technology product and the replacement of a failing component has to be undertaken by a technician from the supplying company. The specific complexity of the inverter often requires that a proper after-sales service plan has to be implemented to ensure long-term sustainability of the system.
Figure 11: Battery inverter operation diagram
d) Battery storage
Usually, the battery storage for SPV-hybrid mini-grids is still based on lead acid batteries. The optimum design of the battery unit and the lifespan of the battery depend on many parameters

24
related to the way they are operated and to external conditions, in particular the ambient temperature and the discharge cycle of the battery. For optimum battery dimenioning, planners have to refer to the producers' fact sheets. Some battery manufactures provide their own calculation tools (e.g. www.batterysizingcalculator.com).
Table 3: Advantages and constraints of storage technologies (Source: IRENA)
e) Diesel generator
Gensets in the range of 30 kVA to 200 kVA typically need a major maintenance operation after 15,000 to 25,000 running hours. Major maintenance operations should be considered with respect to the cost and availability of the replacement parts.
Figure 12: Diesel generator

25
f) Intelligent control unit
The intelligent control unit acts as a demand-driven controller of solar power feed-in to the interface between the diesel generator, PV array and power load. The intelligent control unit records the energy flows in the stand-alone grid and uses that information to determine the maximum permissible PV power (see Figure 13).
Figure 13: Intelligent control unit (solar fuel saver) operation diagram (Source: Juwi)
To be taken into consideration:
� Quality and operation behavior of the components
� Ability to operate in harsh environmental conditions in remote areas
� Lifespan and maintenance requirements under local conditions
� Availability of technical services and spare part supply
� Technical risk assessment and risk minization strategy (e.g. training of local staff, planned maintenance, spare parts on stock)
2.2 System design options
PV-diesel solutions are a convincing alternative for already existing diesel powered mini-grids. Already today, there is a significant cost advantage of PV-diesel hybrid systems compared to conventional stand-alone diesel gensets. In principle two main basic system solutions are suitable and commercial available on the market.
� Hybridization without storage technology (AC coupled photovoltaic)
� Hybridzation with storage technology (DC coupled or AC coupled photovoltaic)

26
a) PV-diesel hybridization without storage technology
The diesel gensets together with the connected load is the overlaid system and builds the electrical network. That is still valid even if the PV is going to supply energy into this grid. The PV can be seen as a negative load.
Integration of a PV plant with up to 20% PV penetration rate (ratio between PV peak power and genset nominal power) is possible. The diesel grid acts as a voltage source for the PV string inverter, this allows a stable operation without energy flow back to the generators. Figure 14 shows the principle of thesystem design.
Figure 14: PV diesel hybridization with up to 20% penetration rate of PV
To be taken into consideration for systems with up to 20 % PV penetration rate:
� Safeguarde the diesel gensets building the electrical network (stabilizing the grid)
� Safeguarding the ratio between PV peak power and genset nominal power should be up to 20 %
� Consideration of sufficient load demand during day operation
� Realization with-out additional control unit needed
For a higher portion of PV, an additional control unit is needed to guaranty a stable operation.
An additional intelligent control unit such as the fuel save (FS) controller unit can be integrated into both new and existing power supply systems. The integration of a fuel save controller unit allows a significantly higher PV penetration level (see Figure 15). The PV inverter will be limited to the measured load (minium diesel load).

27
Figure 15: Intelligent and fast interfacing between load, genset and PV inverter, Fuel Save Controller (Source: SMA)
Figure 16 shows a load profile over the day as an example. The PV power is limited to allow a minimum genset load (in this example: minimum of 30% of genset real power). To avoid that energy flows back from the PV plant to the diesel generator or ignore the spinning reserve of the diesel system, an intelligent and fast interfacing between load, genset and PV inverter is required. The fuel save controller unit does not control the gensets, it controls the PV power system to keep the gensets within allowed operation conditions.
Figure 16: Interaction between the diesel generator and the solar power output as regulated by the SFS controller (Source: JUWI)
Figure 15 also shows the interplay between the diesel generator and the solar power output as regulated by the intelligent control unit i.e. Fuel Saver. When the diesel generator output is at its

28
minimum partial load, the solar output is throttled by the FS. This temporary reduction of the solar power ensures the efficient operation of the diesel generator. The solar fuel saver acts as interface between the solar plant and the diesel generator, regulating the solar power output to ensure an efficient operation of the diesel generator.
Thus, the genset operates in a reliable and stable state even with high levels of photovoltaic. A ratio up to 60% photovoltaic penetration is possible (ratio between PV peak power and genset nominal power). For each MW installed genset capacity, a photovoltaic plant with 600 kW can be added to the genset power supply system. The fuel save controller manages feed-in of PV and the diesel genset remains unaffected.
A multi-genset system allows for more fuel savings because the controller can even switch off individual generators, in case that there is short-term storage capacity (lead acid or others) available.
To be taken into consideration for systems with mor e than 20% PV penetration rate:
� Safeguard the diesel gensets building the electrical network
� Check whether power demand in the grid is sufficient during solar hours to absorb the produced SPV power
� An additional control unit is usally needed
� In-time adjustment (control) of genset and SPV operation to ad hoc variations in power demand and/or solar irradiation
� Spinning reserve for diesel generator in the system design
� Diesel generators have to operate at least above 30% of installed diesel capacity in order to avoid inefficient operation
b) PV-diesel hybridization with storage technology
The battery storage power can compensate for the fluctuations in load and irradiation to further increase the overall system efficiency by providing spinning reserves and facilitating optimized genset operation.
The increasing share of solar energy production reduces the availability of conventional power plants that can provide these ancillary services. However, these ancilliaty services can also be provided by storage systems. Ancillary services include frequency-dependent control of active power feed-in, voltage stability, black start capability after a grid failure and grid congestion management. These services provide renewable energy with the same grid-stabilizing characteristics as conventional power plants. Thus, storage systems enable the provision of high-quality energy at any time and balance the fluctuations caused by the rapid rise in solar energy use. The same storage system can also be used for other purposes, such as an uninterruptible power supply. As generators become more adjustable and controllable, the number of conventional units can be significantly reduced while future grid requirements can still be met and supply reliability can be guaranteed at any time.

29
The figures below show the principle booth integration of a PV application into a hybrid system structure. Booth technologies are used in applications world wide.
PV-Diesel hubrid power systems can be classified according to their type of voltage (DC or AC). In DC-coupled systems, the PV generator is connected via a special DC/DC charge controller (see Figure 17). In AC-coupled systems, a conventional PV inverter is used for feeding power into the AC-grid (see Figure 18).
Figure 17: PV-Diesel hybridization with storage and DC-coupled PV
Figure 18: PV-Diesel hybridization with storage and AC-coupled PV

30
Figure 19: PV-Diesel hybridization solution with storage
The integration of a storage technology reduces the operating time of the diesel genset and the fuel consumption (instead of spinning reserve). The sizing of the storage is optimized – instead of using an additional genset. The use of weather forecast information reduces the need of spinning reserve (see Figure 19).
Figure 20 and Figure 21 show industrial solutions based on control and management systems that integrate all generation components including battery storage. System solution in the MW range are commercially available.
For operating a hybrid plant, the operation strategy has to be adjusted to reducing diesel consumption to a minimum and keeping frequency and voltage in range. This ensures a control of active and reactive power and a stable grid.

31
Figure 20: RE hybrid power solution with storage from SIEMENS
Figure 21: PV-Diesel hybrid power plant with storage from SMA
To be taken into consideration for AC or DC coupled PV-Diesel hybrid system solution with storage technology:
� SPV penetration and storage capacity can be extended to the economic optimum, diesel off-mode may be supported.
� An additional control unit is needed
� Ensure power quality and grid stability (voltage, frequency, reactive power)
� Storage may substitute for spinning reserve and idle genset operation
� Power sharing among generation units may help to meet the load demand in the most economical way
� Diesel generators have to operate at least at 30% of installed capacity in order to avoid inefficient operation

32
2.3 Operation conditions
The operational strategy of the system defines the system design. The operation mode should be directed towards efficiency of the diesel genset and battery operation, and target the prolongation of their operational life. Optimizing the load factor of the genset and the cycling of the battery is important as it has a strong impact on the sizing and the life cycle costs of the system.
a) Diesel unit
The diesel unit can consist of one or more diesel generators. In particular systems with more than 50 kW are usually built with multiple gensets of different sizes in order to allow for the optimizaiont of the load factor of each of the different gensets during operation.
Gensets, especially those below 250 kVA (200 kW), experience significant efficiency losses (increased fuel use per kWh generated) when used at low load factors (<30%), and all types of gensets suffer from degradation if repeatedly used for long time periods at low load factors.
It is recommended to ensure that diesel gensets run as much as possible at a load factor higher than 30%. Figure 22 shows the relation between fuel consumption and load factor.
Figure 22: Increase in fuel consumption for genets run at low load factor
b) Battery storage
Today, the most suitable storage technology for hybrid systems in rural electrification is lead acid batteries with tubular plates, either vented lead acid (VLA: flooded batteries with liquid electrolyte to be regularly refilled) or valve-regulated lead acid (VRLA: maintenance-free batteries). The chosen battery should be specifically designed for deep cycling applications (not more than 50-60% discharge per cycle).

33
The battery capacity should be big enough to store the entire energy required for covering the load during the hours when the genset is not supposed to run and solar irradiation is not available (e.g. during night hours and early morning hours).
The battery discharge should be limited to 50-60% (deep discharge) of the actual battery capacity.The battery room should be designed to keep the batteries at low temperatures (at least below 30°C).
Figure 23: Lifespan according to depth of discharge (for 2V cells OPzS and OPzV)
Figure 23 illustrates the relation between the amount of cycles and the discharge factor. The battery lifespan (measured in number of cycles) depends on the depth of discharge reached at every cycle: the deeper the battery is discharged at each cycle, the shorter is its lifespan, as shown for VRLA and VLA batteries.
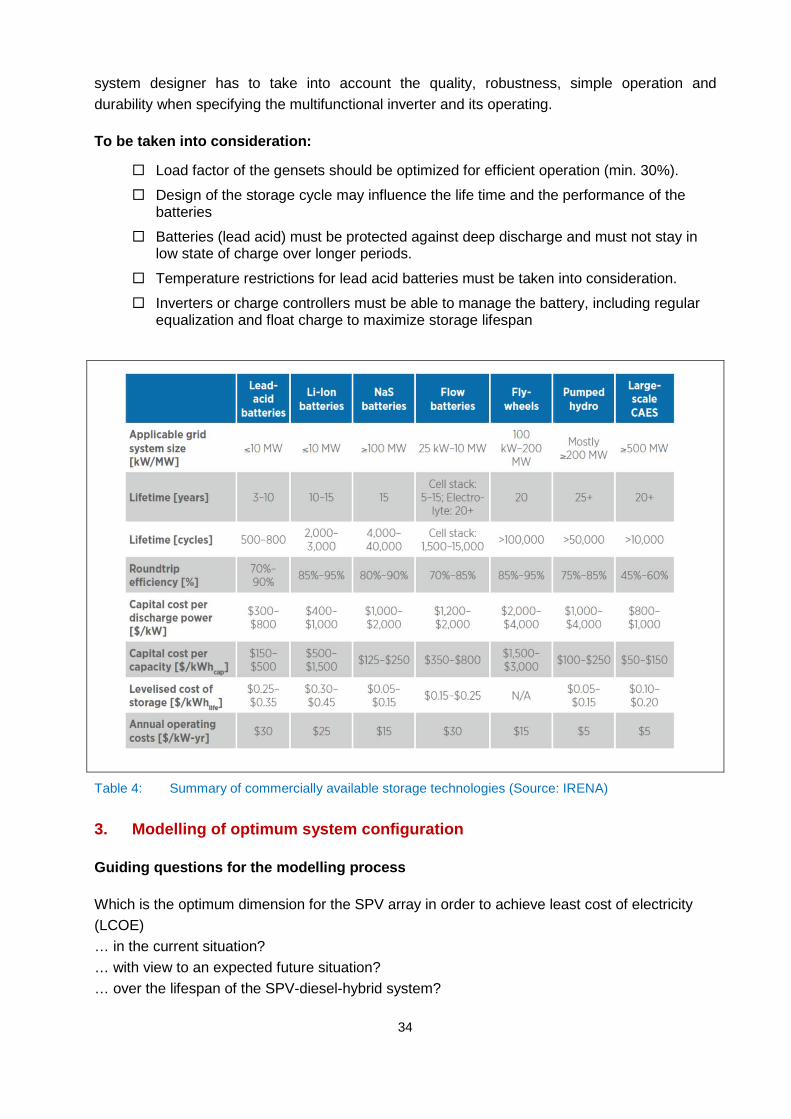
Storage technologies are undergoing rapid enhancement. Advantages and constraints of commercially available battery types are summarized in Table 4.
c) Multifunctional battery inverter
The inverter component should be designed in order to be able to supply the load when solar output is not available and the genset does not run at an efficient load factor. Seasonal variations of the load and its yearly growth should be taken into account when specifying its rated capacity.
The multifunctional battery inverter devices controll the operations of the different energy sources of the system. A failure in one of its components significantly hamper the functioning of the entire system. Improper settings for the various thresholds that control the shift between sources affect the lifespan of the battery and the efficiency of solar energy use. Therefore, the
34
system designer has to take into account the quality, robustness, simple operation and durability when specifying the multifunctional inverter and its operating.
To be taken into consideration:
� Load factor of the gensets should be optimized for efficient operation (min. 30%).
� Design of the storage cycle may influence the life time and the performance of the batteries
� Batteries (lead acid) must be protected against deep discharge and must not stay in low state of charge over longer periods.
� Temperature restrictions for lead acid batteries must be taken into consideration.
� Inverters or charge controllers must be able to manage the battery, including regular equalization and float charge to maximize storage lifespan
Table 4: Summary of commercially available storage technologies (Source: IRENA)
3. Modelling of optimum system configuration
Guiding questions for the modelling process
Which is the optimum dimension for the SPV array in order to achieve least cost of electricity (LCOE) … in the current situation? … with view to an expected future situation? … over the lifespan of the SPV-diesel-hybrid system?

35
What are the economic benefits of SPV-hybridization compared to maintaining the diesel-only system?
What is the advantages of a battery storage, and … … which is the optimum dimension of the battery? … how will the battery influence the dimensioning of the SPV array? … how will the use of the battery influence the overall COE?
What are the expected effects of SPV-hybridization… … on the security of local power supply? … on the COE and the life cycle cost of the power generation system? … on the use of fossil fuels? … on the local CO2 emissions from power generation?
Prerequisite to start the simulation of a project
An approach with a chronological simulation and optimization of a project is recommended. The following steps are useful and will guide to the optimum PV hybrid system solution. Start with the current power situation and actual demand, the integration of a PV system and the benefits, sensitivity analyses of different scenarios and taking into account the expected future situation that leads to the optimum PV hybrid system solution.
1) Establish a model showing the current power generation system - Simulation of actual load profile and demand - Modelling of existing diesel generators in use - Adjustment of specific cost figures to the actual TCGR - Calculation of COE, NPC-SPUG fuel consumption, CO2 emission etc.
2) Simulate SPV-hybridization of the current system - Introduction and optimum dimensioning of the SPV array - Introduction and optimum dimensioning of battery storage (optional) - Calculation of COE, NPC-SPUG fuel consumption, CO2 emission ... - Assessment of comparative benefits (cost, fuel consumption, emission…)
3) Establish a diesel-only design for an expected future situation - Reference to consolidated load and demand forecasts - Modeling of necessary diesel generators - Simulation of COE and fuel consumption
4) Simulate SPV-hybridization of the future system - Introduction and optimum dimensioning…
5) Sensitivity analysis of different scenarios
6) Selection of the optimum system configuration recommended from the simulation tool

36
3.1 Economic optimization and sensitivity analysis
The modeling of a technical solution under the different system configurations and components requires an adequate software tool. HOMER, a modeling system developed by the National Renewable Energy Laboratory (NREL) of the US-DOE, which is emerging as an international standard for modeling of distributed renewable electricity systems can be used as a convenient tool to modeling a local solution. The model is available, in the initial version fee of charge, through the following website:
� http://www.homerenergy.com/software.html
HOMER can be used for:
� Chronological simulation and optimization of a project
� Modelling technical and economic factors
� Comparing cost and feasibility of different configurations
� Sensitivity analysis with levelized cost simulation
Figure 24 below shows the start-up window of the HOMER simulation tool.
Figure 24: Start-up window of HOMER
37
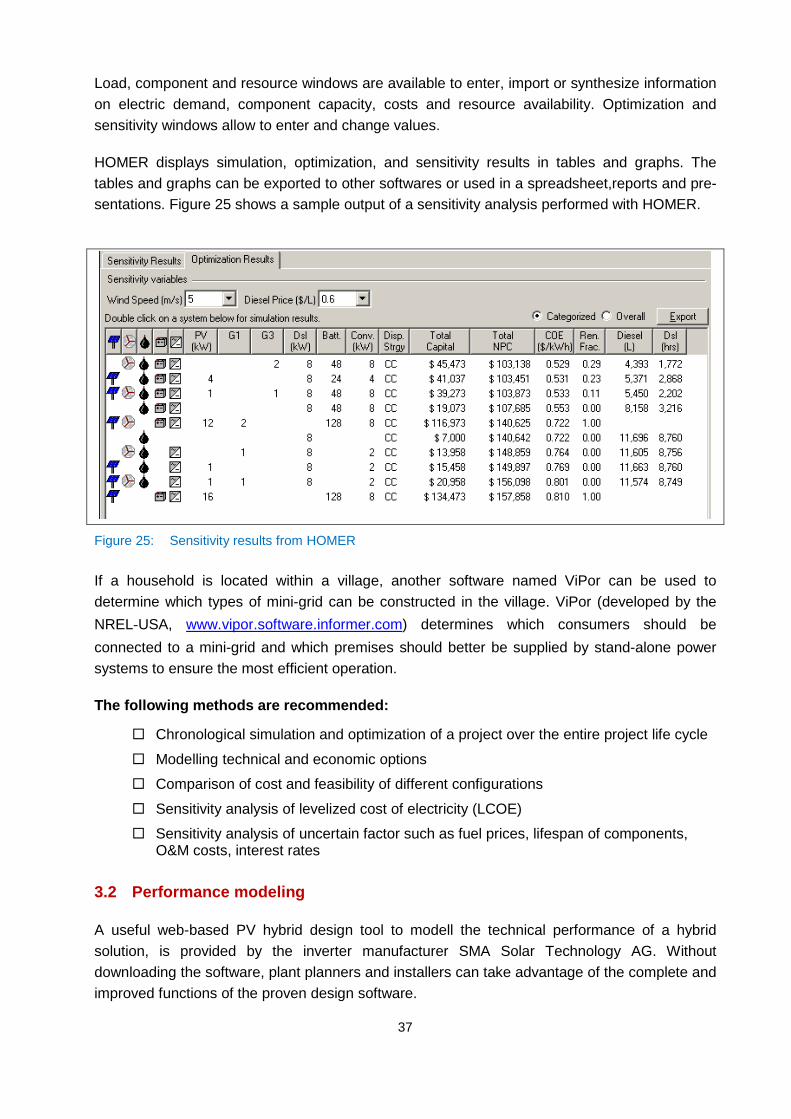
Load, component and resource windows are available to enter, import or synthesize information on electric demand, component capacity, costs and resource availability. Optimization and sensitivity windows allow to enter and change values.
HOMER displays simulation, optimization, and sensitivity results in tables and graphs. The tables and graphs can be exported to other softwares or used in a spreadsheet,reports and pre-sentations. Figure 25 shows a sample output of a sensitivity analysis performed with HOMER.
Figure 25: Sensitivity results from HOMER
If a household is located within a village, another software named ViPor can be used to determine which types of mini-grid can be constructed in the village. ViPor (developed by the
NREL‐USA, www.vipor.software.informer.com) determines which consumers should be
connected to a mini-grid and which premises should better be supplied by stand-alone power systems to ensure the most efficient operation.
The following methods are recommended:
� Chronological simulation and optimization of a project over the entire project life cycle
� Modelling technical and economic options
� Comparison of cost and feasibility of different configurations
� Sensitivity analysis of levelized cost of electricity (LCOE)
� Sensitivity analysis of uncertain factor such as fuel prices, lifespan of components, O&M costs, interest rates
3.2 Performance modeling
A useful web-based PV hybrid design tool to modell the technical performance of a hybrid solution, is provided by the inverter manufacturer SMA Solar Technology AG. Without downloading the software, plant planners and installers can take advantage of the complete and improved functions of the proven design software.

38
For a more concrete technical performance-based simulation the PV hybrid web tool generates and proposes marketable solutions as an alternative for pure diesel operated grids. A simulation
with storage technology is possible with the software tool SMA Off-Grid Configurator.4
The software tool shows the integration of a higher level of PV without a storage unit, while maintaining system reliability and keeping costs down. It shows how higher portion of PV penetration, reliability and cost interact. The modelling of an electricity system starts with a fossil-fueled system, to which a PV system is adapted. Key model outputs are reliability, costs and the return of investment. Furthermore, it is desplayed how increased use of PV can affect the overall costs. The tool can be used under http://www.sunnydesignweb.com (see Figure 26).
Figure 26: Start-up window of PV hybrid web design tool (SMA)
Beside the data on project location, temperature, voltage level (low or medium voltage grid), type of grid connection, line losses, wiring size and electrical connection of the PV inverter, the economical input data, load profile, genset and PV plant configuration are of importance:
Key economical input data:
� OpEx PV as a percentage of CapEx/year
� True fuel costs
� Annual increase in fuel costs
4 http://www.sma-america.com/en_US/products/software/sma-off-grid-configurator.html

39
� Analysis period of economic viability
� Specific investment costs of the PV system
� Inverter’s share of the PV system investment cost
� Equity ratio
� Debt ratio
� Interest rate
� Credit period
� Cash flow discount rate
Key load profile data input:
� Industry loads
� Commercial load
� Create or load own load profile
� Average annual energy consumption
� Average displacement power factor cos φ of the loads
� Average daily profile of energy consumption by season
Key generator input data:
� Apparent power
� Fuel consumption at nominal power
� Efficiency at nominal power
� Minimum utilization of the genset, load factor
� Expected PV minimum power with no clouds
Useful information about the different load characteristics can either be chosen as default value from the tool or be created and loaded using own definitions. The configuration of the genset or of the units are of relevance for the simulation. The minimum power of the gensets, adjusted for the load, takes into account an additional power reserve that can be provided by the gensets. A load-related minimum power of 110% means a power reserve of 10%. The minium load factor of 40% ensures the efficient operation of the generator and avoids increased maintenance efforts and reduction of generator lifetime.
The following methods are recommended:
� Collection and evaluation of meteorological input data for the project location, or to another location close by
� Modelling technical and economic options
� Sensitivity analysis of uncertain factor such as fuel prices, PV investment, O&M costs, interest rates, debt ratio
� Assessment of the return of investment
� Determination of levelized cost of electricity (LCOE) with sensitivity analysis

40
3.3 Levelized costs of electricity (LCOE)
Levelized costs of electricity (LCOE) are the total average cost per unit of the total electricity generated by a specific systems its life time. It is a systematic economic cost assessment including all costs occurring over the lifetime of the system: initial investment, operations and maintenance, cost of fuel, cost of capital, replacement cost of components (NREL 2013). Table 5 shows the LCOE for different system configurations for conventional and renewable sources, while Figure 27 shows the LCOE comparison of various electrification options.
Table 5: Sensitivity analysis for different hybrid configurations (Source: ARE, Brussels)
Figure 27: Comparing the levelized cost of various electrification option (Source: Norplan 2012)
Nowadays, for most sites renewable energy solutions have a lower Levelized Cost of Electricity than diesel generators (for current LCOE cost data of renewable energy, see: REN21 2014).

41
The following methods are recommended:
� Estimation of true cost of generation rate per kWh for the entire hybrid system
4. Bankable project documentation
Key aspects of bankable PV-diesel hybrid projects
Already today, there is a significant cost advantage of PV-diesel hybrid systems compared to conventional diesel gensets. There are two macro economic trends to be considered: first, prices for PV system technology have dropped by more than 50% within the last three years. Second, the fuel cost for diesel gensets are steadily rising (see Figure 28). In numerous countries in the sunbelt regions of the earth, levelized costs for photovoltaic energy are already significantly lower than energy from diesel engines. The integration of storage technologies are well-proven and new storage technologies with advantages in energy density and lifespan are expected to become commercially available in the future. The storage increases the security of power supply and reduces the overall cost of energy of SPV-diesel hybrid systems.
The integration of a photovoltaic plant could be beneficial for an investor if there is a significant amount of base load gensets to leverage high fuel saving potential.
Chart source: h p://www.solaroffgrid.info/wp-content/uploads/sites/2/2014/06/diesel-vs-pv-300x225.png
Alad
power plant
Basilan
power plant Global trend
Diesel genera on cost
NPC-SPUG Forecast (MEDP 2012-2021)
Diesel genera on cost
Global trend
LCOE of SPV plants
Figure 28: PV generation cost today and trends in diesel generation costs
The combination of diesel and photovoltaic ensures consumers an attractive and reliable energy supply with low maintenance and operating costs. They have a modular design, are scalable and can be adjusted according to current energy demands. This means that, despite high, initial upfront costs for PV system and a optional storage, PV systems can reduce the local TCGR

42
and FCRR as well as dependence from imports of fossil fuels, while minimizing the impact of the local market on energy prices in the Philippines within the next years. This results in saving of UCME subsidies and is benefically for all energy consumers.
The analysis in Figure 29 shows when the effective diesel costs exceed one US dollar/per liter for the operator and the local solar irradiation conditions allow the use of PV (especially economically viable with PV yields above 1500 kWh/kWp).
Figure 29: Financially attractive area for PV diesel operation in remote areas (Source: SMA)
4.1 Investment costs
Rural electrification agencies as well as many operators of small diesel minigrids are aware that hybridization can help provide a better service and reduce production costs. The costs of solar modules have been steadily decreasing and this trend favours a broad deployment of PV hybrid systems. A project developer may consider, as a rule of thumb, that in case a storage is integrated one third of the budget for the capital cost will be dedicated to the PV array itself.
However, one also has to consider that a hybrid system can have many other components, besides the PV array. The cost of the storage component is significant (see Figure 30). The replacement of a used battery storage after six to nine years, with a cost roughly equivalent to 20 % of the available budget, should be included in the cumulated expenses.
In addition, the battery charge control feature of the battery inverters for hybrid systems makes them more expensive than grid-connected inverters. This makes a significant cost difference compared to simple PV power plants connected to the grid. Data collected on recent systems installed in Africa and Asia show that the typical real installed cost of a complete PV / battery diesel hybrid system is in the range of 5,500 to 9,000 EUR / kWp with variations according to system size and location. Diesel gensets are widespread in developing countries and products and services are readily available. On the contrary, solar PV distributors and installers with a

43
significant market base and experience are far fewer, implying generally higher costs with some variations according to the country.
Figure 30: Typical cost structure of a PV / diesel hybrid system
Despite variations due to system size and location, the cost structure of a PV-diesel hybrid system typically follows the breakdown shown in the pie chart above. The private investors can contribute to the optimisation of the investment cost.
To be taken into consideration:
� Include storage replacement during project lifetime in the calculations
� Due to small project volume and uncertain framework conditions transaction cost may be relatively high
� Fiscal incentives should be taken into consideration for the assessment of economic feasbility, probable delays in availing these incentives should be taken into consideration
� Deviations from the optimum technical systems design may be reasonable if they help in reducing the investment cost and the resulting LCOE substantially
� Establishing SPV installations on commercial land or on existing roofs may help avoiding delays in project development due to land-use or IP issues
4.2 Operation and maintenance costs
As a basic minimum, the project should generate a cash flow sufficient to cover O&M costs, and be built around existing local businesses or public institutions in order to increase critical mass, revenue, and local involvement. Because it is sometimes difficult and costly to retain skilled personnel in a remote village, an operator should consider operating valuably on a bundle of hybrid systems in a given area to reduce operations and maintenance costs.
O&M expenses, such as those associated with maintenance activities, are less predictable and can be influenced by: system size and location (e.g., water availability, weather conditions, travel distances), plant architecture and ease of site access (e.g., ground mount vs. roof mount),

44
as well as the extent that meters and inverters are deployed at a site. As a result, estimated and actual O&M expenses can markedly differ. Table 6 gives an indication for O&M costs for Solar PV without storage technology.
Table 6: O&M costs of Solar PV without storage technology (Source: EPRC)
Access to service and spare parts is very critical in the case of electronic components. In the case of failure of one component, the necessary diagnosis and replacement is often an issue. In addition to initial training sessions, it is required that RE developers and manufacturers and/or local distributors provide an adequate after-sales service for the components. The long-term continuity of the after-sales service is important.
To be taken into consideration:
� Ensure sufficient cash flow over the entire project life cycle
� Involve local capacities in O&M
� Employ and train local staff for the operation of all components of the SPV-hybrid plant
� Establish lean and efficient billing and collection system
� Ensure a realistic assessment of O&M cost for SPV arrays, inverters, converters and storage, and avoid overestimations of the relevant cost
� Implement an adapted planned maintenance concept in order to avoid system outages and to reduce unplanned repair cost
4.3 Cash flow
Hybrid mini-grids are still perceived as a high-risk and low-return investment. Local financial institutions are a natural debt provider due to their ability to understand market dynamics and perform due diligence. However these institutions have limited experience in cash flow analysis, and rely on collateral for corporate lending. For developers’ and lender’s credits, analysis must be based on projected cash flows.

45
The following methods are recommended:
� Comprehensive cash flow analysis has to include all foreseeable cash in- and outflows over the project lifetime
� Economic risk assessment and risk mitigation strategy is requested in order being able to avoid illiquidity and other disturbance of the cash flow
4.4 Internal rate of return
The internal rate of return (IRR) is a rate of return used in capital budgeting to measure and compare the profitability of the investment. It is recommended to provide a sufficient internal rate of return in the financial concept in order to cover the risks accordingly and to elaborate a comprehensive risk analysis and risk mitigation strategy. This prevents illiquidity and all potential disturbances of the cash flow.
From the point of view of a private investor, providing capital for an investment in a PV option must be attractive. The savings in generation cost (versus the diesel option) should pay back the initial investment in a reasonable timeframe and provide a suitable rate of return. To be viable from an economic and financial point of view, and to attract investment, a hybrid system has to be efficient. Environments with low fuel costs or with limited solar resources would make it difficult for such a system to compete with diesel-based power plants.
The following methods are recommended:
� Preparation of financial concept with sufficient high internal rate of return
� Elaborate a comprehensive risk analysis and risk mitigation strategy, to avoid illiquidity and all potential disturbances of the cash flow
5. Selection of appropriate market option
Based on the legal background for rural and missionary electrification in the Philippines, two fundamental avenues with further options can be identified for RE developers to provide electricity in rural areas. An overview of the market options for private sector with RE projects in off-grid areas is given in Figure 31. The NPC-SPUG is the lead agency overseeing and implementing the missionary electrification program. Distribution Utilities (DUs), particularly the Electric Cooperatives (ECs) complement the SPUG activities.
Private investors, in the form of New Power Producers (NPPs) for the SPUG areas or as Qualified Third Parties (QTP) for the waived/declared unviable areas, act as market delivery partners of the Government in achieving the goal of facilitating access to electricity even in the remotest areas of the country.
Private sector participation (PSP) can be done under two general schemes:
� The New Power Producer (NPP) for NPC-SPUG areas
� The Qualified Third Party (QTP) for the unviable remote areas
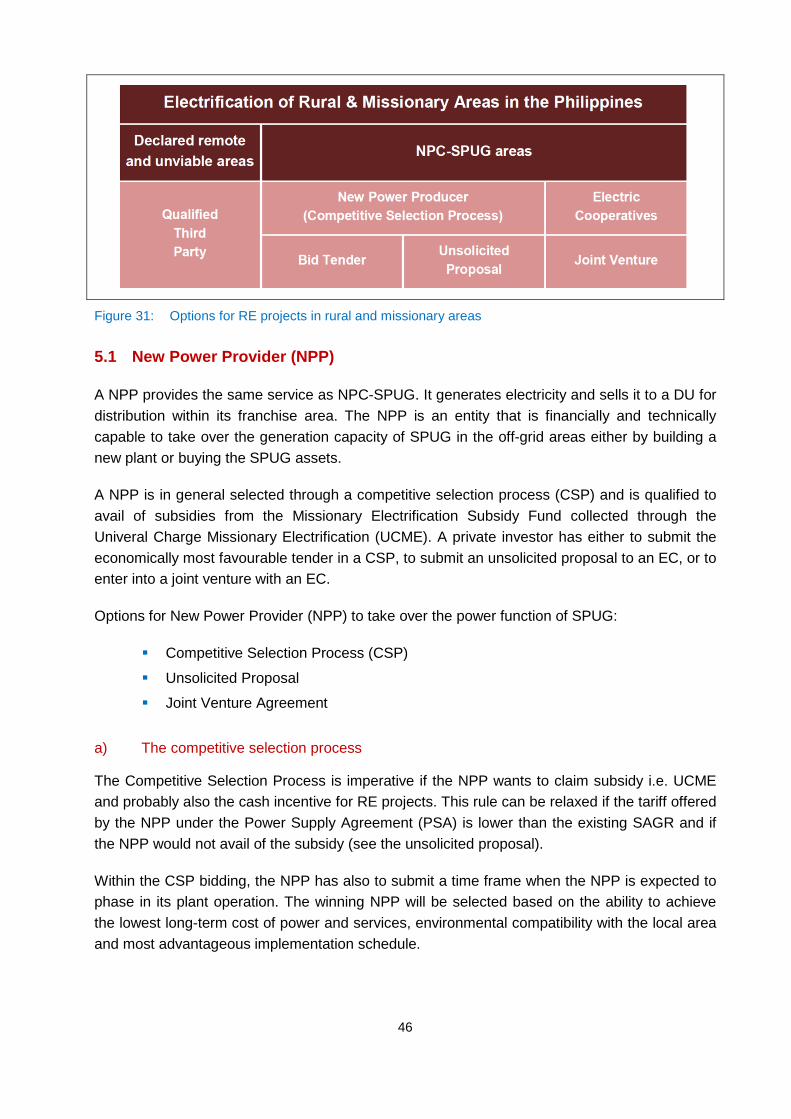
46
Figure 31: Options for RE projects in rural and missionary areas
5.1 New Power Provider (NPP)
A NPP provides the same service as NPC-SPUG. It generates electricity and sells it to a DU for distribution within its franchise area. The NPP is an entity that is financially and technically capable to take over the generation capacity of SPUG in the off-grid areas either by building a new plant or buying the SPUG assets.
A NPP is in general selected through a competitive selection process (CSP) and is qualified to avail of subsidies from the Missionary Electrification Subsidy Fund collected through the Univeral Charge Missionary Electrification (UCME). A private investor has either to submit the economically most favourable tender in a CSP, to submit an unsolicited proposal to an EC, or to enter into a joint venture with an EC.
Options for New Power Provider (NPP) to take over the power function of SPUG:
� Competitive Selection Process (CSP)
� Unsolicited Proposal
� Joint Venture Agreement
a) The competitive selection process
The Competitive Selection Process is imperative if the NPP wants to claim subsidy i.e. UCME and probably also the cash incentive for RE projects. This rule can be relaxed if the tariff offered by the NPP under the Power Supply Agreement (PSA) is lower than the existing SAGR and if the NPP would not avail of the subsidy (see the unsolicited proposal).
Within the CSP bidding, the NPP has also to submit a time frame when the NPP is expected to phase in its plant operation. The winning NPP will be selected based on the ability to achieve the lowest long-term cost of power and services, environmental compatibility with the local area and most advantageous implementation schedule.

47
The PSA to be signed by the EC and the NPP can be for a period of up to 15 years.The NPPs are allowed for full cost recovery and they are also entitled to collect subsidy from UCME.
Essential for the Competitive Selection Process (CSP):
� Full cost recovery
� Tendering Process
� Contract approval by the energy Regulatory Commission (ERC)
� Contract period up to 15 years
The cost recovery is based on the True Cost Generation Rate (TCGR) which is calculated on a per plant basis and again has to be approved by the ERC. Meanwhile, the ECs will collect from its consumers a rate based on the Subsidized Approved Generation Rate (SAGR). If the TCGR is higher than the SAGR, the difference (subsidy) shall be collected from NPC-SPUG through the UCME. If the NPP puts up a RE project, it is still entitled to get the cash incentive for RE projects in missionary areas.
b) The unsolicited proposal
The Unsolicited proposals are considered a form of competitive bidding if they are properly subjected to a Swiss challenge. Swiss Challenge Approach means that following an unsolicited approach, an open bidding process is conducted. If unsuccessful, the original proponent has the option to match the winning bid and win the contract (see: Public Private Infrastructure Advisory Facility, Note 6, May 2012).
In this case, the successful NPP also qualifies for availing subsidies from UCME. Otherwise, NPPs concluding a PSA with a DU on the basis of unsolicited proposal would be excluded from availing subsidies from the UCME.
Important steps:
� Selection of local partner for foreign companies (the partnership will be owned 60 % by the Philippine partner)
� Determination of an appropriate range of NPP services
� Negotiate an appropriate contractual setting with the DU and NPC-SPUG
� Develop an appropriate investment strategy
5.2 Qualified Third Party (QTP)
The QTP is an entity that is financially and technically capable to provide generation and distribution facilities in the unviable or remote areas of the distribution utilities (DU) – especially the electric cooperatives .
There is still a big number of unviable areas that can be targeted for QTP operation. After getting the accreditation, the RE developer can select the area it wants to develop, propose it to the DOE and start working on getting the permits and developing the project.

48
In case that a foreign company wants to be a QTP, it has the option of forming a company together with a local partner which will take a majority control. The RE developer also needs to make sure that it has a good and reliable partner on the ground that can perform the above mentioned operational steps and has the capability to build the generation facility, the distribution system and the collection from the end-users.
The following methods are recommended:
� Selection of local partner (has to be 60 % Philippine owned company)
� Develop an integrated business model for both power generation and distribution, including establishment of the grid
� Determine an appropriate investment strategy
5.3 Joint Venture (JV)
A joint venture with ECs is a possible option for the private sector to enter the power market with RE technologies. For this reason, private investors can establish joint ventures with ECs in the missionary areas. The ECs in general can also enter into a joint venture agreement with private companies and other ECs to jointly develop power projects, invest in auxiliary services and develop projects. The ECs which has entered into joint ventures can apply for technical and financial assistance from NEA - usually to help defray the equity required from the EC.
To be taken into consideration:
� Willingness of EC to enter into JV with the private sector is the critical issue
5.4 Incentives
The promotion of RE in power generation is enhanced by the RE Act that aims to accelerate the exploration and development of the country’s RE resources by providing fiscal and non-fiscal incentives to private sector investors and equipment manufacturers / suppliers.
Regardless whether the option takenby the developer is NPP, JV or QTP, to avail of the incentives and privileges (please see below) provided under the RE Act, RE Developers have first to register with the DOE and apply for a RE service contract (RESC).
Incentives in the Philippines:
� Income tax holiday (ITH) for the first 7 years of commercial operations
� Duty-free importation
� Reduced (1.5%) realty tax rates on equipment and machinery
� Net operating loss carry-over (NOLCO) for the first 3 years of commercial operations
� Reduced (10%) corporate tax rate after the expiration of the ITH
� Accelerated depreciation
� No (0%) value-added tax

49
� Tax exemption on sale of carbon credits
� Tax credit on domestic capital equipment and services related to the installation of equipment and machinery
� Exemption from paying Universal Charge for power generated for own use
� Cash generation-based incentive
� Can Avail of UCME subsidy
With regard to the non-fiscal incentives (especially FIT and RPS) the guidelines, rules and regulations for their implementation in rural electrification (off-grid and unviable areas) are being deliberated by the technical working group chaired by NPC. Due to the differences in conditions between the offgrid/unviable areas and the on-grid areas, different rules and procedures for the non-fiscal incentives will be applied.
Cash generation-based incentive per kilowatt hour generated from RE 5 = (TCGR6 – SAGR7) * 50%
Note: For QTPs, FCRR8 and SARR9 shall replace the TCGR and SAGR in the formula.10
Formula 1: Formula for cash generation-based incentive
In the Philippines, the average retail electricity price for consumers is approximately PhP 10.19 pesos/kWh. However, diesel generation costs in remote areas are much higher. Most of these areas receive their power from diesel generation that needs to be heavily subsidized due to high true power generation cost. The average true cost generation rate in 14 National Power Corporation-Small Power Utilities Group (NPC-SPUG) first wave areas (PhP 8.42 pesos/kWh) is almost 50% higher compared to the subsidized generation rate (PhP 5.645 pesos/kWh).
There are two different types of subsidies to be taken into consideration. The subsidy from UCME covers the difference between TCGR and SAGR in off-grid power generation the difference between the FCRR and the SARR in the unviable or QTP areas. The cash generation-based incentive provided on the basis of the RE Act amounts to 50% of the
5 Equivalent to fifty percent (50%) of the universal charge for power needed to service missionary areas where it
operates the same 6 TCGR (True Cost Generation Rate) refers to the reasonable cost of generation for the particular SPUG area
where the RE Developer operates. 7 SAGR (Subsidized Approved Generation Rate) refers to the generation rates, expressed in Peso per kilowatt-hour,
which the ERC has approved for an EC to charge its customers for electricity generation services. 8 FCRR (Full Cost Recovery Rate) refers to the rate, expressed in Peso per kilowatt-hour, which recovers the full
efficient costs of providing electricity service sufficient to enable the QTP to operate viably. 9 SARR (Subsidized Approved Retail Rate)” or “SARR” refers to the rate, expressed in Peso per kilowatt-hour, that
the ERC has determined to be the maximum that an end user in a Declared Unviable Area shall pay for the electricity service provided by a QTP
10 ERC Resolution 7 s2014

50
difference between TCGR and SAGR for each kWh produced from RE sources. The Cash Incentive will also be sourced from the UCME.
The operators of Solar PV – Diesel hybrid who want to avail of subsidies through the UCME and/or the cash generation-based incentive have to ensure that the electricity generated and supplied from different components of their hybrid system is separately metered and verified. This is a requirement for determining the applicable cash generation-based incentive as only generation from the RE source would be entitled to this incentive.
ERC recognizes the difficulty and expense of locating RE generation projects in missionary areas. Hence, the “ERC Amended Guidelines for the Setting of Generation Rates and Subsidies for Missionary Areas” (ERC Resolution 21 s2011), Article II Section 3 states that in cases where the NPP utilizes renewable energy or where the NPP is a RE developer, the ERC may use the approved FIT rate for power generation from the same source in on-grid areas as a benchmark for the reasonability of the price for power generated from RE sources missionary areas.
In a declared remote or unviable area, a QTP charges ERC-approved rates that allow for the full cost recovery of both the costs of generation facilities and the costs of the associated delivery systems built to serve these remote or unviable areas.
The QTP framework provides the Full Cost Retail Rate (FCRR) and Subsidized Approved Retail Rate (SARR) to be recoverable from the end-users and/or the UCME. If the SARR is lower than the FCRR, the QTP is entitled to recover the difference from the UCME.
Important:
� Registration with the DOE and enter into an RE service contract (RESC) with the DOE in order to qualify for the availing of fiscal and other incentives

51
V. References
(1) Advanced hybridization for diesel power grids to minimize fuel consumption, Wollny, Michael, SMA Solar Technology AG, Niestetal, Germany 2013
(2) Rural Electrification with PV Hybrid Systems, Overview and recommendations for further deployment, Report IEA-PVPS T9-13, CLUB-ER Thematic Paper, July 2013
(3) Renewable energies for off-grid power generation in the Philippines; Avenues and examples for private sector; Participation in the off-grid power sector, GIZ background paper, GIZ-Philippines, May 2013
(4) Renewable energy in the Philippines: Costly or competitive? Facts and explanations on the price of renewable energies for electricity production, GIZ-Philippines, June 2013
(5) Accompanying the Philippines on the road toward sustainable energy supply, GIZ’s support to renewable energy development in the Philippines, GIZ-Philippines, April 2013
(6) MINI-GRID Policy Toolkit; Policy and business frameworks for sucessful mini-grid roll-outs; EU Energy Initiative - Partnership Dialogue Facility (EUEI PDF) Eschborn 2014
(7) Administrative procedures, rules and processes for off-grid PV project development in the Philippines, eclareon, GIZ, June 2013
(8) Technical-economical analysis of the integration of renewable energies in the power supply system of San Vicente, Palawan; Case Study 2014; Integration Umwelt & Energie GmbH, GIZ
(9) Technical data survey and energy audit for Air Sena - Fishing village hybrid-PV project in Sumatra Remote Islands, EnReach, GIZ, Indonesia, 2014
(10) Hybrid mini grids for rural electrification: Lessons learned, USAID, Alliance for rural electrification; Brussels 2012
(11) Renewables 2014, Global status report, REN 21, Paris 2014
(12) Review of strategies and technologies for demand side management on Isolated Mini-Grids”, Berkley Lab and SERC, Harper (2013)
(13) Addressing solar photovoltaic operations and maintenance challenges, A survey of current knowledge and practices, Electric Power Research Center (EPRI) white Paper, July 2010
(14) Utility Scale Solar Power Plants - A Guide For Developers; International Finance Cooperation, India, February 2012

52
VI. Appendix - Fact Sheet - Carabao Island
GEOGRAPHIC INFORMATION
Geographic Location Carabao island is located between Tablas Island and the resort island of Boracay. Coordinates: between 12.00 and 12.100 latitude and between 121.500 and 122.00 longitude.
Distances 4.31 nautical miles southwest of Sta. Fe, Romblon; 5.39 nautical miles from the northeastern tip of Panay Island; and 35.05 nautical miles from the Provincial Capital in Romblon, Romblon.
Land Area 28.90 square kilometers
Topography The terrain is characterized by lowlands in the northern and eastern sections and by rolling hills in the central and the south central portion. 67% of the land area generally hilly.
Accessibility Carabao Island can be reached by boats from Tablas Island, Caticlan and Boracay Island. Regular trips are available from the Caticlan (30-40 minutes ride) and Boracay Island (20-30 minutes ride). These trips are scheduled only during daytime.
Climate No pronounced season. Relatively wet from May to October, dry for the rest of the year. Based on PAGASA’s climate classification the island is under the Type III.
ADMINISTRATIVE INFORMATION
Political Classification Island municipality
Name of Municipality San Jose, Romblon, Region IV-B MIMAROPA
Barangays 5 namely Busay, Combot, Lanas, Pinamihagan and Poblacion.
Population 10,294 (based on 2010 Census)

53
Number of Households 1,752
Annual population growth rate 1.9%
Population density 378 persons per square kilometer
Average household size 6 (2010 Census)
TRANSPORTATION, COMMUNICATION & OTHER INFRASTRUCTUR ES
Road network Primarily made of single lane concrete roads and dirt roads. Of the islands’
51.33 kilometres road network, only about 30% paved to a limited extent. Two-
lane concrete roads are found in the poblacion while two-lane dirt roads are spread along the coastline
Mode of transportation
Public transportation is provided by mostly by motorcycles (see picture at the
right) which act as the island taxis. Fare cost will vary on the distance.
Communication facilities
Cell phone signals are weak because the primary cell sites are located in the island of Boracay
Water and Sanitation
Sixty-One percent (61%) of the island’s water supply is mostly shared community water system primarily composed of a common water source (usually a spring) and water piped to the houses (8.5%). No centralized sewerage treatment, only septic tanks per household.
Educational Facilities
One (1) secondary school and eight (8) elementary schools with a total of 66 classrooms in 36 buildings.
Health facilities One municipal hospital with 25 beds, 5 barangay health centers

54
ECONOMIC INFORMATION
Primary economic activities Agriculture, fishing, forestry and tourism
Main agricultural product Coconut
Ave. Annual Household Income P121,060.00 (2009 data for the province)
Ave. Annual Household Expenses
P96,117.00 (2009 data for the province)
ENERGY SUPPLY & UTLIZATION
Distribution Utility
Tablas Island Electric Cooperative (TIELCO)
Power Generation Entity
National Power Corporation – Small Power Utilities Group (NPC-SPUG)
Power Plant Capacity
two (2) operating generating sets – 228kW and 163kW
Year Plant Operation Started
May 1997
Power Plant operation
14 hours: 4am to 6am and 3:30pm to 11pm
Load Demand Peak load is 260kw, minimum is 110kw

55
Load and Demand Curve
N a t i o n a l P o w e r C o r p o r a t i o n
SMALL POWER UTILITIES GROUP
L O A D A N D D E M A N D C U R V E
SAN JOSE DIESEL POWER PLANTJUNE 26 -JULY 25, 2014
0100H 0200H 0300H 0400H 0500H 0600H 0700H 0800H 0900H 1000H 1100H 1200H 1300H 1400H 1500H 1600H 1700H 1800H 1900H 2000H 2100H 2200H 2300H 2400H
T O T A L C A P A B I L I T Y
0.000 0.000 0.000 0.140 0.290 0.290 0.000 0.000 0.000 0.000 0.000 0.000 0.140 0.290 0.290 0.290 0.290 0.290 0.290 0.290 0.290 0.290 0.140 0.000
S Y S T E M D E M A N D
0.000 0.000 0.000 0.140 0.183 0.182 0.000 0.000 0.000 0.000 0.000 0.000 0.130 0.177 0.167 0.158 0.171 0.191 0.260 0.251 0.235 0.192 0.140
R E S E R V E D / (D E F I C I E N C Y)
0.000 0.000 0.000 0.000 0.107 0.108 0.000 0.000 0.000 0.000 0.000 0.000 0.010 0.113 0.123 0.132 0.119 0.099 0.030 0.039 0.055 0.098 0.000 0.000
0.14 0.14 0.14 0.14 0.14 0.14 0.14 0.14 0.14 0.14 0.14 0.14 0.14 0.14
0.15 0.15 0.15 0.15 0.15 0.15 0.15 0.15 0.15 0.15 0.15
-0.05
0.00
0.05
0.10
0.15
0.20
0.25
0.30
0.35
0100H 0200H 0300H 0400H 0500H 0600H 0700H 0800H 0900H 1000H 1100H 1200H 1300H 1400H 1500H 1600H 1700H 1800H 1900H 2000H 2100H 2200H 2300H 2400H
L o
a d
i n
M
e g
a w
a t
t s
T i m e i n H o u r s
Deficiency
Unit 3
Unit 2
Unit 1
System Demand
Rev ised Nov ember 2001
Fuel Consumption
SPUG Diesel consumption is 3.2 liters/kWh which translate into PhP21,000.00 per month.
True Cost Generation Rate
PHP 14-16/kWhr
Power Supply Service Quality
Due to old age of the units, particularly the 163kw, breakdowns are normal occurrences and lack of replacement parts worsened the situations. Furthermore, fuel supply problem affects the plant operation especially during poor weather conditions. Power failures become the norm rather than the exception. Poor power quality (i.e., low voltages and unstable frequencies) can be deduced from users who complaint of damaged appliances or equipment. All those interviewed during the field mission by the team claimed that they have damaged appliances (usually televisions and refrigerators) due to power instability
Power Plant Upgrading Plans
NPC-SPUG plans to replace the units with three (3) brand new 250kw generating sets in 2015. With these new units, the plan is to increase operating hours up to 16 hours.
Present Total Customers
1,457 (50% of households plus commercial loads)
Average 64,570 kWh
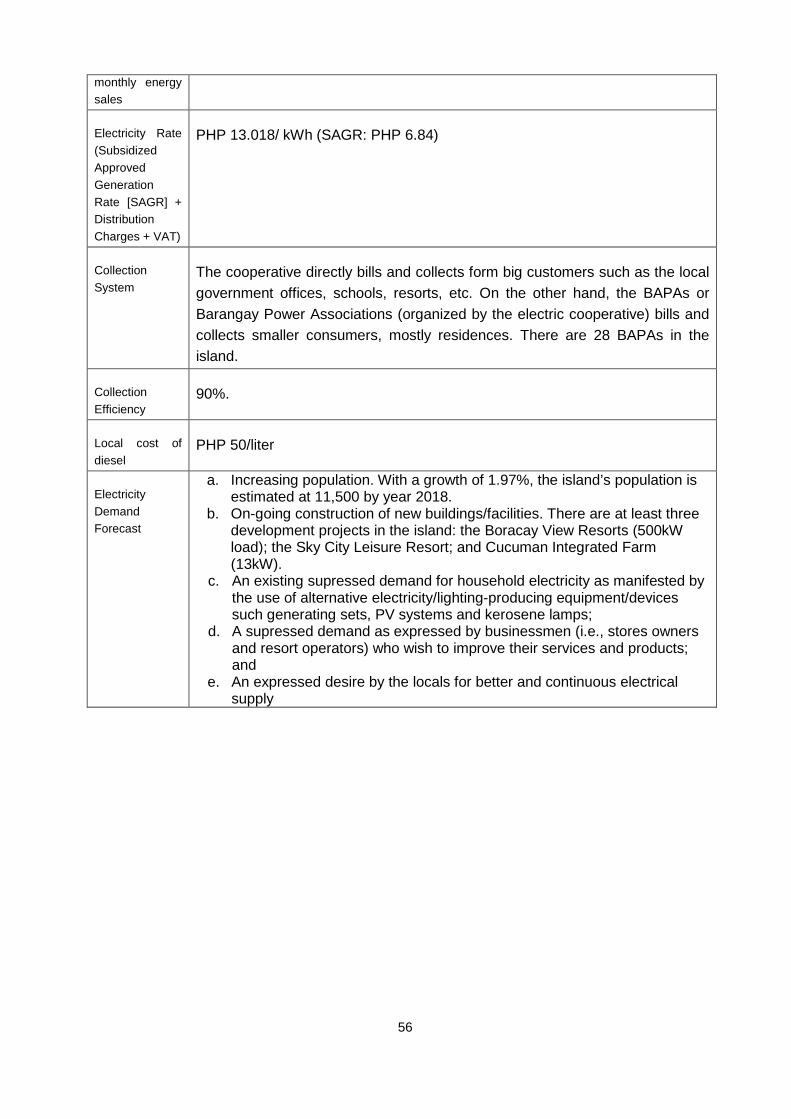
56
monthly energy sales
Electricity Rate (Subsidized Approved Generation Rate [SAGR] + Distribution Charges + VAT)
PHP 13.018/ kWh (SAGR: PHP 6.84)
Collection System
The cooperative directly bills and collects form big customers such as the local government offices, schools, resorts, etc. On the other hand, the BAPAs or Barangay Power Associations (organized by the electric cooperative) bills and collects smaller consumers, mostly residences. There are 28 BAPAs in the island.
Collection Efficiency
90%.
Local cost of diesel
PHP 50/liter
Electricity Demand Forecast
a. Increasing population. With a growth of 1.97%, the island’s population is estimated at 11,500 by year 2018.
b. On-going construction of new buildings/facilities. There are at least three development projects in the island: the Boracay View Resorts (500kW load); the Sky City Leisure Resort; and Cucuman Integrated Farm (13kW).
c. An existing supressed demand for household electricity as manifested by the use of alternative electricity/lighting-producing equipment/devices such generating sets, PV systems and kerosene lamps;
d. A supressed demand as expressed by businessmen (i.e., stores owners and resort operators) who wish to improve their services and products; and
e. An expressed desire by the locals for better and continuous electrical supply

57
VII. Appendix - Fact Sheet - Isla Gigantes Norte
GEOGRAPHIC INFORMATION
Geographic Location Located in the Visayans Sea at 11.60°N 123.34°E.
Distances Roughly 14 nautical miles north of Panay Island
Land Area Approximately 9.7 square kilometers
Topography Hilly with flat and narrow coastal areas. The highest point in the island is 213 metres (699 ft.).
Accessibility The island can only be reached by boats. Boats can be chartered from either the municipality of Estancia (2 hours travel) or Carles (1 hour travel). Public ferries leave daily from Estancia Port to Isla Gigantes Norte (P100/person). Private boats can also be chartered to reach the islands at a cost of P3,000.00.
Climate The climate in Gigantes Islands can be categorized as type III, according to the Philippine Atmospheric Geophysical and Astronomical Services (PAGASA) with seasons not very pronounced; relatively dry from November to April and wet during the rest of the year.
ADMINISTRATIVE INFORMATION
Political Classification Island barangays
Name of Municipality Carles, Ilolio, Region VI - Western Visayas
Barangays Asluman and Granada
Population 5,894 (Bgy. Asluman - 2,849 and Bgy. Granada - 3,045)
Number of Households 1,155
Annual population growth rate 1.51%

58
Population density 602 per square kilometre (based on provincial average)
Main population center There are two main population centers in the island - Poblacion Asluman and Poblacion Asluman. Roughly 55% of the population of the island are located in these two centers. These are also the center of the political, economic, health and educational activities.
Average household size 5
TRANSPORTATION, COMMUNICATION & OTHER INFRASTRUCTUR ES
Road network The road system is composed of barangay roads that are all earth-filled and unpaved.
Mode of transportation Motorcycle is the main form of transportation. There are no 4-wheeled vehicles in the island. The minimum fare is P10/person and will increase depending on the distance.
Communication facilities Mobile network signal in the island is quite weak. Mobile signals originate at cell sites located at main island of Panay.
Water and Sanitation Water supply comes from springs that are piped by gravity to the houses. Some enterprising local residents built small water reservoir (e.g. tanks) located near the water source and piped down the water to the houses for a fee. Fresh water is abundant providing a 24-hour supply to the communities. The island does not have a sewerage system, houses usually have their own septic tanks.
Educational Facilities 1 Elementary School, 1 High School
Health facilities 1 Barangay Health Center
ECONOMIC INFORMATION
Primary economic activities Fishing (95% of the households are engaged in fishing) and

59
tourism
Main agri/aqua cultural product Scallops, crab and dried fish (as seen in the picture at the right).There are two ice plants in the island that also acts as buying stations of fish and other marine products. These ice plants are owned by out-of-town based companies.
Ave. Annual Household Income P187,023.00 (2009 Municipal data for all barangays)
Ave. Annual Household Expenses
P139,086.00 (2009 Municipal data for all barangays)
ENERGY SUPPLY & UTLIZATION
Distribution Utility Iloilo Electric Cooperative III (ILECO III)
Power Generation
Entity NPC-SPUG
Power Plant
Capacity SPUG has three (3) generating sets – two (2) 163kW and one (1) 140kW.
Year Plant Operation Started
1997
Power Plant
operating hours 8 hours (3:30pm and ends at 11pm)
Load Demand Before Typhoon Haiyan (November 2014), the normal maximum peak load is 120kw up to 140kW. Present maximum peak load is only 100kW.

60
Load and Demand Curve
N a t i o n a l P o w e r C o r p o r a t i o n
SMALL POWER UTILITIES GROUP
L O A D A N D D E M A N D C U R V E
GIGANTES DPPJULY 2014
0100H 0200H 0300H 0400H 0500H 0600H 0700H 0800H 0900H 1000H 1100H 1200H 1300H 1400H 1500H 1600H 1700H 1800H 1900H 2000H 2100H 2200H 2300H 2400H
T O T A L C A P A B I L I T Y
0.320 0.320 0.320 0.320 0.320 0.320 0.320 0.320 0.320 0.320 0.320 0.320 0.320 0.320 0.320 0.320 0.320 0.320 0.320 0.320 0.320 0.320 0.320 0.320
S Y S T E M D E M A N D
0.030 0.068 0.102 0.099 0.093 0.078 0.065
R E S E R V E D / (D E F I C I E N C Y)
0.320 0.320 0.320 0.320 0.320 0.320 0.320 0.320 0.320 0.320 0.320 0.320 0.320 0.320 0.320 0.320 0.290 0.252 0.218 0.221 0.227 0.242 0.255 0.320
0.16 0.16 0.16 0.16 0.16 0.16 0.16 0.16 0.16 0.16 0.16 0.16 0.16 0.16 0.16 0.16 0.16 0.16 0.16 0.16 0.16 0.16 0.16 0.16
0.16 0.16 0.16 0.16 0.16 0.16 0.16 0.16 0.16 0.16 0.16 0.16 0.16 0.16 0.16 0.16 0.16 0.16 0.16 0.16 0.16 0.16 0.16 0.16
0.00
0.05
0.10
0.15
0.20
0.25
0.30
0.35
0100H 0200H 0300H 0400H 0500H 0600H 0700H 0800H 0900H 1000H 1100H 1200H 1300H 1400H 1500H 1600H 1700H 1800H 1900H 2000H 2100H 2200H 2300H 2400H
L o
a d
i
n M
e g
a w
a t
t s
T i m e i n H o u r s
Deficiency
Unit 2
Unit 1
System Demand
Rev ised Nov ember 2001
Fuel Consumption The diesel consumption before Typhoon Haiyan is 230 litres for every 8 hours of operation. After the typhoon, the diesel consumption went down to 170 litres for the same period of operation which translate into PhP21,000.00 per month.
True Cost
Generation Rate
Power Supply
Service Quality ILECO III does not maintain an office or service center in the island. ILECO III staff would travel from the mainland to perform the necessary works such as billing and collection, maintenance and repair of the distribution lines. For minor problems with the distribution lines, the NPC-SPUG staff would normally work on it. However, for major problems, NPC has to call ILECO III who, in turn, will send a team to do the repair. Since most of the power failures experienced in the island are due to distribution line faults, power interruptions are normally long since it will take time for the repair team to go to the island.
Based on observations most of distribution lines are new since the old lines damaged by Typhoon Haiyan in November 2013 were recently replaced.
Power Plant
Upgrading Plans NPC plans to replace one of the units with a new 160kW generating set by 2015.
Present Total 346 households (30% of total households)

61
Customers
Average monthly energy sales
-
Electricity Rate
(Subsidized
Approved Generation
Rate [SAGR] + Distribution
charges + VAT)
PHP 11.44616/kWhr (SAGR: PHP 6.59)
Collection System ILECO III directly bills and collects its consumer. The electric cooperative tried to establish BAPAs (Barangay Power Association) but it failed.
Collection
Efficiency 100%
Local cost of diesel PHP 50/liter
Electricity Demand Forecast
a. Increasing population. With a growth of 1.51%, the island’s population is estimated at 6,850 by year 2020;
b. Recovery from Typhoon Haiyan. The daily normal peak loads before and after the typhoon was 120kW and 100kW, respectively. As the island continue to recovery, the demand for electricity will increase;
c. An existing supressed demand for electricity as manifested by the use of alternative electricity/lighting-producing equipment/devices such generating sets, PV systems and kerosene lamps;
d. A supressed demand expressed by businessmen (i.e., stores owners, water distributor, welding shops operators and resort operators) who wish to improve their services and products; and
e. An expressed desire by the locals for better and continuous electrical supply.

62
VIII. Appendix - Fact Sheet - San Vicente, Palawan
GEOGRAPHIC INFORMATION
Geographic Location San Vicente is located in the northwest of Palawan’s mainland, bounded by the West Philippine Sea in the West, the municipality of Taytay in the north, municipality of Roxas in the East and City of Puerto Princesa in the Southwest.
Distances The town is 186 kilometers north from Puerto Princesa City, the capital of the Province of Palawan
Land Area It occupies a total land area of 165,797.6525 hectares with a forest area of 82,080.09 hectares and 22 identified islands and islets within its municipal boundaries.
Topography The terrain is characterized by narrow coastal plains and coves along the western part of the town. On the eastern sections are rolling hills and mountains.
Accessibility The town can be reached by land from Puerto Princesa City which has an operating international airport. Travel time is approximately 3-1/2 hours. In the future, direct flights to San Vicente from Manila will be possible once the airport being built in the town starts operating.
Climate San Vicente's dry season begins in December, lasting until the month of May while the onset of the wet or rainy season is in June, usually drying up again in November. North-eastern winds, the “amihan”, prevail from November to May. Rough coastal waters characterize the season of “habagat”, or the south-western winds.

63
ADMINISTRATIVE INFORMATION
Political Classification Classified as a first class municipality
Name of Municipality San Jose, Palawan, Region IV-B MIMAROPA
Barangays The municipality has jurisdiction over ten (10) barangays: Alimanguan, Binga, Caruray, Kemdeng, New Agutaya, New Canipo, Poblacion, Port Barton, San Isidro, and Sto. Nino..
Population 30,919 (2010 Census)
Number of Households 6,460 (2010 Census)
Annual population growth rate 6.0% (2010 Census)
Population density 21 persons per square kilometer (2010 Census)
Average household size 5 (2010 Census)
TRANSPORTATION, COMMUNICATION & OTHER INFRASTRUCTUR ES
Road network Roads (two-lane concrete roads) and other infrastructure support facilities are now on its implementation process funded by the National Government. However, most of these road improvements are located on the Poblacion and its nearby barangays and the access roads from the main provincial highway to Port Barton and the Poblacion. A provincial road that runs along the coast, connects all the barangays of San Vicente, however, this road is in a dilapidated condition.
Mode of transportation
San Vicente is accessible by bus & shuttle vans, from several points such as directly from Puerto Princesa City, or via the municipality of Roxas. Within San Vicente, tricycles, motorcycles, and outrigger boats are the usual mode of transportation.
Communication Cell phone signals are relatively good since major telecomunication

64
facilities companies has installed cell sites in several barangays in the town(i.e., Poblacion, Alimanguan, Binga, Port Barton and Caruray). Cable TV and Internet services are also available in the barangays of Poblacion, Alimanguan and Port Barton.
Water and Sanitation
The Municipality’s water supply is mostly shared community water system primarily composed of a common water source (usually a spring) and water piped to the houses. No centralized sewerage treatment, only septic tanks per household or establishment are used.
Educational Facilities
Aside from the elementary schools at each of the barangay, the municipality has the San Vicente National High School. It also host branches of Palawan State University and Palawan Poly-technical College Inc. which offer tertiary education.
Health facilities The municipality has no major hospital, instead it has a Rural Health Unit and several barangay health centers.
ECONOMIC INFORMATION
Primary economic activities Fishing and farming are the major economic activities in San Vicente wherein 29.50% and 25.77%, respectively are engaged in it. Tourism is a growing industry. The municipality has several white sand beaches including a 14km beachfront, waterfalls, islets, coral reef sites, vast forest cover, mangroves, and varied endemic flora and fauna are also some of the attractions.
Main agricultural product Rice, coconut and marine products
Ave. Annual Household Income P132,640.00 (2009 data for the province)
Ave. Annual Household Expenses
P112,822.00 (2009 data for the province)

65
ENERGY SUPPLY & UTLIZATION
Distribution Utility Palawan Electric Cooperative (PALECO)
Power Generation Entity National Power Corporation – Small Power Utilities Group (NPC-SPUG)
Power Plant Capacity The NPC-SPUG plant consists of three diesel generating sets: 1 – 500kW (with only 400 kW dependable); 1 - 260 kW; and 1-160 kW. The first unit is used for the base load and the last two are for peaking/reserve purposes. All generators are old and need replacement.
Year Plant Operation Started
1995
Power Plant operation 16 hours: 8am to 12am
Load Demand Peak load is 0.50MW, with a load factor of 51.54%
Load and Demand Curve N a t i o n a l P o w e r C o r p o r a t i o n
SMALL POWER UTILITIES GROUP
L O A D A N D D E M A N D C U R V E
San Vicente Diesel Power PlantMay 2013
0100H 0200H 0300H 0400H 0500H 0600H 0700H 0800H 0900H 1000H 1100H 1200H 1300H 1400H 1500H 1600H 1700H 1800H 1900H 2000H 2100H 2200H 2300H 2400H
T O T A L C A P A B I L I T Y
0.000 0.000 0.000 0.000 0.000 0.000 0.000 0.400 0.400 0.400 0.400 0.400 0.400 0.400 0.400 0.400 0.400 0.400 0.620 0.620 0.620 0.620 0.400 0.400
S Y S T E M D E M A N D
0.225 0.305 0.345 0.375 0.380 0.360 0.380 0.370 0.330 0.330 0.340 0.480 0.515 0.500 0.440 0.355 0.300
R E S E R V E D / (D E F I C I E N C Y)
0.000 0.000 0.000 0.000 0.000 0.000 0.000 0.175 0.095 0.055 0.025 0.020 0.040 0.020 0.030 0.070 0.070 0.060 0.140 0.105 0.120 0.180 0.045 0.100
0.400 0.400 0.400 0.400 0.400 0.400 0.400 0.400 0.400 0.400 0.400 0.400 0.400 0.400 0.400 0.400 0.400
0.220 0.220 0.220 0.220
0.00
0.10
0.20
0.30
0.40
0.50
0.60
0.70
0100H 0200H 0300H 0400H 0500H 0600H 0700H 0800H 0900H 1000H 1100H 1200H 1300H 1400H 1500H 1600H 1700H 1800H 1900H 2000H 2100H 2200H 2300H 2400H
L o
a d
i n
M
e g
a w
a t
t s
T i m e i n H o u r sUnit 4 Unit 1 Unit 2 Unit 3 Deficiency System Demand
Rev ised Nov ember 2001
Fuel Consumption Diesel consumption is 3.2 liters/kWhr which translate into PhP21,000.00 per month.
True Cost Generation Rate PhP31.0995/kWh (based on a 2012 NPC audit)
Power Supply Service Quality
Due to old age of the diesel generators, breakdowns are normal occurrences and lack of replacement parts worsened the situations. Power failures are frequent. Poor power quality (i.e., low voltages and

66
unstable frequencies) can be deduced from users who complaint of damaged appliances or equipment.
Power Plant Upgrading Plans
NPC-SPUG plans to replace the units with two (2) brand new 450kw generating sets in 2015. However, It is not clear to date when this plan will be
realized.
Total Customers 2,144 (mostly residential users and a few commercial establishments)
Average monthly energy sales
125,416 MWh (2012 data)
Electricity Rate
(Subsidized Approved Generation Rate [SAGR] + Distribution Charges + VAT)
PHP 8.90/kWhr (SAGR: PHP 6.4812)
Collection System The cooperative directly bills and collects from customers.
Collection Efficiency 90%.
Local cost of diesel P50/liter
Electricity Demand Forecast
The demand for electricity in San Vicente is expected to grow due to the following:
a. Increasing population. With a growth rate of 6.0%, the San Vicente’s figure is higher than the national average of 2%;
b. An increasing tourist arrival. In the early 2000s, the annual tourists arrivals numbered only in the hundreds. But starting 2009, the visitors are arriving in the thousands;
c. On-going construction of new buildings/facilities (e.g. airport, resorts, golf course, etc.);
d. An existing supressed demand for electricity as manifested by the use of alternative electricity/lighting-producing equipment/devices such generating sets, PV systems and kerosene lamps;
e. A supressed demand as expressed by businessmen (i.e., stores owners and resort operators) who wish to improve their services and products; and
f. An expressed desire by the locals for better and continuous electrical supply.