hybrid (solar pv-diesel) mini grids in philippines - giz.de
TRANSCRIPT
Varun Gaur, PPRE, University of Oldenburg Page 1
Master Thesis Report June 2013
Hybrid (Solar PV-Diesel) Mini Grids in Philippines
Prepared for
GIZ Germany
Prepared By
Varun Gaur Masters Student (2011-2013)
Post Graduate Program in Renewable Energy (PPRE)
University of Oldenburg, Germany
Email: [email protected]

Varun Gaur, PPRE, University of Oldenburg Page 2
Varun Gaur, PPRE, University of Oldenburg Page 3
Acknowledgement
Foremost, I would like to express my sincere gratitude to my supervisors Dr Detlev Heinemann (University of Oldenburg) and Mr Tobias Cossen (GIZ) for the continuous support in my Master thesis and research, for their patience, motivation, enthusiasm and immense knowledge. Their guidance helped me in all the time of research and writing of this thesis. Besides my main supervisors, I will also like to thank the entire team at Project Development Program (PEP) of GIZ for their support. Last but not the least, I would like to thank my family for supporting me throughout the life

Varun Gaur, PPRE, University of Oldenburg Page 4
Table of Contents
CHAPTE R 1 INTRODUCTION . . . . . . . . . . . . . . . . . . . . . . . . . . . . . . . . . . . . . . . . . . . . . . . . . . . . . . . . . . . . . . . . . . . . . . . . . . . . . . . . .6 1.1 Background ...................................................................................................................... 6 1.2 Objectives of my Master Thesis ...................................................................................... 7 1.3 Methodology .................................................................................................................... 7 1.4 Contents of the Report ..................................................................................................... 9
CHAPTER 2 PHILIPPINES: AN OVERVIEW . . . . . . . . . . . . . . . . . . . . . . . . . . . . . . . . . . . . . . . . . . . . . . . . . . . . . . . . . 10 2.1 Basic Information........................................................................................................... 10 2.2 Electricity sector in Philippines ..................................................................................... 12
2.3 Electricity Generation by Source ................................................................................... 12 2.4 Need for Renewable Energy and trends in the Fossil Fuel mix of Grid ........................ 14
CHAPT ER 3 OFF GRI D EL ECT RI CIT Y I N PHIL IPP INES . . . . . . . . . . . . . . . . . . . . . . . . . . . . . . . . . . . . . . . . . . . . . . . . . 16 3.1 Current Scenario ............................................................................................................ 16 3.2 Strategy of the Government in the Off Grid Sector ....................................................... 17 3.3 Schemes for Off Grid Electrification ............................................................................. 18
3.4 Problems with Diesel Mini Grids and the need for Renewable Energy ........................ 19 3.5 Schemes for Renewable Energy in Off Grid Electrification ......................................... 21
CHAPTER 4: ELECTRIFICATION SCENARIO IN PHILIPPINE ISLANDS . . . . . . . . . . . . . . . . . . 22 4.1: Status Quo of Electricity in Island A ............................................................................ 22
4.1.1 Electricity Consumption in the island (Findings from Household survey) ......... 26
4.1.2 Electricity Generation in the Island ..................................................................... 28 4.1.3 Transmission and Distribution of electricity........................................................ 29
4.1.4 Other important findings from Island A .............................................................. 30 4.2: Status Quo of Electrification in Island B ...................................................................... 31 4.3: Status Quo of Electrification in Island C ...................................................................... 33
CHAPTER 5 MODELLING OF THE SOLAR-DIESEL HYBRID POWER SYSTEM . . . . . . . . 36 5.1: Indicative Technical Configuration of the proposed Solar-Diesel Hybrid Power
System .................................................................................................................................. 37
5.2: Methodology for Modelling the Hybrid Power System ............................................... 38 5.3: Resultant Excel Tool for modelling the Hybrid Power System.................................... 45
CHAPTER 6: RESULTS OF THE MODELING OF SOLAR-DIESEL HYBRID SYSTEM FOR ISLAND A
& ISLAND B . . . . . . . . . . . . . . . . . . . . . . . . . . . . . . . . . . . . . . . . . . . . . . . . . . . . . . . . . . . . . . . . . . . . . . . . . . . . . . . . . . . . . . . . . . . . . . . . . . . . 47 6.1: Different Load Scenarios for Island A .......................................................................... 47
6.2: Modelling results for Island A-Scenario1 ..................................................................... 49 6.2.1 Sensitivity Analysis for IslandA-Scenario1 ............................................................ 50
6.3: Modelling results for Island A-Scenario2 ..................................................................... 53 6.3.1 Sensitivity Analysis for IslandA-Scenario2 ............................................................ 54
6.4: Modelling results for Island A-Scenario3 ..................................................................... 57
6.4.1 Sensitivity Analysis for IslandA-Scenario3 ............................................................ 58 6.5: Modelling results for Island B ...................................................................................... 61
6.5.1 Sensitivity Analysis for IslandA-Scenario2 ............................................................ 62 CHAPTER 7: ASSESSMENT OF ROOFTOP PV POTENTIAL IN ISLAND B . . . . . . . . . . . . . . . 65
7.1: Methodology for the Assessment ................................................................................. 65 7.2: Resorts with relevant roof tops for Solar PV installations............................................ 67
7.3: Potential Roof Top Solar PV installation in Island B ................................................... 73 CHAPT ER 8: CO NCLUSIO NS . . . . . . . . . . . . . . . . . . . . . . . . . . . . . . . . . . . . . . . . . . . . . . . . . . . . . . . . . . . . . . . . . . . . . . . . . . . . . . . . . 74

Varun Gaur, PPRE, University of Oldenburg Page 5
ANNEXURES . . . . . . . . . . . . . . . . . . . . . . . . . . . . . . . . . . . . . . . . . . . . . . . . . . . . . . . . . . . . . . . . . . . . . . . . . . . . . . . . . . . . . . . . . . . . . . . . . . . 76 REFERENCES . . . . . . . . . . . . . . . . . . . . . . . . . . . . . . . . . . . . . . . . . . . . . . . . . . . . . . . . . . . . . . . . . . . . . . . . . . . . . . . . . . . . . . . . . . . . . . . . . 98
Varun Gaur, PPRE, University of Oldenburg Page 6
CHAPTER 1 INTRODUCTION
1.1 Background
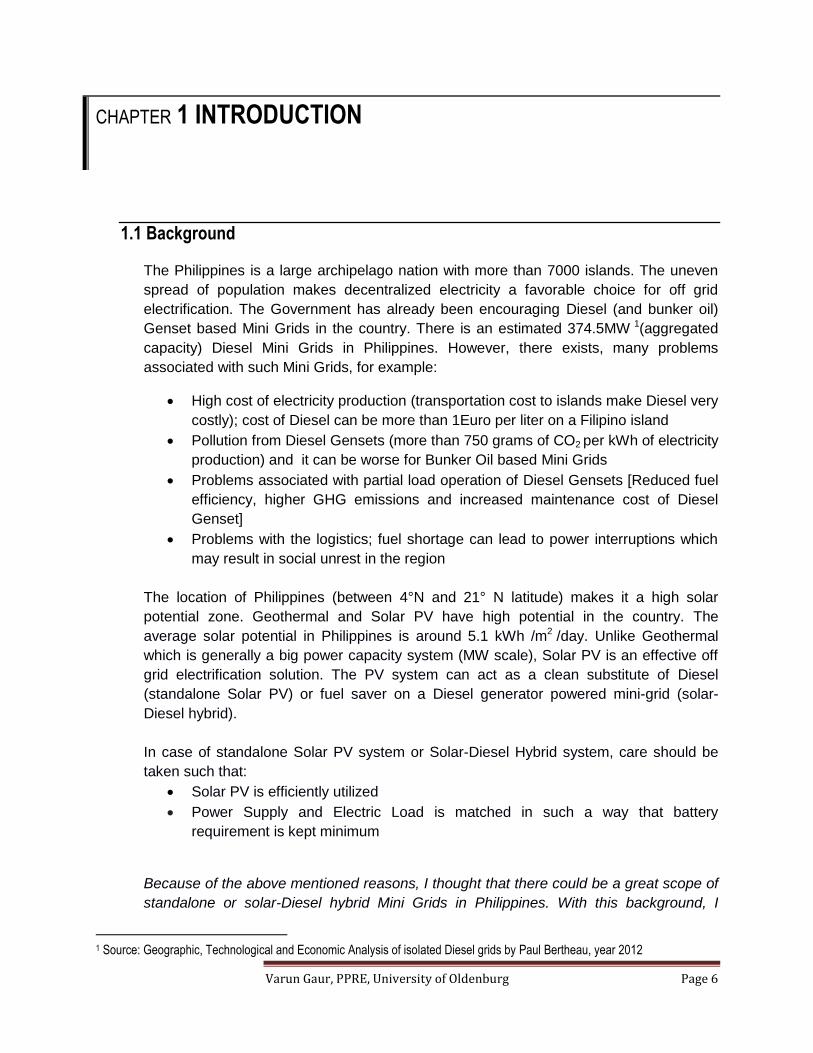
The Philippines is a large archipelago nation with more than 7000 islands. The uneven
spread of population makes decentralized electricity a favorable choice for off grid
electrification. The Government has already been encouraging Diesel (and bunker oil)
Genset based Mini Grids in the country. There is an estimated 374.5MW 1(aggregated
capacity) Diesel Mini Grids in Philippines. However, there exists, many problems
associated with such Mini Grids, for example:
High cost of electricity production (transportation cost to islands make Diesel very
costly); cost of Diesel can be more than 1Euro per liter on a Filipino island
Pollution from Diesel Gensets (more than 750 grams of CO2 per kWh of electricity
production) and it can be worse for Bunker Oil based Mini Grids
Problems associated with partial load operation of Diesel Gensets [Reduced fuel
efficiency, higher GHG emissions and increased maintenance cost of Diesel
Genset]
Problems with the logistics; fuel shortage can lead to power interruptions which
may result in social unrest in the region
The location of Philippines (between 4°N and 21° N latitude) makes it a high solar
potential zone. Geothermal and Solar PV have high potential in the country. The
average solar potential in Philippines is around 5.1 kWh /m2 /day. Unlike Geothermal
which is generally a big power capacity system (MW scale), Solar PV is an effective off
grid electrification solution. The PV system can act as a clean substitute of Diesel
(standalone Solar PV) or fuel saver on a Diesel generator powered mini-grid (solar-
Diesel hybrid).
In case of standalone Solar PV system or Solar-Diesel Hybrid system, care should be
taken such that:
Solar PV is efficiently utilized
Power Supply and Electric Load is matched in such a way that battery
requirement is kept minimum
Because of the above mentioned reasons, I thought that there could be a great scope of
standalone or solar-Diesel hybrid Mini Grids in Philippines. With this background, I
1 Source: Geographic, Technological and Economic Analysis of isolated Diesel grids by Paul Bertheau, year 2012
Varun Gaur, PPRE, University of Oldenburg Page 7
carried out my Master thesis- “Hybrid (Solar PV- Diesel) Mini Grids in Philippine Islands”.
The Master thesis aims to answer the following research questions:
What is the Electrification Scenario in Philippine Islands? What are the
associated problems? Is there at all any intervention required?
What will be the impact of injecting Solar PV into the existing Diesel Mini Grids?
Will it be cost effective to hybridize or completely solarize existing Diesel Mini
Grids?
1.2 Objectives of my Master Thesis
I had the following objectives behind my Master thesis:
1. To assess the Off Grid electrification scenario in Philippines, with the focus on Diesel
Mini Grids in selected islands;
2. To understand the impact of injecting Solar PV into the existing Diesel Mini Grids in
Philippine Islands, with focus on the impact on Levelized cost of electricity generation
1.3 Methodology
I carried out my thesis under the supervision of
Dr Detlev Heinemann (my Professor at the University of Oldenburg, Germany)
Mr Tobias Cossen (Project Manager, PEP- GIZ (German Agency for International
Cooperation))
I utilized following methodology to execute my thesis:
Activity 1: Getting an overview of the Electricity Sector of Philippines
I started my thesis with the literature survey of Electricity Sector in Philippines, with the
focus on OffGrid Electricity. With the support of GIZ, I also attended a high level talk by
Philippine delegation to Germany that helped me in getting deeper insights into the
electricity sector of Philippines.
Activity 2: Assessment of Solar/ Solar Diesel Hybrid Mini Grids elsewhere in the
world
Simultaneous to Activity 1, I also studied existing Solar/ Solar-Diesel Hybrid Mini Grids
all across the world. For this, I utilized literature on the internet and various publications
at the library of Technical University, Berlin. GIZ also helped me in undergoing relevant
trainings at SMA Solar Academi (Kassel Germany) where I learnt Island System of SMA.
I later utilized the knowledge of SMA Sunny Island system to model the Hybrid Power
System. I also participated in various Renewable Energy workshops in Germany and
took regular guidance from the Experts in the field of Decentralized Energy.
Varun Gaur, PPRE, University of Oldenburg Page 8
Activity 3: Scoping Mission to Philippine Islands
Activity 1 and Activity 2 prepared me with the broad picture of Philippine OffGrid
Electricity Sector and the possible Renewable Energy options. Thereafter, I undertook a
scoping mission to Philippines with the objective to understand the electricity load
pattern, electricity supply system and electricity costs in the selected islands. This
mission was supported by GIZ and I was locally assisted by the GIZ’s local partner
Powersource Philippines Inc (PSPI). This mission was a part of collaboration between
GIZ and PSPI and therefore some information will be kept confidential in the thesis
report.
During the mission, I surveyed 3 islands (I will call them as Island A, Island B and Island
C) with the focus on Island A. As a part of my mission, I carried out a household survey
and the interviews of mini grid operators in the Island A, whereas for Island B and Island
C, I only carried out preliminary assessment of their Mini Grids.
Activity 4: Modelling the power supply system for the Solar/ Solar-Diesel Hybrid
Mini Grids in the selected island
Activity 3 helped me in getting precise information on the electricity load pattern and the
electricity generation system of the selected island. After coming back to Germany, I
utilized this information to model the Solar/ Solar Diesel Hybrid Mini Grid in the selected
island. By modelling, I mean re-producing different system configurations (power system
sizes) and the associated costs (investment costs and electricity generation costs),
based on different input parameters (such as Electric Load, Solar Insolation, Solar
penetration, etc).
For the modelling:
I utilized the technical configuration of Hybrid System on the lines of SMA Island
System
I developed an excel application which inputs local parameters (such as Electric
Load curve, Solar Insolation, Diesel costs, required solar penetration etc) and
provides the required Power supply system configuration and the associated
costs (system costs and electricity generation costs)
I then carried out sensitivity analysis to understand the possible influencing
parameters to the proposed Hybrid System.
Activity 5: Rooftop PV assessment
Island B is a tourist island with a large number of resorts. During my survey, I was also
advised to do an indicative assessment of possible Rooftop Solar PV potential of the
resorts.
Varun Gaur, PPRE, University of Oldenburg Page 9
1.4 Contents of the Report
There are 8 chapters in the report including the current chapter on Introduction.
The next Chapter (Chapter 2) presents a general overview of Philippines and its
electricity sector. Chapter 3 focuses on the OffGrid electricity Sector in Philippines. It will
talk about the current government strategy and schemes for the offgrid electricity.
Chapter 4 presents the execution of my Scoping Mission and the results of the survey.
Chapter 5 details out my methodology and the resultant excel application which I have
utilized to model the Solar/ Solar Diesel Hybrid Power System. The results of system
modelling and various sensitivity analyses are discussed in Chapter 6. The focus of
modelling is Island A. Chapter 7 presents the results of Roof Top PV assessment at
Island B.
Chapter 8 concludes the report.

Varun Gaur, PPRE, University of Oldenburg Page 10
CHAPTER 2 PHILIPPINES: AN OVERVIEW
2.1 Basic Information
Situated in Southeast Asia, the Philippines is a sovereign state with a democratic
government. It is a large archipelago nation with an estimated 7,107 islands, out of
which around 3,000 are inhabited (source ACCESS project, UNDP). It has a coastline of
around 36000 kms. To its west across the South China Sea lies Vietnam and in the east,
it is surrounded by Philippine Sea. Across the sea on north lies Taiwan and on the south
sits Indonesia and Malaysia. Located between 4°N and 21° N latitude, it is situated on
the pacific ring of fire and pacific typhoon belt
Philippines is the 12th most populous country in the world with a population of around 92
million (Census 2010, source-Wikipedia). In addition, there are around 12 million
Filipinos which live overseas. Manila is its capital with a population of around 1.6 million.
Philippines is the 43rd largest economy in the world where contribution of agriculture,
industry and Service sector are 13.8%, 30% and 56.2% respectively (source: Wikipedia).
Figure 2.a: Map of Philippines; Source: World Atlas
Varun Gaur, PPRE, University of Oldenburg Page 11
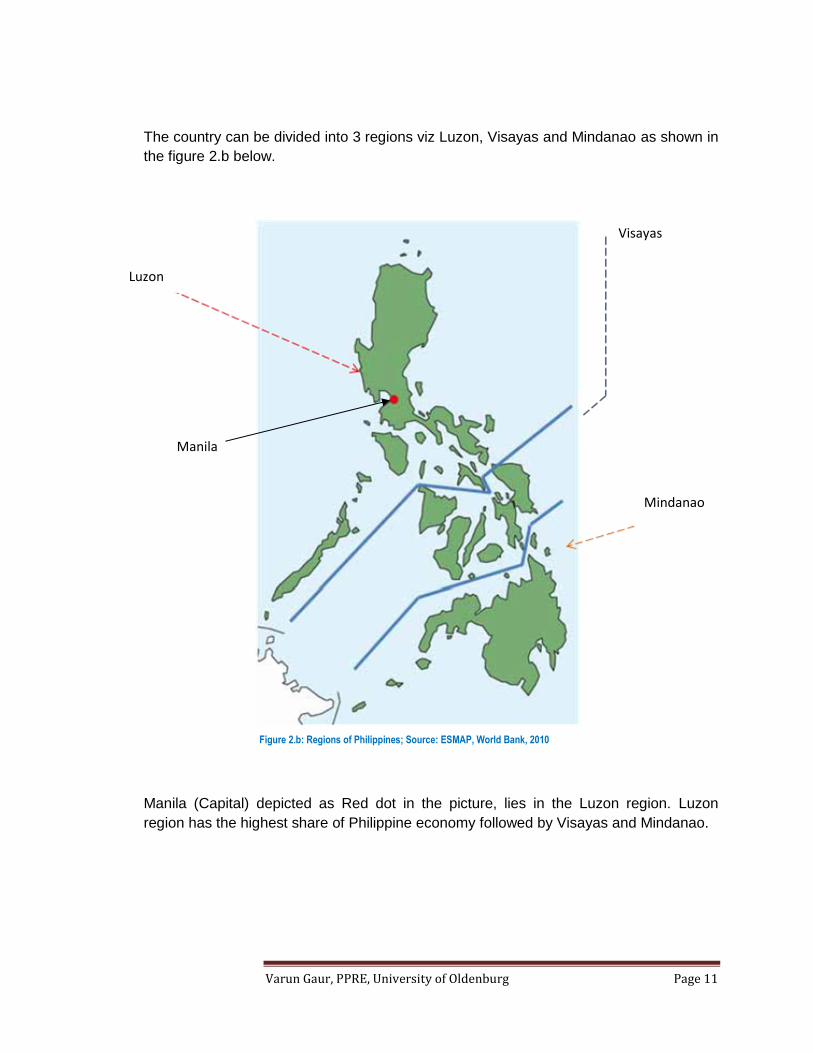
The country can be divided into 3 regions viz Luzon, Visayas and Mindanao as shown in
the figure 2.b below.
Manila (Capital) depicted as Red dot in the picture, lies in the Luzon region. Luzon
region has the highest share of Philippine economy followed by Visayas and Mindanao.
Figure 2.b: Regions of Philippines; Source: ESMAP, World Bank, 2010
Luzon
Visayas
Mindanao
Manila
Varun Gaur, PPRE, University of Oldenburg Page 12
2.2 Electricity sector in Philippines
Philippines has an electrification rate of 83% with around 16 million people living without
access to electricity (Source IEA, 2012). Luzon has the highest electrification rate
followed by Visayas and then Mindanao.
The Organizational Structure of Electricity Sector in Philippines and the
concerned agencies are as follows
Policy Making: Department of Energy
Electricity Regulations: Energy Rgulations Commission
Electricity Generation: Generation sector was earlier dominated by state owned
NPC (National Power Corporation), however, it is now open to private players
and there are already many IPPs selling power to NPC.
Electricity Transmission: Transmission seactor was earlier under NPC,
however, now it is privatized: National Power Grid Corporation of Philippines is
currently the Transmission Operator and is a joint venture between a Chinese
and a Filipino company.
Electricity Distribution: Distribution sector is vastly privatized. Distribution
sector includes: Investor owned electric utilities (Meralco is one of them), Electric
Cooperatives or local government owned utilities
National Electrification Administration (NEA) provides financial as well as
technical assistance to Electric Cooperatives
Off Grid electrification: Off Grid Sector is dominated by NPC-SPUG (National
Power Corporation- Small Power Utility Group); Some areas are also operated
by NPPs (New Private Power Producers) and QTPs (Qualified Third Parties);
Offgrid sector is explained in the next chapter.
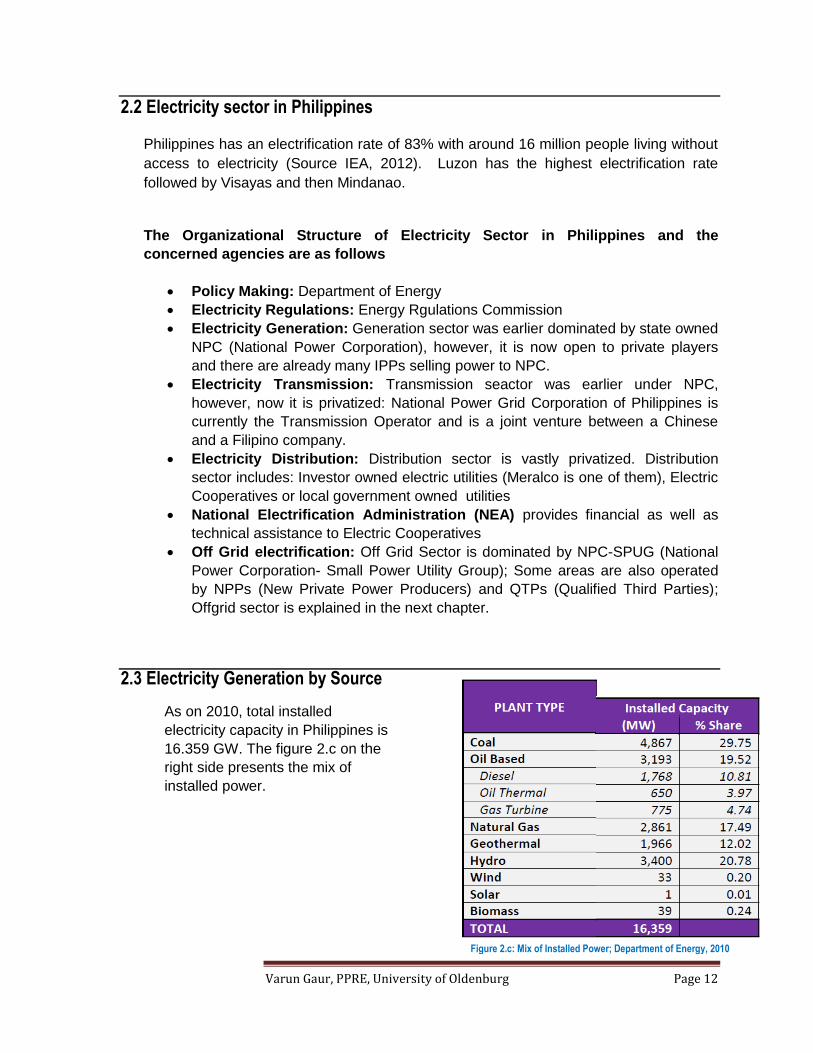
2.3 Electricity Generation by Source
As on 2010, total installed
electricity capacity in Philippines is
16.359 GW. The figure 2.c on the
right side presents the mix of
installed power.
Figure 2.c: Mix of Installed Power; Department of Energy, 2010
Varun Gaur, PPRE, University of Oldenburg Page 13
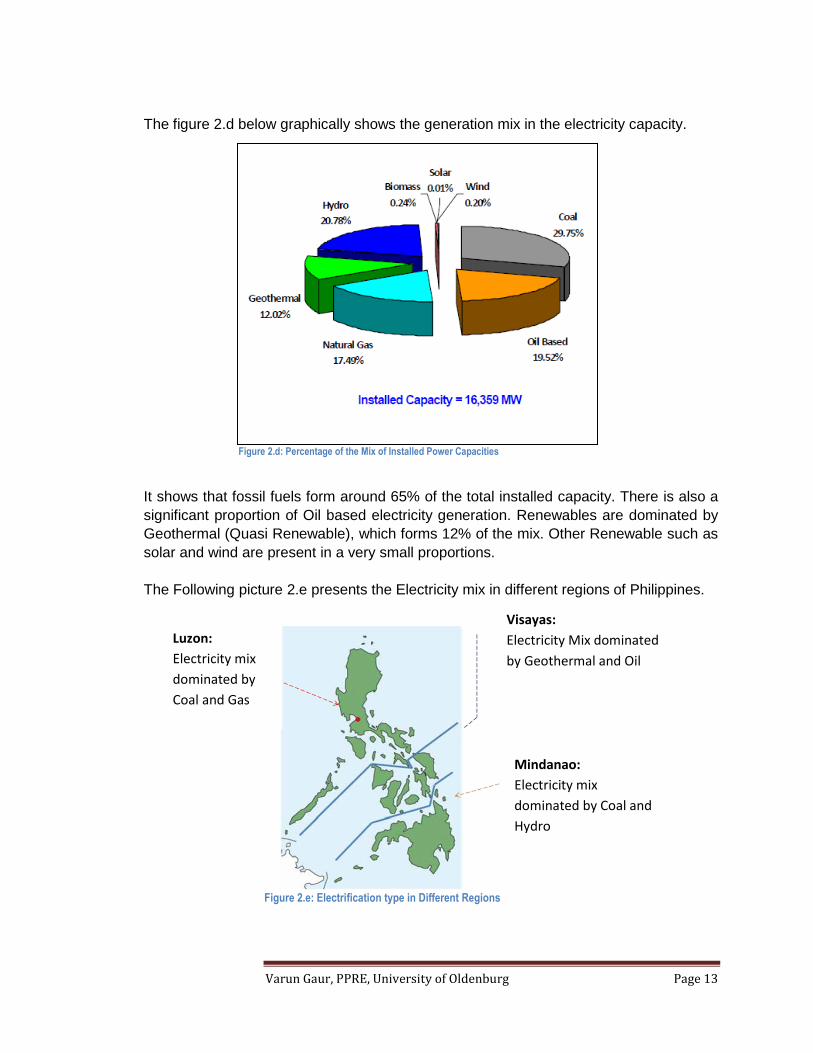
The figure 2.d below graphically shows the generation mix in the electricity capacity.
It shows that fossil fuels form around 65% of the total installed capacity. There is also a
significant proportion of Oil based electricity generation. Renewables are dominated by
Geothermal (Quasi Renewable), which forms 12% of the mix. Other Renewable such as
solar and wind are present in a very small proportions.
The Following picture 2.e presents the Electricity mix in different regions of Philippines.
Figure 2.d: Percentage of the Mix of Installed Power Capacities
Luzon:
Electricity mix
dominated by
Coal and Gas
Visayas:
Electricity Mix dominated
by Geothermal and Oil
Mindanao:
Electricity mix
dominated by Coal and
Hydro
Figure 2.e: Electrification type in Different Regions
Varun Gaur, PPRE, University of Oldenburg Page 14
As shown, each region has a combination of base load power plants (such as Coal or
Geothermal) and balancing power plants (such as Gas, Hydro or Oil)
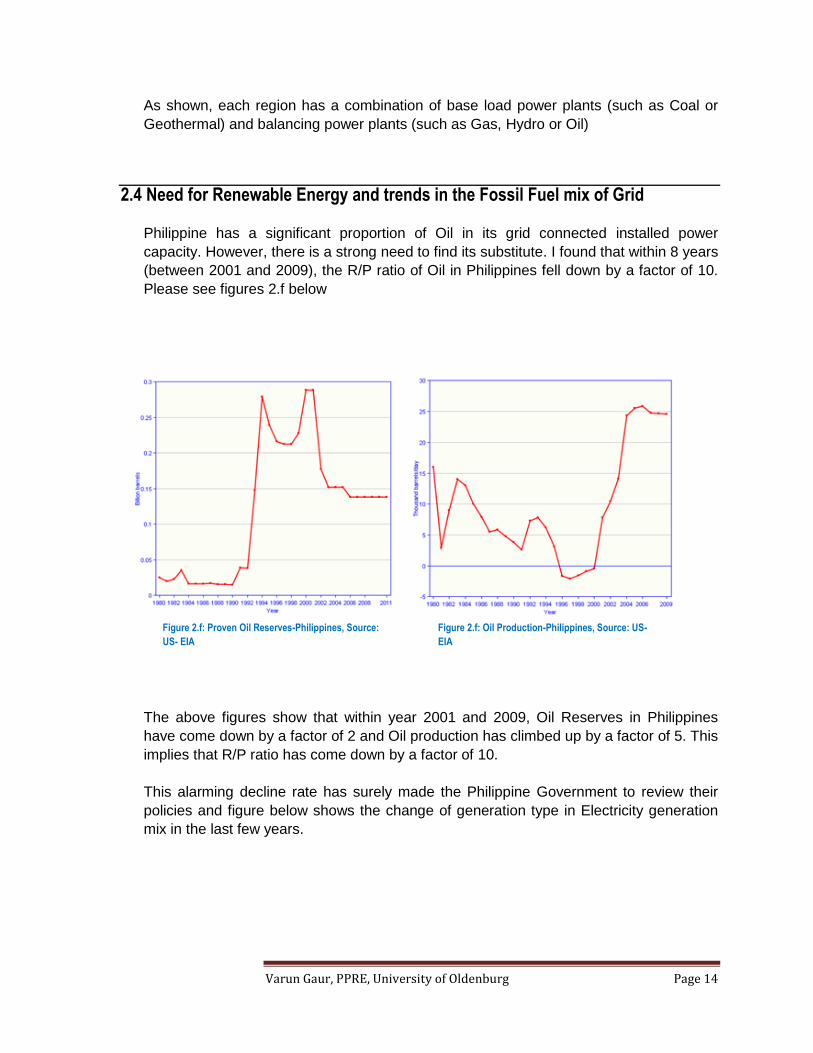
2.4 Need for Renewable Energy and trends in the Fossil Fuel mix of Grid
Philippine has a significant proportion of Oil in its grid connected installed power
capacity. However, there is a strong need to find its substitute. I found that within 8 years
(between 2001 and 2009), the R/P ratio of Oil in Philippines fell down by a factor of 10.
Please see figures 2.f below
The above figures show that within year 2001 and 2009, Oil Reserves in Philippines
have come down by a factor of 2 and Oil production has climbed up by a factor of 5. This
implies that R/P ratio has come down by a factor of 10.
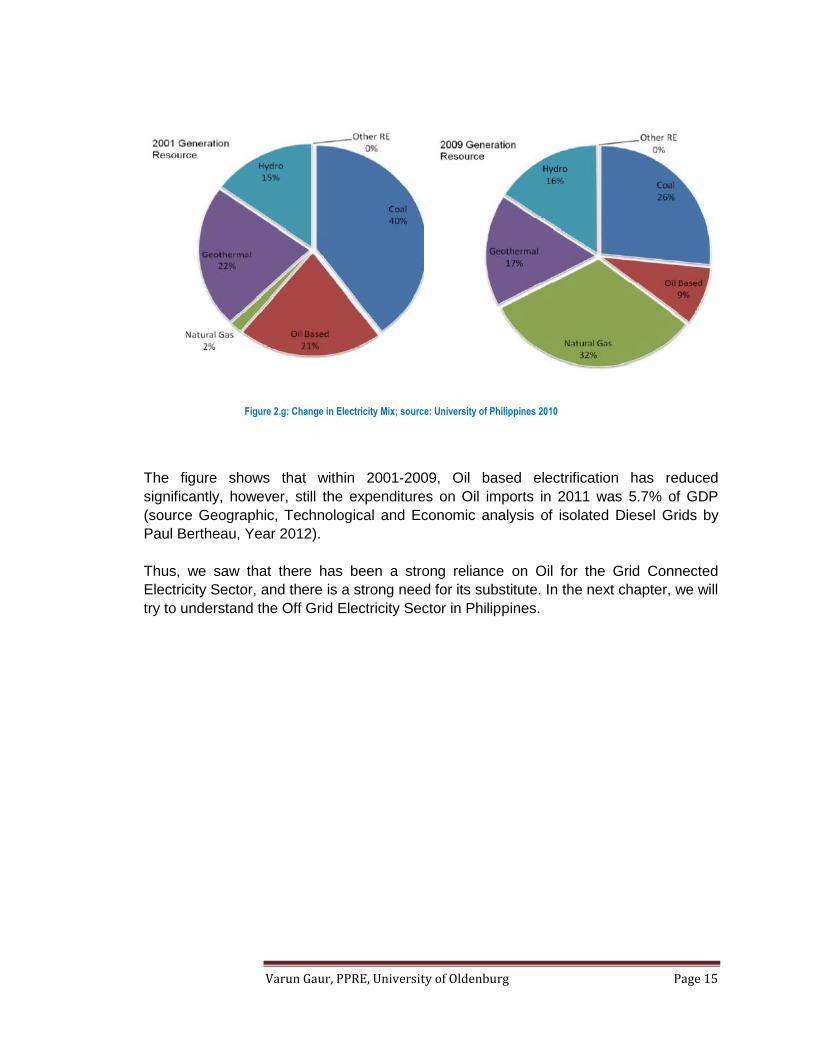
This alarming decline rate has surely made the Philippine Government to review their
policies and figure below shows the change of generation type in Electricity generation
mix in the last few years.
Figure 2.f: Proven Oil Reserves-Philippines, Source:
US- EIA
Figure 2.f: Oil Production-Philippines, Source: US-
EIA
Varun Gaur, PPRE, University of Oldenburg Page 15
The figure shows that within 2001-2009, Oil based electrification has reduced
significantly, however, still the expenditures on Oil imports in 2011 was 5.7% of GDP
(source Geographic, Technological and Economic analysis of isolated Diesel Grids by
Paul Bertheau, Year 2012).
Thus, we saw that there has been a strong reliance on Oil for the Grid Connected
Electricity Sector, and there is a strong need for its substitute. In the next chapter, we will
try to understand the Off Grid Electricity Sector in Philippines.
Figure 2.g: Change in Electricity Mix; source: University of Philippines 2010

Varun Gaur, PPRE, University of Oldenburg Page 16
CHAPTER 3 OFF GRID ELECTRICITY IN PHILIPPINES
3.1 Current Scenario
NPC-SPUG (National Power Cooperation- Small Power Utiliy Group) is the government
agency majorly responsible for off grid/ island electrification in Philippines. Offgrid/
Island electrification sector in the country is primarily based on Diesel Gensets. As per a
recent study2 , there exists around 374.5 MW of Diesel Mini Grids in Philippines. NPC-
SPUG operates 534 generating units with a capacity of 278.398 MW in 221 areas. NPC
SPUG has been able to energize 3,947 barangays (villages), most of which depend on
Diesel Genset (with an exception of hydro and wind at one location each).
As per the data from NPC SPUG, 11% of island Mini Grids (of NPC-SPUG) operate for
24 hours while remaining provide electricity for less than 24 hours, with majority of them
operating for 6-8 hours. Presented below is the classification of Diesel Mini Grids based
on their hours of operation.
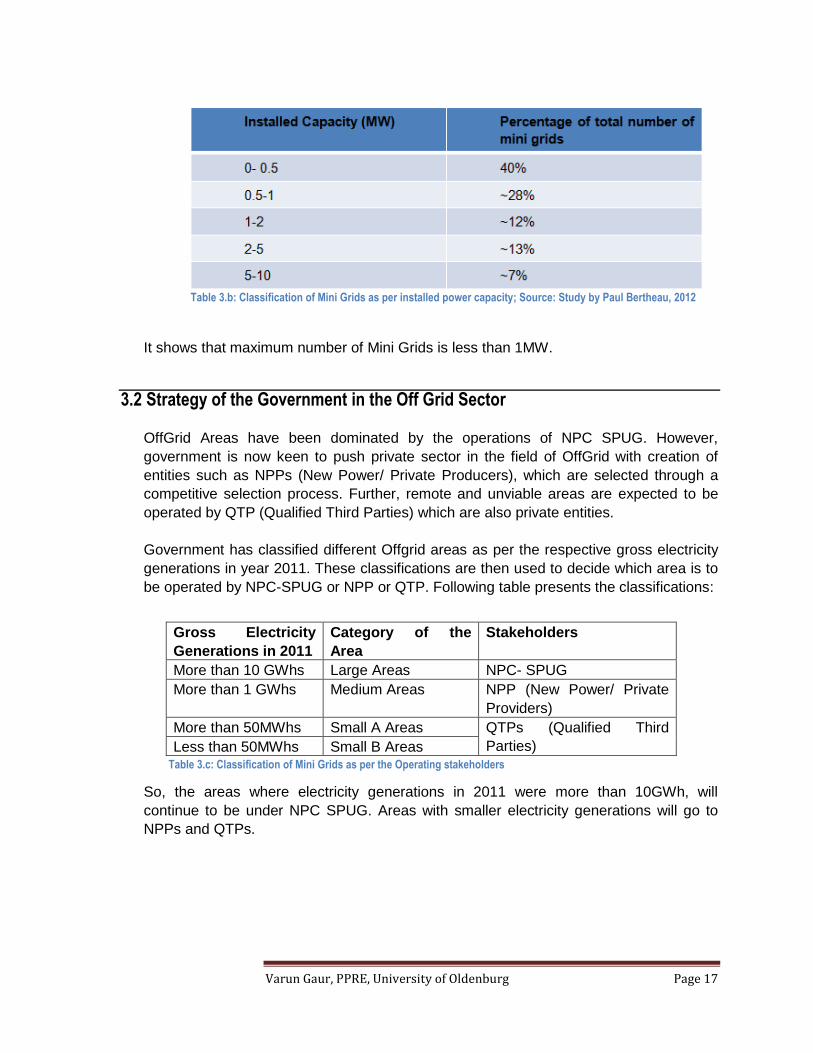
Presented next is the classification of Mini Grids based on the installed power capacity.
2 Geographic, Technological and Economic analysis of isolated Diesel Grids by Paul Bertheau, Year 2012
Service Hours of Mini Grids Mini Grid Areas (Numbers)
6-8 hours 149
10-15 hours 36
16-20 hours 11
24 hours 25
Total 221
Table 3.a: Classification of Mini Grids as per the hours of operations; Source: NPC SPUG
Varun Gaur, PPRE, University of Oldenburg Page 17
It shows that maximum number of Mini Grids is less than 1MW.
3.2 Strategy of the Government in the Off Grid Sector
OffGrid Areas have been dominated by the operations of NPC SPUG. However,
government is now keen to push private sector in the field of OffGrid with creation of
entities such as NPPs (New Power/ Private Producers), which are selected through a
competitive selection process. Further, remote and unviable areas are expected to be
operated by QTP (Qualified Third Parties) which are also private entities.
Government has classified different Offgrid areas as per the respective gross electricity
generations in year 2011. These classifications are then used to decide which area is to
be operated by NPC-SPUG or NPP or QTP. Following table presents the classifications:
So, the areas where electricity generations in 2011 were more than 10GWh, will
continue to be under NPC SPUG. Areas with smaller electricity generations will go to
NPPs and QTPs.
Gross Electricity
Generations in 2011
Category of the
Area
Stakeholders
More than 10 GWhs Large Areas NPC- SPUG
More than 1 GWhs Medium Areas NPP (New Power/ Private
Providers)
More than 50MWhs Small A Areas QTPs (Qualified Third
Parties) Less than 50MWhs Small B Areas Table 3.c: Classification of Mini Grids as per the Operating stakeholders
Table 3.b: Classification of Mini Grids as per installed power capacity; Source: Study by Paul Bertheau, 2012
Varun Gaur, PPRE, University of Oldenburg Page 18
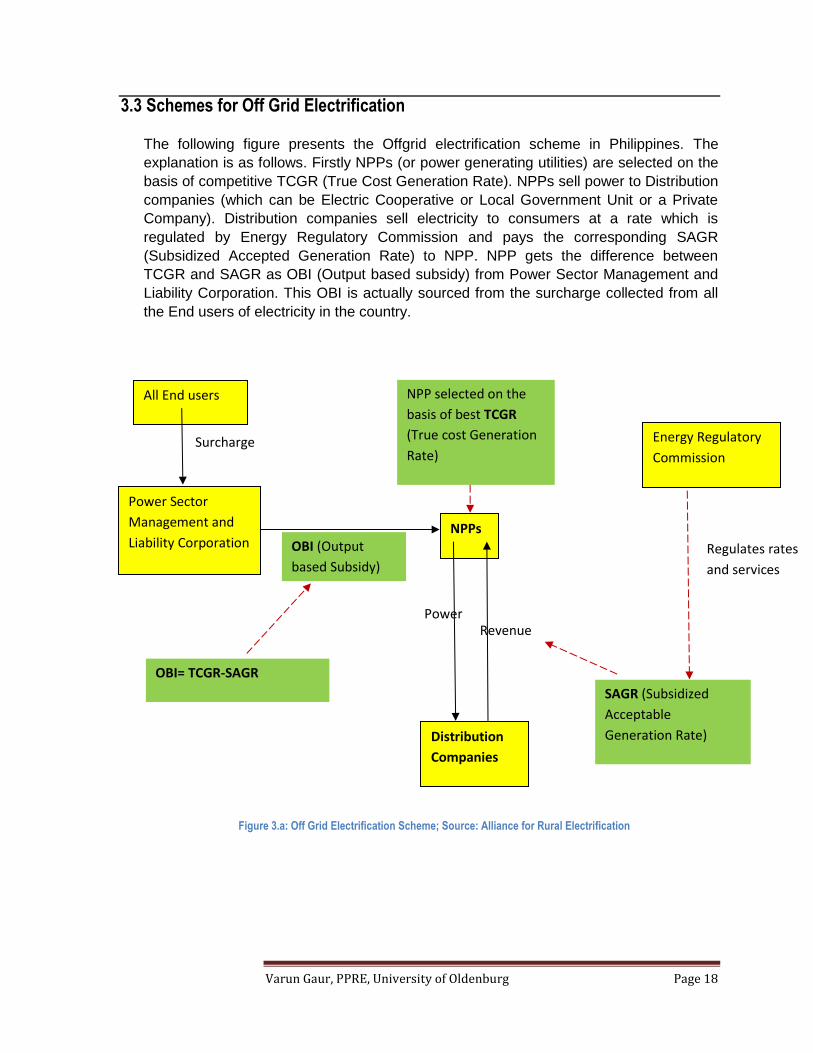
3.3 Schemes for Off Grid Electrification
The following figure presents the Offgrid electrification scheme in Philippines. The
explanation is as follows. Firstly NPPs (or power generating utilities) are selected on the
basis of competitive TCGR (True Cost Generation Rate). NPPs sell power to Distribution
companies (which can be Electric Cooperative or Local Government Unit or a Private
Company). Distribution companies sell electricity to consumers at a rate which is
regulated by Energy Regulatory Commission and pays the corresponding SAGR
(Subsidized Accepted Generation Rate) to NPP. NPP gets the difference between
TCGR and SAGR as OBI (Output based subsidy) from Power Sector Management and
Liability Corporation. This OBI is actually sourced from the surcharge collected from all
the End users of electricity in the country.
Figure 3.a: Off Grid Electrification Scheme; Source: Alliance for Rural Electrification
NPPs
Distribution
Companies
Power Sector
Management and
Liability Corporation
All End users
Power Revenue
Energy Regulatory
Commission
Regulates rates
and services
SAGR (Subsidized
Acceptable
Generation Rate)
OBI (Output
based Subsidy)
OBI= TCGR-SAGR
Surcharge
NPP selected on the
basis of best TCGR
(True cost Generation
Rate)
Varun Gaur, PPRE, University of Oldenburg Page 19
3.4 Problems with Diesel Mini Grids and the need for Renewable Energy
In the earlier sections, we observed that almost entire Off grid sector in Philippines is
based on Diesel Genset. However, there are serious problems with Diesel
Electrifications:
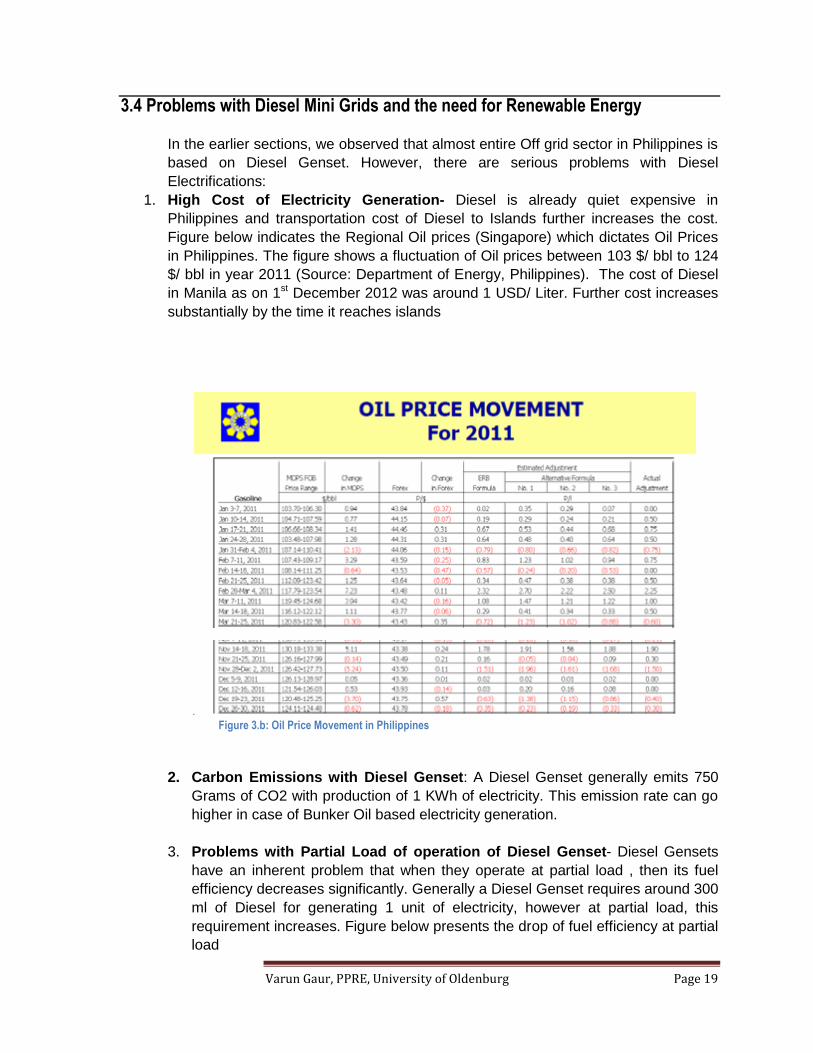
1. High Cost of Electricity Generation- Diesel is already quiet expensive in
Philippines and transportation cost of Diesel to Islands further increases the cost.
Figure below indicates the Regional Oil prices (Singapore) which dictates Oil Prices
in Philippines. The figure shows a fluctuation of Oil prices between 103 $/ bbl to 124
$/ bbl in year 2011 (Source: Department of Energy, Philippines). The cost of Diesel
in Manila as on 1st December 2012 was around 1 USD/ Liter. Further cost increases
substantially by the time it reaches islands
2. Carbon Emissions with Diesel Genset: A Diesel Genset generally emits 750
Grams of CO2 with production of 1 KWh of electricity. This emission rate can go
higher in case of Bunker Oil based electricity generation.
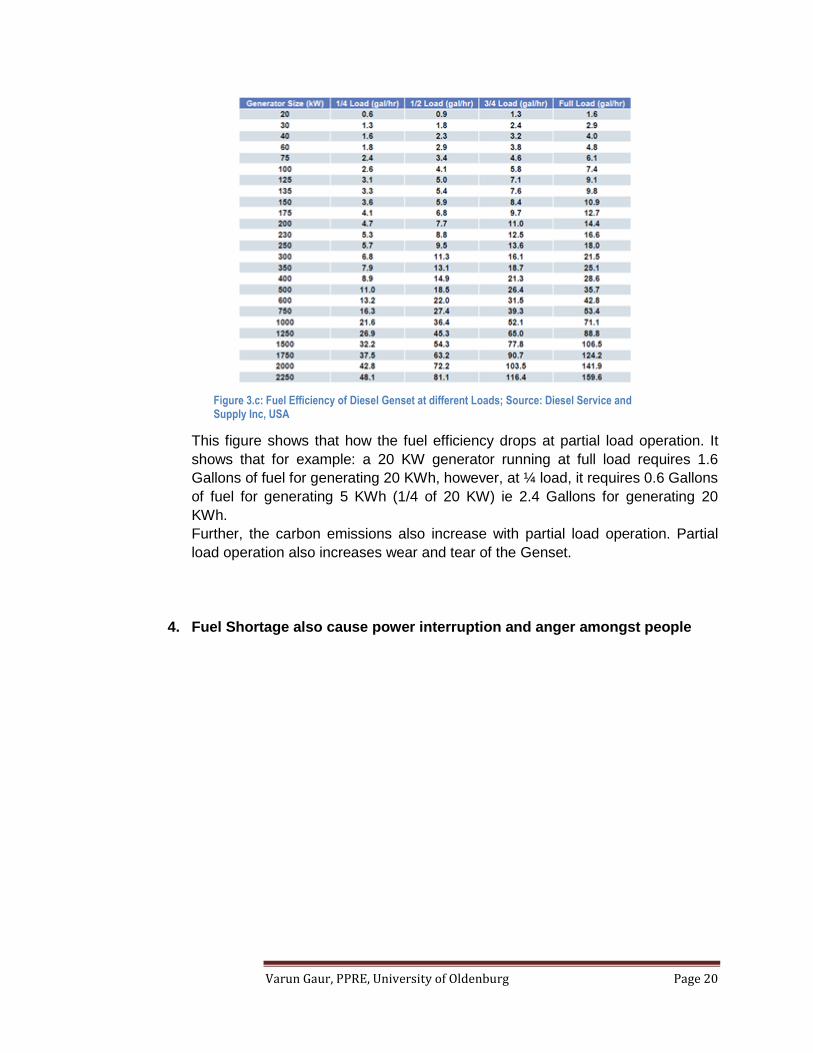
3. Problems with Partial Load of operation of Diesel Genset- Diesel Gensets
have an inherent problem that when they operate at partial load , then its fuel
efficiency decreases significantly. Generally a Diesel Genset requires around 300
ml of Diesel for generating 1 unit of electricity, however at partial load, this
requirement increases. Figure below presents the drop of fuel efficiency at partial
load
Table 3.c: Classification of Mini Grids as per the Operating stakeholders
Figure 3.b: Oil Price Movement in Philippines
Varun Gaur, PPRE, University of Oldenburg Page 20
This figure shows that how the fuel efficiency drops at partial load operation. It
shows that for example: a 20 KW generator running at full load requires 1.6
Gallons of fuel for generating 20 KWh, however, at ¼ load, it requires 0.6 Gallons
of fuel for generating 5 KWh (1/4 of 20 KW) ie 2.4 Gallons for generating 20
KWh.
Further, the carbon emissions also increase with partial load operation. Partial
load operation also increases wear and tear of the Genset.
4. Fuel Shortage also cause power interruption and anger amongst people
Figure 3.c: Fuel Efficiency of Diesel Genset at different Loads; Source: Diesel Service and Supply Inc, USA
Varun Gaur, PPRE, University of Oldenburg Page 21
3.5 Schemes for Renewable Energy in Off Grid Electrification
I first try to understand the government schemes of OffGrid Renewable Energy.
Following are the main findings:
Cash Sales based subsidy
In a government document (Department of Energy), I found that RE based
electrification in Mini Grids will be rewared by subsidy as follows
Output based Subsidy (OBI) = 50% (TCGR-SAGR)* KWh of electricity produced.
However, it is unclear whether this OBI will be over and above the OBI as given in
Diesel based electrification where OBI= 100% (TCGR-SAGR)* KWh of electricity
produced
Fiscal Benefits
In addition to OBI, there was a mention of following extra benefits for RE
• Income tax holiday for 7 years
• Duty free importation of RE machinery
• Exemption from universal charge
• RPS ( Renewable Portfolio Standard) which is the bindings on Distribution
companies to buy certain % of electricity from RE sources.
It is unclear whether these benefits are only for Grid Connected Renewables or also
for Offgrid Renewables.
I tried to clarify these doubts during my meetings at Department of Energy, however,
government officers had no clear information and I was only pushed from one door to
another.
Thus, in this chapter, we saw that Offgrid Electrification in Philippines is majorly based
on Diesel and this Diesel based electrification is highly subsidized. High cost of Diesel
makes the electricity cost very high and a huge financial burden. This brings in a strong
case of Renewable Energy based Offgrid electrification.

Varun Gaur, PPRE, University of Oldenburg Page 22
CHAPTER 4: ELECTRIFICATION SCENARIO IN PHILIPPINE ISLANDS
In the previous chapters, I presented a broad picture of Philippines and its Off Grid
electricity sector. This was primarily based on my Literature survey. After getting a broad
picture of Filipino Off Grid Electrification Sector, I undertook a scoping mission to
selected Islands in Philippines. The objective was to understand the electrification
scenario in the selected islands and utilize the information to model the Solar/ Solar
Diesel hybrid Mini Grids for the same. Now on, I will present you my findings and
assessment from the selected islands. Chapter 4 will present the findings from the
scoping mission and in the following chapters, I will utilize the information to model the
PV system.
My mission was supported by GIZ and the same has asked to keep some select
information confidential. During the mission, I surveyed 3 islands and will refer them as
Island A, Island B and Island C. It is to be noted that the focus of my mission is Island A,
however, I will also present crucial learning’s from Island B and Island C.
The findings from the respective islands are discussed next.
4.1: Status Quo of Electricity in Island A
Located in the Visayas sea, Island A is around 2.5 hours boat ride from nearest port.
With around 600 households, it has a population of around 3000.
I had 2 objectives with my survey of Island A
Understand the existing electricity supply scenario
Understand the existing electricity demand pattern
In the survey, I was assisted by 2 employees of Power Source Philippines Inc (PSPI),
which is our local partner in the project. The names of the PSPI officials are: 1) Mr Erwin
Tindoc and 2) Mr Romy Alvarez. PSPI also hired 6 Resource Persons for assistance in
household survey.
I started my assessment with a Focused Group Discussion (FGD) with the local council
(Barangay council). This helped me in getting a broad picture of the village. In the FGD, I
got to know that the island is divided into 6 clusters (Sitios) of households. It has 2
Primary schools, 1 high school and 1 small health center.
Varun Gaur, PPRE, University of Oldenburg Page 23
As conveyed in the FGD, the main sources of income in the island are:
Fishing
Carpentry
Small Shops
Remittance from family members living in the cities or abroad
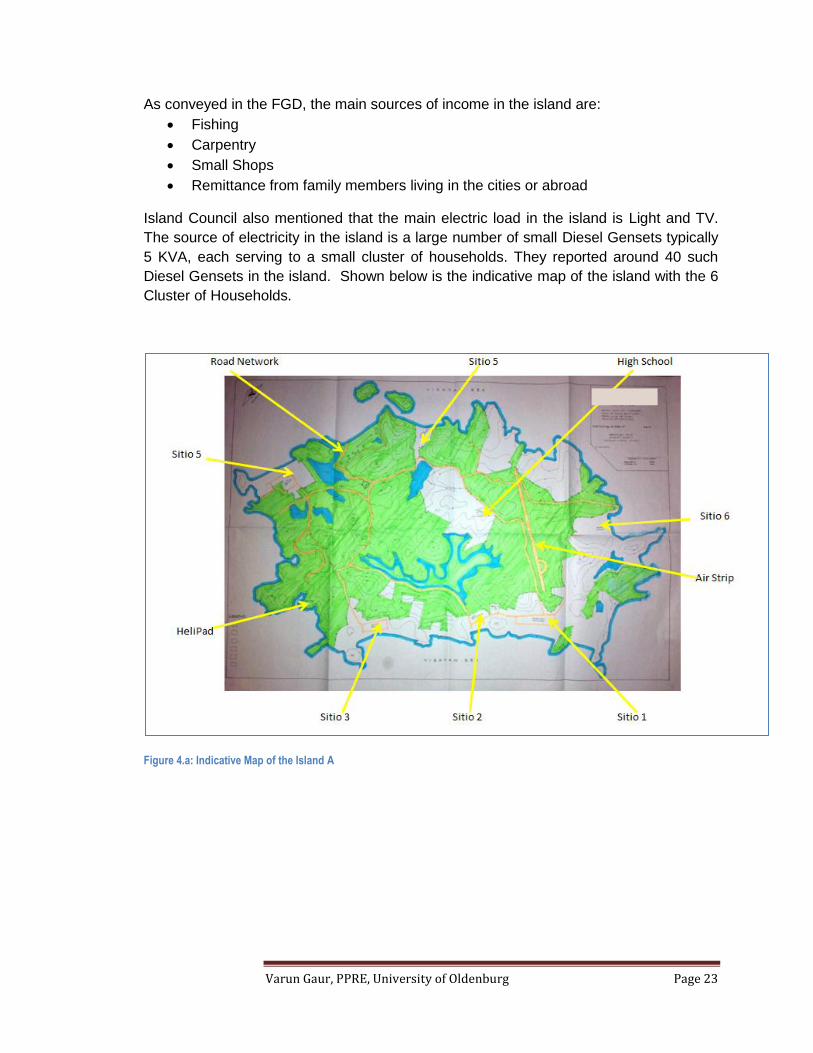
Island Council also mentioned that the main electric load in the island is Light and TV.
The source of electricity in the island is a large number of small Diesel Gensets typically
5 KVA, each serving to a small cluster of households. They reported around 40 such
Diesel Gensets in the island. Shown below is the indicative map of the island with the 6
Cluster of Households.
Figure 4.a: Indicative Map of the Island A
Varun Gaur, PPRE, University of Oldenburg Page 24
The table below presents the spread of population in the island
Sitio (Cluster) Name/ Number
Number of Households Number of Shops
Sitio 1 200 Households ~ 14 shops
Sitio 2 50 Households ~ 4 shops
Sitio 3 130 Households ~7 shops
Sitio 4 200 Households ~10 shops
Sitio 5 22 Households ~5 shops
Sitio 6 22 Households ~5 shops Table 4.a: Spread of Population in the Island
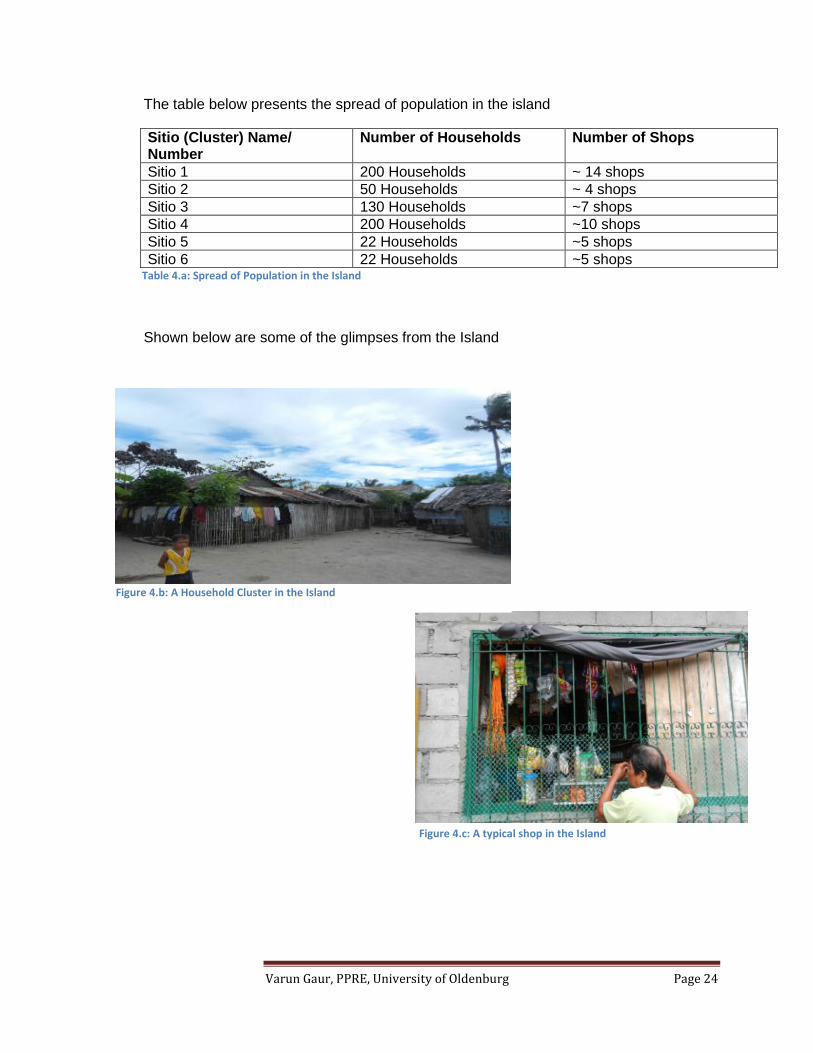
Shown below are some of the glimpses from the Island
Figure 4.c: A typical shop in the Island
Figure 4.b: A Household Cluster in the Island
Varun Gaur, PPRE, University of Oldenburg Page 25
After getting a broad picture of the island, I started my survey. I broke the survey into 2
parts.
Part 1: To understand the electric load in the island and the cost of electricity. For
this, I interviewed around 50% households. The questionnaire used for this survey is
attached as Annexure 1
Part 2: To understand the electricity supply system, the cost of electricity generation
and the electricity distribution system. For this, I interviewed around 10% of Diesel
mini grid operators. The questionnaire is attached as Annexure 2
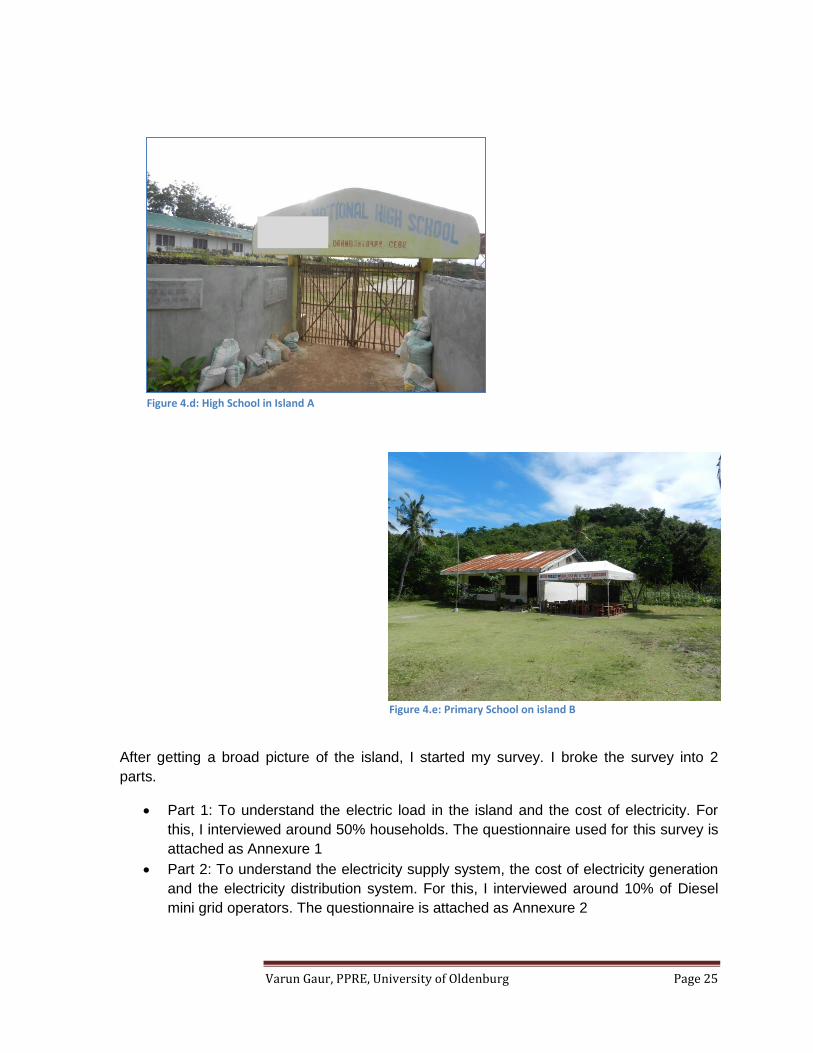
Figure 4.d: High School in Island A
Figure 4.e: Primary School on island B
Varun Gaur, PPRE, University of Oldenburg Page 26
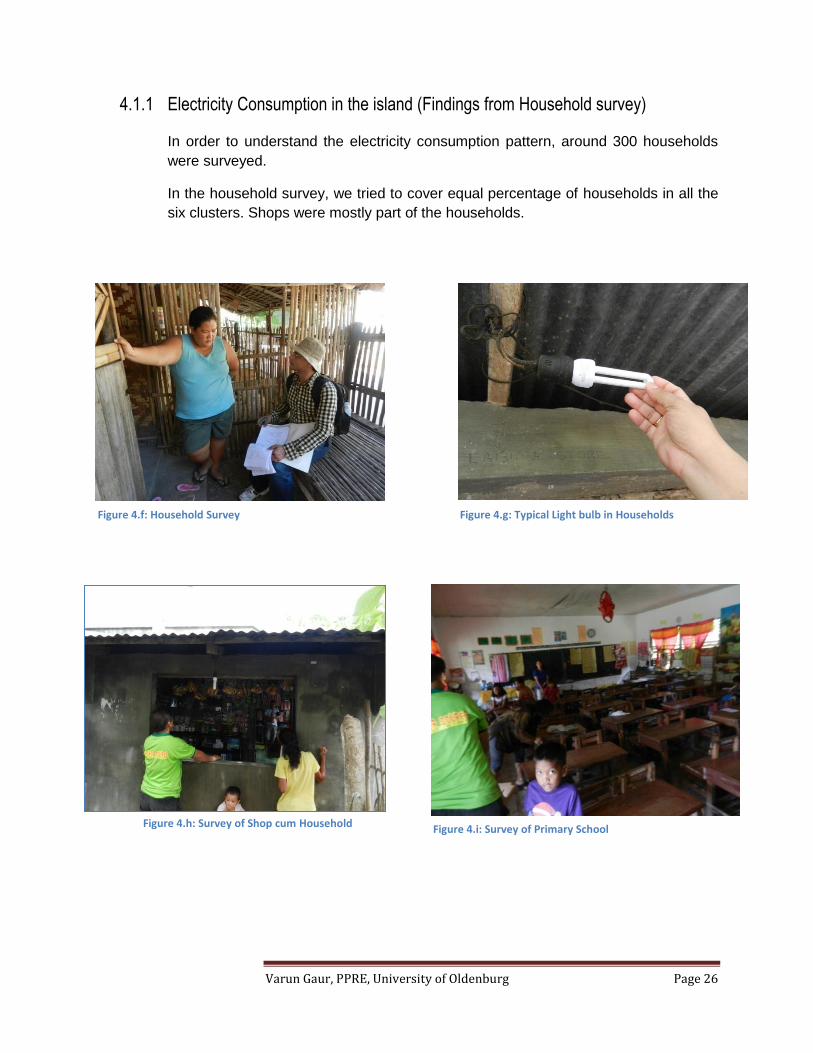
4.1.1 Electricity Consumption in the island (Findings from Household survey)
In order to understand the electricity consumption pattern, around 300 households
were surveyed.
In the household survey, we tried to cover equal percentage of households in all the
six clusters. Shops were mostly part of the households.
Figure 4.f: Household Survey Figure 4.g: Typical Light bulb in Households
Figure 4.h: Survey of Shop cum Household Figure 4.i: Survey of Primary School

Varun Gaur, PPRE, University of Oldenburg Page 27
The data collected from the household survey is attached as Annexure 3. The survey
reported around 38KW of combined electricity load of around 50% of households.
Therefore, I assume a total load of 76KW for the entire Island.
The major findings from the household survey are as follows:
From the data, it is clear that the most common load in the island is Light bulb
(CFL) and the TV (along with DVD player). Few households (mostly Genset
owners) also had Audio Amplifiers, Fans, Laptops and Refrigerators.
The households get around 3.5 hours of electricity every day (6 pm to around
9.30 pm). They pay a fixed price of electricity per gadget, which is mentioned
below:
Light Point (~18 W): 8 Pesos/ night (3.5 to 4 hours)
TV Point with DVD player (~90 W): 20 pesos/ night (3.5 to 4 hours)
Considering the case of light point, it means that for 63 Whs, consumers are
paying 0.15 Euros. This translates into the cost of electricity as 2.3 Euros/ kWh
For lighting requirements beyond 9.30 pm, people use kerosene lanterns. The
cost of kerosene in village is 1.4 Euros/ liter of kerosene
People showed a great aspiration for having Refrigerators and TVs in the near
future
People mentioned that the supply of electricity is very erratic and they also
encounter frequent flickering of lights
People have the willingness to pay for electricity services
The load curve of Island A can therefore be interpreted as figure 4.j
Figure 4.j: Load curve of Island A
Varun Gaur, PPRE, University of Oldenburg Page 28
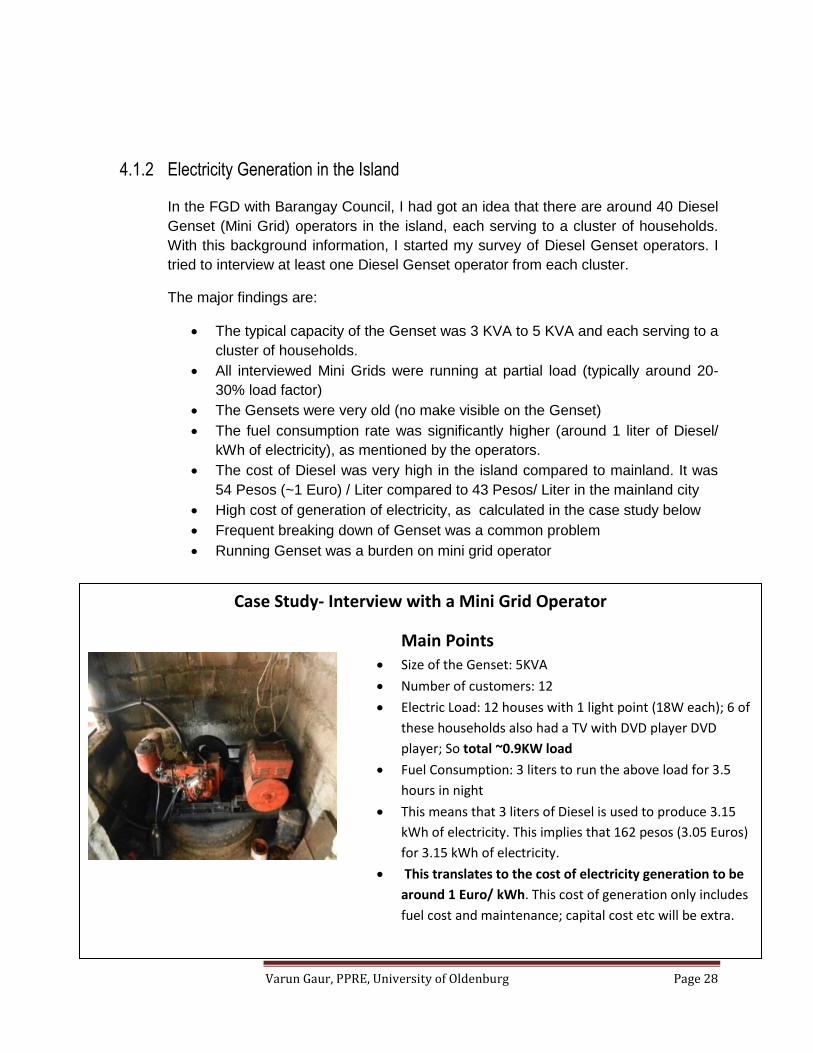
4.1.2 Electricity Generation in the Island
In the FGD with Barangay Council, I had got an idea that there are around 40 Diesel
Genset (Mini Grid) operators in the island, each serving to a cluster of households.
With this background information, I started my survey of Diesel Genset operators. I
tried to interview at least one Diesel Genset operator from each cluster.
The major findings are:
The typical capacity of the Genset was 3 KVA to 5 KVA and each serving to a
cluster of households.
All interviewed Mini Grids were running at partial load (typically around 20-
30% load factor)
The Gensets were very old (no make visible on the Genset)
The fuel consumption rate was significantly higher (around 1 liter of Diesel/
kWh of electricity), as mentioned by the operators.
The cost of Diesel was very high in the island compared to mainland. It was
54 Pesos (~1 Euro) / Liter compared to 43 Pesos/ Liter in the mainland city
High cost of generation of electricity, as calculated in the case study below
Frequent breaking down of Genset was a common problem
Running Genset was a burden on mini grid operator
Case Study- Interview with a Mini Grid Operator
Main Points Size of the Genset: 5KVA
Number of customers: 12
Electric Load: 12 houses with 1 light point (18W each); 6 of
these households also had a TV with DVD player DVD
player; So total ~0.9KW load
Fuel Consumption: 3 liters to run the above load for 3.5
hours in night
This means that 3 liters of Diesel is used to produce 3.15
kWh of electricity. This implies that 162 pesos (3.05 Euros)
for 3.15 kWh of electricity.
This translates to the cost of electricity generation to be
around 1 Euro/ kWh. This cost of generation only includes
fuel cost and maintenance; capital cost etc will be extra.
Varun Gaur, PPRE, University of Oldenburg Page 29
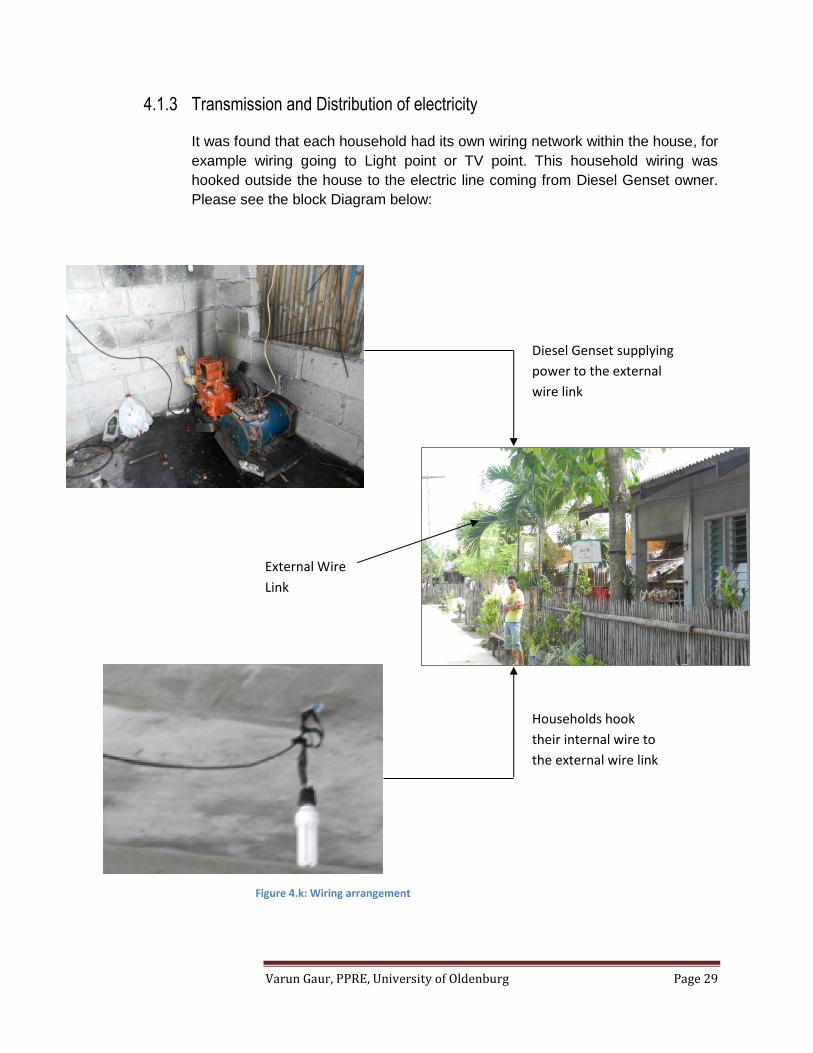
4.1.3 Transmission and Distribution of electricity
It was found that each household had its own wiring network within the house, for
example wiring going to Light point or TV point. This household wiring was
hooked outside the house to the electric line coming from Diesel Genset owner.
Please see the block Diagram below:
Diesel Genset supplying
power to the external
wire link
External Wire
Link
Households hook
their internal wire to
the external wire link
Figure 4.k: Wiring arrangement

Varun Gaur, PPRE, University of Oldenburg Page 30
One being asked about the electricity thefts, it was reported that neighbors play the role
of police. However, I saw intrusions into the wires at some places.
4.1.4 Other important findings from Island A
In addition to the above mentioned findings, I also had some miscellaneous observations
which shall be crucial for any intervention in the island. They are as follows:
Ruins of a big old Mini Grid in Island A
During my assessment in Island A, I came across some ruins of an Old Mini Grid, which
was established in 1996. I questioned few of the Office Bearers of the local Island
Council. Following are the main findings:
The capacity of Mini Grid was around 75 KVA
Diesel Genset was provided by a local politician
Transmission & Distribution network was laid down by Electric cooperative
Operation of mini grid was handed over to the local community
It was reported that after some time, trained technicians left the village and then
due to lack of proper operation and maintenance, system failed and is lying idle.
Now there still exists
o Broken Diesel Genset and Tranformer. Transformer was 75 KVA and the
Genset was kept in a locked room.
o Around 20 wooden poles (30 feet high) in 3 biggest clusters
o Secondary lines hanging from pole to pole
There might be possibility of using some of the remains of this mini grid.
Interview with a senior official of the concerned Electric Cooperative:
When, I was returning from Island A, I managed to get the appointment of General
Manager of the concerned Electric Cooperative. I asked him about their plans for the
electrification of Island A. He told that there could be 2 possibilities
Solar Home System Program in Island A: There could be the possibility of
distributing Solar Home System to each household in Island A. He mentioned
one such scheme for an another Island which might be replicated in Island A. In
that scheme, Department of Energy provides free SHS to the Electric
Cooperative for the distribution to relevant households. Further Electric
Cooperative distributes such SHSs to households but charges a monthly O&M
fees. One example he gave was 320 Pesos/ month for 75 Wp SHS. Translating
this figure in terms of Energy charges, I found that despite of 100% grant from
government, households were still expected to pay 57 Euro cents/ KWh on
O&M.
Varun Gaur, PPRE, University of Oldenburg Page 31
Handing over the Island A to QTP (Qualified Third Party): He also pointed out
that there is a possibility of handing over the Island A to QTP (Qualified Third
Party), who will be given franchisee of the Mini Grid operations in the Island for a
certain number of years.
4.2: Status Quo of Electrification in Island B
Island B is around 1 hour boat ride from Island A. It has around 1000 households with
around 5000 population. It is a tourist island and has around 30 resorts. Although my
focus of study was island A, however I also tried to study the electrification scenario for
Island B because of the following reasons:
It has a big Diesel Genset Mini grid operated by a Private Company. This gave me
an opportunity to see the operations by a big private player.
It is famous for Tourism and has a number of Resorts, so it has an unconventional
Electric Load.
It is close to Island A, so there might be some resemblance in the electric load
pattern, and there might be some learnings for Island A
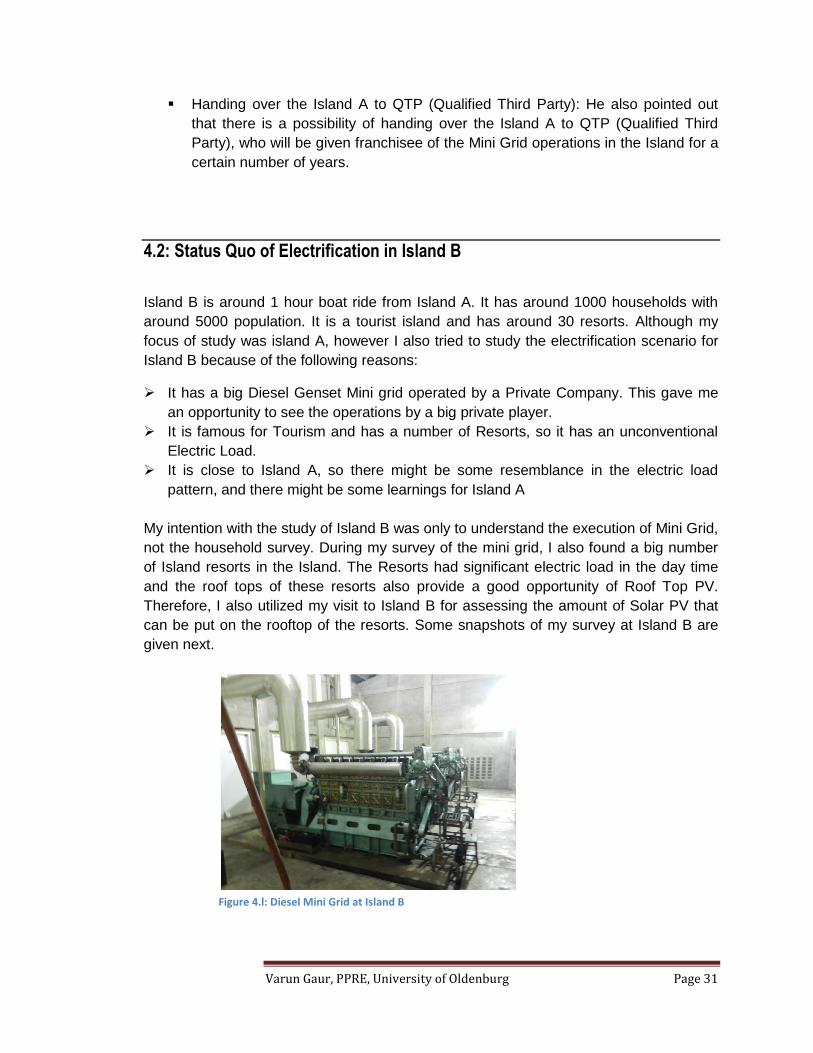
My intention with the study of Island B was only to understand the execution of Mini Grid,
not the household survey. During my survey of the mini grid, I also found a big number
of Island resorts in the Island. The Resorts had significant electric load in the day time
and the roof tops of these resorts also provide a good opportunity of Roof Top PV.
Therefore, I also utilized my visit to Island B for assessing the amount of Solar PV that
can be put on the rooftop of the resorts. Some snapshots of my survey at Island B are
given next.
Figure 4.l: Diesel Mini Grid at Island B
Varun Gaur, PPRE, University of Oldenburg Page 32
The following are the major findings from the Mini Grid at Island B
The total capacity of Mini Grid is around 1,050 KW comprising of three 350 KVA
Generators. Only one generator is used at a time. All the Generators are of Chinese
Make: Ningbo CSI Power & Machinery Group Co. Ltd
The generation, transmission and distribution is managed by PowerSource
Philippines Inc
It provides 24 hours of electricity
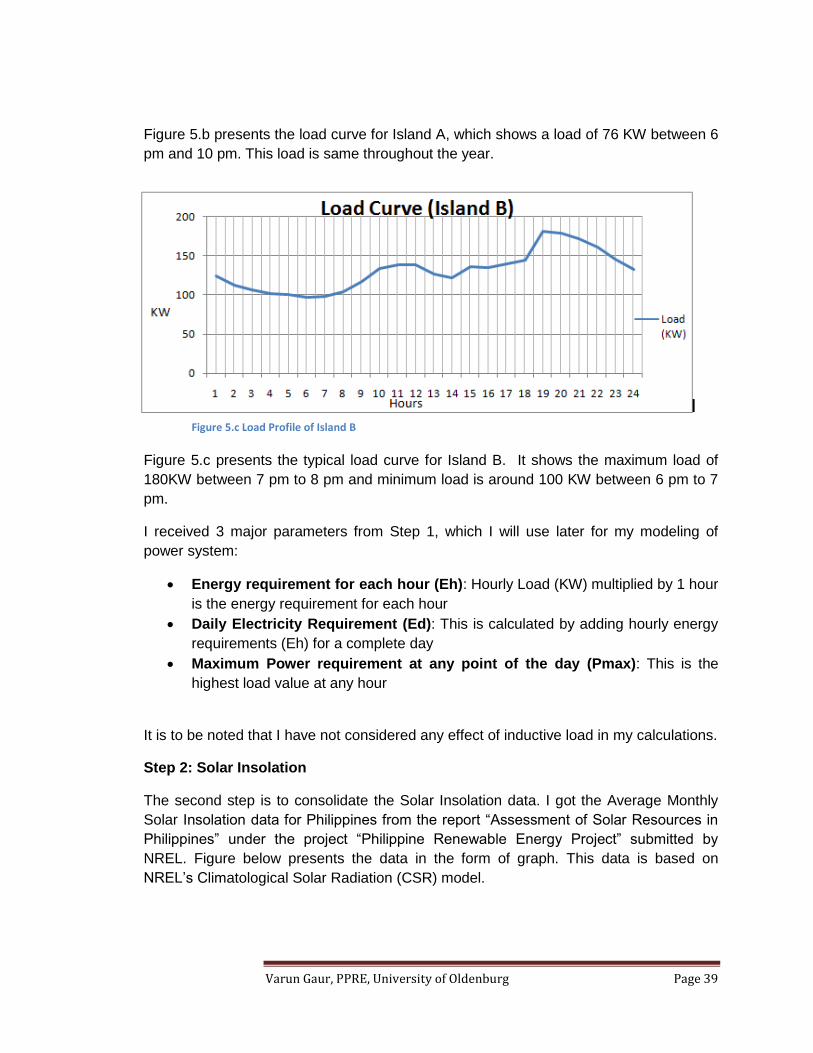
A typical daily load curve is shown in figure below (a day in December 2012) It
shows a peak load of around 180 KW at 1900 hours and Minimum load of 93 KW at
around 0600 hours
It serves around 1000 households, 30 resorts and a Telecom Tower
All consumers were paying electricity at the rate of ~0.55 Euros/ KWh
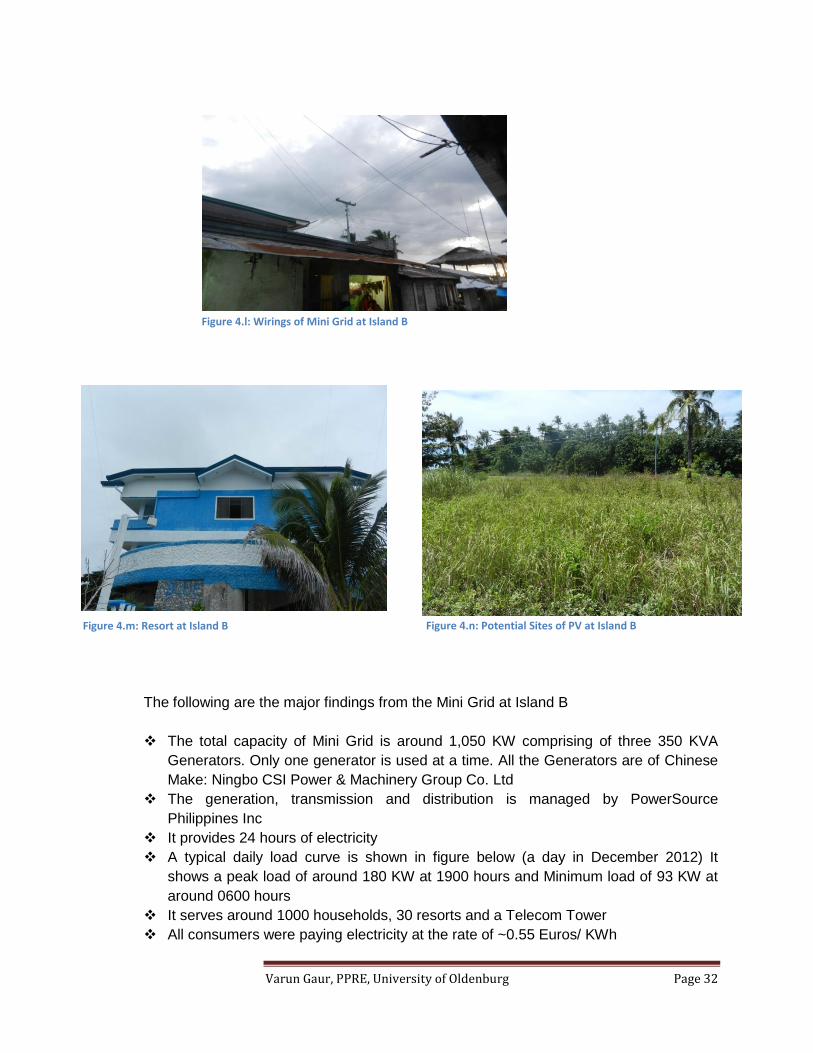
Figure 4.l: Wirings of Mini Grid at Island B
Figure 4.m: Resort at Island B Figure 4.n: Potential Sites of PV at Island B

Varun Gaur, PPRE, University of Oldenburg Page 33
The cost of Diesel in the island is `0.9 Euro/ Liter
The transmission of electricity is at 13.2KV
As per the operator of Mini Grid, the distribution losses in the island were to the tune
of around 10%
As per the records, fuel efficieny rate was between 320-350 ml of Diesel/ KWh of
electricity
4.3: Status Quo of Electrification in Island C
Island C is further around 1 hour boat ride from Island B. It has a population of
around 7,000 with fishing as the main source of income. Again, Island C was not
my focus of study and my intention with Island C, was only to assess the working
of its mini grid. The reasons which made interested to study the electrification for
Island B are:
It has a big Diesel Genset Mini Grid where
o Generation of Electricity is managed by a Government Company
(NPC-SPUG)
o Transmission and Distribution is managed by an Electric Cooperative
So, this gave me an opportunity to study a mini grid operated by a
government agency
Like Island A, it has only residential load, so there might be some
resemblance in the electric load pattern, and there might be some learning’s
for Island A
Figure 4.o: Load Profile of Island B
Varun Gaur, PPRE, University of Oldenburg Page 34
Following are the main findings from the interview with the Mini grid Operator
The generation is done through 2 generators viz 220 KVA and 125 KVA alternately.
220 KVA generator was of USA make: Dale and 125 KVA generator was of
Japanese make
As already mentioned, generation of electricity was done by NPC SPUG, whereas, a
local Electric Cooperative (EC) was responsible for transmission and distribution.
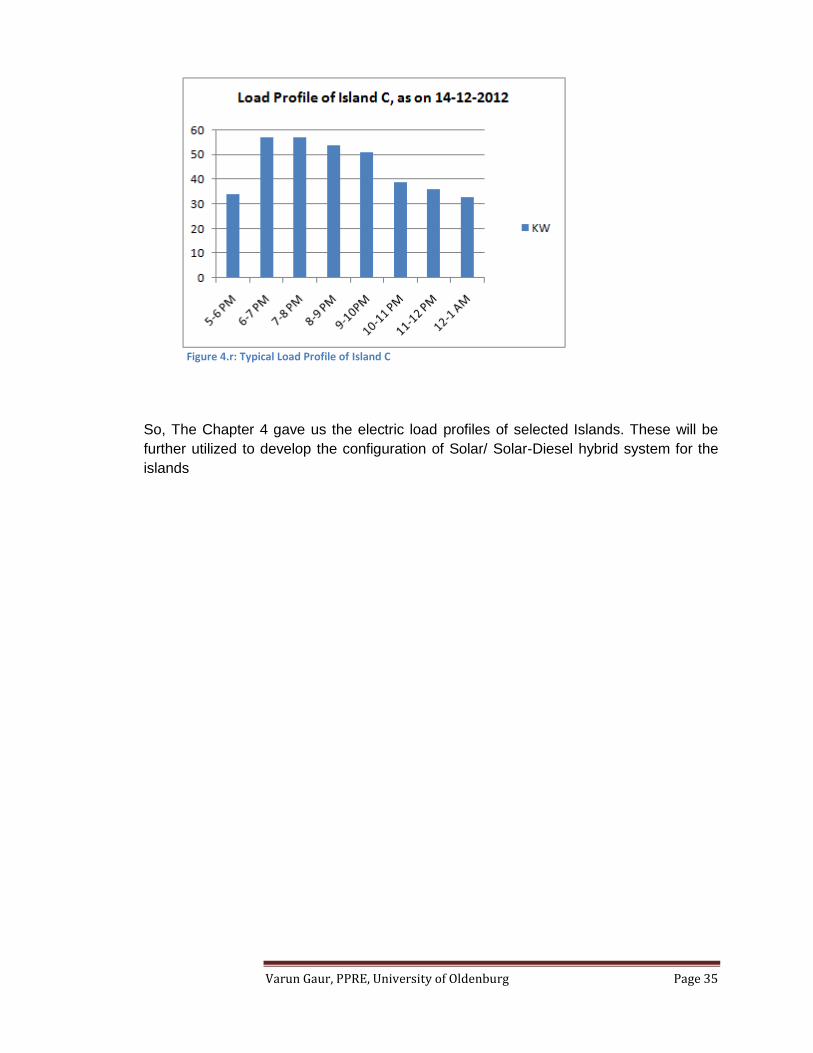
Mini Grid operates from 5 pm to 1 am; The load profile of a typical day is shown in
the figure 4.o below
NPC SPUG sells electricity to EC @ 0.094 Euros/ KWh) and EC sells electricity to
households @ 0.22 Euros/ KWh
Mini Grid operator also mentioned that there are around 15% of households who do
not pay electricity bill
He also mentioned that government had tried to give electricity also in the morning
time, but electric load was not sufficient to run the generator, so morning hours of
operation was discontinued.
The fuel efficiency on 14-12-2012 was around 420 ml of Diesel/ KWh
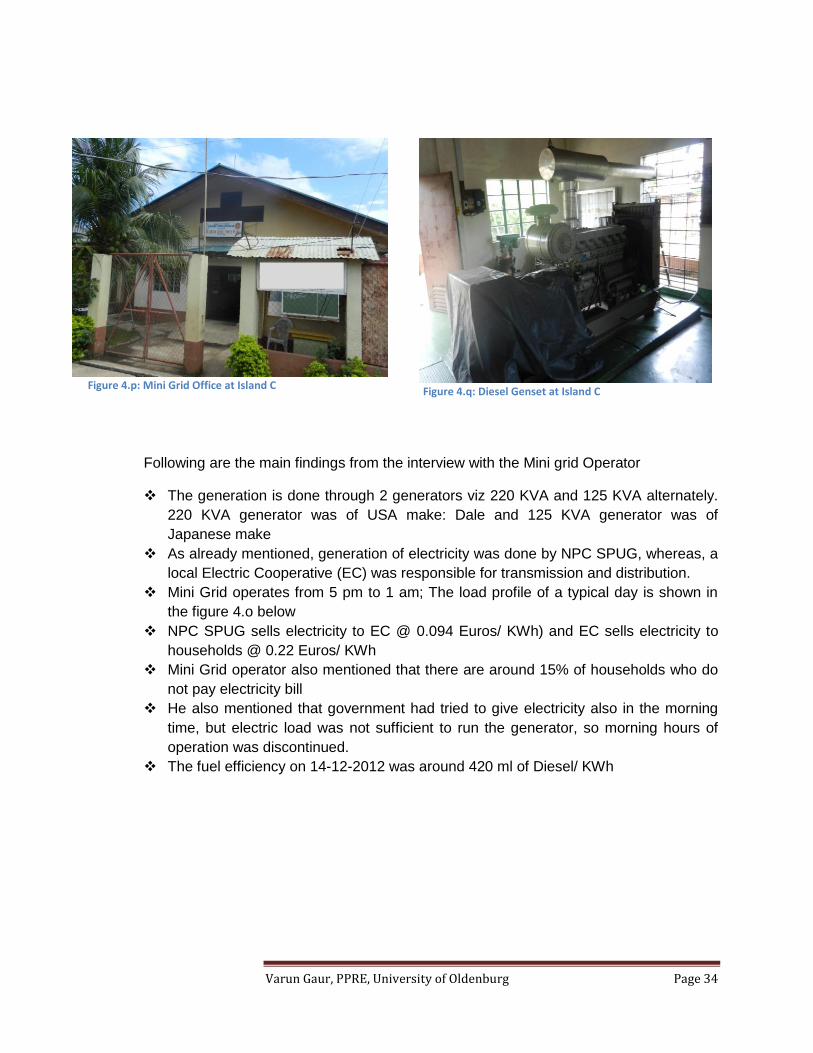
Figure 4.p: Mini Grid Office at Island C Figure 4.q: Diesel Genset at Island C
Varun Gaur, PPRE, University of Oldenburg Page 35
So, The Chapter 4 gave us the electric load profiles of selected Islands. These will be
further utilized to develop the configuration of Solar/ Solar-Diesel hybrid system for the
islands
Figure 4.r: Typical Load Profile of Island C
Varun Gaur, PPRE, University of Oldenburg Page 36
CHAPTER 5 MODELLING OF THE SOLAR-DIESEL HYBRID POWER SYSTEM
In the previous chapter, I explained the findings from my scoping mission to Island A,
Island B and Island C. This scoping mission had helped me to gather the Load profile
(Electric Demand pattern) of these islands. In this chapter, I will utilize the load profile to
model the Solar-Diesel Hybrid Power System for these islands.
By modelling, I mean re-producing different system configurations (power system sizes)
and the associated costs (investment costs and electricity generation costs), based on
different input conditions/ parameters (such as Electric Load, Solar Insolation, Solar
penetration, etc).
There will be 3 outcomes from this modeling:
1. Power System sizing for different input conditions/ parameters
2. Investment Costs and the Levelized Cost of Electricity generations for different
input conditions/ parameters
3. Savings on the GHG emissions
The focal point of my study is Island A for which I will also consider different scenarios
for sensitivity analysis. I will also present the modeling for Island B.
Section 5.1 of this chapter will present my indicative technical configuration of the
proposed Solar-Diesel Hybrid System. For this, I utilized learnings from my recent
training program at SMA Solar Academi, Kassel and my learnings at University of
Oldenburg.
Section 5.2 will present my methodology for developing the excel sheet tool that can
model the Solar-Diesel Hybrid Power System, based on different input parameters. For
developing this tool, I utilized learnings from my University of Oldenburg and my
experience at TERI India.
Based on this methodology, Chapter 6 will present the models for Island A and Island B.
Varun Gaur, PPRE, University of Oldenburg Page 37
5.1: Indicative Technical Configuration of the proposed Solar-Diesel Hybrid Power System
A Hybrid Power system is that power supply system which utilizes two or more power
sources. This helps in improving the reliability of the system as there is less reliance on
one method of power production. Solar Diesel Hybrid System utilizes solar and Diesel as
the power supply and battery as the power backup. A Power converter system is an
important component of Hybrid System that controls the power supply and power
backup system in the most efficient manner.
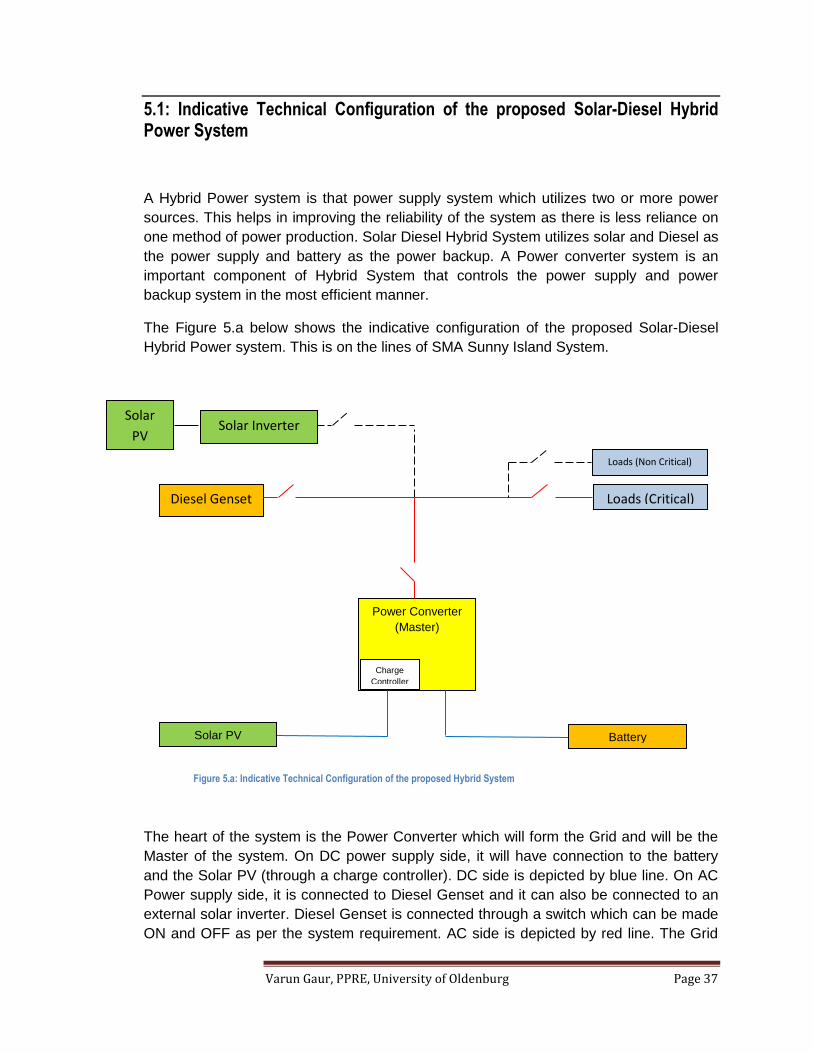
The Figure 5.a below shows the indicative configuration of the proposed Solar-Diesel
Hybrid Power system. This is on the lines of SMA Sunny Island System.
The heart of the system is the Power Converter which will form the Grid and will be the
Master of the system. On DC power supply side, it will have connection to the battery
and the Solar PV (through a charge controller). DC side is depicted by blue line. On AC
Power supply side, it is connected to Diesel Genset and it can also be connected to an
external solar inverter. Diesel Genset is connected through a switch which can be made
ON and OFF as per the system requirement. AC side is depicted by red line. The Grid
Loads (Critical) Diesel Genset
Power Converter
(Master)
Solar PV Battery
Charge
Controller
Solar
PV Solar Inverter
Loads (Non Critical)
Figure 5.a: Indicative Technical Configuration of the proposed Hybrid System

Varun Gaur, PPRE, University of Oldenburg Page 38
formed by the Master is connected to loads. There can be separate connection to
Critical load or Non Critical load where Non Critical Load can be switched OFF or ON as
per the system requirements.
Master will keep an eye on the frequency of the system with the following logic:
If frequency > 50 hz, this means that the Supply is more than Demand
If frequency <50 Hz, this will mean that Demand is more than Supply
According to frequency values, Master will regulate the Diesel Genset and the Loads.
Solar PV will be designed in such a way that it will never be more then demand.
The above system is modular in nature. With any possible future load growth, system
size can be increased by adding extra modules. For example, there can be an additional
power converter in parallel to Master, however this additional module will be
synchronized with the frequency of Master.
5.2: Methodology for Modelling the Hybrid Power System
Section 5.1 presented the indicative technical configuration of the power system. Now
the next step is to model the power system as per the load and other input conditions.
Described below is my methodology for modeling the system.
Step 1: Load Profile
The first step is to gather the hourly load profile. Presented below is the typical load
profile for Island A and Island B (Corresponding excel sheets are attached as Annexure
4 and Annexure 5 respectively. This data is from the scoping mission.
Figure 5.b: Load Curve of Island A
Varun Gaur, PPRE, University of Oldenburg Page 39
Figure 5.b presents the load curve for Island A, which shows a load of 76 KW between 6
pm and 10 pm. This load is same throughout the year.
Figure 5.c presents the typical load curve for Island B. It shows the maximum load of
180KW between 7 pm to 8 pm and minimum load is around 100 KW between 6 pm to 7
pm.
I received 3 major parameters from Step 1, which I will use later for my modeling of
power system:
Energy requirement for each hour (Eh): Hourly Load (KW) multiplied by 1 hour
is the energy requirement for each hour
Daily Electricity Requirement (Ed): This is calculated by adding hourly energy
requirements (Eh) for a complete day
Maximum Power requirement at any point of the day (Pmax): This is the
highest load value at any hour
It is to be noted that I have not considered any effect of inductive load in my calculations.
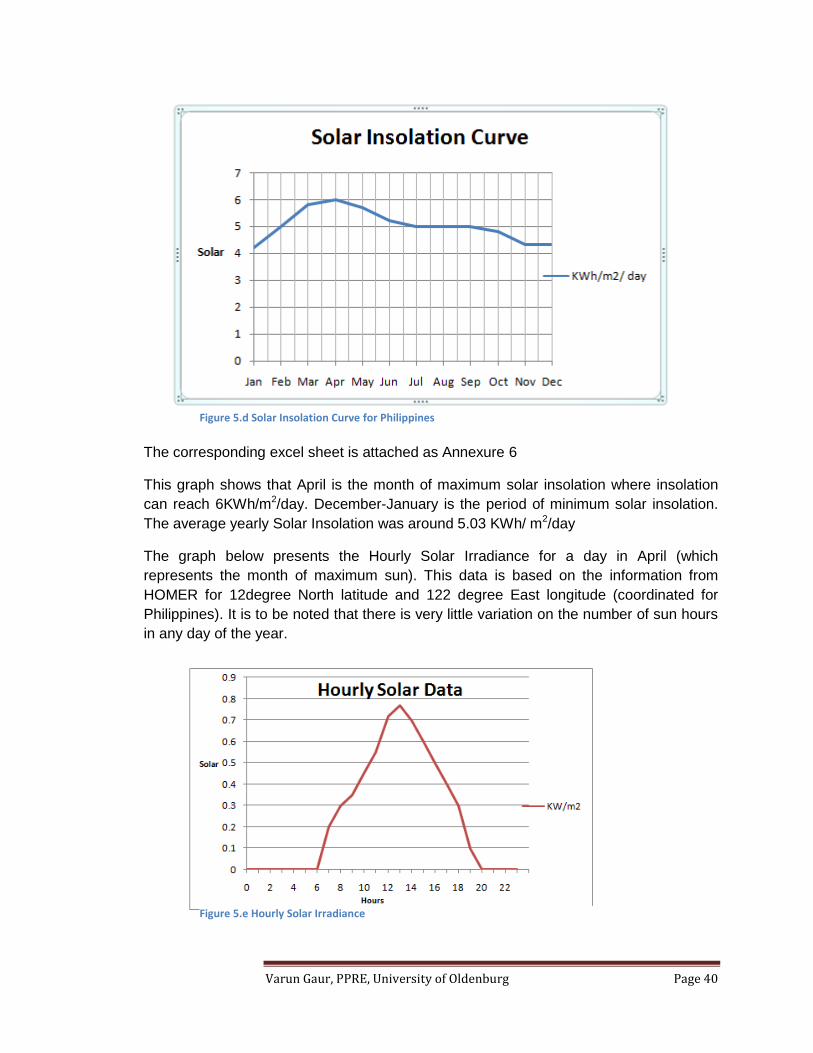
Step 2: Solar Insolation
The second step is to consolidate the Solar Insolation data. I got the Average Monthly
Solar Insolation data for Philippines from the report “Assessment of Solar Resources in
Philippines” under the project “Philippine Renewable Energy Project” submitted by
NREL. Figure below presents the data in the form of graph. This data is based on
NREL’s Climatological Solar Radiation (CSR) model.
Figure 5.c Load Profile of Island B
Varun Gaur, PPRE, University of Oldenburg Page 40
The corresponding excel sheet is attached as Annexure 6
This graph shows that April is the month of maximum solar insolation where insolation
can reach 6KWh/m2/day. December-January is the period of minimum solar insolation.
The average yearly Solar Insolation was around 5.03 KWh/ m2/day
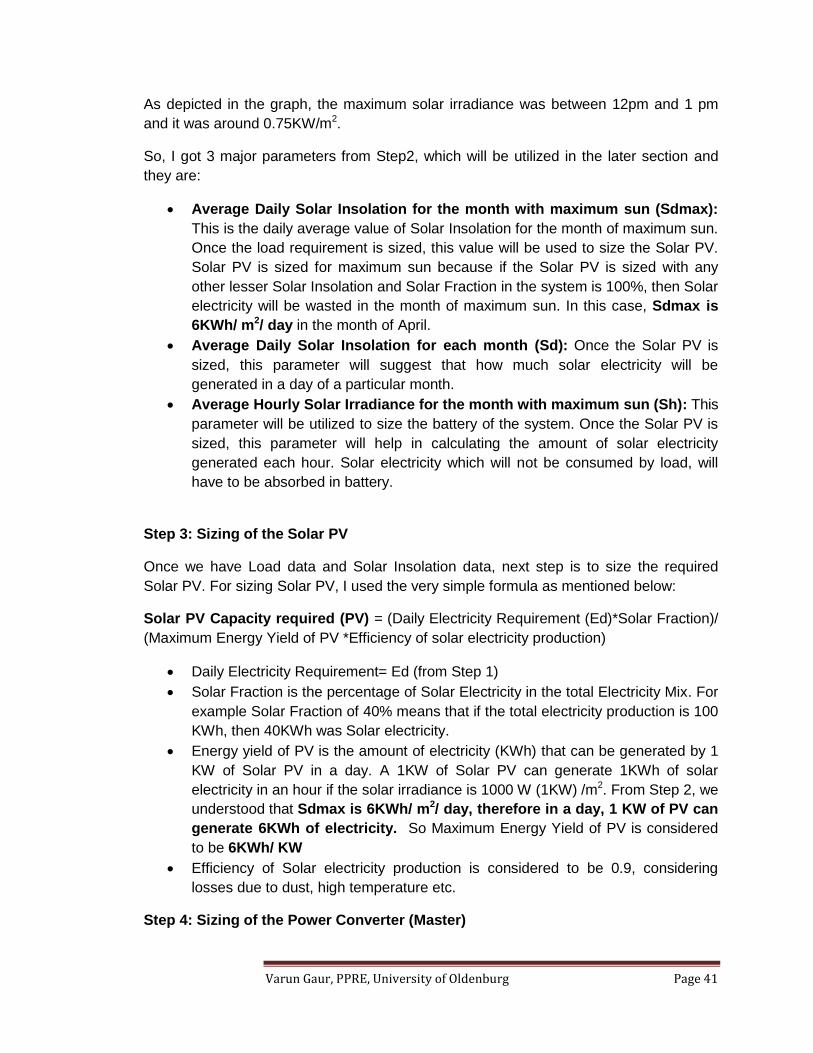
The graph below presents the Hourly Solar Irradiance for a day in April (which
represents the month of maximum sun). This data is based on the information from
HOMER for 12degree North latitude and 122 degree East longitude (coordinated for
Philippines). It is to be noted that there is very little variation on the number of sun hours
in any day of the year.
Figure 5.d Solar Insolation Curve for Philippines
Figure 5.e Hourly Solar Irradiance
Varun Gaur, PPRE, University of Oldenburg Page 41
As depicted in the graph, the maximum solar irradiance was between 12pm and 1 pm
and it was around 0.75KW/m2.
So, I got 3 major parameters from Step2, which will be utilized in the later section and
they are:
Average Daily Solar Insolation for the month with maximum sun (Sdmax):
This is the daily average value of Solar Insolation for the month of maximum sun.
Once the load requirement is sized, this value will be used to size the Solar PV.
Solar PV is sized for maximum sun because if the Solar PV is sized with any
other lesser Solar Insolation and Solar Fraction in the system is 100%, then Solar
electricity will be wasted in the month of maximum sun. In this case, Sdmax is
6KWh/ m2/ day in the month of April.
Average Daily Solar Insolation for each month (Sd): Once the Solar PV is
sized, this parameter will suggest that how much solar electricity will be
generated in a day of a particular month.
Average Hourly Solar Irradiance for the month with maximum sun (Sh): This
parameter will be utilized to size the battery of the system. Once the Solar PV is
sized, this parameter will help in calculating the amount of solar electricity
generated each hour. Solar electricity which will not be consumed by load, will
have to be absorbed in battery.
Step 3: Sizing of the Solar PV
Once we have Load data and Solar Insolation data, next step is to size the required
Solar PV. For sizing Solar PV, I used the very simple formula as mentioned below:
Solar PV Capacity required (PV) = (Daily Electricity Requirement (Ed)*Solar Fraction)/
(Maximum Energy Yield of PV *Efficiency of solar electricity production)
Daily Electricity Requirement= Ed (from Step 1)
Solar Fraction is the percentage of Solar Electricity in the total Electricity Mix. For
example Solar Fraction of 40% means that if the total electricity production is 100
KWh, then 40KWh was Solar electricity.
Energy yield of PV is the amount of electricity (KWh) that can be generated by 1
KW of Solar PV in a day. A 1KW of Solar PV can generate 1KWh of solar
electricity in an hour if the solar irradiance is 1000 W (1KW) /m2. From Step 2, we
understood that Sdmax is 6KWh/ m2/ day, therefore in a day, 1 KW of PV can
generate 6KWh of electricity. So Maximum Energy Yield of PV is considered
to be 6KWh/ KW
Efficiency of Solar electricity production is considered to be 0.9, considering
losses due to dust, high temperature etc.
Step 4: Sizing of the Power Converter (Master)

Varun Gaur, PPRE, University of Oldenburg Page 42
Power Converter is the central unit which controls the power generation, energy storage
and interacts with the load. The size of the Master should be equal to the maximum
power requirement of load at any point of time. Therefore Wattage of Power Converter
should be equivalent to Pmax (with a flexibility of 5% over capacity). However, if the
Solar Fraction is zero, we will only utilize Diesel Genset and therefore Power Converter
will not be used.
Further Number of Power Converters= Pmax/ Maximum AC Power of available Power
Converter
Step 5: Sizing of the Diesel Genset
The size of the Diesel Genset should be equal to the maximum power requirement of
load (Pmax) at any point of time. If the Solar fraction is between 0 and 0.5, I have
considered Size of Diesel Genset to be Pmax. In case, solar fraction is 0.5 or more then
I have considered size of Genset as 50% of the Pmax. The size will have a flexibility of
5% over capacity.
It is to be noted that I have not considered any effect of Power Factor in my calculations.
Step 6: Sizing of the Battery Bank
Battery Bank absorbs the electricity from Solar in day time and provides to load during
night time. The size of the battery bank can be calculated by the below mentioned
formula:
Batter Bank= (Electricity to be stored in battery* Autonomy)/ (Battery efficiency* DoD)
Energy to be stored in battery: Step 3 gave us the Size of Solar PV (PV). Step 2
gave us the Sh (hourly solar insolation during the day of maximum sun). Sh will
give us the hourly Yield from PV. Hourly Yield will be: Size of Solar PV * Sh.
For example, if size of Solar PV is 1KW and the Sh at 1pm to 2 pm is 700 W/m2,
then it means that 1KW of PV can generate 0.7KWh during 1 pm to 2 pm.
Similarly, we can get solar electricity for the entire day. This is further matched
with the hourly load requirements. The Solar electricity which is not consumed by
load is fed to the battery. For example, if the solar electricity generation between
1 pm to 2 pm is 0.7KWh and load requirement is 0.4KWh, and then 0.3KWh will
be fed to battery. Similarly, calculation of the entire day is carried out.
The number of Autonomy days is the number of days that battery must support
the load without starting the generator. In our case, if the Solar fraction is 100%,
then the battery can support the entire load for 1 day (in the month of maximum
solar insolation)
Battery Efficiency is considered to be 0.9
DoD (Depth of Discharge of the battery): DoD is the amount of charge that can
be taken out from battery in one cycle. For example, if the battery is 100Ah and
DoD is 70%, then 70Ah can be consumed from the battery in one cycle. In our
Varun Gaur, PPRE, University of Oldenburg Page 43
modeling DoD is assumed as 70% as the batteries under consideration is AGM
type (Absorbant Glass Mat) type, which provides 5 years life at deep discharges
(around 70-80%)
Step 7: Sizing of Diesel requirement
Step 3 gave us the size of PV. Step 2 gave us the Sd (average daily solar insolation in
each month). Daily Solar Electricity Yield can be calculated as: Size of Solar PV *Sd.
This was further matched with the daily load requirement. The leftover electricity
requirement is expected to be fed by Diesel Genset. Once we have sized the required
electricity units from Diesel Genset, amount of required Diesel will be calculated by using
the thumb rule that 350 ml of Diesel is used to generate 1 KWh of electricity.
Step 8: Sizing of the CO2 emissions
CO2 emission for hybrid system:
Step 7 gave us the daily electricity production from Solar and Diesel. As a rule of thumb,
750 grams of CO2 is produced while generating 1KWh of Diesel electricity and 36 grams
of CO2 is produced while generating 1KWh of solar electricity. In this way, I calculated
the CO2 emissions for generating a particular number of electricity units.
CO2 emission in existing scenario:
Further, during my scoping mission, I understood that Diesel Gensets in Island A were
using around 1 liter of Diesel to produce 1 KWh of electricity, therefore CO2 emissions in
existing scenario is assumed to be 3 times than the normal rate. Hence, it was assumed
that the current rate of CO2 emissions in Island A is 2 Kgs of CO2 per KWh of electricity
generation.
Further, findings from scoping mission to Island B indicated that around 350 ml of Diesel
is used to produce 1 unit of electricity and hence the rate of CO2 emissions in Island B in
existing scenario is considered 750 grams of CO2/ KWh of electricity production.
Savings in CO2 emissions were calculated as: CO2 emissions in the existing scenario –
CO2 emissions for Hybrid System
Step 9: Financial Modeling
In the above eight steps, we were able to size the Power Supply System. Now, in this
step, I will explain my strategy to model the Levelized Cost of electricity generation.
Levelized Cost (LC) of Electricity is generated by the following formula:
LC= ∑ (It+Mt+Ft)/ (1+r)t / ∑ Et(1-SDR)t/(1+r)t where summation and t extends from 1 to n
It= Total Investment cost in year t
Investment cost comprises: Cost of Solar PV+ Cost of Diesel Genset +
Investment cost of Battery+ Investment cost of Power Convertor
Varun Gaur, PPRE, University of Oldenburg Page 44
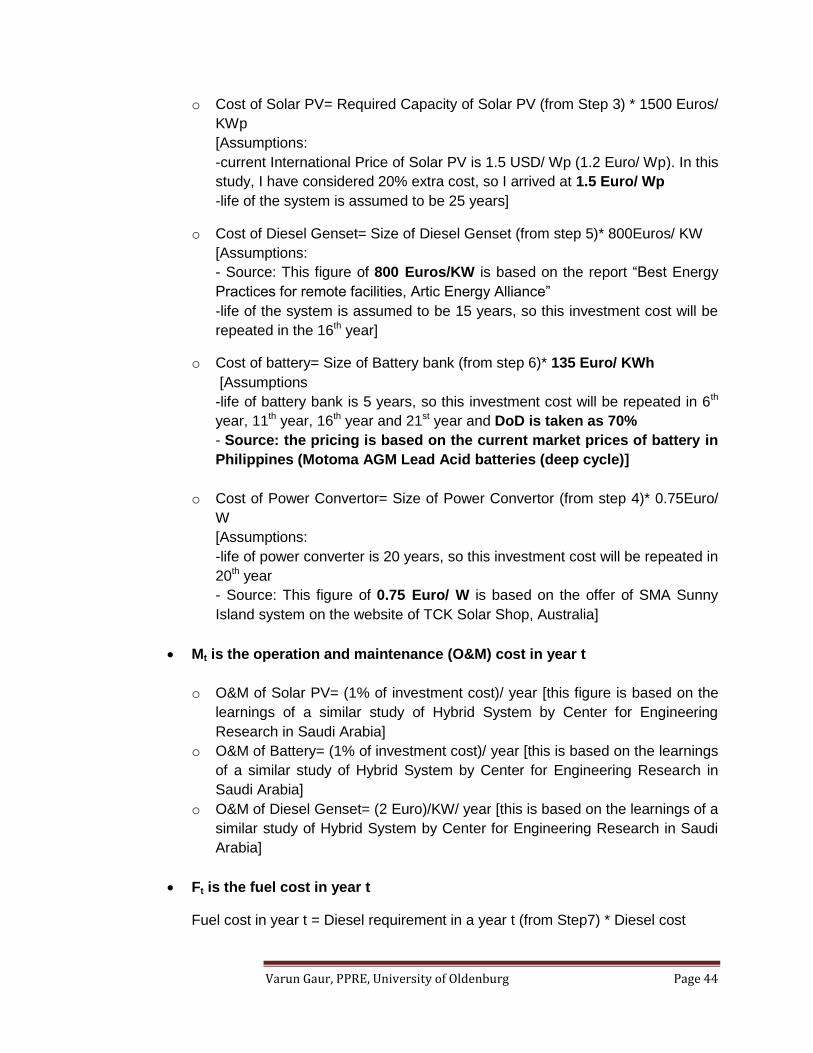
o Cost of Solar PV= Required Capacity of Solar PV (from Step 3) * 1500 Euros/
KWp
[Assumptions:
-current International Price of Solar PV is 1.5 USD/ Wp (1.2 Euro/ Wp). In this
study, I have considered 20% extra cost, so I arrived at 1.5 Euro/ Wp
-life of the system is assumed to be 25 years]
o Cost of Diesel Genset= Size of Diesel Genset (from step 5)* 800Euros/ KW
[Assumptions:
- Source: This figure of 800 Euros/KW is based on the report “Best Energy
Practices for remote facilities, Artic Energy Alliance”
-life of the system is assumed to be 15 years, so this investment cost will be
repeated in the 16th year]
o Cost of battery= Size of Battery bank (from step 6)* 135 Euro/ KWh
[Assumptions
-life of battery bank is 5 years, so this investment cost will be repeated in 6th
year, 11th year, 16th year and 21st year and DoD is taken as 70%
- Source: the pricing is based on the current market prices of battery in
Philippines (Motoma AGM Lead Acid batteries (deep cycle)]
o Cost of Power Convertor= Size of Power Convertor (from step 4)* 0.75Euro/
W
[Assumptions:
-life of power converter is 20 years, so this investment cost will be repeated in
20th year
- Source: This figure of 0.75 Euro/ W is based on the offer of SMA Sunny
Island system on the website of TCK Solar Shop, Australia]
Mt is the operation and maintenance (O&M) cost in year t
o O&M of Solar PV= (1% of investment cost)/ year [this figure is based on the
learnings of a similar study of Hybrid System by Center for Engineering
Research in Saudi Arabia]
o O&M of Battery= (1% of investment cost)/ year [this is based on the learnings
of a similar study of Hybrid System by Center for Engineering Research in
Saudi Arabia]
o O&M of Diesel Genset= (2 Euro)/KW/ year [this is based on the learnings of a
similar study of Hybrid System by Center for Engineering Research in Saudi
Arabia]
Ft is the fuel cost in year t
Fuel cost in year t = Diesel requirement in a year t (from Step7) * Diesel cost
Varun Gaur, PPRE, University of Oldenburg Page 45
Diesel cost was 1 Euro/ Liter in island A, so it is kept same in the analysis
SDR- It is the System Degradation Rate owing to the losses due to ageing of
Solar PV modules and generators. It is considered 0.5% in my model.
r is the Discount rate: Discount rate is a factor by which a future value must be
multiplied in order to obtain the present value. This includes interest rate as well
as other financial risks involved with the investment. In my modeling, I will
consider different discount rates between 6% to 13%
n is the life of the project: In my modeling, I have considered 25 years as the
life of the project
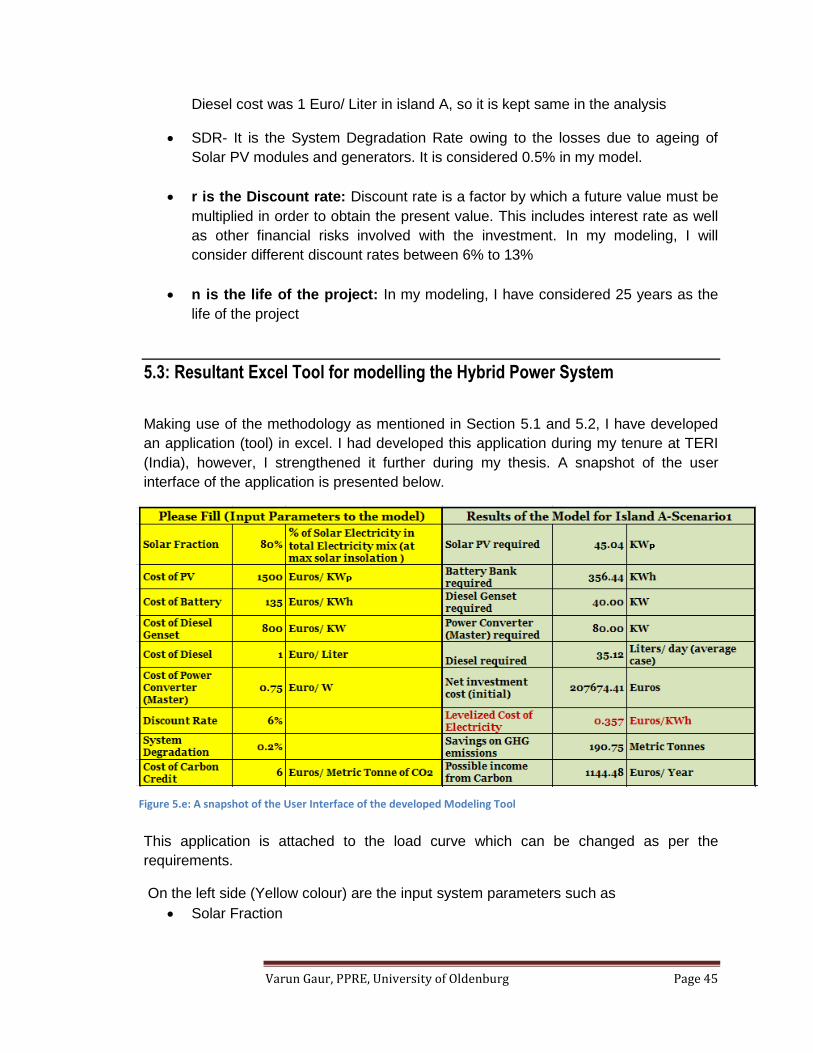
5.3: Resultant Excel Tool for modelling the Hybrid Power System
Making use of the methodology as mentioned in Section 5.1 and 5.2, I have developed
an application (tool) in excel. I had developed this application during my tenure at TERI
(India), however, I strengthened it further during my thesis. A snapshot of the user
interface of the application is presented below.
This application is attached to the load curve which can be changed as per the
requirements.
On the left side (Yellow colour) are the input system parameters such as
Solar Fraction
Figure 5.e: A snapshot of the User Interface of the developed Modeling Tool
Varun Gaur, PPRE, University of Oldenburg Page 46
Cost of system components (such as Solar PV, Diesel Genset, Power Converter,
Diesel, Cost of Carbon)
Discount Rate
System Degradation Rate
On the basis of input parameters and the load curve, it calculates and displays:
System Sizes (Size of Solar PV, Diesel Genset, Power Converter, Diesel
Requirement)
Initial Investment Cost
Levelized Cost of Electricity
Carbon Credits
The above mentioned methodology and the excel application will be utilized to
model Solar/ Solar-Diesel Hybrid Systems for Island A and Island B. The results of
the modeling are discussed in next Chapter (Chapter 6).
Varun Gaur, PPRE, University of Oldenburg Page 47
CHAPTER 6: RESULTS OF THE MODELING OF SOLAR-DIESEL HYBRID SYSTEM FOR ISLAND A & ISLAND B
Chapter 5 presented my methodology and my developed excel application for modeling
the power system. This chapter will present the results of applying the above mentioned
methodology for the Island A and Island B.
The focus of my study is Island A, for which I have considered different scenarios . I will
start by describing different load scenarios for Island A
6.1: Different Load Scenarios for Island A
Based on the household survey, I got the electric load pattern in the island A (discussed
in Chapter 4). I utilized this load pattern to size the solar-Diesel hybrid mini grid. Further,
I felt that there can be some changes in the load pattern in the near future and I made 2
two extra scenarios.
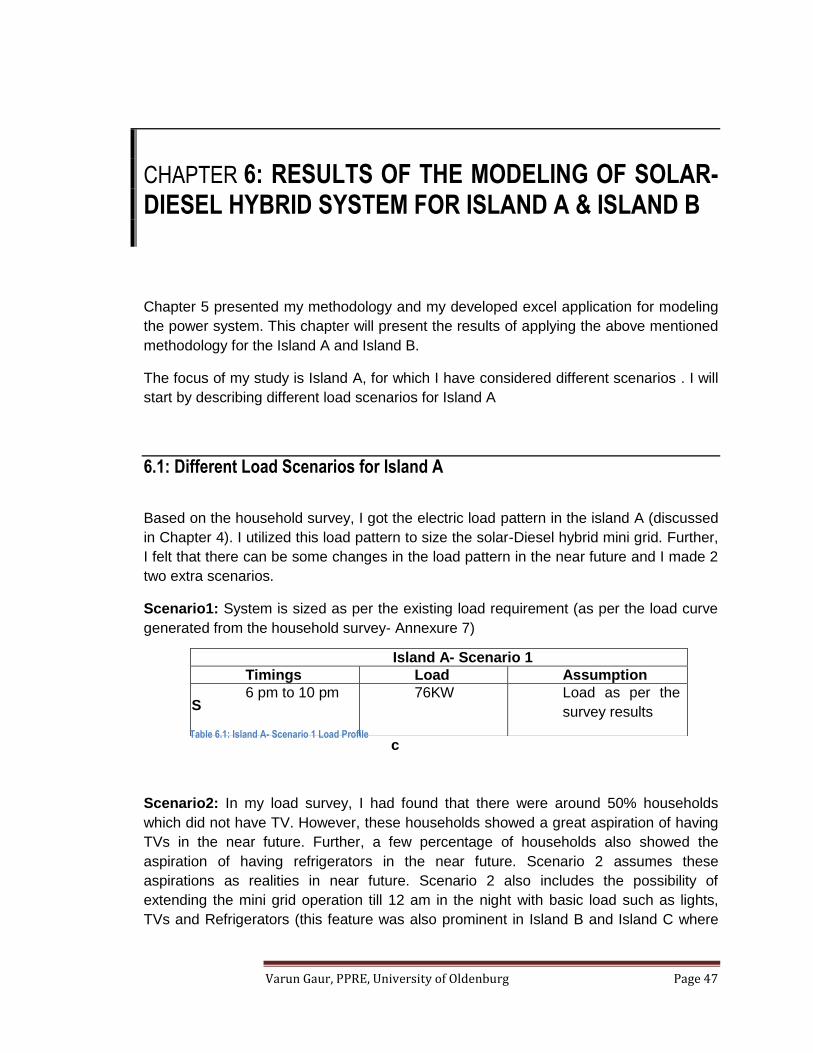
Scenario1: System is sized as per the existing load requirement (as per the load curve
generated from the household survey- Annexure 7)
S
c
Scenario2: In my load survey, I had found that there were around 50% households
which did not have TV. However, these households showed a great aspiration of having
TVs in the near future. Further, a few percentage of households also showed the
aspiration of having refrigerators in the near future. Scenario 2 assumes these
aspirations as realities in near future. Scenario 2 also includes the possibility of
extending the mini grid operation till 12 am in the night with basic load such as lights,
TVs and Refrigerators (this feature was also prominent in Island B and Island C where
Island A- Scenario 1
Timings Load Assumption
6 pm to 10 pm 76KW Load as per the
survey results
Table 6.1: Island A- Scenario 1 Load Profile
Varun Gaur, PPRE, University of Oldenburg Page 48
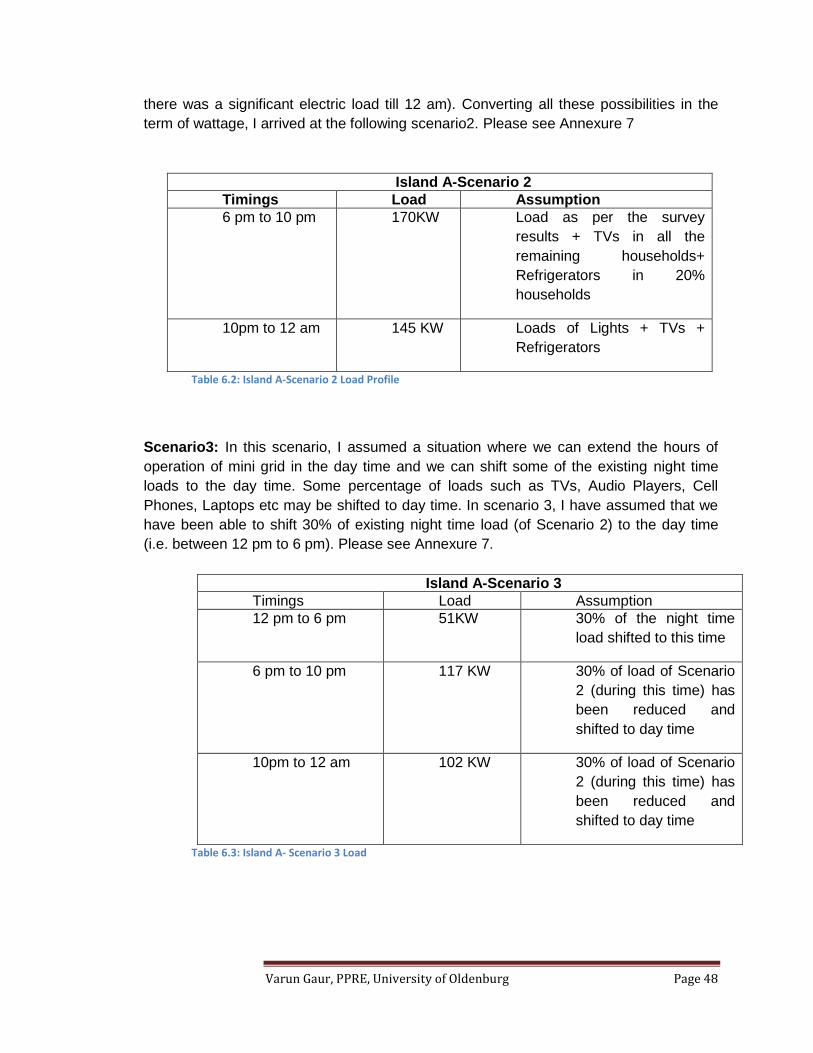
there was a significant electric load till 12 am). Converting all these possibilities in the
term of wattage, I arrived at the following scenario2. Please see Annexure 7
Island A-Scenario 2
Timings Load Assumption
6 pm to 10 pm 170KW Load as per the survey
results + TVs in all the
remaining households+
Refrigerators in 20%
households
10pm to 12 am 145 KW Loads of Lights + TVs +
Refrigerators
Table 6.2: Island A-Scenario 2 Load Profile
Scenario3: In this scenario, I assumed a situation where we can extend the hours of
operation of mini grid in the day time and we can shift some of the existing night time
loads to the day time. Some percentage of loads such as TVs, Audio Players, Cell
Phones, Laptops etc may be shifted to day time. In scenario 3, I have assumed that we
have been able to shift 30% of existing night time load (of Scenario 2) to the day time
(i.e. between 12 pm to 6 pm). Please see Annexure 7.
Island A-Scenario 3
Timings Load Assumption
12 pm to 6 pm 51KW 30% of the night time
load shifted to this time
6 pm to 10 pm 117 KW 30% of load of Scenario
2 (during this time) has
been reduced and
shifted to day time
10pm to 12 am 102 KW 30% of load of Scenario
2 (during this time) has
been reduced and
shifted to day time
Table 6.3: Island A- Scenario 3 Load
Varun Gaur, PPRE, University of Oldenburg Page 49
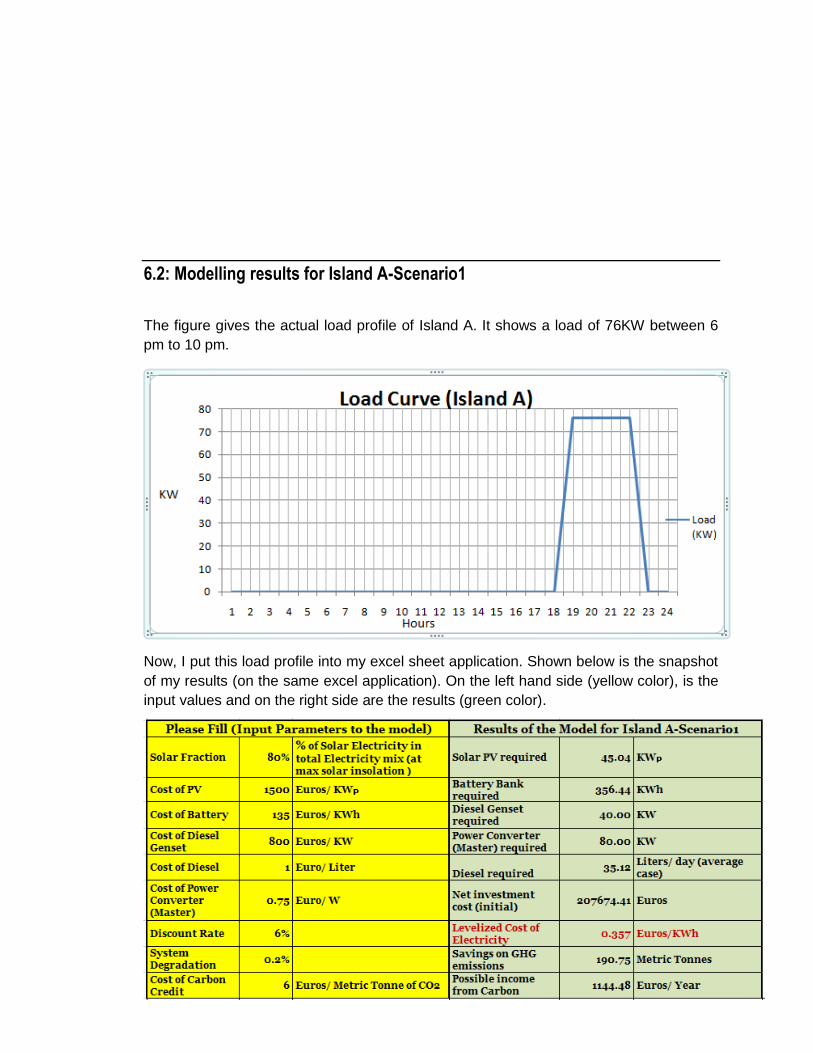
6.2: Modelling results for Island A-Scenario1
The figure gives the actual load profile of Island A. It shows a load of 76KW between 6
pm to 10 pm.
Now, I put this load profile into my excel sheet application. Shown below is the snapshot
of my results (on the same excel application). On the left hand side (yellow color), is the
input values and on the right side are the results (green color).
Varun Gaur, PPRE, University of Oldenburg Page 50
The above snapshot shows that for Island A- Scenario1 load profile: for example: When I
input the required Solar Fraction to be 80%, then the Levelized cost of electricity
generation (LC) will be 0.357 Euros/ KWh. It also gives the values for the required
system sizes and also the carbon emission values. Similarly, by changing input
parameters, resultant values can be obtained. Please see Figure 4.g above for the
assumptions and the results.
6.2.1 Sensitivity Analysis for IslandA-Scenario1
Now, in his section, I have done several simulations for analyzing the effect on Levelized
Cost of electricity by varying different system parameters.
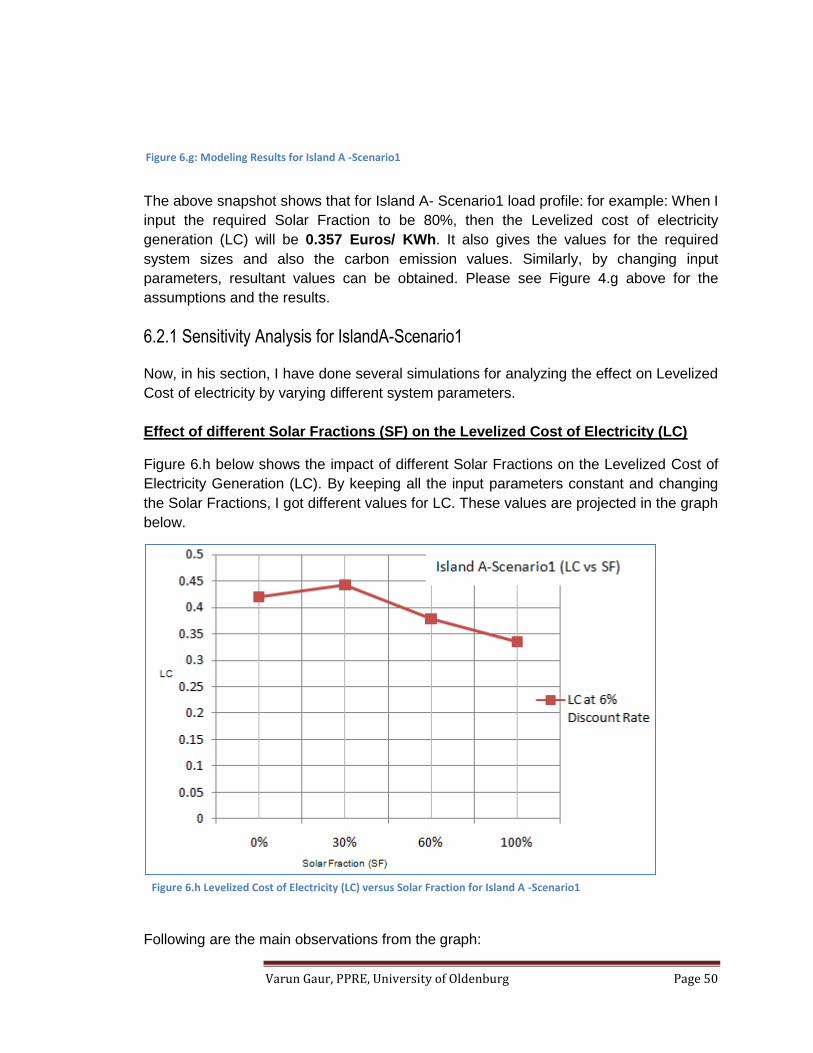
Effect of different Solar Fractions (SF) on the Levelized Cost of Electricity (LC)
Figure 6.h below shows the impact of different Solar Fractions on the Levelized Cost of
Electricity Generation (LC). By keeping all the input parameters constant and changing
the Solar Fractions, I got different values for LC. These values are projected in the graph
below.
Following are the main observations from the graph:
Figure 6.g: Modeling Results for Island A -Scenario1
Figure 6.h Levelized Cost of Electricity (LC) versus Solar Fraction for Island A -Scenario1
Varun Gaur, PPRE, University of Oldenburg Page 51
Levelized Electricity cost (LC) is found to be lower at higher solar penetration
(SF).
It can be observed that LC decreases with increasing SF, however, the cost of
Master (Power Converter) makes lower SF expensive and this results in the peak
of LC at SF=30%. LC at SF =0% was observed to be better then SF=30%,
because Master is no more required and the cost is omitted.
Therefore at lower solar fractions, it will be undesirable to have Master, instead,
Solar PV should be connected to load in a decentralized manner.
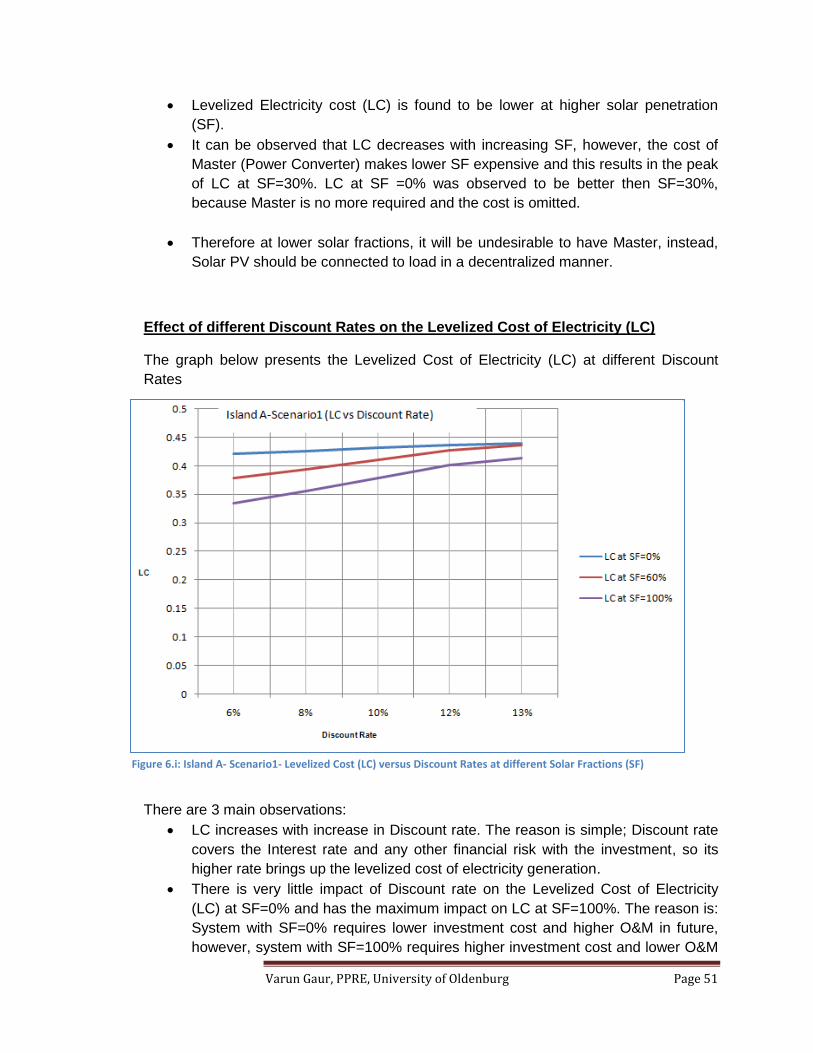
Effect of different Discount Rates on the Levelized Cost of Electricity (LC)
The graph below presents the Levelized Cost of Electricity (LC) at different Discount
Rates
There are 3 main observations:
LC increases with increase in Discount rate. The reason is simple; Discount rate
covers the Interest rate and any other financial risk with the investment, so its
higher rate brings up the levelized cost of electricity generation.
There is very little impact of Discount rate on the Levelized Cost of Electricity
(LC) at SF=0% and has the maximum impact on LC at SF=100%. The reason is:
System with SF=0% requires lower investment cost and higher O&M in future,
however, system with SF=100% requires higher investment cost and lower O&M
Figure 6.i: Island A- Scenario1- Levelized Cost (LC) versus Discount Rates at different Solar Fractions (SF)
Varun Gaur, PPRE, University of Oldenburg Page 52
in future. Higher discount rates will affect the latter more, because high Discount
rate makes the future investment less valuable and current investment more
valuable.
If Discount rates are higher, solar penetration in the system will not be desirable.
In fact, at Discount Rate of 15%, LC at SF=0% (0.446Euro/ KWh) and LC at
SF=100% (0.443 Euro/ KWh) will almost hit each other.
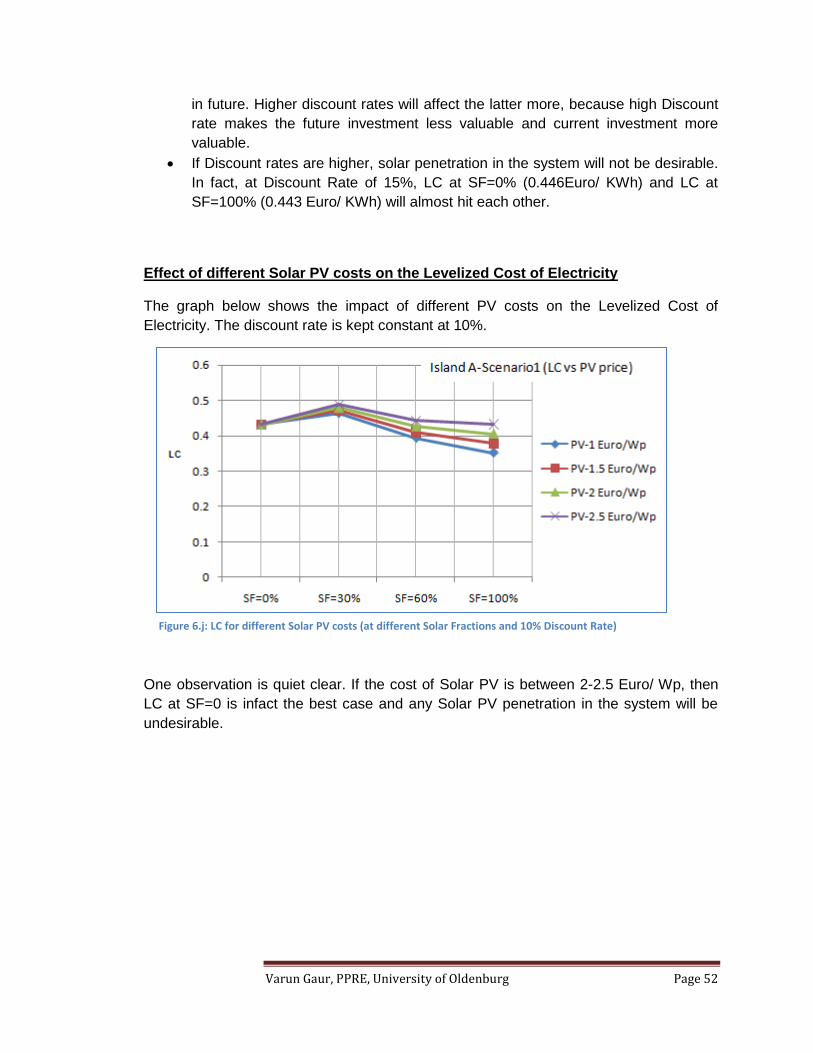
Effect of different Solar PV costs on the Levelized Cost of Electricity
The graph below shows the impact of different PV costs on the Levelized Cost of
Electricity. The discount rate is kept constant at 10%.
One observation is quiet clear. If the cost of Solar PV is between 2-2.5 Euro/ Wp, then
LC at SF=0 is infact the best case and any Solar PV penetration in the system will be
undesirable.
Figure 6.j: LC for different Solar PV costs (at different Solar Fractions and 10% Discount Rate)

Varun Gaur, PPRE, University of Oldenburg Page 53
6.3: Modelling results for Island A-Scenario2
Shown below is the Island A - Scenario2 Load curve (Scenario 2 has already been
explained above). It shows the load of 170KW between 6 pm to 10pm and load of
145KW between 10 pm and 12 am.
Now applying the Scenario2-Load profile to my excel application, I got the below
mentioned results.
Figure 6.k: Load curve for Island A-Scenario 2
Varun Gaur, PPRE, University of Oldenburg Page 54
Applying exactly the same input parameters, the Levelized cost of electricity in scenario
2 is 0.335 Euro/ KWh as compared to 0.357 Euro/ KWh in scenario 1. Thus we see that
as the load grows (almost double as of Scenario 1), the Levelized Cost of
electricity will come down, however, the drop is not significant.
6.3.1 Sensitivity Analysis for IslandA-Scenario2
Now, in the this section, I have done several simulations for analyzing the effect on
Levelized Cost of electricity by varying cost of solar, solar fractions and discount rates
rates. Also, I have tried to compare Scenario 2 results with Scenario 1.
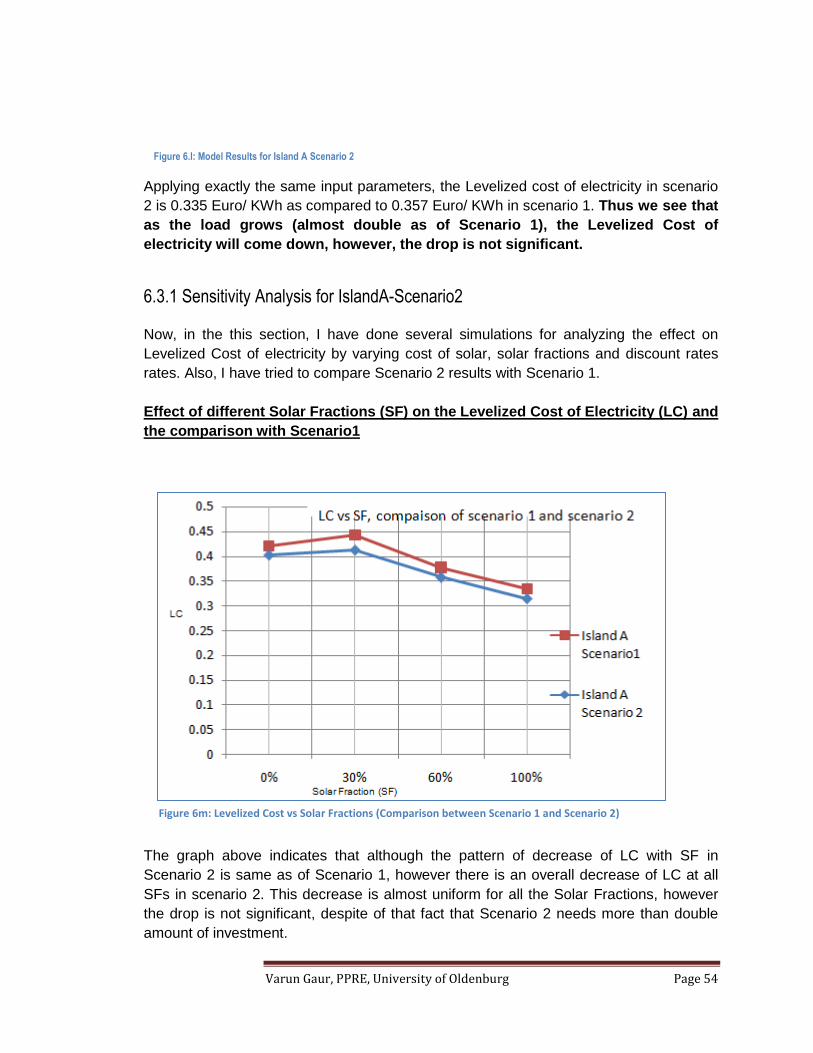
Effect of different Solar Fractions (SF) on the Levelized Cost of Electricity (LC) and
the comparison with Scenario1
The graph above indicates that although the pattern of decrease of LC with SF in
Scenario 2 is same as of Scenario 1, however there is an overall decrease of LC at all
SFs in scenario 2. This decrease is almost uniform for all the Solar Fractions, however
the drop is not significant, despite of that fact that Scenario 2 needs more than double
amount of investment.
Figure 6.l: Model Results for Island A Scenario 2
Figure 6m: Levelized Cost vs Solar Fractions (Comparison between Scenario 1 and Scenario 2)
Varun Gaur, PPRE, University of Oldenburg Page 55
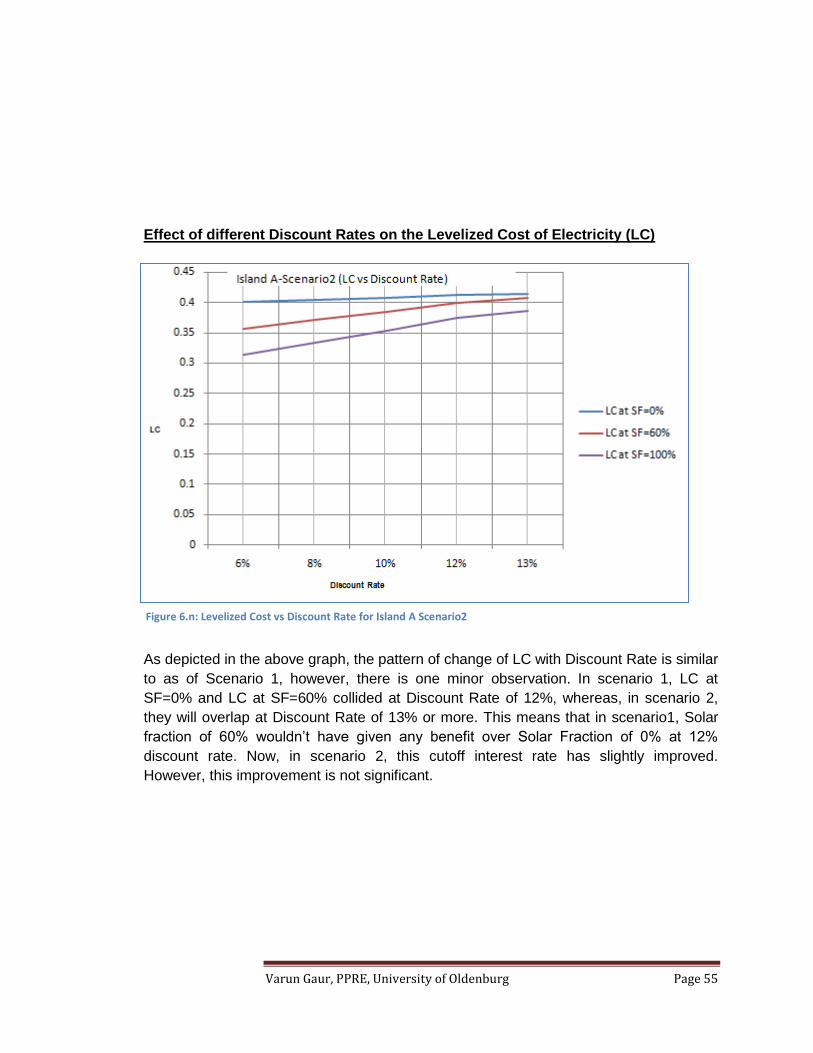
Effect of different Discount Rates on the Levelized Cost of Electricity (LC)
As depicted in the above graph, the pattern of change of LC with Discount Rate is similar
to as of Scenario 1, however, there is one minor observation. In scenario 1, LC at
SF=0% and LC at SF=60% collided at Discount Rate of 12%, whereas, in scenario 2,
they will overlap at Discount Rate of 13% or more. This means that in scenario1, Solar
fraction of 60% wouldn’t have given any benefit over Solar Fraction of 0% at 12%
discount rate. Now, in scenario 2, this cutoff interest rate has slightly improved.
However, this improvement is not significant.
Figure 6.n: Levelized Cost vs Discount Rate for Island A Scenario2
Varun Gaur, PPRE, University of Oldenburg Page 56
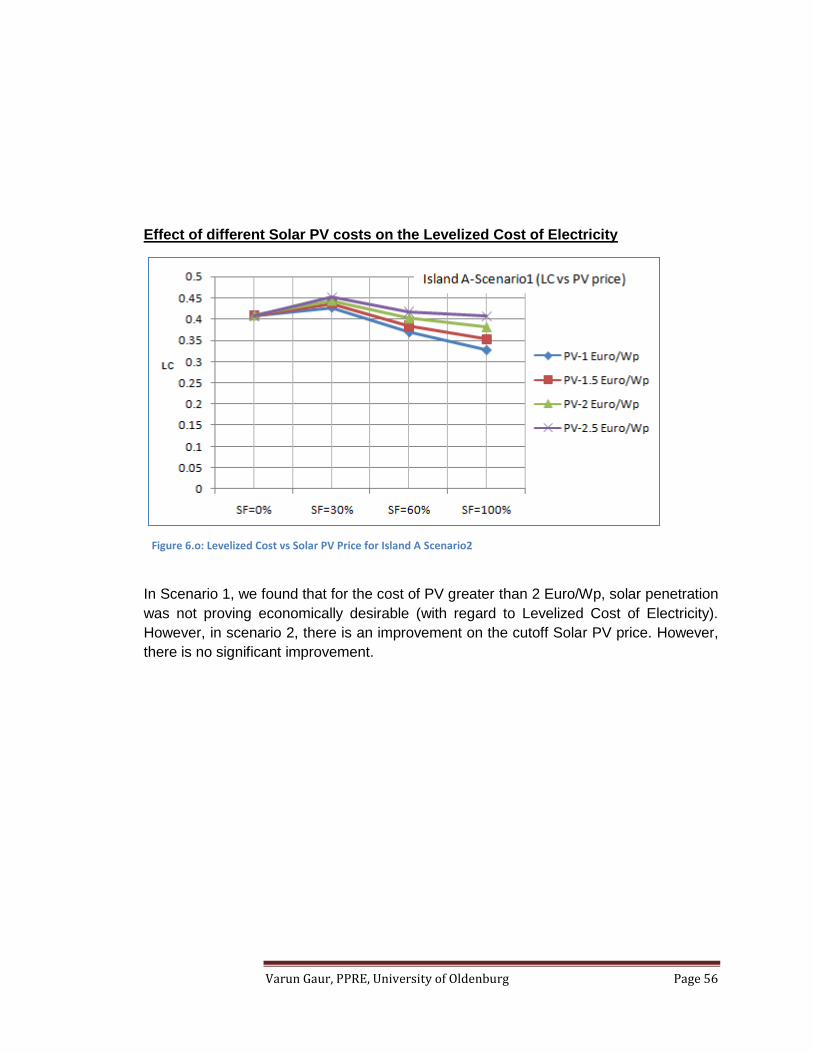
Effect of different Solar PV costs on the Levelized Cost of Electricity
In Scenario 1, we found that for the cost of PV greater than 2 Euro/Wp, solar penetration
was not proving economically desirable (with regard to Levelized Cost of Electricity).
However, in scenario 2, there is an improvement on the cutoff Solar PV price. However,
there is no significant improvement.
Figure 6.o: Levelized Cost vs Solar PV Price for Island A Scenario2
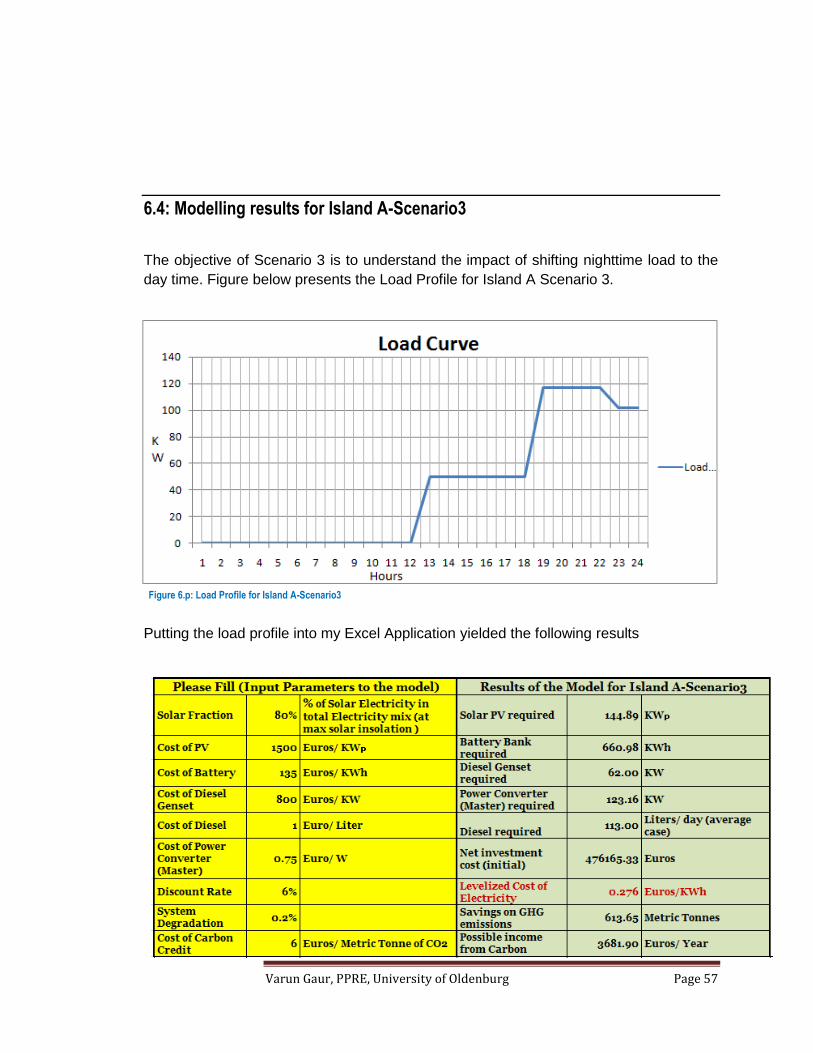
Varun Gaur, PPRE, University of Oldenburg Page 57
6.4: Modelling results for Island A-Scenario3
The objective of Scenario 3 is to understand the impact of shifting nighttime load to the
day time. Figure below presents the Load Profile for Island A Scenario 3.
Putting the load profile into my Excel Application yielded the following results
Figure 6.p: Load Profile for Island A-Scenario3

Varun Gaur, PPRE, University of Oldenburg Page 58
There are 3 very clear observations:
There is a significant reduction in the amount of battery needed in comparison to
scenario 2 (1137 KWh compared to 660 KWh)
There is a reduction in the net initial investment cost (592,690 Euros compared to
476,165 Euros)
The Levelized Cost of Electricity has come down to 0.276Euros/ KWh from 0.335
Euros/ KWh at the same input parameters.
6.4.1 Sensitivity Analysis for IslandA-Scenario3
Effect of different Solar Fractions (SF) on the Levelized Cost of Electricity (LC) and
the comparison with Scenario2
There are 3 prominent observations:
o There is a significant reduction in Levelized Cost of electricity by shifting 30% of
nighttime load to day time (more than 5 Euro cents)
Figure 6.r: Levelized Cost vs Solar PV Price for Island A- Scenario3 (and comparison with Scenario2
Figure 6.q: Snapshots of results for Island A-Scenario3

Varun Gaur, PPRE, University of Oldenburg Page 59
o The peak of LC at SF=30%, which was very prominent in the last 2 scenarios is
absent in this scenario, as there is a significant reduction in the investment cost
of battery. So, any solar penetration is better then Diesel ONLY option.
o There is also a reduction of LC at SF=0 in scenario 3 compared to scenario 2.
The main reason is that with the shifting of night time load to day time, the
maximum power requirement at any point of day has come down; therefore Max
Generator Size required has also come down.
Effect of different Discount Rates on the Levelized Cost of Electricity (LC)
In scenario 2, we found that at 13% Discount Rate, Levelized cost at Solar Fraction of
0% was similar to Solar Fraction of 60%, but in this scenario this situation will come at
much higher discount rates.
This show that even at much higher discount rates, Solar penetration will be desirable in
Scenario 3.
Figure 6.s: Levelized Cost vs Discount rates for Island A Scenario3
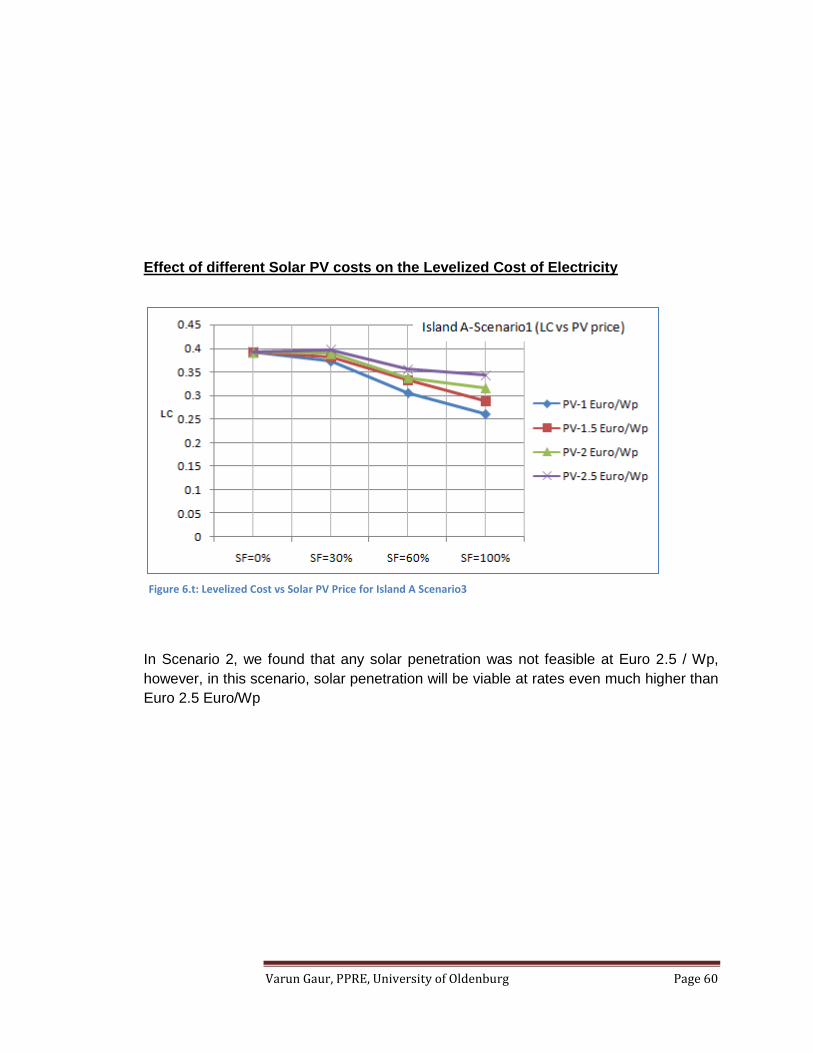
Varun Gaur, PPRE, University of Oldenburg Page 60
Effect of different Solar PV costs on the Levelized Cost of Electricity
In Scenario 2, we found that any solar penetration was not feasible at Euro 2.5 / Wp,
however, in this scenario, solar penetration will be viable at rates even much higher than
Euro 2.5 Euro/Wp
Figure 6.t: Levelized Cost vs Solar PV Price for Island A Scenario3
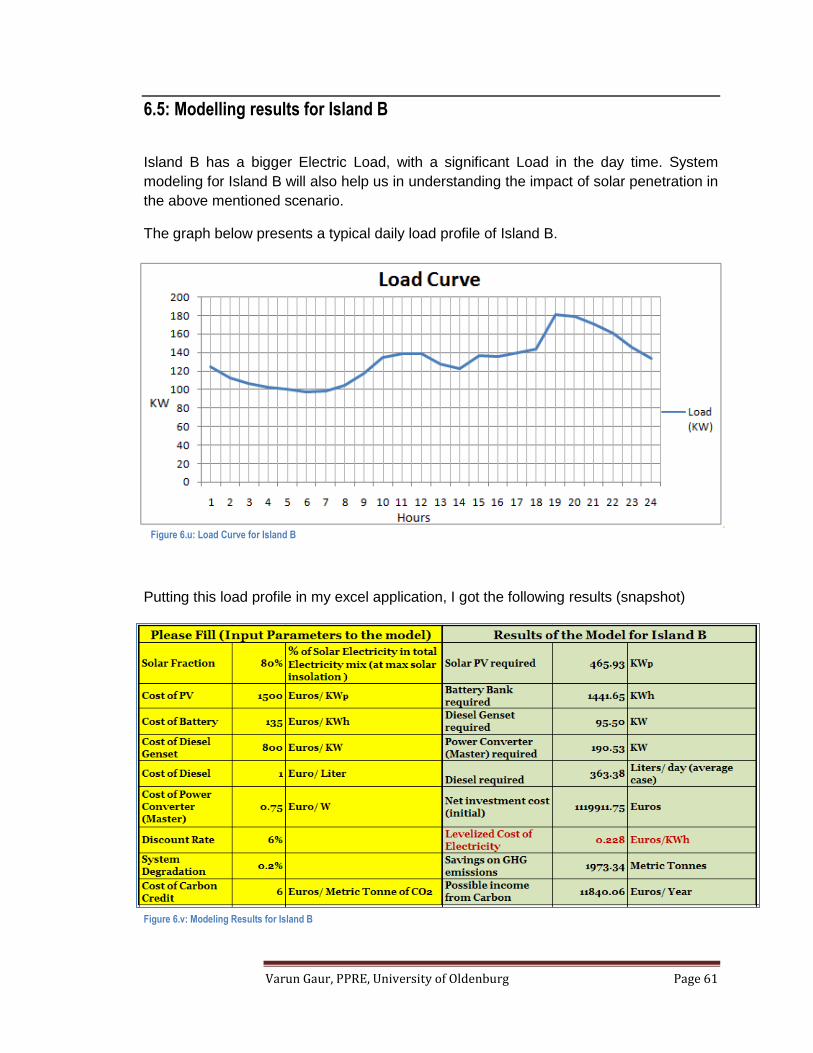
Varun Gaur, PPRE, University of Oldenburg Page 61
6.5: Modelling results for Island B
Island B has a bigger Electric Load, with a significant Load in the day time. System
modeling for Island B will also help us in understanding the impact of solar penetration in
the above mentioned scenario.
The graph below presents a typical daily load profile of Island B.
Putting this load profile in my excel application, I got the following results (snapshot)
Figure 6.u: Load Curve for Island B
Figure 6.v: Modeling Results for Island B
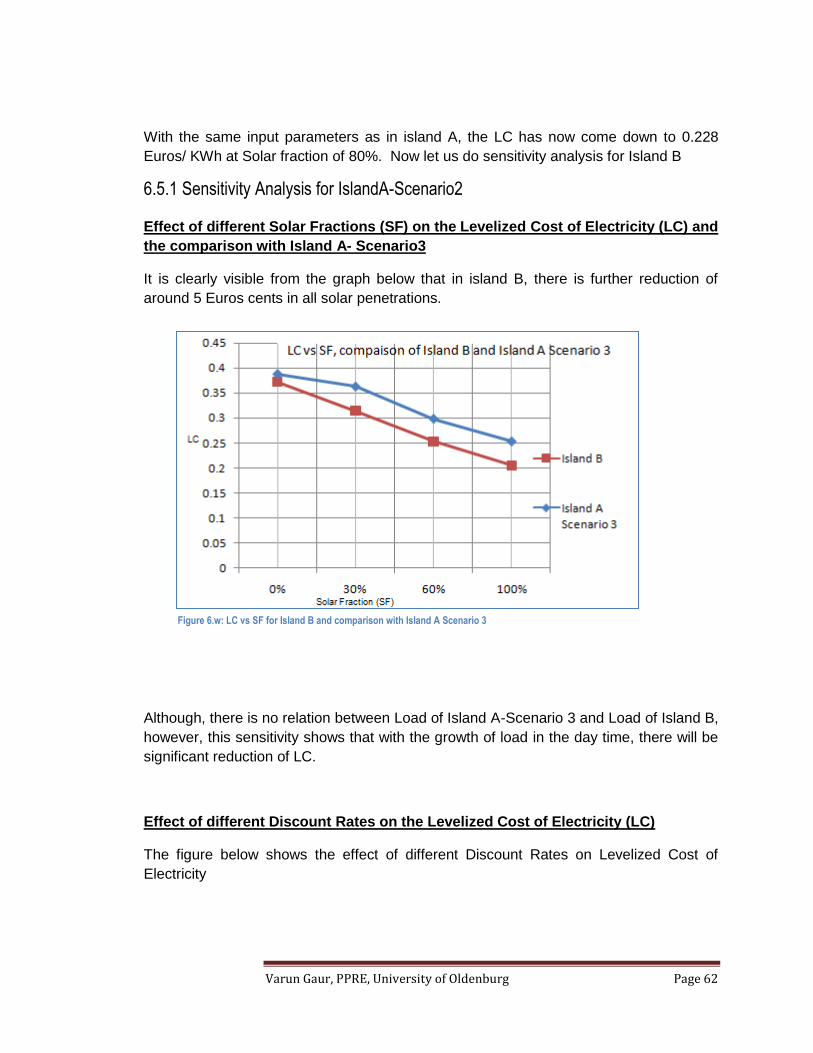
Varun Gaur, PPRE, University of Oldenburg Page 62
With the same input parameters as in island A, the LC has now come down to 0.228
Euros/ KWh at Solar fraction of 80%. Now let us do sensitivity analysis for Island B
6.5.1 Sensitivity Analysis for IslandA-Scenario2
Effect of different Solar Fractions (SF) on the Levelized Cost of Electricity (LC) and
the comparison with Island A- Scenario3
It is clearly visible from the graph below that in island B, there is further reduction of
around 5 Euros cents in all solar penetrations.
Although, there is no relation between Load of Island A-Scenario 3 and Load of Island B,
however, this sensitivity shows that with the growth of load in the day time, there will be
significant reduction of LC.
Effect of different Discount Rates on the Levelized Cost of Electricity (LC)
The figure below shows the effect of different Discount Rates on Levelized Cost of
Electricity
Figure 6.w: LC vs SF for Island B and comparison with Island A Scenario 3
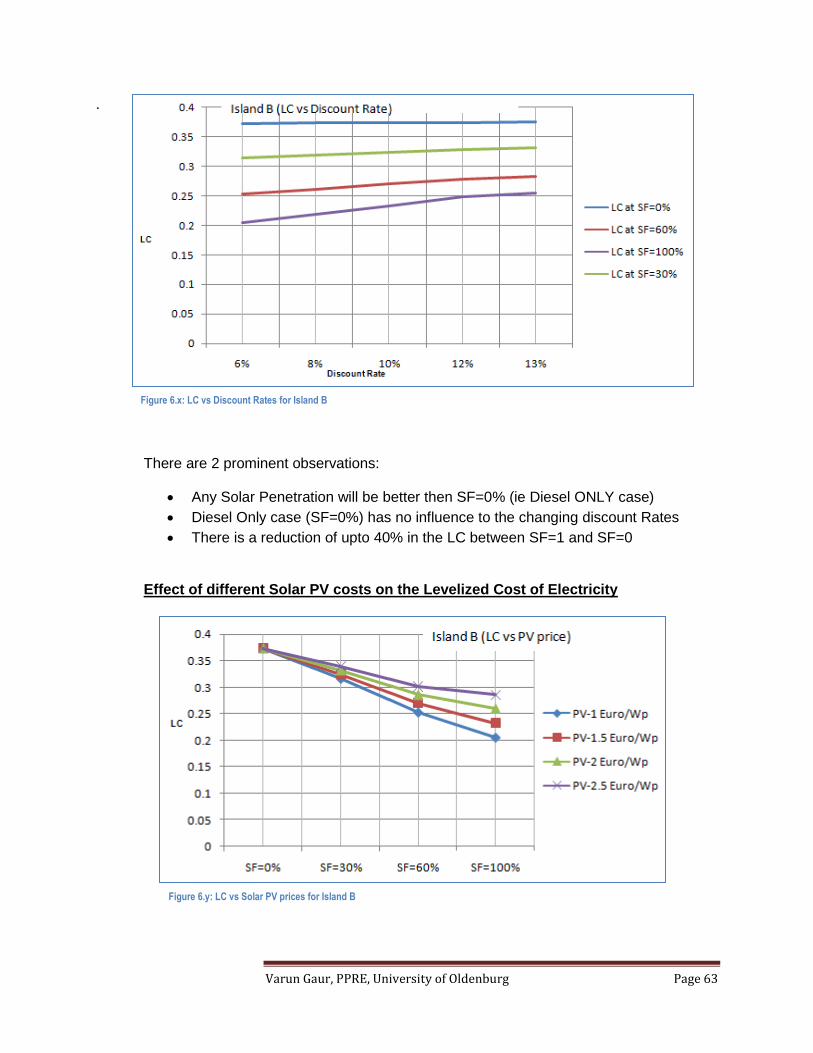
Varun Gaur, PPRE, University of Oldenburg Page 63
.
There are 2 prominent observations:
Any Solar Penetration will be better then SF=0% (ie Diesel ONLY case)
Diesel Only case (SF=0%) has no influence to the changing discount Rates
There is a reduction of upto 40% in the LC between SF=1 and SF=0
Effect of different Solar PV costs on the Levelized Cost of Electricity
Figure 6.x: LC vs Discount Rates for Island B
Figure 6.y: LC vs Solar PV prices for Island B

Varun Gaur, PPRE, University of Oldenburg Page 64
The graph indicates that solar penetration will be viable even at much higher prices of
Solar PV (even higher than 2.5 Euro/ Wp)

Varun Gaur, PPRE, University of Oldenburg Page 65
CHAPTER 7: ASSESSMENT OF ROOFTOP PV POTENTIAL IN ISLAND B
During my survey in Island B, I realized that there is a vast potential of utilizing roof tops
of Resorts for PV installation, because of the following reasons:
Resorts have a significant day time load which will match the Solar PV
generation
There is a good amount of Roof tops available on the resorts
The Price of electricity is already very high in island B and Resort owners
showed an inclination of Roof Top Solar in their resorts.
Further, as seen in chapter 6, we found that any penetration of solar in Island B Grid is
much economical then Only Diesel Option. Therefore, there is a strong case of putting
solar on the rooftop of the resorts.
After my discussions with PSPI staff, I did an indicative assessment of the Rooftop Solar
PV potential of the resorts. I was assisted by a PSPI staff, Mr Ian, who helped me in
seeing around all the relevant resorts.
Section 7.1 of this chapter presents my methodology of the roof top PV assessment.
Section 7.2 presents the rough sketches of the relevant resorts. Section 7.3 presents the
possible Solar PV installation on the roof tops of the resorts and the methodology of
calculation.
7.1: Methodology for the Assessment
In my understanding, Roof Top PV installation requires assessment at 3 fronts:
I. Rooftop Area
For its rated performance, Solar PV panels should always be facing South
direction, at an inclination which should be equivalent to the latitude of the place
of installation. There should off course be no hindrance to the sunlight. Rooftops
should therefore be accordingly chosen.
II. Structural strength of Rooftop: The roof of the building should be capable of
handling the mechanical stress of Solar PV. Solar PV installation would also
require mounting structure to be drilled and fastened into the roof, so rooftop
should be accordingly capable.
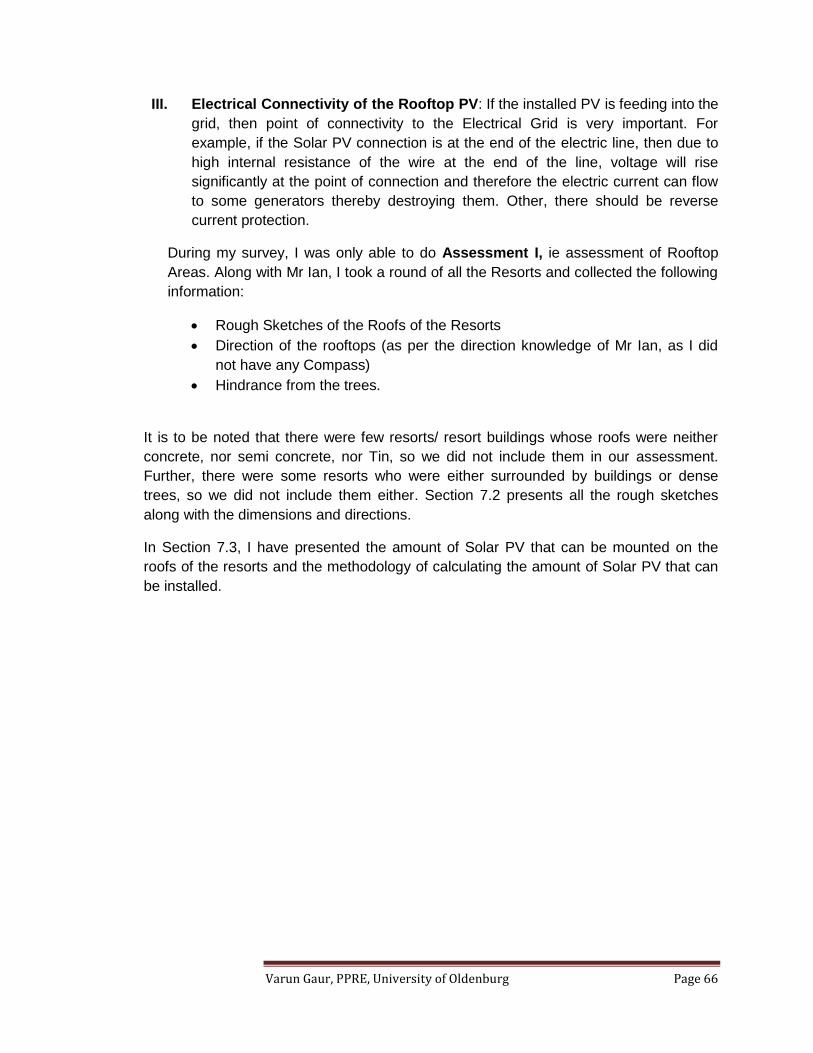
Varun Gaur, PPRE, University of Oldenburg Page 66
III. Electrical Connectivity of the Rooftop PV: If the installed PV is feeding into the
grid, then point of connectivity to the Electrical Grid is very important. For
example, if the Solar PV connection is at the end of the electric line, then due to
high internal resistance of the wire at the end of the line, voltage will rise
significantly at the point of connection and therefore the electric current can flow
to some generators thereby destroying them. Other, there should be reverse
current protection.
During my survey, I was only able to do Assessment I, ie assessment of Rooftop
Areas. Along with Mr Ian, I took a round of all the Resorts and collected the following
information:
Rough Sketches of the Roofs of the Resorts
Direction of the rooftops (as per the direction knowledge of Mr Ian, as I did
not have any Compass)
Hindrance from the trees.
It is to be noted that there were few resorts/ resort buildings whose roofs were neither
concrete, nor semi concrete, nor Tin, so we did not include them in our assessment.
Further, there were some resorts who were either surrounded by buildings or dense
trees, so we did not include them either. Section 7.2 presents all the rough sketches
along with the dimensions and directions.
In Section 7.3, I have presented the amount of Solar PV that can be mounted on the
roofs of the resorts and the methodology of calculating the amount of Solar PV that can
be installed.
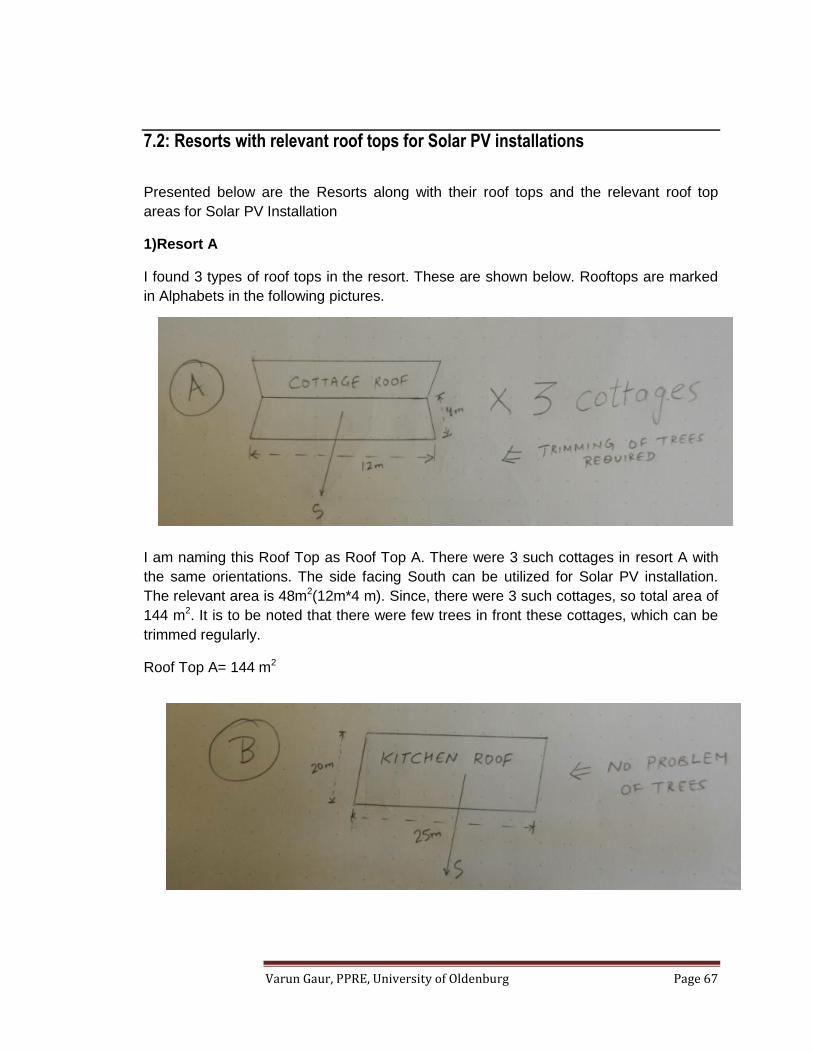
Varun Gaur, PPRE, University of Oldenburg Page 67
7.2: Resorts with relevant roof tops for Solar PV installations
Presented below are the Resorts along with their roof tops and the relevant roof top
areas for Solar PV Installation
1)Resort A
I found 3 types of roof tops in the resort. These are shown below. Rooftops are marked
in Alphabets in the following pictures.
I am naming this Roof Top as Roof Top A. There were 3 such cottages in resort A with
the same orientations. The side facing South can be utilized for Solar PV installation.
The relevant area is 48m2(12m*4 m). Since, there were 3 such cottages, so total area of
144 m2. It is to be noted that there were few trees in front these cottages, which can be
trimmed regularly.
Roof Top A= 144 m2
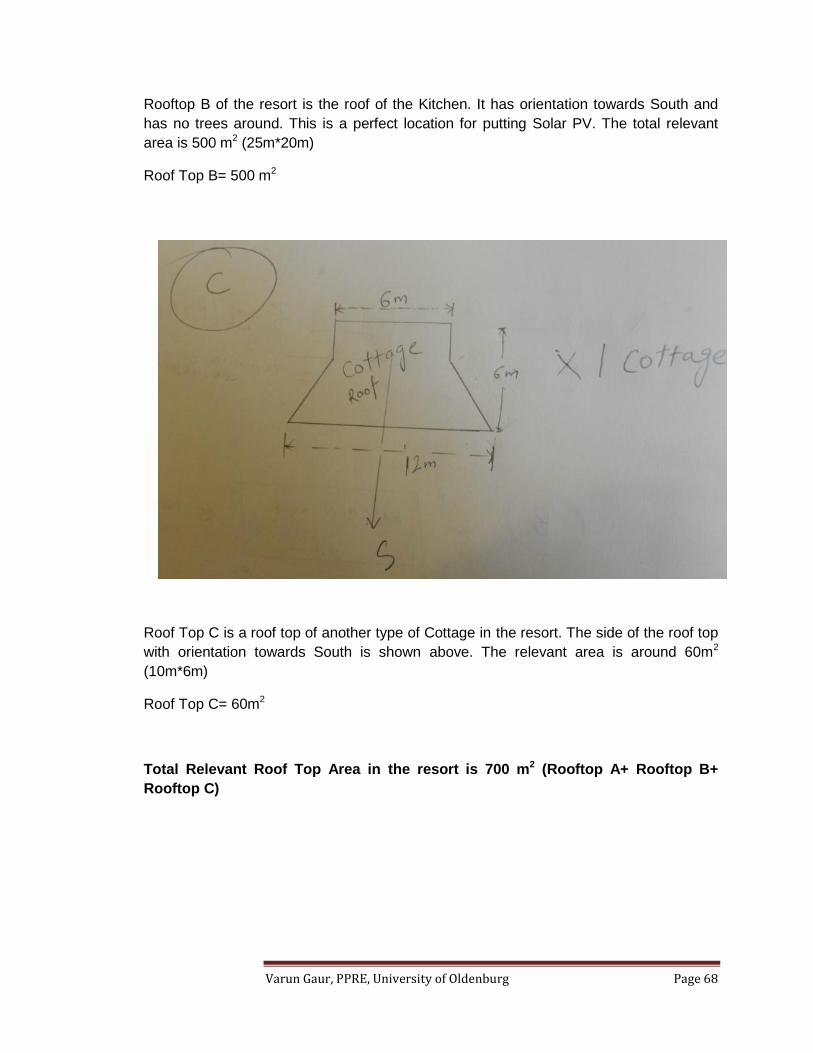
Varun Gaur, PPRE, University of Oldenburg Page 68
Rooftop B of the resort is the roof of the Kitchen. It has orientation towards South and
has no trees around. This is a perfect location for putting Solar PV. The total relevant
area is 500 m2 (25m*20m)
Roof Top B= 500 m2
Roof Top C is a roof top of another type of Cottage in the resort. The side of the roof top
with orientation towards South is shown above. The relevant area is around 60m2
(10m*6m)
Roof Top C= 60m2
Total Relevant Roof Top Area in the resort is 700 m2 (Rooftop A+ Rooftop B+
Rooftop C)
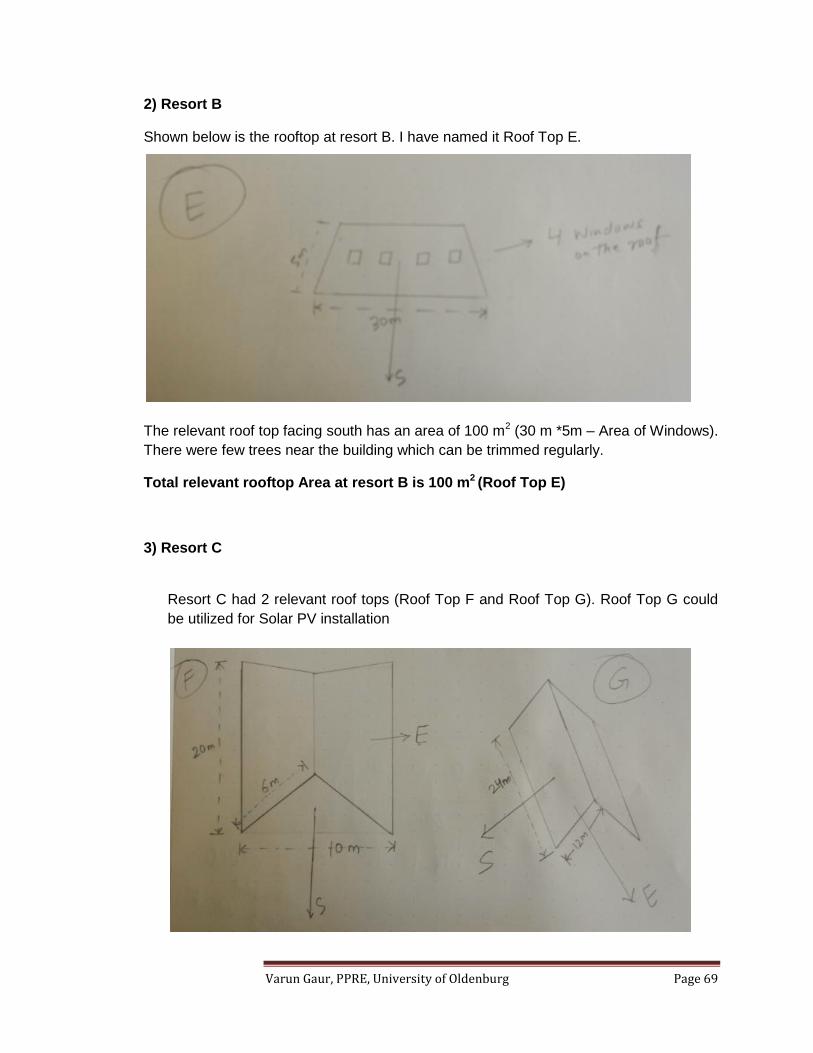
Varun Gaur, PPRE, University of Oldenburg Page 69
2) Resort B
Shown below is the rooftop at resort B. I have named it Roof Top E.
The relevant roof top facing south has an area of 100 m2 (30 m *5m – Area of Windows).
There were few trees near the building which can be trimmed regularly.
Total relevant rooftop Area at resort B is 100 m2 (Roof Top E)
3) Resort C
Resort C had 2 relevant roof tops (Roof Top F and Roof Top G). Roof Top G could
be utilized for Solar PV installation
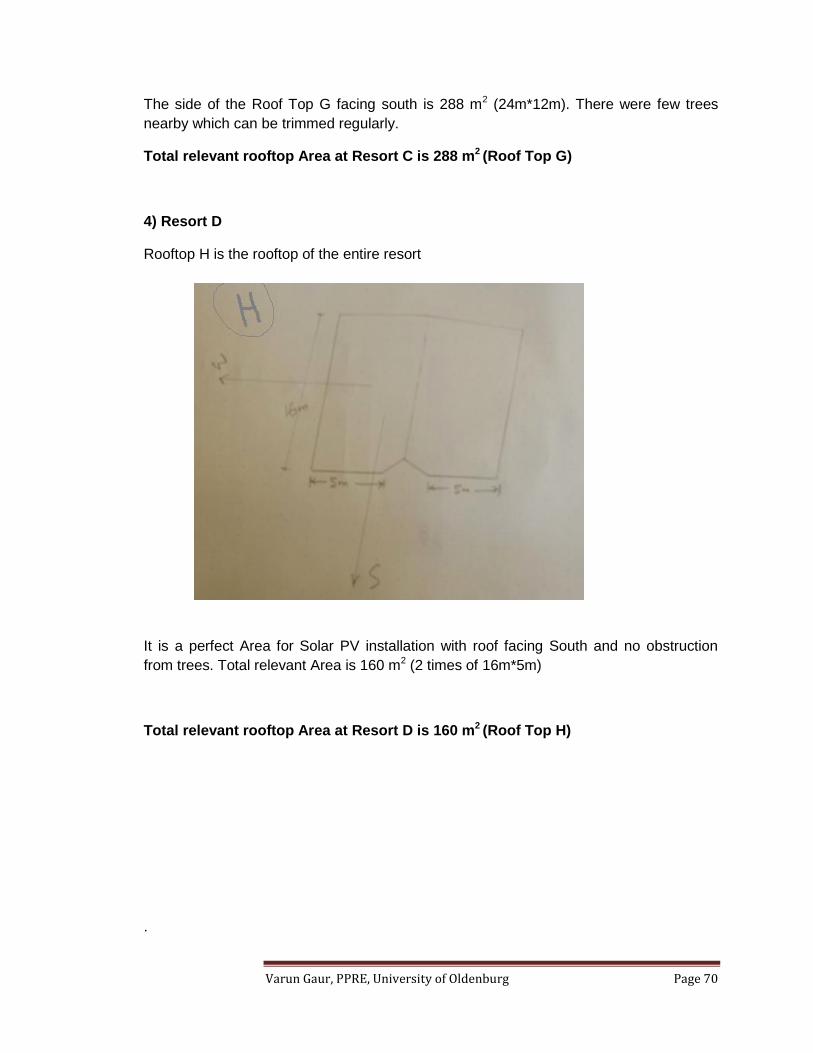
Varun Gaur, PPRE, University of Oldenburg Page 70
The side of the Roof Top G facing south is 288 m2 (24m*12m). There were few trees
nearby which can be trimmed regularly.
Total relevant rooftop Area at Resort C is 288 m2 (Roof Top G)
4) Resort D
Rooftop H is the rooftop of the entire resort
It is a perfect Area for Solar PV installation with roof facing South and no obstruction
from trees. Total relevant Area is 160 m2 (2 times of 16m*5m)
Total relevant rooftop Area at Resort D is 160 m2 (Roof Top H)
.

Varun Gaur, PPRE, University of Oldenburg Page 71
5) Resort E
Area of the South facing roof is 80 m2 and there are 2 such buildings, So Total relevant
Area of 160 m2
Total relevant rooftop Area at Resort E is 160 m2 (Roof Top I)
6) Resort F
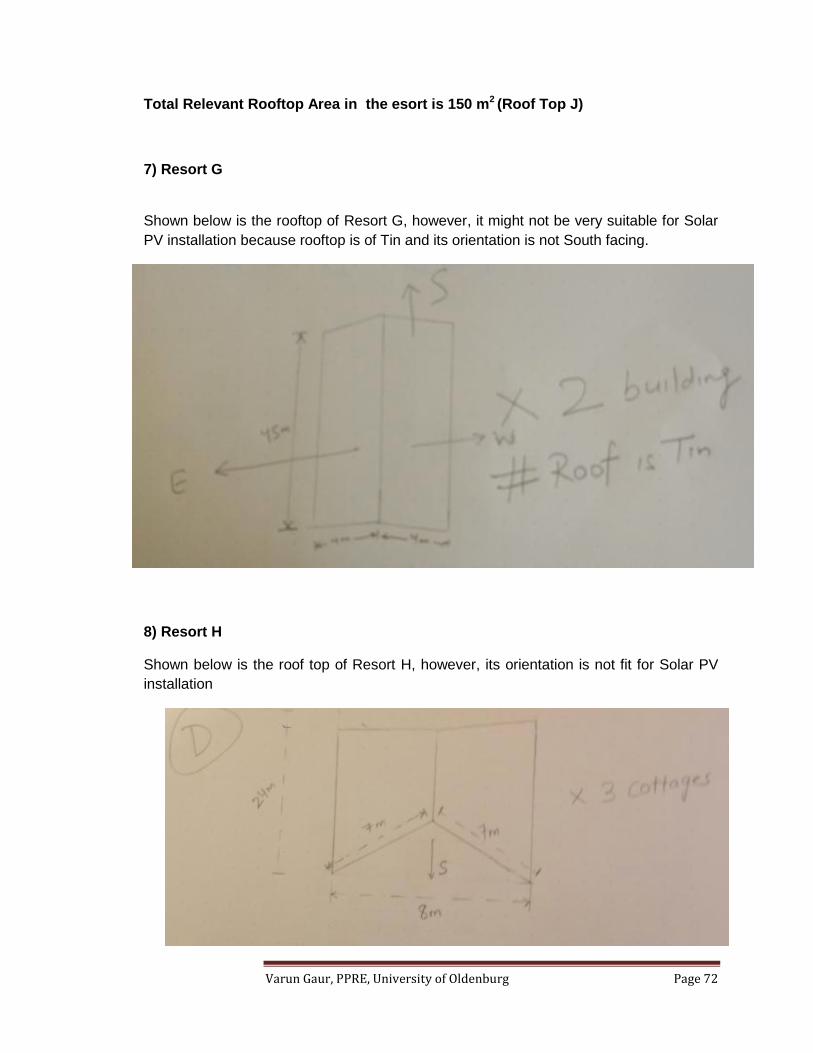
Varun Gaur, PPRE, University of Oldenburg Page 72
Total Relevant Rooftop Area in the esort is 150 m2 (Roof Top J)
7) Resort G
Shown below is the rooftop of Resort G, however, it might not be very suitable for Solar
PV installation because rooftop is of Tin and its orientation is not South facing.
8) Resort H
Shown below is the roof top of Resort H, however, its orientation is not fit for Solar PV
installation
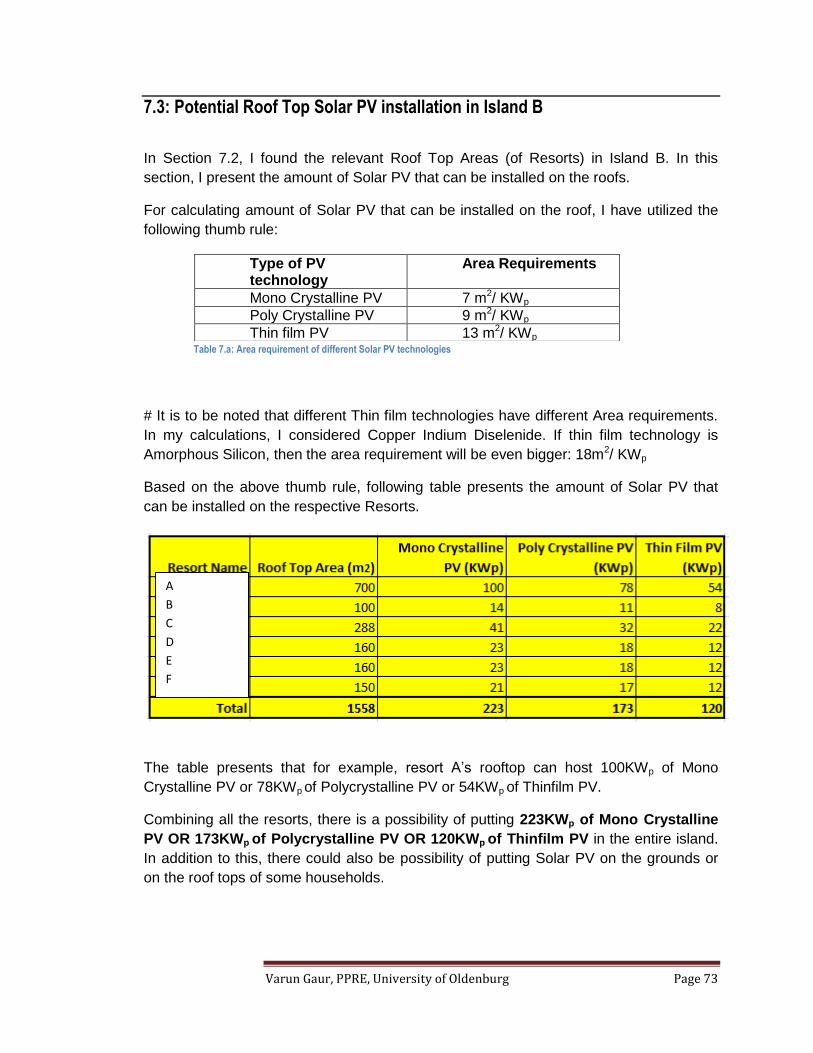
Varun Gaur, PPRE, University of Oldenburg Page 73
7.3: Potential Roof Top Solar PV installation in Island B
In Section 7.2, I found the relevant Roof Top Areas (of Resorts) in Island B. In this
section, I present the amount of Solar PV that can be installed on the roofs.
For calculating amount of Solar PV that can be installed on the roof, I have utilized the
following thumb rule:
# It is to be noted that different Thin film technologies have different Area requirements.
In my calculations, I considered Copper Indium Diselenide. If thin film technology is
Amorphous Silicon, then the area requirement will be even bigger: 18m2/ KWp
Based on the above thumb rule, following table presents the amount of Solar PV that
can be installed on the respective Resorts.
The table presents that for example, resort A’s rooftop can host 100KWp of Mono
Crystalline PV or 78KWp of Polycrystalline PV or 54KWp of Thinfilm PV.
Combining all the resorts, there is a possibility of putting 223KWp of Mono Crystalline
PV OR 173KWp of Polycrystalline PV OR 120KWp of Thinfilm PV in the entire island.
In addition to this, there could also be possibility of putting Solar PV on the grounds or
on the roof tops of some households.
Type of PV technology
Area Requirements
Mono Crystalline PV 7 m2/ KWp
Poly Crystalline PV 9 m2/ KWp
Thin film PV 13 m2/ KWp Table 7.a: Area requirement of different Solar PV technologies
A
B
C
D
E
F

Varun Gaur, PPRE, University of Oldenburg Page 74
Chapter 8: Conclusions
I would like to close my report with the following conclusions:
General:
There is a vast scope of solarizing existing Diesel Mini Grids/ establishing stand
alone Solar Mini Grids in Philippines [400 MW and above]
Government is pumping significant subsidies on Diesel Mini Grids and it is a
huge burden
The policies related to Off grid Renewable Energy are unclear in Philippines,
however, the same has a vast scope in the country
Specific to Island A:
In the existing scenario, where several small Diesel Gensets are serving to
several small clusters of households, people are paying a very high cost of
electricity (~2 Euros/ KWh); Also the cost of electricity generation is very high to
individual Genset owner (~1 Euro/ KWh)
I had then proposed a Solar-Diesel Hybrid Mini Grid where a Central Power
Converter (Master Inverter on the lines of SMA Sunny Island) plays the role of
Master with power inputs from Solar, Diesel and Battery BackUp. Following were the
main findings
In Scenario 1 [Existing load pattern of 76 KW between 6 pm to 10 pm], Levelized
electricity cost (LC) was observed to be lower at higher solar fraction /
penetration (SF). It was observed that LC decreases with increasing SF,
however, high cost of Master (Power Converter) makes lower SF expensive and
this resulted in a peak of LC at SF=30%. LC at SF =0% was observed to be
better then SF=30%, because Master is no more required and the cost is
omitted.
In Scenario 1, as the Discount rate increases from 6% to 13%, viability of higher
solar penetrations (SF) was observed to be decreasing. At higher discount rates
(>13%), SF=0% (Diesel only option) was found to be more viable.
In Scenario 2 (where the existing load is assumed to get increased at the same
night timings), it was observed that the Levelized cost of Electricity will come
down only slightly as compared to Scenario 1, however, the drop is not
significant. This is despite of the fact that investment cost will become almost
double in Scenario2.
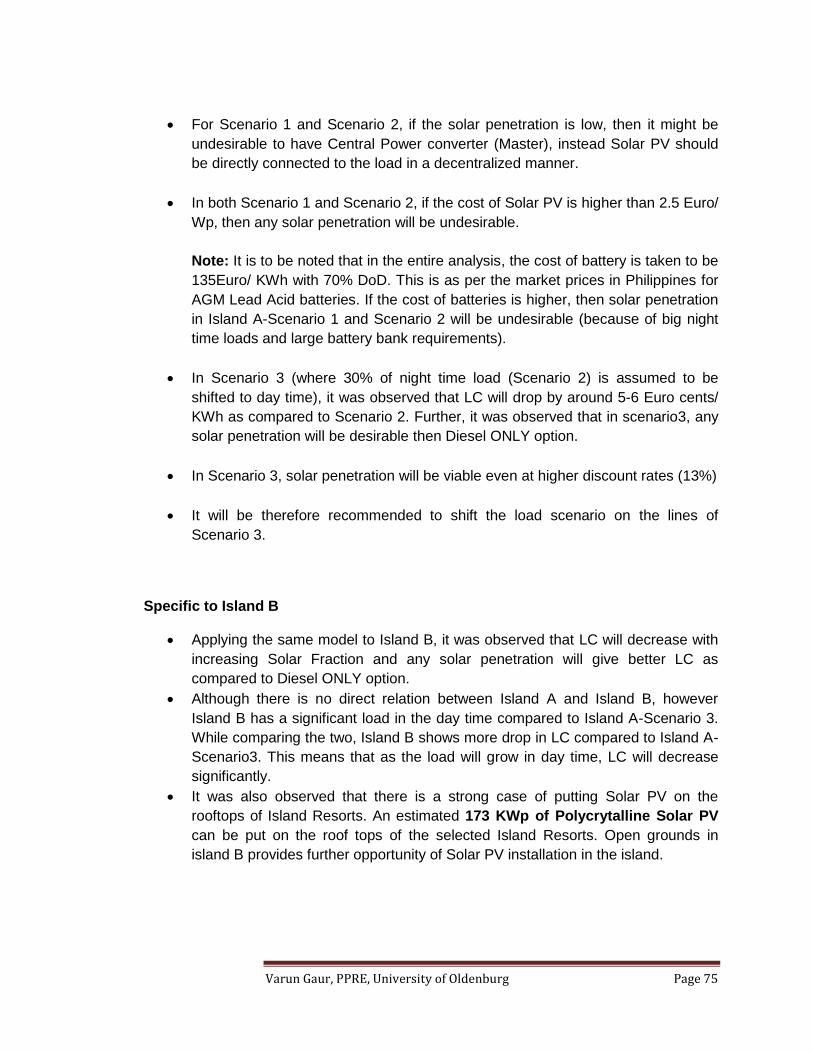
Varun Gaur, PPRE, University of Oldenburg Page 75
For Scenario 1 and Scenario 2, if the solar penetration is low, then it might be
undesirable to have Central Power converter (Master), instead Solar PV should
be directly connected to the load in a decentralized manner.
In both Scenario 1 and Scenario 2, if the cost of Solar PV is higher than 2.5 Euro/
Wp, then any solar penetration will be undesirable.
Note: It is to be noted that in the entire analysis, the cost of battery is taken to be
135Euro/ KWh with 70% DoD. This is as per the market prices in Philippines for
AGM Lead Acid batteries. If the cost of batteries is higher, then solar penetration
in Island A-Scenario 1 and Scenario 2 will be undesirable (because of big night
time loads and large battery bank requirements).
In Scenario 3 (where 30% of night time load (Scenario 2) is assumed to be
shifted to day time), it was observed that LC will drop by around 5-6 Euro cents/
KWh as compared to Scenario 2. Further, it was observed that in scenario3, any
solar penetration will be desirable then Diesel ONLY option.
In Scenario 3, solar penetration will be viable even at higher discount rates (13%)
It will be therefore recommended to shift the load scenario on the lines of
Scenario 3.
Specific to Island B
Applying the same model to Island B, it was observed that LC will decrease with
increasing Solar Fraction and any solar penetration will give better LC as
compared to Diesel ONLY option.
Although there is no direct relation between Island A and Island B, however
Island B has a significant load in the day time compared to Island A-Scenario 3.
While comparing the two, Island B shows more drop in LC compared to Island A-
Scenario3. This means that as the load will grow in day time, LC will decrease
significantly.
It was also observed that there is a strong case of putting Solar PV on the
rooftops of Island Resorts. An estimated 173 KWp of Polycrytalline Solar PV
can be put on the roof tops of the selected Island Resorts. Open grounds in
island B provides further opportunity of Solar PV installation in the island.
Varun Gaur, PPRE, University of Oldenburg Page 76
Specific to Island C
Visit to Island C, was utilized to understand the execution of Diesel Mini Grids by
NPC-SPUG and it also helped in developing Scenarios for Island A. No modeling
was done for Island C.
ANNEXURES
Annexure 1
There were 2 different forms used for household survey (one developed by me
and the other developed by PSPI)
Household Survey form (No 1)
Location: _______________________________________________________________
(Sitio) (Barangay) (Municipality) (Province)
I. SOCIO-ECONOMIC DATA
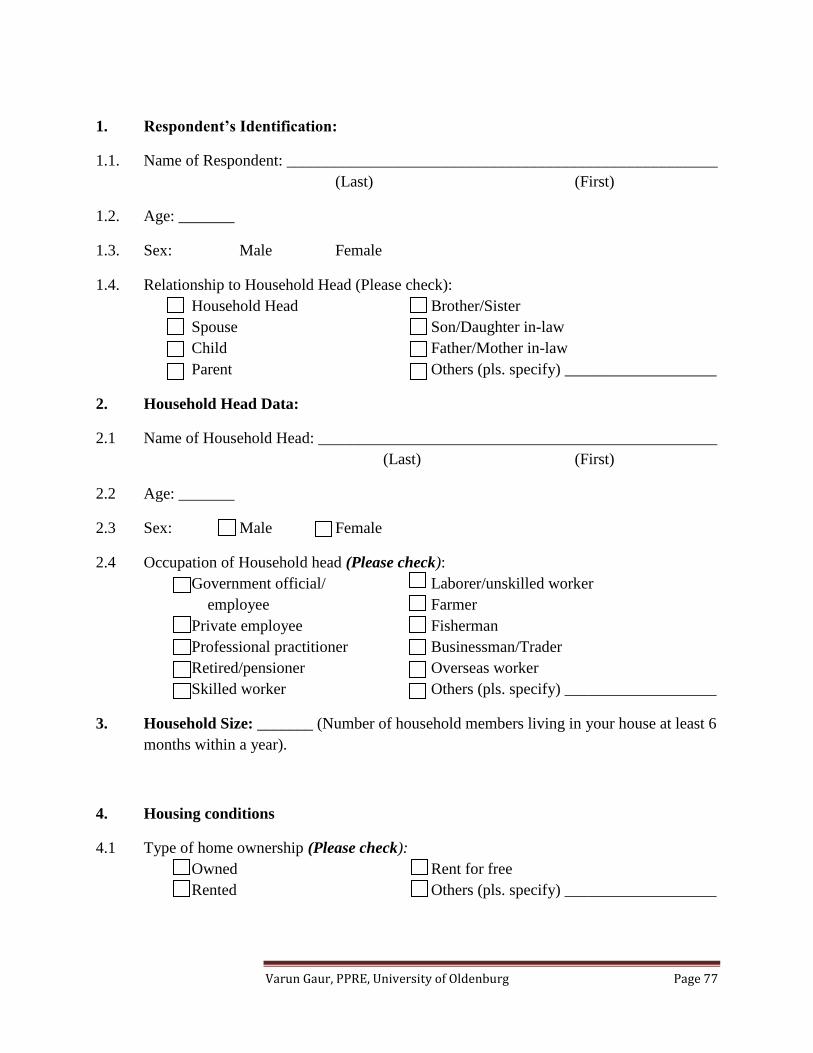
Varun Gaur, PPRE, University of Oldenburg Page 77
1. Respondent’s Identification:
1.1. Name of Respondent: ______________________________________________________
(Last) (First)
1.2. Age: _______
1.3. Sex: Male Female
1.4. Relationship to Household Head (Please check):
Household Head Brother/Sister
Spouse Son/Daughter in-law
Child Father/Mother in-law
Parent Others (pls. specify) ___________________
2. Household Head Data:
2.1 Name of Household Head: __________________________________________________
(Last) (First)
2.2 Age: _______
2.3 Sex: Male Female
2.4 Occupation of Household head (Please check):
Government official/ Laborer/unskilled worker
employee Farmer
Private employee Fisherman
Professional practitioner Businessman/Trader
Retired/pensioner Overseas worker
Skilled worker Others (pls. specify) ___________________
3. Household Size: _______ (Number of household members living in your house at least 6
months within a year).
4. Housing conditions
4.1 Type of home ownership (Please check):
Owned Rent for free
Rented Others (pls. specify) ___________________

Varun Gaur, PPRE, University of Oldenburg Page 78
4.2 Main type of housing materials (Please check):
Wood Bamboo/Sawali/Cogon
Concrete Others (pls. specify) ___________________
5. Income of the family (is the income regular)
6. Expenditure of the family
Expenditure on electricity
Expenditure on rest
II. ENERGY INFORMATION
1. Sources of Energy for Lighting and other uses
1.1 What are your sources of energy for lighting and operating home appliances? (Please
check, household can have more than one sources)
Kerosene
Drycell/Battery
Car battery (powered by some minigrid or Genset)
Personal Diesel Genset
Connection to Diesel Genset MiniGrid
Gas Light
Solar system
1.2 What are the uses of the sources of energy mentioned above? (Appliance Details)
Type of
Appliance
Wattage Time of
day used
Is it used daily
(D) at this time
or randomly
(R)
If (R ), then can
its usage be
shifted to day
time
Any major
variation in
the usage
pattern in
some
particular
time of year
(for example
during fish
migration)
Powered
by which
energy
source
(refer
1.1)
Light Bulb1
Light Bulb2
Light Bulb3
B&W TV
Colored TV
VHS Player
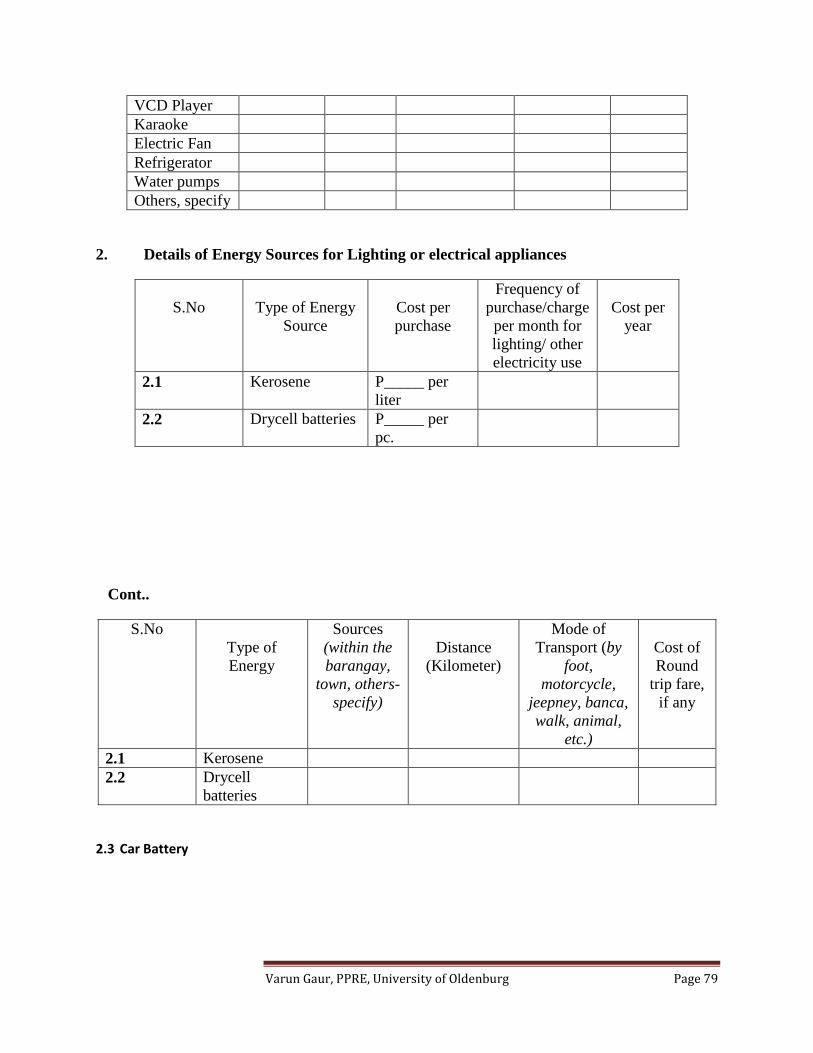
Varun Gaur, PPRE, University of Oldenburg Page 79
VCD Player
Karaoke
Electric Fan
Refrigerator
Water pumps
Others, specify
2. Details of Energy Sources for Lighting or electrical appliances
S.No
Type of Energy
Source
Cost per
purchase
Frequency of
purchase/charge
per month for
lighting/ other
electricity use
Cost per
year
2.1 Kerosene P_____ per
liter
2.2 Drycell batteries P_____ per
pc.
Cont..
S.No
Type of
Energy
Sources
(within the
barangay,
town, others-
specify)
Distance
(Kilometer)
Mode of
Transport (by
foot,
motorcycle,
jeepney, banca,
walk, animal,
etc.)
Cost of
Round
trip fare,
if any
2.1 Kerosene
2.2 Drycell
batteries
2.3 Car Battery

Varun Gaur, PPRE, University of Oldenburg Page 80
2.3.1 What is the capacity of the battery (villagers might know this with the number of
plates in the battery and it is possible that I might not get this answer or we can see by
our own)
2.3.2 Price of the battery _______________
2.3.3 Where it is charged ______________
2.3.4 How frequently battery is charged ___________________
2.3.5 Money spent on charging each time ___________________
2.4 Personal Diesel Genset
2.4.1 What is the capacity of Diesel Genset
2.4.2 What is the initial cost
2.4.3 What is the operational cost (cost of Diesel)
2.4.4 Any problems
2.5 Diesel Generator Set based Mini Grid
2.5.1 Who owns the generator set? (Please check)
Private Barangay Others, specify
______________________
2.5.2 Total number of households connected to the same Genset? _____________ households
2.5.3 How is your household charged? (Please check)
Monthly fixed rate, go to 2.5.4
Based on number of lights/bulbs or appliances, go to 2.5.6
2.5.4 How much is the monthly rate? P _____________
2.5.6 How much is the charge per light/bulb (Indicate the cost opposite each bulb)
10 Watts P __________ 40 Watts P __________
20 Watts P __________ Others, specify _________ P __________
2.5.7 How much is the charge per appliance? (Indicate the cost opposite each appliance)
B&W TV P __________ VCD P __________
Karaoke P __________ VHS P __________
Others, specify ____________________ P __________
2.5.8 How long have you been connected to mini grid
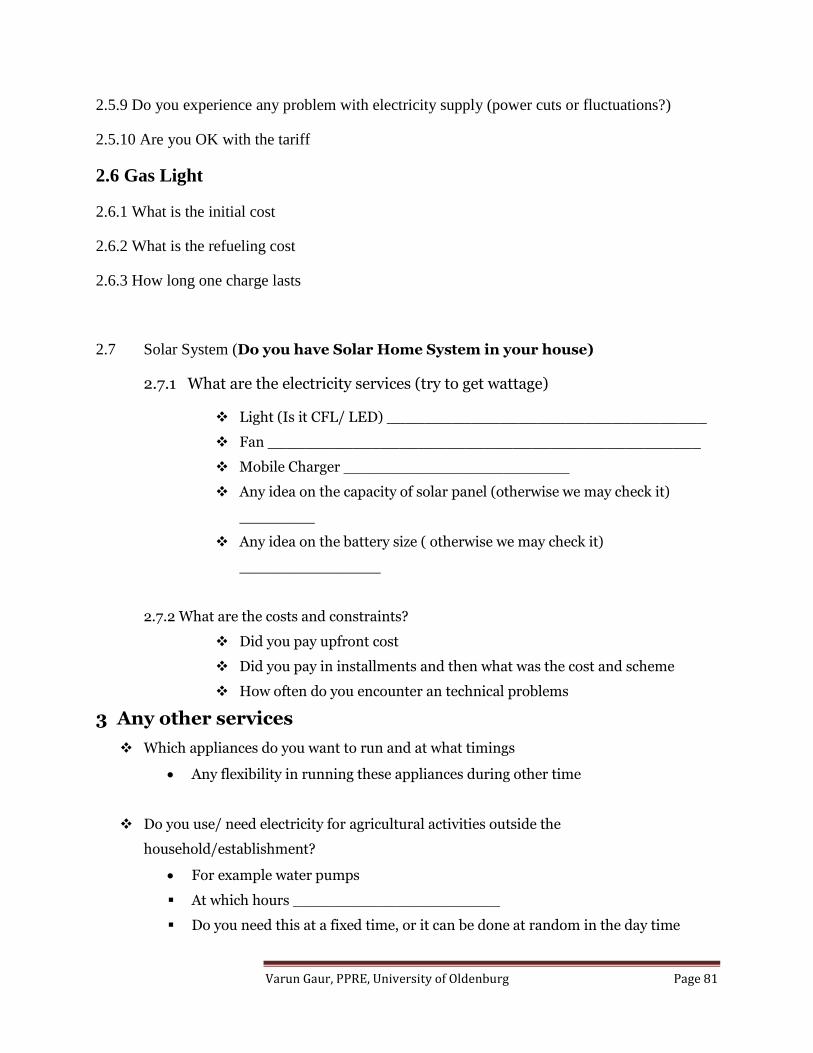
Varun Gaur, PPRE, University of Oldenburg Page 81
2.5.9 Do you experience any problem with electricity supply (power cuts or fluctuations?)
2.5.10 Are you OK with the tariff
2.6 Gas Light
2.6.1 What is the initial cost
2.6.2 What is the refueling cost
2.6.3 How long one charge lasts
2.7 Solar System (Do you have Solar Home System in your house)
2.7.1 What are the electricity services (try to get wattage)
Light (Is it CFL/ LED) __________________________________
Fan ______________________________________________
Mobile Charger ________________________
Any idea on the capacity of solar panel (otherwise we may check it)
________
Any idea on the battery size ( otherwise we may check it)
_______________
2.7.2 What are the costs and constraints?
Did you pay upfront cost
Did you pay in installments and then what was the cost and scheme
How often do you encounter an technical problems
3 Any other services
Which appliances do you want to run and at what timings
Any flexibility in running these appliances during other time
Do you use/ need electricity for agricultural activities outside the
household/establishment?
For example water pumps
At which hours ______________________
Do you need this at a fixed time, or it can be done at random in the day time
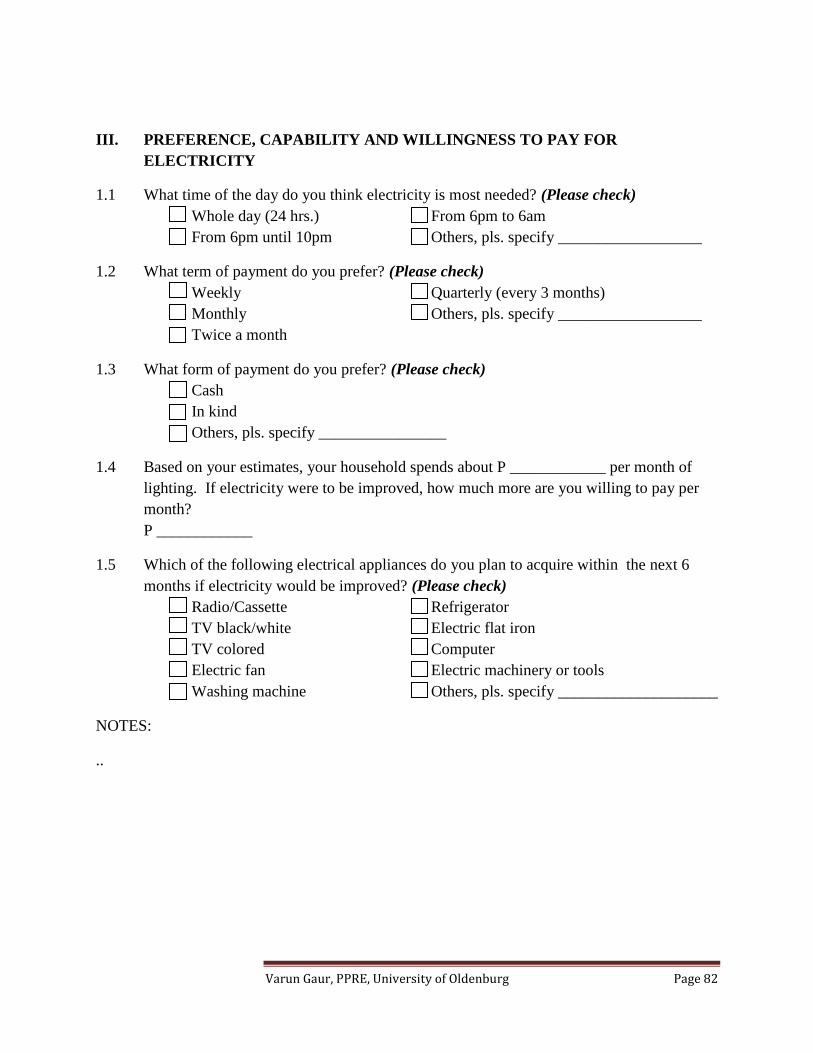
Varun Gaur, PPRE, University of Oldenburg Page 82
III. PREFERENCE, CAPABILITY AND WILLINGNESS TO PAY FOR
ELECTRICITY
1.1 What time of the day do you think electricity is most needed? (Please check)
Whole day (24 hrs.) From 6pm to 6am
From 6pm until 10pm Others, pls. specify __________________
1.2 What term of payment do you prefer? (Please check)
Weekly Quarterly (every 3 months)
Monthly Others, pls. specify __________________
Twice a month
1.3 What form of payment do you prefer? (Please check)
Cash
In kind
Others, pls. specify ________________
1.4 Based on your estimates, your household spends about P ____________ per month of
lighting. If electricity were to be improved, how much more are you willing to pay per
month?
P ____________
1.5 Which of the following electrical appliances do you plan to acquire within the next 6
months if electricity would be improved? (Please check)
Radio/Cassette Refrigerator
TV black/white Electric flat iron
TV colored Computer
Electric fan Electric machinery or tools
Washing machine Others, pls. specify ____________________
NOTES:
..
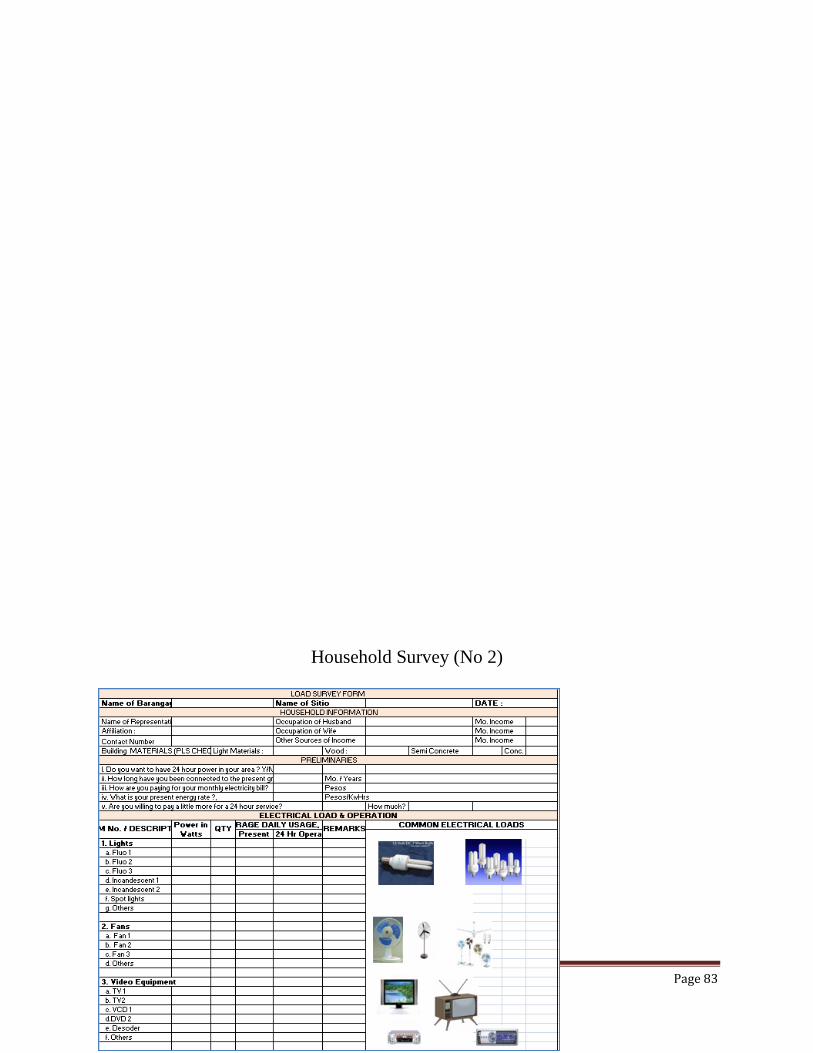
Varun Gaur, PPRE, University of Oldenburg Page 83
Household Survey (No 2)
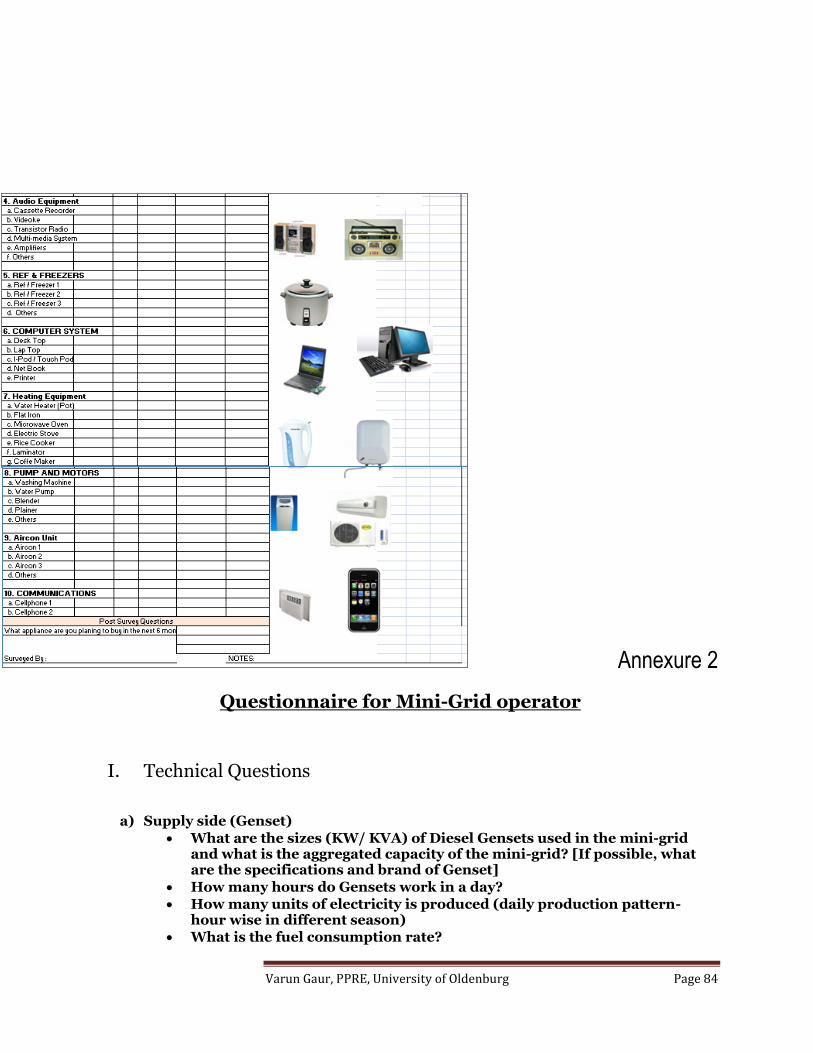
Varun Gaur, PPRE, University of Oldenburg Page 84
Annexure 2
Questionnaire for Mini-Grid operator
I. Technical Questions
a) Supply side (Genset)
What are the sizes (KW/ KVA) of Diesel Gensets used in the mini-grid and what is the aggregated capacity of the mini-grid? [If possible, what are the specifications and brand of Genset]
How many hours do Gensets work in a day? How many units of electricity is produced (daily production pattern-
hour wise in different season) What is the fuel consumption rate?
Varun Gaur, PPRE, University of Oldenburg Page 85
What are the constraints on the operation of Diesel Genset (What are the typical failures of the Diesel Gensets?)
How many times operation and maintenance is required?
b) Demand side (Consumers and Loads) How many consumers does the mini-grid has? What are the typical
electricity loads (Wattage requirements) of the consumers? What are the types of main loads (residential- lights, fans, motors etc)? If possible, we would like to know the pattern of load- for example load X
in all households runs during theses Y hours
Any forecast for future developments in load?
c) Distribution network
What is the typical length of distribution network? What are the specifications of wires? [ mini-grid operator can atleast give some idea]
What is the operating voltage and frequency of the system and what are their typical deviations?
How is electricity metering done? Any idea on distribution losses
II. Financial Questions
d) Supply side (Genset) What is the cost of Diesel Genset?
What is the cost of Diesel (including and not including transportation)? What is the cost of routinely maintenance? What is the cost of electricity production (cost per unit of electricity
production)? What is the availability of free space for Solar PV for the operator?
Any idea on Solar potential in that area (operator might not have this information, but he/ she can give a general idea ofthe local climate)
e) Demand side (consumers) How does the operator charge consumers for electricity (Is there fee for
service model or fixed charges)?
Is there a separate price for no commercial on the island) loads operating at different time of the day?
Any problems in collecting fees from consumers? What is the percentage of people not paying the bill and what does operator do in that situation?
Any problem of electricity thefts in the grid and what does operator do in that situation?
Any financial support from the government? What is the framework ofthat support?
What are the competitions tothe Diesel mini-grid? If there are competitors, what do they offer and how do they operate?
III. General Questions
Varun Gaur, PPRE, University of Oldenburg Page 86
a) How is Diesel transported to the village and what is the typical distance from refuelling station?
b) What are the commercial activities in the village c) Do you see any possibility of charging different rates residential and
commercial loads or loads operating at different time of the day d) Any plan of the operator to extend the mini-grid/ any forecast for increase in
the consumer load
Survey Form for the battery charging station operator
I. What are the typical battery capacities in the village II. What is the price for charging
III. What are the costs of new batteries IV. How often a customer brings the battery for charging V. How long does the battery lasts
VI. What are the problems with Diesel supply for Genset VII. What is the capacity and cost of Diesel Genset
VIII. What is the cost of Diesel fuel
Annexure 3 Result of Household Survey (Electric Load)

Varun Gaur, PPRE, University of Oldenburg Page 87
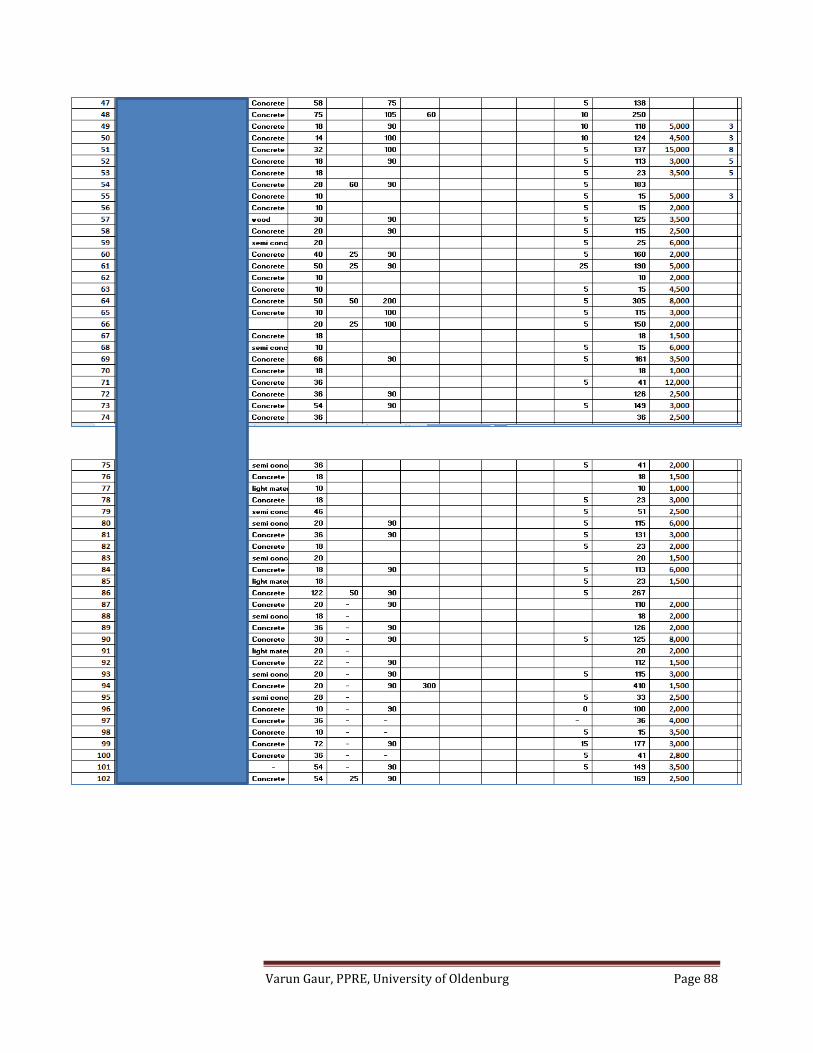
Varun Gaur, PPRE, University of Oldenburg Page 88

Varun Gaur, PPRE, University of Oldenburg Page 89
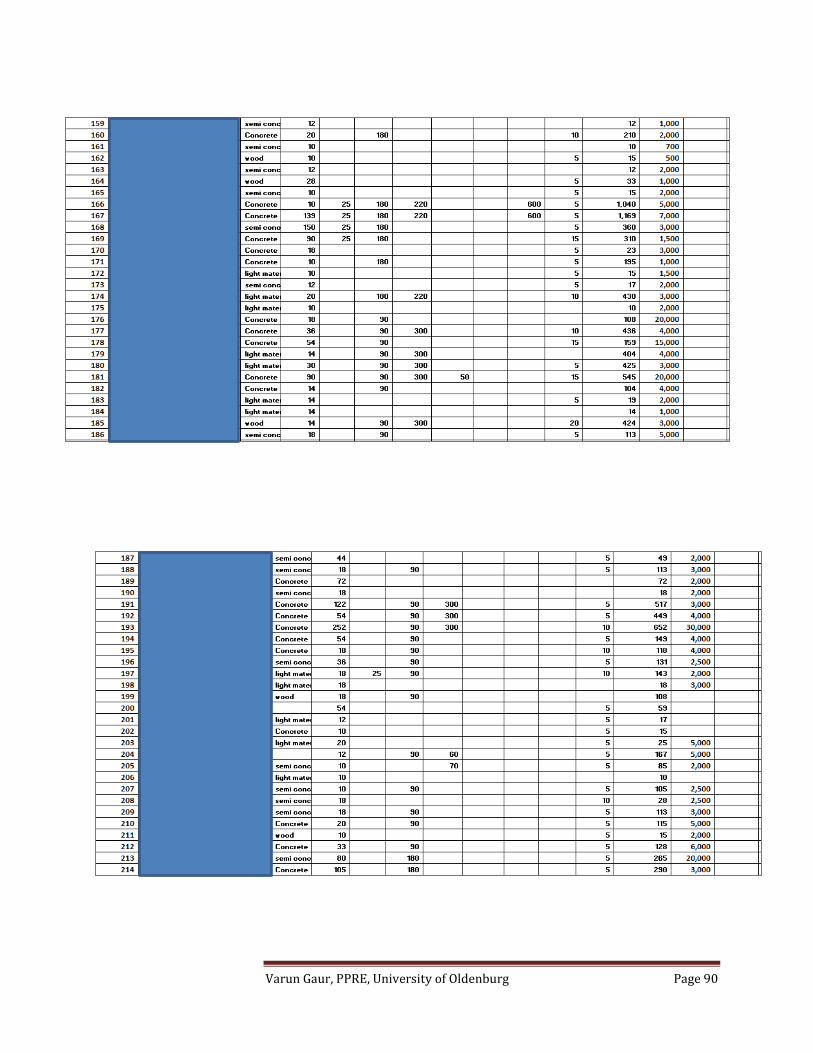
Varun Gaur, PPRE, University of Oldenburg Page 90

Varun Gaur, PPRE, University of Oldenburg Page 91
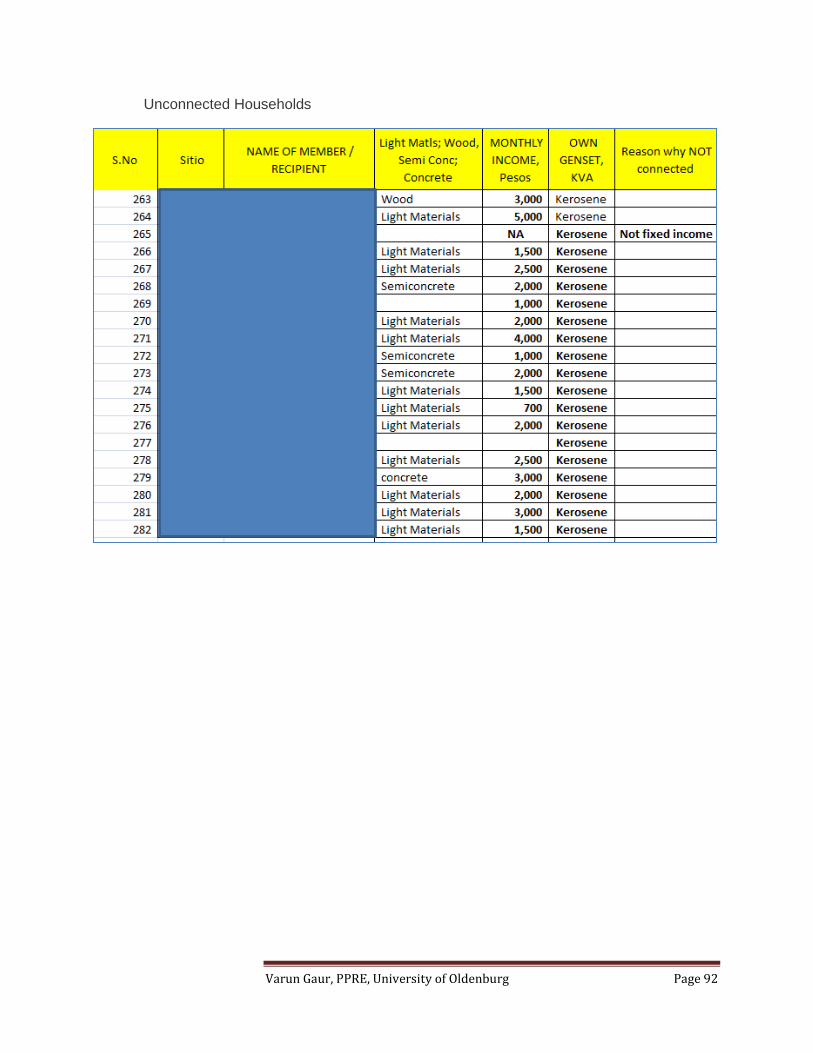
Varun Gaur, PPRE, University of Oldenburg Page 92
Unconnected Households
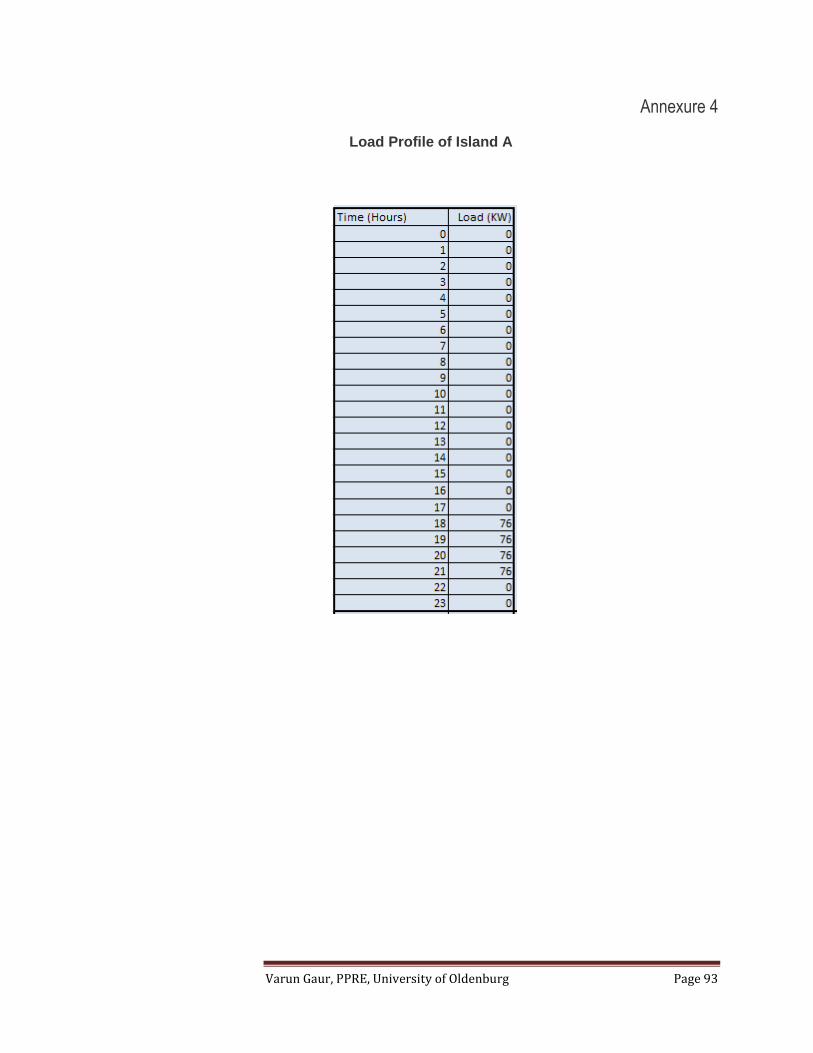
Varun Gaur, PPRE, University of Oldenburg Page 93
Annexure 4
Load Profile of Island A

Varun Gaur, PPRE, University of Oldenburg Page 94
Annexure 5
Load Profile of Island B (Typical Day)
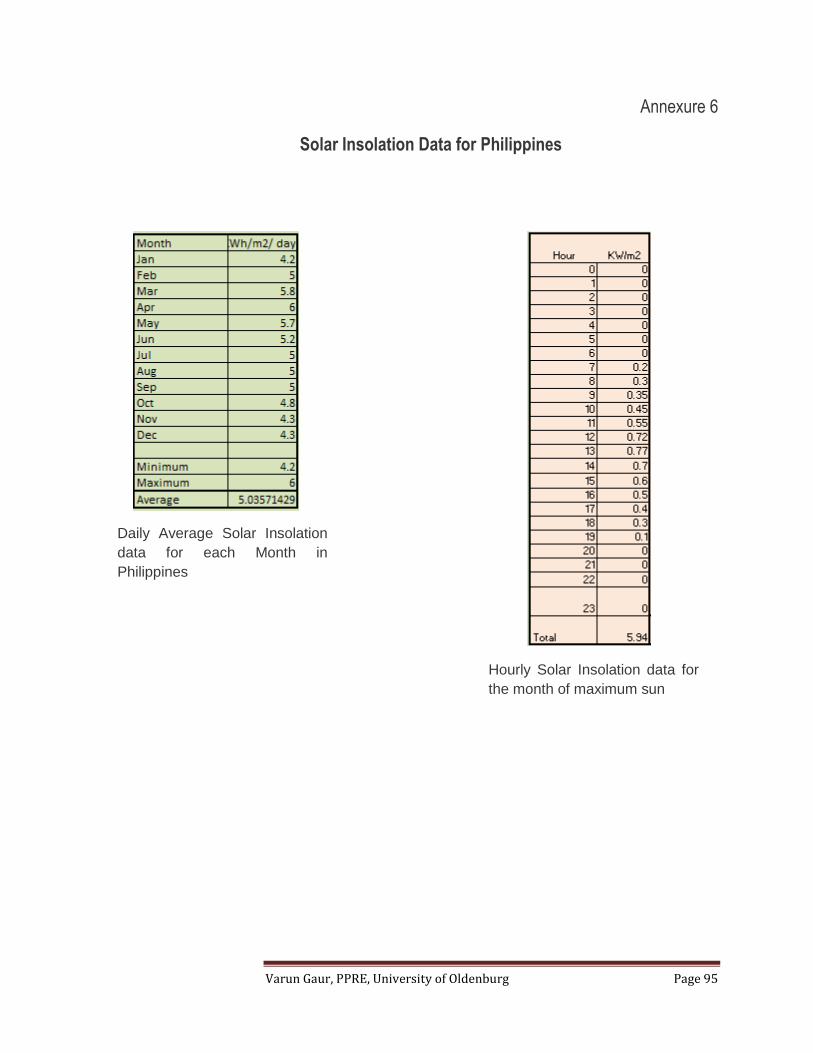
Varun Gaur, PPRE, University of Oldenburg Page 95
Annexure 6
Solar Insolation Data for Philippines
Daily Average Solar Insolation
data for each Month in
Philippines
Hourly Solar Insolation data for
the month of maximum sun
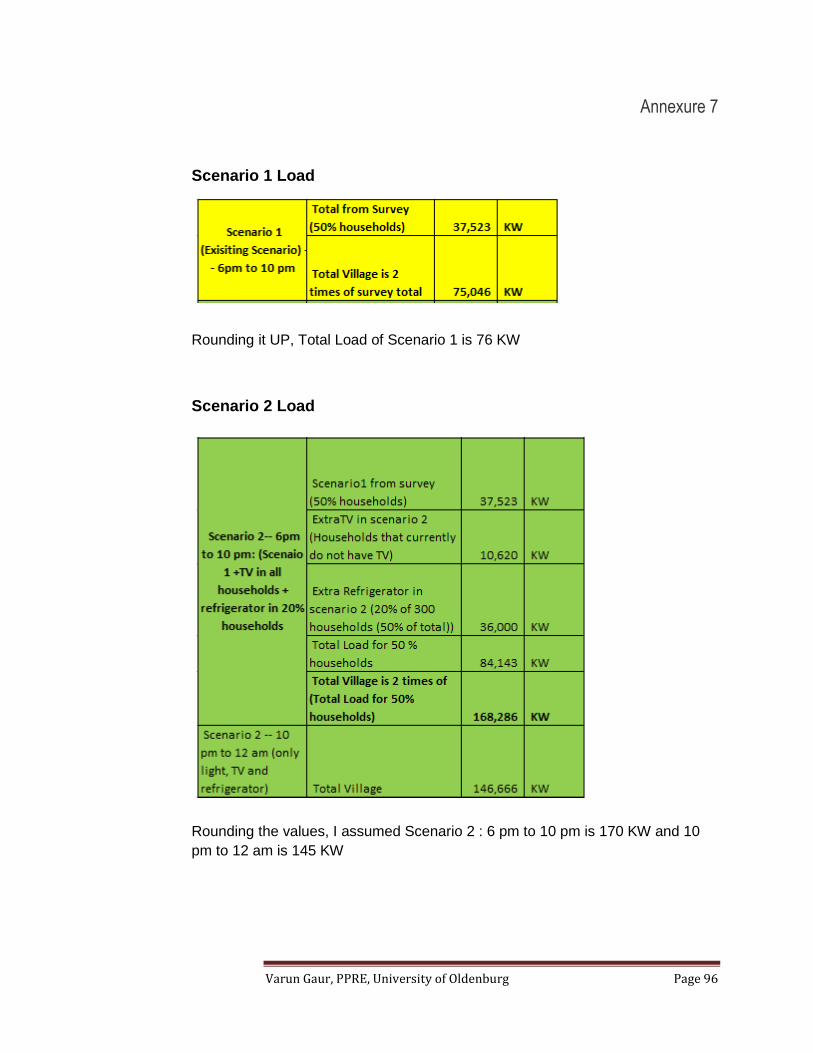
Varun Gaur, PPRE, University of Oldenburg Page 96
Annexure 7
Scenario 1 Load
Rounding it UP, Total Load of Scenario 1 is 76 KW
Scenario 2 Load
Rounding the values, I assumed Scenario 2 : 6 pm to 10 pm is 170 KW and 10
pm to 12 am is 145 KW
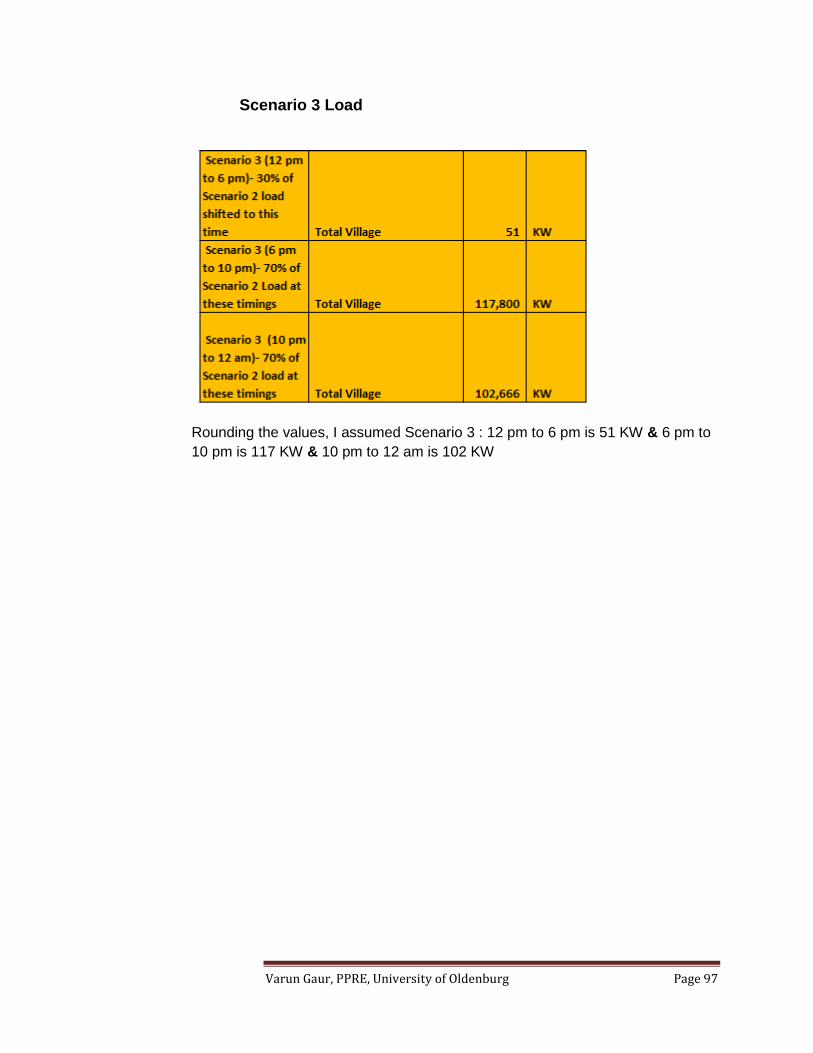
Varun Gaur, PPRE, University of Oldenburg Page 97
Scenario 3 Load
Rounding the values, I assumed Scenario 3 : 12 pm to 6 pm is 51 KW & 6 pm to
10 pm is 117 KW & 10 pm to 12 am is 102 KW
Varun Gaur, PPRE, University of Oldenburg Page 98
REFERENCES
For executing my Master thesis, I utilized information from the following references:
1) International Energy Agency, 2012 (www.iea.org)
2) Hybrid Mini grids for rural Electrification , Alliance for Rural Electrification, 2010
(www.ruralelec.org)
3) Missionary Electrification Development Plan, 2012, Department of Energy
Philippines
4) Geographic, Technological and Economic Analysis of isolated Diesel grids by
Paul Bertheau, year 2012
5) University of Philippines, 2010
6) Diesel Service and Supply Inc, USA (www.dieselserviceandsupply.com)
7) Analysis of Renewable Energy Retrofit Options to Existing Diesel Mini grids ,
Asia Pacific Economic Cooperations
8) Hybrid System by Center for Engineering Research, Saudi Arabia
9) Best Energy Practices for remote facilities, Artic Energy Alliance
10) Access Project, UNDP
11) ESMAP Project, World Bank
12) Report of Department of Energy, Philippines
13) US- EIA
14) Reports from NPC-SPUG
15) Homer
16) Training at SMA Solar Academi
17) Interviews with officials of Power Source Philippines Inc
18) Interviews with GIZ officials
19) Interviews with Department of Energy Officials
20) Interview with Mr Jiwan Acharya, Asian Development Bank
21) Wikipedia
22) World Atlas
23) Barangay Council of Island A
24) Barangay Council of Island C
25) Mr Freddy, Owner of resort A