software open access surfing the genomics wave: an r
TRANSCRIPT
Ryan et al. Genome Medicine 2014, 6:79http://genomemedicine.com/content/6/10/79
SOFTWARE Open Access
SuRFing the genomics wave: an R package forprioritising SNPs by functionalityNiamh M Ryan1, Stewart W Morris1, David J Porteous1,2, Martin S Taylor3† and Kathryn L Evans1,2*†
Abstract
Identifying functional non-coding variants is one of the greatest unmet challenges in genetics. To help addressthis, we introduce an R package, SuRFR, which integrates functional annotation and prior biological knowledge toprioritise candidate functional variants. SuRFR is publicly available, modular, flexible, fast, and simple to use. Wedemonstrate that SuRFR performs with high sensitivity and specificity and provide a widely applicable and scalablebenchmarking dataset for model training and validation.Website: http://www.cgem.ed.ac.uk/resources/
BackgroundLinkage analyses and genome-wide association studies(GWASs) routinely identify genomic regions and variantsassociated with complex diseases [1]. Over 90% of disease-associated variants from GWASs fall within non-codingregions [2], underlining the importance of the regulatorygenome in complex diseases. However, while there are anumber of programs that identify putatively pathologicalcoding variants, pinpointing the potential causal variantswithin non-coding regions is a major bottleneck, as thegenomic signals that characterise functional regulatoryvariants are not fully defined and our understanding ofregulatory architecture is incomplete [3].Currently a number of large scale projects are under-
way with the aim of genome-wide, systematic identifica-tion of functional elements, through a combination ofbiochemical assays followed by highly parallel sequencing[4]. This wealth of studies generating such data are typifiedby the Encyclopaedia of DNA Elements (ENCODE) pro-ject [5], Functional Annotation of the Mammalian Gen-ome (FANTOM5) project [6], 1000 Genomes project [7]and the Epigenome Roadmap [8]. These endeavours pro-vide genome annotation datasets for a range of genomemarks, including histone acetylation and methylation [5],
* Correspondence: [email protected]†Equal contributors1Centre for Genomic and Experimental Medicine, Institute of Genetics andMolecular Medicine, The University of Edinburgh, Western General Hospital,Crewe Road, Edinburgh EH4 2XU, UK2Centre for Cognitive Ageing and Cognitive Epidemiology, The University ofEdinburgh, 7 George Square, Edinburgh EH8 9JZ, UKFull list of author information is available at the end of the article
© 2014 Ryan et al.; licensee BioMed Central LtCommons Attribution License (http://creativecreproduction in any medium, provided the orDedication waiver (http://creativecommons.orunless otherwise stated.
chromatin states [9], DNase hypersensitive sites (DNaseHSs) [10,11], DNase footprints [12,13], transcriptionfactor binding sites (TFBSs) [14,15], conserved sequences[16], enhancers [17] and polymorphisms [7]. These re-sources, which have been made publicly available via gen-ome web browsers such as the UCSC Genome Browser[18] and the Ensembl Genome Browser [19], provide arich dataset for functional predictions. Manual interroga-tion of genome browsers for a range of functional annota-tions simultaneously does not, however, scale well forlarge studies, lacks reproducibility, is unsystematic and isdifficult to benchmark.There is a need for a system that combines these an-
notation datasets, along with other genomic functionalmeasures, to prioritise candidate variants for follow-upanalyses. To address this need, we have developed theSuRFR tool (SNP Ranking by Function R package). SuRFRhas the following advantages: simplicity; speed; modular-ity; flexibility; transparency (the output indicates whichfeatures have contributed to rankings); and ease of integra-tion with other R packages.In addition, we also introduce novel training and valid-
ation datasets that i) capture the regional heterogeneityof genomic annotation better than previously applied ap-proaches, and ii) facilitate understanding of which anno-tations are most important for discriminating differentclasses of functionally relevant variants from backgroundvariants.We show that SuRFR successfully prioritises known
regulatory variants over background variants. Additionaltests on novel data confirm the generalisability of the
d. This is an Open Access article distributed under the terms of the Creativeommons.org/licenses/by/4.0), which permits unrestricted use, distribution, andiginal work is properly credited. The Creative Commons Public Domaing/publicdomain/zero/1.0/) applies to the data made available in this article,
Ryan et al. Genome Medicine 2014, 6:79 Page 2 of 13http://genomemedicine.com/content/6/10/79
method. Moreover, we demonstrate that SuRFR either out-performs or performs at least as well as three recently in-troduced, approximately comparable, approaches [20-22]in the prioritisation of known disease variants from severalindependent datasets.
ImplementationOverview of SuRFRSuRFR is based on the conceptually simple construct ofa rank-of-ranks. Each variant is scored for its overlapwith multiple types of annotation. For each annotationcategory, each variant is ranked from least likely to indi-cate function through to most likely. The ranks frommultiple distinct annotation categories are averagedusing a weighting model to produce a final, combined,weighted rank (R) of variant candidacy for the traitunder consideration (Equation 1):
R ¼ rankiX
rij:wj� ���
where rij is the rank of the ith variant in the jth annota-tion category, and Wj is the weight for the jth annotationcategory.Central to this approach is a weighting model that
apportions the relative importance of each annotationtype (a vector of multipliers, one for each annotationdata source). The training and validation of weightingmodels is described in subsequent sections. SuRFR isdistributed with three pre-trained weighting modelsthat utilise publicly available data for variant annota-tion. The three pre-trained models are: a general modelbroadly applicable to any analysis (ALL); a model de-signed specifically for prioritising (rare) disease variants(DM); and a model for complex disease variants (DFP).Users are also free to specify their own weighting models.Some parameter types are additionally tunable within apre-defined weighting model (for example, minor allelefrequency (MAF)).Training and validation of the weighting models were
based on ten-fold cross-validation using a novel andbroadly applicable data spiking strategy described inlater sections.SuRFR is implemented as an R package and is publicly
available [23]. The input requirement is a tab-delimitedtext or bed file composed of chromosome number andstart and end coordinates for each SNP (GRCh37/hg19assembly); SuRFR builds a functional table based onthese data. The SuRFR package can interact with a sisterannotation package, 'SNP Annotation Information ListR package' (SAILR). SAILR provides precompiled anno-tation tables for all variants from the 1000 Genomesproject [7] for each of the four main populations (AFR,AMR, ASN, and EUR) from which users can extract asubset of SNPs of interest.
Annotation sourcesSuRFR incorporates information relating to a range ofgenomic and epigenomic annotation parameters knownto correlate with regulatory elements and non-codingdisease variants. Annotation data classes and sources aresummarized in Additional file 1 and detailed below.
Minor allele frequencyMAFs were obtained from the 1000 Genomes EURpopulation for the cross-validation and model selection.The variants with the lowest MAF (rarest) were rankedhighest. The optimal allele frequency range can, how-ever, be tuned to suit any analysis.
ConservationGenomic evolutionary rate profiling (GERP) estimatesposition-specific evolutionary rates and identifiescandidate-constrained elements [24]. Constraint ismeasured in terms of rejection substitution (RS) scores,which are based on a comparison of the number of ob-served versus expected substitutions at each nucleotideposition. SNP sites were ranked on the basis of their RSscore. To prevent distortion of the rankings by positive se-lection and other confounding factors, we set all negativeRS scores to zero prior to ranking.
DNase hypersensitivitySNPs were ranked on normalised peak scores (maximumsignal strength across any cell line) from genome-wideDNase HS data assayed in 125 cell types (wgEncodeR-egDnaseClusteredV2) [25,26].
DNase footprintsThis dataset comprised deep sequencing DNase foot-printing data from the ENCODE project [27]. SNPs wereranked by the number of cell lines where DNase foot-prints were observed.
Chromatin statesWe used chromatin states predicted by the combinatorialpatterns of chromatin marks from the mapping of ninechromatin marks across nine cell lines [17]. Multivariablelogistic regression on the full training/validation set wasused to assess the relationship between chromatin statesand variant type (regulatory or background variant)across the nine cell lines using the R function glm.Chromatin states were ranked from most to least in-formative; on the basis of β coefficients across the ninecell lines (Additional files 2 and 3). The highest rankingstate from the nine cell lines was chosen to representthe chromatin state of each SNP.
Ryan et al. Genome Medicine 2014, 6:79 Page 3 of 13http://genomemedicine.com/content/6/10/79
PositionRanking was determined by SNP position relative to genefeatures (exon, intron, splice site, promoter (defined as be-ing within 1 kb of a transcription start site (TSS)), 10 kbupstream or downstream of a gene, intragenic, CpGislands, CpG shores). The ranking of the categories(Additional file 4) is based on enrichment data presentedby Schork et al. [28] and Hindorff et al. [29]. UCSC geneannotation data ('Known Gene' gene predictions fromsources such as RefSeq and GenBank) and the FANTOM5CAGE data [16] were used to define TSSs.
Transcribed enhancersEach SNP was assessed for overlap with CAGE-definedtranscribed enhancers from the FANTOM5 project [30].
Transcription factor binding sitesTFBSs were identified from data based on ChiP-seq ex-periments for 161 transcription factors across 91 celltypes and predicted transcription factor binding motifsfrom the ENCODE Factorbook repository (wgEncodeR-egTfbsClusteredV3) [15,31]. The highest peak signal forany transcription factor across all cell lines was used torank SNPs.
Annotation weightingsThe SNP rankings for each of the annotation parameterswere combined into a final rank-of-ranks by assigningweights to each parameter, thus adjusting their relativecontribution to the final ranking of the SNPs. Differentcombinations of parameter weightings were assessedusing cross-validation and a benchmarking dataset com-prising non-coding disease and regulatory variants, andbackground genomic variants of unknown function (1000Genomes variants located within the ENCODE pilotproject regions).
Construction of test datasetsFor the purposes of model training and validation weconstructed benchmark datasets (defined as being rele-vant, scalable, simple, accessible, independent and re-usable [32]) by combining known functional variantswith background datasets of variants. Several sources ofboth functional and background variants were used.
Non-coding variants with phenotypic impacts from theHuman Gene Mutation DatabaseNon-protein-coding variants with reported phenotypicimpacts were obtained from the Human Gene MutationDatabase (HGMD Professional version, release December2013), using the mutation table PROM, which containssubstitutions that cause regulatory abnormalities [33].Only variants of the subclasses ‘Disease causing mutation’(DM), ‘Disease-associated polymorphism with additional
supporting functional evidence’ (DFP) and ‘In vitro/laboratory or in vivo functional polymorphism’ (FP) wereincluded.The known variants were subdivided into three data-
sets by HGMD class: ALL (the full dataset of 1,827 vari-ants with known disease effect or regulatory function);DM (644 variants of known disease causing mutations)only; and DFP (686 disease associated variants withfunctional evidence) only.
ENCODE background variantsTo assess SuRFR’s ability to distinguish functional variantsfrom non-functional, a control set of non-functional vari-ants was required. However, training sets consisting of ex-perimentally confirmed non-functional variants are stillhard to come by and are limited in size. The ENCODEpilot project provides information on 44 regions acrossthe genome that were selected around medically import-ant genes and from regions with a cross-section of genedensities and non-exonic conservation scores [34]. Back-ground variants were obtained by randomly sampling170,892 SNPs located within the ENCODE pilot regionsfrom the 1000 Genomes project EUR population [7].
Additional test datasetsFor independent validation of SuRFR, we constructedannotation feature datasets for variant sets from a var-iety of sources. All of these contained variants with ex-perimentally verified phenotypic impacts. Some of thesedatasets also contain background variants. All of thesedatasets were filtered to remove variants containedwithin the HGMD or ENCODE training and validationdatasets.
Variants from the β-haemoglobin (HBB) locus TheHbVar database is a locus-specific database of humanhaemoglobin variants and thalassemias [35]. The HBBdataset constructed from HbVar data contains SNPsfrom the human haemoglobin beta gene, HBB (codingand non-coding), the true positive SNPs being variantsthat cause beta thalassemia (27 non-coding variantsproximal to the HBB gene and 324 coding variants).
RAVEN regulatory variant dataset To assess the abilityof SuRFR to prioritise regulatory variants with no knowndisease association, we took advantage of a dataset de-signed to detect variants modifying transcriptional regu-lation [36], originally developed to train the web-basedapplication RAVEN. The RAVEN true positive SNP setconsists of 95 experimentally verified regulatory SNPs,and the control set, 3,856 background variants, all within10 kb of genes with mouse homologs. An additionalcontrol set of background variants was constructed byrandomly sampling the 1000 Genomes EUR dataset for
Ryan et al. Genome Medicine 2014, 6:79 Page 4 of 13http://genomemedicine.com/content/6/10/79
SNPs that were matched for distance to the nearest TSS.This matched background set contains 9,500 variants.
ClinVar variant dataset The ClinVar archive [37] pro-vides a freely accessible collection of experimentally veri-fied disease variants [38]. We compiled 128 variants(excluding mitochondrial variants) catalogued in the Clin-Var archive (sourced from the GWAVA website [39]) into aknown disease variant set. A background set of 150 vari-ants classified as non-pathogenic was also taken from theGWAVA support website. An additional 58 non-exonic,non-coding SNPs were obtained directly from the ClinVardatabase and a background set of 5,800 1000 GenomesEUR SNPs matched for distance to the nearest TSS wasgenerated for this dataset.
Complex trait related datasetsSORT1 dataset Musunuru et al. [40] investigated achromosome 1p13 locus strongly associated with low-density lipoprotein cholesterol (LDL-C) levels and cardio-vascular disease. Fine-mapping of the 1p13 locus, usingSNPs genotyped from approximately 20,000 individuals ofEuropean descent [41], identified 22 variants in the min-imal genomic region responsible for LDL-C association, ofwhich the six SNPs with the highest association were clus-tered in a 6.1 kb non-coding region. Luciferase assays andelectrophoretic shift assays were used to demonstrate thatone of the six SNPs, rs12740374, creates a binding site forthe transcription factor C/EBP and alters liver-specific ex-pression of the SORT1 gene. We constructed an annota-tion table for the 22 variants from this analysis.
EGR2 dataset The early growth response 2 (EGR2) geneis considered a good candidate for systemic lupus ery-thematosus susceptibility (SLE). Myouzen et al. [42]searched for functional coding variants within this locusby sequencing 96 individuals with SLE and found nocandidate variants. A case-control association study forSLE of the 80 kb region around the EGR2 gene identifieda single SNP with a significant P-value. Functional char-acterisation (electrophoretic shift assay) of the SNPs incomplete linkage disequilibrium (LD) with this taggingSNP showed that two SNPs had allelic differences inbinding ability. Luciferase assays performed on thesetwo SNPs showed that one (rs1412554) increased ex-pression by 1.2-fold while the second (rs1509957) re-pressed transcriptional activity. The 35 proxy SNPs thatare in perfect R-squared (R2 = 1.0) with the tagging SNPwere annotated to test method performance.
TCF7L2 dataset In a search for variants associated withtype 2 diabetes, (T2D) Gaulton et al. [43] identified knownSNPs in strong LD with reported SNPs associated withT2D or fasting glycaemia. Of these variants, they identified
six variants at the TCF7L2 locus, one being a GWAS-significant SNP, rs7903146, and the other five being in LDwith that tagging SNP). Using luciferase assays, they ob-served allelic differences in enhancer activity for the tag-ging SNP, rs7903146. These six SNPs defined a finaldataset to assess SuRFR’s functionality.
Cross-validationKnown functional and pathogenic variants were obtainedfrom the HGMD database and split into three datasets: ALL(general class), DM (only disease mutations) and DFP (onlydisease-associated with further evidence of functionality).An equal number of background 1000 Genomes EURvariants from the ENCODE pilot regions were randomlyselected. For the full (ALL) cross-validation analysis, knownand background variants were split into a training/valid-ation set (1,440 known and 1,440 background SNPs) and ahold-out test set (387 known SNPs and 169,452 back-ground variants). The training/validation set was furtherrandomly split into 10 folds for cross-validation.A modified grid search algorithm, incorporating multi-
variable regression, was used for parameter optimisation.Multivariable regression performed on the full training/validation set was used to guide the parameter boundar-ies of the grid search algorithm (Additional file 5). Usingbrute force permutation of integer parameter values par-ameter weightings were permuted (n = 450,000) acrossthe three models. Performance was measured using re-ceiver operating characteristic (ROC) curves and areaunder the curve (AUC) statistics using the ROCR Rpackage [44]). Maximum AUC with a threshold accept-able performance error <0.005 was the objective param-eter optimised for weighting parameter selection.Multiple very similar scoring models existed: the
AUCs of the top 1% of weightings differed by less than0.003 (Δ AUC ALL: 0.00258; Δ AUC DM: 0.00211; ΔAUC DFP: 0.00108), arguing for a smooth parameterspace with few fine-grained local optima.The 10-fold cross-validation was repeated for the HGMD
subclasses DM (512 variants) and DFP (534 variants). Thedifferences between the mean training AUCs and validationAUCs were used to calculate performance errors. Threemodels were developed from this analysis and incorporatedin the R package: a general model, 'ALL'; a model specific-ally designed to identify (rare) disease mutations, 'DM'; anda model for complex disease variants (GWAS or commonvariants), 'DFP'. For each of the three dataset classes, thebest model was run on the hold-out test dataset (similarlydivided by variant class into ALL, DM and DFP categories).Generalisation errors were calculated by comparing testAUCs to the mean validation AUCs. Performance and gen-eralisation errors were calculated to assess how consistentlyeach model performed during cross-validation and to pre-dict how well they would perform on novel data.
Ryan et al. Genome Medicine 2014, 6:79 Page 5 of 13http://genomemedicine.com/content/6/10/79
Results and discussionCross-validation analysis of genomic features usingHGMD regulatory variantsOur goal was to design and test a method for the prioritisa-tion of candidate functional SNPs. One of the greatest chal-lenges faced in the development of a predictive method,such as this, is the need for systematic and impartial per-formance evaluation. Two critical factors in performanceevaluation are i) good benchmarking datasets and ii) theuse of appropriate statistical evaluation methods [32].Non-coding variants with reported phenotypic impacts
were obtained from HGMD. These variants were subdi-vided into three datasets: ALL (the full HGMD dataset,1,827 SNPs); DM (known disease causing variants, 644SNPs); and DFP (disease-associated variants with functionalevidence, 686 SNPs). In each case, an equal number ofbackground variants was obtained by randomly samplingSNPs from the 1000 Genomes project (EUR) that were lo-cated within the ENCODE pilot project regions. Althoughthis background set will contain true functional variants, ithas the advantage of providing insight into the impact dif-ferent genomic backgrounds have on performance, makingit an excellent benchmark dataset. In addition, a benchmarkdataset should be relevant, accessible, reusable, representa-tive of the data under investigation, composed of experi-mentally verified variants and applicable to the evaluationof other tools. The combination of phenotypically func-tional variants from HGMD and ENCODE pilot regionbackground variants fulfils all of these criteria.We used 10-fold cross-validation to assess the per-
formance and gerenalisability of SuRFR on the threedatasets. All three datasets were divided into training,validation and hold-out test subsets. For each dataset,each of the three subsets comprised non-overlappingsets of SNPs. This was an important consideration as itprevented over-fitting of the derived models.We assessed SuRFR’s performance via ROC curve and
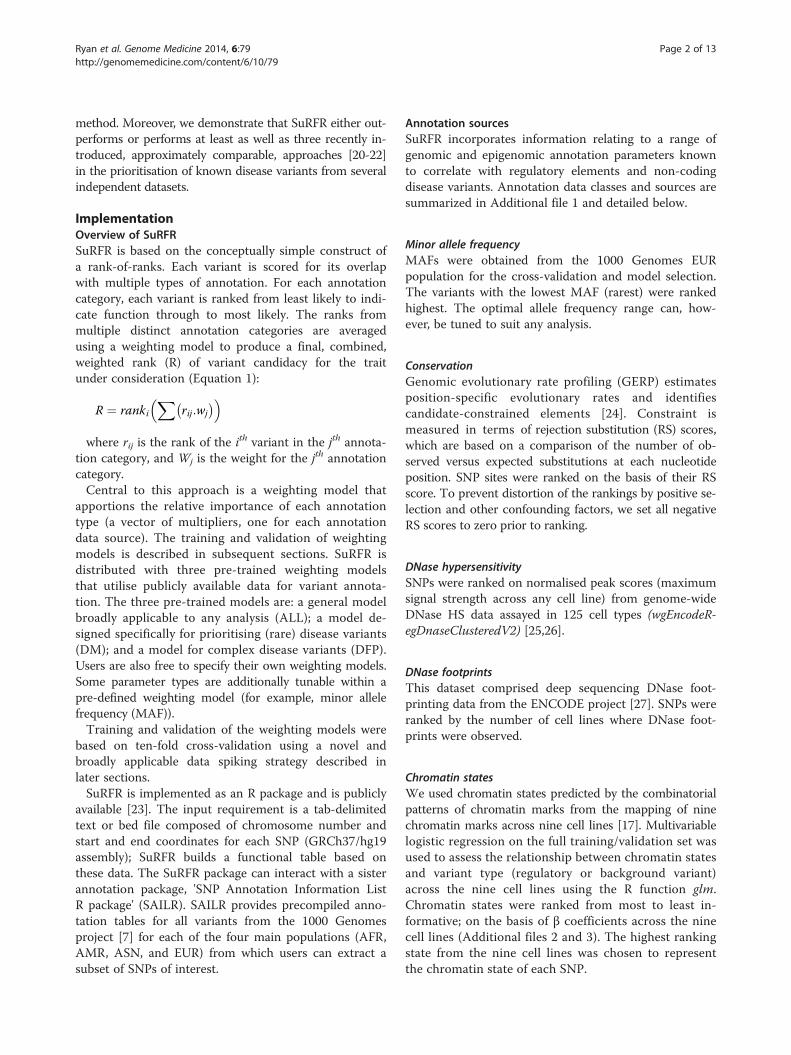
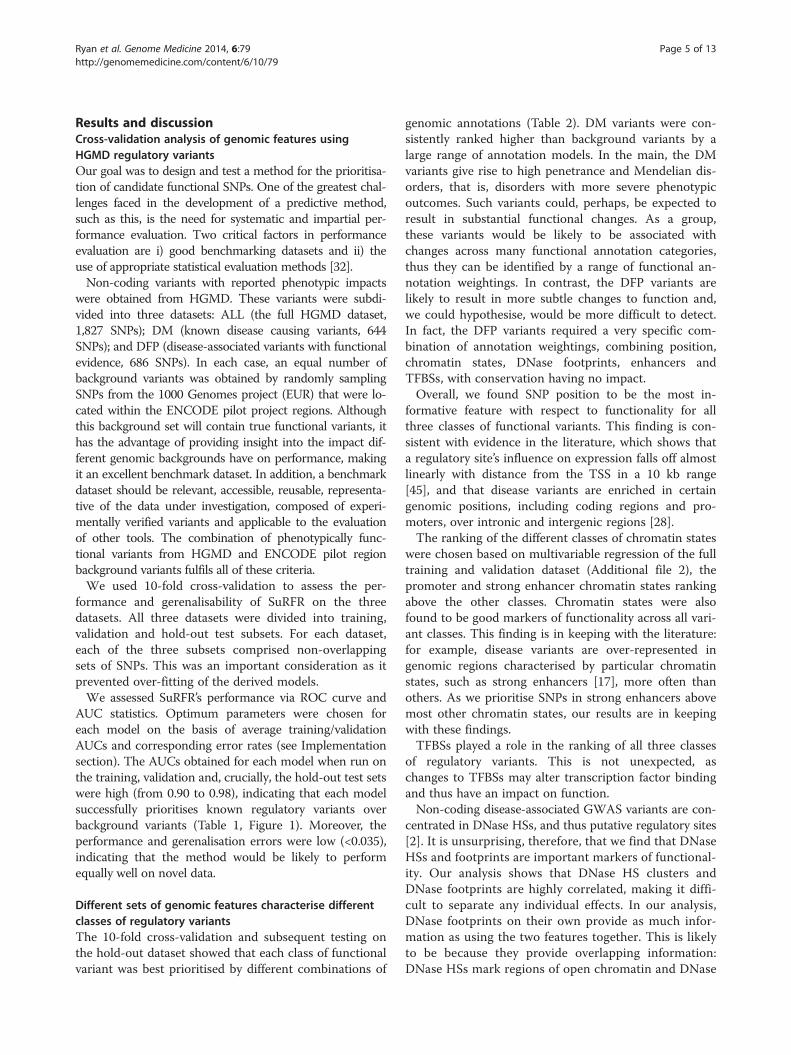
AUC statistics. Optimum parameters were chosen foreach model on the basis of average training/validationAUCs and corresponding error rates (see Implementationsection). The AUCs obtained for each model when run onthe training, validation and, crucially, the hold-out test setswere high (from 0.90 to 0.98), indicating that each modelsuccessfully prioritises known regulatory variants overbackground variants (Table 1, Figure 1). Moreover, theperformance and gerenalisation errors were low (<0.035),indicating that the method would be likely to performequally well on novel data.
Different sets of genomic features characterise differentclasses of regulatory variantsThe 10-fold cross-validation and subsequent testing onthe hold-out dataset showed that each class of functionalvariant was best prioritised by different combinations of
genomic annotations (Table 2). DM variants were con-sistently ranked higher than background variants by alarge range of annotation models. In the main, the DMvariants give rise to high penetrance and Mendelian dis-orders, that is, disorders with more severe phenotypicoutcomes. Such variants could, perhaps, be expected toresult in substantial functional changes. As a group,these variants would be likely to be associated withchanges across many functional annotation categories,thus they can be identified by a range of functional an-notation weightings. In contrast, the DFP variants arelikely to result in more subtle changes to function and,we could hypothesise, would be more difficult to detect.In fact, the DFP variants required a very specific com-bination of annotation weightings, combining position,chromatin states, DNase footprints, enhancers andTFBSs, with conservation having no impact.Overall, we found SNP position to be the most in-
formative feature with respect to functionality for allthree classes of functional variants. This finding is con-sistent with evidence in the literature, which shows thata regulatory site’s influence on expression falls off almostlinearly with distance from the TSS in a 10 kb range[45], and that disease variants are enriched in certaingenomic positions, including coding regions and pro-moters, over intronic and intergenic regions [28].The ranking of the different classes of chromatin states
were chosen based on multivariable regression of the fulltraining and validation dataset (Additional file 2), thepromoter and strong enhancer chromatin states rankingabove the other classes. Chromatin states were alsofound to be good markers of functionality across all vari-ant classes. This finding is in keeping with the literature:for example, disease variants are over-represented ingenomic regions characterised by particular chromatinstates, such as strong enhancers [17], more often thanothers. As we prioritise SNPs in strong enhancers abovemost other chromatin states, our results are in keepingwith these findings.TFBSs played a role in the ranking of all three classes
of regulatory variants. This is not unexpected, aschanges to TFBSs may alter transcription factor bindingand thus have an impact on function.Non-coding disease-associated GWAS variants are con-
centrated in DNase HSs, and thus putative regulatory sites[2]. It is unsurprising, therefore, that we find that DNaseHSs and footprints are important markers of functional-ity. Our analysis shows that DNase HS clusters andDNase footprints are highly correlated, making it diffi-cult to separate any individual effects. In our analysis,DNase footprints on their own provide as much infor-mation as using the two features together. This is likelyto be because they provide overlapping information:DNase HSs mark regions of open chromatin and DNase
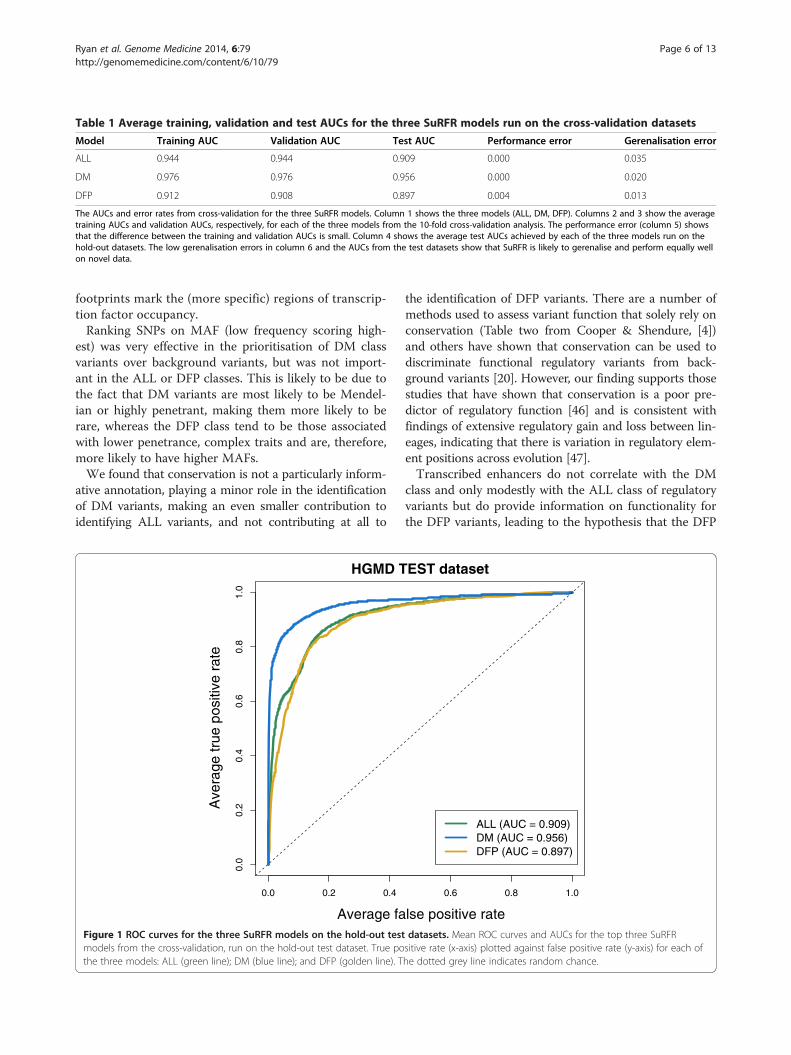
Table 1 Average training, validation and test AUCs for the three SuRFR models run on the cross-validation datasets
Model Training AUC Validation AUC Test AUC Performance error Gerenalisation error
ALL 0.944 0.944 0.909 0.000 0.035
DM 0.976 0.976 0.956 0.000 0.020
DFP 0.912 0.908 0.897 0.004 0.013
The AUCs and error rates from cross-validation for the three SuRFR models. Column 1 shows the three models (ALL, DM, DFP). Columns 2 and 3 show the averagetraining AUCs and validation AUCs, respectively, for each of the three models from the 10-fold cross-validation analysis. The performance error (column 5) showsthat the difference between the training and validation AUCs is small. Column 4 shows the average test AUCs achieved by each of the three models run on thehold-out datasets. The low gerenalisation errors in column 6 and the AUCs from the test datasets show that SuRFR is likely to gerenalise and perform equally wellon novel data.
Ryan et al. Genome Medicine 2014, 6:79 Page 6 of 13http://genomemedicine.com/content/6/10/79
footprints mark the (more specific) regions of transcrip-tion factor occupancy.Ranking SNPs on MAF (low frequency scoring high-
est) was very effective in the prioritisation of DM classvariants over background variants, but was not import-ant in the ALL or DFP classes. This is likely to be due tothe fact that DM variants are most likely to be Mendel-ian or highly penetrant, making them more likely to berare, whereas the DFP class tend to be those associatedwith lower penetrance, complex traits and are, therefore,more likely to have higher MAFs.We found that conservation is not a particularly inform-
ative annotation, playing a minor role in the identificationof DM variants, making an even smaller contribution toidentifying ALL variants, and not contributing at all to
HGMD T
Average fa
Ave
rage
true
pos
itive
rat
e
0.0 0.2 0.4
0.0
0.2
0.4
0.6
0.8
1.0
Figure 1 ROC curves for the three SuRFR models on the hold-out testmodels from the cross-validation, run on the hold-out test dataset. True pothe three models: ALL (green line); DM (blue line); and DFP (golden line). T
the identification of DFP variants. There are a number ofmethods used to assess variant function that solely rely onconservation (Table two from Cooper & Shendure, [4])and others have shown that conservation can be used todiscriminate functional regulatory variants from back-ground variants [20]. However, our finding supports thosestudies that have shown that conservation is a poor pre-dictor of regulatory function [46] and is consistent withfindings of extensive regulatory gain and loss between lin-eages, indicating that there is variation in regulatory elem-ent positions across evolution [47].Transcribed enhancers do not correlate with the DM
class and only modestly with the ALL class of regulatoryvariants but do provide information on functionality forthe DFP variants, leading to the hypothesis that the DFP
EST dataset
lse positive rate
0.6 0.8 1.0
ALL (AUC = 0.909)DM (AUC = 0.956)DFP (AUC = 0.897)
datasets. Mean ROC curves and AUCs for the top three SuRFRsitive rate (x-axis) plotted against false positive rate (y-axis) for each ofhe dotted grey line indicates random chance.
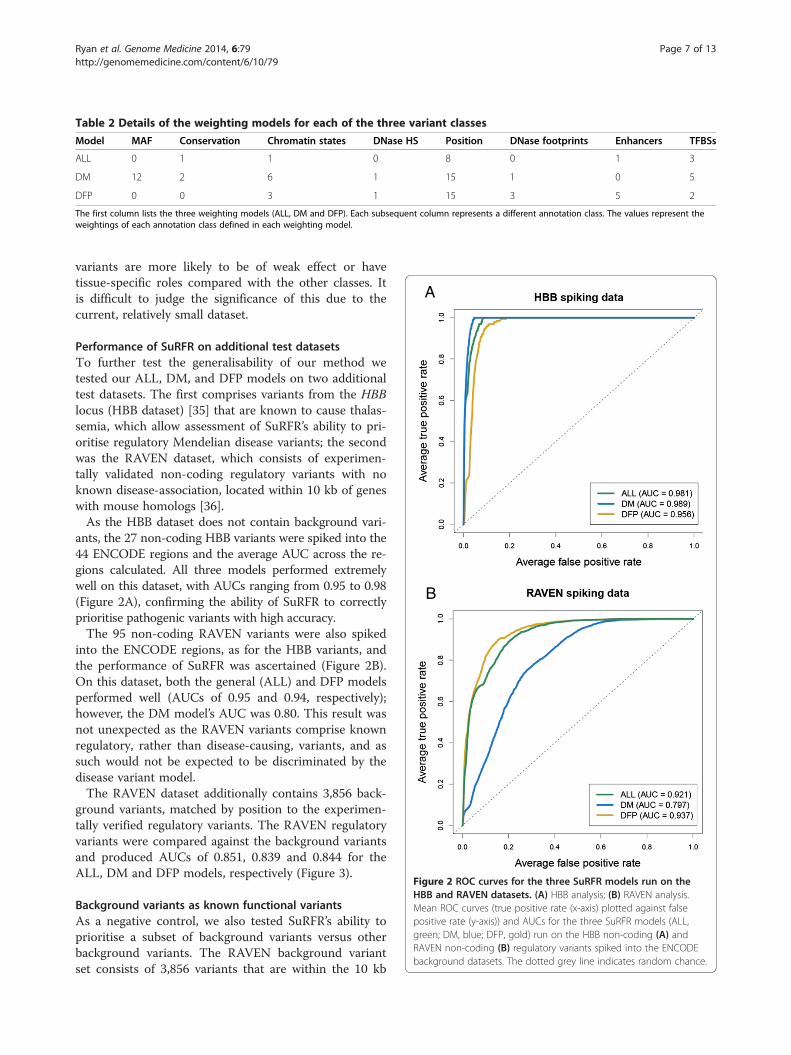
Table 2 Details of the weighting models for each of the three variant classes
Model MAF Conservation Chromatin states DNase HS Position DNase footprints Enhancers TFBSs
ALL 0 1 1 0 8 0 1 3
DM 12 2 6 1 15 1 0 5
DFP 0 0 3 1 15 3 5 2
The first column lists the three weighting models (ALL, DM and DFP). Each subsequent column represents a different annotation class. The values represent theweightings of each annotation class defined in each weighting model.
A
B
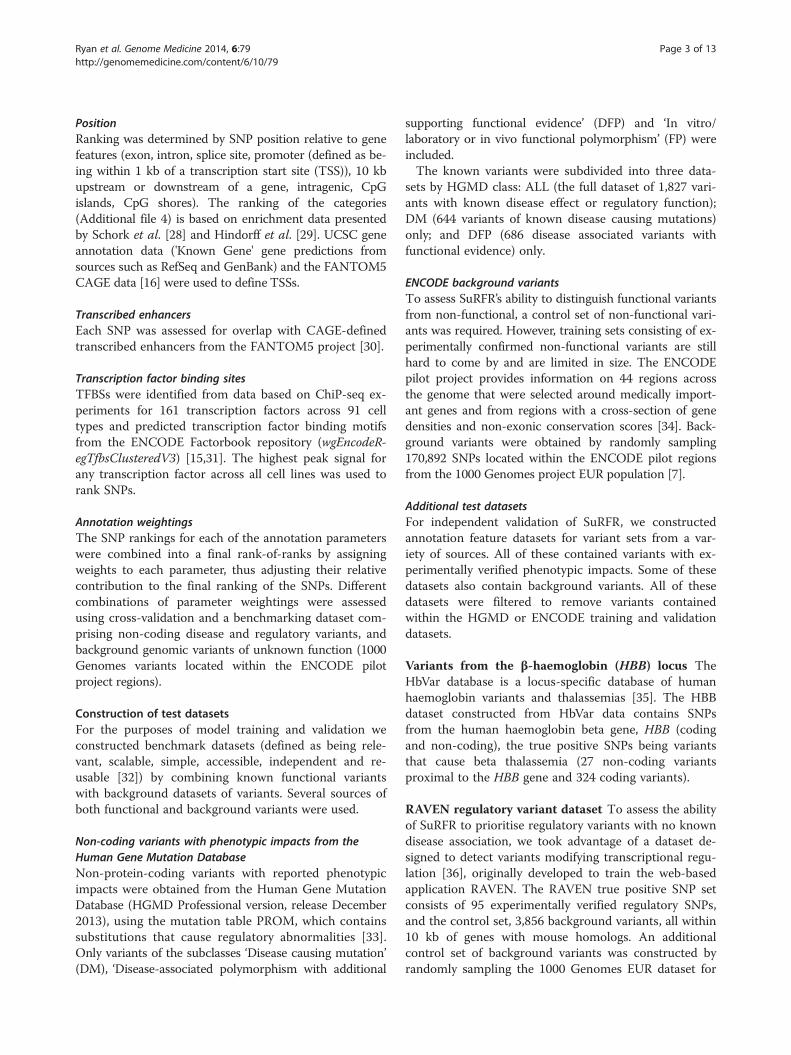
Figure 2 ROC curves for the three SuRFR models run on theHBB and RAVEN datasets. (A) HBB analysis; (B) RAVEN analysis.Mean ROC curves (true positive rate (x-axis) plotted against falsepositive rate (y-axis)) and AUCs for the three SuRFR models (ALL,green; DM, blue; DFP, gold) run on the HBB non-coding (A) andRAVEN non-coding (B) regulatory variants spiked into the ENCODEbackground datasets. The dotted grey line indicates random chance.
Ryan et al. Genome Medicine 2014, 6:79 Page 7 of 13http://genomemedicine.com/content/6/10/79
variants are more likely to be of weak effect or havetissue-specific roles compared with the other classes. Itis difficult to judge the significance of this due to thecurrent, relatively small dataset.
Performance of SuRFR on additional test datasetsTo further test the generalisability of our method wetested our ALL, DM, and DFP models on two additionaltest datasets. The first comprises variants from the HBBlocus (HBB dataset) [35] that are known to cause thalas-semia, which allow assessment of SuRFR’s ability to pri-oritise regulatory Mendelian disease variants; the secondwas the RAVEN dataset, which consists of experimen-tally validated non-coding regulatory variants with noknown disease-association, located within 10 kb of geneswith mouse homologs [36].As the HBB dataset does not contain background vari-
ants, the 27 non-coding HBB variants were spiked into the44 ENCODE regions and the average AUC across the re-gions calculated. All three models performed extremelywell on this dataset, with AUCs ranging from 0.95 to 0.98(Figure 2A), confirming the ability of SuRFR to correctlyprioritise pathogenic variants with high accuracy.The 95 non-coding RAVEN variants were also spiked
into the ENCODE regions, as for the HBB variants, andthe performance of SuRFR was ascertained (Figure 2B).On this dataset, both the general (ALL) and DFP modelsperformed well (AUCs of 0.95 and 0.94, respectively);however, the DM model’s AUC was 0.80. This result wasnot unexpected as the RAVEN variants comprise knownregulatory, rather than disease-causing, variants, and assuch would not be expected to be discriminated by thedisease variant model.The RAVEN dataset additionally contains 3,856 back-
ground variants, matched by position to the experimen-tally verified regulatory variants. The RAVEN regulatoryvariants were compared against the background variantsand produced AUCs of 0.851, 0.839 and 0.844 for theALL, DM and DFP models, respectively (Figure 3).
Background variants as known functional variantsAs a negative control, we also tested SuRFR’s ability toprioritise a subset of background variants versus otherbackground variants. The RAVEN background variantset consists of 3,856 variants that are within the 10 kb
RAVEN known and background spiked in RAVEN background
Average false positive rate
Ave
rage
true
pos
itive
rat
e
0.0 0.2 0.4 0.6 0.8 1.0
0.0
0.2
0.4
0.6
0.8
1.0
True ALL (AUC = 0.830)True DM (AUC = 0.845)True DFP (AUC = 0.842)Background ALL (AUC = 0.503)Background DM (AUC = 0.502)Background DFP (AUC = 0.503)
Figure 3 Performance of SuRFR on regulatory versus background variants. ROC curves and AUCs for the three models of SuRFR run ontrue RAVEN variants (experimentally verified) or negative RAVEN variants (background variants set as 'true'). The three 'True' analyses (ALL, greenline; DM, dark blue line; DFP, golden line) all perform consistently well, with an average AUC of 0.845, whereas the 'Background' as true analysesshowed SuRFR does not detect background variants any more than you would expect by chance (the grey dotted line).
Ryan et al. Genome Medicine 2014, 6:79 Page 8 of 13http://genomemedicine.com/content/6/10/79
region upstream of genes that are conserved betweenmice and humans. One-hundred randomly sampled sub-sets of 95 variants from this RAVEN background datasetwere redefined as 'known' and spiked into the RAVENbackground dataset. The average AUC calculated acrossthese 100 sets was 0.50, indicating background variantsare not prioritised any better than would be expectedby chance (Figure 3). In contrast, the 95 RAVENbackground variants spiked into the same background set(see above), achieved AUCs ranging from 0.84 to 0.85,demonstrating the ability of the method to prioritise func-tional variants better than non-functional variants.
Comparison with alternative methodsWe compared SuRFR’s ability to prioritise known patho-genic variants against three additional tools that priori-tise non-coding variants using a somewhat comparableapproach: GWAVA, CADD and FunSeq. GWAVA uses amodified random forest algorithm, written in the Pythonlanguage, to prioritise non-coding variants [20]. CADDprovides a single measure (C score) that has been pre-computed for the entire genome. C scores are based onintegration of multiple annotations [21]. FunSeq is amethod for prioritising cancer drivers. Prioritisation isbased upon the assessment of patterns of multiple
functional annotations. The authors state that FunSeqwill be most effective in the analysis of tumour genomes,but can also be applied for the analysis of germ linemutations [22].To compare SuRFR with these methods, we used an
independent dataset of 128 pathogenic variants from theClinVar archive of disease variants (see Implementationsection). This dataset excludes mitochondrial variants, asSuRFR has been trained on nuclear, not mitochondrial,variants and relies heavily on functional data that arenot applicable to mitochondrial variants (most notably,histone modifications and DNase HS data). These werecompared against two background sets: a backgroundset of 150 'non-pathogenic' ClinVar variants and 19,400variants identified as part of the 1000 Genomes project[7], selected by Ritchie et al. [20] for their assessmentof GWAVA’s performance, which were matched withthe pathogenic variants for distance to the nearest TSS.None of the three datasets contained variants usedto train SuRFR, GWAVA, CADD or FunSeq, allowingrigorous comparison of the methods’ performances.SuRFR was run using the DM model, as it is the mostappropriate model for this data type. GWAVA was simi-larly run using the TSS model, as this was used byRitchie et al. in their original analysis [20]. CADD has
Ryan et al. Genome Medicine 2014, 6:79 Page 9 of 13http://genomemedicine.com/content/6/10/79
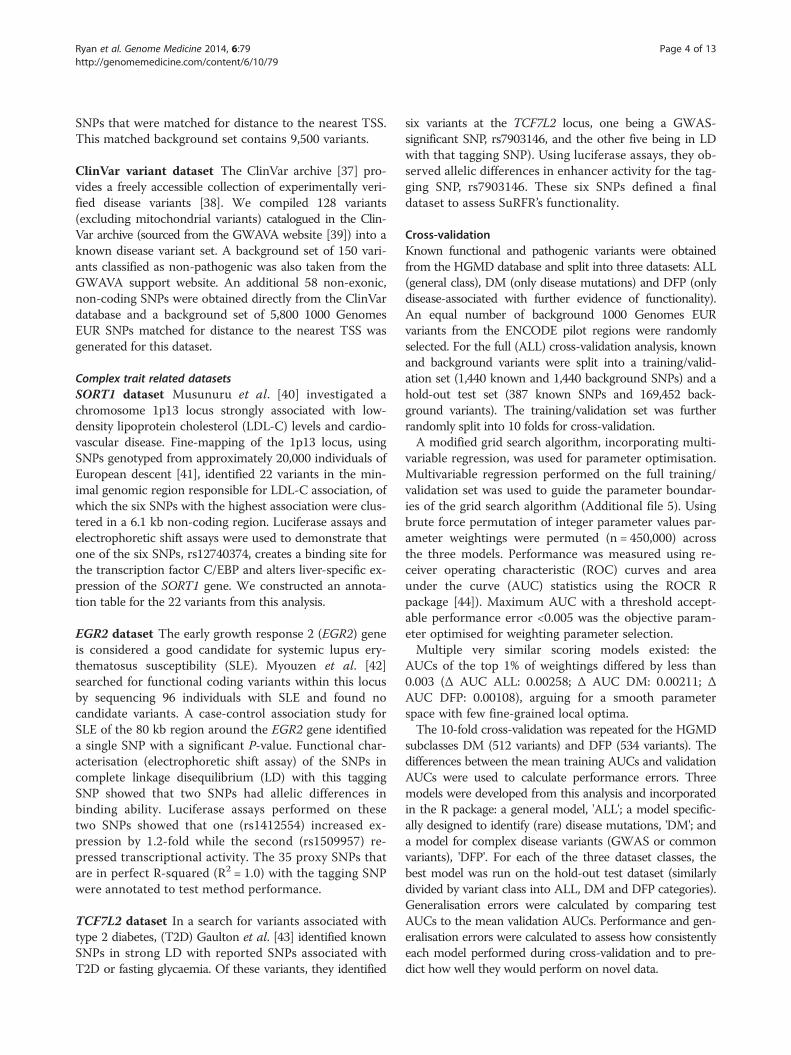
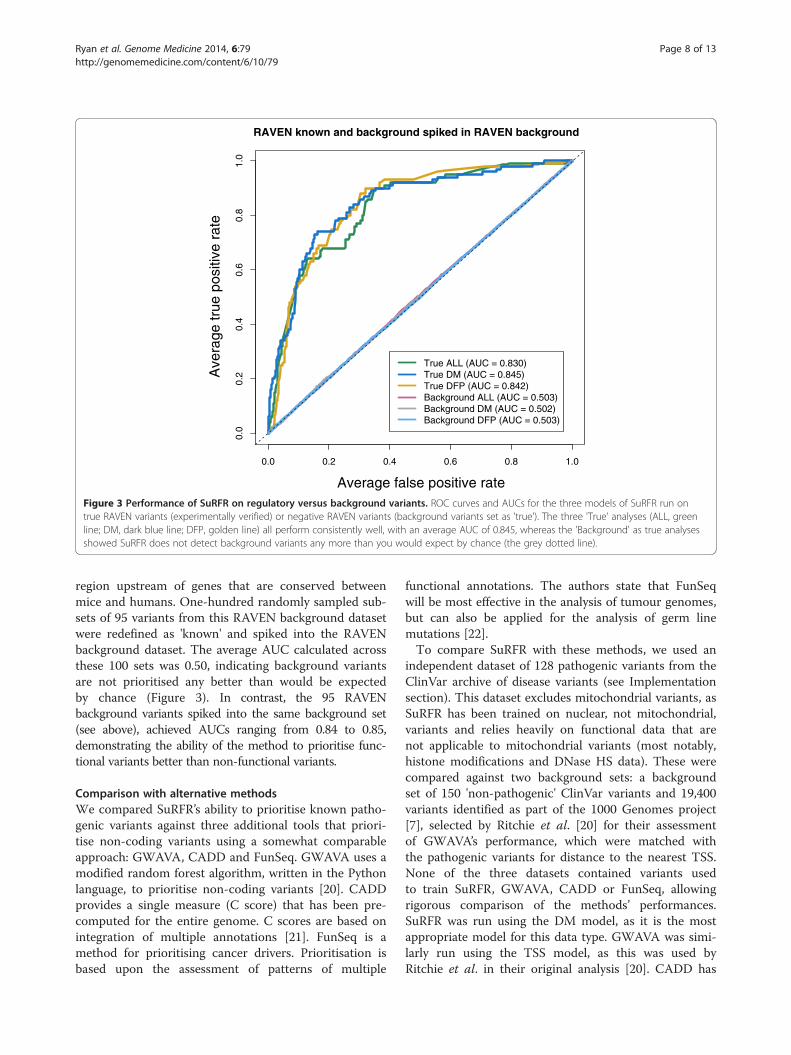
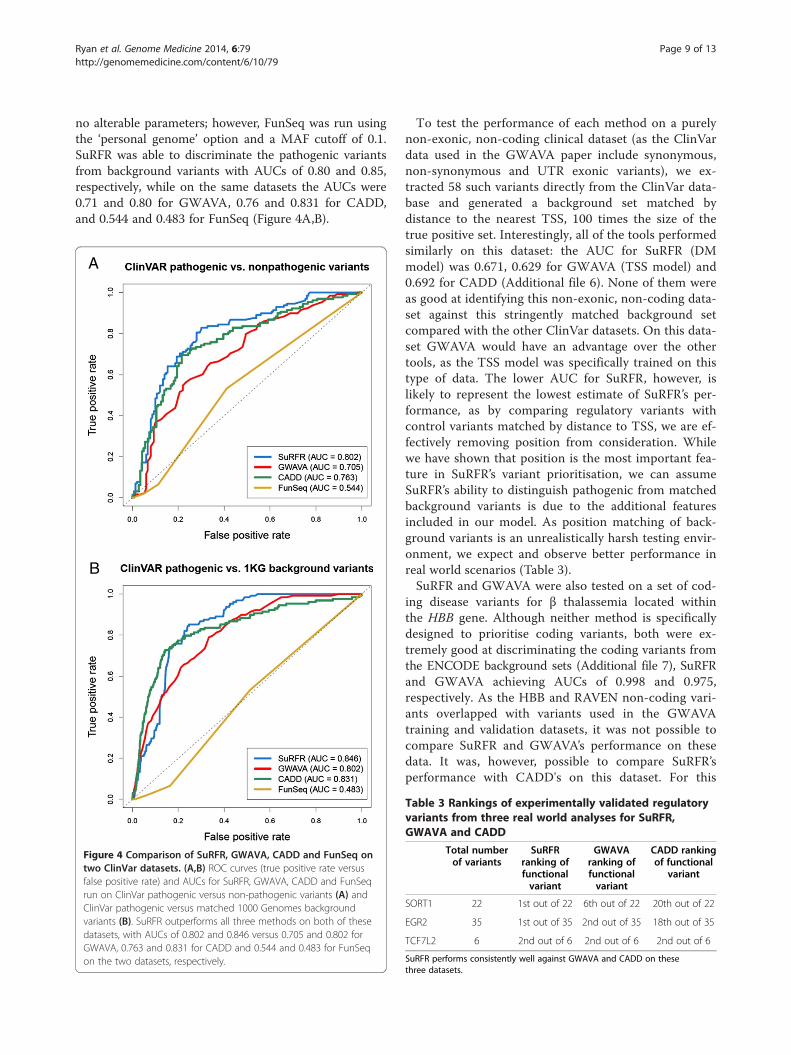
no alterable parameters; however, FunSeq was run usingthe ‘personal genome’ option and a MAF cutoff of 0.1.SuRFR was able to discriminate the pathogenic variantsfrom background variants with AUCs of 0.80 and 0.85,respectively, while on the same datasets the AUCs were0.71 and 0.80 for GWAVA, 0.76 and 0.831 for CADD,and 0.544 and 0.483 for FunSeq (Figure 4A,B).
A
B
Figure 4 Comparison of SuRFR, GWAVA, CADD and FunSeq ontwo ClinVar datasets. (A,B) ROC curves (true positive rate versusfalse positive rate) and AUCs for SuRFR, GWAVA, CADD and FunSeqrun on ClinVar pathogenic versus non-pathogenic variants (A) andClinVar pathogenic versus matched 1000 Genomes backgroundvariants (B). SuRFR outperforms all three methods on both of thesedatasets, with AUCs of 0.802 and 0.846 versus 0.705 and 0.802 forGWAVA, 0.763 and 0.831 for CADD and 0.544 and 0.483 for FunSeqon the two datasets, respectively.
To test the performance of each method on a purelynon-exonic, non-coding clinical dataset (as the ClinVardata used in the GWAVA paper include synonymous,non-synonymous and UTR exonic variants), we ex-tracted 58 such variants directly from the ClinVar data-base and generated a background set matched bydistance to the nearest TSS, 100 times the size of thetrue positive set. Interestingly, all of the tools performedsimilarly on this dataset: the AUC for SuRFR (DMmodel) was 0.671, 0.629 for GWAVA (TSS model) and0.692 for CADD (Additional file 6). None of them wereas good at identifying this non-exonic, non-coding data-set against this stringently matched background setcompared with the other ClinVar datasets. On this data-set GWAVA would have an advantage over the othertools, as the TSS model was specifically trained on thistype of data. The lower AUC for SuRFR, however, islikely to represent the lowest estimate of SuRFR’s per-formance, as by comparing regulatory variants withcontrol variants matched by distance to TSS, we are ef-fectively removing position from consideration. Whilewe have shown that position is the most important fea-ture in SuRFR’s variant prioritisation, we can assumeSuRFR’s ability to distinguish pathogenic from matchedbackground variants is due to the additional featuresincluded in our model. As position matching of back-ground variants is an unrealistically harsh testing envir-onment, we expect and observe better performance inreal world scenarios (Table 3).SuRFR and GWAVA were also tested on a set of cod-
ing disease variants for β thalassemia located withinthe HBB gene. Although neither method is specificallydesigned to prioritise coding variants, both were ex-tremely good at discriminating the coding variants fromthe ENCODE background sets (Additional file 7), SuRFRand GWAVA achieving AUCs of 0.998 and 0.975,respectively. As the HBB and RAVEN non-coding vari-ants overlapped with variants used in the GWAVAtraining and validation datasets, it was not possible tocompare SuRFR and GWAVA’s performance on thesedata. It was, however, possible to compare SuRFR’sperformance with CADD's on this dataset. For this
Table 3 Rankings of experimentally validated regulatoryvariants from three real world analyses for SuRFR,GWAVA and CADD
Total numberof variants
SuRFRranking offunctionalvariant
GWAVAranking offunctionalvariant
CADD rankingof functional
variant
SORT1 22 1st out of 22 6th out of 22 20th out of 22
EGR2 35 1st out of 35 2nd out of 35 18th out of 35
TCF7L2 6 2nd out of 6 2nd out of 6 2nd out of 6
SuRFR performs consistently well against GWAVA and CADD on thesethree datasets.
Ryan et al. Genome Medicine 2014, 6:79 Page 10 of 13http://genomemedicine.com/content/6/10/79
study, we combined the RAVEN experimentally verifiedregulatory variants with 9,500 background variants,matched by distance to the nearest TSS (100 controlvariants for each true positive variant). The AUC forSuRFR on this dataset was 0.702, while CADD achieveda more modest performance, with an AUC of 0.608(Additional file 8).To establish next how well SuRFR performs compared
with GWAVA and CADD on variants related to complextraits, we ran all three methods on three published ana-lyses identifying regulatory variants associated with dis-ease risk (see Implementation section).
SORT1: analysis of a chr1p13 locus associated withlow-density lipoprotein levels and cardiovascular diseaseMusunuru et al. [40] showed that a region of chromo-some 1p13 was associated with LDL-C. They carried outfunctional analysis on 22 variants from the locus andidentified rs12740374 as the most likely functional can-didate. We ran the 22 candidate variants through SuRFRand compared their ranking with GWAVA and CADD’srankings [20]. SuRFR successfully ranked rs12740374 1stout of the 22, whereas GWAVA ranked it 6th out of 22and CADD ranked it 20th out of 22 (Table 3).
EGR2: Evaluation of variants from the EGR2 locusassociated with systemic lupus erythematosusThe 80 kb chr10q21 candidate locus for SLE contains atotal of 237 variants with a MAF >0.10 from the 1000Genomes ASN population [7]. When all 237 SNPs wereassessed by GWAVA, CADD and SuRFR, no tool wasable to identify rs1509957 (a SNP found by Myouzenet al. [42] to have reduced activity in a reporter assay)within the top 10%. However, when only the 35 proxySNPs in LD with the most significantly associated SNPfrom their association study for SLE were ranked, SuRFRranked rs1509957 1st out of 35, GWAVA ranked it 2nd,and CADD ranked it 18th, highlighting the importanceof using additional prior biological information to pre-filter variants to improve predictive power (Table 3).
Study of type 2 diabetes-associated variants at the TCF7L2locusOf the six variants within the T2D GWAS associated re-gion at the TCF7L2 locus, only one SNP showed signifi-cantly increased enhancer activity. GWAVA, CADD andSuRFR all ranked this variant second out of six (Table 3).We have shown that SuRFR either outperforms or per-
forms as well as GWAVA, and that both GWAVA andSuRFR substantially outperform CADD on the datasetstested here. The 'black box' nature of GWAVA’s designmeans that we are unable to comment on the reasonsfor the difference in performance between the twomethods. However, Ritchie et al. [20] report that G + C
content, conservation, DNase HSs, distance to the nearestTSS and some histone modifications contribute most tothe discriminative power of GWAVA. While there areoverlaps between the annotations used by the twomethods there are also differences, and it seems likely thatthese differences contribute to the difference in perform-ance between SuRFR and GWAVA. The training and val-idation approaches also differ and we would argue thatour tripartite training, validation and testing splits of theinitial data are better suited to avoid over-fitting than theGWAVA bipartite training and validation approach.CADD was developed using an entirely different proto-
col involving a support vector machine trained to differen-tiate high-frequency human-derived alleles from an equalnumber (14.7 million) of simulated variants [21]. A widerange of annotations were assessed and combined into asingle measure (C score) for each variant, which can beviewed as an estimate of deleteriousness. SuRFR eithermatches or outperforms CADD on all of the datasets wehave tested. This may be because CADD is trained to dif-ferentiate high-frequency alleles from simulated variantsof equal frequencies, whereas the datasets under test oftencontain a range of allele frequencies.
Advantages of using SuRFRImplementation of SuRFR in R has many advantages, in-cluding ease of use and of data management. In addition,code run times are short and the R environment pro-vides a high level of flexibility. For example, the use of Rfacilitates incorporation of additional modules, functionsand annotation data in the future; and integration withother R packages. This is a clear advantage over web-based methods, where there may be issues of data secur-ity, control over parameter settings or flexibility to mod-ify the underlying code. At every point during therunning of the R package, users can understand the ex-tent to which the various annotations contribute to thevariant rankings, allowing construction of hypothesesbased on the data obtained. This is a major advantageover 'black box' approaches such as GWAVA, where theuser is unaware of the factors affecting variant rankings.
Intended use of the softwareThis R package is intended to be used as an aid for gen-omics studies. We must, however, emphasise that SuRFRis predictive and does not take the place of experimentalvalidation. Instead, it should be used as a guide to priori-tising candidate variants to take forward for follow-upanalysis.
LimitationsSuRFR is not currently designed to discriminate betweencoding variants of differing impact; however, many exist-ing software packages perform this task well [4].
Ryan et al. Genome Medicine 2014, 6:79 Page 11 of 13http://genomemedicine.com/content/6/10/79
SuRFR, and any other comparable method, is likely todiscriminate against long-range enhancers, due to thestrong influence of SNP position (score increasing withproximity to genes). This is currently a difficult issue toaddress, as known variants are biased towards codingand promoter variants and no relevant datasets exist totrain methods in the discrimination of true long-rangeenhancers.All methods tested here performed less well on matched
non-exonic, non-coding variants (Additional file 6). Again,this is likely to be due to a lack of knowledge, sufficientlycomprehensive genomic measures and appropriate train-ing datasets.
Outline of planned future developmentThere is scope for extending SuRFR. Planned future de-velopments under consideration include expanding thecollection of annotations to assess the impact of codingvariants and investigation of additional annotations thatmay correlate with regulatory elements (for instance, ex-pression quantitative trait loci data). In addition, wewould hope to improve SuRFR’s flexibility by i) linking itin with other R packages (for example, next-generationsequencing packages and methylation and expressionanalysis packages), and ii) provide additional utility foruser customisation.We would also like to extend SuRFR's remit to assess
indels. This goal is currently somewhat hampered by arelative dearth of appropriate training and validation data.
ConclusionsAssessing the impact of non-coding variants is currentlya major challenge in complex trait genetics. We have de-veloped a system that combines a unique collection ofdata from multiple functional annotation categories toprioritise variants by predicted function. The modulardesign and tunable parameterisation of SuRFR allows forthe simple and efficient incorporation of publicly avail-able data and prior biological knowledge into the rank-ing scheme.The R package provides three models: a general model
for any analysis (ALL); a model designed specifically forprioritising (rare) disease variants (DM); and a model forcomplex disease variants (DFP). Alternatively, SuRFR al-lows users to specify their own custom model. Thismethod has been tested on known regulatory and dis-ease variants and a proposed benchmark backgroundvariant dataset and has been shown to perform withhigh sensitivity and specificity. SuRFR also has the abilityto prioritise coding and non-coding functional variants.Our analysis has provided insight into the extent to
which different classes of functional annotation are mostuseful for the identification of known regulatory variants.We have also shown that SuRFR either outperforms, or
performs at least as well as, comparable SNP prioritisa-tion approaches, whilst benefiting from the advantagesthat come from being part of the R environment.
Availability and requirementsProject name: SuRFRProject home page: http://www.cgem.ed.ac.uk/resources/Operating system(s): unix/linuxProgramming language: ROther requirements: bedtools and tabixLicense: Artistic-2.0Any restrictions to use by non-academics: No
Additional files
Additional file 1: Table S1. Annotation data and sources.
Additional file 2: Table S2. Chromatin state multivariable regression βcoefficients.
Additional file 3: Table S3. Chromatin state rankings.
Additional file 4: Table S4. Position category rankings.
Additional file 5: Table S5. Grid search parameter boundaries.
Additional file 6: Figure S1. Comparison of SuRFR, GWAVA and CADDon an additional, non-coding ClinVar dataset. ROC curves (true positiverate versus false positive rate) and AUCs for SuRFR, GWAVA and CADDrun on a non-exonic, non-coding dataset of ClinVar pathogenic variantsversus a matched 1000 Genomes background variant set. SuRFR, GWAVAand CADD perform to a similar level on these data.
Additional file 7: Figure S2. ROC curves and AUCs of SuRFR versusGWAVA on HBB coding variants. The plot shows the performance ofSuRFR and GWAVA in terms of true positive rates (x-axis) and falsepositive rates (y-axis), plotting ROC curves (SuRFR, blue; GWAVA, red)against performance expected by chance (grey dotted line). This figureshows that both methods are very good at prioritising functional codingvariants over background variants.
Additional file 8: Figure S3. ROC curves and AUCs for SuRFR versusCADD on RAVEN regulatory variants versus a matched control set. Theplot shows the performance of SuRFR and CADD in terms of true positiverates (x-axis) and false positive rates (y-axis), plotting ROC curves (SuRFR,blue; CADD, green) against performance expected by chance (greydotted line). This figure shows that both methods prioritise functionalregulatory variants over matched background variants to a similar extent.
AbbreviationsAUC: area under the ROC curve; DNase HS: DNase hypersensitive site;GWAS: genome-wide association study; HGMD: Human Gene MutationDatabase; LD: linkage disequilibrium; LDL-C: low-density lipoproteincholesterol; MAF: minor allele frequency; ROC: receiver operatingcharacteristic curve; RS: rejection substitution; SLE: systemic lupuserythematosus; SNP: single-nucleotide polymorphism; T2D: type 2 diabetes;TFBS: transcription factor binding site; TSS: transcription start site;UTR: untranslated region.
Competing interestsThe authors declare that they have no competing interests.
Authors’ contributionsKE and MT conceived the study and supervised its execution. DP and NRparticipated in study design. NR built the test datasets, performed allstatistical analyses and wrote the R code. SM and NR constructed the Rpackage. KE, NR and MT drafted the manuscript. All authors critically revisedthe manuscript and approved it for publication.
Ryan et al. Genome Medicine 2014, 6:79 Page 12 of 13http://genomemedicine.com/content/6/10/79
AcknowledgementsThis project was funded by the Medical Research Council and supported bythe Medical Research Foundation and The University of Edinburgh. We thankRosie M Walker, Colin A Semple and A Chris Boyd for useful discussion andRosie M Walker and Philippa A Thomson for critical review of the manuscript.
Author details1Centre for Genomic and Experimental Medicine, Institute of Genetics andMolecular Medicine, The University of Edinburgh, Western General Hospital,Crewe Road, Edinburgh EH4 2XU, UK. 2Centre for Cognitive Ageing andCognitive Epidemiology, The University of Edinburgh, 7 George Square,Edinburgh EH8 9JZ, UK. 3MRC Human Genetics Unit, Institute of Geneticsand Molecular Medicine, The University of Edinburgh, Western GeneralHospital, Crewe Road, Edinburgh EH4 2XU, UK.
Received: 20 June 2014 Accepted: 26 September 2014
References1. Manolio TA, Collins FS, Cox NJ, Goldstein DB, Hindorff LA, Hunter DJ,
McCarthy MI, Ramos EM, Cardon LR, Chakravarti A, Cho JH, Guttmacher AE,Kong A, Kruglyak L, Mardis E, Rotimi CN, Slatkin M, Valle D, Whittemore AS,Boehnke M, Clark AG, Eichler EE, Gibson G, Haines JL, Mackay TF, McCarrollSA, Visscher PM: Finding the missing heritability of complex diseases.Nature 2009, 461:747–753.
2. Maurano MT, Humbert R, Rynes E, Thurman RE, Haugen E, Wang H,Reynolds AP, Sandstrom R, Qu H, Brody J, Shafer A, Neri F, Lee K, Kutyavin T,Stehling-Sun S, Johnson AK, Canfield TK, Giste E, Diegel M, Bates D, HansenRS, Neph S, Sabo PJ, Heimfeld S, Raubitschek A, Ziegler S, Cotsapas C,Sotoodehnia N, Glass I, Sunyaev SR, et al: Systematic localization ofcommon disease-associated variation in regulatory DNA. Science 2012,337:1190–1195.
3. Li X, Montgomery SB: Detection and impact of rare regulatory variants inhuman disease. Front Genet 2013, 4:67.
4. Cooper GM, Shendure J: Needles in stacks of needles: finding disease-causalvariants in a wealth of genomic data. Nat Rev Genet 2011, 12:628–640.
5. ENCODE Project Consortium: An integrated encyclopedia of DNAelements in the human genome. Nature 2012, 489:57–74.
6. FANTOM Consortium and the RIKEN PMI and CLST (DGT), Forrest AR,Kawaji H, Rehli M, Baillie JK, de Hoon MJ, Lassmann T, Itoh M, Summers KM,Suzuki H, Daub CO, Kawai J, Heutink P, Hide W, Freeman TC, Lenhard B,Bajic VB, Taylor MS, Makeev VJ, Sandelin A, Hume DA, Carninci P,Hayashizaki Y: R.P. the, and Clst, A promoter-level mammalianexpression atlas. Nature 2014, 507:462–470.
7. 1000 Genomes Project Consortium, Abecasis GR, Altshuler D, Auton A,Brooks LD, Durbin RM, Gibbs RA, Hurles ME, McVean GA: A map of humangenome variation from population-scale sequencing. Nature 2010,467:1061–1073.
8. Bernstein BE, Stamatoyannopoulos JA, Costello JF, Ren B, Milosavljevic A,Meissner A, Kellis M, Marra MA, Beaudet AL, Ecker JR, Farnham PJ, Hirst M,Lander ES, Mikkelsen TS, Thomson JA: The NIH Roadmap EpigenomicsMapping Consortium. Nat Biotechnol 2010, 28:1045–1048.
9. Ernst J, Kellis M: Discovery and characterization of chromatin states forsystematic annotation of the human genome. Nat Biotechnol 2010,28:817–825.
10. Degner JF, Pai AA, Pique-Regi R, Veyrieras JB, Gaffney DJ, Pickrell JK, De LeonS, Michelini K, Lewellen N, Crawford GE, Stephens M, Gilad Y, Pritchard JK:DNase I sensitivity QTLs are a major determinant of human expressionvariation. Nature 2012, 482:390–394.
11. Thurman RE, Rynes E, Humbert R, Vierstra J, Maurano MT, Haugen E,Sheffield NC, Stergachis AB, Wang H, Vernot B, Garg K, John S, Sandstrom R,Bates D, Boatman L, Canfield TK, Diegel M, Dunn D, Ebersol AK, Frum T,Giste E, Johnson AK, Johnson EM, Kutyavin T, Lajoie B, Lee BK, Lee K,London D, Lotakis D, Neph S, et al: The accessible chromatin landscape ofthe human genome. Nature 2012, 489:75–82.
12. Hager G: Footprints by deep sequencing. Nat Methods 2009, 6:254–255.13. Hesselberth JR, Chen X, Zhang Z, Sabo PJ, Sandstrom R, Reynolds AP,
Thurman RE, Neph S, Kuehn MS, Noble WS, Fields S, StamatoyannopoulosJA: Global mapping of protein-DNA interactions in vivo by digitalgenomic footprinting. Nat Methods 2009, 6:283–289.
14. Neph S, Vierstra J, Stergachis AB, Reynolds AP, Haugen E, Vernot B, ThurmanRE, John S, Sandstrom R, Johnson AK, Maurano MT, Humbert R, Rynes E,Wang H, Vong S, Lee K, Bates D, Diegel M, Roach V, Dunn D, Neri J, SchaferA, Hansen RS, Kutyavin T, Giste E, Weaver M, Canfield T, Sabo P, Zhang M,Balasundaram G, et al: An expansive human regulatory lexicon encodedin transcription factor footprints. Nature 2012, 489:83–90.
15. Wang J, Zhuang J, Iyer S, Lin X, Whitfield TW, Greven MC, Pierce BG, DongX, Kundaje A, Cheng Y, Rando OJ, Birney E, Myers RM, Noble WS, Snyder M,Weng Z: Sequence features and chromatin structure around thegenomic regions bound by 119 human transcription factors. Genome Res2012, 22:1798–1812.
16. Davydov EV, Goode DL, Sirota M, Cooper GM, Sidow A, Batzoglou S:Identifying a high fraction of the human genome to be under selectiveconstraint using GERP++. PLoS Comput Biol 2010, 6:e1001025.
17. Ernst J, Kheradpour P, Mikkelsen TS, Shoresh N, Ward LD, Epstein CB, ZhangX, Wang L, Issner R, Coyne M, Ku M, Durham T, Kellis M, Bernstein BE:Mapping and analysis of chromatin state dynamics in nine human celltypes. Nature 2011, 473:43–49.
18. Kent WJ, Sugnet CW, Furey TS, Roskin KM, Pringle TH, Zahler AM, HausslerD: The human genome browser at UCSC. Genome Res 2002, 12:996–1006.
19. Flicek P, Amode MR, Barrell D, Beal K, Billis K, Brent S, Carvalho-Silva D, ClaphamP, Coates G, Fitzgerald S, Gil L, Giron CG, Gordon L, Hourlier T, Hunt S, JohnsonN, Juettemann T, Kahari AK, Keenan S, Kulesha E, Martin FJ, Maurel T, McLarenWM, Murphy DN, Nag R, Overduin B, Pignatelli M, Pritchard B, Pritchard E, RiatHS, et al: Ensembl 2014. Nucleic Acids Res 2014, 42:D749–D755.
20. Ritchie GR, Dunham I, Zeggini E, Flicek P: Functional annotation ofnoncoding sequence variants. Nat Methods 2014, 11:294–296.
21. Kircher M, Witten DM, Jain P, O'Roak BJ, Cooper GM, Shendure J: A generalframework for estimating the relative pathogenicity of human geneticvariants. Nat Genet 2014, 46:310–315.
22. Khurana E, Fu Y, Colonna V, Mu XJ, Kang HM, Lappalainen T, Sboner A,Lochovsky L, Chen J, Harmanci A, Das J, Abyzov A, Balasubramanian S, BealK, Chakravarty D, Challis D, Chen Y, Clarke D, Clarke L, Cunningham F, EvaniUS, Flicek P, Fragoza R, Garrison E, Gibbs R, Gumus ZH, Herrero J,Kitabayashi N, Kong Y, Lage K, et al: Integrative annotation of variantsfrom 1092 humans: application to cancer genomics. Science 2013,342:1235587.
23. SuRFR [http://www.cgem.ed.ac.uk/resources/]24. Cooper GM, Stone EA, Asimenos G, Program NCS, Green ED, Batzoglou S,
Sidow A: Distribution and intensity of constraint in mammalian genomicsequence. Genome Res 2005, 15:901–913.
25. Sabo PJ, Hawrylycz M, Wallace JC, Humbert R, Yu M, Shafer A, Kawamoto J,Hall R, Mack J, Dorschner MO, McArthur M, Stamatoyannopoulos JA:Discovery of functional noncoding elements by digital analysis ofchromatin structure. Proc Natl Acad Sci U S A 2004, 101:16837–16842.
26. Song L, Crawford GE: DNase-seq: a high-resolution technique formapping active gene regulatory elements across the genome frommammalian cells. Cold Spring Harb Protoc 2010, 2010:prot5384.
27. Sabo PJ, Kuehn MS, Thurman R, Johnson BE, Johnson EM, Cao H, Yu M,Rosenzweig E, Goldy J, Haydock A, Weaver M, Shafer A, Lee K, Neri F,Humbert R, Singer MA, Richmond TA, Dorschner MO, McArthur M,Hawrylycz M, Green RD, Navas PA, Noble WS, Stamatoyannopoulos JA:Genome-scale mapping of DNase I sensitivity in vivo using tiling DNAmicroarrays. Nat Methods 2006, 3:511–518.
28. Schork AJ, Thompson WK, Pham P, Torkamani A, Roddey JC, Sullivan PF,Kelsoe JR, O'Donovan MC, Furberg H, Schork NJ, Andreassen OA, Dale AM,The Tobacco and Genetics Consortium, The Bipolar Disorder PsychiatricGenomics Consortium, Schizophrenia Psychiatric Genomics Consortium:All SNPs are not created equal: genome-wide association studies reveala consistent pattern of enrichment among functionally annotated SNPs.PLoS Genet 2013, 9:e1003449.
29. Hindorff LA, Sethupathy P, Junkins HA, Ramos EM, Mehta JP, Collins FS,Manolio TA: Potential etiologic and functional implications of genome-wide association loci for human diseases and traits. Proc Natl Acad SciU S A 2009, 106:9362–9367.
30. Andersson R, Gebhard C, Miguel-Escalada I, Hoof I, Bornholdt J, Boyd M, ChenY, Zhao X, Schmidl C, Suzuki T, Ntini E, Arner E, Valen E, Li K, Schwarzfischer L,Glatz D, Raithel J, Lilje B, Rapin N, Bagger FO, Jorgensen M, Andersen PR, BertinN, Rackham O, Burroughs AM, Baillie JK, Ishizu Y, Shimizu Y, Furuhata E, MaedaS: An atlas of active enhancers across human cell types and tissues.Nature 2014, 507:455–461.
Ryan et al. Genome Medicine 2014, 6:79 Page 13 of 13http://genomemedicine.com/content/6/10/79
31. Wang J, Zhuang J, Iyer S, Lin XY, Greven MC, Kim BH, Moore J, Pierce BG,Dong X, Virgil D, Birney E, Hung JH, Weng Z: Factorbook.org: a Wiki-baseddatabase for transcription factor-binding data generated by the ENCODEconsortium. Nucleic Acids Res 2013, 41:D171–D176.
32. Vihinen M: How to evaluate performance of prediction methods?Measures and their interpretation in variation effect analysis. BMCGenomics 2012, 13:S2.
33. Stenson PD, Mort M, Ball EV, Howells K, Phillips AD, Thomas NS, Cooper DN:The Human Gene Mutation Database: 2008 update. Genome Med 2009,1:13.
34. ENCODE Project Consortium: Identification and analysis of functionalelements in 1% of the human genome by the ENCODE pilot project.Nature 2007, 447:799–816.
35. Patrinos GP, Giardine B, Riemer C, Miller W, Chui DH, Anagnou NP, WajcmanH, Hardison RC: Improvements in the HbVar database of humanhemoglobin variants and thalassemia mutations for population andsequence variation studies. Nucleic Acids Res 2004, 32:D537–D541.
36. Andersen MC, Engstrom PG, Lithwick S, Arenillas D, Eriksson P, Lenhard B,Wasserman WW, Odeberg J: In silico detection of sequence variationsmodifying transcriptional regulation. PLoS Comput Biol 2008, 4:e5.
37. ClinVar [http://www.ncbi.nlm.nih.gov/clinvar/]38. Landrum MJ, Lee JM, Riley GR, Jang W, Rubinstein WS, Church DM, Maglott
DR: ClinVar: public archive of relationships among sequence variationand human phenotype. Nucleic Acids Res 2014, 42:D980–D985.
39. GWAVA data [ftp://ftp.sanger.ac.uk/pub/resources/software/gwava/v1.0/paper_data/]
40. Musunuru K, Strong A, Frank-Kamenetsky M, Lee NE, Ahfeldt T, Sachs KV,Li X, Li H, Kuperwasser N, Ruda VM, Pirruccello JP, Muchmore B, Prokunina-Olsson L, Hall JL, Schadt EE, Morales CR, Lund-Katz S, Phillips MC, Wong J,Cantley W, Racie T, Ejebe KG, Orho-Melander M, Melander O, Koteliansky V,Fitzgerald K, Krauss RM, Cowan CA, Kathiresan S, Rader DJ: From noncodingvariant to phenotype via SORT1 at the 1p13 cholesterol locus. Nature2010, 466:714–719.
41. Kathiresan S, Willer CJ, Peloso GM, Demissie S, Musunuru K, Schadt EE,Kaplan L, Bennett D, Li Y, Tanaka T, Voight BF, Bonnycastle LL, Jackson AU,Crawford G, Surti A, Guiducci C, Burtt NP, Parish S, Clarke R, Zelenika D,Kubalanza KA, Morken MA, Scott LJ, Stringham HM, Galan P, Swift AJ,Kuusisto J, Bergman RN, Sundvall J, Laakso M, et al: Common variants at 30loci contribute to polygenic dyslipidemia. Nat Genet 2009, 41:56–65.
42. Myouzen K, Kochi Y, Shimane K, Fujio K, Okamura T, Okada Y, Suzuki A,Atsumi T, Ito S, Takada K, Mimori A, Ikegawa S, Yamada R, Nakamura Y,Yamamoto K: Regulatory polymorphisms in EGR2 are associated withsusceptibility to systemic lupus erythematosus. Hum Mol Genet 2010,19:2313–2320.
43. Gaulton KJ, Nammo T, Pasquali L, Simon JM, Giresi PG, Fogarty MP, PanhuisTM, Mieczkowski P, Secchi A, Bosco D, Berney T, Montanya E, Mohlke KL,Lieb JD, Ferrer J: A map of open chromatin in human pancreatic islets.Nat Genet 2010, 42:255–259.
44. Sing T, Sander O, Beerenwinkel N, Lengauer T: ROCR: visualizing classifierperformance in R. Bioinformatics 2005, 21:3940–3941.
45. MacIsaac KD, Lo KA, Gordon W, Motola S, Mazor T, Fraenkel E: A quantitativemodel of transcriptional regulation reveals the influence of bindinglocation on expression. PLoS Comput Biol 2010, 6:e1000773.
46. Torkamani A, Schork NJ: Predicting functional regulatory polymorphisms.Bioinformatics 2008, 24:1787–1792.
47. Meader S, Ponting CP, Lunter G: Massive turnover of functional sequence inhuman and other mammalian genomes. Genome Res 2010, 20:1335–1343.
doi:10.1186/s13073-014-0079-1Cite this article as: Ryan et al.: SuRFing the genomics wave: an R packagefor prioritising SNPs by functionality. Genome Medicine 2014 6:79.
Submit your next manuscript to BioMed Centraland take full advantage of:
• Convenient online submission
• Thorough peer review
• No space constraints or color figure charges
• Immediate publication on acceptance
• Inclusion in PubMed, CAS, Scopus and Google Scholar
• Research which is freely available for redistribution
Submit your manuscript at www.biomedcentral.com/submit