socio-economic profile 2014 - kzn treasury · the main focus of this socio-economic profile is on...
TRANSCRIPT

i
UThungulu District Municipality
Socio-Economic Profile 2014

i
TABLE OF CONTENTS 1. Demographic profile………………………………………………………………………………………………… 1 1.1 Introduction ………………………………………………………………………………………………………….. 1
1.2 Population distribution………………………………………………………………………………………………. 1
1.3 Population distribution by age and gender……………………………………………………………………….. 2 2. Global and South African Economic-Outlook…………………………………………………………………. 4 3. KwaZulu-Natal provincial economic structure and performance………………………………………….. 4 4. UThungulu’s economic performance…………………………………………………………………………… 5 5. International trade…………………………………………………………………………………………………… 7 5.1 Imports and exports…………………………………………………………………………………………………. 7
6. Labour markets……………………………………………………………………………………………………… 8 6.1 Employment………………………………………………………………………………………………………….. 8
6.2 Employment by industry……………………………………………………………………………………………..9
6.3 Unemployment………………………………………………………………………………………………………. 9
6.4 Labour remuneration and productivity…………………………………………………………………………….. 11 7. Poverty………………………………………………………………………………………………………………… 12
8. Development indicators……………………………………………………………………………………………. 13 8.1 Human Development Index (HDI)…………………………………………………………………………………. 13
8.2 Income inequality……………………………………………………………………………………………………. 14 9. Education……………………………………………………………………………………………………………... 15 9.1 School and educator: Learner ratio in 2008 and 2012………………………………………………………….. 15
9.2 Literacy rate………………………………………………………………………………………………………….. 16 10. Health………………………………………………………………………………………………………………… 17 10.1 HIV and AIDS……………………………………………………………………………………………………… 17
11. Access to basic services…………………………………………………………………………………………. 18 11.1 Access to sanitation……………………………………………………………………………………………...... 18
11.2 Access to water…………………………………………………………………………………………………….. 19 11.3 Access to electricity………………………………………………………………………………………………... 20 12. Tourism……………………………………………………………………………………………………………… 21 13. Appendix……………………………………………………………………………………………………………. 23 14. References………………………………………………………………………………………………………….. 25

ii
LIST OF TABLES
Table 1: Population size, percentage share of population and density, 2012…………………………………….. 1
Table 2: Provincial GDP-R and Economic Growth Rate – Seasonally Adjusted and Annualized Quarterly,
2012:Q1 to 2014:Q1…………………………………………………………………………………………………….. 5
Table 3: Sector performance analysis of uThungulu in 2001, 2006 and 2012………………………………. …... 6
Table 4: Uthungulu exports, 2001 to 2012 (000s)………………...………………………………………………… 7
Table 5: Uthungulu imports, 2001 to 2012 (000s)………………..………………………………………………….. 7
Table 6: Total trade and trade balance in uThungulu in 2001, 2007 and 2012…………………………………… 8
Table 7.1: Employment in KZN and uThungulu district in 2012……………………………………………………. 8
Table 7.2: uThungulu employment by sector in 2001, 2006 and 2012……………………………………………. 9
Table 8: Poverty level across uThungulu district in 2001, 2006 and 2012…………………………………… ….. 12
Table 9: Learner-Educator Ratio (LER) and Learner-School Ratio (LSR) by districts in 2008 and 2012……… 16
Table 10: HIV positive and AIDS deaths estimates in 2001 and 2012…………………………………………….. 18
Table 11: Households access to sanitation by toilet facility in 2001 and 2012……………………………………. 18
Table 12: Access to piped water in KZN and uThungulu in 2001 and 2012…………..………………………….. 20
Table 13: Tourism spending in KZN in 2001 and 2012……………………………………………………………… 21
Table 14: Tourism spending as a percentage of GDP in 2001, 2006 and 2012…………………………………. 22
LIST OF FIGURES
Figure 1a: Percentage distribution of uThungulu district population by age and gender, 2001……….………… 2
Figure 1b: Percentage distribution of uThungulu district population by age and gender, 2012……….………… 3
Figure 2: GDP-R, uThungulu district and local municipalities, 2012……………………………………………….. 6
Figure 3.1: uThungulu district’s unemployment rate (official definition), 2012…………………….……………… 10
Figure 3.2: uThungulu district’s unemployment rate (official definition) by gender, 2012………………………. 10
Figure 4: uThungulu remuneration and productivity trend analysis, 2001 to 2012………...…………………….. 11
Figure 5: Human Development Index in KZN and uThungulu district municipality in 2001 and 2012………….. 13
Figure 6: Gini coefficient in KZN and uThungulu district municipality in 2001 and 2012………………………… 14
Figure 7: Literacy rates in KZN and uThungulu, 2001 to 2012…………...………………………………………… 17
Figure 8: Percentage share of households in KZN and uThungulu with electricity connection in 2001 and
2012……………………………………………………………………………………………………………………….. 20

iii
APPENDIX
Table A1: National population size, size of the area and population density by province, 2012……………….. 23
Figure A1: Percentage share of population size by province, 2012………………………………………………... 23
Figure A2: Percentage contribution to KZN Real GDP by district municipalities, 2012………………………… 24
LIST OF ACRONYMS
AFSA Aids Foundation South Africa
AIDS Acquired Immunodeficiency Syndrome
BRICS Brazil, Russia, India, China and South Africa
DM District Municipality
EAP Economically Active Population
GDP Gross Domestic Product
GDP-R Gross Domestic Product by Region
GVA Gross Value Added
HDI Human Development Index
HIV Human Immunodeficiency Virus
IMF Internationally Monetary Fund
KZN KwaZulu-Natal
LER Learner-Educator Ratio
LM Local Municipality
LSR Learner-School Ratio
NDP National Development Plan
QLFS Quarterly Labour Force Survey
RDP Reconstruction and Development Plan
SA South African
SARB South African Reserve Bank
Stats SA Statistics South Africa
UNICEF United Nations Children’s Fund

iv
UThungulu is one of the eleven provincial district municipalities in KwaZulu-Natal (KZN). The district is located on the
north-eastern region of KZN province on the eastern sea-board of South Africa. The district is made up of six local
municipalities, namely uMfolozi, uMhlathuze, Ntambanana, uMlalazi, Mthonjaneni and Nkandla. The neighbouring
districts are uMkhanyakude, Zululand, Umzinyathi and iLembe district municipality.
The district has a population of 909 760 people. The total geographical area of the municipality is 8213 square
kilometres (km2), thus contributing a population density of 110, 8 per km2.
The agricultural sector is dual economy, consisting of commercial agriculture on one hand and traditional agriculture
on the other. The significant economic centers that shape the district are Richards Bay, whose harbour facilities are
world class and have been the prime reason for large-scale industrialisation in the district, and Empangeni, an
industrial and service centre whose higher-order services attract people from many rural settlements.

1
1. Demographic profile
1.1 Introduction
The link between population growth and economic growth has been a long debate among economists. Population
growth is supposed to decrease the gross domestic product (GDP) per capita because output growth rate cannot
keep pace with population growth (Malthus, 1826). This is due to limited availability of natural resources in the
economy. In addition, Solow (1956) analysed the impact of population growth rate on output into two aspects: firstly,
an increase in the population rate increases the amount of labour and thus increases output. Secondly, it decreases
physical capital per worker, thus resulting in a decrease in productivity. Therefore it is of utmost importance to look at
the population dynamics and its effect on the economy with greater emphasis on uThungulu district municipality
1.2 Population distribution
The main focus of this socio-economic profile is on uThungulu district municipality in KZN. South Africa (SA) is a
diverse nation, with over 50 million people and a wide variety of cultures, languages and religious beliefs. According
to the annual mid-year population estimates by Statistics South Africa (Stats SA, 2013), the country’s population was
estimated at 52 981 991. The province of KZN is home to an estimated 10.3 million people which accounts for an
estimated 19.8 per cent of the South African population and is the second most populated province after Gauteng 12
065 885 (24 per cent). UThungulu district municipality is located on the north-eastern region of KZN on the eastern
sea-board of SA. The district is made up of six local municipalities, which are Mfolozi, uMhlathuze, Ntambanana,
uMlalazi, Mthonjaneni and Nkandla. Table 1 shows the population size, area and population density of KZN and
uThungulu district municipality in 2012.
Table 1: Population size, percentage share of population and density, 2012
Source: Global Insight, 2014
The estimated population of uThungulu district was 909 760 in 2012, which accounts for 8.8 per cent of KZN
population. Table 1 indicates that uMhlathuze had the highest population in the uThungulu district with an estimated
population size of 338 848, which accounts for 3.3 percentage share of KZN population in 2012. This was followed by
uMlalazi with the population of 213 129 (2.1 per cent of KZN population). Mfolozi is the third populous local
Population size
% share of KZN
population
% share of
uThungulu
population Area in square KM
% share of KZN
Area Population density
KwaZulu-Natal 10 347 260 100 93 378 100 110.8
uThungulu 909 760 8.8 100 8 213 8.8 110.8
Mfolozi 124 475 1.2 13.7 1 208 1.3 103.1
uMhlathuze 338 848 3.3 37.2 789 0.8 429.3
Ntambanana 73 168 0.7 8.0 1 084 1.2 67.5
uMlalazi 213 129 2.1 23.4 2 214 2.4 96.3
Mthonjaneni 47 515 0.5 5.2 1 087 1.2 43.7
Nkandla 112 625 1.1 12.4 1 830 2.0 61.5
2
municipality with the population of 124 475. Nkandla trails Mfolozi with the population of 112 625, which is followed
by Ntambanana with 73 168 people and lastly Mthonjaneni with 47 515 people (Table 1).
1.3 Population distribution by age and gender
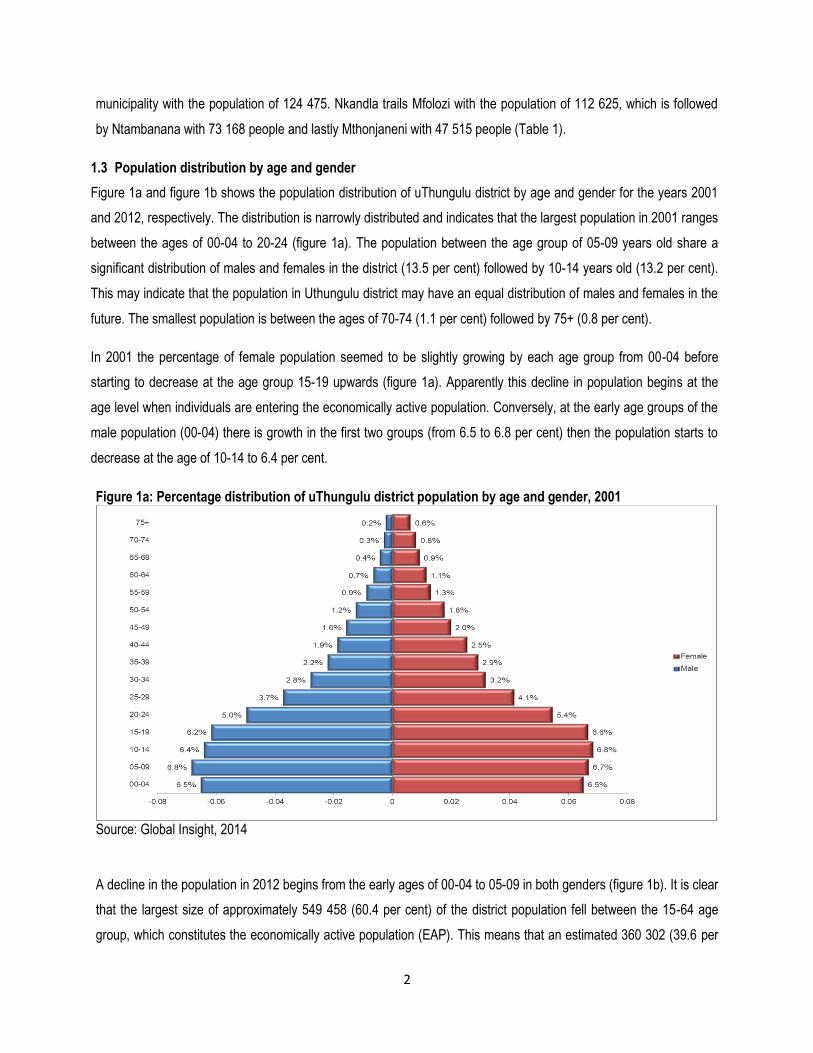
Figure 1a and figure 1b shows the population distribution of uThungulu district by age and gender for the years 2001
and 2012, respectively. The distribution is narrowly distributed and indicates that the largest population in 2001 ranges
between the ages of 00-04 to 20-24 (figure 1a). The population between the age group of 05-09 years old share a
significant distribution of males and females in the district (13.5 per cent) followed by 10-14 years old (13.2 per cent).
This may indicate that the population in Uthungulu district may have an equal distribution of males and females in the
future. The smallest population is between the ages of 70-74 (1.1 per cent) followed by 75+ (0.8 per cent).
In 2001 the percentage of female population seemed to be slightly growing by each age group from 00-04 before
starting to decrease at the age group 15-19 upwards (figure 1a). Apparently this decline in population begins at the
age level when individuals are entering the economically active population. Conversely, at the early age groups of the
male population (00-04) there is growth in the first two groups (from 6.5 to 6.8 per cent) then the population starts to
decrease at the age of 10-14 to 6.4 per cent.
Figure 1a: Percentage distribution of uThungulu district population by age and gender, 2001
Source: Global Insight, 2014
A decline in the population in 2012 begins from the early ages of 00-04 to 05-09 in both genders (figure 1b). It is clear
that the largest size of approximately 549 458 (60.4 per cent) of the district population fell between the 15-64 age
group, which constitutes the economically active population (EAP). This means that an estimated 360 302 (39.6 per

3
cent) of the district’s population is distributed under the age of 15 and those who are 64 years and above. This
translates to a high dependency ratio1 of 65.4 per cent.
Developing countries tend to have higher dependency ratios than developed nations, and children account for a
larger fraction of dependents in developing countries. Dependency ratios are key influences on economic growth.
Nations with high dependency ratios spend large shares of their resources taking care of dependents, while those
with lower ratios are able to devote more resources to investment in physical capital, technological progress, and
education.
A higher dependency ratio is likely to reduce productivity growth. A growth in the non-productive population will
diminish productive capacity and could lead to a lower long run trend rate of economic growth. If the government fails
to tackle issues emanating from a higher dependency ratio, there could be increased pressures placed on
government finances, leading to higher borrowing or higher taxes which impact on government fiscus. Thus, it is of
great importance to use this tool with caution or maybe with other instruments.
Figure 1b: Percentage distribution of uThungulu district population by age and gender, 2012
Global Insight, 2014
1 Dependency Ratio= (number of people under 15 years) + (number of people aged 65 and over)/ (number of people
between 15 and 64) x 100 = (411 212/ 498 548) x 100= 82.5 per cent. The dependency ratio is an age population ratio of those not in the labour force.

4
2. Global and South African Economic-Outlook
According to the International Monetary Fund (IMF, 2014), the global economic recovery remains uncertain and
uneven. It gained strength in the first quarter of 2014 and is expected to improve further in 2014 and 2015. Much of
the momentum gained are from advanced economies. The global gross domestic product (GDP) growth is estimated
to have decelerated to 3 per cent in 2013, slightly down from 3.2 per cent recorded in 2012. The world output is
however expected to increase at 3.7 per cent in 2014 before rising to 3.9 per cent in 2015 (IMF, 2014). The global
economic developments since the 2009 world recession indicate that advanced economies have gained some speed
in recovery, while the emerging market economies, particularly China and India, have slowed down (IMF, 2014).
The South African economy is estimated to have grown by 2 per cent in 2013. The tepid growth rate for 2013 is far
less than the 2.5 per cent recorded in 2012. However, it is projected to gain momentum and reach 2.8 per cent in
2014 and 3.3 per cent in 2015 (IMF, 2014 and Stats SA, 2014). The national economic outlook is far below the
estimations for other emerging market economies in 2013, particularly the BRICS2 countries, with the exception of
Russia at 1.5 per cent.
According to the IMF (2014) emerging market economies continue to account for the bulk of global growth. Economic
growth in emerging market economies is estimated to reach 5.1 per cent and 5.4 per cent in 2014 and 2015
respectively. Growth prospects in emerging market economies are constrained by the slow implementation of
structural reforms, high inflation, fiscal imbalances and tight financial conditions. The Sub-Saharan African economy
is expected to accelerate to a growth rate of 6.1 per cent in 2014. The moderate growth projection is backed by
continuing investment in infrastructure and productive capacity. Following the global trends, the South African (SA)
economy is estimated to have grown by 1.9 per cent in 2013. This is projected to gain momentum and reach 2.8 per
cent in 2014 and 3.3 per cent in 2015.
3. KwaZulu-Natal Provincial Economic Structure and Performance
KZN is one of the key provinces in the South African economy in terms of GDP contribution. The estimated real GDP
generated by the province amounted to approximately R323.6 billion in 2012, making it the second largest contributor
to the national output (16.6 percent) after Gauteng with 36 percent (KZN Provincial Treasury, 2013). Figure A2 shows
the provincial GDP contributions by KZN Districts for 2012.
Table 2 shows the sectors and their respective percentage contribution to the provincial GDP-R and economic
growth rate in terms of seasonally adjusted and annualized quarterly basis from 2012:Q1 to 2014:Q1. The provincial
economy indicated a seasonally adjusted and annualized quarterly increase of 2 per cent in the first quarter of 2014,
2The BRICS countries are Brazil, Russia, India, China and South Africa.

5
compared to the adjusted 1.8 per cent recorded in the fourth quarter of 2013. It is clear that the first quarter of 2014
annual growth rate shows a marginal improvement over the fourth quarter 2013.
The annualized growth rates also indicated that all three sectors, namely the primary, secondary and tertiary sector
continued to record positive growth rates at 1.9 per cent, 2.7 per cent and 1.9 per cent respectively in the first quarter
of 2014. All the sub-sectors in the secondary and tertiary sectors recorded positive growth. Mining and quarrying sub
sector declined from positive growth of 6.7 per cent to negative 3.7 per cent.
Table 2: Provincial GDP-R and Economic Growth Rate-Seasonally Adjusted and Annualized Quarterly, 2012:Q1 to 2014:Q1
Source: KZN Treasury Economic Model, 2014 4. UThungulu’s Economic Performance
Appendix figure A2 shows the percentage contribution to KZN real GDP by district municipalities in 2012. Among all
eleven district municipalities, eThekwini is the largest contributor to the KZN GDP at 65.7 per cent followed by
uThungulu at 8.3 per cent and Umgungundlovu at 8.0 per cent.
Figure 2 represents the estimated real Gross Domestic Product for uThungulu district municipality and its local
municipalities for the year 2012. Uthungulu district recorded an estimated GDP-R of R26.8 billion in 2012. Among all
the six local municipalities, the largest contributor to the district’s GDP-R was uMhlathuze at R11.3 billion (42.1 per
cent) trailed by Mfolozi with contribution of R8.2 billion (30.6 per cent). Mthonjaneni local municipality was the lowest
contributor to uThungulu’s GDP at R239.4 million (0.9 per cent).
2014
2012q1 2012q2 2012q3 2012q4 2013q1 2013q2 2013q3 2013q4 2013q1
Primary Industries -3.36 1.51 4.65 7.08 5.60 1.63 2.10 2.72 1.87
Agriculture, forestry and fishing -3.36 1.16 4.51 8.10 6.40 3.34 2.47 1.64 3.41
Mining and quarrying -3.38 2.71 5.17 3.49 2.79 -4.20 0.81 6.68 -3.72
Secondary Industries 1.00 1.69 2.14 2.22 -0.73 2.00 0.43 1.85 2.73
Manufacturing 1.18 2.17 2.56 2.60 -1.03 2.02 0.07 1.92 2.85
Electricity, gas and water -2.26 -3.77 -3.18 -4.00 -2.79 -0.27 0.54 -0.25 0.47
Construction 1.85 1.87 2.69 3.67 2.82 3.35 3.04 2.66 3.24
Tertiary industries 3.85 3.30 2.74 2.34 2.31 2.32 2.18 1.93 1.89
Wholesale & retail trade; hotels & restaurants 4.76 4.23 3.39 2.62 2.87 2.91 2.70 2.85 2.84
Transport , storage and communication 3.00 2.58 2.42 2.25 1.76 1.54 1.84 1.73 1.62
Finance, real estate and business services 4.69 3.96 2.71 2.08 2.25 2.64 2.64 2.45 2.13
Personal services 2.22 2.17 2.30 2.34 2.27 2.12 1.93 1.65 1.61
General government services 3.16 2.50 2.61 2.54 2.39 2.08 1.32 0.42 0.84
All industries at basic prices 2.64 2.76 2.68 2.57 1.67 2.20 1.71 1.96 2.11
Taxes less subsidies on products 4.98 4.54 3.89 2.71 0.27 0.48 0.65 0.80 0.53
KZN - GDPR at constant 2005 prices 2.89 2.95 2.81 2.58 1.52 2.01 1.59 1.83 1.95
Provincial Industry2012 2013

6
Figure 2: GDP-R, uThungulu District and Local Municipalities, 2012
Global Insight, 2014
Table 3 shows uThungulu’s contribution to GDP by sectors in 2001, 2006 and 2012. It is indicated in the table that
the tertiary sector contributed a larger portion of 47.5 per cent to uThungulu’s GDP in 2012. This large contribution by
the tertiary sector primarily emanate from the community service (15.6 per cent) followed by transport at 11.9 per
cent and finance at 10.8 per cent. The larger contribution by the community service should be seen as a cause for
concern for the policy makers.
Table 3 further shows that the secondary sector recorded a decrease from 43.2 per cent in 2001 to 40.1 per cent in
2006 and 31 per cent in 2012, thus it is not adequately adding value in the economy of the district and the economy
at large. It is further worth noting that primary sector recorded marginal increase from 18.3 per cent in 2001 to 19.2
per cent in 2006 and 21.5 per cent in 2012.
Table 3: Sector Performance Analysis of uThungulu in 2001, 2006 and 2012
Source: Global Insight, 2014
26,837,830
8,220,370
11,294,204
3,233,106 3,536,917
239,413 313,820
0
5,000,000
10,000,000
15,000,000
20,000,000
25,000,000
30,000,000
Mfolozi, 30.6
uMhlathuze, 42.1
Ntambanana, 12.0
uMlalazi, 13.2
Mthonjaneni, 0.9 Nkandla, 1.2
2001 2006 2012
Primary sector 18.3% 19.2% 21.5%
Agriculture 6.2% 4.8% 5.2%
Mining 12.1% 14.4% 16.3%
Secondary sector 43.2% 40.1% 31.0%
Manufacturing 39.6% 37.0% 27.3%
Electricity 1.1% 0.9% 1.1%
Construction 2.5% 2.1% 2.6%
Tertiary sector 38.6% 40.8% 47.5%
Trade 7.4% 7.1% 9.2%
Transport 10.7% 10.9% 11.9%
Finance 9.1% 10.8% 10.8%
Community services 11.4% 12.0% 15.6%

7
5. International trade
5.1 Imports and exports
Table 4 shows the contribution by uThungulu district and its local municipalities in total rand values of exports in the
periods 2001 to 2012. It is evident from the table that exports in uThungulu district recorded growth of 285.4 per cent
from an estimated value of R9.2 billion in 2001 to R35.4 billion in 20123. The district’s proportion of exports to
provincial exports in KZN was 37.6 per cent in 2012. Among all six local municipalities, uMhlathuze contributed R35.2
billion of the districts exports in 2012, the highest compared to all other local municipalities, followed by uMlalazi at
R162.4 million in the same period. Ntambanana and Nkandla both made insignificant contribution in the period under
review.
Table 4: UThungulu Exports, 2001 to 2012 (000s)
Source: Global Insight, 2014
Table 5 shows the contribution by uThungulu district and its local municipalities towards the total rand value of
imports in the period 2001 to 2012. In the year 2012 uThungulu district imported goods estimated to the value of R8.8
billion. UMhlathuze was the largest importer with imports estimated at R8.8 billion in 2012 trailed by Mfolozi (R36
million) and uMlalazi (R 11.6 million).
Table 5: UThungulu Imports, 2001 to 2012 (000s)
Source: Global Insight, 2014
3 Note that exports from uThungulu also come from other regions.
2001 2002 2003 2004 2005 2006 2007 2008 2009 2010 2011 2012
Uthungulu 9 173 131 21 955 406 14 567 094 14 663 047 14 920 058 16 478 591 20 727 752 20 896 356 20 061 389 24 136 175 30 412 934 35 354 152
Mfolozi 987 36 20 13 193 3 354 3 648 912 2 305 5 935 30 249 8 320 4 455
uMhlathuze 9 150 313 21 923 178 14 547 479 14 631 514 14 861 100 16 269 540 20 559 194 20 256 971 19 858 587 23 917 438 30 272 269 35 179 276
Ntambanana 0 0 0 0 0 0 0 0 0 0 0 0
uMlalazi 17 980 27 181 15 927 14 645 44 568 195 147 164 158 629 377 188 071 180 391 126 682 162 444
Mthonjaneni 3 851 5 011 3 668 3 694 11 036 10 255 3 488 7 703 8 796 8 097 5 664 7 977
Nkandla 0 0 0 0 0 0 0 0 0 0 0 0
2001 2002 2003 2004 2005 2006 2007 2008 2009 2010 2011 2012
Uthungulu 1 030 276 4 859 179 5 147 157 4 478 312 4 481 262 6 546 410 7 780 684 9 034 856 5 861 985 6 862 923 9 356 920 8 838 871
Mfolozi 258 310 823 2 866 9 716 5 174 2 732 5 209 12 299 14 057 20 218 36 020
uMhlathuze 1 028 928 4 858 198 5 144 190 4 473 184 4 470 201 6 537 815 7 776 350 9 025 434 5 842 187 6 840 844 9 327 105 8 790 821
Ntambanana 0 0 0 0 0 0 0 0 0 0 0 0
uMlalazi 1 032 667 2 102 2 263 1 274 3 195 1 210 2 801 6 416 7 610 8 911 11 568
Mthonjaneni 57 4 43 0 71 226 391 1 412 1 083 412 687 462
Nkandla 0 0 0 0 0 0 0 0 0 0 0 0

8
Table 6 shows the trade balance and total trade for uThungulu district for the years 2001, 2007 and 2012. It can be
realised from the table that the district had positive trade balance (surplus) for all the years under review. The trade
balance increased from R8.1 billion in 2001 to 13 billion in 2007 and continued to increase to R26.5 billion in 2012.
Total trade in the district followed the same trend by increasing from R10.2 billion to 28.5 billion and 44.2 billion in the
same period. Both exports and imports experienced growth in all the years under review.
Table 6: Total trade and trade balance in uThungulu in 2001, 2007 and 2012 (000s)
Source: Global Insight, 2014 6. Labour markets
South Africa's labour market had changed since 1994, with an emphasis on strategies that eliminate labour
inequalities of the past and improve general working conditions for all South Africans. With an unemployment rate of
around 25.2 per cent for the first quarter of 2014, South Africa's biggest challenge is still the creation of jobs
(Quarterly Labour Force Survey Stats SA, 2014). The global recession of 2008 hit the local labour market hard thus
resulting in more than a million jobs that were lost by 2010. However, the market is gradually recovering and this is
expected to help employment figures.
6.1 Employment
Table 7.1 is an illustration of the number of people who are formally and informally employed in KZN and uThungulu
district in 2012. It is evident from the table that the district’s percentage share of the provincial formal employment in
2012 was 6.7 per cent in contrast to 6.8 per cent in the informal sector. Among the six local municipalities,
uMhlathuze had the highest share of both the district formal employment at 40.3 per cent and informal employment at
40.2 per cent. Mthonjaneni local municipality had the lowest employment contribution for both formal and informal at
1.9 per cent and 2.1 per cent respectively.
Table 7.1: Employment in KZN and uThungulu district in 2012
Source: Global Insight, 2014
2001 2007 2012
Exports 9 173 131 20 727 752 35 354 152
Imports 1 030 276 7 780 684 8 838 871
Trade Balance 8 142 855 12 947 068 26 515 281
Total Trade 10 203 407 28 508 436 44 193 022
Formal
Employment
Informal
Employment
Total
Employment
% Share of KZN's
Formal
Employment
% Share of
KZN's Informal
Employment
% Share of the
District's Formal
Employment
% Share of the
District's Informal
Employment
KwaZulu-Natal 1 511 493 550 341 2 061 834 100 100
Uthungulu 101 946 37 199 139 144 6.7 6.8 100 100
Mfolozi 25 024 8 999 34 023 1.7 1.6 24.5 24.2
uMhlathuze 41 038 14 965 56 003 2.7 2.7 40.3 40.2
Ntambanana 10 772 3 946 14 718 0.7 0.7 10.6 10.6
uMlalazi 19 830 7 322 27 152 1.3 1.3 19.5 19.7
Mthonjaneni 1 906 792 2 697 0.1 0.1 1.9 2.1
Nkandla 3 377 1 174 4 552 0.2 0.2 3.3 3.2

9
6.2 Employment by industry
Table 7.2 indicates employment by sector in uThungulu district municipality. It can be seen from the table that in
2012 the tertiary sector was the highest employer with an estimated 62 356 number of people employed (61.2 per
cent). This was driven mainly by an increase of 27 400 in the community service industry employing 26.9 per cent
trailed by finance and households both employing 9.4 per cent of people each. It is worrying that community service
was the main driver in increasing employment in the district as government is supposed to create environment for the
private sector to create jobs.
Table 7.2: uThungulu employment by sector in 2001, 2006 and 2012
Source: Global Insight, 2014 It is further worth noting that the secondary sector experienced a decrease in employment in uThungulu, mainly in
the manufacturing sector from 25 per cent to 24.5 per cent and 20.2 per cent for the periods 2002, 2008 and 2012,
respectively. Among the three sectors in the district, the primary sector appeared to be the least employer at 18.7 per
cent in 2012.
6.3 Unemployment
High levels of unemployment, poverty and income inequality are some of the major challenges hampering the
economic performance of a country. Figure 3.1 is a representation of the level of unemployment in KZN and
uThungulu district municipality in 2012.
Number of
People
Employed
% of People
Employed
Number of
People
Employed
% of People
Employed
Number of
People
Employed
% of People
Employed
Agriculture 12 653 15.4 10 800 11.7 11 336 11.1
Mining 2 517 3.1 5 686 6.2 7 701 7.6
Primary Sector 15 170 18.4 16 486 17.9 19 037 18.7
Manufacturing 16 854 20.5 17 044 18.5 15 820 15.5
Electricity 581 0.7 580 0.6 625 0.6
Construction 3 130 3.8 4 923 5.3 4 107 4.0
Secondary Sector 20 565 25.0 22 547 24.5 20 553 20.2
Trade 7 577 9.2 9 952 10.8 9 117 8.9
Transport 6 260 7.6 6 131 6.7 6 678 6.6
Finance 6 527 7.9 8 633 9.4 9 623 9.4
Community services 18 411 22.4 20 262 22.0 27 400 26.9
Households 7 768 9.4 8 127 8.8 9 538 9.4
Tertiary Sector 46 544 56.6 53 105 57.6 62 356 61.2
2002 2006 2012

10
Figure 3.1: uThungulu district's unemployment rate (official definition), 2012
Source: Global Insight, 2014 The province of KZN experienced 22 per cent unemployment rate while Uthungulu district municipality recorded an
estimated 20.9 per cent in 2012. Among all six local municipalities in the district, Ntambanana had the highest
unemployment rate at 30.4 per cent followed by Nkandla with 27.9 per cent. The lowest unemployment rate was
experienced by Mthonjaneni local municipality at 1.8 per cent.
Figure 3.2 shows the comparison of the level of unemployment rate by gender in 2012. KZN recorded 22.3 per cent
unemployment rate for males and 21.6 per cent of female counterparts. In the same period, uThungulu district
recorded unemployment rate of 21 per cent and 20.7 per cent for male and female population respectively in the
same period. Among the six local municipalities, Nkandla had the highest unemployment rate for males at 40.9 per
cent trailed by Ntambanana at 30.5 per cent. Ntambanana had the highest unemployment rate for females at 30.4
per cent followed by Mfolozi (25.4 per cent).
Figure 3.2: uThungulu district's unemployment rate (official definition) by gender, 2012
Source: Global Insight, 2014
22.020.9
22.8
16.2
30.4
25.9
1.8
27.9
0.0
5.0
10.0
15.0
20.0
25.0
30.0
35.0
KZN Uthungulu Mfolozi uMhlathuze Ntambanana uMlalazi Mthonjaneni Nkandla

11
6.4 Labour remuneration and productivity
There is currently an important general debate in South Africa among employer organisations, labour unions and
politicians on the size and fairness of perceived employee remuneration gaps among the different employment levels
in the organisations (Van Zyl, 2010). Labour unions, in particular, are of the opinion that these remuneration gaps are
expanding and that the situation constitutes a major threat to job creation and the fair distribution of income in the
workplace and the economy as a whole. Employer organisations, argue that employee remuneration gaps are the
result of the shortages of high skilled employees in the workplace and differences in labour productivity levels
between the different employee segments.
Labour productivity4 is defined as rate of output per unit of labour. According to Pilat (1996), labour productivity is the
most important determinant of a country’s income level. Slow productivity growth limits the rate at which real incomes
can improve and also increases the probability of conflicting demands concerning the distribution of income. Van Zyl
(2010) argues for the existence of a positive link between employee remuneration gaps and labour productivity, in
that the greater the employee remuneration gap, the higher the level of labour productivity.
Figure 4: UThungulu remuneration and productivity trend analysis, 2001 to 2012
Source: Global Insight, 2014
Figure 4 shows the gap between uThungulu’s labour productivity and labour remuneration for the period 2001 to
2012. It can be seen from the figure that labour remuneration had been above labour productivity, while, in some
years productivity of labour was below zero. The negative productivity levels indicate a decrease in output. When
remuneration is above the productivity levels, this indicate that labour is being compensated more than what they
produced.
4 http://www.businessdictionary.com

12
The highest gap was experienced in 2006 with labour remuneration at 13.1 per cent while labour productivity was at
0.3 per cent. A positive relationship for these two variables should have been indicated as an ideal situation since the
high level of labour productivity should be remunerated accordingly. The years 2001, 2003, 2004, 2009 and 2010
show negative productivity levels with remuneration rising faster than productivity which is a major challenge in the
district and South Africa as a whole.
Given these huge discrepancy between labour productivity and remuneration there is therefore a need for policy
makers and other stakeholders like business, labour and government to arrive at a solution for this phenomenon.
7. Poverty
Poverty5 is a condition where people's basic needs for food, clothing, and shelter are not being met. It is a key
development challenge in social, economic and political terms; not only in South Africa but throughout the developing
world. In post-apartheid South Africa, fighting the legacy of poverty and under-development has always been a
central theme of government. This was covered in the Reconstruction and Development Plan (RDP) of 1994 and
repeated in the National Development Plan (NDP) published in 2012. Table 8 is an illustration of people living in
poverty in KZN and uThungulu district for the periods 2001, 2006 and 2012.
Table 8: Poverty level across uThungulu district in 2001, 2006 and 2012
Source: Global Insight, 2014 It is evident from table 8 that in KZN, approximately 5.2 million people were living in poverty in 2001 as compared to
4.3 million people in 2012. This indicates a percentage decrease from 55 per cent in 2001 to 42.5 per cent in 2012.
As for uThungulu district 525 576 people were living in poverty in 2001 as compared to 414 160 people in 2012.
UThungulu district had a high poverty rate in 2001 (60 per cent) but decreased to 45.5 per cent in 2012 which is
higher than that of the province. A downward trend is shown by all the local municipalities with regards to people
living in poverty in 2001, 2006 and 2012. This could have been the results of many state social intervention programs
to reduce the impact of poverty.
5 http://www.businessdictionary.com
Number of
people living in
poverty
% Share of
people living in
poverty
Number of
people living in
poverty
% Share of
people living in
poverty
Number of
people living in
poverty
% Share of
people living in
poverty
KwaZulu-Natal 5 245 662 55.0 4 928 804 49.8 4 393 563 42.5
Uthungulu 525 576 60.0 483 765 53.4 414 160 45.5
Mfolozi 67 303 63.9 65 780 59.3 65 227 52.4
uMhlathuze 119 230 41.3 134 425 40.3 117 602 34.7
Ntambanana 61 565 73.9 53 770 65.5 42 577 58.2
uMlalazi 143 946 66.2 120 860 59.0 106 733 50.1
Mthonjaneni 32 318 65.2 30 678 57.9 23 226 48.9
Nkandla 101 215 77.4 78 252 64.3 58 795 52.2
2001 2006 2012

13
8. Development indicators
The four main development indicators which KZN and uThungulu district municipality uses to track progress are
highlighted. These indicators illustrate where improvements have been made and which areas still need attention.
The four main development indicators are Gini coefficient, the Human Development Index (HDI), and functional
literacy rates.
8.1 Human Development Index (HDI)
Human Development Index6 (HDI) is a comparative measure of life expectancy, literacy, education, and standards of
living for countries worldwide. It is a standard means of measuring well-being. It is used to distinguish whether the
country is a developed, developing, or underdeveloped, and also to measure the impact of economic policies on
people’s quality of life. The HDI is made up of three indexes: life expectancy at birth, standard of living (looks at the
income for basic living in accordance with purchasing power parity of income) and literacy levels (which look at
adults’ literacy as well as enrolment). The HDI7 ranges between 0 and 1, with 0 indicating no human development
and 1 indicating a high level of human development.
Figure 5: Human Development Index in KZN and uThungulu district municipality in 2001 and 2012
Source: Global Insight, 2014
6 http://en.wikipedia.org/wiki/List_of_African_countries_by_Human_Development_Index
7 A region with an HDI value of 0.80 or more is classified as having high human development status; between 0.50 to
0.80 is classified as having medium human capital development and between 0.5 and 0.0 is classified as having low
levels of development.

14
Figure 5 represents the average HDI for KZN and uThungulu district in 2001 and 2012. It is depicted that KZN in
2012 had HDI of 0.56, which is higher than the HDI of 0.50 experienced in 2001. This implies that the province needs
to do more in improving the level of education, health care and general standard of living in order to improve the level
of development within the province.
The HDI for uThungulu district increased from a low 0.46 in 2001 to 0.53 in 2012 which is still below that of the
province and the district is classified as having medium human development. Among the six local municipalities,
uMhlathuze had the highest HDI at 0.61 which is also above that of the province and that of the district in 2012.
UMhlathuze, Ntambanana, uMlalazi, Mthonjaneni and Nkandla had HDI’s less than 0.50, thus demonstrating an
overall low human development for the district in 2012 (Figure 5).
8.2 Income inequality
Despite the end of apartheid in 1994, South Africa’s income inequality remains one of the highest in the world. This is
one of the biggest challenges facing the country and has a negative impact on the country's economic development
and business environment. This is a reflection of the unequal distribution of resources and opportunities, thereby
leading to a higher rate of poverty. Excessive income inequality8 negatively affects household’s quality of life (World
Bank, 2012). Pro poor policies are therefore essential which are aimed at bridging the gap between the rich and the
poor.
Figure 6: Gini coefficient in KZN and uThungulu district municipality in 2001 and 2012
Source: Global Insight, 2014
8 Income inequality is often presented as the percentage of income to a percentage of population.

15
Figure 6 shows the Gini Coefficient9 for KZN and uThungulu district in 2001 and 2012. It is indicated that KZN’s Gini
coefficient slightly decreased from 0.65 in 2001 to 0.62 in 2012 which indicate that almost one person receives all the
income in the economy. This elaborates how high the level of income inequality in the province of KZN is. UThungulu
district had a similar Gini coefficient as the province at 0.65 in 2001. In 2012 the districts recorded a Gini coefficient of
0.61 which was high as well but marginally lower than that of the province. Among the six local municipalities,
uMhlathuze had the highest Gini coefficient in 2012 at 0.62, while Ntambanana had the lowest of them all at 0.47.
These results show that uThungulu had population with unequal income, which is expected given the level of poverty
in the district. Reducing inequality substantially is currently unlikely without a massive improvement in human capital.
Thus, the need for implementation of incentives to boost economic participation for all households in the province
and the district is essential.
9. Education
All South Africans have the right to basic education, including adult basic education and further education. According
to South Africa’s Bill of Rights, the state has an obligation, through reasonable measures, to progressively make
education available and accessible. South Africa has one of the highest rates of public investment in education in the
world. The province of KZN allocated R39.4 billion in 2014 for the Department of Education which constitutes 40.8 per
cent of the total KZN budget (KZN Provincial Treasury, 2014). Although challenges still remain in the education
department but government is prepared to prioritise education in its allocation.
9.1 School and educator: Learner ratio 2008 and 2012
The learner to educator ratio10 (LER) is the average number of learners per educator at a specific level of education
in a given school year. The learner to school ratio (LSR) is the average number of learners per school at a specific
level of education in a given school year.
Table 9 is the representation of the number of learners, educators and schools in the ordinary sector across the
KwaZulu-Natal districts for the year 2008 and 2012. It is evident that the province recorded an increase in the number
of learners, educators and schools from 2008 to 2012. It is also indicated that the learner-educator ratio decreased
from 31.9 in 2008 to 30.3 in 2012. This is the indication that each educator is able to give personal attention to
learners and help them along in the learning process. This is in accordance with the ideal LER which is 30 per class.
9 The Gini Coefficient is the standard economic measure of income inequality varying between 0 (perfect equality)
and 1 (perfect inequality). Available on: http://blog.euromonitor.com/2012/06/south-africa-the-most-unequal-income-
distribution-in-the-world.html
10 http://www.childrencount.ci.org.za

16
It is further worth noting that the learner to school ratio also recorded marginal decrease form 467 in 2008 to 466 in
2012. This indicates that the learning environment and the resources are available to aid the learning process in each
school and are being used by fewer learners and they are more available to each learner in the school. These
changes to the ratios are so minor that significant changes based on the ratios may not be clear.
Table 9: Leaner-Educator Ratio (LER) and Leaner-School Ratio (LSR) by districts in 2008 and 2012
Source: Department of Basic Education, 2013
UThungulu district followed the same positive trends as the KZN province with regards to the number of learners
from 290 880 in 2008 to 302 057 in 2012 (an increase of 3.8 per cent). In the year 2008, there were 637 schools
within the district, since then the number of schools had increased to 676 in 2012. These results impacted positively
to the LER ratio (decreased from 32.8 to 31.4) and the increase in the number of learners, educators and schools is
good for the district.
9.2 Literacy rate
Literacy rate11 is the percentage of the population age 15 and above who can, with understanding, read and writes a
short, simple statement on their everyday life. Generally, ‘literacy rate’ also includes ‘numeracy rate’, which is the
ability to make simple arithmetic calculations. Low levels of literacy and education in general, can hinder the
11 Literacy rate is calculated by dividing the number of literates aged 15 years and over by the corresponding age group population and multiplying the result by 100.
Available on:http://www.indexmundi.com/facts/indicators/SE.ADT.LITR.ZS/compare?country=za
No. of
learners
No. of
educators
No. of
schools LER LSR
No. of
learners
No. of
educators
No. of
schools LER LSR
eThekwini 672 100 4 866 1 015 29.4 662.2 703 386 24 767 1 055 28.4 666.7
Ugu 215 485 4 913 471 31.9 457.5 219 293 7 257 508 30.2 431.7
uMgungundlovu 233 677 8 855 528 29.8 442.6 244 219 8 674 549 28.2 444.8
uThukela 206 167 6 302 455 32.6 453.1 209 117 6 718 458 31.1 456.6
uMzinyathi 183 822 8 621 489 34.1 375.9 188 725 5 849 486 32.3 388.3
Amajuba 140 550 4 272 263 32.9 534.4 137 659 4 407 250 31.2 550.6
Zululand 288 320 5 391 730 33.4 395 303 392 9 578 768 31.7 395.0
uMkhanyakude 219 160 6 327 485 34.8 445.7 240 848 7 309 543 33.0 443.6
uThungulu 290 880 7 834 637 32.8 456.6 302 057 9 628 676 31.4 446.8
iLembe 159 668 6 734 403 32.5 396.2 175 006 5 564 431 31.5 406.0
Sisonke 161 591 22 868 461 33.2 350.5 154 267 5 181 452 29.8 341.3
KZN 2 771 420 86 983 5 938 31.9 467 2 877 969 94 932 6 176 30.3 466.0
2008 2012

17
economic development of a country in the current rapidly changing and technology driven world. High levels of
literacy in the economy are essential as it makes it easier for literate individuals to be trained and can add more value
to the human capital and be more productive.
Figure 7 represents how KZN and uThungulu district’s literacy rate varied in 2001 to 2012. KZN realised an increase
during this period from 66.6 per cent in 2001 to 79.4 per cent in 2012. The district of uThungulu also showed
increasing literacy rate in the same period from 58.6 per cent in 2001 to 75.3 per cent in 2012. However, it is evident
that progress in KZN and uThungulu district had been positive over the years but much need to be done to reach out
to even more people.
Figure 7: Literacy rates in KZN and uThungulu, 2001 to 2012
Source: Global Insight, 2014
10. Health
10.1 HIV and AIDS
Sub-Saharan Africa is the region worst affected by HIV and AIDS. HIV and AIDS in South Africa is a major health
concern. According to AIDS Foundation South Africa Annual Review (AFSA) (2013); South Africa has the highest
prevalence of HIV/AIDS compared to any other country in the world.

18
Table 10: HIV Positive and Aids Deaths estimates in 2001 and 2012
Source: Global Insight, 2014 Table 10 depicts KZN and uThungulu HIV positive estimates and AIDS deaths estimates for the years 2001 and
2012. The percentage of HIV positive estimates in KZN increased from 11.6 per cent in 2001 to 15 per cent in 2012.
The proportion of AIDS deaths was estimated at a low 1 per cent in KZN in the year 2012. UThungulu district
followed almost similar trend (from 11.9 per cent in 2001 to 15.4 per cent in 2012).
South Africa has made important steps in its response to HIV and AIDS over the past decade. Interventions by
government and civil society, supported by donors and the private sector, have succeeded in stabilising and reducing
HIV incidence, cutting AIDS related mortality and reducing the burden on those most affected by the epidemic (AFSA
Annual Review, 2013).
11. Access to basic services
11.1 Access to sanitation
The lack of basic services such as water supply and sanitation is a key symptom of poverty and underdevelopment.
South Africa with its mix of developed and developing districts, 9.7 million (20 per cent) of the people did not have
access to adequate water supply and 16 million (33 per cent) lacked proper sanitation services which led to health
risks in the society (Kahinda, Taigbenu & Boroto, 2007). The South African government has committed itself to
provide financial assistance to poor households for the capital cost of rendering sanitation services and related to
providing free basic services in rural areas (Department of Water Affairs and Forestry, 1994).
Table 11: Households access to sanitation by toilet facility in 2001 and 2012
Source: Global Insight, 2013
Total Population
HIV Positive %
Estimates
Aids Deaths %
Estimates
2001 2012 2001 2012 2001 2012
KwaZulu-Natal 9 529 450 10 347 260 11.6 15.0 0.4 1.0
Uthungulu 875 257 909 760 11.9 15.4 0.4 1.0
Mfolozi 105 405 124 475 12.1 16.1 0.4 1.1
uMhlathuze 288 993 338 848 12.8 16.5 0.4 1.1
Ntambanana 83 321 73 168 11.7 14.6 0.4 0.9
uMlalazi 217 290 213 129 11.5 14.5 0.4 1.0
Mthonjaneni 49 540 47 515 12.4 15.2 0.4 1.0
Nkandla 130 709 112 625 10.5 13.8 0.4 0.9
Flush toilet (VIP) Pit toilet
Bucket
system No Toilet Flush (VIP) Pit toilet
Bucket
system No Toilet
KwaZulu-Natal 45.1 7.6 28.4 0.4 18.5 51.8 20.8 20.6 0.7 6.0
Uthungulu 32.4 8.6 24.5 0.5 34.0 40.1 22.2 25.4 0.7 11.6
Mfolozi 20.0 7.2 23.5 0.8 48.4 19.0 31.6 36.3 0.7 12.4
uMhlathuze 55.5 9.3 23.6 0.4 11.3 61.1 18.8 15.9 0.6 3.6
Ntambanana 14.6 11.5 14.0 0.5 59.4 5.8 51.9 20.7 0.7 20.8
uMlalazi 18.0 7.8 22.6 0.6 51.0 28.0 15.6 31.8 0.9 23.8
Mthonjaneni 25.4 6.7 36.0 0.2 31.6 38.0 17.9 32.5 0.2 11.3
Nkandla 9.6 8.4 31.5 0.3 50.3 26.2 23.4 37.3 0.6 12.6
2001 2012

19
Table 11 represent the province of KZN and UThungulu’s access to sanitation by toilet facilities. In the table above, it
can be seen that in KZN the estimated percentage of households with no toilets dropped from an estimate of 18.5 per
cent in 2001 to 6 per cent in 2012. UThungulu district also recorded a decrease in the percentage of households with
no toilets from 34 per cent in 2001 to 11.6 per cent in 2012 which is above that of the province. UMlalazi local
municipality had the highest estimated percentage of households with no toilets at 23.8 per cent in 2012 followed by
Ntambanana with 20.8 per cent while uMhlathuze had the lowest estimates at 3.6 per cent.
The objective of the bucket system being phased out seems achievable since the highest estimate of a local
municipality using bucket system was 0.7 per cent in 2012 in both Mfolozi and Ntambanana. The percentage of
households using flush toilet system in uThungulu increased from 32.4 per cent in 2001 to 40.1 per cent in 2012.
Among all local municipalities uMhlathuze had the highest percentage of people with access to flush toilet system
both in 2001 and 2012 at 55.5 per cent and 61.1 per cent respectively. This was even higher than the provincial
average in 2012.
The rest of the local municipalities in this district showed positive trend except that of Mfolozi and Ntambanana at 19
per cent and 5.8 per cent respectively in 2012. Despite the progress made with regard to improving access to basic
sanitation, but there are still communities that are living without proper sanitation.
11.2 Access to water
South Africa is not well endowed with abundant fresh water resources. In fact, it is regarded as the 30th most water
scarce country in the world12. Due to the fast growing economy, population growth and other social development
needs, the demand for water is expected to increase. According to the UNICEF13 (2013) an estimated 36 per cent of
the world’s population (2.5 billion people) lack improved sanitation facilities, and 768 million people still use unsafe
drinking water sources. An amount of 25 litres per day is considered as the minimum required for the consumption,
the preparation of food and hygiene (Department of Water Affairs and Forestry, 1994).
Table 12 shows household’s percentage access to water in the province of KZN and uThungulu district municipality
in 2001 and 2012. It can be seen that KZN shows an improvement in access to piped water, because of the decrease
in the percentage of households with no formal piped water from 23 per cent in 2001 to 20.8 per cent in 2012.
Uthungulu district also recorded a decrease in the percentage of households with no formal piped water from 39.4
per cent in 2001 to 24.3 per cent in 2012. All the local municipalities in the district recorded a decrease in the
proportion of households with no formal piped water from 2001 to 2012. It is indicated that Mthonjaneni is the only
local municipality with a decrease in the percentage of households with on site piped water from 47.3 per cent in
2001 to 46.9 per cent in 2012.
12 www.unicef.org 13 http://www.unicef.org/wash/

20
Table 12: Access to piped water in KZN and uThungulu in 2001 and 2012
Source: Global Insight, 2013 UMhlathuze (from 17.5 per cent in 2001 to 4.2 per cent in 2012) and Nkandla (from 15.2 per cent in 2001 to 9.4 per
cent in 2012), are the only local municipalities who experienced a decrease in percentages of households with off-
site piped water. Conversely, Mfolozi, Ntambanana, uMlalazi and Mthonjaneni recorded increasing proportions in
households with off-site piped water. It is clear that uThungulu district is on par with KZN province in terms of
improvements in water availability to the households in the district (table 12).
11.3 Access to electricity
Electricity access is increasingly at the forefront of government’s worry, especially in the poorest countries (World
Energy Outlook, 2011). Figure 8 represents the percentages of population with access to electricity in KZN and in
uThungulu district as well as the local municipalities within the district in 2001 and 2012. In 1996, household access
to electricity connections was at a lower level of percentage. The increase in electricity connections is now the
second biggest infrastructure achievement in the uThungulu district municipality since 1999.
Figure 8: Percentage share of households in KZN and uThungulu with electricity connection in 2001 and 2012
Source: Global Insight, 2014
2001 2012 2001 2012 2001 2012
KwaZulu-Natal 23.0 20.8 54.2 61.4 22.8 17.8
Uthungulu 39.4 24.3 45.4 62.0 15.3 13.7
Mfolozi 63.5 24.5 22.6 55.3 13.8 20.2
uMhlathuze 9.4 5.8 73.1 90.0 17.5 4.2
Ntambanana 65.8 50.9 16.8 19.0 17.4 30.0
uMlalazi 55.8 38.7 30.3 37.1 13.9 24.2
Mthonjaneni 45.6 31.1 47.3 46.9 7.1 21.9
Nkandla 66.1 50.0 18.7 40.5 15.2 9.4
% No Formal Piped Water % On-Site % Off-Site
61.0 54.1 47.7
85.5
31.2 41.2 33.16.6
78.676.1 83.4
93.9
62.158.3 67.9
44.4
0
20
40
60
80
100
120
140
160
180
200
2001 2012

21
Access to electricity connections has; however, increased in KZN from 61 per cent in 2001 to 78.6 per cent in 2012.
Uthungulu’s electricity connection increased significantly from 54.1 per cent in 2001 to 76.1 per cent in 2012.
Regardless of the positive trend shown in figure 8, approximately 8.8 per cent of the population residing in uThungulu
district are still without electricity (figure 8).
12. Tourism
Table 13 shows tourism spending in KwaZulu-Natal and uThungulu district in 2001 and 2012 as well as the
municipalities within the uThungulu district. In South Africa tourism is regarded as a growth catalyst and a contributor
towards the economic upliftment of poorer regions (Saayman, Saayman & Wim Naude, 2000). It is also one of the
most rapidly expanding industries with tourist arrivals growing by +5.0 per cent worldwide in 2014 (World Trade
Organisation, 2014). According to Department of Travel and Tourism (2013), tourism contribution to the global GDP
was at 9.3 per cent in 2012 and was estimated to have risen by 3.2 per cent in 2013.
In KZN tourism spending increased more than doubled between 2001 and 2012. It is also clear that an enormous
increase in tourism spending from about R597 million in 2001 to an estimated R1 946 million in 2012 was realized in
uThungulu district.
Table 13: Tourism spending in KZN and uThungulu in 2001 and 2012
Source: Global Insight, 2014
It can also be realised form the table that tourism spending in KZN grew by an estimate of 206.7 per cent from 2002
to 2012 whereas in uThungulu it grew by 225.4 per cent in the same period. Among the six local municipalities,
uMhlathuze is the urban hub of the district because of the port of Richards Bay. Hence, it is the most contributor to
uThungulu tourism spending with an estimated R1 334 million which accounts for 68.6 per cent of the district’s
tourism spending trailed by uMlalazi at 14.2 per cent. The least contributor is Ntambanana at an estimated R59
million which was 3 per cent of the district’s tourism spending. According to uThungulu District Municipality Annual
Report (2004), the district municipality wishes to link Ntambanana with Hluhluwe-Umfolozi Game Reserve so as to
increase its tourism potential.
2001 2012 2001 2012 2001 2012
KwaZulu-Natal 9 183 290 28 161 435 100 100
Uthungulu 597 991 1 946 112 6.5 6.9 100 100
Mfolozi 29 538 132 885 0.3 0.5 4.9 6.8
uMhlathuze 325 473 1 334 986 3.5 4.7 54.4 68.6
Ntambanana 35 456 59 345 0.4 0.2 5.9 3.0
uMlalazi 158 259 276 185 1.7 1.0 26.5 14.2
Mthonjaneni 20 145 64 372 0.2 0.2 3.4 3.3
Nkandla 29 120 78 339 0.3 0.3 4.9 4.0
Tourism SpendingTourism Spending as % of
KZN Tourism Spending
Tourism Spending as % of
uThungulu Tourism Spending

22
Table 14: Tourism spending as a percentage of GDP in 2001, 2006 and 2012
Source: Global Insight, 2014 Table 14 represents tourism spending as the percentage of GDP in KZN and uThungulu district. In 2001 to 2012 the
province of KwaZulu-Natal realised an increase in tourism spending as a percentage of GDP from 5.4 per cent to 5.7
per cent. Tourism spending as a proportion of GDP in uThungulu district rose from 3.6 per cent in 2001 to 5.2 per
cent in 2006 before decreasing marginally to 4.6 percent in 2012. Mthonjaneni contributed the highest percentage
with regard to tourism spending to GDP at an estimated 17.1 per cent in 2012 trailed by Nkandla (15.0 per cent). The
Phobane Lake nearby Mthonjaneni attracts many tourists for its popular water sport and fishing fans (Ncube, 2008).
Although it was the highest but it had decreased from 25.2 per cent in 2006 to 17.1 per cent in 2012.
2001 2006 2012
KwaZulu-Natal 5.4 7.1 5.7
Uthungulu 3.6 5.2 4.6
Mfolozi 57.8 97.7 1.0
uMhlathuze 4.8 7.6 7.7
Ntambanana 1.7 2.0 1.1
uMlalazi 7.4 7.7 5.1
Mthonjaneni 14.5 25.2 17.1
Nkandla 18.4 28.9 15.0

23
13. APPENDIX
Table A1: National population size, size of the area and population density by province, 2012
Source: Global Insight, 2014
Figure A1: Percentage Share of Population Size by Province, 2012
Source: Global Insight, 2014
Western Cape 5,821,973 11.14 129,475 10.6 45.0
Eastern Cape 6,645,998 12.72 169,063 13.8 39.3
Northern Cape 1,125,434 2.15 373,351 30.6 3.0
Free State 2,780,723 5.32 130,007 10.6 21.4
KwaZulu-Natal 10,347,260 19.80 93,378 7.6 110.8
North-West 3,554,571 6.80 105,076 8.6 33.8
Gauteng 12,394,668 23.72 18,213 1.5 680.6
Mpumalanga 4,115,826 7.88 76,642 6.3 53.7
Limpopo 5,461,739 10.45 126,042 10.3 43.3
National Total 52,248,192 100.00 1,221,246 100 42.8
Population size
% share of national
population
Area in square
km
% share of
National area
Population
Density
Western Cape, 11.1
Eastern Cape, 12.7
Northern Cape, 2.2
Free State, 5.3
KwaZulu-Natal, 19.8
North-West, 6.8
Gauteng, 23.7
Mpumalanga, 7.9
Limpopo, 10.5

24
Figure A2: Percentage contribution to KZN Real GDP by district municipalities, 2012
Source: Global Insight, 2014

25
REFERENCES Aids Foundation South Africa (2013) Annual Review. Available online: http://www.aids.org.za/wp-content/uploads/2013/04/AFSA_AR2012_13.pdf. Census (2011) Statistics South Africa. Department of Travel and Tourism (2013) Annual Report 2012/3. Vote 35. Statistical Release. Government printer. Pretoria. Department of Water Affairs and Forestry (1994) Water Supply and Sanitation Policy White Paper, Water an Indivisible Natural Asset, Cape Town November 1994. Available online: http://www.unicef.org/wash. Department of Water Affairs and Forestry (2009) “Tap water in South Africa safe to drink” Media statement. Global Insight (2013) IHS Global Insight, ReX Regional Explorer. IMF (2014) World Economic Outlook Update. Available online: http://www.imf.org/external/pubs/ft/weo/2014/01. Kahinda, J.M. et al (2007) Domestic rainwater harvesting to improve water supply in rural South Africa. Physics and Chemistry of the Earth 32 (2007) 1050–1057. Science Direct. Available online: http://lshs.tamu.edu/docs/. KZN Provincial Treasury (2013): Kwazulu-Natal Provincial Socio-Economic Review and Outlook (SERO), 2013/14. Pretoria, Government Printer. KZN Provincial Treasury (2014): Provincial Budget, 07 March 2014. Ncube, E.S. (2008). The Role of Municipality in Development Process. A Study of Uthungulu District Municipality In Kwazulu-Natal. Malthus T.R. (1826). An essay on the principle of population. 6th ed. London: John Murray. Pilat, D. (1996). “Labour Productivity Levels in OECD Countries: Estimates for Manufacturing and Selected Service Sectors”, OECD Economics Department Working Papers, No. 169, OECD Publishing. Available online: http://dx.doi.org/10.1787/405541536677. Quarterly Labour Force Survey Statistics South Africa (2014), 1st Quarter: Statistical Release P0211. Government printer. Pretoria. Saayman, A. et al (2000). The impact of Tourist spending in South Africa: Spatial Implication. Faculty of Economic and Management Sciences, Potchefstroom. University of CHE. Vol. 3 No.3. Solow R.M. (1956) A contribution to the theory of economic growth. The Quarterly Journal of Economics. 70, no.1:65 Available online: http://www.jstor.org/stable/1884513. Statistics South Africa (2011). General Household Survey 2011. Statistical Release P0318. Government Printer. Pretoria. Statistics South Africa (2013): Mid-Year Population estimates 2013. Statistical Release P0302. Pretoria, Government printer.

26
Statistics South Africa (2014): The Quarterly Labour Force Survey, First Quarter 2014. Statistical Release P0211. Pretoria, Government printer. Van Zyl, G. (2010). Does employee remuneration dispersion in the South African economy enhance labour productivity? The Gauteng manufacturing industry as a case study: Department of Economics and Econometrics. University of Johannesburg, South Africa. World Bank (2012). Economic update- Focus on inequality of opportunity. Washington DC. World Energy Outlook (2011). Population without electricity in South Africa. Available online: http://www.worldenergyoutlook.org/publications/weo-2011 World Trade Organisation (2014). International tourism exceeds expectations with arrivals up by 52 million in 2013.