social network analysis of the influences of … network analysis of the influences of educational...
TRANSCRIPT

1 3
© Springer Fachmedien Wiesbaden 2014
Prof. Dr. K. A. Frank ()Department of Counseling, Educational Psychology and Special Education, Michigan State University,220 Trowbridge Rd,48824 East Lansing, MI, USAe-mail: [email protected]
Dr. Y.-J. LoUniversity of Michigan,500S State St,48109 Ann Arbor, MI, USAe-mail: [email protected]
Dr. M. SunCollege of Education, University of Washington,BOX 353600, 98195 Seattle, WA, USAe-mail: [email protected]
Social network analysis of the influences of educational reforms on teachers’ practices and interactions
Kenneth A. Frank · Yun-Jia Lo · Min Sun
Z Erziehungswiss (2014) (Suppl) 17:117–134DOI 10.1007/s11618-014-0554-x
Abstract In this chapter we present social network analysis in the context of re-cent educational reforms concerning teachers’ instructional practices. Teachers are critical to the implementation of educational reforms, and teacher networks are important because teachers draw on local knowledge and conform to local norms as they implement new practices. We describe three social network approaches. First, we graphically represent network data to characterize the network structure through which information and knowledge about reforms might diffuse. Second, we use social influence models to express how teachers’ beliefs or behaviors are affected by others with whom they interact. Third, we use social selection models to express how teachers might select with whom to engage in interactions about reforms. We discuss the implications for scientific dialogue, and for informing educational policy studies and the practice of educational policy makers and school administrators.
118 K. A. Frank et al.
1 3
Keywords Teacher networks · Reform · Implementation influence · Statistical models
Soziale Netzwerkanalyse der Einflüsse von Bildungsreformen auf die Lehrpraxis und Interaktionen von Lehrkräften
Zusammenfassung In diesem Kapitel präsentieren wir die Soziale Netzwerkana-lyse im Kontext aktueller Bildungsreformen, die sich auf Instruktionspraktiken von Lehrpersonen beziehen. Lehrpersonen spielen für die Implementation von Bil-dungsformen eine zentrale Rolle. Soziale Netzwerke von Lehrpersonen sind inso-fern von hoher Bedeutung, als Lehrpersonen im Zuge der Implikation neuer Prak-tiken auf lokales Wissen und lokale Normen zurückgreifen. Wir beschreiben drei netzwerkanalytische Ansätze: Erstens präsentieren wir Netzwerkdaten graphisch, um die Struktur des Netzwerkes zu charakterisieren, durch die Information und Wissen über die Reform verbreitet werden. Zweitens verwenden wir soziale Ein-flussmodelle, um darzustellen, wie Überzeugungen und Verhalten von Lehrperso-nen von denjenigen Lehrpersonen beeinflusst werden, mit denen sie interagieren. Drittens verwenden wir soziale Selektionsmodelle, um darzustellen, wie Lehrper-sonen die Personen auswählen, mit denen sie die Reform betreffend interagieren. Wir diskutieren Implikationen für den wissenschaftlichen Dialog, die Bedeutung für bildungspolitische Studien sowie die praktische Bedeutung für bildungspolitische Akteure und Schulangestellte.
Schlüsselwörter Lehrpersonen Netzwerke · Reform · Implementierung Einfluss · Statistische Modellierung
Given that the implementation of reforms is one of the greatest and constant chal-lenges for schools (e.g., Tyack and Cubin 1995), research communities have improved methods to probe policy implementation processes. Analyses of teachers’ social networks are critical to these endeavors because it is teachers who implement new practices in classrooms (Cohen et al. 2003); and as they do so, teachers seek local knowledge and respond to local norms embedded in their collegial networks (Frank et al. 2004; Frank et al. 2011). Correspondingly, social network analysis (SNA) has been identified as one of the most direct approaches to map and measure how social interactions are shaped by, and shape the implementation of reforms (e.g., Datnow 2012; Moolenaar 2012).
In this chapter of the special issue, we anchor our presentation of social network analysis in examples of teachers who seek to implement reforms (see Frank 1998, for a more general review of social network analysis in educational settings). We will synthesize and discuss the applications of three SNA strategies: graphical rep-resentation, models of social influence and models of selection of network partners. In addition, we discuss the implications for scientific dialogue, and for informing educational policy studies and the practice of educational policy makers and school administrators.
Social network analysis of the influences of educational reforms 119
1 3
1 The basic approaches of network analysis
1.1 Graphical representations
Graphical representations of network data can give researchers, and potentially school leaders, a systemic overview of the social structure in a school. In turn the social structure can be related to the flow of resources that affects teachers’ behaviors, such as the implementation of reforms. As follows, we will use Figs. 1 and 2, origi-nally used in Frank and Zhao’s (2005), to illustrate how new practices diffuse through the network structure of Westville (pseudonym) school.
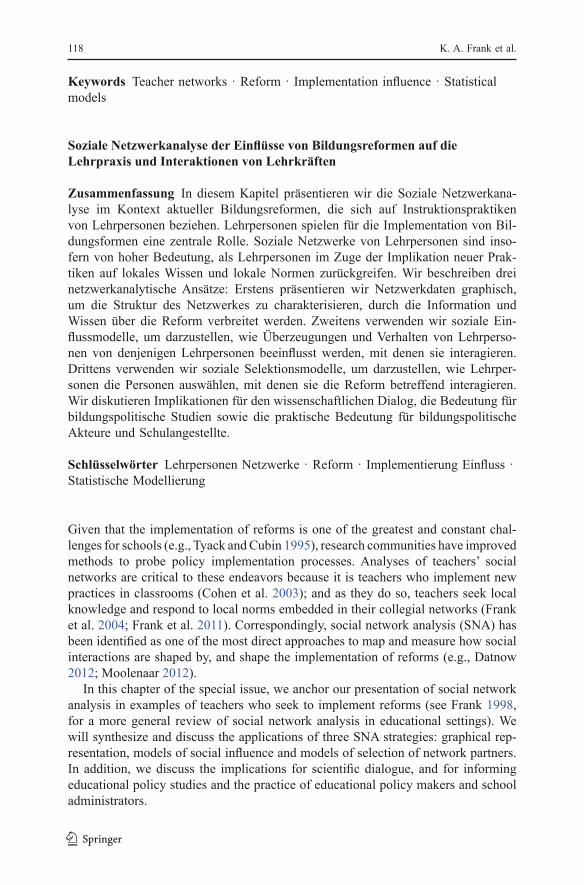
In the mid-1990s, the district central administration made Westville switch from Macintosh computers to Windows. To illustrate how the informal network shaped the organizational response to change, Frank and Zhao (2005) first used Fig. 1 to illustrate the informal structure of collegial ties among the teachers in Westville. Each teacher is represented by a number, and the lines indicate close collegial rela-tionships obtained from the survey question “who are your closest colleagues in the school?”. Frank’s KliqueFinder algorithm identified the subgroup boundaries in the image by maximizing the concentration of ties within subgroups versus between sub-groups (see Frank 1995, 1996, for more details of the algorithm). The solid lines
Fig. 1 Crystallized sociogram of collegial ties in Westville (Frank and Zhao 2005, p. 209)
120 K. A. Frank et al.
1 3
indicate within-subgroup interactions, while dotted lines indicate between-subgroup interactions.1
The text following each number in Fig. 1 indicates the grade in which the teacher taught (e.g., G3 indicates grade 3, MG indicates multiple grades, and GX indicates unknown grade). This information reveals an alignment of grade and subgroup boundaries embedded in the sociogram in Fig. 1. Subgroup A consists mostly of third
1 Directionality is not represented in Fig. 1 because close collegial relationships are used only to establish the underlying social structure. Arrowheads are used in Fig. 2 to show the flow of resources.
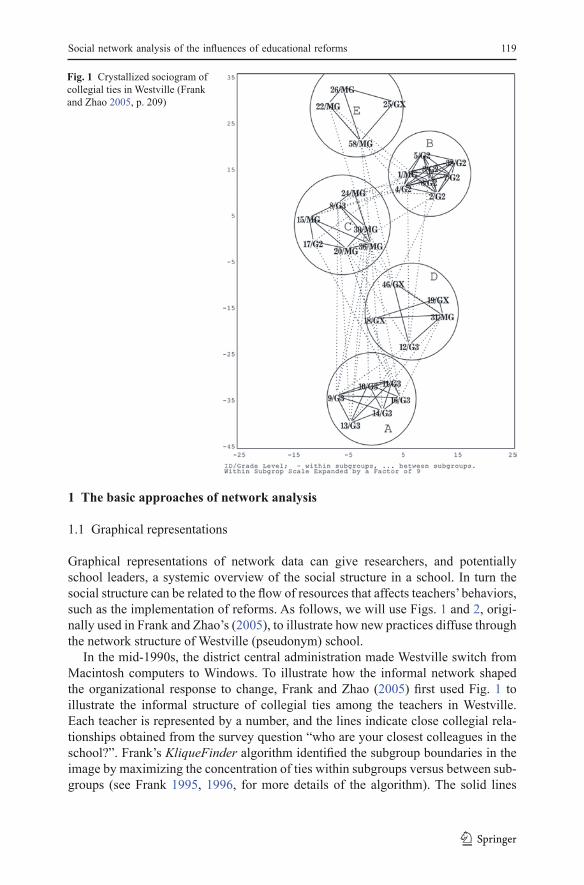
Fig. 2 Ripple Plot of diffusion of technology implementation in Westville (Frank and Zhao 2005, p. 211)

Social network analysis of the influences of educational reforms 121
1 3
grade teachers and subgroup B consists mostly of second grade teachers.2 But the subgroup structure also characterizes those faculty, administrators, and staff who do not neatly fit into the categories of the formal organization. For example, subgroup C contains the physical education teacher, a special education teacher, the principal, and two teachers who did not have extensive ties with others in their grades.
To relate the social structure in Fig. 1 to the flow of expertise about Windows and ultimately to changes in teachers’ computer use, Fig. 2 represents interactions concerning use of technology (in response to the question: ‘Who in the last year has helped you use technology in the classroom’) with the location of the teachers still determined by the close collegial relations in Fig. 1. Generally technology talk was concentrated within subgroups, especially the grade-based subgroups A and B. To represent the flow of knowledge or expertise, each teacher’s identification number was replaced with a dot proportional to his or her use of technology at time 1 (an * indicates no information available). The larger the dot, the more the teacher used technology as reported at time 1. The ripples indicate increases in the use of technol-ogy from time 1 to time 2.3
The intra-organizational diffusion essentially began when teacher 2 was assigned to Westville because of her expertise with the Windows platform. Teacher 2 imme-diately established collegial ties with the other teachers in subgroup B, and she supported those ties by talking with and helping others in subgroup B regarding com-puter technology. Thus she generated extensive discussions regarding technology in her subgroup, resulting in some increments in technology use.
The key to extending teacher 2’s knowledge beyond her subgroup was the colle-gial tie which teacher 2 formed with teacher 20. Through teacher 20, the expertise of teacher 2 was disseminated to both subgroup C and B, because teacher 20 talked with members of her subgroup, C, as well as members of subgroup A, resulting in substan-tial changes in use (e.g., as can be observed in the ripples around school actors in sub-group C). In the aggregate, these interactions among teachers facilitated the diffusion of knowledge about how to use Windows which led to changes in classroom practices.
Graphical representations can intuitively demonstrate the information flow among actors in a social organization and illustrate the process of change. The application of social network analysis to educational research can go above and beyond these graphical representations by statistically testing the extent to which teachers are influenced through interactions with colleagues and what factors affect the ways in which teachers select with whom to interact. We discuss these models of influence and selection in the next sections (in the technical appendix we present an overview of the application of influence and selection models).
2 There is a strong alignment of subgroups and grades in Westville because it had been reconfigured shortly before the time of data collection, drawing most of the second grade teachers from one school and most of the third grade teachers from another. Furthermore, the teachers’ room assignments reinforce grade assignments, as all but one of the second grade teachers are on one wing and all but one of the third grade teachers are on another wing.3 Because the metrics varied slightly between administrations of the instrument, each measure of use was standardized and then the difference was taken from the standardized measures. Each ring represents an increase of.2 standardized units.
122 K. A. Frank et al.
1 3
1.2 The influence model
We begin the discussion of statistical modeling of teacher networks with the influ-ence model, which is used to estimate a teacher’s implementation of certain teaching practices as a function of the prior behaviors of others around her (as a norm), and her own prior behaviors. For example, Frank et al. (2013a) modeled a teacher’s imple-mentation of basic skills reading instruction4 as a function of her previous imple-mentation as well as the behaviors of those with whom she frequently interacted regarding professional matters. Formally, let skills-based instructioni represent the extent to which teacher i implemented skills based instruction. This is modeled as
(1)
where the error terms (ei) are assumed independently distributed, N(0,σ2). The term previous skills-based instruction of others in the network of ii can be simply the mean or sum of the behaviors of those with whom teacher i interacted (e.g., as indicated in response to a question about from whom a teacher has received help with instruc-tion). Using mean as an example, if teacher Ashley indicated interacting with Kim and Sam who previously implemented skills-based instruction at levels of 25 and 30 respectively (for example, these might represent the number of times per month the teachers used skills based instruction for the core tasks of teaching), then Ashley is exposed to a norm of 27.5 (= (25 + 30)/2) through her network.5. Correspondingly, the term β1 indicates the normative influence of others on teacher i. If β1 is positive, the more the members of Ashley’s network teach basic skills, the more she increases her use of basic skills instruction. Corresponding to Fig. 2, if β1 is large, then one would observe many ripples associated with teachers who interacted with more others who had adopted the particular practice.
Note that the inference of influence is indirect—we do not directly ask people who influenced them. Instead, influence is assumed if teachers change their behaviors in the direction of the average behavior of those in their network. A positive coefficient of β1 indicates that the higher level of average implementation of a particular reform initiative of those in one’s network the greater the likelihood of increasing one’s own level of implementation. As an example, consider a teacher Lisa, who has compa-rable practices to Ashley at the beginning of the diffusion process, but Lisa’s network implements basic skills at lower levels than the members of Ashley’s network. Under
4 The skilled-based instructional practices include that teachers read stories or other imaginative texts; practice dictation (teacher reads and students write down words) about something the students are inter-ested in; use context and pictures to read words; blend sounds to make words or segment the sounds in words; clap or sound out syllables of words; drill and practice sight words (e.g., as part of a competition); use phonics-based or letter-sound relationships to read words in sentences; use sentence meaning and structure to read words; and practice letter-sound associations (see Frank et al. 2013a, p. 12–13 for details).5 In this sense, the exposure term extends basic conceptualizations of centrality (e.g., Freeman 1978) because the exposure term is a function of the characteristics of the members of a network, whereas cen-trality is a function only of the structure of the network.
Skills based instruction
previous skills based instri
-
-
=+
ββ
0
1uuction of others in the network of i
previous skills bi
-+β2
aased instruction of i ei i
+ ,
Social network analysis of the influences of educational reforms 123
1 3
these conditions, Ashley and Lisa’s practices will diverge as they conform to the norms in their respective networks. The network influence can accentuate any initial fragmentation in a network, as teachers respond to different norms in their own local-ized networks.
Note that model (1) is a basic regression model, with β1 representing the network effect (Friedkin and Marsden 1994). As such, and given longitudinal data, the model can be estimated with ordinary software once one has constructed the network term6. Furthermore, one can include covariates of a teacher’s attitude toward instructional practices representing a key predictor from the diffusion of innovation literature (Frank et al. 2013a; Frank et al. 2004; Rogers 2010).
Note the use of timing to identify the effects in model (1). The individual’s out-come is modeled as a function of her peers’ prior characteristics. This would be natu-ral if one were to model contagion. For example, whether A gets a cold from B is a function of A’s exposure to B over the last week and whether B had a cold last week. We would not argue that contagion occurs if A and B interacted in the last 24 hours and both A and B got sick today (see Lyons 2011 and Cohen-Cole and Fletcher’s 2008a, b of Christakis and Fowler’s 2007, 2008 models of the contagion of obesity; see also Leenders 1995).
1.3 Extensions of the influence model
Multiple sources of influence. The basic model in equation (1) can be extended to estimate multiple sources of influence. For example, Sun et al. (2013a) modeled a teacher’s use of skills based instruction as a function of influences of formal leaders from whom they received help with reading instruction (e.g., coaches, reading spe-cialists, designated mentors) versus regular teachers from whom they received help with reading instruction. The models used in this study can be simplified as:
(2)
The terms β1 and β2 then represent the influences of formal leaders (e.g., princi-pals, assistant principals, instructional coaches) and of informal leaders (e.g., regular teachers who enact influences on other teachers’ behavior) respectively.7 Sun et al.’s (2013a) estimates of model (2) showed that informal leaders influenced teachers’ spe-cific classroom practices such as skills-based instruction while formal leaders were more likely to influence teachers’ general practices (e.g., setting learning standards,
6 see https://www.msu.edu/~kenfrank/resources.htm: influence models for SPSS, SAS and STATA mod-ules and PowerPoint demonstrations that calculate a network effect and include it in a regression model.7 The difference between the estimates of β1 and β2 can be tested via a standard test of the difference between two regression coefficients (Cohen and Cohen 1983, p. 111). Or the difference can be tested by including a main effect for types of peers (e.g., an indicator of whether the peer is a formal leader) and then an interaction effect between peers and types of peers: peerii’ x formal leader.
Skills based instruction
previous skills based insti
-
- 0
1
= ++
ββ rruction of formal leaders in the network of i
previousi
2+β - skills based instruction of informal leaders in the netwoork of i
previous skills based instruction of i ei
i i
- + +β3

124 K. A. Frank et al.
1 3
choosing curriculum materials, or selecting tests). The findings empirically contrib-ute to the literature of distributive leadership by showing how teachers exhibit infor-mal leadership as they influence their colleagues’ practices (e.g., Spillane et al. 2001; Spillane and Kim 2012; Supovitz et al. 2010).
Multiple levels of influence. Networks can also be extended beyond direct inter-actions. For example, one could construct a network term based on others whom a teacher observed, members of a teacher’s cohesive subgroup (where interactions are concentrated within cohesive subgroups, but not all members of subgroups have interactions with each other—see Fig. 1), or her department. That is, the network can extend beyond direct ties with whom one is close colleagues.
These network effects beyond those of direct relations will quickly become dif-ficult to measure and differentiate, especially in the small closed communities of elementary schools or high school departments which feature extensive opportuni-ties for casual interaction and observation of all in the system. One way to model the influence of the community is through multilevel models. For example we can extend equation (1) to a multilevel framework (e.g., Raudenbush and Bryk 2002) for teacher i nested within subgroup j:
(3)
At the subgroup level (level 2), β0j, the adjusted mean behavior for a subgroup is modeled as a function of the previous subgroup norm:
(4)
where the error terms (u0j) are assumed independently distributed, N(0,τ00). The parameter γ01 then represents the extent to which new practices are affected by old practices of subgroup members. Using a model such as defined by (3) and (4), Frank et al. (2013a) found that teachers responded to members of their subgroup, even those from whom they did not directly receive help. In fact, Frank et al. (2013a) estimated that the influence of other members of the subgroup was about as strong as a teacher’s own prior skills based instruction, suggesting that teachers were highly responsive to the normative behavior of their subgroup. One can even extend the influence model to nested individuals within subgroups within schools (e.g., Frank et al. 2013a).
‘Spillover’ effects. Data from more than two time points can be used to illustrate complex dynamics of information diffusion and policy implementation. For instance, utilizing three years of data, Sun and colleagues found a “spillover” effect in which the expertise a teacher gained from a professional development program was diffused
At Level teacher i in subgroup j
Skills based instruct
(
-
1 :)iion
previous skills based instruction of formalij j
j
=+
ββ
0
1 - lleaders in the network of i
previous skills based inij
j
- +β2
sstructionij ij
+ e ,
Level subgroup level j
subgroup average ofj
2 : (
)β γ γ
0 00 01= + pprevious skills based instruction
j - u
j+
0,

Social network analysis of the influences of educational reforms 125
1 3
to others with whom she interacted in her school (Sun et al. 2013b). For example, if Ashley attended professional development, the total effect of professional develop-ment can be augmented if Ashley spilled over what she had learned from this program to other teachers (e.g., Sam or Kim) who might not have directly participated in the program. Effective professional development programs for teachers can be designed to both increase the individual teachers’ expertise in enacting high-quality instruc-tion and facilitate the diffusion of new expertise among teachers (see also Penuel et al. 2012 and Cole and Weinbaum 2010, for similar indirect effects on changes in attitudes).
Heterogeneous influence. The strength of influence may depend on one’s prior state of behavior. For example, Penuel et al. (2012) discovered a developmental theory of change in which teachers whose prior implementation were far from the desired practices responded more to direct participation in organized professional develop-ment, while teachers whose prior implementation were more advanced responded more to the sharing of promising practices and engaging in in-depth discussion with colleagues. The findings are fruitful to think of designing different features of pro-grams for teachers with different prior practices (see also Coburn et al. 2012; Frank et al. 2011).
The selection model. While the influence model represents how actors change behaviors or beliefs in response to others around them, the selection model repre-sents how actors choose with whom to interact or to whom to allocate resources. For example, the choices a teacher makes in helping others can be modeled as:
(5)
where p(helpii′) represents the probability that actor i’ provides help to actor i (similar to the influence model, these data can be obtained in response to a question about from whom teacher i received helped with instruction) and θ1 represents the effect of being close colleagues on the provision of help. For the data in Figs. 1 and 2, the term θ1 would be large and positive if most of the help shown in Fig. 2 was to those who were close colleagues as shown in Fig. 1. As in the influence model, other terms could be included such as common grade taught, level of knowledge, etc. (e.g., Frank 2009; Frank and Zhao 2005; Spillane et al. 2012):
(6)
Using this type of model, several studies have found that teachers engage in extensive professional discussions with close colleagues as well as others who teach the same grade—both θ1 and θ2 are positive (e.g., Frank and Zhao 2005; Penuel et al. 2010;
0 1( )
log1 ( )
,ii'ii'
ii'
p helpclose colleague
p help
= + −
θ θ
0 1 2( )
log1 ( )
ii'ii' ii'
ii'
p helpclose colleague same grade
p help
= + + −
θ θ θ
126 K. A. Frank et al.
1 3
Spillane et al. 2012). Help also tends to flow from experts to novices (Coburn et al. 2010; Frank and Zhao 2005; Penuel et al. 2009).
Using longitudinal data, Spillane et al. (2012) modeled the formation of new advice flows among teachers. Their results imply that the density of advice and information interactions within grades increases over time. On the one hand, this enhances resource flows within grades as grade members develop a common lan-guage and norms for knowledge sharing (Nonaka 1994; Yasumoto et al. 2001). On the other hand, without deliberate interventions over time (such a sending teach-ers in different grades to professional development together), teachers of one grade level may not be able to access the knowledge possessed by those in other grades (as is the case between subgroup A and C in Figs. 1 and 2). Such segmented social capital can inhibit learning because the knowledge necessary for successful teach-ing is not necessarily compartmentalized within grades (Frank et al. 2013a; Coburn et al. 2010).
1.4 Extensions of the selection model: modeling at the individual level
The selection model can be extended to model the characteristics of people that affect participation in ties or interactions. (Van Duijn 1995; Lazega and Van Duijn 1997; see Steglich et al. 2010; or Snijders et al. 2006, for alternatives). For example, Spillane et al. (2012) found that those engaged in professional development in a particular area were more likely to provide help to others in that area in their school. Simi-larly, Frank et al. (2008b) found that teachers who became National Board Certified were more likely to provide help to others in their school than similar teachers who did not become National Board Certified. This complements Sun et al.’s (2013b) findings regarding spillover: teachers who participated in professional development subsequently became more likely to help other teachers in the new school year. Pro-fessional development may either enhance teachers’ content knowledge, or improve their ability to articulate knowledge to others, or merely signal the “expert status” of those who participated in professional development.
Finally, the effects of dyadic characteristics can be moderated by individual char-acteristics. For example, Frank (2009) found that the effect of being a close col-league on the provision of help was weaker if the provider of help identified with members of the school as a collective (e.g., “I matter to others in this school”; “others in this school matter to me”; “I belong in this school”). Frank (2009) interpreted the identification with the collective of the school as a quasi-tie, directing the alloca-tion of resources without relying on a direct relation (e.g., close colleagues). Those who identified with others in the school as a collective developed a quasi-tie with all school members, directing their expertise equally throughout the school rather than just to their immediate networks. Thus factors that contribute to or compromise group identity (teacher turnover) can indirectly affect the flow of knowledge in a school; schools with high turnover rates may contain teachers who will help their closest colleagues but few others.
As a second example of how networks can be modified by individual charac-teristics, a recent study (Garrison et al. 2014) found that teachers who perceived pressure for their students to perform on tests were more likely to seek how others

Social network analysis of the influences of educational reforms 127
1 3
who increased their students’ test scores. In this way the external institutions associ-ated with standardized testing changed not just teachers’ practices, but their very networks. In turn, these changes in networks can affect a myriad of practices that may or may not be related to test scores. Thus the institutional forces may have powerful effects beyond the practices they target.
2 Discussion
The three basic techniques of graphically representing networks, and modeling influ-ence and selection in networks can be employed to help researchers and policymak-ers better understand how schools and teachers respond to educational reforms. This section discusses the significance of social network analysis to educational research, implications for practice, and several directions for future inquiry.
2.1 Implications for research
Social network analysis provides a new set of tools for researchers to investigate the complexity of reform implementation and ask questions beyond traditional approaches based on characteristics of individuals or organizations. The graphical representations illustrated in Figs. 1 and 2 provide a systemic overview of how behav-iors can diffuse unevenly among teachers as they respond to, and draw on, their social networks. Social network analysis also allows researchers to explore the variation of social contexts within school organizations, particularly relevant for individual teachers. While we can use multilevel models to examine how teachers are affected by the schools in which they teach (e.g., Frank 1998), teachers may experience the context of their schools differently depending on the particular local networks in which they are embedded. One teacher’s network may present an unfavorable view of the principal and discourage teaching to standardized tests, while another teacher’s network in the same school might favor the principal and encourage focusing on test scores. Thus the organizational culture is not monolithic as the teacher’s particular network filters how she experiences the culture of her organization.
The influence and selection models allow researchers to specify and test hypoth-esis derived from behavioral theories from economics, sociology, and psychological with regard to individual choice, decision making, and actions. For example, the tendency for teachers to be influenced by the others with whom they interact can be tested through the term β1 in the influence model in equation (1). This can be used to identify the sociological theories of the social contexts under which teachers are not influenced by their colleagues versus when they are. Such models would also allow one to test social psychological theories about the effects of social identity on the tendency to conform (e.g., Tajfel and Turner 1979) and developmental theories of learning. The selection models can be used to identify how teachers choose to whom to provide help. This informs an economic or communications theory of how resources flow through a system (Frank et al. 2013b) and how the ‘spillover’ effect of human capital investment is generated via peer learning and norms (Sun et al. 2013b). Such analyses can then help school leaders select individual teachers to take

128 K. A. Frank et al.
1 3
on special responsibilities to help others respond to change and thus add value to the development of organizational learning theories (Sun et al. 2013b).
2.2 Implications for practice
Acknowledging that policy implementation depends on local contexts, it is difficult for external researchers to propose “prescriptions” for how a particular school should organize its process for change, or “prescribe” uniform strategies for all schools. Therefore, our implications for practice are limited to the degree to which we can iden-tify common features of policy implementation and school reforms across schools. Generally, we suggest that change agents (e.g., policy-makers, district administra-tors, principals, or teachers) should consider local contexts of individual teachers as they respond to external demands for change within the social organization of their schools (Frank et al. 2010; Youngs et al. 2012). ‘Resistant’ teachers might simply be ones whose immediate networks push against a new behavior, or who cannot access knowledge from colleagues to support new behaviors. Pushing too hard against such norms can place teachers in ambiguous roles which may contribute to burnout.
Moreover, change agents must consider themselves as changing schools, not indi-vidual teachers (Finnigan and Daly 2012). The model of identifying an effective practice and then training a few teachers in a given school in an isolated setting does not recognize the social context of the teachers; rather, change agents should engage the entire faculty and staff in a school with structured inventions (e.g., Purkey and Smith 1983). This can be facilitated by requiring a large buy-in of school faculty before implementing reform (e.g., Success for All’s requirement of support from 75 % of a faculty). Change agents might also deliberately attend to how knowledge and support will be circulated throughout a school, for example, by targeting indi-viduals well integrated into the networks of their schools (Frank and Fahrbach 1999; Sun et al. 2013b) or by cultivating help from subgroups of teachers who have already adopted new practices (Frank et al. 2013b).
2.3 New trends in social network analysis
We have attended carefully to the models of influence and selection because they are the bedrock of social network analysis and because there is an emerging consen-sus regarding their specifications and estimations. Here we present three extensions beyond the basic tools we presented above.
Agent-based models. One great challenge in understanding organizational responses to diffusion is to anticipate the organizational changes that will emerge as a result of the combined processes of influence and selection. To explore the combined effects one can use agent-based models which simulate processes based on rules for behav-ior and interactions among actors (e.g., Brown et al. 2005; Lim et al. 2002; Parker et al. 2003; Maroulis et al. 2010; Wilensky 1999, 2001). For example, one can use agent-based models to examine the ultimate distribution of teaching practices after diffusion through a network (e.g., Frank and Fahrbach 1999). Graphical representa-tions of such processes can also be found in animated movies of network processes
Social network analysis of the influences of educational reforms 129
1 3
(Moody et al. 2005). As such, agent based models hold great promise for educational research to explore the systemic implications of non-linear processes.
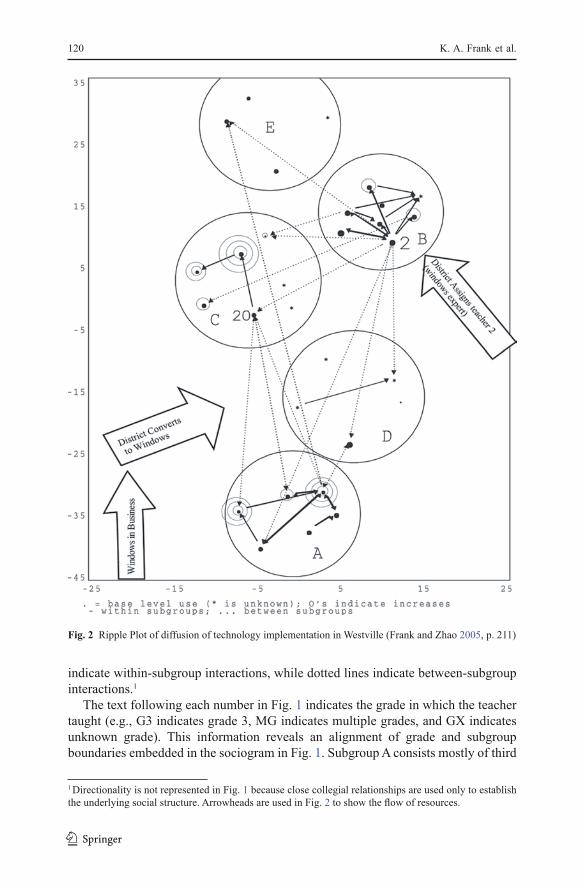
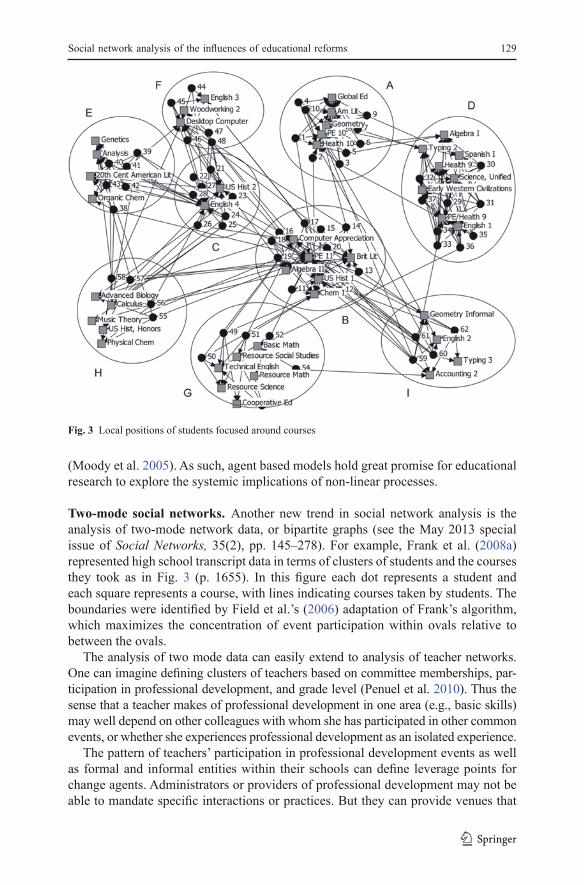
Two-mode social networks. Another new trend in social network analysis is the analysis of two-mode network data, or bipartite graphs (see the May 2013 special issue of Social Networks, 35(2), pp. 145–278). For example, Frank et al. (2008a) represented high school transcript data in terms of clusters of students and the courses they took as in Fig. 3 (p. 1655). In this figure each dot represents a student and each square represents a course, with lines indicating courses taken by students. The boundaries were identified by Field et al.’s (2006) adaptation of Frank’s algorithm, which maximizes the concentration of event participation within ovals relative to between the ovals.
The analysis of two mode data can easily extend to analysis of teacher networks. One can imagine defining clusters of teachers based on committee memberships, par-ticipation in professional development, and grade level (Penuel et al. 2010). Thus the sense that a teacher makes of professional development in one area (e.g., basic skills) may well depend on other colleagues with whom she has participated in other common events, or whether she experiences professional development as an isolated experience.
The pattern of teachers’ participation in professional development events as well as formal and informal entities within their schools can define leverage points for change agents. Administrators or providers of professional development may not be able to mandate specific interactions or practices. But they can provide venues that
Fig. 3 Local positions of students focused around courses
130 K. A. Frank et al.
1 3
define focal points of local positions. For example, professional development focused around basic skills may not merely serve as an opportunity to deliver content, but also for convening teachers among whom knowledge and influence might flow.
Measuring the depth of teachers’ interactions. Marsden (2005) extensively reviews the measurement of social networks. Examples of network instruments for teachers can be found at https://www.msu.edu/~kenfrank/resources.htm#survey. Here we signal a new approach to measurement attending to the nature of teachers’ interactions instead of merely the presence or absence of an interaction. Motivated by Coburn’s attention to the importance and variability of depth of interactions (e.g., Coburn and Russell 2008), new social network instruments include items concern-ing the depth of collaborative activities about teaching, including “sharing how to use curricular materials,” “discussion of why and how students can learn best,” or “demonstrating a lesson or activity.” Analyzing the psychometric properties of the measures of depth is challenging for conceptual and technical reasons. Conceptually, it is difficult for teachers, like many others, to parse their conversations into spe-cific components. Technically, observations of teacher interactions are dependent on one another. One can address some of these dependencies by employing multilevel models of selection to cross-nested item analysis within the individuals who make nominations and the individuals who receive nominations in a network survey (Sun 2011). The conceptual challenges are as yet unresolved, but would be an important area for further work.
3 Conclusion
To sum up we encourage researchers, policymakers, school reformers, and school leaders to focus on individual teachers as embedded in their networks. It is the teach-er’s practices that significantly contribute to educational outcomes. But those prac-tices are shaped by the others in a school who can provide local knowledge and who may expect local coordination. Thus we bring the tools of social network analysis to bear on the classic challenge of understanding the decision making of teachers within the social organization of their schools.
On-line technical appendix

Social network analysis of the influences of educational reforms 131
1 3
Tabl
e 1
Exam
ples
of t
he C
ompo
nent
s of I
nflue
nce
and
Sele
ctio
n M
odel
sIn
fluen
ce M
odel
Sele
ctio
n M
odel
Bas
ic In
fluen
ce M
odel
Mul
tiple
Sou
rces
of I
nflue
nce
Mul
tiple
leve
ls o
f Infl
uenc
eB
asic
Sel
ectio
n M
odel
Hyp
othe
sis
H1:
If te
ache
rs in
ter-
acte
d w
ith o
ther
s with
hi
gher
leve
ls o
f ski
lls-
base
d in
stru
ctio
nal
expe
rtise
, the
ir ow
n in
stru
ctio
nal p
ract
ices
w
ould
be
posi
tivel
y in
fluen
ced
Wha
t typ
es o
f ins
truct
iona
l pra
ctic
es m
ost r
espo
nsiv
e to
w
hich
type
s of l
eade
rs. F
or e
xam
ple,
H21
: Tea
cher
s’ ge
nera
l pra
ctic
es (e
.g.,
setti
ng a
mbi
tious
go
als,
choo
sing
ass
essm
ent a
nd c
urric
ulum
) wou
ld b
e m
ore
likel
y to
resp
ond
to th
e in
fluen
ce o
f for
mal
lead
ers
H22
: Tea
cher
s’ sp
ecifi
c pe
dago
gica
l pra
ctic
es in
cla
ssro
oms
are
mor
e lik
ely
to b
e in
fluen
ced
by in
form
al le
ader
s who
ar
e re
gula
r cla
ssro
om te
ache
rs
H3:
Teac
hers
’ pra
ctic
es o
f ski
lls-
base
d in
stru
ctio
n w
ere
incr
ease
d if
they
bel
onge
d to
a su
bgro
up w
ith a
hi
gher
leve
l of s
kills
-bas
ed in
stru
c-tio
nal e
xper
tise
H41
: Tea
cher
s who
wer
e cl
ose
colle
ague
wer
e m
ore
likel
y to
he
lp e
ach
othe
r in
clas
sroo
m
inst
ruct
ion
H42
: Tea
cher
s who
taug
ht in
th
e sa
me
grad
e w
ere
mor
e lik
ely
to h
elp
each
oth
er
Dat
aLo
ngitu
dina
l dat
aLo
ngitu
dina
l dat
aLo
ngitu
dina
l dat
a w
ith te
ache
rs
nest
ed in
subg
roup
sLo
ngitu
dina
l aat
a w
ith p
aire
d-le
vel r
elat
ions
hips
bet
wee
n al
l po
ssib
le p
airs
of t
each
ers
Mod
elR
egre
ssio
nR
egre
ssio
nM
ultil
evel
mod
elin
gLo
gist
ic re
gres
sion
Dep
ende
nt
Varia
ble
Y1:
Teac
her’s
skill
s-ba
sed
inst
ruct
ion
Y2:
Teac
her’s
skill
s-ba
sed
inst
ruct
ion
Y3:
Teac
her’s
skill
s-ba
sed
inst
ruct
ion
Y4:
at p
air l
evel
, one
teac
her
help
ed th
e ot
her t
each
erIn
de-
pend
ent
Varia
ble
X11
: Tea
cher
’s e
xpos
ure
to th
e sk
ills-
base
d in
stru
ctio
nal e
xper
tise
of o
ther
teac
hers
in h
er/
his n
etw
ork
X12
: Tea
cher
’s o
wn
prev
ious
skill
s-ba
sed
inst
ruct
ion
X21
: Tea
cher
’s e
xpos
ure
to th
e ge
nera
l pra
ctic
es o
f for
mal
le
ader
s in
her/h
is n
etw
ork
X22
: Tea
cher
’s e
xpos
ure
to th
e sk
ills-
base
d in
stru
ctio
nal
expe
rtise
of i
nfor
mal
lead
ers i
n he
r/his
net
wor
kX
23: T
each
er’s
ow
n pr
evio
us sk
ills-
base
d in
stru
ctio
n
Leve
l 1:
X31
: Tea
cher
’s e
xpos
ure
to th
e sk
ills-
base
d in
stru
ctio
nal e
xper
tise
of o
ther
te
ache
rs in
her
/his
net
wor
kX
32: T
each
er’s
ow
n pr
evio
us sk
ills-
base
d in
stru
ctio
nLe
vel 2
:X
33: T
he a
vera
ges o
f tea
cher
s’ sk
ills-
base
d in
stru
ctio
n in
the
subg
roup
s
X41
: The
pai
r of t
each
ers
taug
ht th
e sa
me
subj
ect
X42
: The
pai
r of t
each
ers
taug
ht in
the
sam
e gr
ade
Hyp
othe
sis
Test
If th
e co
effic
ient
of X
11
is p
ositi
ve a
nd si
gnifi
-ca
nt, t
he h
ypot
hesi
s H1
is re
tain
ed
If th
e co
effic
ient
of X
21 is
pos
itive
and
sign
ifica
nt, t
he
hypo
thes
is H
21 is
reta
ined
If th
e co
effic
ient
of X
22 is
sign
ifica
nt, t
he h
ypot
hesi
s H22
is
reta
ined
The
com
paris
on o
f coe
ffici
ents
bet
wee
n X
21 a
nd X
22
impl
ies t
he c
ompa
rativ
e in
fluen
ces o
n di
ffere
nt ty
pes o
f in-
stru
ctio
nal p
ract
ices
bet
wee
n fo
rmal
and
info
rmal
lead
ers
If th
e co
effic
ient
of X
33 is
pos
itive
an
d si
gnifi
cant
, the
hyp
othe
sis H
3 is
reta
ined
If th
e co
effic
ient
of X
41 an
d X
42 ar
e po
sitiv
e an
d si
gnifi
-ca
nt, t
he h
ypot
hese
s H41
and
H42
are
reta
ined

132 K. A. Frank et al.
1 3
References
Brown, D. G., Page, S. E., Riolo, R., Zellner, M., & Rand, W. (2005). Path dependence and the validation of agent-based spatial models of land use. International Journal of Geographical Information Sci-ence, 19(2), 153–174.
Christakis, N., & Fowler, J. (2007). The spread of obesity in a large social network over 32 years. The New England Journal of Medicine, 357, 370–379.
Christakis, N., & Fowler, J. (2008). The collective dynamics of smoking in a large social network. The New England Journal of Medicine, 358, 249–258.
Coburn, C. E., & Russell, J. L. (2008). District policy and teachers’ social networks. Educational Evalua-tion and Policy Analysis, 30(3), 203–235.
Coburn, C. E., Choi, L., & Mata, W. (2010). I would go to her because her mind is math: Network forma-tion in the context of mathematics reform. In A. J. Daly (Ed.), Social network theory and educational change (pp. 33–50). Cambridge: Harvard Educational Press.
Coburn, C. E., Russell, J. L., Kaufman, J., & Stein, M. K. (2012). Supporting sustainability: Teach-ers’ advice networks and ambitious instructional reform. American Journal of Education, 119(1), 137–182.
Cohen, J., & Cohen, P. (1983). Applied multiple regression/correlation analysis for the behavioral sci-ences. Hillsdale: Lawrence Erlbaum.
Cohen, D. K., Raudenbush, S. W., & Ball, D. L. (2003). Resources, instruction, and research. Educational Evaluation and Policy Analysis, 25(2), 119–142.
Cohen-Cole, E., & Fletcher, J. M. (2008a). Detecting implausible social network effects in acne, height, and headaches: Longitudinal analysis. British Medical Journal, 337, 2533–2537.
Cohen-Cole, E., & Fletcher, J. M. (2008b). Is obesity contagious? Social networks vs. environmental fac-tors in the obesity epidemic. Journal of Health Economics, 27(5), 1382–1387.
Cole, R. P., & Weinbaum, E. H. (2010). Changes in attitude: Peer influence in high school reform. In A. J. Daly (Ed.), Social network theory and educational change (pp. 77–95). Cambridge: Harvard Educational Press.
Datnow, A. (2012). Teacher agency in educational reform: Lessons from social networks research. Ameri-can Journal of Education, 119(1), 193–201.
Field, S., *Frank, K. A., Schiller, K., Riegle-Crumb, C., & Muller, C. (2006). Identifying Social Contexts in Affiliation Networks: Preserving the Duality of People and Events. Social Networks, 28, 97–123. (* co first authors).
Finnigan, K. S., & Daly, A. J. (2012). Mind the gap: Organizational learning and improvement in an under-performing urban system. American Journal of Education, 119(1), 41–71.
Frank, K. A. (1995). Identifying cohesive subgroups. Social Networks, 17, 27–56.Frank, K. A. (1996). Mapping interactions within and between cohesive subgroups. Social Networks, 18,
93–119.Frank, K. A. (1998). The social context of schooling: Quantitative methods. Review of Research in Educa-
tion, 23, 171–216.Frank, K. A. (2009). Quasi-ties: Directing resources to members of a collective. American Behavioral
Scientist, 52, 1613–1645.Frank, K. A., & Fahrbach, K. (1999). Organizational culture as a complex system: Balance and informa-
tion in models of influence and selection. Organization Science, 10(3), 253–277.Frank, K. A., & Zhao, Y. (2005). Subgroups as a meso-level entity in the social organization of schools.
In L. Hedges & B. Schneider (Eds.), Social organization of schools (pp. 279–318). New York: Sage Publications.
Frank, K. A., Zhao, Y., & Borman, K. (2004). Social capital and the diffusion of innovations within orga-nizations: Application to the implementation of computer technology in schools. Sociology of Educa-tion, 77, 148–171.
Frank, K. A., Muller, C., Schiller, K., Riegle-Crumb, C., Strassman-Muller, A., Crosnoe, R., & Pearson J. (2008a). The social dynamics of mathematics course taking in high school. American Journal of Sociology, 113(6), 1645–1696.
Frank, K. A., Sykes, G., Anagnostopoulos, D., Cannata, M., Chard, L., Krause, A., & McCrory, R. (2008b). Extended influence: National board certified teachers as help providers. Education, Evaluation, and Policy Analysis, 30(1), 3–30.

Social network analysis of the influences of educational reforms 133
1 3
Frank, K. A., Kim, C., & Belman, D. (2010). Utility theory, social networks, and teacher decision mak-ing. In A. J. Daly (Ed.), Social network theory and educational change (pp. 223–242). Cambridge: Harvard University Press.
Frank, K. A., Zhao, Y., Penuel, W. R., Ellefson, N. C., & Porter, S. (2011). Focus, fiddle and friends: Sources of knowledge to perform the complex task of teaching. Sociology of Education, 84(2), 137–156.
Frank, K.A., Penuel, W.R., Sun, M., Kim, C., & Singleton, C. (2013a). The organization as a filter of institutional diffusion. Teacher’s College Record. 115(1), 306–339.
Frank, K. A., Penuel, W. R., & Krause, A. (2013b). What is a “good” social network for a system? Knowl-edge flow and organizational change. Paper presented at the annual meeting of Association for Public Policy Analysis and Management, Washington, DC, USA.
Freeman, L. C. (1978). Centrality in social networks: Conceptual clarification. Social Networks, 1, 215–239.
Friedkin, N. E., & Marsden, P. (1994). Network studies of social influence. In S. Wasserman & J. Galaskie-wicz (Eds.), Advances in social network analysis (pp. 1–25). Thousand Oaks: Sage.
Garrison Wilhelm, A., Chen, I., Frank, K.A., & Smith, R. (2014). Understanding Mathematics Teach-ers’ Advice-Seeking Networks. Paper presented at the Annual Meeting of the American Educational Research Association, Philadelphia, PA.
Lazega, E., & van Duijn, M. (1997). Position in formal structure, personal characteristics and choices of advisors in a law firm: A logistic regression model for dyadic network data. Social Networks, 19, 375–397.
Leenders, R. (1995). Structure and influence: Statistical models for the dynamics of actor attributes, net-work structure and their interdependence. Amsterdam: Thesis Publishers.
Lim, K., Deadman, P. J., Moran, E., Brondizio, E., & Mc-Cracken, S. (2002). Agent-based simulations of household decision-making and land use change near Altamira, Brazil. In H. R. Gimblett (Ed.), Integrating geographic information systems and agent-based techniques for simulating social and ecological processes (pp. 277–308). New York: Oxford University Press.
Lyons, R. (2011). The spread of evidence-poor medicine via flawed social-network analysis. Statistics, Politics, and Policy, 2(1). Retrieved at http://arxiv.org/abs/1007.2876. Accessed 18 Feb. 2013.
Maroulis, S., Guimera, R., Petry, H., Stringer, M J., Gomez, L., Amaral, L.A.N., & Wilensky, U. (2010). Complex systems view on educational policy research. Science, 330(6000), 38–39.
Marsden, P. V. (2005). Recent developments in network measurement. In P. J. Carrington, J. Scott, & S. Wasserman (Eds), Model and methods in social network analysis (pp. 8–30). New York: Cambridge University Press.
Moody, J., McFarland, D. A., & Bender-DeMoll, S. (2005). Dynamic network visualization: Methods for meaning with longitudinal network movies. American Journal of Sociology, 110, 1206–1241.
Moolenaar, N. M. (2012). A social network perspective on teacher collaboration in schools: Theory, meth-odology, and applications. American Journal of Education, 119(1), 7–39.
Nonaka, I. (1994). A dynamic theory of organizational knowledge creation. Organization Science, 5(1), 14–37.
Parker, D. C., Manson, S. M., Janssen, M. A., Hoffmann, M. J., & Deadman, P. (2003). Multi-agent sys-tems for the simulation of land-use and land-cover change: A review. Annals of the Association of American Geographers, 93(2), 314–337.
Penuel, W. R., Riel, M., Krause, A., & Frank, K. A. (2009). Analyzing teachers’ professional interactions in a school as social capital: A social network approach. Teachers College Record, 111(1), 124–163.
Penuel, W. R., Riel, M., Joshi, A., & Frank, K. A. (2010). The alignment of the informal and formal sup-ports for school reform: Implications for improving teaching in schools. Educational Administration Quarterly, 46(1), 57–95.
Penuel, W. R., Sun, M., Frank, K. A., & Gallagher, H. A. (2012). Using social network analysis to study how collegial interactions can augment teacher learning from external professional development. American Journal of Education, 119(1), 103–136.
Purkey, S. C., & Smith, M. S. (1983). Effective schools: A review. Elementary School Journal, 83(4), 427–452.
Raudenbush, S. W., & Bryk, A. S. (2002). Hierarchical linear models: Applications and data analysis methods. Thousand Oaks: Sage Publications.
Rogers, E. M. (2010). Diffusion of innovations. New York: Simon and Schuster.Snijders, T. A. B., Pattison, P. E., Robins, G. L., & Handcock, M. S. (2006). New specifications for expo-
nential random graph models. Sociological Methodology, 36(1), 99–153.

134 K. A. Frank et al.
1 3
Spillane, J. P., & Kim, C. M. (2012). An exploratory analysis of formal school leaders’ positioning in instructional advice and information networks in elementary schools. American Journal of Educa-tion, 119(1), 73–102.
Spillane, J. P., Halverson, R. R., & Diamond, J. B. (2001). Investigating school leadership practice: A distributed perspective. Educational Researcher, 30, 23–27.
Spillane, J., Kim, C. M., & Frank, K. A. (2012). Instructional advice and information providing and receiv-ing behavior in elementary schools: Exploring tie formation as a building block in social capital development. American Educational Research Journal, 49(6), 1112–1145.
Steglich, C., Snijders, T. A. B., & Pearson, M. (2010). Dynamic networks and behavior: Separating selec-tion from influence. Sociological Methodology, 40, 329–393
Sun, M. (2011). The use of multilevel item response theory modeling to estimate professional interactions among teachers (Unpublished doctoral dissertation). Michigan State University, East Lansing.
Sun, M., Frank, K. A., Penuel, W., & Kim, C. M. (2013a). How external institutions penetrate schools through formal and informal leaders. Educational Administration Quarterly, 49(4), 610–644.
Sun, M., Penuel, W., Frank, K. A., Gallagher, A., & Youngs, P. (2013b). Shaping professional development to promote the diffusion of instructional expertise among teachers. Education, Evaluation and Policy Analysis, 35(3), 344–369.
Supovitz, J. A., Sirinides, P., & May, H. (2010). How principals and peers influence teaching and learning. Educational Administration Quarterly, 46, 31–56.
Tajfel, H, & J. C. Turner. (1979). An integrative theory of intergroup conflict. In W. G. Austin & S. Worchel (Eds.), The Social Psychology of Intergroup Relations (pp. 33–47). Pacific Grove: Brooks-Cole.
Tyack, D., & Cuban, L. (1995). Tinkering toward utopia: A century of school reform. Cambridge: Harvard University Press.
Van Duijn, M. A. J. (1995). Estimation of a random effects model for directed graphs. In T. A. B. Snijders (Ed.), Symposium statistische software, nr. 7. toeval zit overal: Programmatuur voor random-coef-ficient modellen [Chance is omnipresent: Software for random coefficient models], (pp. 113–131). Groningen, iec ProGAMMA.
Wilensky, U. (1999). NetLogo [Computer software]. Retrieved from http://ccl.northwestern.edu/netlogo. Accessed 12 Nov. 2013.
Wilensky, U. (2001). Modeling nature’s emergent patterns with multi-agent languages. Paper presented at the EuroLogo, Linz, Austria.
Yasumoto, J. Y., Uekawa, K., & Bidwell, C. (2001). The collegial focus and student achievement: Conse-quences of high school faculty social organization for students on achievement in mathematics and science. Sociology of Education, 74, 181–209.
Youngs, P., Frank, K. A., Thum, Y. M., & Low, M. (2012). The motivation of teachers to produce human capital and conform to their social contexts. In T. Smith, L. Desimone, & A. C. Porter (Eds.), Orga-nization and effectiveness of high-intensity induction programs for new teachers (pp. 248–272). Mal-den: Blackwell Publishing.