social benchmarking training
TRANSCRIPT

1EMC CONFIDENTIAL—INTERNAL USE ONLY
SOCIAL MEDIABENCHMARKING
Presented By Jon Gogel, EMC Social Team

Overview
Why Benchmark?
Normalizing Data
Demo1. Comparing To Peers
2. Comparing To Your Best
3. Comparing To An Average
Next Steps

3EMC CONFIDENTIAL—INTERNAL USE ONLY
WHY BENCHMARK?
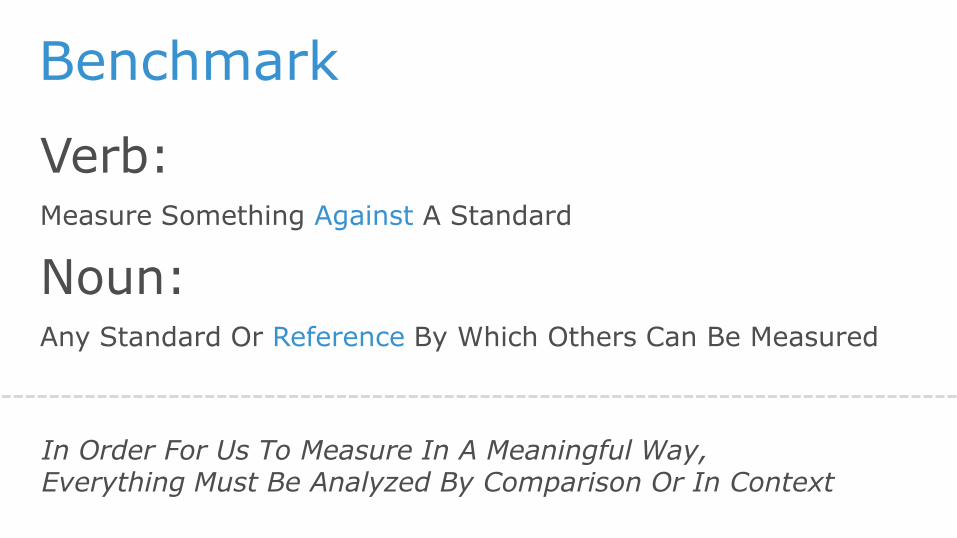
Benchmark
Verb: Measure Something Against A Standard
Noun: Any Standard Or Reference By Which Others Can Be Measured
In Order For Us To Measure In A Meaningful Way, Everything Must Be Analyzed By Comparison Or In Context

We Had 500 Clicks To Our
Landing Page Link
Interpret These Findings…
This Month, There Were 2,000
Engagements
In Q2 Of 2013, We Had 3,000
Fans & Followers
So What | Is This Good, Bad, Remarkable?

We Had 500 Clicks To Our
Landing Page Link
Interpret These Findings…
This Month, There Were 2,000
Engagements
In Q2 Of 2013, We Had 3,000
Fans & Followers
So What | Is This Good, Bad, Remarkable?
VANITY METRICS |
Not Actionable Ignore ContextFalse Conclusions

500 Clicks To Our Landing Page,
80% Of Page Traffic Is From Social
Interpret These Findings…
Unique Engagements
Increased By 1k This Month
We Gained 200 New Followers In Q2,
Our Average is 130
Insight| Context Is King
500 Clicks To Our Landing Page
80% Of Page Traffic Is From Social
Interpret These Findings…
Unique Engagements
Increased By 1k This Month
We Gained 200 New Followers In Q2
Our Average is 130
Insight| Context Is King
ACTIONABLE METRICS|
Reference ContextProvide GuidanceStill Need Investigating

9EMC CONFIDENTIAL—INTERNAL USE ONLY
Normalizing Data

Which Is More Impressive?
As You Grow, So Should Your Idea Of Performance
100 Clicks From 3,000 Followers
500 Clicks From 10,000 Followers
OR

Which Is More Impressive?
Relating Metrics Like Engagement To Audience Size Normalizes KPIs Into A Benchmark That Can Be Measured Against
3.3%Clicks Per Follower
Ratio
5% Clicks Per Follower
RatioOR

Easy Ways To Normalize
Engagement %
Engagement
Total Audience
Growth Rates
(New Figure – Old Figure )
Old Figure
Net New Fans: New Fans – Lost Fans

Overview
Why Benchmark?
Normalizing Data
Demo1. Comparing To Peers
2. Comparing To Your Best
3. Comparing To An Average
Next Steps

14EMC CONFIDENTIAL—INTERNAL USE ONLY
SIMPLY MEASUREDBENCHMARK DEMO

LOG IN
WWW.SIMPLYMEASURED.COM

AVERAGESYOUR BESTTO PEERS
Reports To Benchmark Against Peers Include:
Benchmark Peers

AVERAGESYOUR BESTTO PEERS
Custom Competitive Data Collections Can Be Created For Up To 10 EMC Twitter/Facebook Accounts
Benchmark Peers

AVERAGESYOUR BESTTO PEERS
Run Multiple Twitter Channel Report On: ―Twitter All‖
Demo
19EMC CONFIDENTIAL—INTERNAL USE ONLY
TO PEERS AVERAGESYOUR BEST
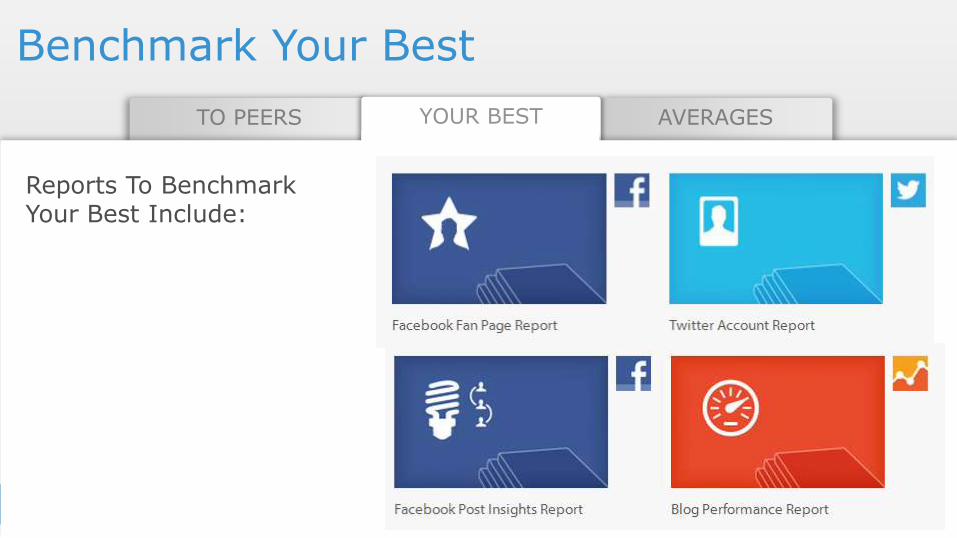
Reports To Benchmark Your Best Include:
Benchmark Your Best
TO PEERS AVERAGESYOUR BEST
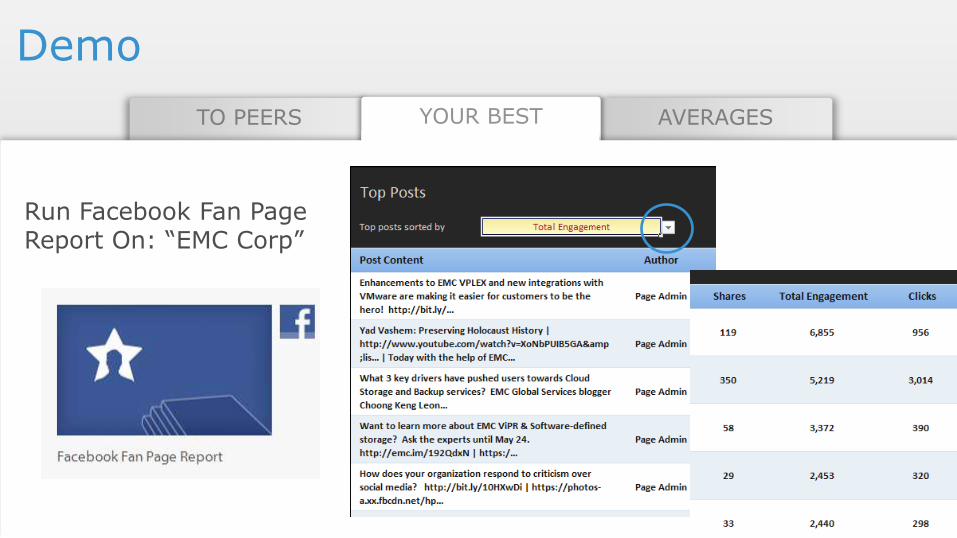
Run Facebook Fan Page Report On: ―EMC Corp‖
Demo
TO PEERS YOUR BEST AVERAGES
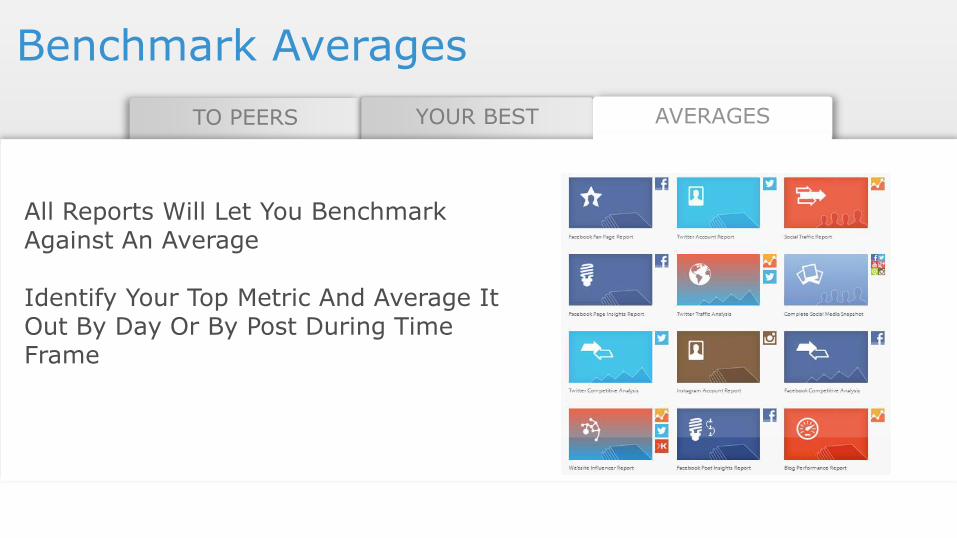
All Reports Will Let You Benchmark Against An Average
Identify Your Top Metric And Average It Out By Day Or By Post During Time Frame
Benchmark Averages
TO PEERS YOUR BEST AVERAGES
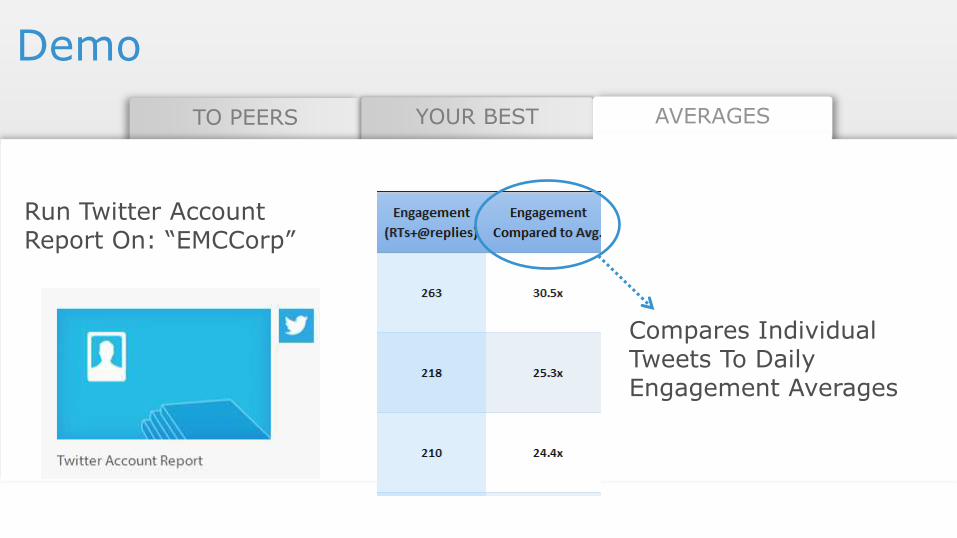
Run Twitter Account Report On: ―EMCCorp‖
Compares Individual Tweets To Daily Engagement Averages
Demo

TO PEERS YOUR BEST AVERAGES
Reports Will Also Call Out Days And Posts That Exceed Averages For The Time Period
Demo

TO PEERS YOUR BEST AVERAGES
OTHER WAYS TO BENCHMARK?

Overview
Why Benchmark?
Normalizing Data
Demo1. Comparing To Peers
2. Comparing To Your Best
3. Comparing To An Average
Next Steps

26EMC CONFIDENTIAL—INTERNAL USE ONLY
NEXT STEPS

Strategize A List Of Peers To Measure Against
Keep Up To Date With New And Unique Campaigns
Balance Benchmarks With Data Normalization
Sync Up Engagement Formulas In Industry Research

Final Thought…
Pick A Few Meaningful
Metrics & Delve Deep