smoothing and mean-covariance estimation of … and mean-covariance estimation of functional data...
TRANSCRIPT

Bayesian Analysis (0000) 00, Number 0, pp. 1
Smoothing and mean-covariance estimation offunctional data with a Bayesian hierarchical
model
Jingjing Yang∗,¶ and Hongxiao Zhu† and Taeryon Choi‡,‖ and Dennis D. Cox §,¶
Abstract. Functional data, with basic observational units being functions (e.g.,curves, surfaces) varying over a continuum, are frequently encountered in variousapplications. While many statistical tools have been developed for functionaldata analysis, the issue of smoothing all functional observations simultaneouslyis less studied. Existing methods often focus on smoothing each individualfunction separately, at the risk of removing important systematic patternscommon across functions. We propose a nonparametric Bayesian approach tosmooth all functional observations simultaneously and nonparametrically. In theproposed approach, we assume that the functional observations are independentGaussian processes subject to a common level of measurement errors, enablingthe borrowing of strength across all observations. Unlike most Gaussian processregression models that rely on pre-specified structures for the covariance kernel,we adopt a hierarchical framework by assuming a Gaussian process prior for themean function and an Inverse-Wishart process prior for the covariance function.These prior assumptions induce an automatic mean-covariance estimation inthe posterior inference in addition to the simultaneous smoothing of allobservations. Such a hierarchical framework is flexible enough to incorporatefunctional data with different characteristics, including data measured on eithercommon or uncommon grids, and data with either stationary or nonstationarycovariance structures. Simulations and real data analysis demonstrate that, incomparison with alternative methods, the proposed Bayesian approach achievesbetter smoothing accuracy and comparable mean-covariance estimation results.Furthermore, it can successfully retain the systematic patterns in the functionalobservations that are usually neglected by the existing functional data analysesbased on individual-curve smoothing.
Keywords: functional data, smoothing, Bayesian hierarchical model, Gaussianprocess, Matern covariance function, empirical Bayes.
1 Introduction
As more digital data are being collected in modern experiments, considerable effortshave been made to process and analyze functional data — data that are realizations
∗Department of Biostatistics, University of Michigan, Ann Arbor, MI 48109, USA, [email protected]† Department of Statistics, Virginia Tech, Blacksburg, VA 24061, USA, [email protected]‡ Department of Statistics, Korea University, Seoul 136-701, Republic of Korea, [email protected]§ Department of Statistics, Rice University, Houston, TX 77005, USA, [email protected]¶Supported by NIH grant PO1-CA-082710.‖Supported by Basic Science Research Program through the National Research Foundation of Korea
(NRF) funded by the Ministry of Education, Science and Technology (No. 2012R1A1A2041370).
c© 0000 International Society for Bayesian Analysis DOI: 0000
imsart-ba ver. 2014/10/16 file: FinalVersion_BA967.tex date: July 28, 2015

2 Smoothing and mean-covariance estimation of functional data
of random functions varying over a continuum such as a region of time or a rangeof wavelengths (Ramsay and Silverman, 2002). Since Ramsay and Dalzell (1991) firstcoined the term “functional data analysis” (FDA), numerous papers have been publishedon the FDA theory, methods and applications, making it one of the most active researchareas in statistics. One salient feature of functional data is that, although the underlyingfunctions are often continuous and smooth, data can only be collected discretely, whichoften produces measurement errors. It is possible to treat functional data as fullyobserved when the measurements are dense and the noise level is low (Hall et al.,2001; Cardot et al., 2003; Zhu and Cox, 2009; Zhu et al., 2010). However, in mostcircumstances, it is necessary to convert the discrete measurements to functions thatcan be evaluated on any subset of the domain, referred to as smoothing. Smoothingreduces the effect of measurement errors, and better smoothing leads to less biasedresults in further analyses (see, e.g., Hitchcock et al. (2006)).
Existing approaches for smoothing functional data can be divided into threeoverlapping categories (see, e.g., Ramsay and Silverman (2005)): (1) methods based onrepresentations with basis functions such as B-splines, Fourier series, and wavelets; (2)nonparametric smoothing with kernels; and (3) roughness-penalty-based methods suchas smoothing spline. Although these existing smoothing methods are computationallytractable and generally available in standard statistical softwares, they mainly focuson smoothing each individual curve separately rather than smoothing all curves at thesame time, thus failing to borrow strength across all observations. Such a failure maycause the following problems: (1) The order of smoothness of each curve may vary acrossall functional observations even if they are assumed to be independent and identicallydistributed (i.i.d.). This problem is severe when functional data are sparse and measuredon uncommon grids. (2) The systematic patterns shared by all observations could beblurred or wiped out. This problem becomes more severe when the signal-to-noise-ratio(SNR) is low.
In these regards, we propose a model-based approach for smoothing all functionalobservations simultaneously and nonparametrically. In particular, we assume that allfunctional observations are i.i.d. Gaussian processes (GPs) subject to a common levelof additive measurement errors, which facilitates the borrowing of strength across alldata and the simultaneous smoothing based on the hierarchical GP structures. The GPprior is a nonparametric prior widely used in Bayesian nonparametric regression, spatialmodeling, and machine learning (see, e.g., Rasmussen and Williams (2006), Banerjeeet al. (2008), Banerjee et al. (2013), and Banerjee et al. (2014)). Recently, GP prior hasalso been increasingly employed in Bayesian FDA. For instance, GP has been used asthe prior for functional batch effects (Kaufman et al., 2010) and as the base measurefor a Dirichlet process prior (Nguyen and Gelfand, 2014) in functional ANOVA. GPregression has also been used in FDA (see, e.g., Shi and Choi (2011), Shi et al. (2012),and Wang and Shi (2014)), providing a nonparametric linkage between a functionalpredictor and a functional response. Despite the wide applicability of GP, most existingapproaches assume pre-specified parametric structures for the covariance kernel such assquared exponential or Matern, and the parameters in the kernel function often needto be pre-determined, which causes a lack of flexibility and introduces potential biases.
imsart-ba ver. 2014/10/16 file: FinalVersion_BA967.tex date: July 28, 2015
J. Yang et al. 3
We contrast our proposed approach with existing GP methods for exploiting aBayesian hierarchical model with a GP prior for the mean curve and an Inverse-Wishartprocess (IWP) prior for the covariance surface. By assuming the IWP prior, ourapproach avoids possible biases caused by the mis-specification of the covariance kernelas commonly used in the existing methods. Furthermore, our method has the flexibilityof allowing the scale parameter of IWP to adjust a smooth covariance surface to beeither stationary or nonstationary, which provides more flexible posterior covarianceestimation as well as more accurate smoothing of functional observations
In addition, through borrowing strength across all curves, our approach facilitatesthe smoothing of sparse functional data measured on uncommon grids. An individualcurve contains much less information about the functional observation when it isobserved at very few grid points. Smoothing individual curves one-at-a-time is extremelydifficult in this case. With the assumption that the functional observations share thecommon mean and covariance, our Bayesian approach can simultaneously smooth allcurves on a pooled, dense grid, by treating functional values at unobserved grid pointsas parameters (or missing values) and updating them during a Markov Chain MonteCarlo (MCMC) procedure.
Finally, our proposed Bayesian inferential procedure also produces mean andcovariance estimation as by-products. Functional mean-covariance estimation hasalready been extensively investigated in the literature. Existing approaches includethe sample estimation (Ramsay and Silverman, 2005), the roughness-penalty-basedmethod (Rice and Silverman, 1991, page 22), and the Principal Analysis by ConditionalExpectation (PACE) method with local polynomial smoothing (Yao et al., 2005a).Regarding the mean-covariance estimation, our proposed method can be considered as aBayesian counterpart of PACE. PACE aims to estimate eigenvalues and eigenfunctionsof the covariance surface with irregularly spaced longitudinal data (Yao et al., 2005a,b;Muller, 2005; Leng and Muller, 2006). It also produces mean-covariance estimatesas by-products. The main idea of PACE is to first formulate a “raw” covarianceusing pooled sparse longitudinal measurements and then apply a two-dimensionallocal polynomial smoother to estimate the covariance. Smoothing based on thepooled raw data has the effect of borrowing strength from all data; performing localpolynomial smoothing has a similar effect as performing Bayesian smoothing with a GPprior. Therefore, the mean-covariance estimates produced by our approach should becomparable with the ones produced by PACE. In comparison with PACE, however, ourBayesian approach offers the benefit of full posterior inference for all latent processesand parameters, such as credible intervals and simultaneous credible bands for themean curve and the covariance surface. These uncertainties are hard to quantify in afrequentist approach such as PACE. Furthermore, our method avoids the selection ofoptimal bandwidths for local polynomial smoothing as required in PACE, which can besensitive to different selection methods.
Accordingly, the main contributions of our proposed approach can be summarizedas follows: (1) It facilitates simultaneous smoothing of all functional observations. (2)It preserves systematic patterns that are common across all curves. (3) It avoids thepotential bias caused by the mis-specification of the covariance function. (4) It is
imsart-ba ver. 2014/10/16 file: FinalVersion_BA967.tex date: July 28, 2015

4 Smoothing and mean-covariance estimation of functional data
flexible enough to accommodate functional data with common or uncommon grids,dense or sparse measurements, as well as stationarity or nonstationarity. (5) It resultsin mean-covariance estimates as by-products, with full Bayesian characterization of theuncertainties.
To demonstrate the performance of our proposed method, we considered simulationstudies with synthetic data as well as two case studies with real spectroscopyand metabolic data. The results are compared with alternative methods based onsingle-curve smoothing (e.g., smoothing spline and kernel smoothing) as well asPACE. In simulation studies with noisy functional data based on either stationary ornonstationary covariances, we find that our proposed approach recovers the true signalsmore accurately than those single-curve smoothing methods. In real case studies, we findthat our method retains systematic patterns that were wiped out by the single-curvesmoothing methods. Regarding the mean-covariance estimation, our proposed approachis comparable with the PACE method as expected.
The remainder of this article is organized as follows: In Section 2, we outline thedetails of the proposed Bayesian hierarchical model as well as the heuristic empiricalBayes approach used to determine hyperparameters. In Section 3, we describe theMCMC algorithm for posterior inference. Results of simulations and real case studiesare presented in Sections 4 and 5, respectively. Discussion is provided in Section 6.
2 Unified Bayesian hierarchical model
2.1 Model description
Suppose that the functional data contain n independent trajectories, denoted by{Yi(·); i = 1, 2, · · · , n}, and the ith trajectory has pi measurements on grid ti ={ti1, · · · , tipi}. Further assume that the ith trajectory Yi(·) depends on an underlyingGP Zi(t), t ∈ T , through the following model:
Yi(tij) = Zi(tij) + εij , tij ∈ T , i = 1, · · · , n, j = 1, · · · , pi, (2.1)
where {Zi(·)} are i.i.d. GPs with mean function µ(·) and covariance kernel Σ(·, ·),denoted by Zi ∼ GP (µ,Σ). The covariance kernel satisfies Σ(s, t) = E[(Zi(s) −µ(s))(Zi(t) − µ(t))], ∀s, t ∈ T . The error terms {εij} are assumed to be i.i.d. randomnormal variables, i.e., εij ∼ N(0, σ2
ε ), and independent of {Zi(·)}. We assume thefollowing priors for the model parameters σ2
ε , µ(·), and Σ(·, ·):
σ2ε ∼ Inverse-Gamma(aε, bε), (µ | Σ) ∼ GP
(µ0,
1
cΣ
), Σ ∼ IWP(δ,Ψ), (2.2)
where Inverse-Gamma(aε, bε) denotes an Inverse Gamma distribution with shapeparameter aε and scale parameter bε. The scaling parameter c in the GP prior satisfiesc > 0. Here IWP(δ,Ψ) denotes the IWP with shape parameter δ and scaling parameterΨ. An IWP is defined such that, on any finite grid t = {t1, t2, · · · , tp} with p points, theprojection Σ(t, t) is Inverse-Wishart distributed, i.e., Σ(t, t) ∼ IW(δ,Ψ(t, t)). Here the
imsart-ba ver. 2014/10/16 file: FinalVersion_BA967.tex date: July 28, 2015

J. Yang et al. 5
Inverse-Wishart distribution follows the parametrization of Dawid (1981). In particular,a symmetric and positive definite matrix Σ(t, t) is said to be IW(δ,Ψ(t, t)) distributedif K = Σ(t, t)−1 is Wishart distributed with degrees of freedom δ + p − 1 and scalematrix Ψ(t, t)−1.
The advantage of adopting the parameterization of Dawid (1981) is two-fold: theparameter δ does not vary with the dimension of t, and the resulting Inverse-Wishartdistribution is consistent under marginalization. These properties are essential inshowing that the IWP prior for Σ(·, ·) is well-defined when the number of grid points papproaches infinity. This is summarized in Proposition 2.1. Proposition 2.1 essentiallystates that IWP(δ,Ψ) is a well-defined (infinite-dimensional) probability measure and itsfinite-dimensional projection on grid t×t coincides with the Inverse-Wishart distributionIW(δ,Ψ(t, t)). The proof can be derived through following similar arguments as in theproof of Lemma 2 in the Appendix of Zhu et al. (2014).
Proposition 2.1. Let T ⊆ R be a compact set and δ > 4 be a positive integer. Supposethat Ψ : T × T → R is a symmetric and positive semi-definite mapping, i.e., anyevaluation of Ψ on a finite grid t×t ⊆ T ×T gives a symmetric and positive semi-definitematrix. Then there exists a unique probability measure λ on (RT ×T ,B(RT ×T )), suchthat for any finite discretization t, λt×t = IW(δ,Ψ(t, t)). We denote λ = IWP(δ,Ψ).
In the prior distribution of Σ ∼ IWP(δ,Ψ), a smaller value of δ leads to a lessinformative prior; the parameter Ψ controls the prior covariance structure. To encouragea smoother estimation of the covariance, we set Ψ(·, ·) = σ2
sA(·, ·), where σ2s is a
positive scaling parameter and A(·, ·) is a smooth correlation/covariance kernel whichcan be either stationary or nonstationary. The structure of A(·, ·) may be nonparametricor of parametric form with hyperparameters. In this paper, we use the Maternparameterization as an example of the stationary correlation structure, i.e., Ψ(ti, tj) =σ2s Materncor(|ti − tj |; ρ, ν), where the Matern correlation kernel Materncor(d; ρ, ν) is
defined as
Materncor(d; ρ, ν) =1
Γ(ν)2ν−1
(√2νd
ρ
)νKν
(√2νd
ρ
), d ≥ 0, ρ > 0, ν > 0.
In the above expression, d denotes the distance between two measurement points; ρ isthe scale parameter; ν is the order; and Kν(·) is the modified Bessel function of thesecond kind. One of the important properties of the Matern covariance kernel is itspositive definiteness (Stein, 1999). Both ρ and ν can influence the smoothness of thesignal estimates. We choose ν > 2 so that the resulting GP is bν−1c times differentiable,which ensures the smoothness of the underlying data. It is also convenient to take ν tobe an integer plus 0.5, in which case the Matern correlation kernel has a closed-formexpression. For example, if ν = 2.5, the correlation kernel A(·, ·) takes the form
A(ti, tj) =
(1 +
√5|ti − tj |ρ
+5(|ti − tj |)2
3ρ2
)exp
(−√
5|ti − tj |ρ
). (2.3)
Notice that the Matern structure is sensitive to both ρ and ν, while the estimation ofthese parameters can be unstable. Zhang (2004) has pointed out in a geostatistical setup
imsart-ba ver. 2014/10/16 file: FinalVersion_BA967.tex date: July 28, 2015
6 Smoothing and mean-covariance estimation of functional data
that not all three parameters (σ2s , ρ, ν) in the Matern class can be estimated consistently.
To ensure a stable covariance estimation, we set ρ and ν at fixed values obtainedfrom empirical correlation estimation, by minimizing the mean square error betweenan empirical correlation estimate and the Materncor(ρ, ν) function. The hyperprior forσ2s is set to be σ2
s ∼ Gamma(as, bs), i.e., a Gamma distribution with shape parameteras and inverse scale parameter bs.
The above Bayesian hierarchical model is constructed based on infinite-dimensionalGPs. However, practical posterior calculations can only be conducted in a finite manner.Since we assume latent GPs in our model, posterior inference can be performed similarlyas in GP regression. In particular, the latent processes {Zi(·)} and the parameters µ(·),Σ(·, ·) will be inferred on a finite grid, while the inference on non-grid points, if needed,can be obtained by posterior prediction. Therefore, we will represent the likelihood formodel (2.1) and the priors (2.2) in multivariate forms through evaluating the functionson finite grids. Denoting Yi(ti) by Yti , Zi(ti) by Zti , model (2.1) implies that
Yti | Zti , σ2ε ∼ N(Zti , σ
2ε I), i = 1, · · · , n, (2.4)
Zti | µ(ti),Σ(ti, ti) ∼ N(µ(ti),Σ(ti, ti)), (2.5)
where I is a pi× pi identity matrix. Since the grids {ti; i = 1, 2, · · · , n} are not requiredto be common, we evaluate the GP and IWP prior distributions in (2.2) on the pooledgrid t = ∪ni=1ti. Denote µ(t) by µ, µ0(t) by µ0, Σ(t, t) by Σ and Ψ(t, t) by Ψ, then
µ | Σ ∼ N(µ0,
1
cΣ
), Σ ∼ IW(δ,Ψ). (2.6)
The multivariate representations in (2.4)–(2.6) enable us to write the joint posteriordistribution of ({Zi(t)},µ,Σ, σ2
ε , σ2s), based on which posterior sampling can be
performed by MCMC; details are presented in Section 3. The posterior means of {Zi(t)}will be treated as smoothed functional signals.
2.2 Prior parameter setup
The proposed Bayesian hierarchical model described in Section 2.1 contains severalhyper-parameters: (c,µ0, ν, ρ, aε, bε, as, bs). Their values are determined using empiricalmethods. In particular, we set c = 1, which implies that the functional mean hasGaussian prior with the same covariance kernel as the data. We set µ0 to be thesmoothed sample mean of {Yti} by existing methods. To facilitate stable covarianceestimation, we take ν and ρ as their empirical estimates ν and ρ respectively. Theempirical estimates can be obtained by minimizing the mean square error betweenan empirical correlation estimate and a Materncor(D; ρ, ν) correlation function withdistance matrix D, subject to ρ > 0 and ν ≥ 2.5.
The values of (aε, bε, as, bs) are determined using a heuristic empirical Bayesapproach with empirical estimates of {σ2
ε , σ2s}, which is described as follows:
imsart-ba ver. 2014/10/16 file: FinalVersion_BA967.tex date: July 28, 2015

J. Yang et al. 7
• The value of σ2ε can be easily obtained using a differencing technique
(Von Neumann, 1941)
σ2ε =
1
2∑ni=1(pi − 1)
n∑i=1
pi−1∑j=1
(Yi(ti(j+1))− Yi(tij))2. (2.7)
• A moment estimator of σ2s can be derived by taking expectation (with respect to
the prior distribution of Σ) and applying a trace operator to both sides of theequation Cov(Y (t)) = Σ + σ2
ε I:
trace(E{Cov(Y (t))}) =trace(Ψ)
δ − 2+ σ2
ε trace(I) =σ2strace(A)
δ − 2+ pσ2
ε ,
σ2s ≈ trace(E{Cov(Y (t))})− pσ2
ε
trace(A)/(δ − 2), (2.8)
where p is the length of the pooled grid t; σ2ε is given by (2.7); and E{Cov(Y (t))}
can be estimated by an empirical method, e.g. the covariance estimate by PACE(Yao et al., 2005b).
• The values of (aε, bε, as, bs) can be estimated by the method of moments with theprior distributions of σ2
ε , σ2s and the empirical estimates in (2.7) and (2.8).
3 Posterior inference with MCMC
Based on the multivariate representations (2.4)–(2.6), we derive the joint posteriordistribution and develop a MCMC algorithm for posterior inference in this section.Denote the observed data by Y = {Yt1 ,Yt2 , · · · ,Ytn}; denote the underlying GPevaluations on the observational grids by Z = {Zt1 ,Zt2 , · · · ,Ztn}; and denote the
evaluations on the pooled grid by Z = {Z1(t), Z2(t), · · · , Zn(t)}. Recall that t = ∪itiis the pooled grid. Let Z∗ = Z \Z, i.e. Z∗ = {Zt∗1
,Zt∗2, · · · ,Zt∗n
}, where Zt∗i= Zi(t
∗i )
and t∗i = t \ ti is the set of grid points for the ith trajectory with missing observations.The joint posterior density of all parameters can be written as
f(Z,µ,Σ, σ2ε , σ
2s |Y) ∝ f(Y |Z, σ2
ε )f(Z|µ,Σ)f(σ2ε )f(µ|Σ)f(Σ|σ2
s)f(σ2s)
∝ f(Y |Z, σ2ε )f(Z∗|Z,µ,Σ)f(Z|µ,Σ)f(σ2
ε )f(µ|Σ)f(Σ|σ2s)f(σ2
s). (3.1)
Here we have factored the joint prior of Z as f(Z|µ,Σ) = f(Z∗|Z,µ,Σ)f(Z|µ,Σ),which enables the updates of Z and Z∗ by a Gibbs sampler. To design a MCMCalgorithm of the Gibbs sampler, we need to derive conditional distributions for the latentvariables Z, Z∗ and the model parameters µ,Σ, σ2
s , σ2ε . For brevity, we only present the
conditional posterior distributions of Z and Z∗ in Section 3.1 . The derivation of theconditional posteriors for the remain parameters are trivial due to the conjugacy of theirpriors.
imsart-ba ver. 2014/10/16 file: FinalVersion_BA967.tex date: July 28, 2015

8 Smoothing and mean-covariance estimation of functional data
3.1 Conditional posteriors
In case that all functional data are observed on a common grid, i.e. {ti ≡ t; i =1, 2, · · · , n}, then Z∗ vanishes and the conditional posterior distribution of Zti canbe derived from
f(Zti |Yti ,µ,Σ, σ2ε ) ∝ f(Yti |Zti ,µ,Σ, σ
2ε )f(Zti |µ,Σ),
which gives
(Zti |Yti ,µ,Σ, σ2ε ) ∼ N(µi, Vi), (3.2)
Vi =((1/σ2
ε )I + Σ−1)−1
;
µi = Vi
((1/σ2
ε )Yti + Σ−1µ(ti)), where Σ = Σ(ti, ti).
In case that functional data are collected on uncommon grids, we will first updateZt∗i
from
(Zt∗i|Zti ,µ,Σ) ∼ N(µ∗i ,V
∗i ), (3.3)
µ∗i = µ(t∗i ) + Σ(t∗i , ti)Σ(ti, ti)
−1(Zti − µ(ti)) = BiZti − ui,
where Bi = Σ(t∗i , ti)Σ(ti, ti)−1, ui = Biµ(ti)− µ(t∗i );
V ∗i = Σ(t∗i , t
∗i )− Σ(t∗i , ti)Σ(ti, ti)
−1Σ(ti, t∗i ).
Then update Zti from the conditional posterior distribution
f(Zti |Yti ,µ,Σ, σ2ε ,Zt∗i
) ∝ f(Yti |Zti ,µ,Σ, σ2ε )f(Zti |µ,Σ)f(Zt∗i
|Zti ,µ,Σ), (3.4)
which gives
(Zti |Yti ,Zt∗i,µ,Σ, σ2
ε ) ∼ N(µi, Vi), (3.5)
Vi =((1/σ2
ε )I + Σ(ti, ti)−1 +BT
i (V ∗i )−1Bi
)−1;
µi = Vi
((1/σ2
ε )Yti + Σ(ti, ti)−1µ(ti) +BT
i (V ∗i )−1(ui +Zt∗i)).
When t∗ and t are both dense, the conditional variance V ∗i in (3.3) can be very
close to a zero matrix, which could cause numerical instability when inverting V ∗i . In
this case, we suggest using the conditional mean in (3.3) as a sample for Zt∗iin the
MCMC algorithm and removing the conditional prior f(Zt∗i|Zti ,µ,Σ) from (3.4) when
updating Zti (note that now (3.5) collapses to (3.2)).
3.2 MCMC algorithm
Based on the joint posterior distributions derived from (3.1), we design a MCMCalgorithm for posterior sampling as follows:
Step 0: Set initial values. Set (µ, σ2ε ) to be the empirical estimates, Z to be the raw
data Y , and Σ to be an identity matrix. The prior parameters (c,µ0, ν, ρ, aε, bε, as, bs)are set as described in Section 2.2.
imsart-ba ver. 2014/10/16 file: FinalVersion_BA967.tex date: July 28, 2015

J. Yang et al. 9
Step 1: Conditional on Y and current values of (µ,Σ), update Z∗ and Z. In the generalcase where all data are observed on uncommon grids, update Z∗ and Z from (3.3) and
(3.5) alternatively. In the case of common grids, update Z (identical to Z) from (3.2).
Step 2: Conditional on Y and current values of Z, update the noise variance σ2ε by
(σ2ε |Y ,Z) ∼ Inverse-Gamma
(aε +
∑ni=1 pi2
, bε +1
2
n∑i=1
[(Yti −Zti)
T (Yti −Zti)])
.
Step 3: Conditional on current values of Z = Z ∪Z∗ and Σ, update µ from
(µ|Z,Σ) ∼ N
(1
n+ c
(n∑i=1
Zi(t) + cµ0
),
1
n+ cΣ
).
Step 4: Conditional on current values of Z = Z ∪Z∗ and µ, update Σ from
(Σ|Z,µ) ∼ IW (n+ δ + 1,Q) , Q = (Z−µJ)(Z−µJ)T +c(µ−µ0)(µ−µ0)T +σ2sA,
where Z denotes a matrix with columns {Zi(t)}; J = (1, · · · , 1) is a vector of ones withlength p; and matrix A is given by equation (2.3).
Step 5: Given current values of Σ, update σ2s from
(σ2s |Σ) ∼ Gamma
(as +
(δ + p− 1)p
2, bs +
1
2trace(AΣ−1)
).
Repeat Steps 1 ∼ 5 for a large number of iterations until convergence is achieved.
For the simulations and real case studies in Sections 4 and 5, we ran 10, 000 MCMCiterations after a burn-in period of 2, 000 iterations. The convergence of the MCMCchains were diagnosed by the Gelman and Rubin diagnostic method (Gelman and Rubin,1992; Sarkka and Aki, 2014).
4 Simulation studies
Two simulation studies were performed for functional data with stationary andnonstationary covariance, respectively. Within each study, we analyzed functionalobservations on both common and uncommon grids.
4.1 Simulation 1: functional data with stationary covariance
Two types of functional data with stationary covariance were generated with commonand uncommon grids. The underlying smooth functional data were generated from aGP with mean µ(t) = 3 sin(4t) and covariance kernel Σ(s, t) = 5 Materncor(|s− t|; ρ, ν),where ρ = 0.5, ν = 3.5, and s, t ∈ [0, π/2]. Each dataset contained n = 50 observations.
imsart-ba ver. 2014/10/16 file: FinalVersion_BA967.tex date: July 28, 2015

10 Smoothing and mean-covariance estimation of functional data
The common grid contained p = 80 equally spaced grid points on [0, π/2]. Noise terms{εij ; i = 1, · · · , n, j = 1, · · · , p} were independently generated from N(0, σ2
ε ) with σε =√5/2, and then added to the smooth functional data, resulting the final dataset with
SNR equal to 2. In the uncommon grid case, we randomly retained data on 60% of thecommon grid points, which resulted in moderately sparse functional data on uncommongrids. Two sample curves for the common and uncommon grid cases are shown in Figure1(a, b), where the gray lines/line-segments denote the raw data.
Based on the data generated above, we applied the MCMC algorithm in Section3.2 to obtain posterior samples. Taking the common grid case as an example, we setδ = 5, ρ = 0.503, ν = 3.459, σ2
ε = 1.239, and σ2s = 10.750 using empirical estimation
methods. With σ2ε and σ2
s , we obtained values for the hyperprior parameters {aε =0.807, bε = 1, as = 214.990, bs = 20}. The posterior means of the parameters werecalculated by averaging 10, 000 posterior samples. The parameter σ2
ε , with true value1.250, had posterior mean 1.244 and 95% credible interval [1.187, 1.302]. The parameterσ2s , with unidentifiable true value, had posterior mean 73.443 and 95% credible interval
[69.700, 77.620].
In Figure 1(a, b), we display the smoothed curves (black solid lines), together withthe raw data (gray lines/line segments), the 95% pointwise credible intervals (blackdash-dot lines), and the underlying true smooth curves (blue dots) for the common(frame (a)) and uncommon grid (frame (b)) cases. The heat maps of our Bayesiancorrelation estimates are shown in Figure 1(c, d) for common (frame (c)) and uncommon(frame (d)) grid cases. In contrast, we also plotted the heat map of the sample correlationin the common grid case in Figure 1(e), and the heat map of the underlying truecorrelation in Figure 1(f). These plots show that our method can recover the truesmooth signals accurately for both common and uncommon grid cases, while providinga much smoother correlation estimate than the sample estimate in Figure 1(e). Eventhough around 40% of the grid points are missing in each trajectory, the results ofsmoothing and mean-covariance estimation as in Figure 1(a, d) are almost as good asthe common grid results as in Figure 1(b, c).
To further assess the performance of the proposed method, we compared the resultswith four alternative smoothing methods: best possible least square (BLS) estimation,smoothing spline with cubic splines applied to each individual curve (Spline), kernelsmoothing with local polynomials applied to each individual curve (Kernel), and PACE.The BLS method served as an “oracle” model, in which the smoothed curves wereestimated by the conditional mean of the latent GPs, while assuming the true mean andcovariance of the latent processes were known. In the common grid case, the conditionalmean and covariance for each signal can be written as
E{Zi|Yi,µ,Σ} = µ+ Σ(Σ + σ2εI)−1(Yi − µ),
Cov(Zi|Yi,µ,Σ) = Σ−Σ(Σ + σ2εI)−1Σ,
which can be easily derived from the joint Gaussian distribution of Yi and Zi. Weobtained the Spline and Kernel estimates using R (R Core Team, 2013) functionssmooth.spline and locpoly from the KernSmooth library. The smoothing parameterin the former function was determined by generalized cross-validation (GCV) and
imsart-ba ver. 2014/10/16 file: FinalVersion_BA967.tex date: July 28, 2015

J. Yang et al. 11
0 0.5 1 1.5
−10
−5
0
5
(a)
0 0.5 1 1.5
−10
−5
0
5
(b)
(c)
0 0.5 1 1.5
0
0.5
1
1.5
(d)
0 0.5 1 1.5
0
0.5
1
1.5(e)
0 0.5 1 1.5
0
0.5
1
1.5
(f)
0 0.5 1 1.5
0
0.5
1
1.5
0 0.2 0.4 0.6 0.8 1
Figure 1: Simulation 1: (a) Two sample curves for functional observations in the commongrid case (gray lines), superimposed by the Bayesian smoothed curves (black solid lines),along with the 95% pointwise credible intervals (black dashed lines) and the true signals(blue dots); (b) plots (same as in (a)) for the uncommon grid case; (c) heat map of ourBayesian correlation estimate in the common grid case; (d) heat map (same as in (c))in the uncommon grid case; (e) heat map of the sample correlation in the common gridcase; (f) heat map of the true underlying (Martern) correlation.
the smoothing parameter in the latter function was selected by a direct plug-inapproach using the dpill function. We chose degree = 1 in the locpoly function(equivalent to local linear smoothing). For the Spline and Kernel methods, weestimated the mean curve by averaging individually smoothed curves. The PACEmethod was implemented with a Matlab package developed by Yao et al. (2005b)(http://www.stat.ucdavis.edu/PACE/).
To quantitatively measure the goodness of smoothing and mean-covarianceestimation, we repeated the above simulation 100 times for the common grid case. We
calculated the root integrated mean square errors (RIMSEs), defined by (∫ π/20
(Z(t) −Z(t))2dt)1/2 for signal estimates and by (
∫ π/20
∫ π/20
(Σ(s, t)−Σ(s, t))2dsdt)1/2 for surfaceestimates, where the integrations were approximated by the trapezoidal rule. Wecompared the mean RIMSEs of our Bayesian estimates with the ones from alternative
imsart-ba ver. 2014/10/16 file: FinalVersion_BA967.tex date: July 28, 2015
12 Smoothing and mean-covariance estimation of functional data
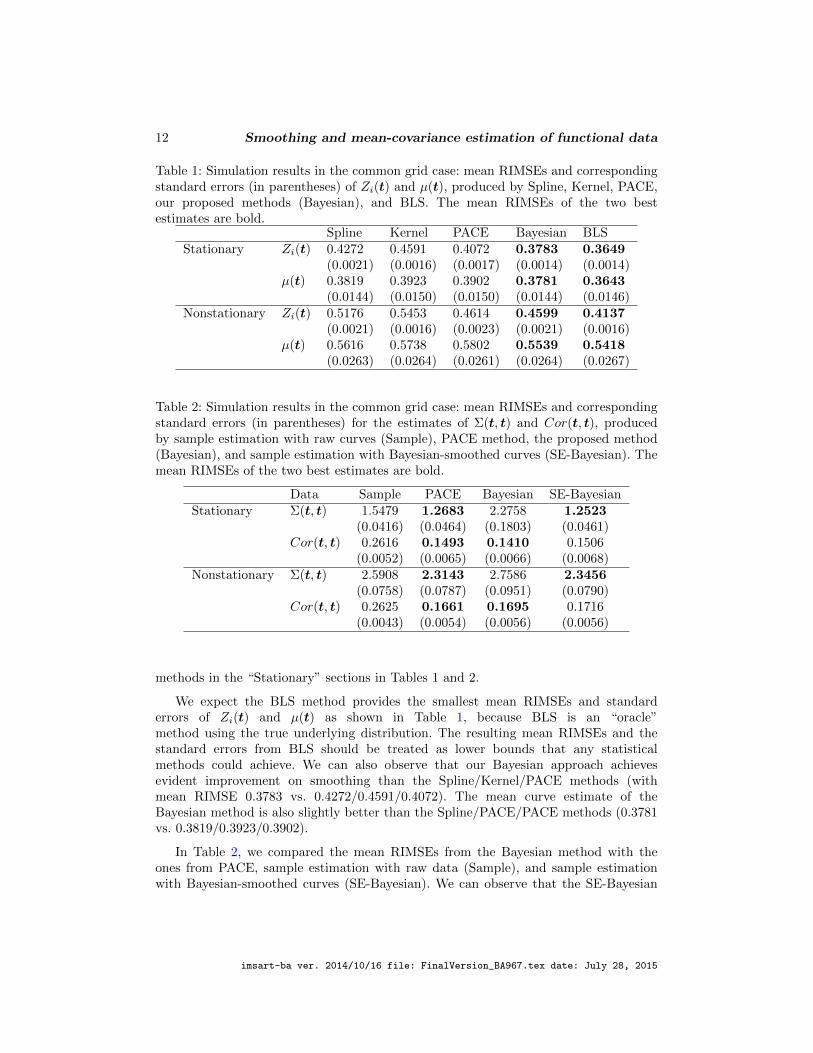
Table 1: Simulation results in the common grid case: mean RIMSEs and correspondingstandard errors (in parentheses) of Zi(t) and µ(t), produced by Spline, Kernel, PACE,our proposed methods (Bayesian), and BLS. The mean RIMSEs of the two bestestimates are bold.
Spline Kernel PACE Bayesian BLSStationary Zi(t) 0.4272 0.4591 0.4072 0.3783 0.3649
(0.0021) (0.0016) (0.0017) (0.0014) (0.0014)µ(t) 0.3819 0.3923 0.3902 0.3781 0.3643
(0.0144) (0.0150) (0.0150) (0.0144) (0.0146)Nonstationary Zi(t) 0.5176 0.5453 0.4614 0.4599 0.4137
(0.0021) (0.0016) (0.0023) (0.0021) (0.0016)µ(t) 0.5616 0.5738 0.5802 0.5539 0.5418
(0.0263) (0.0264) (0.0261) (0.0264) (0.0267)
Table 2: Simulation results in the common grid case: mean RIMSEs and correspondingstandard errors (in parentheses) for the estimates of Σ(t, t) and Cor(t, t), producedby sample estimation with raw curves (Sample), PACE method, the proposed method(Bayesian), and sample estimation with Bayesian-smoothed curves (SE-Bayesian). Themean RIMSEs of the two best estimates are bold.
Data Sample PACE Bayesian SE-BayesianStationary Σ(t, t) 1.5479 1.2683 2.2758 1.2523
(0.0416) (0.0464) (0.1803) (0.0461)Cor(t, t) 0.2616 0.1493 0.1410 0.1506
(0.0052) (0.0065) (0.0066) (0.0068)Nonstationary Σ(t, t) 2.5908 2.3143 2.7586 2.3456
(0.0758) (0.0787) (0.0951) (0.0790)Cor(t, t) 0.2625 0.1661 0.1695 0.1716
(0.0043) (0.0054) (0.0056) (0.0056)
methods in the “Stationary” sections in Tables 1 and 2.
We expect the BLS method provides the smallest mean RIMSEs and standarderrors of Zi(t) and µ(t) as shown in Table 1, because BLS is an “oracle”method using the true underlying distribution. The resulting mean RIMSEs and thestandard errors from BLS should be treated as lower bounds that any statisticalmethods could achieve. We can also observe that our Bayesian approach achievesevident improvement on smoothing than the Spline/Kernel/PACE methods (withmean RIMSE 0.3783 vs. 0.4272/0.4591/0.4072). The mean curve estimate of theBayesian method is also slightly better than the Spline/PACE/PACE methods (0.3781vs. 0.3819/0.3923/0.3902).
In Table 2, we compared the mean RIMSEs from the Bayesian method with theones from PACE, sample estimation with raw data (Sample), and sample estimationwith Bayesian-smoothed curves (SE-Bayesian). We can observe that the SE-Bayesian
imsart-ba ver. 2014/10/16 file: FinalVersion_BA967.tex date: July 28, 2015
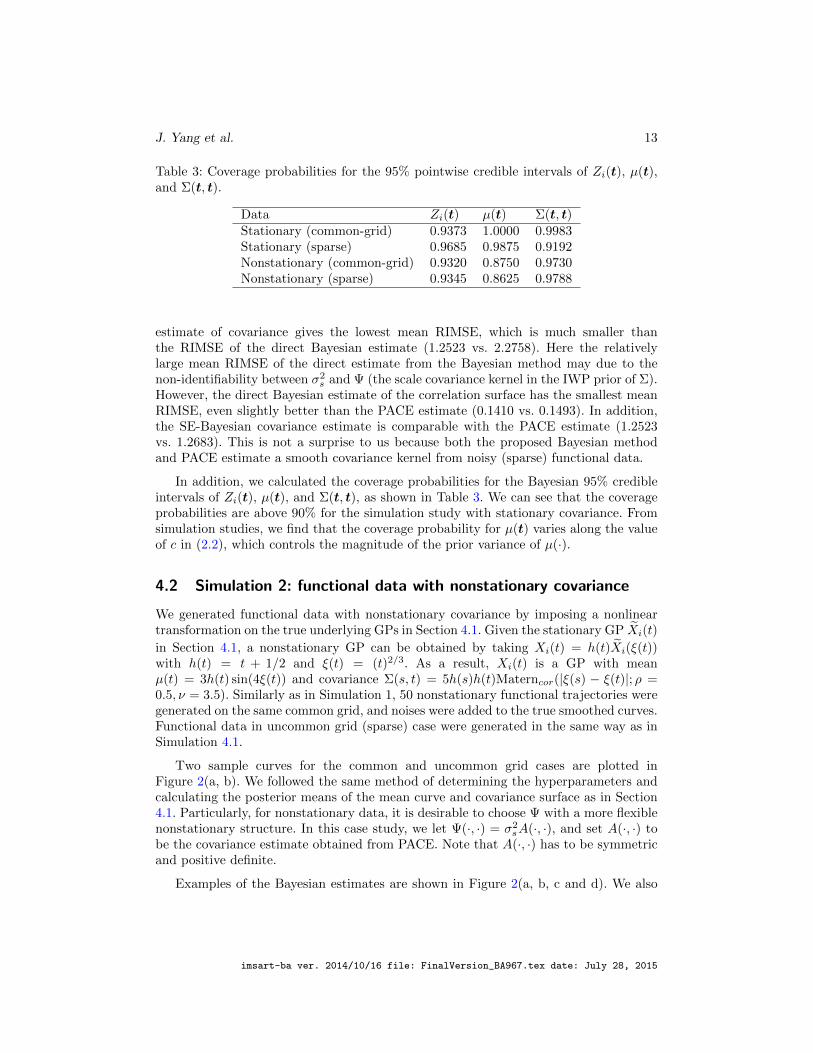
J. Yang et al. 13
Table 3: Coverage probabilities for the 95% pointwise credible intervals of Zi(t), µ(t),and Σ(t, t).
Data Zi(t) µ(t) Σ(t, t)Stationary (common-grid) 0.9373 1.0000 0.9983Stationary (sparse) 0.9685 0.9875 0.9192Nonstationary (common-grid) 0.9320 0.8750 0.9730Nonstationary (sparse) 0.9345 0.8625 0.9788
estimate of covariance gives the lowest mean RIMSE, which is much smaller thanthe RIMSE of the direct Bayesian estimate (1.2523 vs. 2.2758). Here the relativelylarge mean RIMSE of the direct estimate from the Bayesian method may due to thenon-identifiability between σ2
s and Ψ (the scale covariance kernel in the IWP prior of Σ).However, the direct Bayesian estimate of the correlation surface has the smallest meanRIMSE, even slightly better than the PACE estimate (0.1410 vs. 0.1493). In addition,the SE-Bayesian covariance estimate is comparable with the PACE estimate (1.2523vs. 1.2683). This is not a surprise to us because both the proposed Bayesian methodand PACE estimate a smooth covariance kernel from noisy (sparse) functional data.
In addition, we calculated the coverage probabilities for the Bayesian 95% credibleintervals of Zi(t), µ(t), and Σ(t, t), as shown in Table 3. We can see that the coverageprobabilities are above 90% for the simulation study with stationary covariance. Fromsimulation studies, we find that the coverage probability for µ(t) varies along the valueof c in (2.2), which controls the magnitude of the prior variance of µ(·).
4.2 Simulation 2: functional data with nonstationary covariance
We generated functional data with nonstationary covariance by imposing a nonlineartransformation on the true underlying GPs in Section 4.1. Given the stationary GP Xi(t)
in Section 4.1, a nonstationary GP can be obtained by taking Xi(t) = h(t)Xi(ξ(t))with h(t) = t + 1/2 and ξ(t) = (t)2/3. As a result, Xi(t) is a GP with meanµ(t) = 3h(t) sin(4ξ(t)) and covariance Σ(s, t) = 5h(s)h(t)Materncor(|ξ(s) − ξ(t)|; ρ =0.5, ν = 3.5). Similarly as in Simulation 1, 50 nonstationary functional trajectories weregenerated on the same common grid, and noises were added to the true smoothed curves.Functional data in uncommon grid (sparse) case were generated in the same way as inSimulation 4.1.
Two sample curves for the common and uncommon grid cases are plotted inFigure 2(a, b). We followed the same method of determining the hyperparameters andcalculating the posterior means of the mean curve and covariance surface as in Section4.1. Particularly, for nonstationary data, it is desirable to choose Ψ with a more flexiblenonstationary structure. In this case study, we let Ψ(·, ·) = σ2
sA(·, ·), and set A(·, ·) tobe the covariance estimate obtained from PACE. Note that A(·, ·) has to be symmetricand positive definite.
Examples of the Bayesian estimates are shown in Figure 2(a, b, c and d). We also
imsart-ba ver. 2014/10/16 file: FinalVersion_BA967.tex date: July 28, 2015

14 Smoothing and mean-covariance estimation of functional data
0 0.5 1 1.5
−10
−5
0
5
10
(a)
0 0.5 1 1.5
−10
−5
0
5
10
(b)
(c)
0 0.5 1 1.5
0
0.5
1
1.5
(d)
0 0.5 1 1.5
0
0.5
1
1.5(e)
0 0.5 1 1.5
0
0.5
1
1.5
(f)
0 0.5 1 1.5
0
0.5
1
1.5
0 0.2 0.4 0.6 0.8 1
Figure 2: Simulation 2: (a) two sample curves in the common grid case (gray lines),superimposed by the Bayesian estimates (black solid lines), along with the 95% pointwisecredible intervals (black dash-dot lines) and the true signals (blue dots); (b) curve plot(same as (a)) for the uncommon grid case; (c) heat map of our Bayesian correlationestimate in the common grid case; (d) heat map (same as (c)) in the uncommon gridcase; (e) heat map of the sample correlation estimate (common grid case); (f) heat mapof the true underlying (nonstationary) correlation surface.
plotted the heat map of the sample correlation in the common grid case in Figure
2(e) and the heat map of the true underlying correlation in Figure 2(f). The mean
RIMSEs (from 100 repeated simulations of the common grid case) for {Zi(t)}, µ(t),
and Σ(t, t) are displayed in the “Nonstationary” sections of Tables 1 and 2. In addition,
the coverage probabilities of the 95% Bayesian credible intervals for {Zi(t)}, µ(t), and
Σ(t, t) are displayed in the “Nonstationary” section of Table 3. The nonstationary results
in Tables 1, 2 and 3 show similar patterns as in the stationary case studies. In particular,
the proposed Bayesian approach produces the best smooth signal and mean estimates
with the lowest mean RIMSEs.
imsart-ba ver. 2014/10/16 file: FinalVersion_BA967.tex date: July 28, 2015
J. Yang et al. 15
5 Real case studies
We use two real datasets with different levels of noise to show that our proposedBayesian method produces accurate smooth estimates for the functional signals andmean-covariance.
5.1 Spectroscopy data with low levels of noise
In this application, we analyzed the spectroscopy data that were produced in a cervicalpre-cancer study. The goal of the study was to diagnose early-stage cervical cancerwith spectroscopy measurements (Yamal et al., 2012). This data contain n = 462spectroscopy measurements produced by a multi-spectral digital colposcopy (MDC)device (Buys et al., 2012). When taking the measurements, an operator puts a probein contact with the cervical tissues; the device then ejects a beam of light through theprobe onto the tissues and records the spectrum intensities of the reflected light througha white-light filter in the device. Each measurement contains intensity values (log10transformed) ranging over emission wavelengths from 410 to 700 nanometer (nm). Thespectroscopy data are collected on dense emission wavelengths (a case of common grid).We took intensity values at 1/3 of the equally spaced emission wavelengths as ourobservations (training data), and treated the values at the remaining 2/3 wavelengthsas the validation data for prediction purposes. Figure 3(a) shows three raw curves ontheir original scale (before the log10 transformation).
We then applied our Bayesian method on the training data (log10 transformed),with δ = 5 and hyperpriors set by the heuristic empirical Bayes method in Section 2.2.The values of the prior parameters were taken as: aε = 1117.759, bε = 1, as = 0.905,bs = 5, ρ = 369.716, ν = 3.190. The Bayesian estimates for σ2
ε and σ2s were 9.339×10⁻⁵
with 95% credible interval (9.199×10⁻⁵, 9.488×10⁻⁵), and 196.655 with 95% confidenceinterval (173.679, 220.693), respectively.
We plotted the smoothed curves by the Kernel method in Figure 3(b), the onesby the Spline method in Figure 3(c), and the ones by our Bayesian method in Figure3(d) together with 95% pointwise credible intervals. One can observe that all localfeatures in the raw data are completely wiped out by the kernel estimates in Figure 3(b),which may due to the over-estimation of the smoothing parameter. In contrast, boththe Spline and the Bayesian methods successfully preserved these features. However,because of the inherent nature of independently smoothing in the Spline method, theamount of smoothness varies across curves. For example, in Figure 3(c), the red andgreen curves appear to be slightly smoother than the blue curve, while our Bayesianmethod produces signal estimates with about the same amount of smoothness. This realdata analysis demonstrates that our proposed Bayesian method is capable of preservingshared features by borrowing strength across all observations.
Due to low levels of noise, the influence of smoothing on the covariance estimationwith this spectroscopy data is almost negligible. In such a situation one would expecta good correlation estimate to have a similar structure as the sample estimate. Figure4 shows the heat maps of the correlation estimates given by sample estimate with raw
imsart-ba ver. 2014/10/16 file: FinalVersion_BA967.tex date: July 28, 2015

16 Smoothing and mean-covariance estimation of functional data
0
5
10
15
x 105 (a)
0
5
10
15
x 105 (b)
450 500 550 600 650 7000
5
10
15
x 105 (c)
450 500 550 600 650 7000
5
10
15
x 105 (d)
Figure 3: Case study on spectroscopy data: (a) three raw spectroscopy curves; (b)smooth estimates by the Kernel method; (c) smooth estimates by the Spline method; (d)smooth estimates by our Bayesian method along with 95% pointwise credible intervals(black dashed curve).
curves in frame (a), Bayesian method in frame (b), PACE in frame (c) and sampleestimate with Bayesian smoothed curves in frame (d). The Bayesian estimate (Figure4(b)) and the sample estimate with Bayesian smoothed curves (Figure 4(d)) are veryclose to the sample estimate based on the raw data (Figure 4(a)). Although the PACEestimate in Figure 4(c) shows a similar main structure, it appears to have differentdetails around emission wavelength 500nm (marked by red circles in Figure 4), from theother three estimates.
We used the remaining 2/3 validation data to assess the prediction performanceof the Bayesian method, compared with three alternative methods – Spline, Kerneland PACE. For the Spline method, the values on the validation grid points could beeasily predicted with the estimated splines coefficients. For the Kernel/PACE/Bayesianmethods, predicted values at the validation points were obtained using linearinterpolation. Due to low noise levels in the spectroscopy data, we simply treatedthe observed values as true data and calculated the RMSEs as in Table 4. Here,the Bayesian method achieves the smallest RMSE, demonstrating the benefit of
imsart-ba ver. 2014/10/16 file: FinalVersion_BA967.tex date: July 28, 2015

J. Yang et al. 17
Figure 4: Heat maps of the correlation estimates by the sample estimation with rawdata in (a), Bayesian method in (b), PACE in (c), and sample estimation with Bayesiansmoothed data in (d).
simultaneous smoothing on prediction.
Table 4: RMSEs for predictions on the validation grids.Spline Kernel PACE Bayesian0.020 0.039 0.025 0.017
5.2 Metabolic data with high levels of noise
We also studied a metabolic dataset from a study of obese children. The data werecollected in the Children’s Nutrition Research Center (CNRC) at the Baylor Collegeof Medicine. We considered a subset of the data that contained energy expenditure(EE) measurements of 44 obese children. These measurements were collected everyminute over a 100-minute period during their sleeping time. Therefore, each trajectorycan be treated as the evaluation of an energy function over time. These raw curves
imsart-ba ver. 2014/10/16 file: FinalVersion_BA967.tex date: July 28, 2015

18 Smoothing and mean-covariance estimation of functional data
20 40 60 80 100
0.4
0.6
0.8
1
1.2
1.4
1.6
(a)
20 40 60 80 100
0.4
0.6
0.8
1
1.2
1.4
1.6
(b)
20 40 60 80 100
0.4
0.6
0.8
1
1.2
1.4
1.6
(c)
Figure 5: (a): Bayesian signal estimates (black solid) with 95% credible intervals (blackdashed) and raw observations (gray); (b): signal estimates by the Spline method; (c):signal estimates by the Kernel method.
appear to fluctuate frequently, implying potentially high levels of noise; three sampleraw trajectories are plotted with the color gray in Figure 5(a).
We applied the proposed Bayesian method to this dataset, using the common gridmodel (n < p). We set δ = 5 and set A(·, ·) as a Matern correlation kernel, which led tosignal estimates with similar level of variations (the black solid curves in Figure 5(a)).In comparison with the Bayesian method, the Spline method produces excessive localvariations in all three curves (Figure 5(b)), and the Kernel smoothing method showsclear over-smoothing for all three curves (Figure 5(c)).
6 Discussion
We have proposed a model-based nonparametric Bayesian method to smooth allfunctional observations simultaneously and estimate the mean and covariance functionsbased on GPs. Specifically, we adopted a hierarchical framework by assuming a GPprior for the mean function and an IWP prior for the covariance function. The proposedmethod facilitats borrowing strength across all functional observations in simultaneoussmoothing and an automatic mean-covariance estimation in the posterior inference.
Simulation studies show that our method produces smoothed signal estimates thatare the closest to the “oracle” BLS estimates among all methods compared, andthe resulting smoothed data lead to improved covariance estimation. In the real casestudy with spectroscopy data, our method demonstrates the most accurate predictionof function values at the validation wavelengths among all methods compared. The
imsart-ba ver. 2014/10/16 file: FinalVersion_BA967.tex date: July 28, 2015

J. Yang et al. 19
real case study with metabolic data shows that the smoothed signal estimates by ourapproach retain consistent patterns, while the alternative methods lost systematic trendscommon across all curves.
In our approach, posterior inference is performed by evaluating GPs on finite grids.To evaluate them on a new grid in posterior sampling in the most convenient way,one needs to perform posterior predictive sampling based on the conditional Gaussiandistribution for smoothed data and to conduct a two-dimensional interpolation for thecovariance surface while restricting the interpolated surface to be symmetric and positivedefinite. When dealing with functional data on uncommon grids, our approach involvesevaluating mean and covariance functions on the pooled grid, which can be extremelydense and cause numerical problems. For example, the covariance matrices on densegrids are likely to be singular, thus inverting these matrices in (3.2), (3.3), (3.5) wouldbe problematic. In such a case, sampling from a multivariate normal distribution witha nearly singular covariance matrix and sampling from an Inverse-Wishart distribution(in the MCMC steps) with a nearly singular scale matrix might also be challenging.These are common numerical issues encountered in GP models due to dense grids.
Many solutions have been proposed to deal with the intensive computational burdenand numerical issues caused by dense grids. The essential idea is to approximate a largematrix or its inverse using a low rank matrix. Comprehensive reviews can be found inRasmussen and Williams (2006, Chapter 8.), Quinonero Candela et al. (2007), and Shiand Choi (2011) for example. An efficient approximation method by adopting a linearrandom projection has also been proposed by Banerjee et al. (2013). In our simulationsand real case studies, we employed numerical schemes such as using the technique ofgeneralized inverse and converting a non-positive definite matrix to a positive definitematrix by replacing its non-positive eigenvalues with fairly small positive numbers,that is, the so-called jittering. Similar strategies have been adopted in the PACE (Yaoet al., 2005b) as well. For problems involving large-scale matrix computations, moreadvanced low-rank approximation techniques can be integrated into our MCMC steps tofurther improve scalability. In terms of the computational scalability, our current MCMCalgorithm is able to handle a moderately large dataset with O(104) observational points.Alternatively, instead of representing the functional data on grids, we can also adoptbasis representations for functional data with an appropriately selected basis system.
Acknowledgments
The authors would like to thank all colleagues in the PO1 project (supported by NIH grantPO1-CA-082710) for collecting the spectroscopy data and the Children’s Nutrition ResearchCenter at the Baylor College of Medicine for providing the metabolic data (funded by NationalInstitute of Diabetes and Digestive and Kidney Diseases Grant DK-74387 and the USDA/ARSunder Cooperative Agreement 6250-51000-037). The research of Taeryon Choi was supportedby Basic Science Research Program through the National Research Foundation of Korea (NRF)funded by the Ministry of Education, Science and Technology (No. 2012R1A1A2041370). Theauthors are grateful for all of the comments from the editor, the associate editor, and tworeferees. Last but not least, the authors greatly appreciate Kirsten Herold of the Writing Lab(School of Public Health, University of Michigan) and Xiaowei Wu (Department of Statistics,Virginia Tech) for their help with editing this article.
imsart-ba ver. 2014/10/16 file: FinalVersion_BA967.tex date: July 28, 2015
20 Smoothing and mean-covariance estimation of functional data
ReferencesBanerjee, A., Dunson, D. B., and Tokdar, S. T. (2013). “Efficient Gaussian process
regression for large datasets.” Biometrika, 100(1): 75–89. 2, 19
Banerjee, S., Carlin, B. P., and Gelfand, A. E. (2014). Hierarchical modeling and analysisfor spatial data. Crc Press. 2
Banerjee, S., Gelfand, A. E., Finley, A. O., and Sang, H. (2008). “Gaussian predictiveprocess models for large spatial data sets.” Journal of the Royal Statistical Society:Series B (Statistical Methodology), 70(4): 825–848. 2
Buys, T. P., Cantor, S. B., Guillaud, M., Adler-Storthz, K., Cox, D. D., Okolo, C.,Arulogon, O., Oladepo, O., Basen-Engquist, K., Shinn, E., et al. (2012). “Opticaltechnologies and molecular imaging for cervical neoplasia: a program project update.”Gender medicine, 9(1): S7–S24. 15
Cardot, H., Ferraty, F., and Sarda, P. (2003). “Spline estimators for the functionallinear model.” Statistica Sinica, 13(3): 571–592. 2
Dawid, A. P. (1981). “Some matrix-variate distribution theory: notationalconsiderations and a Bayesian application.” Biometrika, 68(1): 265–274. 5
Gelman, A. and Rubin, D. B. (1992). “Inference from iterative simulation using multiplesequences.” Statistical science, 457–472. 9
Hall, P., Poskitt, D. S., and Presnell, B. (2001). “A Functional DataAnalytic Approachto Signal Discrimination.” Technometrics, 43(1): 1–9. 2
Hitchcock, D. B., Casella, G., and Booth, J. G. (2006). “Improved estimation ofdissimilarities by presmoothing functional data.” Journal of the American StatisticalAssociation, 101(473): 211–222. 2
Kaufman, C. G., Sain, S. R., et al. (2010). “Bayesian functional ANOVA modeling usingGaussian process prior distributions.” Bayesian Analysis, 5(1): 123–149. 2
Leng, X. and Muller, H.-G. (2006). “Classification using functional data analysis fortemporal gene expression data.” Bioinformatics, 22: 68–76. 3
Muller, H.-G. (2005). “Functional modeling and classification of longitudinal data.”Scandinavian J. Statistics, 32: 223–240. 3
Nguyen, X. and Gelfand, A. E. (2014). “Bayesian nonparametric modeling for functionalanalysis of variance.” Annals of the Institute of Statistical Mathematics, 66(3):495–526. 2
Quinonero Candela, J., E., R. C., and Williams, C. K. I. (2007). “ApproximationMethods for Gaussian Process Regression.” Technical report, Applied Games,Microsoft Research Ltd. 19
R Core Team (2013). R: A Language and Environment for Statistical Computing . RFoundation for Statistical Computing, Vienna, Austria.URL http://www.R-project.org/ 10
imsart-ba ver. 2014/10/16 file: FinalVersion_BA967.tex date: July 28, 2015

J. Yang et al. 21
Ramsay, J. O. and Dalzell, C. (1991). “Some tools for functional data analysis.” Journalof the Royal Statistical Society. Series B (Methodological), 539–572. 2
Ramsay, J. O. and Silverman, B. W. (2002). Applied functional data analysis: methodsand case studies, volume 77. Springer New York. 2
— (2005). Functional data analysis. Springer Series in Statistics. Springer, New York,second edition. 2, 3
Rasmussen, C. E. and Williams, C. K. I. (2006). Gaussian Processes for MachineLearning . Adaptive Computation and Machine Learning. MIT Press, Cambridge,MA. 2, 19
Rice, J. A. and Silverman, B. W. (1991). “Estimating the Mean and CovarianceStructure Nonparametrically When the Data Are Curves.” Journal of the RoyalStatistical Society, Series B , 53: 233–243. 3
Sarkka, S. and Aki, V. (2014). “MCMC Diagnostics for Matlab.” http: // becs.
aalto. fi/ en/ research/ bayes/ mcmcdiag/ . 9
Shi, J. Q. and Choi, T. (2011). Gaussian process regression analysis for functional data.CRC Press, Boca Raton, FL. 2, 19
Shi, J. Q., Wang, B., Will, E. J., and West, R. M. (2012). “Mixed-effectsGaussian process functional regression models with application to dose-response curveprediction.” Stat. Med., 31(26): 3165–3177. 2
Stein, M. L. (1999). Interpolation of spatial data: some theory for kriging . Springer. 5
Von Neumann, J. (1941). “Distribution of the ratio of the mean square successivedifference to the variance.” The Annals of Mathematical Statistics, 12(4): 367–395. 7
Wang, B. and Shi, J. Q. (2014). “Generalized Gaussian process regression model fornon-Gaussian functional data.” J. Amer. Statist. Assoc., 109(507): 1123–1133. 2
Yamal, J.-M., Zewdie, G. A., Cox, D. D., Atkinson, E. N., Cantor, S. B., MacAulay,C., Davies, K., Adewole, I., Buys, T. P., and Follen, M. (2012). “Accuracy of opticalspectroscopy for the detection of cervical intraepithelial neoplasia without colposcopictissue information; a step toward automation for low resource settings.” Journal ofbiomedical optics, 17(4): 047002–047002. 15
Yao, F., Muller, H.-G., and Wang, J.-L. (2005a). “Functional Data Analysis for SparseLongitudinal Data.” Journal of the American Statistical Association, 100(470):577–590. 3
— (2005b). “Functional linear regression analysis for longitudinal data.” The Annalsof Statistics, 33(6): 2873–2903. 3, 7, 11, 19
Zhang, H. (2004). “Inconsistent estimation and asymptotically equal interpolations inmodel-based geostatistics.” Journal of the American Statistical Association, 99(465):250–261. 5
Zhu, H. and Cox, D. D. (2009). “A functional generalized linear model with curveselection in cervical pre-cancer diagnosis using fluorescence spectroscopy.” In
imsart-ba ver. 2014/10/16 file: FinalVersion_BA967.tex date: July 28, 2015

22 Smoothing and mean-covariance estimation of functional data
Optimality , volume 57 of IMS Lecture Notes Monogr. Ser., 173–189. Inst. Math.Statist., Beachwood, OH. 2
Zhu, H., Strawn, N., and Dunson, B. D. (2014). “Bayesian graphical models formultivariate functional data.” arXiv:1411.4158 [stat.ME] .URL http://arxiv.org/abs/1411.4158 5
Zhu, H., Vannucci, M., and Cox, D. D. (2010). “A Bayesian Hierarchical Model forClassification with Selection of Functional Predictors.” Biometrics, 66: 463–473. 2
imsart-ba ver. 2014/10/16 file: FinalVersion_BA967.tex date: July 28, 2015