smart grid transitions: system solutions and consumer
TRANSCRIPT

General rights Copyright and moral rights for the publications made accessible in the public portal are retained by the authors and/or other copyright owners and it is a condition of accessing publications that users recognise and abide by the legal requirements associated with these rights.
Users may download and print one copy of any publication from the public portal for the purpose of private study or research.
You may not further distribute the material or use it for any profit-making activity or commercial gain
You may freely distribute the URL identifying the publication in the public portal If you believe that this document breaches copyright please contact us providing details, and we will remove access to the work immediately and investigate your claim.
Downloaded from orbit.dtu.dk on: Nov 25, 2021
Smart grid Transitions: System solutions and consumer behaviour
Sønderberg Petersen, Leif; Berg, Rikke Brinkø; Bergaentzlé, Claire; Bolwig, Simon; Skytte, Klaus
Publication date:2017
Link back to DTU Orbit
Citation (APA):Sønderberg Petersen, L., Berg, R. B., Bergaentzlé, C., Bolwig, S., & Skytte, K. (Eds.) (2017). Smart gridTransitions: System solutions and consumer behaviour. DTU Management Engineering.

Smart grid Transitions System solutions and consumer behaviour
August 2017
Smart transmissionand distribution
Distributed energy
resources
Renewable energy resources
Centralised power and heat generation
CCS
Electrification of transportCompressed airStorage
Pumped hydro
Smart energy system control
➝

CONTRIBUTION TO FULFILLMENT OF THE SUSTAINABLE DEVELOPMENT GOALS
The research projects that are discussed in this report have contributed to the fulfilment of the following Sustainable Development Goals (SDGs):
7 - Affordable and clean energy;
8 - Decent work and economic growth;
9 - Industry, innovation and infrastructure;
11 - Sustainable cities and communities;
13 - Climate action;
17 - Partnerships to achieve the goals.
Read more about the Sustainable Development Goals at https://sustainabledevelopment.un.org/
Edited by: Leif Sønderberg Petersen, Rikke Brinkø, Claire Bergaentzlé, Simon Bolwig, and Klaus SkytteDesign and print: STEPPhotos: Colourbox unless otherwise statedISBN 978-87-93458-51-2August 2017Front cover illustration from “Spotlight on Smart and Strong Power T&D Infrastructure”,published by International Smart Grid Action Network, May 2016The production of this publication received financial support from EUDP (Energiteknologisk Udviklings- og demonstrationsprogram) under the Danish Energy Agency.
2

CONTENTS
KEY FINDINGS . . . . . . . . . . . . . . . . . . . . . . . . . . . . . . . . . . . . . . . . . . . . . . . . . . . . . . . . . . . . . . . . 4
THE DANISH MODEL. . . . . . . . . . . . . . . . . . . . . . . . . . . . . . . . . . . . . . . . . . . . . . . . . . . . . . . . . . 5
The current residential electricity sector in Denmark . . . . . . . . . . . . . . . . . . . . . . . 5
Energy regulation and taxes . . . . . . . . . . . . . . . . . . . . . . . . . . . . . . . . . . . . . . . . . . . . . 6
District heating as flexibility provider . . . . . . . . . . . . . . . . . . . . . . . . . . . . . . . . . . . . . 6
SYSTEMS SOLUTIONS . . . . . . . . . . . . . . . . . . . . . . . . . . . . . . . . . . . . . . . . . . . . . . . . . . . . . . . . . 8
Flexibility and demand response . . . . . . . . . . . . . . . . . . . . . . . . . . . . . . . . . . . . . . . . . . . . . . . 8
Flexibility by means of large-scale aggregated systems . . . . . . . . . . . . . . . . . . . . . . . 7
Benefits and challenges of demand response . . . . . . . . . . . . . . . . . . . . . . . . . . . . . . . 9
Flexibility via energy markets. . . . . . . . . . . . . . . . . . . . . . . . . . . . . . . . . . . . . . . . . . . . 11
The EcoGrid EU demonstration project for large-scale smart grids . . . . . . . . . . . . . . . . . 14
Smart grid conformance tests . . . . . . . . . . . . . . . . . . . . . . . . . . . . . . . . . . . . . . . . . . . . . . . . . 16
Towards fully renewable energy systems in Denmark . . . . . . . . . . . . . . . . . . . . . . . . . . . . . 16
CONSUMER BEHAVIOUR AND BUILDINGS . . . . . . . . . . . . . . . . . . . . . . . . . . . . . . . . . . . . . 18
Consumer behaviour in transitions to new energy systems . . . . . . . . . . . . . . . . . . . . . . . . 18
How do users adopt new technologies? . . . . . . . . . . . . . . . . . . . . . . . . . . . . . . . . . . . 18
Users as important stakeholders in the development of smart grids . . . . . . . . . . . 19
The contribution of passive consumers to demand response . . . . . . . . . . . . . . . . . 20
A social science based agenda for research on smart grids . . . . . . . . . . . . . . . . . . . 21
Experience with consumer communications and involvement . . . . . . . . . . . . . . . 21
Smart meters and smart apps . . . . . . . . . . . . . . . . . . . . . . . . . . . . . . . . . . . . . . . . . . . . . . . . . . 22
The variability of energy use in residential buildings . . . . . . . . . . . . . . . . . . . . . . . . . . . . . . 24
Technology and the social aspects are equally important . . . . . . . . . . . . . . . . . . . . . . . . . . 25
REFERENCES. . . . . . . . . . . . . . . . . . . . . . . . . . . . . . . . . . . . . . . . . . . . . . . . . . . . . . . . . . . . . . . . . . 26
3

KEY FINDINGS
This publication summarises a selection of research projects contributing to the objectives of Annex 7 of the ISGAN project on smart grids.
Among the key findings is that reaching a fully renewable energy system is not only a matter of electricity infrastructure, but also requires an emphasis on other aspects, for example, market mechanisms that support renewable energy integration and enhance flexibility. Demand response, electric vehicles and storage, and synergies with gas and electricity systems are well-known ways of increasing flexibility.
Current market structures and framework conditions facilitate demand response to a lesser extent, and consequently its most beneficial aspects cannot be accessed. Novel market structures should be investigated in conjunction with the development of detailed demand response models.
The Nordic power market is the main driver of flexibility in the Nordic region. The market was not originally designed to handle large shares of variable renewable energy (VRE), which requires certain rules to be redesigned. Regarding regulatory framework conditions, flexibility is not an explicit goal of existing policies, and both drivers and barriers exist to it. An important potential for flexibility in the region is the coupling of electricity markets with the markets for heat, gas and transportation.
Political and social initiatives to promote changing energy behaviour are just as important as technological developments. Government
information policies and market-based instruments aimed at influencing the energy choices of consumers often ignore the fact that consumer behaviour is not fully reducible to individuals making rational and conscious decisions. To achieve a transition to sustainable energy, an approach that goes beyond individual consumer choice and puts shared routines and system change at its heart is needed.
The focus on social practices will help the move away from a technology push approach to smart grids. The provision and consumption of energy is usually not a goal in itself: rather, the energy system enables all kind of social activities that need energy, ranging from the energy needed to provide comfort (heating and cooling in houses) to almost all forms of communication and entertainment.
The vision of the tech-savvy individual who, through smart appliances, can draw on detailed, personalized energy data, make rational decisions based on them and act diligently on the insights he has acquired has not yet been realized.
However, in the EcoGrid EU project at Bornholm, the customers themselves have contributed to balancing electricity generation and load in the power system. The results showed that a real-time price signal can be used to activate flexible consumption. It also demonstrated that the greatest peak load reduction in households is achieved when using equipment that enables an automatic response to price signals, as opposed to when using manual solutions.
4

THE DANISH MODEL
The Danish experiences have shown that, by means of a consistent energy policy with ambitious renewable energy goals, enhanced energy efficiency and support for technical innovation and industrial development, it is possible to sustain significant economic growth, a high standard of living and a high level of security of energy supply, while reducing fossil fuel dependency and mitigat-ing climate change.
The Danish model is fairly unique, as Denmark has historically been one of the most successful countries in supporting the deployment of wind-power generating capac-ities. Starting from 1979, capacity increased steadily (Figure 1). Major wind-power developments are planned. As of today, wind power is supplemented by non-negligible solar-power capacities, reaching nearly 800 MW by the end of 2015.
The successful deployment of capacities and subsequent integration of renewable energy generation is part of a broader evolution from a centralized to a decentralized system of power generation in the country (Pinson, 2017).
The current residential electricity sector in DenmarkResidential electricity consumption accounts for about 30% of total electricity consump-tion. There are approximately 2.8 million residential customers in Denmark. For households and other small consumers, there is currently no legal requirement to measure electricity consumption on an hourly basis: it is sufficient to record consumption monthly or annually. A smart grid strategy drawn up in 2013 envisages metering and settlement by the hour for all consumers by 2020. (Danish Ministry of Climate, Energy and Building, 2013).
Figure 1: Evolution of installed wind power capacities as well as wind power penetration in Denmark. (Pinson, 2017).
Inst
alle
d Ca
paci
ty (G
W)
Shar
e (%
)
Year
1980
6 45
5 40
35
30
25
20
15
10
5
0
4
3
2
1
01986 1992 1998 2004 2010 2015
5

The retail electricity market in Denmark has been fully liberalized since January 2003. All electricity consumers have the freedom to choose their electricity supplier. However, use of the electricity network is not part of the free market. The electricity infrastructure is a natural monopoly, both locally (distribution) and nationally (transmission)
Energy regulation and taxesThe Danish Energy Regulatory Authority (DERA) monitors the activities of energy companies. The TSO Energinet.dk has a broad range of obligations, including market monitoring tasks.
Danish energy taxes are three times the European averageHousehold customers in Denmark pay a comparatively high price for electricity. The cost of energy represents only around 20% of the overall price, and energy taxes are three times the European average. The low share of the cost of energy in the total household energy bill means that the price signals from the market that should stimulate demand response are diluted thus lowering the response. (Kitzing, 2016).
District heating as flexibility provider46% of the net demand for heating in
Figure 2: Electricity market roles and contractual relations: Suppliers enter into a standard contract with Danish Energy Net, the umbrella organisation of network companies. Distribution System Operators (DSOs) are responsible for operating and maintaining the lower voltage infrastructure. The DSO is responsible for metering and owns the meters. The Danish Transmission System Operator (TSO) is responsible for operating and maintaining the high and medium voltage infrastructure. The company is a monopoly owned by the Danish state and regulated based on a cost-plus system. Balancing Responsible Parties are economically responsible towards the TSO to have a balanced portfolio in every single hour. (Kitzing, 2016).
Grid Market
Agreement on balancingresponsibility
Connection andmetering
Commercial or defaultsupply contract
Supplieragreement
Commercialsupply andbalancingagreement
TSO
DSO
BRP
Supplier
Consumer
DSOagreement
6

Denmark is currently covered by district heating, mainly produced by combined heat and power (CHP) plants. Interactions with the district heating system can provide additional flexibility in operating the electric power system by generating heat from CHP plants during periods of high electricity prices or from heat pumps and electric boilers during low electricity price periods. In addition, heat storage, combined with relocation technologies, can provide cost-ef-fective energy storage capacity. Exploiting the existing synergies between these systems can improve the efficiency and flexibility of the overall system and facilitate the penetration
of renewable energy sources. Large-scale heat pumps, electric boilers and heat storage have been investigated as sustainable alternatives to CHPs. However, major challenges remain to the large-scale development of these technologies, among others the current taxes on electricity-based heating (Pinson, 2017; Skytte et al, 2017).
Figure 3: Residential electricity prices in European countries. (Kitzing, 2016).
Den
mar
kG
erm
any
Irela
ndSp
ain
Port
ugal
Ital
yA
ustr
iaN
ethe
rland
sCy
prus
Bel
gium
Uni
ted
Kin
gdom
Swed
enLi
echt
enst
ein
Gre
ece
Nor
way
Latv
iaLu
xem
bour
gSl
oven
iaFr
ance
Finl
and
Slov
akia
Pola
ndCr
oati
aTu
rkey
Rom
ania
Esto
nia
Czec
h R
epub
licLi
thua
nia
Icel
and
Hun
gary
Mal
taM
onte
negr
oB
ulga
riaM
aced
onia
Alb
ania
Bos
nia
and.
..Ko
sovo
Serb
ia
Elec
tric
ity
pric
e (E
UR
/kW
h)0.40
VAT and other recoverable levies
Energy taxes and related levies
Energy, Supply, Network
0.35
0.30
0.25
0.20
0.15
0.10
0.05
0.00
7
SYSTEMS SOLUTIONSFlexibility and demand response
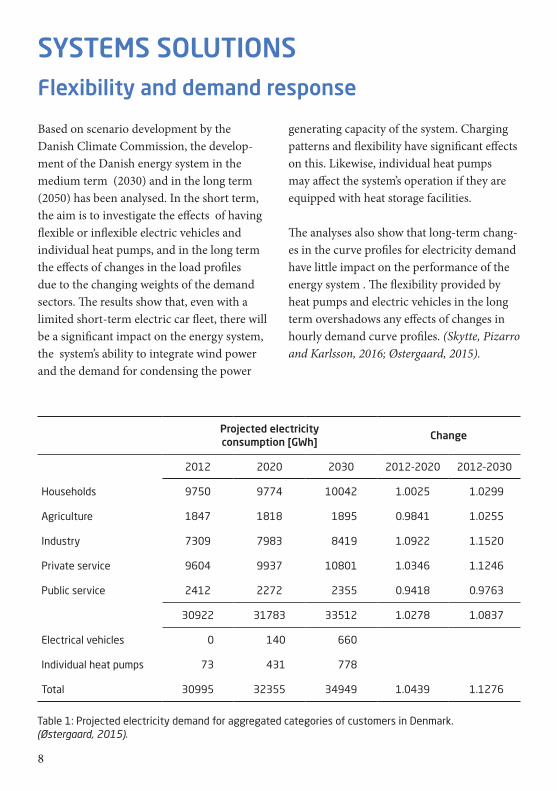
Based on scenario development by the Danish Climate Commission, the develop-ment of the Danish energy system in the medium term (2030) and in the long term (2050) has been analysed. In the short term, the aim is to investigate the effects of having flexible or inflexible electric vehicles and individual heat pumps, and in the long term the effects of changes in the load profiles due to the changing weights of the demand sectors. The results show that, even with a limited short-term electric car fleet, there will be a significant impact on the energy system, the system’s ability to integrate wind power and the demand for condensing the power
generating capacity of the system. Charging patterns and flexibility have significant effects on this. Likewise, individual heat pumps may affect the system’s operation if they are equipped with heat storage facilities.
The analyses also show that long-term chang-es in the curve profiles for electricity demand have little impact on the performance of the energy system . The flexibility provided by heat pumps and electric vehicles in the long term overshadows any effects of changes in hourly demand curve profiles. (Skytte, Pizarro and Karlsson, 2016; Østergaard, 2015).
Table 1: Projected electricity demand for aggregated categories of customers in Denmark. (Østergaard, 2015).
Projected electricity consumption [GWh]
Change
2012 2020 2030 2012-2020 2012-2030
Households 9750 9774 10042 1.0025 1.0299
Agriculture 1847 1818 1895 0.9841 1.0255
Industry 7309 7983 8419 1.0922 1.1520
Private service 9604 9937 10801 1.0346 1.1246
Public service 2412 2272 2355 0.9418 0.9763
30922 31783 33512 1.0278 1.0837
Electrical vehicles 0 140 660
Individual heat pumps 73 431 778
Total 30995 32355 34949 1.0439 1.1276
8

Flexibility by means of large-scale aggregated systems A large number of units with flexible power consumption are expected to be part of the future power system. In Denmark, examples of these units include electrical heat pumps for heating in buildings and electric vehicles with batteries that can be charged and discharged. If pooled together in a large-scale aggregated system, these smaller consump-tion units could potentially offer the power system flexibility. They can help to partially balance the fluctuating power production caused by renewable energy sources. In real-time electricity markets, the aggregated units can help minimize the imbalances caused by forecasting errors and in general provide ancillary services. Instead of tracking wind power directly, it is currently much more realistic to interface with electricity markets.
This is an example of a large-scale optimiza-tion problem that must be solved reliably and in real time. The so-called Douglas-Rachford splitting can be applied to solving this problem. The resulting power balancing performance runs in a closed loop, while the local constraints and objectives for each unit are satisfied and the aggregator operating costs are reduced (Halvgaard, Vandenberghe, Poulsen, Madsen and Jørgensen, 2016).
Benefits and challenges of demand responseDemand response has the potential to bring about a great number of benefits, but there are a number of challenges that must be overcome before it can be considered a valuable contribution to the power system. The overriding issue is the lack of experience
and understanding of the nature of demand response, particularly at the system level, where demand from many different sectors and applications is aggregated. Nonetheless it is clear that this resource is highly diverse, so using a single model type to represent all demand is unrealistic.
Similarly, it is evident that demand does not fit the conventional model of economic rationality. The interaction of end-users with demand and the constraints of appliances themselves mean that the resulting demand profile exhibits a non-linear, time varying, dynamic and stochastic relationship to price, even in the best-case scenario, where the price response is determined through the automated control rather than through a response from the end-user. (Møller
unit1
Aggregator
Electricity market
q
unit2
unitn
Figure 4: Aggregator role and portfolio of units. The aggregator gets a consumption plan q to follow from the market. (Halvgaard, Vanden-berghe, Poulsen, Madsen, and Jørgensen, 2016).
9

and Andersen, 2015; Katz, Andersen, and Morthorst, 2016)
It is therefore necessary to adopt novel approaches to modelling. In particular, models must be extended to incorporate demand of many different types, to con-sider the aggregate behaviour at the system level and to show how it interacts with other system resources.
A further aspect of demand response that warrants attention is the uncertainty of the response. Demand is affected by a number of stochastic variables, including the weather and the sheer randomness of end-user behaviour, and consequently the response of demand to price or other control signals is uncertain.
If the intention is to use demand response for the provision of system services, it is imperative to determine the reliability with which the service can be provided.
Demand response, where it is currently employed, participates in the power market only to a limited extent. Current market structures are poorly suited to demand response, and consequently its most beneficial aspects cannot be accessed. Novel market structures should be investigated, and this should be conducted in conjunction with the development of detailed demand response models.
By considering demand response only in isolation, using simplistic models and in the context of existing market frameworks, a full and accurate assessment of the benefits of demand response cannot be made. Novel,
integrated approaches are required to reveal its full potential (O’Connell, Pinson, Madsen and O’Malley, 2014).
Load shift incentives for households Although the demand side is just one flexibility option among others, response from both traditional and new loads (e.g. heat pumps and electric vehicles) will play an increasingly important role in the future. If demand response is to become significant at the household level, we need to know how to make customers adopt flexible technologies and behaviour, as well as evaluate its potential costs and benefits. A large-scale field study has been started in southern Denmark to investigate this.
The results show that flexibility on the demand side can be a helpful and valuable strategy. It is important, however, to keep in mind the extent to which small consumers are able to contribute manually. The ideal case with elastic demand reacting to real-time price signals is likely to be limited to automat-ically controllable loads that can be shifted without any loss of comfort to the consumer. Traditional household demand is more likely to contribute through simplified signals. The ideal case produces significant benefits of around 7% in a new long-term equilibrium, but the effects of the simplified structures are clearly limited (Katz, 2015).
Demand response from supermarket refrigerationSupermarket refrigeration systems offer demand response capabilities, for example, for participation in the regulating power market. The energy-limited nature of demand response from refrigeration is the key
10

consideration in this context. By restricting the operating regions of the supermarket refrigeration system, there is a simple relationship between the available up- and down-regulation of power, and the available demand response can be represented in a manner that is sufficiently simple to communicate to a market operator in the form of a bid for the provision of regulating power. Two novel contributions to research into demand response have been used. The first is a method of defining block bids that populations of flexible demand units can offer to the power system or market operator. The block offers reflect the load-shifting abilities of individual demand units, given their flexibility in providing a response to the power system and the subsequent necessity of energy recovery. The second is an optimiza-tion framework to dispatch these block offers for demand response alongside conventional generating units for the provision of regu-lating power. An example of the results is presented in Table 2. See also the section on EnergyLab Nordhavn below.
Flexibility via energy markets The most likely developments in the Nordic and Baltic region will be the substantial pen-etration of VRE in the technology mix. This poses the challenge of managing greater levels of uncertainty and variability in the operation of power systems. To address this challenge, flexibility – defined in the Flex4RES project as a measure aimed at keeping a balance between generation and consumption – must be activated. A diverse mixture of resources on both the demand and supply sides and the role of enablers, such as grid infrastructure, are crucial to keep the necessary balance between supply and demand.
The Nordic power market is the main driver of flexibility in the region. Furthermore, interconnection capacity is well developed throughout the region. However, because the energy market was not originally designed to handle large shares of VRE, certain rules may have to be redesigned.
As a result of the typically higher costs of
Table 2: Cost reductions for regulating power procurement when the demand response resource is represented with a varying number of blocks. (O’Connell, Pinson, Madsen, and O’Malley, 2016).
B1 B2 B3
2 DR Block Offers 9.54% 18.10% 19.70%
3 DR Block Offers 17.10% 23.42% 21.25%
4 DR Block Offers 20.81% 23.42% 25.13%
5 DR Block Offers 21.23% 23.43% 25.13%
6 DR Block Offers 21.43% 23.63% 26.00%
Fully Modelled Demand 36.78% 41.80% 43.44%
Limited Temperatur Range 24.45% 28.72% 34.22%
11
flexible supply as compared to VRE, flexible plants are less profitable to operate and to invest in. In hours with little VRE generation, security of supply and resource adequacy could be challenged. Thus, an important open question for policy design is whether the existing Nordic power market can actually handle this problem without introducing capacity mechanisms.
Regarding the regulatory framework, flexibility is not an explicit goal of existing policy, and both drivers and barriers exist. Hydropower is a case in point. Restrictive directives concerning water and rivers limit both the deployment and the flexible operation of large-scale hydropower plants in most Nordic countries.
The role of nuclear power in the region will also have an impact on flexibility. Sweden has a policy which is increasingly loading financial conditions on nuclear producers, and Lithuania is phasing out nuclear power. These developments leave room for dispatchable technologies to keep operating, despite the fact that larger shares of VRE tend
to depress the price level and the number of hours with prices high enough to operate large dispatchable plants. Finland plans to add new nuclear facilities, thus increasing the inflexibility of the system and the need for other sources of flexibility.
An important potential for flexibility in the region is the coupling of electricity markets with the markets for heat, gas and transporta-tion which can be done both at transmission and distributed levels and should be done in a smart way in order to optimize the system stability.
Another important potential source of flexibility is VRE producers themselves. RES support schemes should be explicitly linked to market prices, and there must in addition be an explicit regulatory incentive for VRE producers to act flexibly (Bergaentzlé, Boscán, Skytte, Soysal and Olsen, 2016).
Analysing the electricity spot priceA way to analyse spikes and drops in the electricity spot price is to use the so-called Independent Spike Models (ISM) for
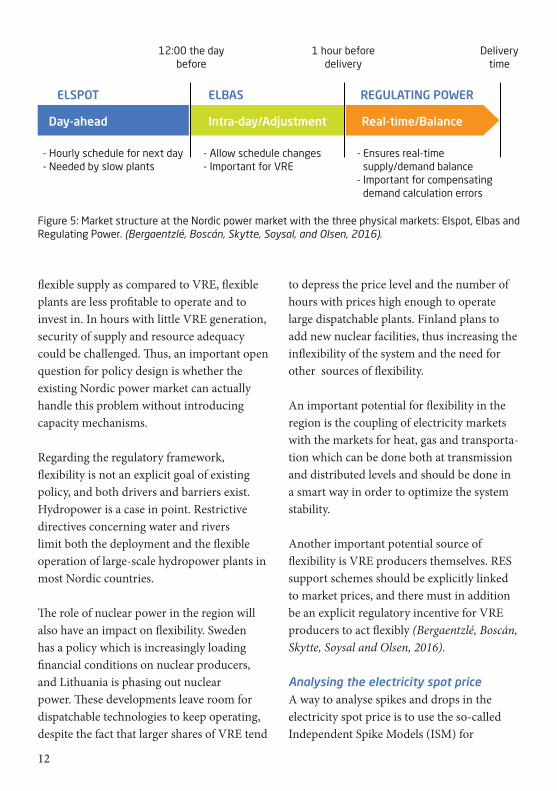
Figure 5: Market structure at the Nordic power market with the three physical markets: Elspot, Elbas and Regulating Power. (Bergaentzlé, Boscán, Skytte, Soysal, and Olsen, 2016).
12:00 the daybefore
- Hourly schedule for next day- Needed by slow plants
- Allow schedule changes- Important for VRE
- Ensures real-time supply/demand balance
- Important for compensating demand calculation errors
1 hour beforedelivery
Deliverytime
ELSPOT ELBAS REGULATING POWER
Day-ahead Intra-day/Adjustment Real-time/Balance
12

electricity spot prices that use regime switching. In a research project, these models were fitted to the Nord Pool spot data to characterize the size and intensity of these deviations. The model was then used to evaluate quantitatively the effects when modifying consumption in order to mimic how additional renewables are integrated into the power system, or conversely the effects when smoothing consumption by using strategies that can be implemented in smart grids. After considering several variables, it was found that consumption can improve forecasts in all directions (going to and from spikes or drops), resulting in a model that is significantly better statistically than the corresponding time-homogeneous model in describing the extreme dynamics in the Nord Pool electricity spot market (Lindström, Norén and Madsen, 2015).
Smart meters could enhance demand-side flexibilitySmart meters are being rolled out in most countries, and changes are being introduced in retail electricity markets. This is paving the way to developing demand-side flexi-bility further. However, it is the regulatory frameworks and the market conditions that ultimately determine what business models will emerge and will be consolidated. At present, there are no clear business cases for consumers to be flexible. In that respect, elec-tricity tariffs may have to be redesigned with the introduction of dynamic tariffs in order to strengthen the price signal transmitted by the wholesale market without distorting it and eventually to improve the business case for load adjustments (Bergaentzlé and Skytte 2017).
Overall, therefore, the Nordic-Baltic region has a quite flexible power system, but important challenges lie ahead, particularly those stemming from the greater reliance on VRE. Consequently, it is of fundamental importance to address the market and the regulatory changes that need to be introduced in a timely manner (Bergaentzlé, Boscán, Skytte, Soysal and Olsen, 2016).
Flexibility in power consumptionScandinavia was one of the first regions in the world to liberalize its electricity sector. The market operator for Scandinavia, now also covering other countries, such as the UK and the Baltic States, is Nord Pool. In both markets and operations, the forecasting of renewable energy generation is of the utmost importance. Denmark was one of the first countries to integrate forecasts into operational practice.
Flexibility in power system operation is high in Denmark, thanks to the system’s interconnections, as well as the CHP plants. Flexibility in electric power consumption is seen as providing a potentially new degree of freedom in power system operation, being also relatively cheap, or at least competitive with other flexibility options in terms of operational costs, while requiring limited investment costs. Substantial changes have also been made in the natural gas market. A gas exchange, Gaspoint Nordic, has been established so that the players have the market place they need to trade natural gas. Utilizing power-to-gas in Denmark reduces total system costs and the curtailment of wind power, thus highlighting the benefits of investing in this new technology (Pinson, 2017).
13

Figure 6: Complete architecture of the EcoGrid EU experiment, combining control aspects to emulate demand response, market concepts to operate it, as well as metering and settlement aspects. (Pinson, 2017).
Day-aheadmarket
Real-timemarket
TSO Retailer
DSO
SCADA
SCADA
Balancingmarket
Prices (o�-line, to be usedfor settlements)
Real-time pricePrice forecast
Settlement (e.g. monthlyor annual depending on
contract)
Meterreadings
Meterreadings
ControlControl andmonitoring
Smart meter
SettingsInformation
Electricity
ELECTRICITY NETWORK
Meter ValueData Base
Smart controller
DER device(Electric vehicle,
heat pump,micro CHP)
Non-smartappliances
The EcoGrid EU demonstration project for large-scale smart grids
One of the world’s largest research and demonstration experiments, the EcoGrid EU project, was initiated in 2011 on the Danish island of Bornholm. The project involves nearly 2000 households and small businesses taking part in a market-based demand response experiment. The hypothesis of the project was that electricity markets
could evolve so as to issue prices that would optimally support and control demand response by taking advantage of the dynamic and conditional elasticity in demand. In practice, this conditional dynamic elasticity is linked to the thermal inertia of buildings, flexibility in the charging patterns of electric vehicles, etc.
14

The evaluation revealed that, even though demand response could help, difficulties in predicting the localized demand response potential for small groups of electric loads, combined with the uncertainty inherent in such responses, was potentially hampering the viability of demand response as a practical solution (Pinson, 2017).
Lessons learnt from EcoGrid EUIn the EcoGrid EU market, the customers themselves contribute to balancing electricity generation and load in the power system. The results show that a real-time price signal can be used to activate flexible consumption. By using a five-minute real-time signal, the total peak load is reduced by approximately 670 kW or 1.2% of the peak load on Bornholm. Households with equipment to control their heating systems so they respond automatically to price signals accounted for 87% of peak load reduction.
In a replication perspective, customer involvement is the key to success (EcoGrid EU, 2015).
Cable
132 kV
60 kV
Sweden
Bornholm
RoenneNexø
0 km 5 km
≈
Figure 7. The Bornholm distribution system. (Ding, 2012).
1 3
2
System balancing
Power markets
Energy priceAncillary
service prices
Grid price/Congestion rent
ELECTRICITY NETWORK
Production&
ConsumptionTechnical control eg: Reactive power controlEmergency operations
Technical operations
Grid constraints
Figure 8. The EcoGrid EU demonstration phases. (Ding, 2012).
28 000 Customers
55 MW Peak load
16 6/10 kV substations
Power Plants
39 MW Diesel
37 MW Steam (oil)
37 MW Steam (oil/coal, CHP)
36 MW Wind Power
2 MW Biogas
5 District Heating
6 Heat Generators
15

Demand response modelling based on EcoGrid EU project dataIn a research project, algorithms responding to real-time electricity prices were researched and benchmarked according to comfort and cost. After this simulation, real power system data from the EcoGrid EU project and methods to quantify an aggregated load were developed. These methods can be used for re-al-time operation and to support investment decisions. More specifically, they can be used
to forecast the response to electricity pricing and to classify different types of customers. The proposed models are then embedded in new five-minute electricity markets for system balancing and local congestion management. The main conclusion of this study is that political and social initiatives to promote changing energy behaviour are just as important as technological developments (Larsen E.M., 2016).
Smart grid conformance testsTo minimize the add-on costs for smart grid-ready products for domestic domains like PV systems, heat pumps and EV home chargers, the aim of the smart grid Open project (SGO) was to develop a smart grid-ready conformance test method. Different standards were reviewed and assessed. The SGO project found that a very simple smart grid control
using two digital lines as implemented in Germany for the grid control of heat pumps and PV systems may give 80% smart grid effect for 20% complexity and cost, not only for heat pumps, but also for most domestic devices, including battery energy storage (Technological Institute, 2017).
Norway
Skagerrak1,000 MW
Jutland -Germany
1,780 MW
Sweden
Konti-Skan740 MW
Zealand -Sweden
1,700 MW
Sweden -Bornholm
60 MW
Great Belt600 MW
Germany KONTEK600 MW
Towards fully renewable energy systems in DenmarkThe Danish energy system is characterised by its strong interconnections with neighbouring countries. An overview of interconnections as of 2014 is given in Figure 9. However, reaching a fully renewable energy system is not only a matter of electricity infrastructure, but also of placing the emphasis on other aspects, for example, market mechanisms that support renewable energy integration and enhance flexibility (demand response, electric vehicles and storage, synergies with gas and electricity systems) (Pinson, 2017).
Figure 9: Interconnection to the Danish power system. (Pinson, 2017).
16

EnergyLab Nordhavn: Towards a carbon-neutral Danish capitalDenmark’s capital, Copenhagen, aims to be a carbon-neutral city by 2050. In practice, a relevant initiative is the development of the Nordhavn neighbourhood to become a smart living lab for energy and its connection with other infrastructure. The EnergyLab Nordhavn project places emphasis on energy system integration, interaction with the transportation system, the development of ICT- and storage-based management solutions for increased flexibility in power system operation, active distribution network planning etc. (Pinson, 2017).
The Danish goal to become independent of fossil fuels by 2050 is realisticDenmark’s ‘Partnership Smart Energy Networks – Research, Development and Demonstration’ has drawn up fifteen recom-mendations for research, development and demonstrations in the area of smart energy, all supporting the national goal of becoming independent of fossil fuels by 2050. Several road-map reports indicate that it is both technically possible and economically feasible to achieve this. The Partnership believes that smart integration of the energy system is the key to the solution. However, this transition in respect of the energy system will take time, with many possible solutions and paths to follow, and many strategic decisions to be taken along the way (Nørgård, 2016).
Figure 10: The EnergyLab Nordhavn project uses the new Copenhagen quarter Nordhavn as laboratory for energy technology. Read more at http://www.energylabnordhavn.dk/.Photo: DTU
Figure 11: Middelgrunden windfarm in front of Copenhagen Harbour.
17

CONSUMER BEHAVIOUR AND BUILDINGSMany households in Denmark have installed Solar-power systems or household windmills. Thus, households are expected to contribute to the integration of variable renewable energy sources into the energy system by providing flexibility. The ongoing smart meter roll-out is a first step in this direction, but it is not enough to prompt consumers to adopt it. The current pricing system does not allow or encourage very much flexibil-
ity from residential electricity customers. New regulations and fee structures are probably required. New types of electricity consumption, especially heat pumps and electric vehicles, need to be embraced and integrated properly into the system so that their potential to provide flexibility can be exploited. This might require more dynamic electricity supply tariffs, network tariffs and even dynamic taxation (Kitzing, 2016).
Consumer behaviour in transitions to new energy systems
Current government information policies and market-based instruments aimed at influencing the energy choices of consumers often ignore the fact that consumer behaviour is not fully reducible to individuals making rational and conscious decisions all the time. To achieve a transition towards sustainable energy, an approach that goes beyond individual consumer choice and puts shared routines and system change at its heart is needed.
How do users adopt new technologies?A number of studies of how users actually adopt new energy technologies have shown that consumer behaviour involves much symbolic, practical and cognitive work beyond the initial purchasing decision. Users not only learn how to use the new technology, they also develop new usages and fit them
to their existing everyday routines, thereby gradually altering these routines. Users are also instrumental in providing advice to other, less experienced and/or potential users. This side of user activity is not captured by formal economic models, which tend to see the user mainly as a mere choice-maker in the market.
In contrast, the literature on technology appropriation suggests that consumption is an active process in which a large group of consumers construct and share the meanings of new technologies and help to define new usage practices, thus helping to consolidate and stabilize new energy systems. After stabilization, however, many ordinary consumers indeed buy a product, plug it in and use it according to pre-defined meanings and preferences as configured by the early majority of creative user-consumers. This is
18
important in capturing the role of users in disruptive system change (Schot, Kanger and Verbong, 2016).
Users are important stakeholders in the development of smart gridsUser roles should be taken more seriously in relation to smart grids, and experts should regard users as important stakeholders and potential participants in the innovation process. The focus on social practices will help the move away from a technology push approach to smart grids. The provision and consumption of energy is usually not a goal in itself: rather, the energy system enables all kinds of social activities that need energy. In modern society, this includes almost all social activities, ranging from the energy needed to provide comfort (heating and cooling in houses) to almost all forms of communication and entertainment.
The user as innovatorIn the innovation studies literature, users have traditionally been conceptualized as buyers or consumers, but in recent decades we observe a shift towards the study of the so-called ‘democratization’ of innovation, meaning that the field acknowledges that (and researches how) users can play roles such as co-producers of innovations as well. This trend is supported by improvements in computer and communications technology that enable users to develop their own new products and services.
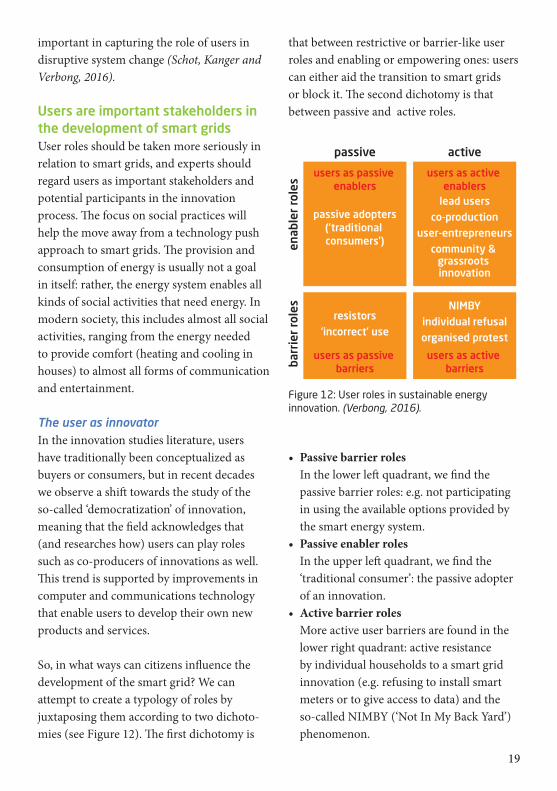
So, in what ways can citizens influence the development of the smart grid? We can attempt to create a typology of roles by juxtaposing them according to two dichoto-mies (see Figure 12). The first dichotomy is
that between restrictive or barrier-like user roles and enabling or empowering ones: users can either aid the transition to smart grids or block it. The second dichotomy is that between passive and active roles.
• Passive barrier roles In the lower left quadrant, we find the
passive barrier roles: e.g. not participating in using the available options provided by the smart energy system.
• Passive enabler roles In the upper left quadrant, we find the
‘traditional consumer’: the passive adopter of an innovation.
• Active barrier roles More active user barriers are found in the
lower right quadrant: active resistance by individual households to a smart grid innovation (e.g. refusing to install smart meters or to give access to data) and the so-called NIMBY (‘Not In My Back Yard’) phenomenon.
passive
barr
ier
role
sen
able
r ro
les
users as passive enablers
users as passive barriers
passive adopters(’traditional consumers’)
resistors‘incorrect’ use
active
users as active enablers
users as active barriers
lead usersco-production
user-entrepreneurscommunity &
grassroots innovation
NIMBYindividual refusalorganised protest
Figure 12: User roles in sustainable energy innovation. (Verbong, 2016).
19

• Active enabler roles Active enabler roles reside in the upper right quadrant. For example, users can become so-called ‘lead users’ who act as key sources of the information and ideas that lead to innovations.
These possible user roles have their own complex social dynamics and generative mechanisms (Verbong, 2016).
The contribution of passive consum-ers to demand responseDynamic tariffs in particular are gaining interest as a way of changing consumption patterns. Indirect control is one such dynamic
tariff that uses an incentive signal, e.g. a real-time price, to influence the load. Indirect control does not require an exact response from any one customer, but with a large num-ber of loads that exhibit somewhat similar behaviour, a statistically likely response can be forecast. Methods have been developed to characterize price-responsive demand from the EcoGrid EU demonstration in a way that was a bid into a real-time market. The experiment uses a market framework to schedule regulating power from conventional forms of generation and DR to meet the real-time balancing needs of the system, needs which are growing due to increased production from wind-power.
Reference
253 households with smart meters
No pricing information 279/621 kW average/peak load
Manual
455 households with smart meters
Receive real-time pricing, but must alter consumption manually
287/750 kW average/peak load
IBM HP
195 households with smart meters and automation equipment
Heat pumps react autonomously to prices
317/710 kW average/peak load
IBM EH
322 households with smart meters and automation equipment
Resistive electric heating reacts autonomously to prices
394/854 kW average/peak load
TNO HP
84 households with smart meters and automation equipment
Heat pumps react autonomously to prices
123/293 kW average/peak load
Siemens EH
398 households with smart meters and automation equipment
Resistive electric heating, water boilers and control-lable PV react to aggregator control
300/810 kW average/peak load
Table 3: Summary of EcoGrid EU customer groups. (Larsen, 2017)
20
Customers were grouped and analysed according to the manufacturer controlling the devices. A number of advanced statistical models were used to show significant flexibili-ty in the load, peaking at 27% for the best performing groups (Larsen, 2017).
A bidding model for a cluster of price- responsive consumersAnother direction for price-responsive consumers to go in is to join up as a cluster of flexible power consumers, where flexibility is understood as the ability of each consumer in the cluster to change her consumption depending on the electricity price and her personal preferences. The portfolio of flexible consumers is managed by a retailer or aggregator, which bids in a wholesale electricity market on behalf of its customers. Traditionally, this bid would simply be a forecast of the load. However, the price response of the pool could also be captured through a more complex, but still quite common market bid that consists of a stepwise marginal utility function, maximum load pick-up and drop-off rates, and maximum and minimum power consumption in a manner analogous to the energy offers made by power producers. A case study has shown that the estimated bid successfully models the price response of the pool of houses in such a way that the mean absolute percentage error incurred when using the estimated market bid to predict consumption within the pool of houses is kept between 14% and 22% for all the months of the test period (Saez-Gallego, Morales, Zugno and Madsen, 2016).
A social science based agenda for research on smart gridsA technology-dominated approach to smart grids will very likely not produce the intended results. Therefore, a new social science-based agenda for research into smart grids is needed. The main elements are: • Developing more socially embedded
visions for smart grids and the services they will provide;
• A shift in the focus on developing smart grid components and systems towards the services they will deliver;
• Development and testing of innovative user-centred business models and ecosys-tems.
Generally, more attention should be paid to the potentially innovative role of users in smart grid development and in sustainable innovations more broadly (Verbong, 2016).
Experience with consumer communications and involvementThe EcoGrid project has acquired experience of the needs of the electricity consumer and the demand for smart grid-related technology. The most active participants in EcoGrid were men over fifty years of age and two-person households. This may indicate that smart grid solutions must be designed and marketed differently if they are to succeed in involving women, younger people and families more actively in the future.
Recommendations for new smart grid projects:• Communication strategy and contingency
plan: From the very beginning of the project, it is important to anchor it broadly. A contingency plan should be drawn up to
21

avert adverse consequences of unplanned events such as server crashes, etc.
• Pre-testing of the project: A pre-test should be conducted, including the entire value chain and a limited number of users.
• Requirements for technological solutions and usability: Remote updating of equipment should be possible so that errors can be solved centrally. There must be user access, e.g. to interrupt automatic control so that the customer can switch to manual control
(Trong, Salamon and Dogru, 2016a; Trong, Salamon and Dogru, 2016b).
Human agency in smart grid security and resilienceThe internet will be used as part of the smart grid infrastructure, e.g., to enable communi-cation with end-user services. Consequently, developing technologies to ensure the security and resilience of smart grids and the internet is of paramount importance. Human agency will affect how electricity grids could
be made “smarter” using ICT. Individuals can have several roles:
• Customer and small-scale producer: individuals who have a contractual relationship to the electricity supplier and to the distribution system operator (DSO). Increasingly the customers themselves become suppliers of electricity from, e.g., photovoltaic (PV) installations.
• Consumer and user: end-users of the electricity grid who want to use the power to have it warm or cool, to run a computer in their business or to travel to work.
• Citizen: individuals who have the right to vote for their political views and the duty to contribute to the public good as taxpayers.
A differentiated view of human agency helps predict the consequences for security and resilience and indicates how one should act accordingly in the innovation process. This is the aim of the EU-funded SPARKS project (Kubeczko, 2015).
Smart meters and smart appsDenmark has passed legislation requiring all electricity consumers in Denmark to have intelligent meters installed by the end of 2020. This has initiated discussions among energy system stakeholders about utilizing the data for purposes other than billing, e.g. load forecasting and consumer classification. Transitions between consumer classes are relevant when planning for future power supplies, and the insights from smart meter analytics can help identify changes in consumption and transitions.
A review has shown that, using only consumption data, electricity consumers can be segmented into smaller and more homogenous clusters. It is generally accepted that smart meter data is very applicable for cluster analysis, with overall satisfactory performance for individual methods. It is ap-propriate to move the focus from the simple classification of smart meter consumption data to show how these findings provide value in a societal setting. This could apply to tariff development or in consumption flexibility analysis (Tureczek, 2017).
22

Smart meters for consumer classification Even for similar residential buildings, huge variations in energy consumption can be observed, mainly due to the different behaviour of occupants, and this impacts on both thermal (temperature setting, window opening, etc.) and the electrical (appliances, TV, computer, etc.) consumption. Given the increasing use of smart metering, the opportunity and potential for the indirect observation and classification of occupants’ behaviour is possible. By using the so-called Hidden Markov Models to make frequent measurements of electricity consumption from smart metering data, customer behav-iour can be classified (Liisberg, et al., 2016).
SSmE smart app Most people in the Global North are char-acterized by passive engagement in energy in their daily lives. A smart app pilot project in Holland aims at involving customers
more. The project rests on the assumption that , when provided with information about energy usage, individual participants are willing and able to adjust their energy consumption patterns. Usage data is available in real time, enabling the user to monitor the level of electricity consumption with an app, the SsmE app. This app has been developed by the Dutch SSmE project (Samen Slim met Energie, or Together Smart with Energy).
Results show that the vision of the tech-savvy individual, who, through smart appliances, can draw on detailed, personalized energy data, make rational decisions based on them and act diligently on the insights he has acquired was not realized in the SSmE project (Verkade, 2017).
PEAKapp projectAnother smart app experiment is PEAKapp. The overall goal of PEAKapp project is to
Realtime
Actueel verbruik:
1341 watt
Stopwatch
Verbruik
Piek
Dashboard Mijn community
00:00
Start
Community ranking
1. Petra Korevaar
2. Hans Maastra
3. Jan Pietersen
16. Henk de Wild
Mijn community
Lorem ipsum dolor sit amet.
50%
Figure 13: Snapshots of the SSmE app. (Verkade, 2017).
Realtime
Actueel verbruik:
1341 watt
Stopwatch
Verbruik
Piek
Dashboard Mijn community
00:00
Start
Community ranking
1. Petra Korevaar
2. Hans Maastra
3. Jan Pietersen
16. Henk de Wild
Mijn community
Lorem ipsum dolor sit amet.
50%
23

develop, validate and launch an ICT eco-system that motivates and supports citizens to adopt and sustain behavioural changes which will reduce their household energy consumption and shift consumption to hours with high shares of VRE in the energy
system. The ICT ecosystem will require smart meters. Validation of the ICT ecosystem will be carried out in some EU countries, and analyses of the collected data will allow insights into consumer behaviour (PEAKapp, 2017).
A smart phone/tablet appwith customizable graphicaluser interface
Hosted in the provider’scentral system
Supports load shiftstransitioning and dynamicaccountancy system
Enables sending notificationsfrom provider to user
Continuouslyengages the user
Connects to theuser’s existing energyprovider
The variability of energy use in residential buildings
Variations in the energy use of buildings are considered significant with respect to their integration into the overall energy grid. Especially where integrated district energy systems are dominant, accurately predicting the operational energy use of a building or cluster of buildings is crucial. These variations are mainly attributed to the following areas:
a) The passive parameters, mainly represent-ing the building envelope and possibly the equipment; and
b) the active components, representing users and climate.
Uncertainty analysis has proved to be the main approach to determining the effect of
Figure 14: PEAKapp functions. (PEAKapp, 2017).
24

uncertainty on building energy performance. Moreover, sensitivity analysis is conducted to analyse variations in building parameters and their effects on energy use.
A new study aims at identifying the parame-ters that are responsible for the variations in energy performance by investigating simple building models. Secondly, by introducing a sensitivity analysis, the key variables that affect energy use in residential buildings can be determined and a new methodology proposed for parameter optimization. The derived results will be evaluated based on a reference scenario and will create a methodology for realistically estimating the magnitude of key variables in building performance. The next step will be to apply this methodology to housing stock models (Gianniou, 2016).
Flexibility in private homesThe DREAM project – Danish Renewable Energy Aligned Markets – has gathered insights into the complex task of implementing flexibility in private homes, municipal buildings and industry in areas without collective heating systems. Here, it is important that as many heat pumps as possible will replace oil-fired burners. The project used anthropological, technical and economic analysis. It identified potentially commercially viable solutions for implement-ing smart grid-ready equipment to entities with relatively low energy consumption, like private houses, the public sector and small industries in areas where the only collective energy source available is electricity (Tekno-logisk Institut, Dansk Energi, Deloitte, Billund Kommune, Danfoss, Billund Varmeværk, Energinet.dk, 2015).
Technology and social aspects are equally important
A greater focus on social practices will help the move away from a technology push approach to smart grids. The provision and consumption of energy is usually not a goal in itself: rather, the energy system enables all kinds of social activities that need energy. In
modern society, this includes almost all social activities, ranging from the energy needed to provide comfort (heating and cooling in houses) to almost all forms of communication and entertainment.
25

REFERENCESBergaentzlé, C., and Skytte, K. (2017). Grid tariffs to support flexibility in decarbonised energy systems. 6th
Conference on the Regulation of Infrastructures. Regulatory challenges for smart cities.Bergaentzlé, C., Boscán, L. R., Skytte, K., Soysal, E. R., and Olsen, O. J. (2016). Framework Conditions for
Flexibility in the Electricity Sector in the Nordic and Baltic Countries. Nordic Energy Research.Danish Ministry of Climate, Energy and Building. (2013). Smart Grid Strategy. The Intelligent Energy System of
the Future. Ding Y., N. P. (2012). Ecogrid EU – A Large Scale smart grids Demonstration of Real Time Market-based
Integration of Numerous Small DER and DR. 3rd IEEE PES Innovative smart grid Technologies Europe (ISGT Europe), Berlin.
EcoGrid EU. (2015). EcoGrid EU: Findings and Recommendations. EcoGrid EU.EcoGrid EU. (2015). EcoGrid EU: From Implementation to Demonstration. EcoGrid EU.Gianniou, P. H. (2016). Identification of parameters affecting the variability of energy use in residential buildings.
Abstract from 12th REHVA World Congress, Aalborg, Denmark.Halvgaard, R., Vandenberghe, L., Poulsen, N., Madsen, H., and Jørgensen, J. (2016, MAY). Distributed Model
Predictive Control for Smart Energy Systems. IEEE TRANSACTIONS ON SMART GRID, VOL. 7, NO. 3.Katz, J., Andersen, M.F. & Morthorst, P.E. (2016). Load-shift incentives for household demand response:
Evaluation of hourly dynamic pricing and rebate schemes in a wind-based electricity system. Energy, Vol. 115, No 3.
Katz, J. M. (2015). Load shift incentives for household demand response: A model to evaluate effects from a Danish field experiment. Proceedings of the 10th Conference on Sustainable Development of Energy, Water and Environment Systems.
Kitzing, L. K. (2016). The residential electricity sector in Denmark: a description of current conditions. Lyngby: Department of Management Engineering, Technical.
Kubeczko, K. A. (2015, February 27, 2015). On Socio-Technical Concerns for smart grid Security and Resilience. Retrieved from SSRN: https://papers.ssrn.com/sol3/papers.cfm?abstract_id=2824408
Larsen, E. M. (2016). Demand response in a market environment. Lyngby: Center for Electric Power and Energy, Technical University of Denmark.
Larsen, E. M. (2017). Demand response evaluation and forecasting: methods and results from the EcoGrid EU experiment. Sustainable Energy, Grids and Networks 10, pp. 75–83.
Liisberg, J., Møller, J., H., B., C. J., Mor, G., and Madsen, H. (2016). Hidden Markov Models for indirect classifica-tion of occupant behaviour. Sustainable Cities and Society 27 , pp. 83–98.
Lindström, E., Norén, V., and Madsen, H. (2015). Consumption management in the Nord Pool region: a stability analysis. Applied Energy 146 , pp. 239–246.
Maj Dang Trong, M. S. (2016). Experience with Consumer Communications and Involvement in smart grid With Examples from EcoGrid on Bornholm: Summary and Recommendations. Forbrugerrådet Tænk, Østkraft.
Møller, N.F. & Andersen, M.F. (2015). An Econometric Analysis of Electricity Demand Response to Price Changes at the Intra-Day Horizon: The Case of Manufacturing Industry in West Denmark. International Journal of Sustainable Energy Planning and Management, Vol 7.
Nørgård, P. (2016, 06 03). Smart Energy Network’s recommendations for research, development and demonstration of smart energy in Denmark. Retrieved from Sustain conference, abstract book 2016: http://www.sustain.dtu.dk/
26

O’Connell, N. M. (2014). Regulating Power from Supermarket Refrigeration. 2014 5th IEEE PES Innovative Smart Grid Technologies Europe (ISGT Europe), October 12-15, Istanbul.
O’Connell, N., Pinson, P., Madsen, H., and O’Malley, M. (2016, July). Economic Dispatch of demand response Balancing Through Asymmetric Block Offers. IEEE TRANSACTIONS ON POWER SYSTEMS, VOL. 31, NO. 4.
O’Connell, N., Pinson, P., Madsen, H., and O’Malley, M. (2014). Benefits and challenges of electrical demand response: a critical review. Renewable and Sustainable Energy Reviews, 39, pp. 686–699.
PEAKapp. (2017, 07 11). Retrieved from PEAKapp: http://www.peakapp.eu/Pinson, P. O. (2017, March). Towards Fully Renewable Energy Systems: Experience and Trends in Denmark.
CSEE JOURNAL OF POWER AND ENERGY SYSTEMS, VOL. 3, NO. 1.Saez-Gallego, J., Morales, J., Zugno, M., and Madsen, H. (2016, November). A Data-Driven Bidding Model for
a Cluster of Price-Responsive Consumers of Electricity. IEEE TRANSACTIONS ON POWER SYSTEMS, VOL. 31, NO. 6.
Schot, J., Kanger, L., and Verbong, G. (2016). The roles of users in shaping transitions to new energy systems. NATURE ENERGY, VOL 1.
Skytte, K., Olsen, O.J., Soysal, E.R & Sneum, D.M. (2017). Barriers for district heating as a source of flexibility for the electricity system. Journal of Energy Markets, Vol. 10, No. 2.
Skytte, K., Pizarro, A. & Karlsson, K. (2016). Use of electric vehicles or hydrogen in the Danish transport sector in 2050? Wiley Interdisciplinary Reviews: Energy and Environment, doi: 10.1002/wene.233.
Technological Institute. (2017, 07 18). Technological Institute. Retrieved from Project - smart grid Open - test procedure for components: https://www.dti.dk/projects/project-smart-grid-open/test-procedure-for- components/33210
Teknologisk Institut; Dansk Energi; Deloitte; Billund Kommune; Danfoss; Billund Varmeværk; Energinet.dk. (2015). smart grid i landområder. DREAM Research Project.
Trong, M. D., Salamon, M., and Dogru, I. (2016a). Erfaringer med forbrugerkommunikation i smart grid –med eksempler fra EcoGrid på Bornholm. Forbrugerrådet Tænk, Østkraft.
Trong, M. D., Salamon, M., and Dogru, I. (2016b). Summary and recommendations. Forbrugerrådet Tænk, Østkraft.
Tureczek, A. M. (2017). Structured Literature Review of Electricity Consumption Classification Using Smart Meter Data. Energies 2017, 10, 584.
Verbong, G. P. (2016). Smart business for smart users? A social science agenda for developing smart grids. Berlin: A. Beaulieu, J. de Wilde, and J. M. A. Scherpen (eds.), Smart grids from a global perspective : bridging old and new energy systems.
Verkade, N. H. (2017). Is the Resource Man coming home? Engaging with an energy monitoring platform to foster flexible energy consumption in the Netherlands. Energy Research and Social Science 27, pp. 36–44.
Østergaard, P. A. (2015). Energy systems scenario modelling and long-term forecasting of hourly electricity demand. International Journal of Sustainable Energy Planning and Management Vol. 07 2015 99-116.
27

Smart grid Transitions:
System solutions and consumer behaviour
This publication summarises a selection of research projects contributing to the objectives of Annex 7 of the International Smart Grid Action Network (ISGAN) project on smart grids.
ISGAN - the Implementing Agreement for a Co-operative Programme on smart grids - functions within a framework created by the International Energy Agency (IEA).
The main objective of Annex 7 is to inves-tigate institutional change associated with smart grid deployment. Using the framework of transition management, this Annex aims to encourage international, coordinated trans-disciplinary research activity in the social sciences supporting and complement-ing technology-oriented smart grid activities.
A further goal is to collect information and knowledge from innovation studies, political science, institutional economics, sociology and energy law and make it palpable for policymakers and other stakeholders.
Finally, it aims to give support to policymak-ers in the field of smart grids by focusing on the direction, efficacy and efficiency of the energy system transition.
Read more: http://www.iea-isgan.org