smart grid analytics - siemens global website · energy system renewable and distributed ......
TRANSCRIPT

Schutzvermerk / Copyright-Vermerk
Smart Grid Analytics Aaron DeYonker VP of Products @ eMeter, a Siemens Business

Sector Infrastructures & Cities – Smart Grid Division
© Siemens AG 2012. All rights reserved.
October 2012 Page 1
The Challenge
Challenges in changing
energy system
Renewable and distributed
generation
Limited generation and
grid capacity
Aging and/or weak
infrastructure
Cost and emissions of
energy supply
Revenue losses, e.g. non-
technical losses

Sector Infrastructures & Cities – Smart Grid Division
© Siemens AG 2012. All rights reserved.
October 2012 Page 2
Smart Grids Solve Critical Problems
Generation
Balancing Renewables Customer Operations Peak Management
Efficiency Outage Prevention / Restoration
Reduction of System Losses
RENEWABLES PROSUMERS
kWh $, €
Generation
Load
Sector Infrastructures & Cities – Smart Grid Division
© Siemens AG 2012. All rights reserved.
October 2012 Page 3
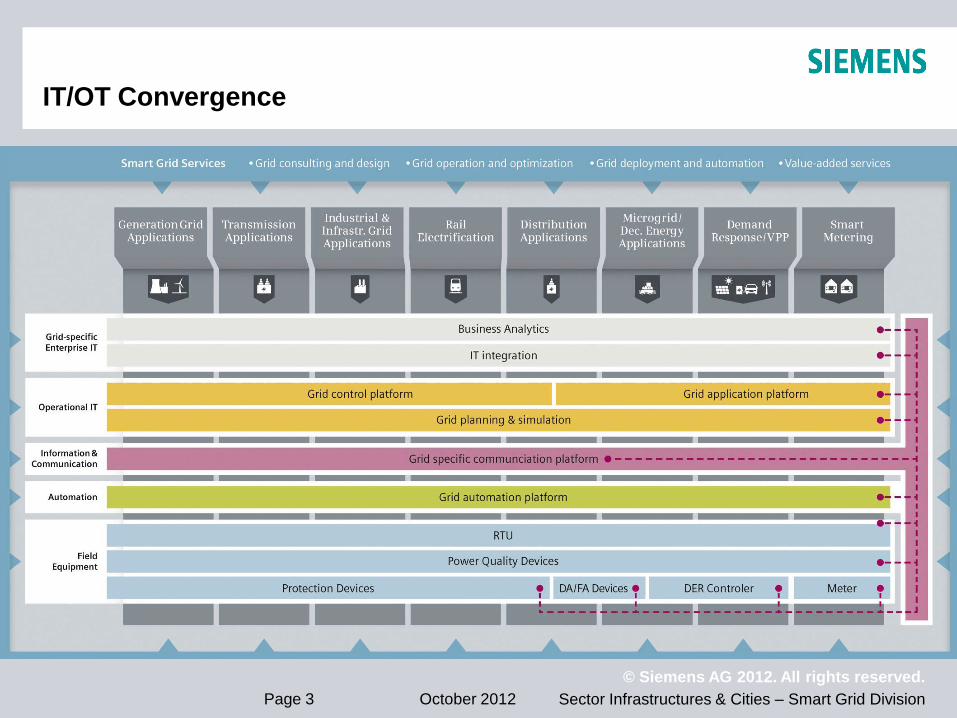
IT/OT Convergence

Sector Infrastructures & Cities – Smart Grid Division
© Siemens AG 2012. All rights reserved.
October 2012 Page 4
Utilities Access to Data
Most
Utilities
Finance
Industry
Retail
Industry
Is this the Grid of the Future?
eMeter Corporate Logo
To ensure the integrity of the eMeter brand it is necessary to understand how to use
the logos.
Minimum Clear Area
A minimum clear area has been created around each logo. This area should always be
kept free of any graphic elements and/or messages. The gray lines in these illustrations
show how the minimum clear area is calculated. In all cases, an area equal to the cap
height of eMeter “r” must remain clear on all sides of the logo. The gray bars in these
illustrations indicate the visual height, width, vertical center and horizontal center of
the logo.
(see the next slide)
Slide 5 Copyright © 2011 eMeter Corp. All rights reserved.
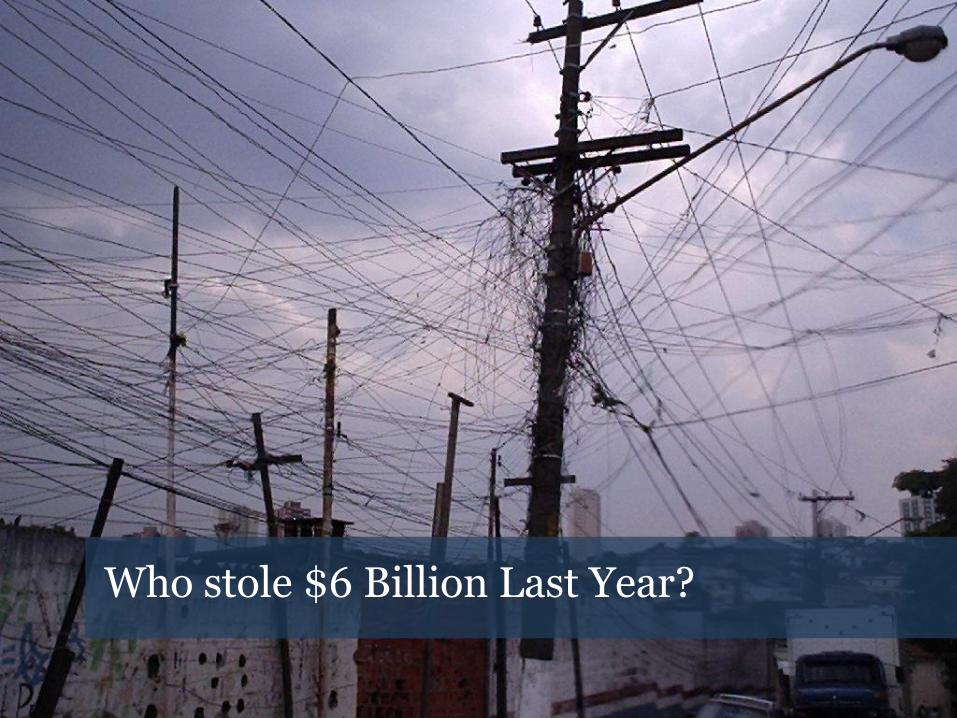
Who stole $6 Billion Last Year?

Sector Infrastructures & Cities – Smart Grid Division
© Siemens AG 2012. All rights reserved.
October 2012 Page 6
Identifying Theft Patterns

Sector Infrastructures & Cities – Smart Grid Division
© Siemens AG 2012. All rights reserved.
October 2012 Page 7
Energy Diversion Dashboard

Is this the Grid of the Future?
eMeter Corporate Logo
To ensure the integrity of the eMeter brand it is necessary to understand how to use
the logos.
Minimum Clear Area
A minimum clear area has been created around each logo. This area should always be
kept free of any graphic elements and/or messages. The gray lines in these illustrations
show how the minimum clear area is calculated. In all cases, an area equal to the cap
height of eMeter “r” must remain clear on all sides of the logo. The gray bars in these
illustrations indicate the visual height, width, vertical center and horizontal center of
the logo.
(see the next slide)
Slide 8 Copyright © 2011 eMeter Corp. All rights reserved.
Who am I lending to?

Sector Infrastructures & Cities – Smart Grid Division
© Siemens AG 2012. All rights reserved.
October 2012 Page 9
Unbilled Usage Summary

Sector Infrastructures & Cities – Smart Grid Division
© Siemens AG 2012. All rights reserved.
October 2012 Page 10
Unbilled Usage by Billing Cycle
Is this the Grid of the Future?
eMeter Corporate Logo
To ensure the integrity of the eMeter brand it is necessary to understand how to use
the logos.
Minimum Clear Area
A minimum clear area has been created around each logo. This area should always be
kept free of any graphic elements and/or messages. The gray lines in these illustrations
show how the minimum clear area is calculated. In all cases, an area equal to the cap
height of eMeter “r” must remain clear on all sides of the logo. The gray bars in these
illustrations indicate the visual height, width, vertical center and horizontal center of
the logo.
(see the next slide)
Slide 11 Copyright © 2011 eMeter Corp. All rights reserved.
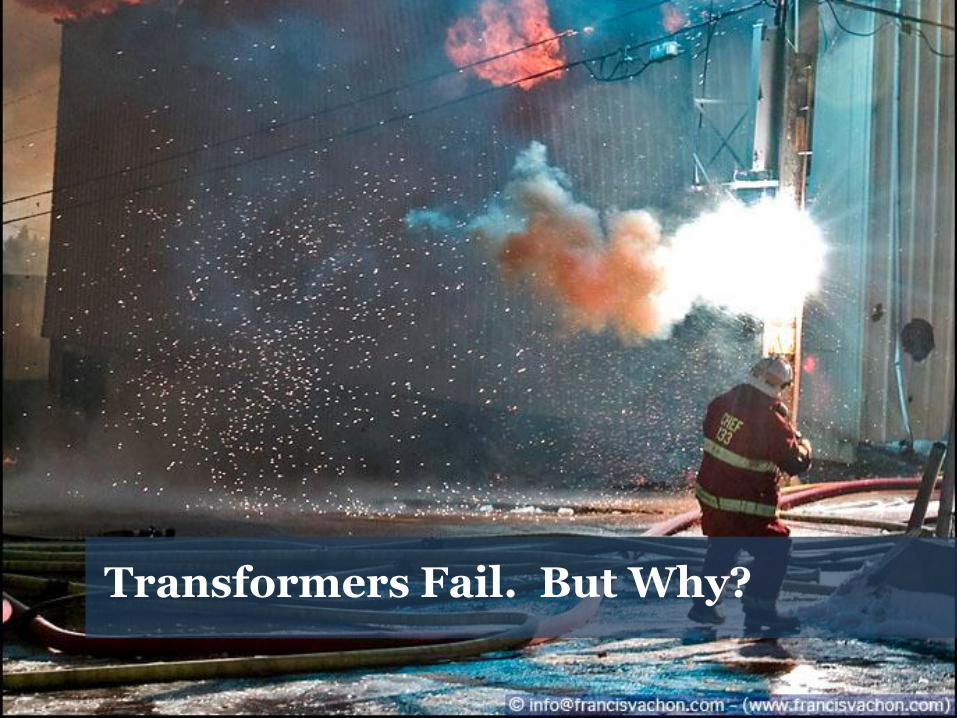
$360 Million Stolen Each Year in US Transformers Fail. But Why?
Sector Infrastructures & Cities – Smart Grid Division
© Siemens AG 2012. All rights reserved.
October 2012 Page 12
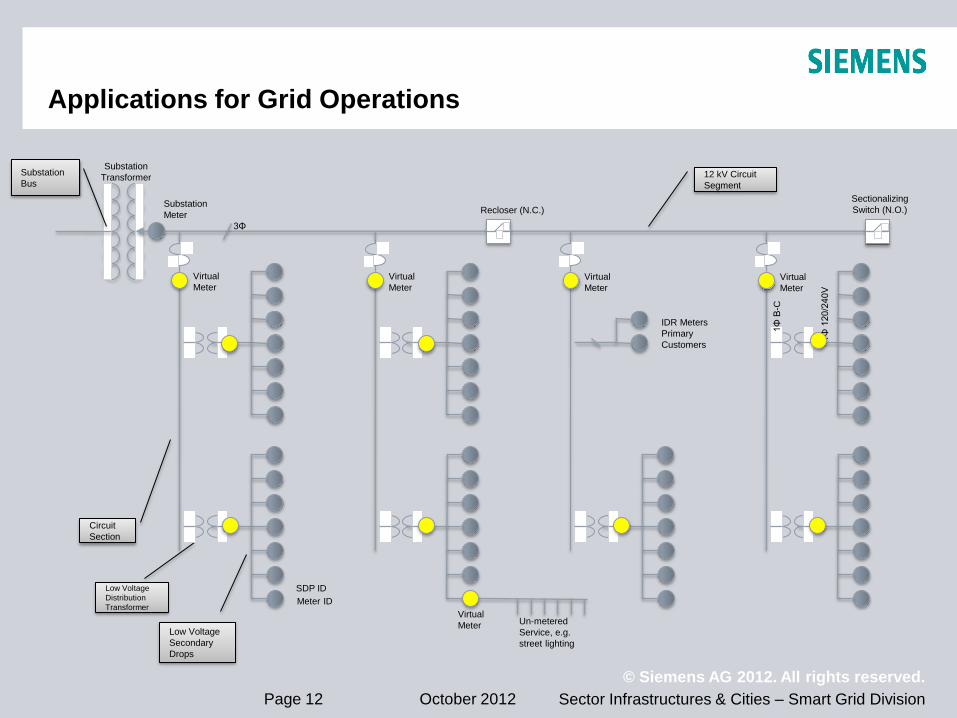
Applications for Grid Operations
3Φ
SDP ID
Meter ID
Substation
Transformer
1Φ
120/2
40V
12 kV Circuit
Segment
Low Voltage
Distribution
Transformer
Low Voltage
Secondary
Drops
Substation
Bus
1Φ
B-C
Recloser (N.C.)
Un-metered
Service, e.g.
street lighting
Virtual
Meter
Circuit
Section
Virtual
Meter
Virtual
Meter
Virtual
Meter
Virtual
Meter
IDR Meters
Primary
Customers
Substation
Meter
Sectionalizing
Switch (N.O.)

Sector Infrastructures & Cities – Smart Grid Division
© Siemens AG 2012. All rights reserved.
October 2012 Page 13
Service Point Metering
Sector Infrastructures & Cities – Smart Grid Division
© Siemens AG 2012. All rights reserved.
October 2012 Page 14
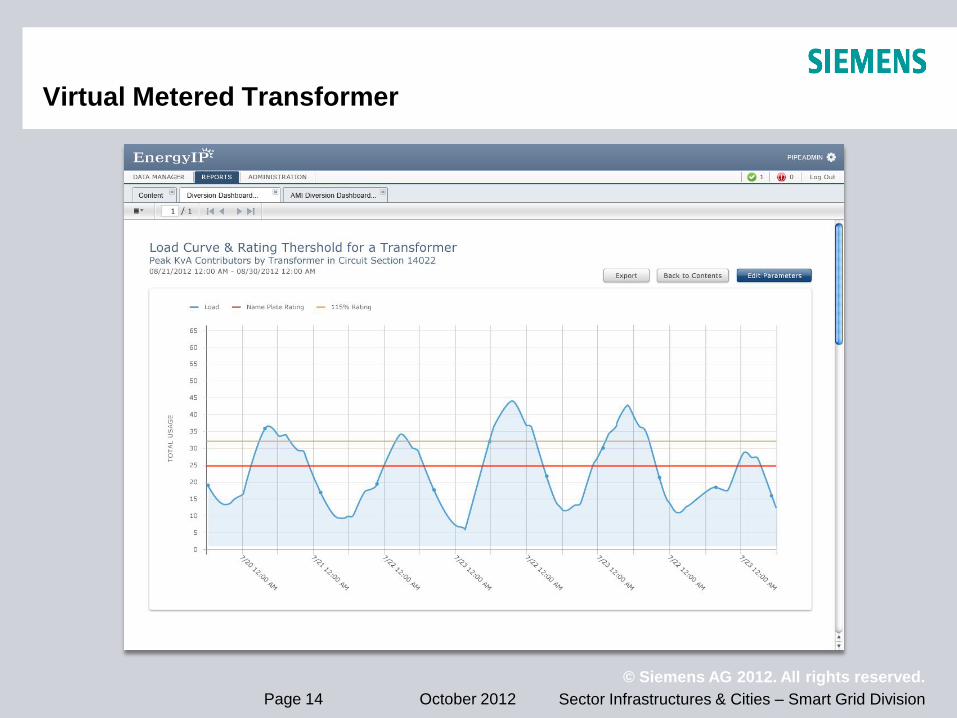
Virtual Metered Transformer
Sector Infrastructures & Cities – Smart Grid Division
© Siemens AG 2012. All rights reserved.
October 2012 Page 15
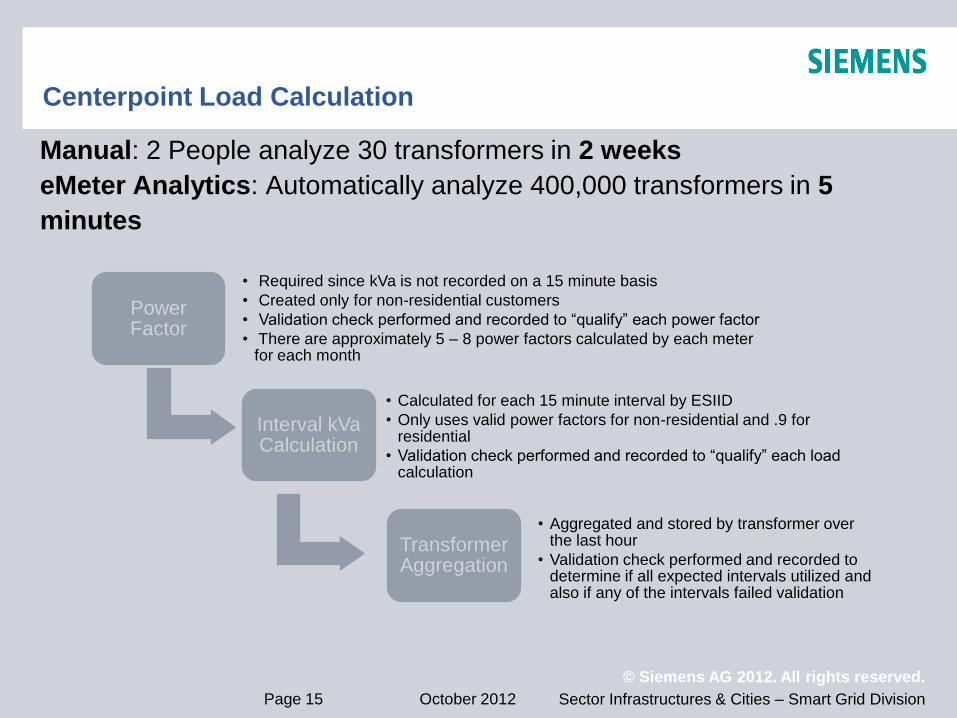
Centerpoint Load Calculation
Manual: 2 People analyze 30 transformers in 2 weeks
eMeter Analytics: Automatically analyze 400,000 transformers in 5
minutes
Power Factor
• Required since kVa is not recorded on a 15 minute basis
• Created only for non-residential customers
• Validation check performed and recorded to “qualify” each power factor
• There are approximately 5 – 8 power factors calculated by each meter for each month
Interval kVa Calculation
• Calculated for each 15 minute interval by ESIID
• Only uses valid power factors for non-residential and .9 for residential
• Validation check performed and recorded to “qualify” each load calculation
Transformer Aggregation
• Aggregated and stored by transformer over the last hour
• Validation check performed and recorded to determine if all expected intervals utilized and also if any of the intervals failed validation

Sector Infrastructures & Cities – Smart Grid Division
© Siemens AG 2012. All rights reserved.
October 2012 Page 16
Transformers Load Monitoring
Sector Infrastructures & Cities – Smart Grid Division
© Siemens AG 2012. All rights reserved.
October 2012 Page 17
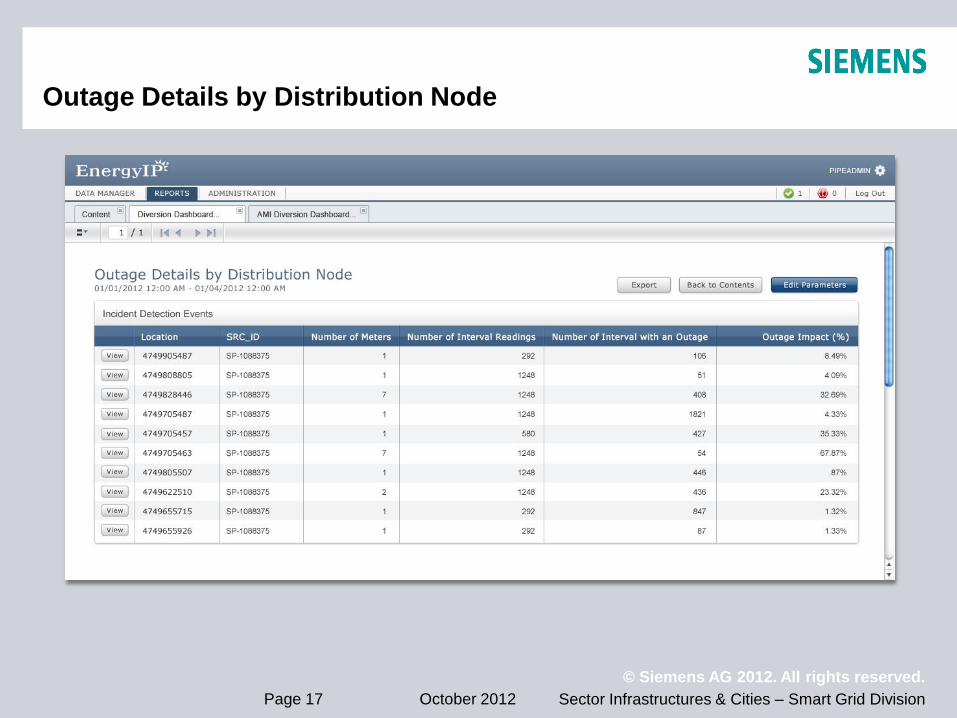
Outage Details by Distribution Node
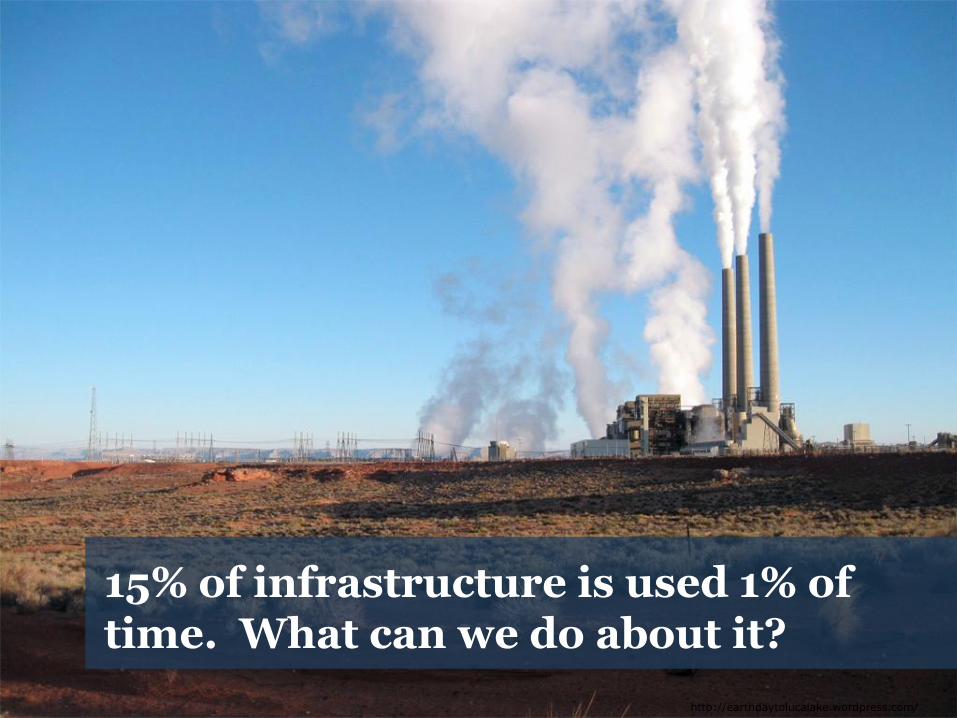
http://earthdaytolucalake.wordpress.com/
15% of infrastructure is used 1% of time. What can we do about it?

Sector Infrastructures & Cities – Smart Grid Division
© Siemens AG 2012. All rights reserved.
October 2012 Page 19
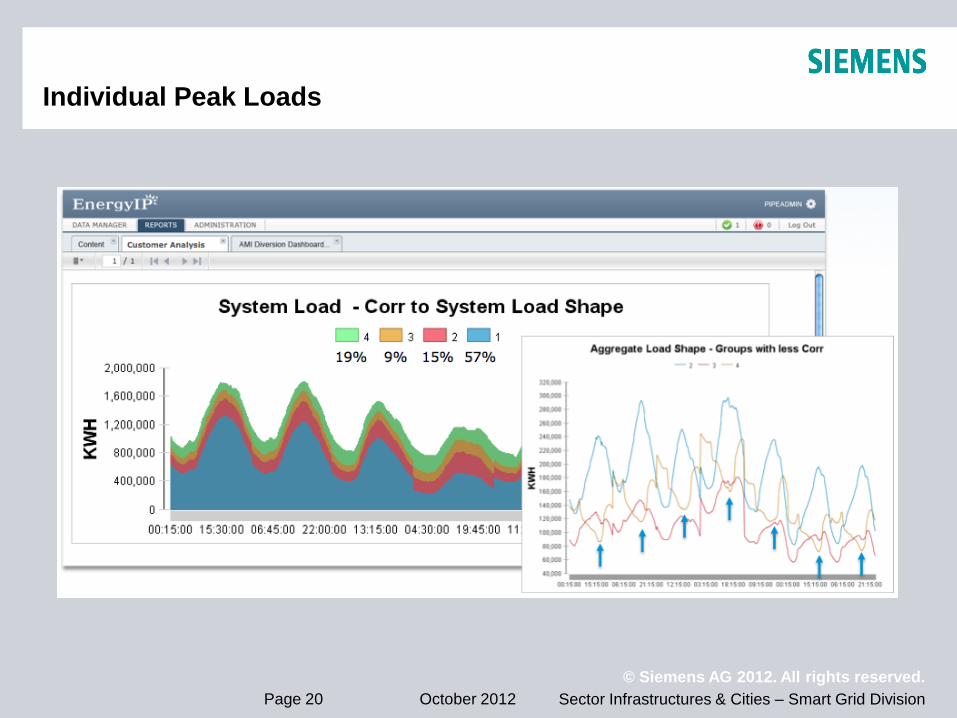
System Load
Sector Infrastructures & Cities – Smart Grid Division
© Siemens AG 2012. All rights reserved.
October 2012 Page 20
Individual Peak Loads
Sector Infrastructures & Cities – Smart Grid Division
© Siemens AG 2012. All rights reserved.
October 2012 Page 21
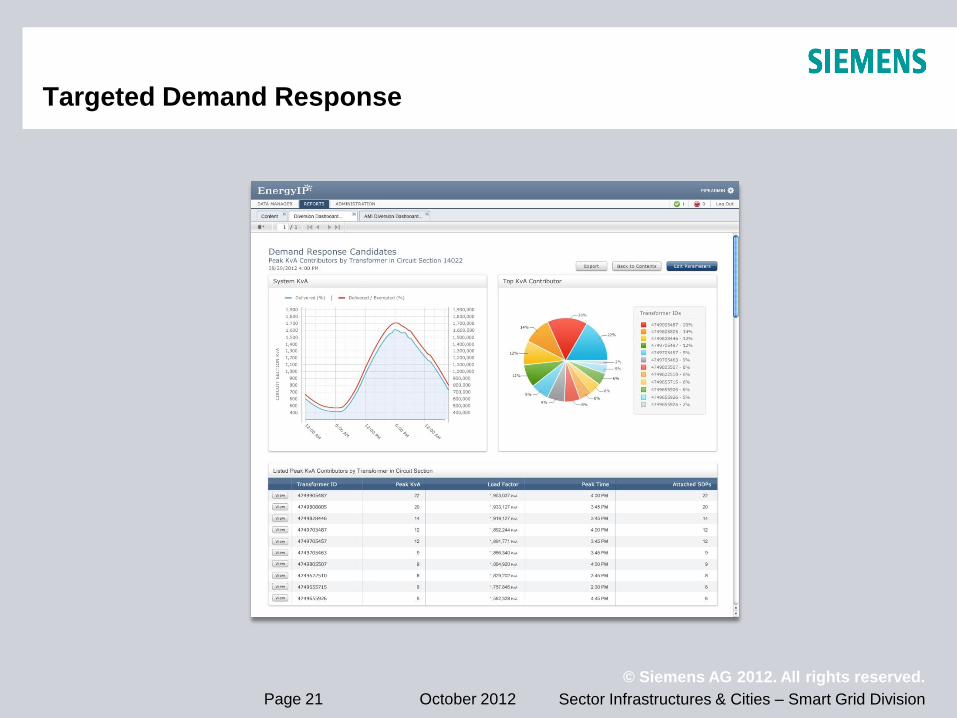
Targeted Demand Response

Sector Infrastructures & Cities – Smart Grid Division
© Siemens AG 2012. All rights reserved.
October 2012 Page 22
Time of Use Analysis

Sector Infrastructures & Cities – Smart Grid Division
© Siemens AG 2012. All rights reserved.
October 2012 Page 23
The Possibilities Are Endless…
Grid Loss Identification
Pricing Analysis
Customer Profiling & Segmentation
Load Modeling & Forecasting
Demand Response Evaluation
Distribution Planning