u.s. smart grid development and global smart grid...
TRANSCRIPT
U.S. Smart Grid Development and Global Smart Grid Coordination Presentation to the Board on
Global Science and Technology
Eric Lightner
Director, Smart Grid Task Force June 21, 2012
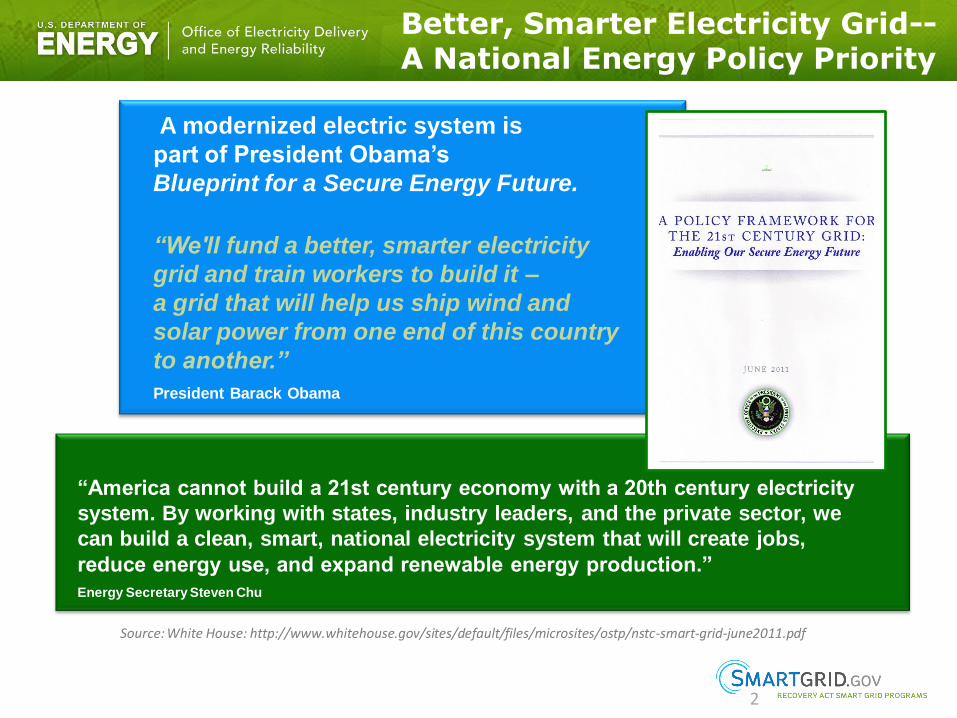
Better, Smarter Electricity Grid-- A National Energy Policy Priority
2
A modernized electric system is
part of President Obama’s
Blueprint for a Secure Energy Future.
“We'll fund a better, smarter electricity
grid and train workers to build it –
a grid that will help us ship wind and
solar power from one end of this country
to another.”
President Barack Obama
“America cannot build a 21st century economy with a 20th century electricity
system. By working with states, industry leaders, and the private sector, we
can build a clean, smart, national electricity system that will create jobs,
reduce energy use, and expand renewable energy production.”
Energy Secretary Steven Chu
Source: White House: http://www.whitehouse.gov/sites/default/files/microsites/ostp/nstc-smart-grid-june2011.pdf
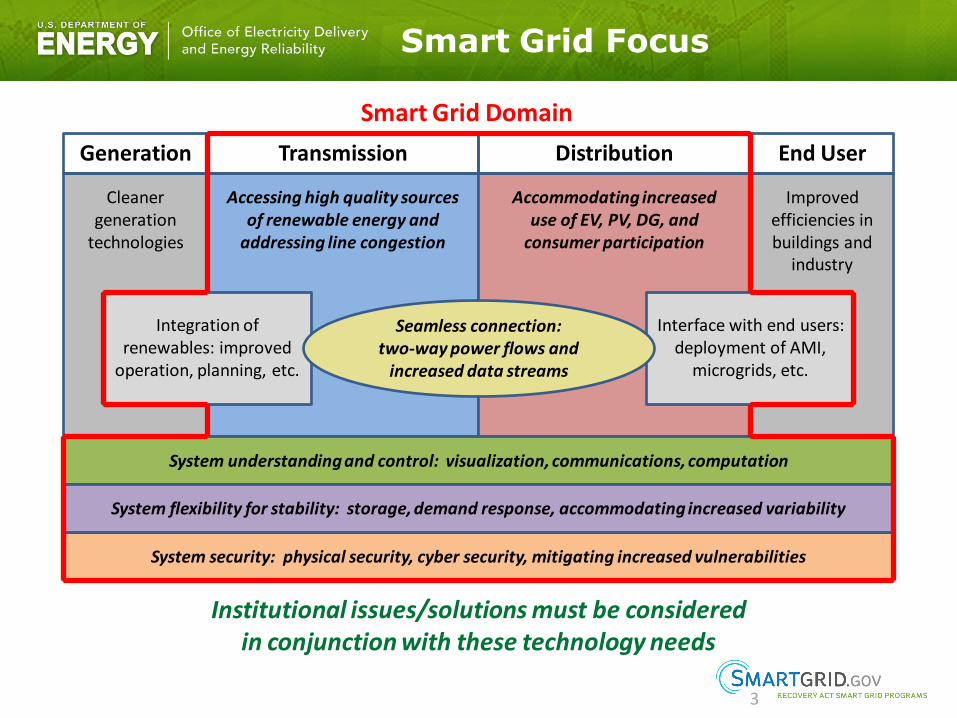
Smart Grid Focus
3
Institutional issues/solutions must be considered in conjunction with these technology needs
Smart Grid Domain
Generation End User Transmission Distribution
System understanding and control: visualization, communications, computation
System flexibility for stability: storage, demand response, accommodating increased variability
Interface with end users: deployment of AMI,
microgrids, etc.
Integration of renewables: improved
operation, planning, etc.
Improved efficiencies in buildings and
industry
Cleaner generation
technologies
Accessing high quality sources of renewable energy and
addressing line congestion
Accommodating increased use of EV, PV, DG, and
consumer participation
System security: physical security, cyber security, mitigating increased vulnerabilities
Seamless connection: two-way power flows and
increased data streams
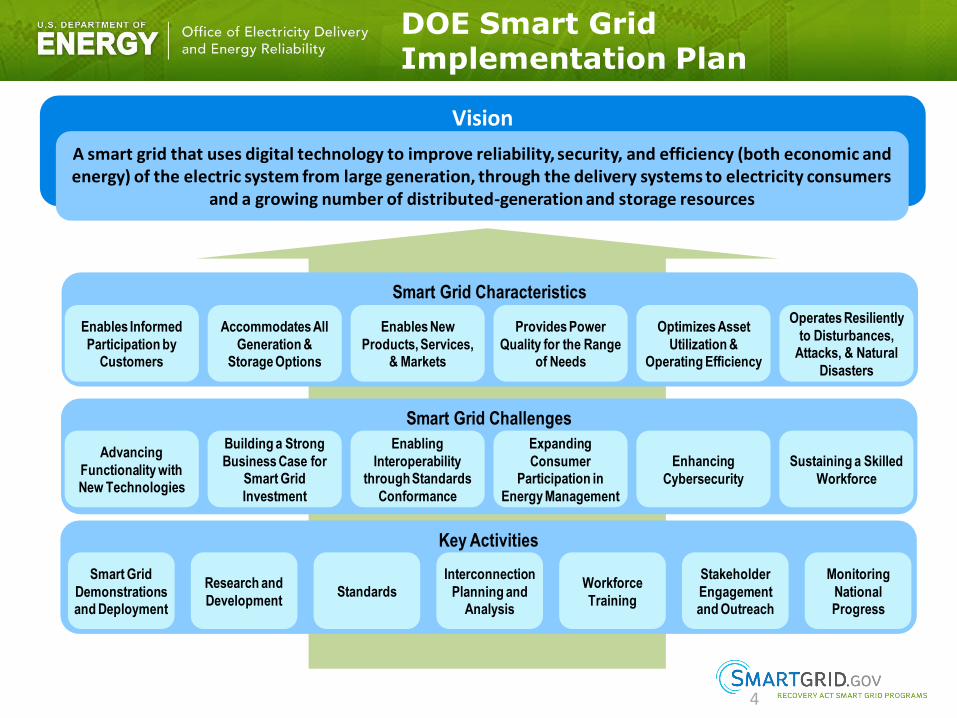
DOE Smart Grid Implementation Plan
4
Smart Grid Characteristics
Enables Informed
Participation by Customers
Accommodates All
Generation & Storage Options
Enables New
Products, Services, & Markets
Provides Power
Quality for the Range of Needs
Optimizes Asset
Utilization & Operating Efficiency
Operates Resiliently
to Disturbances, Attacks, & Natural
Disasters
Smart Grid Challenges
Advancing
Functionality with New Technologies
Building a Strong
Business Case for Smart Grid
Investment
Enabling
Interoperability through Standards
Conformance
Expanding
Consumer Participation in
Energy Management
Enhancing
Cybersecurity
Sustaining a Skilled
Workforce
Key Activities
Smart Grid
Demonstrations and Deployment
Research and
Development Standards
Interconnection
Planning and Analysis
Workforce
Training
Stakeholder
Engagement and Outreach
Monitoring
National Progress
Vision
A smart grid that uses digital technology to improve reliability, security, and efficiency (both economic and energy) of the electric system from large generation, through the delivery systems to electricity consumers
and a growing number of distributed-generation and storage resources
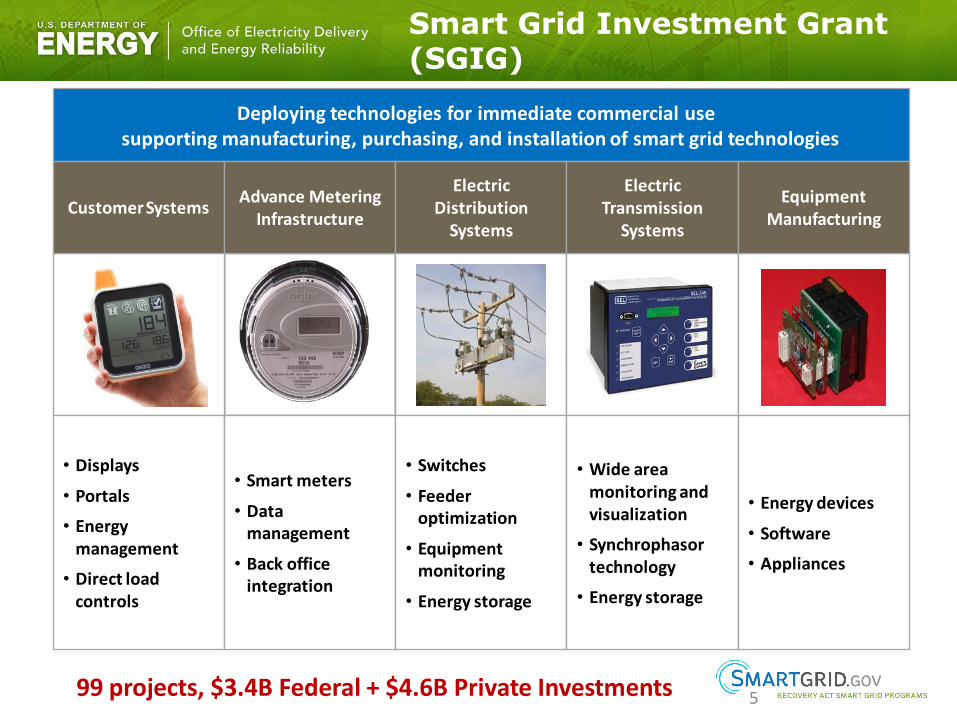
Smart Grid Investment Grant (SGIG)
5
Customer Systems Customer Systems Customer Systems Customer Systems
Deploying technologies for immediate commercial use supporting manufacturing, purchasing, and installation of smart grid technologies
Customer Systems Advance Metering
Infrastructure
Electric Distribution
Systems
Electric Transmission
Systems
• Displays
• Portals
• Energy management
• Direct load controls
• Smart meters
• Data management
• Back office integration
• Switches
• Feeder optimization
• Equipment monitoring
• Energy storage
• Wide area monitoring and visualization
• Synchrophasor technology
• Energy storage
Customer Systems
Equipment Manufacturing
• Energy devices
• Software
• Appliances
99 projects, $3.4B Federal + $4.6B Private Investments
6
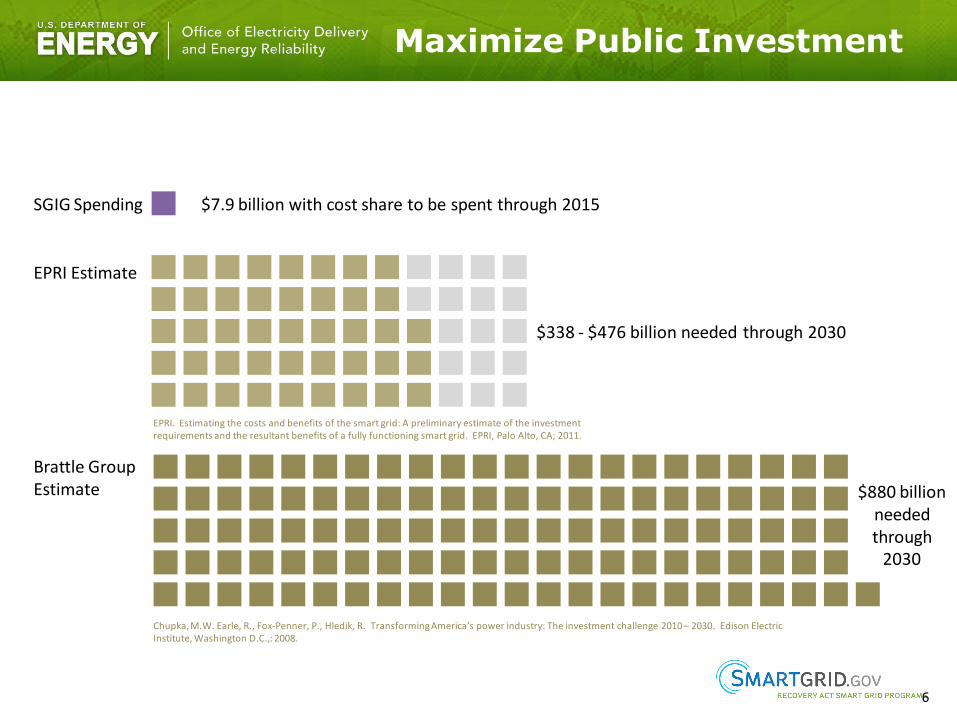
SGIG Spending
EPRI Estimate
Brattle Group Estimate
$7.9 billion with cost share to be spent through 2015
$338 - $476 billion needed through 2030
$880 billion needed through
2030
Chupka, M.W. Earle, R., Fox-Penner, P., Hledik, R. Transforming America’s power industry: The investment challenge 2010 – 2030. Edison Electric Institute, Washington D.C.,: 2008.
EPRI. Estimating the costs and benefits of the smart grid: A preliminary estimate of the investment requirements and the resultant benefits of a fully functioning smart grid. EPRI, Palo Alto, CA; 2011.
Maximize Public Investment
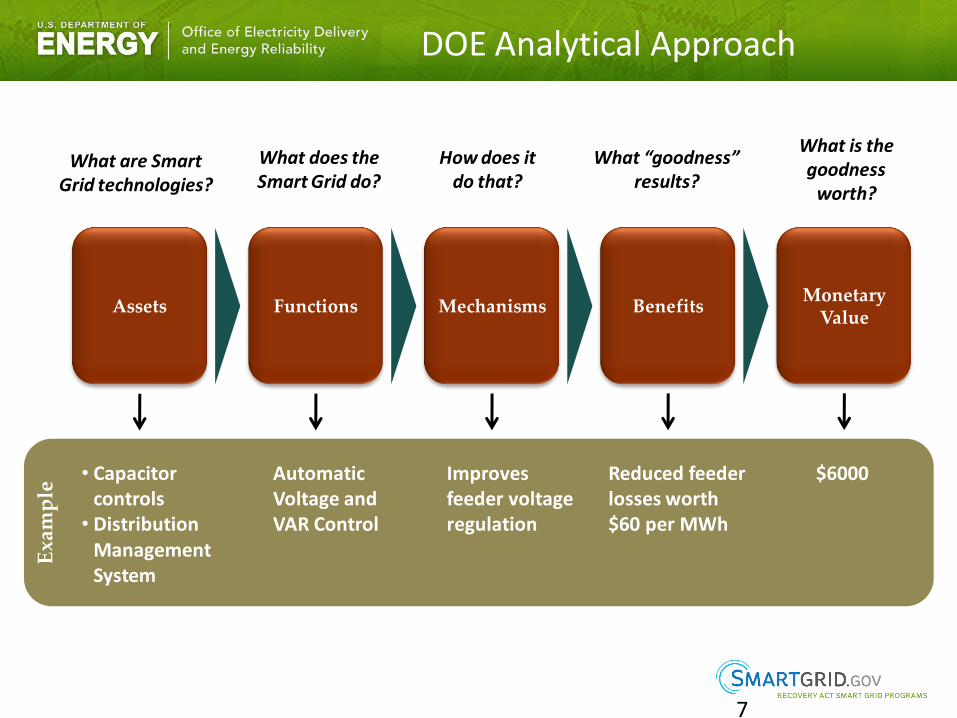
DOE Analytical Approach E
xam
ple
Improves feeder voltage regulation
Reduced feeder losses worth $60 per MWh
Automatic Voltage and VAR Control
• Capacitor controls
• Distribution Management System
Functions Mechanisms Benefits
What does the Smart Grid do?
How does it do that?
What “goodness” results?
Monetary Value
What is the goodness
worth?
What are Smart Grid technologies?
Assets
$6000
7
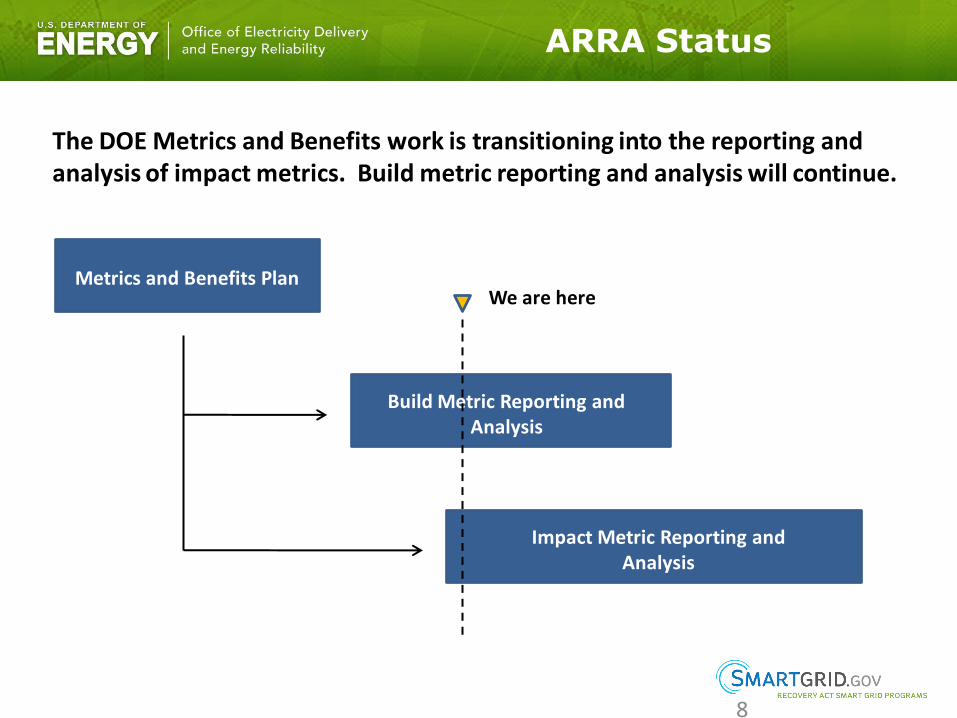
ARRA Status
The DOE Metrics and Benefits work is transitioning into the reporting and analysis of impact metrics. Build metric reporting and analysis will continue.
8
Metrics and Benefits Plan
Build Metric Reporting and Analysis
We are here
Impact Metric Reporting and Analysis
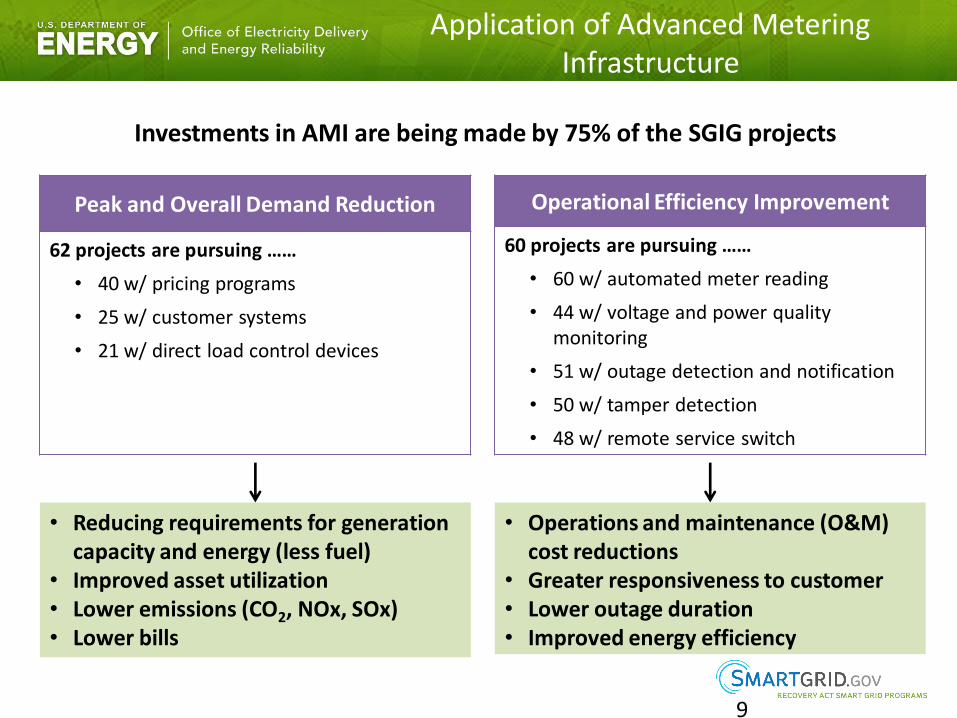
Application of Advanced Metering Infrastructure
Investments in AMI are being made by 75% of the SGIG projects
9
Peak and Overall Demand Reduction
62 projects are pursuing ……
• 40 w/ pricing programs
• 25 w/ customer systems
• 21 w/ direct load control devices
Operational Efficiency Improvement
60 projects are pursuing ……
• 60 w/ automated meter reading
• 44 w/ voltage and power quality monitoring
• 51 w/ outage detection and notification
• 50 w/ tamper detection
• 48 w/ remote service switch
• Reducing requirements for generation capacity and energy (less fuel)
• Improved asset utilization • Lower emissions (CO2, NOx, SOx) • Lower bills
• Operations and maintenance (O&M) cost reductions
• Greater responsiveness to customer • Lower outage duration • Improved energy efficiency
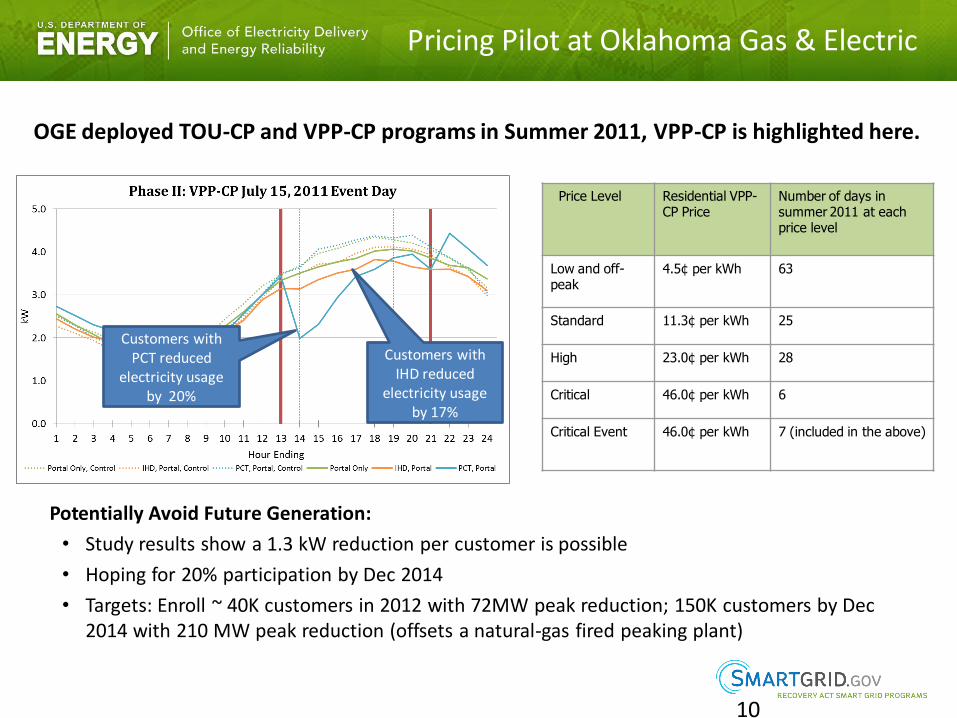
Pricing Pilot at Oklahoma Gas & Electric
10
Potentially Avoid Future Generation:
• Study results show a 1.3 kW reduction per customer is possible
• Hoping for 20% participation by Dec 2014
• Targets: Enroll ~ 40K customers in 2012 with 72MW peak reduction; 150K customers by Dec 2014 with 210 MW peak reduction (offsets a natural-gas fired peaking plant)
Customers with PCT reduced
electricity usage by 20%
Customers with IHD reduced
electricity usage by 17%
Price Level Residential VPP-CP Price
Number of days in summer 2011 at each price level
Low and off-peak
4.5¢ per kWh 63
Standard 11.3¢ per kWh 25
High 23.0¢ per kWh 28
Critical 46.0¢ per kWh 6
Critical Event 46.0¢ per kWh 7 (included in the above)
OGE deployed TOU-CP and VPP-CP programs in Summer 2011, VPP-CP is highlighted here.
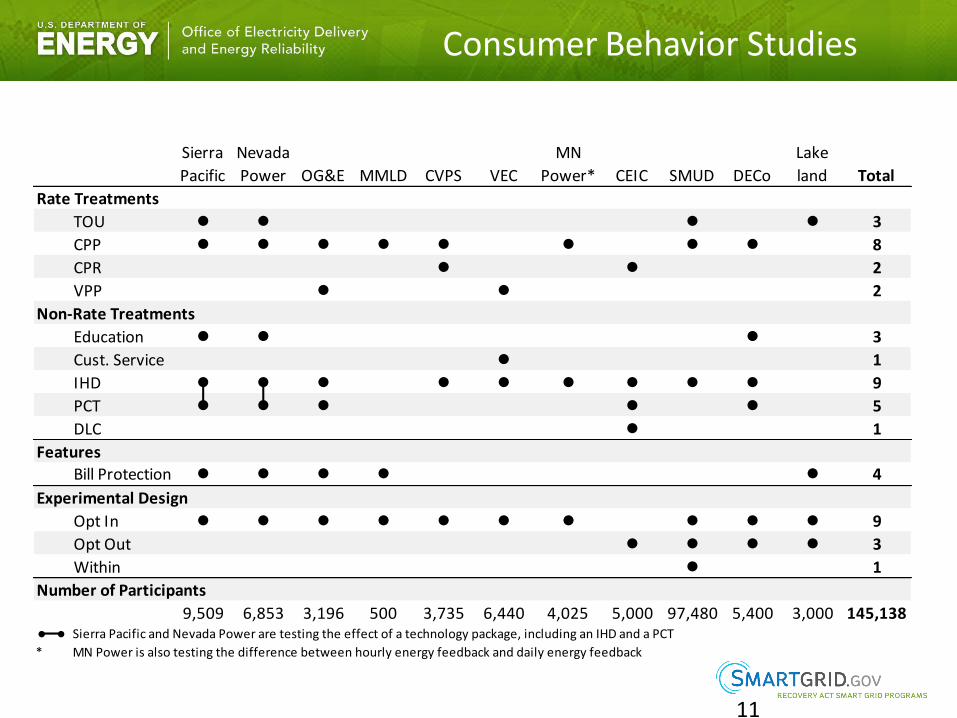
Consumer Behavior Studies
11
Sierra
Pacific
Nevada
Power OG&E MMLD CVPS VEC
MN
Power* CEIC SMUD DECo
Lake
land Total
Rate Treatments
TOU l l l l 3
CPP l l l l l l l l 8
CPR l l 2
VPP l l 2
Non-Rate Treatments
Education l l l 3
Cust. Service l 1
IHD l l l l l l l l l 9
PCT l l l l l 5
DLC l 1
Features
Bill Protection l l l l l 4
Experimental Design
Opt In l l l l l l l l l l 9
Opt Out l l l l 3
Within l 1
Number of Participants
9,509 6,853 3,196 500 3,735 6,440 4,025 5,000 97,480 5,400 3,000 145,138l l Sierra Pacific and Nevada Power are testing the effect of a technology package, including an IHD and a PCT
* MN Power is also testing the difference between hourly energy feedback and daily energy feedback
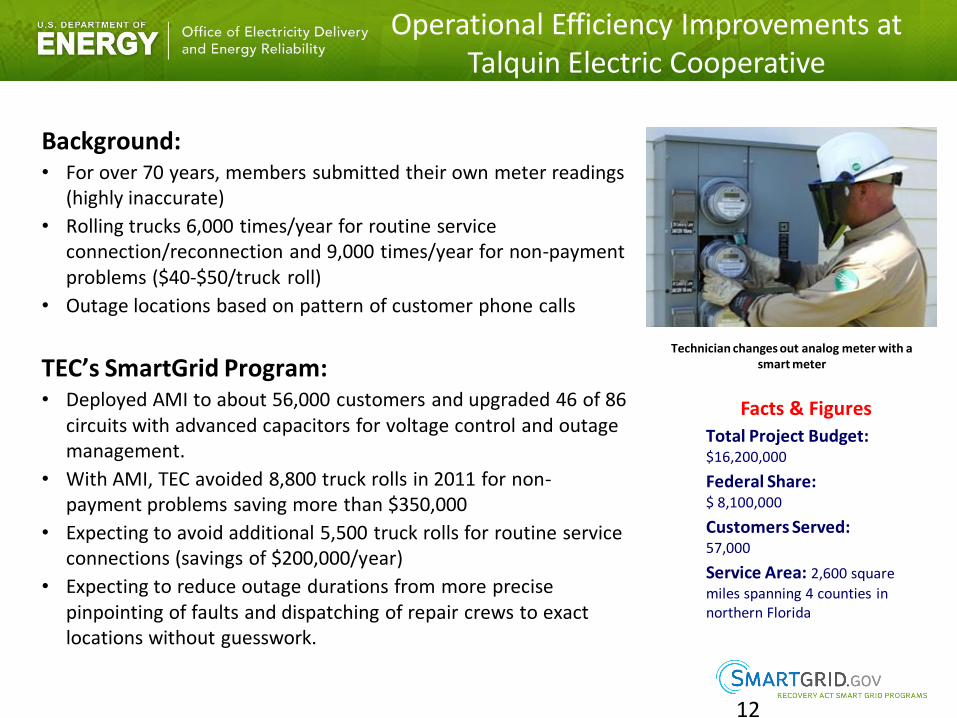
Operational Efficiency Improvements at Talquin Electric Cooperative
12
Background: • For over 70 years, members submitted their own meter readings
(highly inaccurate)
• Rolling trucks 6,000 times/year for routine service connection/reconnection and 9,000 times/year for non-payment problems ($40-$50/truck roll)
• Outage locations based on pattern of customer phone calls
TEC’s SmartGrid Program: • Deployed AMI to about 56,000 customers and upgraded 46 of 86
circuits with advanced capacitors for voltage control and outage management.
• With AMI, TEC avoided 8,800 truck rolls in 2011 for non-payment problems saving more than $350,000
• Expecting to avoid additional 5,500 truck rolls for routine service connections (savings of $200,000/year)
• Expecting to reduce outage durations from more precise pinpointing of faults and dispatching of repair crews to exact locations without guesswork.
Technician changes out analog meter with a smart meter
Facts & Figures
Total Project Budget: $16,200,000
Federal Share: $ 8,100,000
Customers Served: 57,000
Service Area: 2,600 square
miles spanning 4 counties in northern Florida
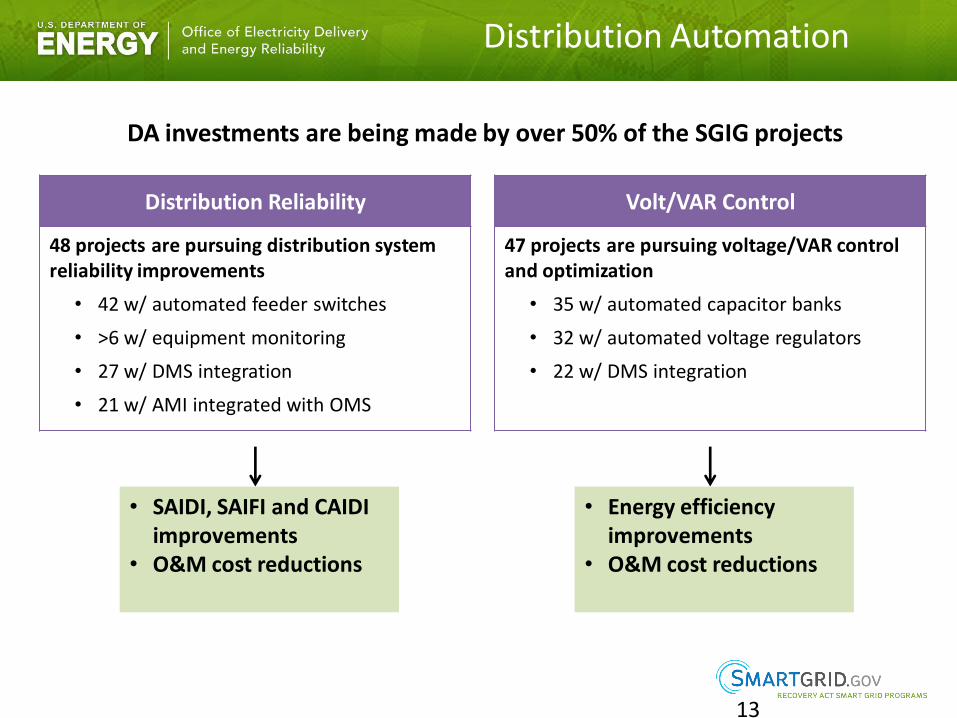
Distribution Automation
DA investments are being made by over 50% of the SGIG projects
13
Distribution Reliability
48 projects are pursuing distribution system reliability improvements
• 42 w/ automated feeder switches
• >6 w/ equipment monitoring
• 27 w/ DMS integration
• 21 w/ AMI integrated with OMS
Volt/VAR Control
47 projects are pursuing voltage/VAR control and optimization
• 35 w/ automated capacitor banks
• 32 w/ automated voltage regulators
• 22 w/ DMS integration
• SAIDI, SAIFI and CAIDI improvements
• O&M cost reductions
• Energy efficiency improvements
• O&M cost reductions
14
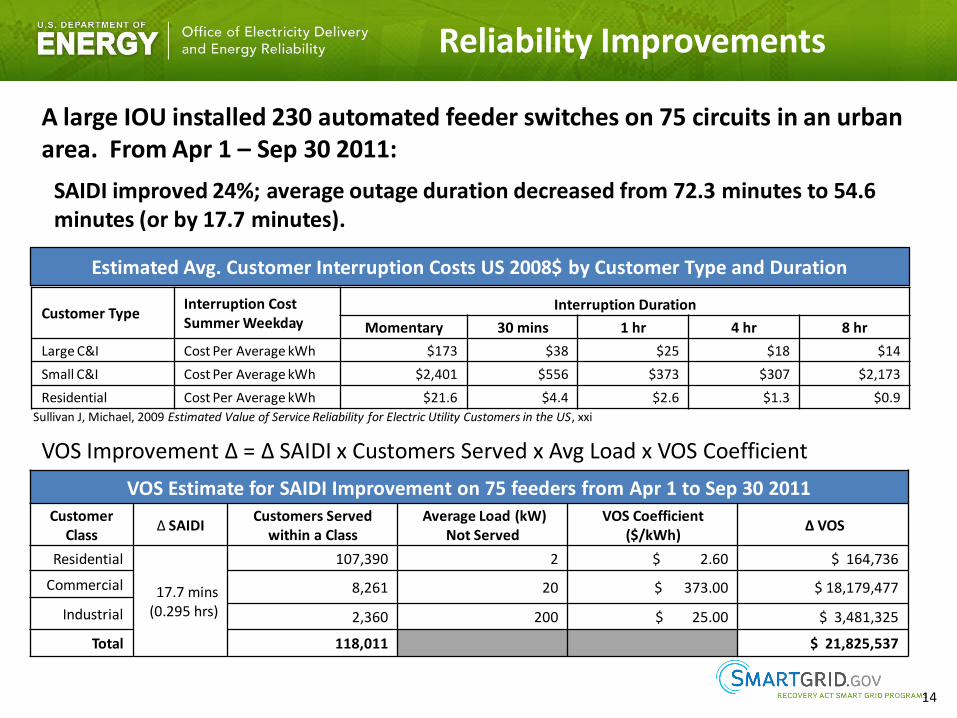
Reliability Improvements
A large IOU installed 230 automated feeder switches on 75 circuits in an urban area. From Apr 1 – Sep 30 2011:
SAIDI improved 24%; average outage duration decreased from 72.3 minutes to 54.6 minutes (or by 17.7 minutes).
Customer Type
Interruption Cost Summer Weekday
Interruption Duration
Momentary 30 mins 1 hr 4 hr 8 hr
Large C&I Cost Per Average kWh $173 $38 $25 $18 $14
Small C&I Cost Per Average kWh $2,401 $556 $373 $307 $2,173
Residential Cost Per Average kWh $21.6 $4.4 $2.6 $1.3 $0.9
Estimated Avg. Customer Interruption Costs US 2008$ by Customer Type and Duration
*Sullivan J, Michael, 2009 Estimated Value of Service Reliability for Electric Utility Customers in the US, xxi VOS Estimate for SAIDI Improvement on 75 feeders from Apr 1 to Sep 30 2011
Customer Class
Δ SAIDI Customers Served
within a Class Average Load (kW)
Not Served VOS Coefficient
($/kWh) Δ VOS
Residential
17.7 mins (0.295 hrs)
107,390 2 $ 2.60 $ 164,736
Commercial 8,261 20 $ 373.00 $ 18,179,477
Industrial 2,360 200 $ 25.00 $ 3,481,325
Total 118,011 $ 21,825,537
VOS Improvement Δ = Δ SAIDI x Customers Served x Avg Load x VOS Coefficient
Sullivan J, Michael, 2009 Estimated Value of Service Reliability for Electric Utility Customers in the US, xxi
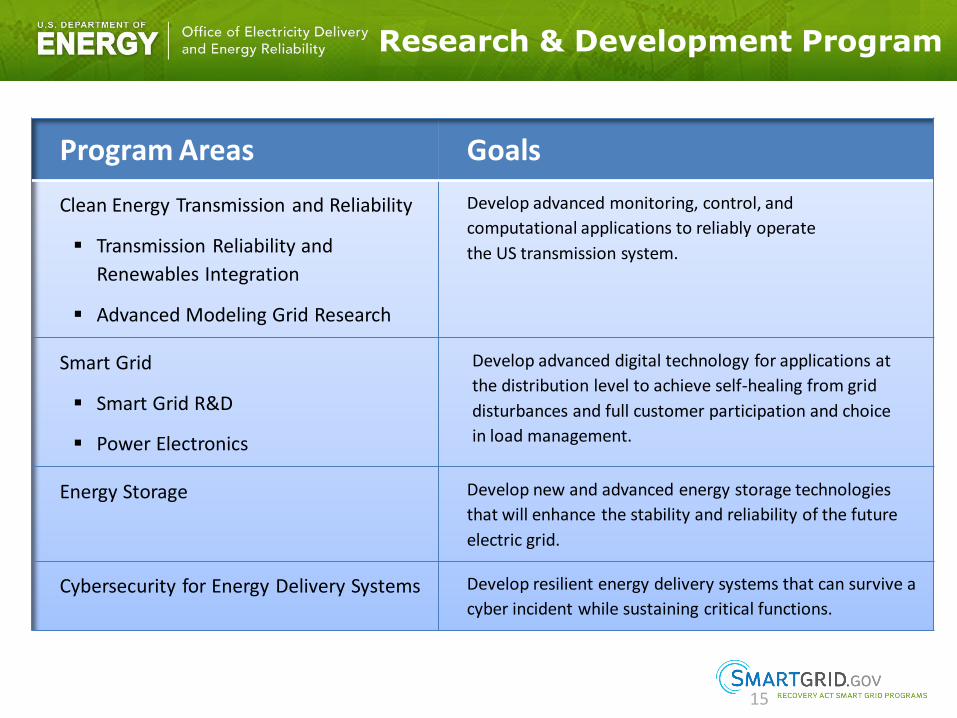
Research & Development Program
15
Program Areas Goals
Clean Energy Transmission and Reliability
Transmission Reliability and
Renewables Integration
Advanced Modeling Grid Research
Develop advanced monitoring, control, and
computational applications to reliably operate
the US transmission system.
Smart Grid
Smart Grid R&D
Power Electronics
Develop advanced digital technology for applications at
the distribution level to achieve self-healing from grid
disturbances and full customer participation and choice
in load management.
Energy Storage
Develop new and advanced energy storage technologies
that will enhance the stability and reliability of the future
electric grid.
Cybersecurity for Energy Delivery Systems Develop resilient energy delivery systems that can survive a
cyber incident while sustaining critical functions.
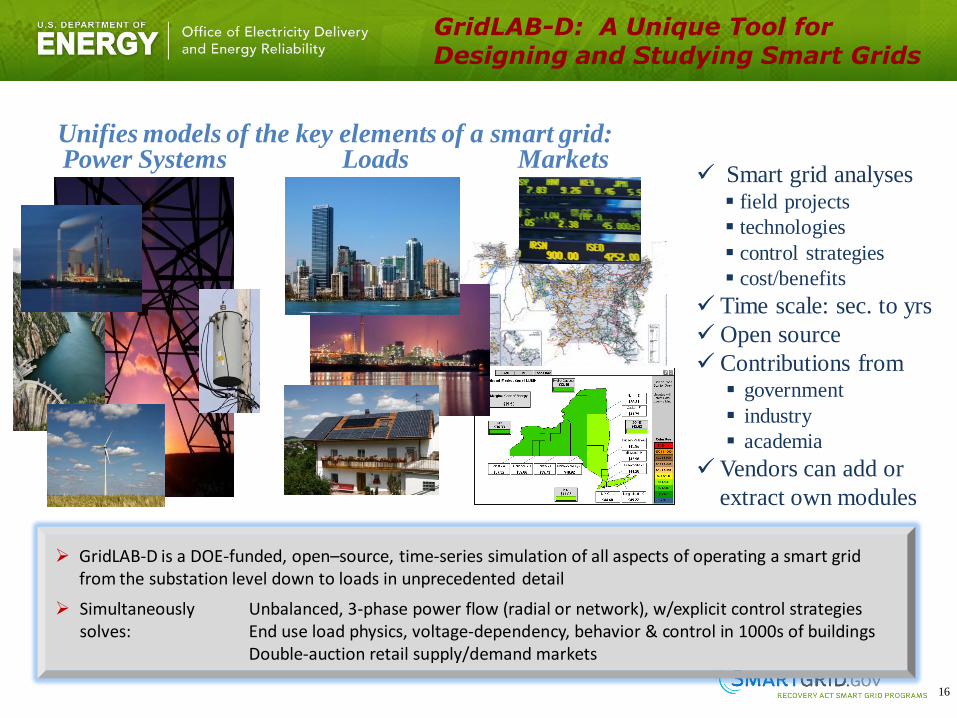
Smart grid analyses field projects
technologies
control strategies
cost/benefits
Time scale: sec. to yrs
Open source
Contributions from government
industry
academia
Vendors can add or
extract own modules
GridLAB-D: A Unique Tool for Designing and Studying Smart Grids
Power Systems Loads Markets Unifies models of the key elements of a smart grid:
16
GridLAB-D is a DOE-funded, open–source, time-series simulation of all aspects of operating a smart grid from the substation level down to loads in unprecedented detail
Simultaneously Unbalanced, 3-phase power flow (radial or network), w/explicit control strategies solves: End use load physics, voltage-dependency, behavior & control in 1000s of buildings Double-auction retail supply/demand markets
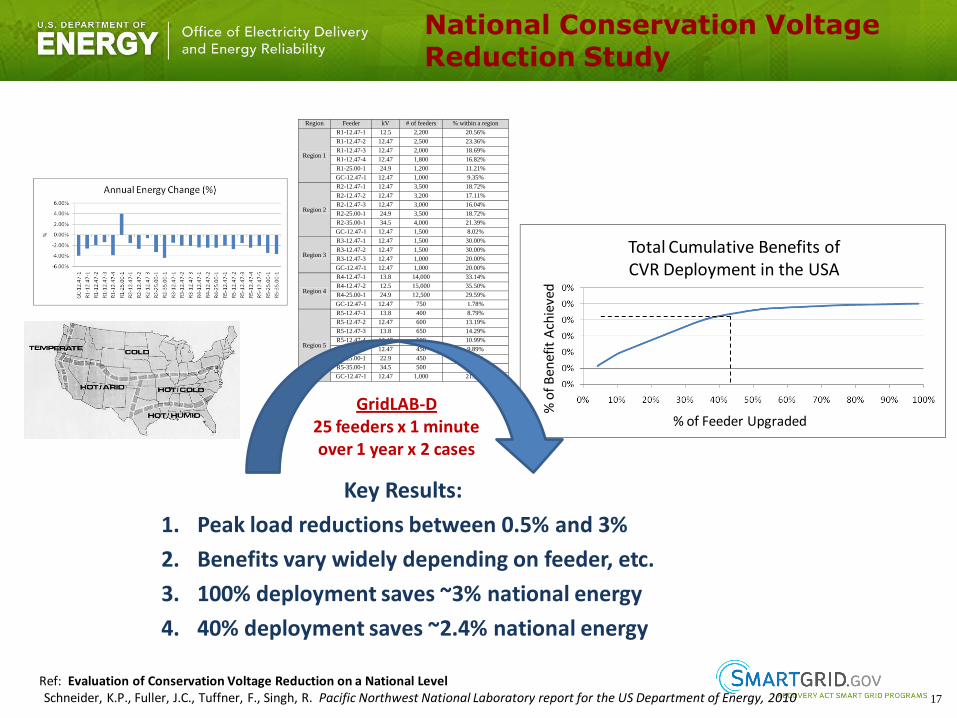
National Conservation Voltage Reduction Study
Region Feeder kV # of feeders % within a region
Region 1
R1-12.47-1 12.5 2,200 20.56%
R1-12.47-2 12.47 2,500 23.36%
R1-12.47-3 12.47 2,000 18.69%
R1-12.47-4 12.47 1,800 16.82%
R1-25.00-1 24.9 1,200 11.21%
GC-12.47-1 12.47 1,000 9.35%
Region 2
R2-12.47-1 12.47 3,500 18.72%
R2-12.47-2 12.47 3,200 17.11%
R2-12.47-3 12.47 3,000 16.04%
R2-25.00-1 24.9 3,500 18.72%
R2-35.00-1 34.5 4,000 21.39%
GC-12.47-1 12.47 1,500 8.02%
Region 3
R3-12.47-1 12.47 1,500 30.00%
R3-12.47-2 12.47 1,500 30.00%
R3-12.47-3 12.47 1,000 20.00%
GC-12.47-1 12.47 1,000 20.00%
Region 4
R4-12.47-1 13.8 14,000 33.14%
R4-12.47-2 12.5 15,000 35.50%
R4-25.00-1 24.9 12,500 29.59%
GC-12.47-1 12.47 750 1.78%
Region 5
R5-12.47-1 13.8 400 8.79%
R5-12.47-2 12.47 600 13.19%
R5-12.47-3 13.8 650 14.29%
R5-12.47-4 12.47 500 10.99%
R5-12.47-5 12.47 450 9.89%
R5-25.00-1 22.9 450 9.89%
R5-35.00-1 34.5 500 10.99%
GC-12.47-1 12.47 1,000 21.98%
Key Results:
1. Peak load reductions between 0.5% and 3%
2. Benefits vary widely depending on feeder, etc.
3. 100% deployment saves ~3% national energy
4. 40% deployment saves ~2.4% national energy
Total Cumulative Benefits of CVR Deployment in the USA
% of Feeder Upgraded
% o
f B
enef
it A
chie
ved
GridLAB-D 25 feeders x 1 minute over 1 year x 2 cases
Ref: Evaluation of Conservation Voltage Reduction on a National Level Schneider, K.P., Fuller, J.C., Tuffner, F., Singh, R. Pacific Northwest National Laboratory report for the US Department of Energy, 2010
17
Standards – Key Aspect of US Policy
18
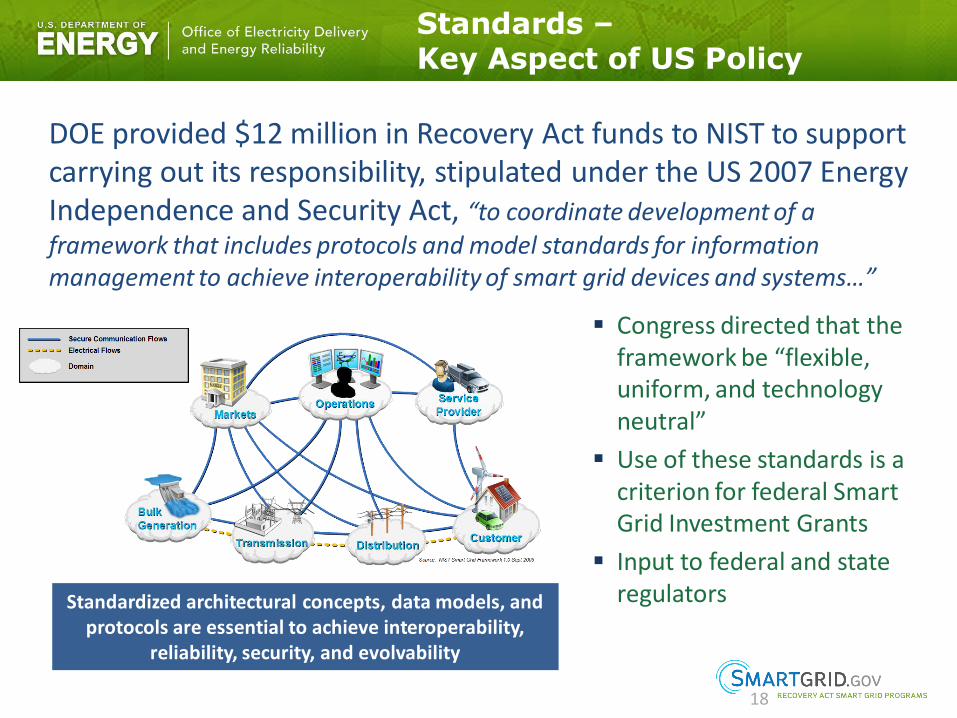
DOE provided $12 million in Recovery Act funds to NIST to support carrying out its responsibility, stipulated under the US 2007 Energy Independence and Security Act, “to coordinate development of a framework that includes protocols and model standards for information management to achieve interoperability of smart grid devices and systems…”
Congress directed that the framework be “flexible, uniform, and technology neutral”
Use of these standards is a criterion for federal Smart Grid Investment Grants
Input to federal and state regulators
Standardized architectural concepts, data models, and
protocols are essential to achieve interoperability, reliability, security, and evolvability
Smart Grid Interoperability Standards
19
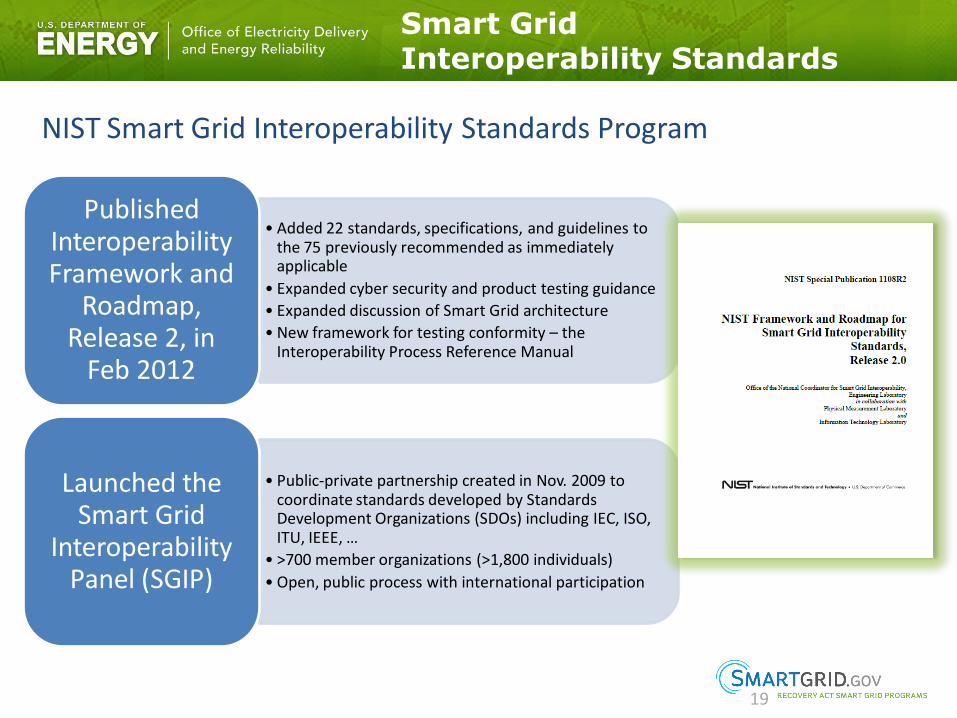
NIST Smart Grid Interoperability Standards Program
• Added 22 standards, specifications, and guidelines to the 75 previously recommended as immediately applicable
• Expanded cyber security and product testing guidance
• Expanded discussion of Smart Grid architecture
• New framework for testing conformity – the Interoperability Process Reference Manual
Published Interoperability Framework and
Roadmap, Release 2, in
Feb 2012
• Public-private partnership created in Nov. 2009 to coordinate standards developed by Standards Development Organizations (SDOs) including IEC, ISO, ITU, IEEE, …
• >700 member organizations (>1,800 individuals)
• Open, public process with international participation
Launched the Smart Grid
Interoperability Panel (SGIP)
Interconnection Transmission Planning
20
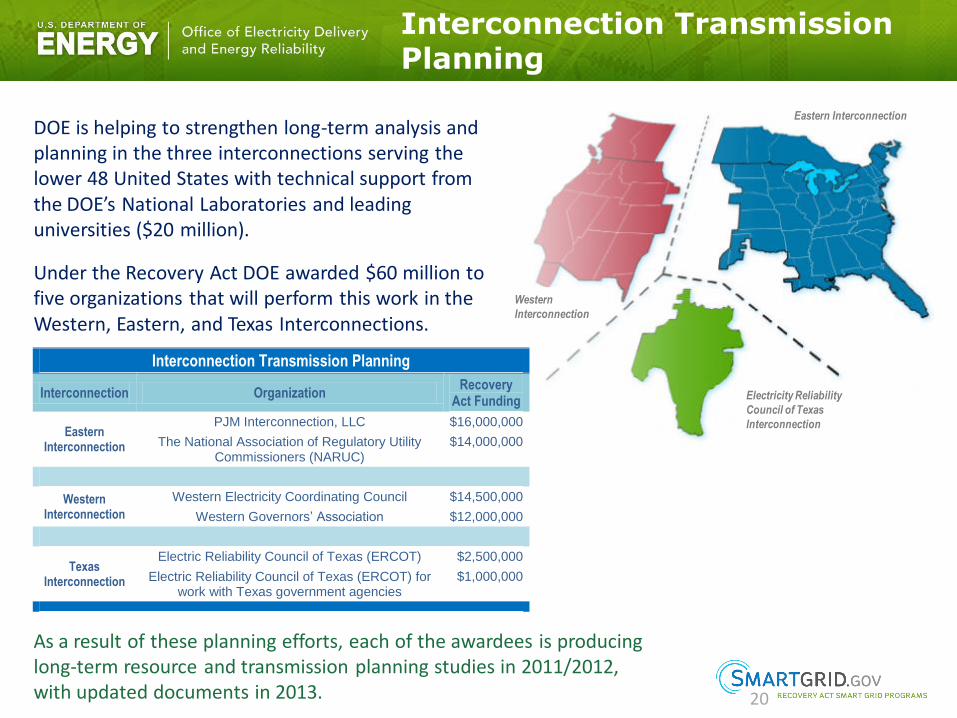
DOE is helping to strengthen long-term analysis and planning in the three interconnections serving the lower 48 United States with technical support from the DOE’s National Laboratories and leading universities ($20 million).
Under the Recovery Act DOE awarded $60 million to five organizations that will perform this work in the Western, Eastern, and Texas Interconnections.
As a result of these planning efforts, each of the awardees is producing long-term resource and transmission planning studies in 2011/2012, with updated documents in 2013.
Electricity Reliability
Council of Texas
Interconnection
Western
Interconnection
Eastern Interconnection
Interconnection Transmission Planning
Interconnection Organization Recovery
Act Funding
Eastern Interconnection
PJM Interconnection, LLC $16,000,000
The National Association of Regulatory Utility Commissioners (NARUC)
$14,000,000
Western Interconnection
Western Electricity Coordinating Council $14,500,000
Western Governors’ Association $12,000,000
Texas Interconnection
Electric Reliability Council of Texas (ERCOT) $2,500,000
Electric Reliability Council of Texas (ERCOT) for work with Texas government agencies
$1,000,000
Workforce Development Training Projects
21
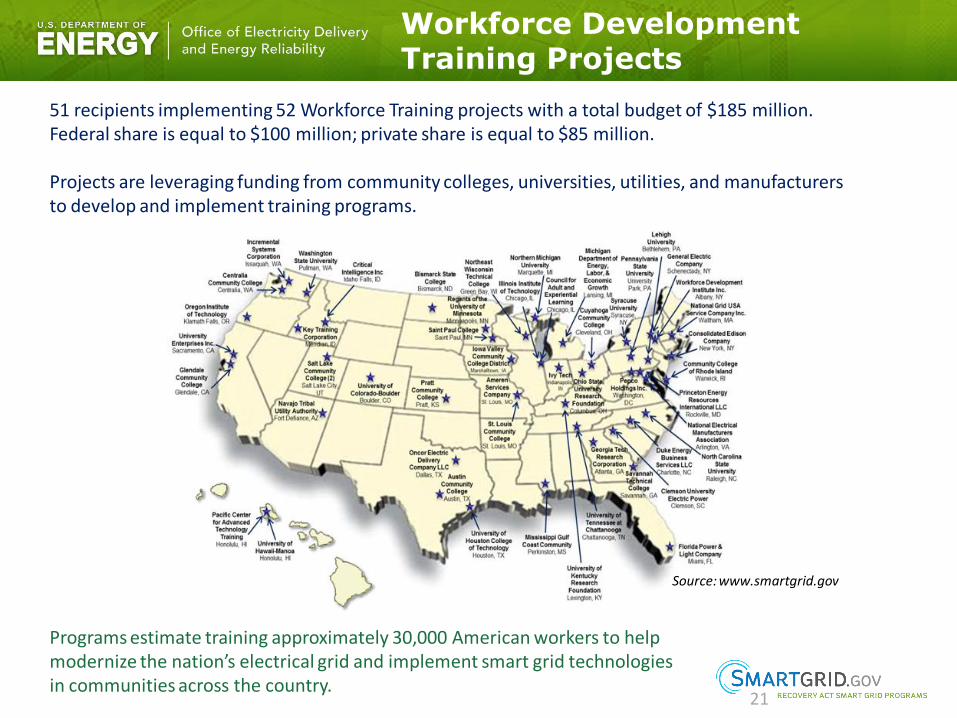
51 recipients implementing 52 Workforce Training projects with a total budget of $185 million. Federal share is equal to $100 million; private share is equal to $85 million.
Projects are leveraging funding from community colleges, universities, utilities, and manufacturers to develop and implement training programs.
Programs estimate training approximately 30,000 American workers to help modernize the nation’s electrical grid and implement smart grid technologies in communities across the country.
Source: www.smartgrid.gov
Stakeholder Engagement and Outreach
22
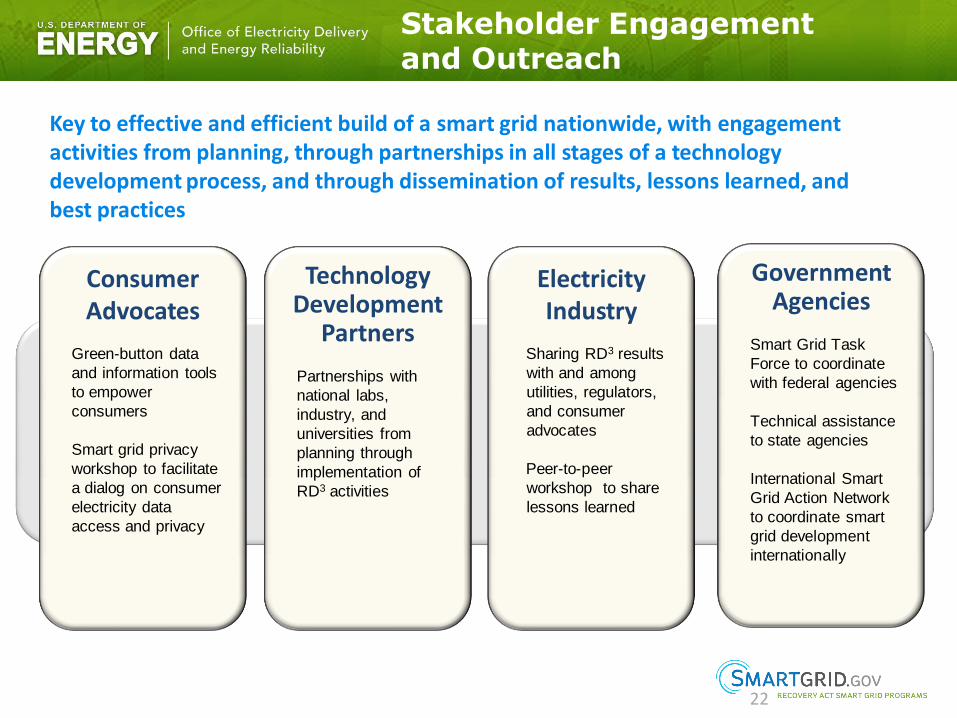
Key to effective and efficient build of a smart grid nationwide, with engagement activities from planning, through partnerships in all stages of a technology development process, and through dissemination of results, lessons learned, and best practices
Government Agencies
Smart Grid Task
Force to coordinate
with federal agencies
Technical assistance
to state agencies
International Smart
Grid Action Network
to coordinate smart
grid development
internationally
Consumer Advocates
Green-button data
and information tools
to empower
consumers
Smart grid privacy
workshop to facilitate
a dialog on consumer
electricity data
access and privacy
Technology Development
Partners
Partnerships with
national labs,
industry, and
universities from
planning through
implementation of
RD3 activities
Electricity Industry
Sharing RD3 results
with and among
utilities, regulators,
and consumer
advocates
Peer-to-peer
workshop to share
lessons learned
Green Button Data and Information Tools
23
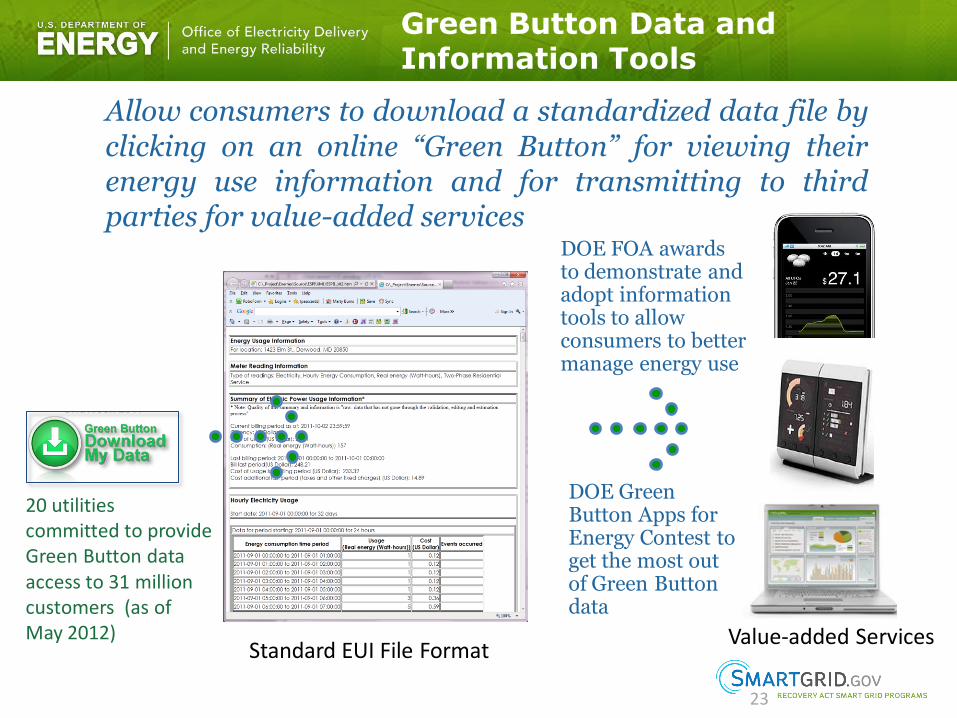
Allow consumers to download a standardized data file by clicking on an online “Green Button” for viewing their energy use information and for transmitting to third parties for value-added services
DOE FOA awards to demonstrate and adopt information tools to allow consumers to better manage energy use
Value-added Services Standard EUI File Format
DOE Green Button Apps for Energy Contest to get the most out of Green Button data
20 utilities committed to provide Green Button data access to 31 million customers (as of May 2012)
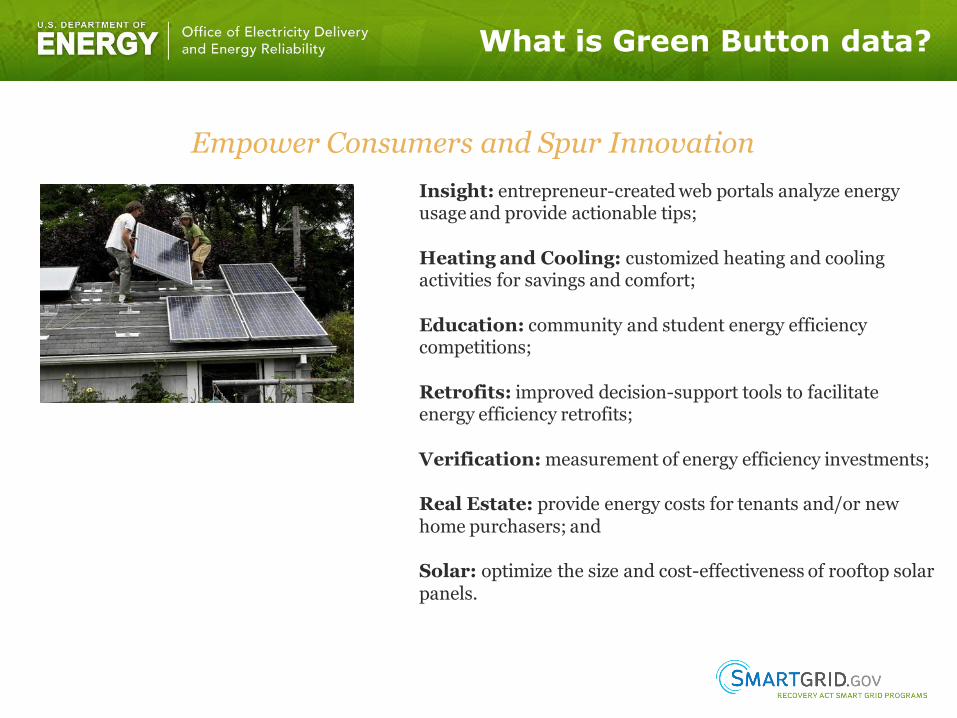
Insight: entrepreneur-created web portals analyze energy usage and provide actionable tips; Heating and Cooling: customized heating and cooling activities for savings and comfort; Education: community and student energy efficiency competitions; Retrofits: improved decision-support tools to facilitate energy efficiency retrofits; Verification: measurement of energy efficiency investments; Real Estate: provide energy costs for tenants and/or new home purchasers; and Solar: optimize the size and cost-effectiveness of rooftop solar panels.
Empower Consumers and Spur Innovation
What is Green Button data?
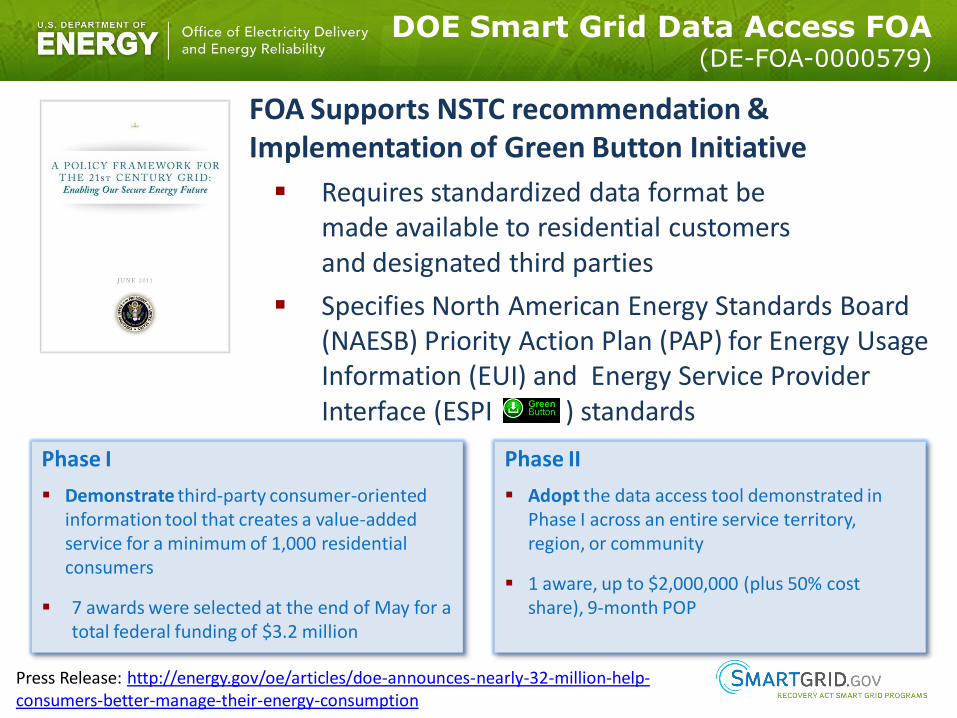
FOA Supports NSTC recommendation & Implementation of Green Button Initiative
Requires standardized data format be made available to residential customers and designated third parties
Specifies North American Energy Standards Board (NAESB) Priority Action Plan (PAP) for Energy Usage Information (EUI) and Energy Service Provider Interface (ESPI ) standards
Phase I
Demonstrate third-party consumer-oriented information tool that creates a value-added service for a minimum of 1,000 residential consumers
7 awards were selected at the end of May for a total federal funding of $3.2 million
Press Release: http://energy.gov/oe/articles/doe-announces-nearly-32-million-help-consumers-better-manage-their-energy-consumption
Phase II
Adopt the data access tool demonstrated in Phase I across an entire service territory, region, or community
1 aware, up to $2,000,000 (plus 50% cost share), 9-month POP
DOE Smart Grid Data Access FOA (DE-FOA-0000579)
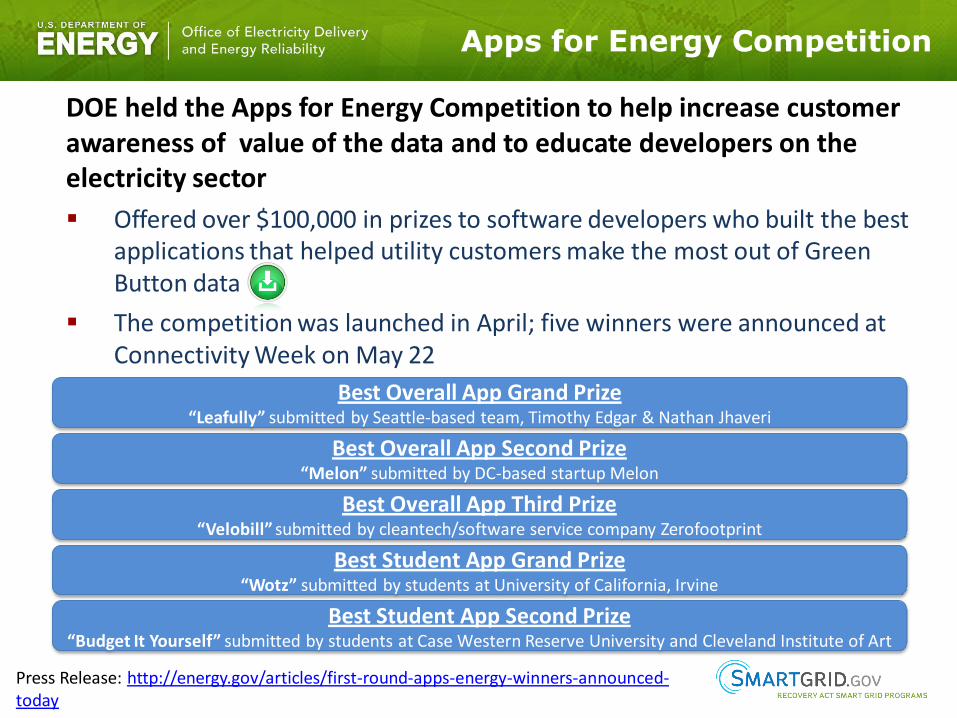
DOE held the Apps for Energy Competition to help increase customer awareness of value of the data and to educate developers on the electricity sector
Offered over $100,000 in prizes to software developers who built the best applications that helped utility customers make the most out of Green Button data
The competition was launched in April; five winners were announced at Connectivity Week on May 22
The five winners were:
Press Release: http://energy.gov/articles/first-round-apps-energy-winners-announced-today
Best Overall App Grand Prize “Leafully” submitted by Seattle-based team, Timothy Edgar & Nathan Jhaveri
Best Overall App Second Prize “Melon” submitted by DC-based startup Melon
Best Overall App Third Prize “Velobill” submitted by cleantech/software service company Zerofootprint
Best Student App Grand Prize “Wotz” submitted by students at University of California, Irvine
Best Student App Second Prize “Budget It Yourself” submitted by students at Case Western Reserve University and Cleveland Institute of Art
Apps for Energy Competition
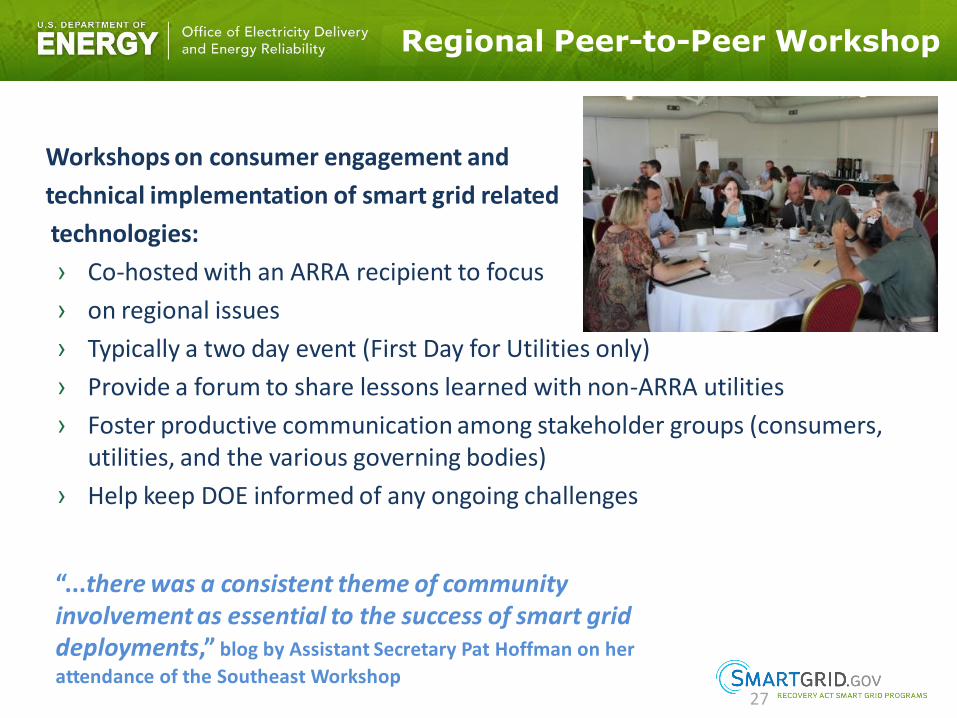
Regional Peer-to-Peer Workshop
27
“...there was a consistent theme of community involvement as essential to the success of smart grid deployments,” blog by Assistant Secretary Pat Hoffman on her
attendance of the Southeast Workshop
Workshops on consumer engagement and
technical implementation of smart grid related
technologies:
› Co-hosted with an ARRA recipient to focus
› on regional issues
› Typically a two day event (First Day for Utilities only)
› Provide a forum to share lessons learned with non-ARRA utilities
› Foster productive communication among stakeholder groups (consumers, utilities, and the various governing bodies)
› Help keep DOE informed of any ongoing challenges
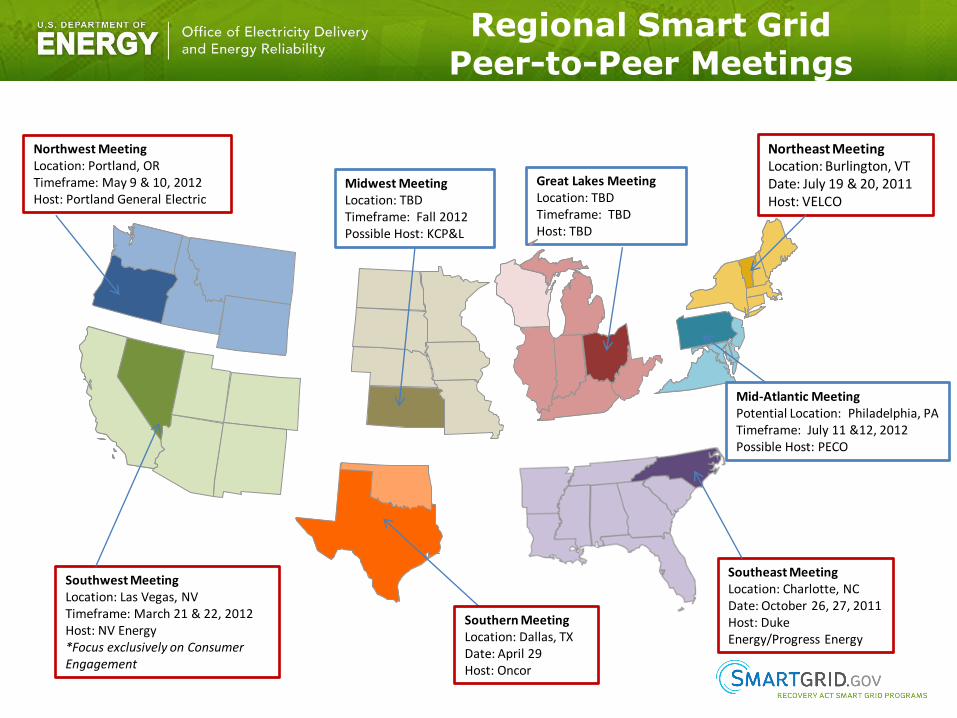
Regional Smart Grid Peer-to-Peer Meetings
Northeast Meeting Location: Burlington, VT Date: July 19 & 20, 2011 Host: VELCO
Southern Meeting Location: Dallas, TX Date: April 29 Host: Oncor
Southeast Meeting Location: Charlotte, NC Date: October 26, 27, 2011 Host: Duke Energy/Progress Energy
Mid-Atlantic Meeting Potential Location: Philadelphia, PA Timeframe: July 11 &12, 2012 Possible Host: PECO
Great Lakes Meeting Location: TBD Timeframe: TBD Host: TBD
Midwest Meeting Location: TBD Timeframe: Fall 2012 Possible Host: KCP&L
Northwest Meeting Location: Portland, OR Timeframe: May 9 & 10, 2012 Host: Portland General Electric
Southwest Meeting Location: Las Vegas, NV Timeframe: March 21 & 22, 2012 Host: NV Energy *Focus exclusively on Consumer Engagement
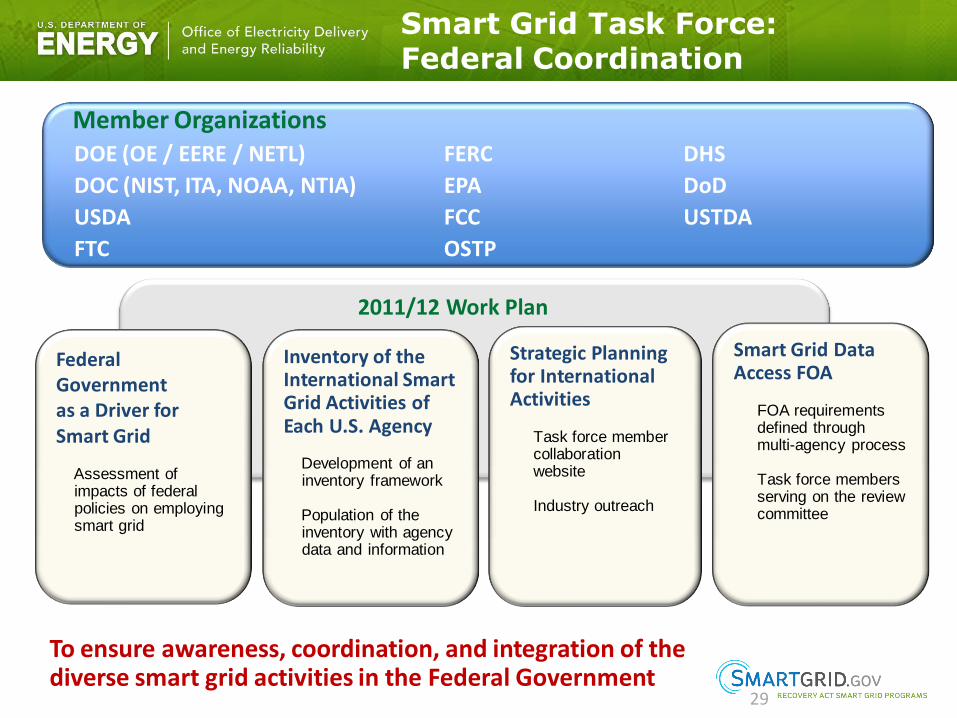
Smart Grid Task Force: Federal Coordination
29
To ensure awareness, coordination, and integration of the diverse smart grid activities in the Federal Government
Strategic Planning for International Activities
Task force member collaboration website Industry outreach
Smart Grid Data Access FOA
FOA requirements defined through multi-agency process Task force members serving on the review committee
Inventory of the International Smart Grid Activities of Each U.S. Agency
Development of an inventory framework Population of the inventory with agency data and information
Federal Government as a Driver for Smart Grid
Assessment of impacts of federal policies on employing smart grid
2011/12 Work Plan
Member Organizations DOE (OE / EERE / NETL) FERC DHS
DOC (NIST, ITA, NOAA, NTIA) EPA DoD
USDA FCC USTDA
FTC OSTP
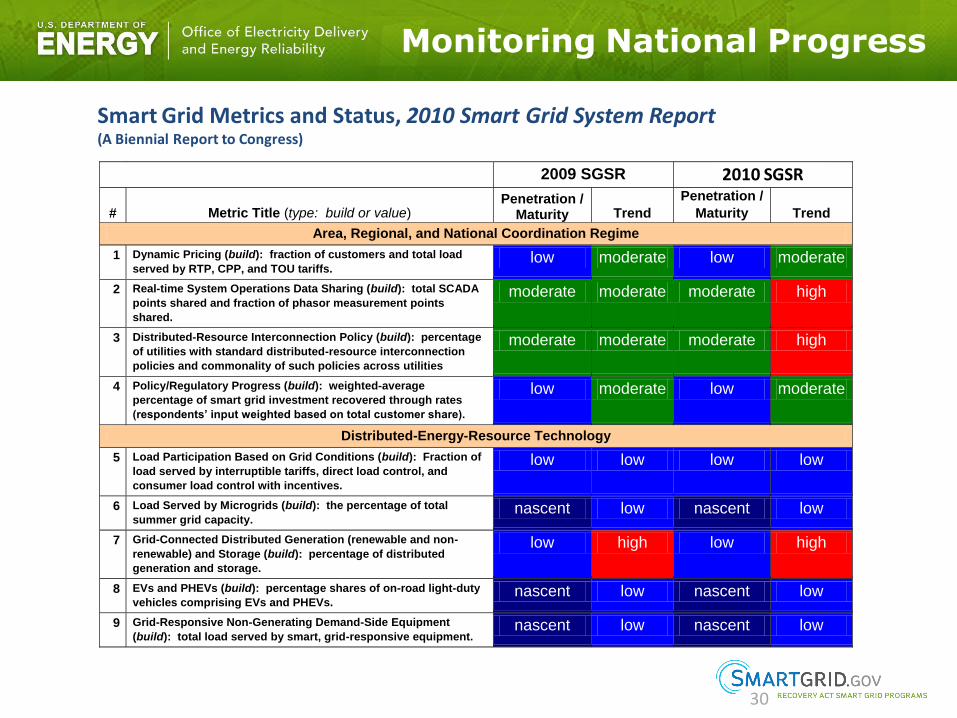
Monitoring National Progress
30
Smart Grid Metrics and Status, 2010 Smart Grid System Report (A Biennial Report to Congress)
2009 SGSR 2011 SGSR
# Metric Title (type: build or value) Penetration /
Maturity Trend
Penetration /
Maturity Trend
Area, Regional, and National Coordination Regime
1 Dynamic Pricing (build): fraction of customers and total load
served by RTP, CPP, and TOU tariffs. low moderate low moderate
2 Real-time System Operations Data Sharing (build): total SCADA
points shared and fraction of phasor measurement points
shared.
moderate moderate moderate high
3 Distributed-Resource Interconnection Policy (build): percentage
of utilities with standard distributed-resource interconnection
policies and commonality of such policies across utilities
moderate moderate moderate high
4 Policy/Regulatory Progress (build): weighted-average
percentage of smart grid investment recovered through rates
(respondents’ input weighted based on total customer share).
low moderate low moderate
Distributed-Energy-Resource Technology
5 Load Participation Based on Grid Conditions (build): Fraction of
load served by interruptible tariffs, direct load control, and
consumer load control with incentives.
low low low low
6 Load Served by Microgrids (build): the percentage of total
summer grid capacity. nascent low nascent low
7 Grid-Connected Distributed Generation (renewable and non-
renewable) and Storage (build): percentage of distributed
generation and storage.
low high low high
8 EVs and PHEVs (build): percentage shares of on-road light-duty
vehicles comprising EVs and PHEVs. nascent low nascent low
9 Grid-Responsive Non-Generating Demand-Side Equipment
(build): total load served by smart, grid-responsive equipment. nascent low nascent low
2010 SGSR
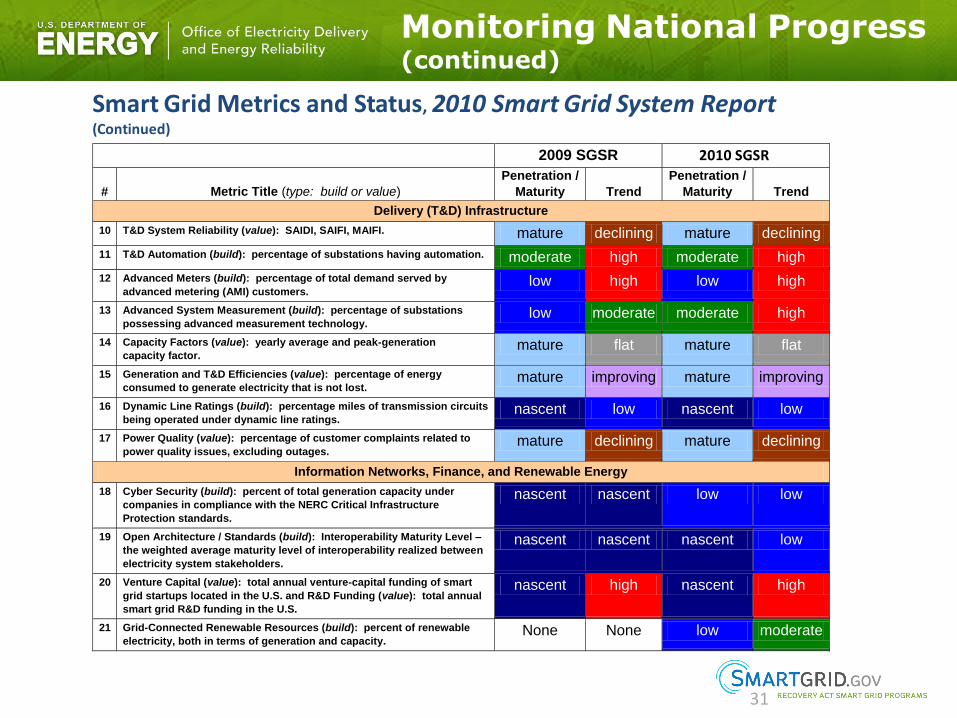
Monitoring National Progress (continued)
31
Smart Grid Metrics and Status, 2010 Smart Grid System Report (Continued)
2009 SGSR 2011 SGSR
# Metric Title (type: build or value)
Penetration /
Maturity Trend
Penetration /
Maturity Trend
Delivery (T&D) Infrastructure
10 T&D System Reliability (value): SAIDI, SAIFI, MAIFI. mature declining mature declining
11 T&D Automation (build): percentage of substations having automation. moderate high moderate high
12 Advanced Meters (build): percentage of total demand served by
advanced metering (AMI) customers. low high low high
13 Advanced System Measurement (build): percentage of substations
possessing advanced measurement technology. low moderate moderate high
14 Capacity Factors (value): yearly average and peak-generation
capacity factor. mature flat mature flat
15 Generation and T&D Efficiencies (value): percentage of energy
consumed to generate electricity that is not lost. mature improving mature improving
16 Dynamic Line Ratings (build): percentage miles of transmission circuits
being operated under dynamic line ratings. nascent low nascent low
17 Power Quality (value): percentage of customer complaints related to
power quality issues, excluding outages. mature declining mature declining
Information Networks, Finance, and Renewable Energy
18 Cyber Security (build): percent of total generation capacity under
companies in compliance with the NERC Critical Infrastructure
Protection standards.
nascent nascent low low
19 Open Architecture / Standards (build): Interoperability Maturity Level –
the weighted average maturity level of interoperability realized between
electricity system stakeholders.
nascent nascent nascent low
20 Venture Capital (value): total annual venture-capital funding of smart
grid startups located in the U.S. and R&D Funding (value): total annual
smart grid R&D funding in the U.S.
nascent high nascent high
21 Grid-Connected Renewable Resources (build): percent of renewable
electricity, both in terms of generation and capacity. None None low moderate
2010 SGSR
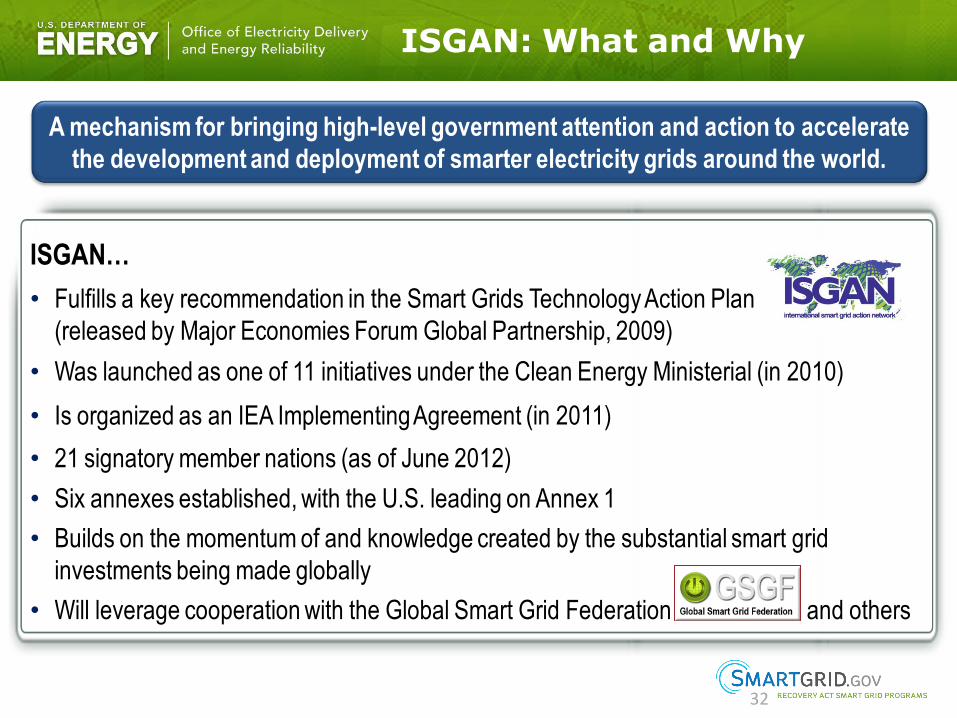
ISGAN: What and Why
32
32 February 24, 2012
ISGAN…
• Fulfills a key recommendation in the Smart Grids Technology Action Plan
(released by Major Economies Forum Global Partnership, 2009)
• Was launched as one of 11 initiatives under the Clean Energy Ministerial (in 2010)
• Is organized as an IEA Implementing Agreement (in 2011)
• 21 signatory member nations (as of June 2012)
• Six annexes established, with the U.S. leading on Annex 1
• Builds on the momentum of and knowledge created by the substantial smart grid
investments being made globally
• Will leverage cooperation with the Global Smart Grid Federation and others
A mechanism for bringing high-level government attention and action to accelerate
the development and deployment of smarter electricity grids around the world.
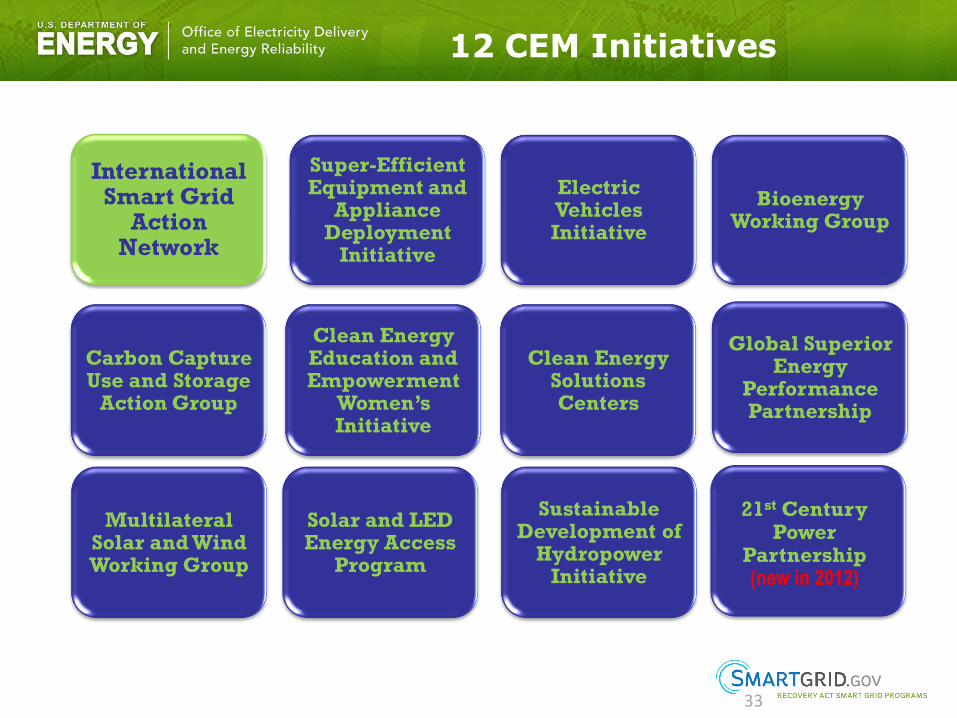
33
12 CEM Initiatives
International Smart Grid
Action Network
Super-Efficient Equipment and
Appliance Deployment
Initiative
Electric Vehicles Initiative
Bioenergy Working Group
Carbon Capture Use and Storage
Action Group
Clean Energy Education and Empowerment
Women’s Initiative
Clean Energy Solutions Centers
Global Superior Energy
Performance Partnership
Multilateral Solar and Wind Working Group
Solar and LED Energy Access
Program
Sustainable Development of
Hydropower Initiative
21st Century Power
Partnership (new in 2012)
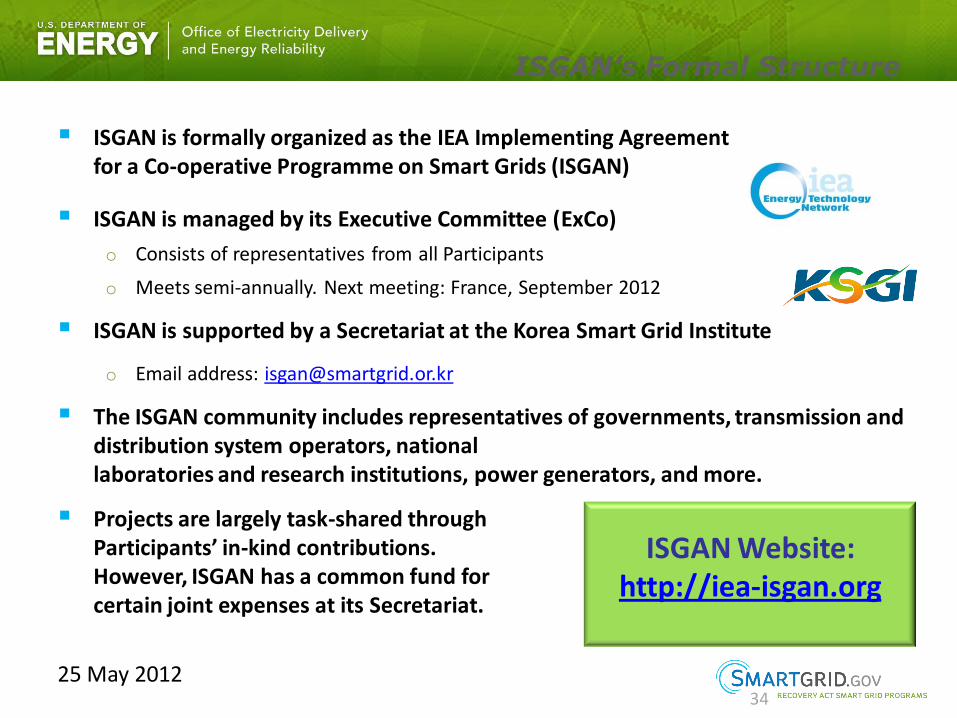
ISGAN’s Formal Structure
ISGAN is formally organized as the IEA Implementing Agreement for a Co-operative Programme on Smart Grids (ISGAN)
ISGAN is managed by its Executive Committee (ExCo)
o Consists of representatives from all Participants
o Meets semi-annually. Next meeting: France, September 2012
ISGAN is supported by a Secretariat at the Korea Smart Grid Institute
o Email address: [email protected]
The ISGAN community includes representatives of governments, transmission and distribution system operators, national laboratories and research institutions, power generators, and more.
Projects are largely task-shared through Participants’ in-kind contributions. However, ISGAN has a common fund for certain joint expenses at its Secretariat.
25 May 2012
34
ISGAN Website: http://iea-isgan.org
35
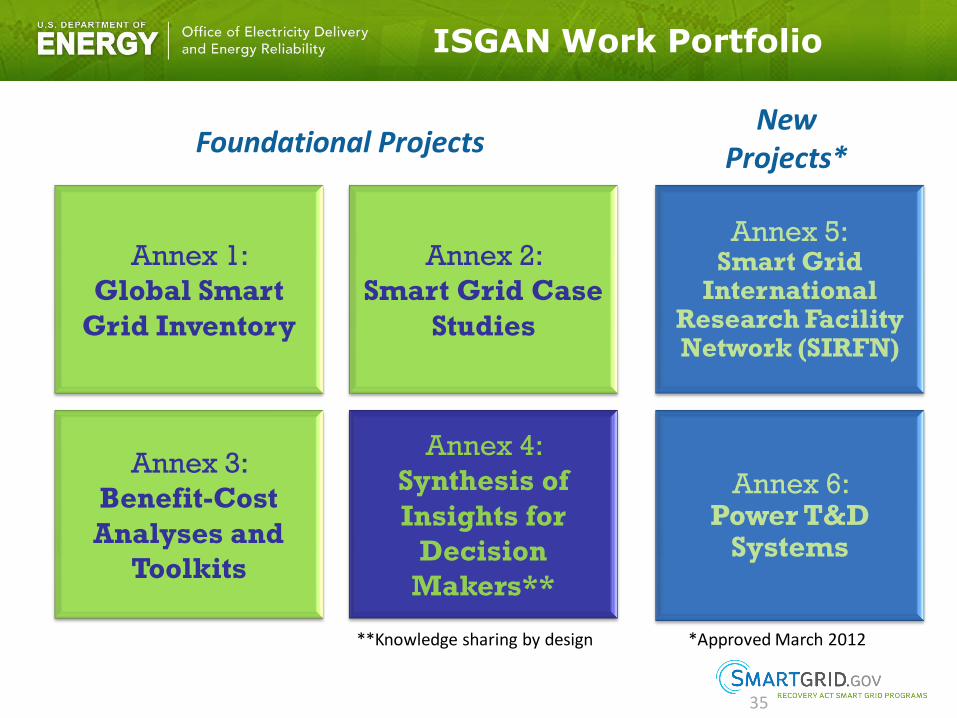
ISGAN Work Portfolio
Annex 5: Smart Grid
International Research Facility Network (SIRFN)
Annex 6: Power T&D
Systems
Foundational Projects New
Projects*
Annex 4:
Synthesis of
Insights for
Decision
Makers**
Annex 2:
Smart Grid Case
Studies
Annex 3:
Benefit-Cost
Analyses and
Toolkits
Annex 1:
Global Smart
Grid Inventory
**Knowledge sharing by design *Approved March 2012
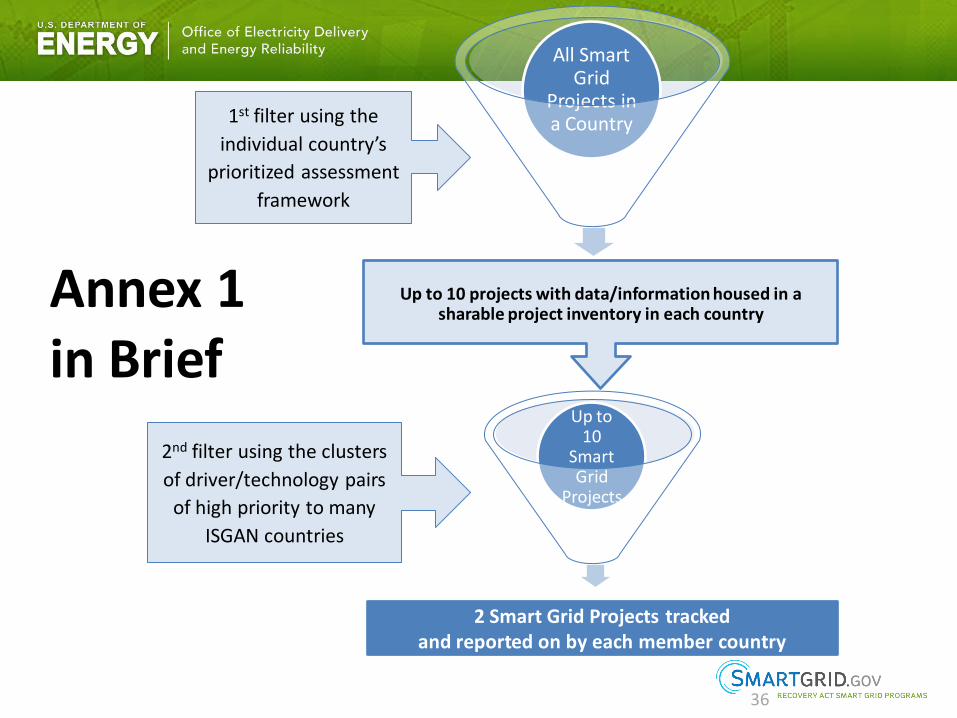
2 Smart Grid Projects tracked and reported on by each member country
Up to 10 projects with data/information housed in a sharable project inventory in each country
All Smart Grid
Projects in a Country 1st filter using the
individual country’s
prioritized assessment
framework
Annex 1 in Brief
Up to 10
Smart Grid
Projects
2nd filter using the clusters
of driver/technology pairs
of high priority to many
ISGAN countries
36
37
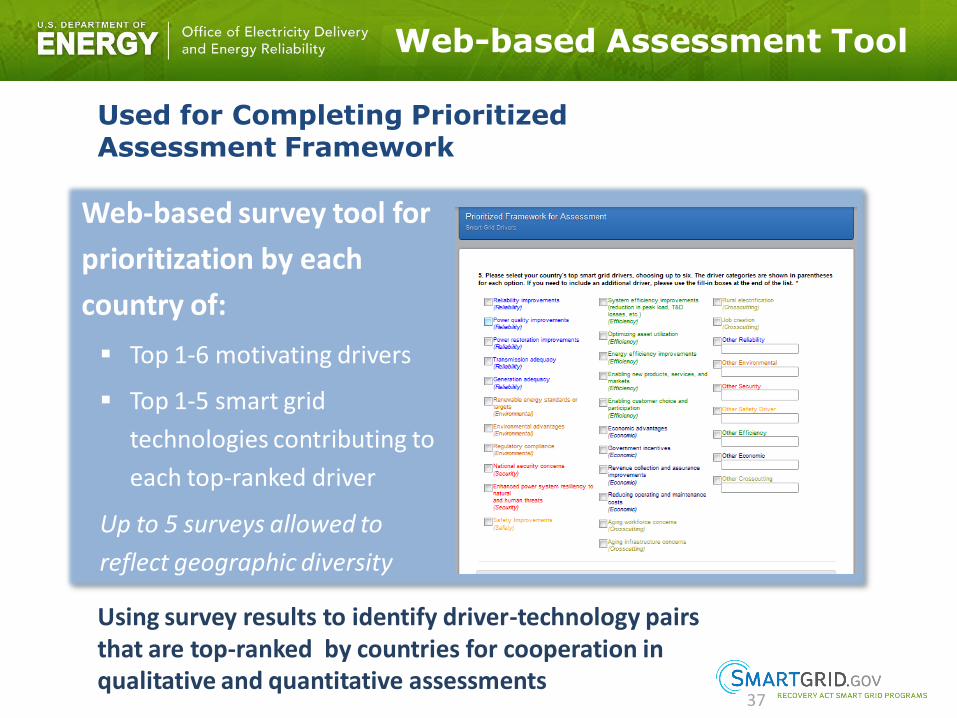
Web-based Assessment Tool
Web-based survey tool for
prioritization by each
country of:
Top 1-6 motivating drivers
Top 1-5 smart grid
technologies contributing to
each top-ranked driver
Up to 5 surveys allowed to
reflect geographic diversity
Using survey results to identify driver-technology pairs that are top-ranked by countries for cooperation in qualitative and quantitative assessments
Used for Completing Prioritized Assessment Framework
38
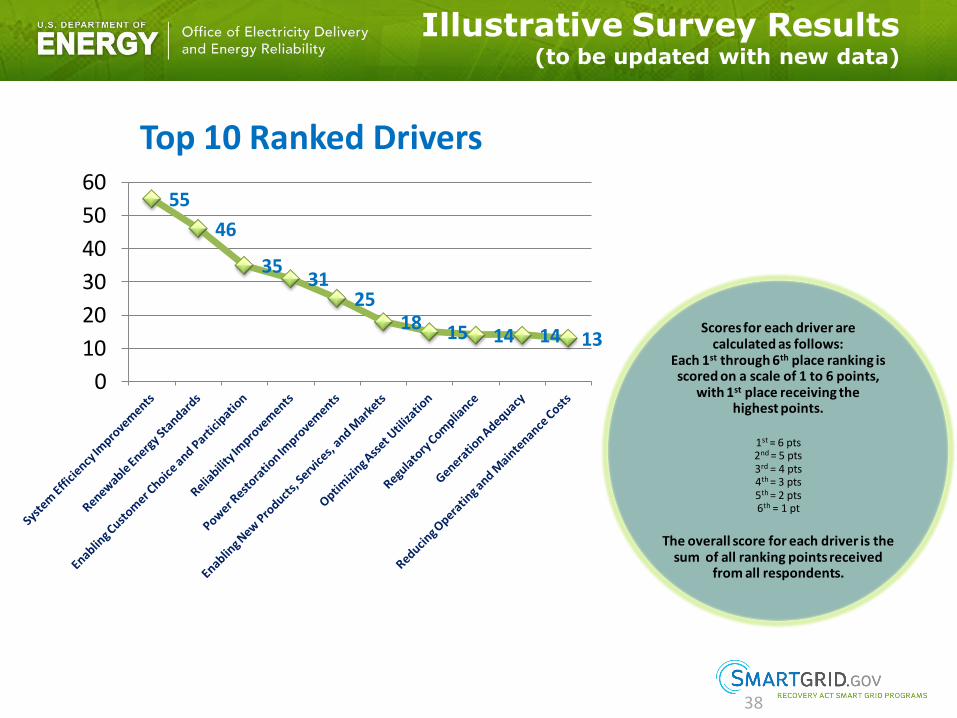
Illustrative Survey Results (to be updated with new data)
Scores for each driver are calculated as follows:
Each 1st through 6th place ranking is scored on a scale of 1 to 6 points,
with 1st place receiving the highest points.
1st = 6 pts 2nd = 5 pts 3rd = 4 pts 4th = 3 pts 5th = 2 pts 6th = 1 pt
The overall score for each driver is the sum of all ranking points received
from all respondents.
55
46
35 31
25 18 15 14 14 13
0
10
20
30
40
50
60
Top 10 Ranked Drivers
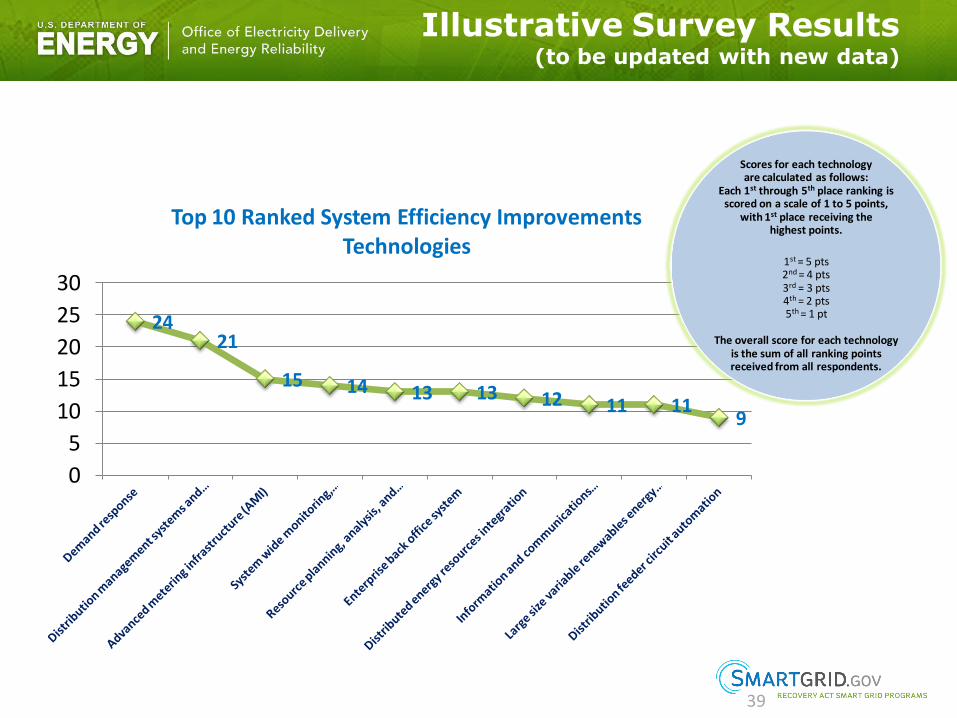
24 21
15 14 13 13 12 11 11 9
0
5
10
15
20
25
30
Top 10 Ranked System Efficiency Improvements Technologies
39
Scores for each technology are calculated as follows:
Each 1st through 5th place ranking is scored on a scale of 1 to 5 points,
with 1st place receiving the highest points.
1st = 5 pts 2nd = 4 pts 3rd = 3 pts 4th = 2 pts 5th = 1 pt
The overall score for each technology
is the sum of all ranking points received from all respondents.
Illustrative Survey Results (to be updated with new data)
40
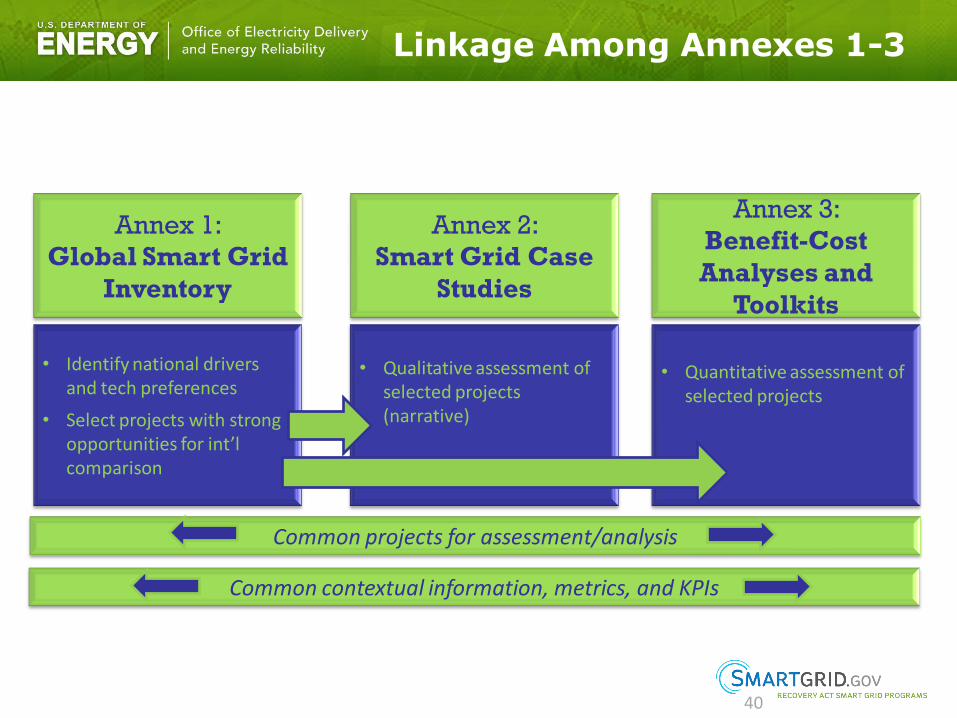
Linkage Among Annexes 1-3
Annex 2:
Smart Grid Case
Studies
Annex 3:
Benefit-Cost
Analyses and
Toolkits
Annex 1:
Global Smart Grid
Inventory
Common projects for assessment/analysis
• Identify national drivers and tech preferences
• Select projects with strong opportunities for int’l comparison
• Qualitative assessment of selected projects (narrative)
• Quantitative assessment of selected projects
Common contextual information, metrics, and KPIs
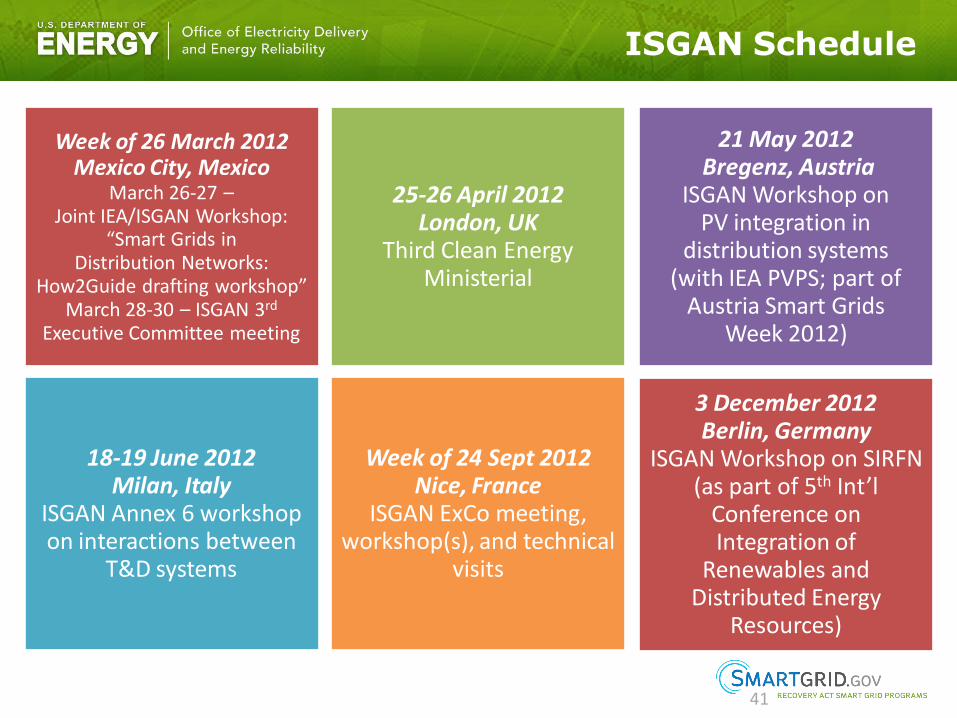
ISGAN Schedule
Week of 26 March 2012 Mexico City, Mexico
March 26-27 – Joint IEA/ISGAN Workshop:
“Smart Grids in Distribution Networks:
How2Guide drafting workshop” March 28-30 – ISGAN 3rd
Executive Committee meeting
25-26 April 2012 London, UK
Third Clean Energy Ministerial
21 May 2012 Bregenz, Austria
ISGAN Workshop on PV integration in
distribution systems (with IEA PVPS; part of
Austria Smart Grids Week 2012)
18-19 June 2012 Milan, Italy
ISGAN Annex 6 workshop on interactions between
T&D systems
Week of 24 Sept 2012 Nice, France
ISGAN ExCo meeting, workshop(s), and technical
visits
3 December 2012 Berlin, Germany
ISGAN Workshop on SIRFN (as part of 5th Int’l
Conference on Integration of
Renewables and Distributed Energy
Resources)
41
Contact Information
Eric M. Lightner Director, Smart Grid Task Force Office of Electricity Delivery and Energy Reliability U.S. Department of Energy (202) 586-8130 [email protected] For more Smart Grid information:
OE: www.oe.energy.gov
Smart Grid: www.smartgrid.gov
Smart Grid Task Force: www.smartgrid.gov/federal_initiatives/federal_smart_grid_task_force
42