smart grid 2030 vision - urban energy support · south african national energy development...
TRANSCRIPT

South African National Energy Development Institute
2013/05/30
1
Smart grid 2030 Vision
March 2013
Version 0.6 (second draft)
South African National Energy Development Institute
2013/05/30
2
This national smart grid Vision forms part of a set of working documents developed by the South African Smart Grid Initiative (SASGI) policy workgroup to create a national framework and to guide the national approach to smart grid implementation in South Africa.
South African National Energy Development Institute
2013/05/30
3
Foreword Adequate electricity availability is a fundamental requirement for supporting South Africa’s economic growth and development targets. South Africa’s electricity infrastructure countrywide is urgently in need of renewal and extension, to meet growing electricity demand while integrating new, sustainable energy options. This presents significant industry challenges, but also opportunities for modernisation and new development.
Appropriate national grid development solutions, with a balanced leveraging of proven and new technologies, are an important part of the response to these challenges. An electricity network with greater intelligence will facilitate the integration of renewable energy, supporting national energy objectives and the transition towards a low-carbon economy. The development and application of smart grid solutions will enable the electricity network to bring considerable other benefits to customers through improved quality of power supply, more accurate billing and better energy consumption management and has the real potential to be a source of employment and economic wealth. .
This Smart Grid 2030 Vision articulates the long-term aspirations and development objectives for the electricity supply industry in South Africa. This Vision does not define a final result but rather an accelerated journey with progress and goals towards continuously achieving the benefits of a smart grid as defined now and with any changes the future may bring.
The objective of the Vision is to bring together all parties involved in smart grids to collaborate towards a focussed, integrated, optimal smart grid journey for the country. The Vision also aims to provide insight and inspiration to all industry participants so that they may join or support this journey. Attainment of the Smart Grid 2030 Vision depends on the serious commitment of each and every stakeholder. In this regard, Government solicits the fullest and unwavering support of everyone, so that together we achieve a successful transition that will support South Africa on its path towards excellence.
It is intended that this document be kept alive and will be reviewed after the pilot studies are complete but hereafter it will be reviewed as and when required by the industry.
_____________________________________ Ms Nelisiwe Magubane Director General South Africa Department of Energy

South African National Energy Development Institute
2013/05/30
4
Official sign-off
It is hereby certified that the smart grid 2030 Vision:
was developed by SASGI under the guidance of the Department of Energy and SANEDI.
takes into account all the relevant policies, legislation and any other indications of the national direction for the energy sector.
Minnesh Bipath Signature: _____________________________________ SANEDI
Thabang Audat Signature: _____________________________________ Department of Energy Chairperson of SASGI
South African National Energy Development Institute
2013/05/30
5
Table of Contents 1 Executive Summary ................................................................................................................................................... 10
2 Vision Purpose .......................................................................................................................................................... 11
3 Background and context to the Vision ...................................................................................................................... 12
3.1 South Africa ESI .................................................................................................................................................. 12
3.2 Smart grid........................................................................................................................................................... 13
3.3 Policy Context .................................................................................................................................................... 15
3.4 Relevance to South Africa .................................................................................................................................. 16
4 Scope of the smart grid Vision .................................................................................................................................. 20
5 Smart grid objectives, costs and benefits ................................................................................................................. 22
5.1 Objectives .......................................................................................................................................................... 22
5.2 Costs and Benefits .............................................................................................................................................. 22
6 Key success factors ................................................................................................................................................... 26
7 Performance ............................................................................................................................................................. 26
8 Principle characteristics ............................................................................................................................................ 27
9 Key technology applications ..................................................................................................................................... 29
9.1 Customer Enablement (CE) ................................................................................................................................ 33
9.2 Advanced Distribution Operations (ADO) .......................................................................................................... 34
9.3 Advanced Transmission Operations (ATO) ........................................................................................................ 35
9.4 Advanced Asset Management (AAM) ................................................................................................................ 35
10 Metrics .................................................................................................................................................................... 35
11 Appendix A: Bibliography ....................................................................................................................................... 37
12 Appendix B: Industry overview ............................................................................................................................... 38
12.1 Transmission AND GENERATION System ......................................................................................................... 38
12.2 Distribution System .......................................................................................................................................... 39
13 Appendix C: Policy context ..................................................................................................................................... 41
14 Appendix D: Interpreting technology hype ............................................................................................................. 44
15 Appendix E: Metrics ................................................................................................................................................ 45
16 Appendix F: Case studies ........................................................................................................................................ 46
16.1 Italy - Focus on service delivery and cost reductions ....................................................................................... 46
16.2 San Diego, USA – Comprehensive smart grid implementation ........................................................................ 46
16.3 California, USA – Focus on security of supply and cost saving......................................................................... 47

South African National Energy Development Institute
2013/05/30
6
Table of Figures Figure 1 Comprehensive Framework to guide the Smart Grid implementation in South Africa .................................... 11
Figure 2 Vision development approach .......................................................................................................................... 12
Figure 3 Historic energy system (conceptual) ................................................................................................................. 13
Figure 4 Transformed energy system (conceptual) ........................................................................................................ 13
Figure 5 Smart grid Gartner Hype Cycle (2011) .............................................................................................................. 15
Figure 6 Smart grid as an enabler to address industry challenges ................................................................................. 19
Figure 7A systems view of the smart grid ........................................................................................................................ 21
Figure 8 A smart grid value contribution ........................................................................................................................ 22
Figure 9Envisaged smart grid initiatives and interfaces for South Africa ........................................................................ 30
Figure 10 Illustrating the correlation between applications and key success factors .................................................... 31
Figure 11 Correlating the prioritised applications with the four functional areas ......................................................... 31
Figure 12 Indicative smart grid sequencing roadmap..................................................................................................... 32
Figure 13 Accumulation of benefits (conceptual) as smart grid components are incorporated .................................... 33
Figure 14: Comprehensive view of smart grid applications in each functional area ....................................................... 33
Table of Tables Table 1 Drivers for change and relevance of the smart grid to South Africa ................................................................... 16
Table 2 Smart grid response to industry challenges ........................................................................................................ 18
Table 3 Costs and benefits to Power Generators ........................................................................................................... 23
Table 4 Costs and benefits to Utilities ............................................................................................................................ 23
Table 5 Costs and benefits to Customers ....................................................................................................................... 24
Table 6 Costs and benefits to Society .............................................................................................................................. 25
Table 7 Key success factors for the smart grid ................................................................................................................ 26
Table 8 Performance requirements for the smart grid ................................................................................................... 26
Table 9 Principle characteristics of the smart grid .......................................................................................................... 27
Table 10 Comparison of the existing and envisaged grid in terms of principle characteristics ....................................... 28
Table 11 Correlation between smart grid principle characteristics and functional areas. .............................................. 31
Table 12 Metrics and proposed targets by 2030 to be defined ...................................................................................... Error!
Bookmark not defined.

South African National Energy Development Institute
2013/05/30
7

South African National Energy Development Institute
2013/05/30
8
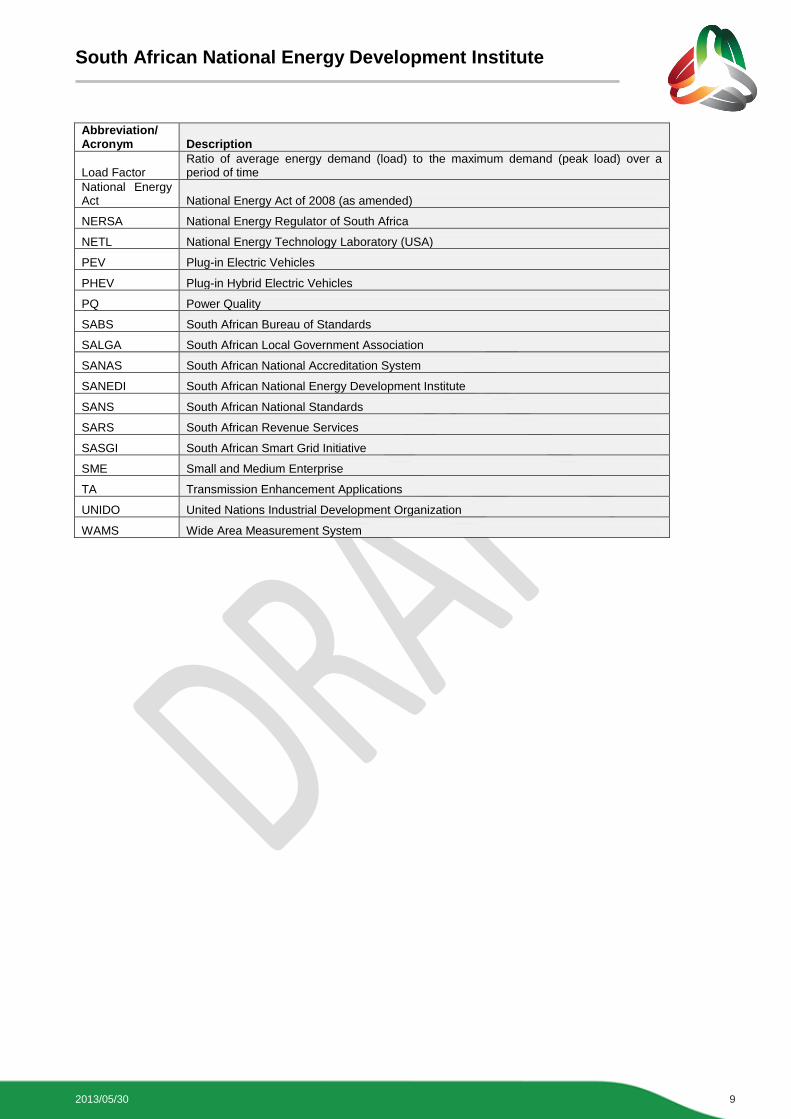
Abbreviations, acronyms and definitions
A list of abbreviations, acronyms and definitions used within the vision document are set out in the table below.
Abbreviation/ Acronym Description
AAM Advanced Asset Management
ADAM Approach to Distribution Asset Management
ADO Advanced Distribution Operation
AMI Advanced Metering Infrastructure
AO Asset System Operation
ATO Advanced Transmission Operation
CE Customer Enablement
CC Climate Change
CSM Customer Side Systems
CV Conventional Vehicles
DEA Department of Environmental Affairs
DER Distributed Energy Resources
Department Department of Energy (also referred to as the ‘DOE’)
DMS Distribution Management System / Distribution Automation
DPW Department of Public Works (also referred to as ‘NDPW’)
DR Demand Response
DSM Demand Side Management
DST Department of Science and Technology
DTI Department of Trade and Industry (also referred to as ‘the dti’)
DOT Department of Transport
EDI Electricity Distribution Industry
EE Energy Efficiency or Energy Efficient (as the context dictates)
Eskom Eskom Holdings Limited
ESI Electricity Supply Industry
FACTS Flexible AC Transmission
GDP Gross Domestic Product
GHG Greenhouse Gas
GIS Geographic Information System
Government The South African Government
HAN Home Area Network
HVDC High Capacity High Voltage
ICT Information and Communications Technology Integration
IED Intelligent Electronic Devices
IEP Integrated Energy Plan
IPAP 2007/2008 Industrial Policy Action Plan
IPAP 2 2010/2011 to 2012/2013 Industrial Policy Action Plan
IPP Independent Power Producer(s)
IRP2 Integrated Resource Plan 2010, published in 2011
South African National Energy Development Institute
2013/05/30
9
Abbreviation/ Acronym Description
Load Factor Ratio of average energy demand (load) to the maximum demand (peak load) over a period of time
National Energy Act National Energy Act of 2008 (as amended)
NERSA National Energy Regulator of South Africa
NETL National Energy Technology Laboratory (USA)
PEV Plug-in Electric Vehicles
PHEV Plug-in Hybrid Electric Vehicles
PQ Power Quality
SABS South African Bureau of Standards
SALGA South African Local Government Association
SANAS South African National Accreditation System
SANEDI South African National Energy Development Institute
SANS South African National Standards
SARS South African Revenue Services
SASGI South African Smart Grid Initiative
SME Small and Medium Enterprise
TA Transmission Enhancement Applications
UNIDO United Nations Industrial Development Organization
WAMS Wide Area Measurement System

South African National Energy Development Institute
2013/05/30
10
1 Executive Summary
South Africa’s electricity network has provided vital links between electricity producers and customers for many decades. Historically, these networks and infrastructure were developed to support the large, predominantly carbon-based generation sources that were congregated around the coal resources in the country.
South Africa is now facing increasing economic challenges combined with a changing electricity landscape. The national drive for lower-carbon generation options (including renewable energy and distributed generation), combined with greatly improved efficiency on the demand side, necessitates more sophisticated and intelligent network capabilities.
Pressures to invest in the renewal and expansion of aging electricity infrastructure across the country are mounting if South Africa is to ensure an acceptable quality of life for all South Africans and economic activity and future growth can be supported.
With these challenges comes an opportunity to incorporate greater intelligence and automation into the network that can optimally support the electricity requirements of the country.
The Vision forms part of a greater framework that is being developed by the South Africa Smart Grid Initiative to guide effective transition to a coherent, modernised national electricity infrastructure.
The purpose of the Vision is to define a common, national blueprint or aspiration for the smart grid before industry stakeholders and participants embark on an investment programme of this magnitude and complexity. The Vision is intentionally ambitious and aspirational to provide a common vision of the smart grid that will be realised over time, but will serve to align efforts across industry. It should also serve to align national efforts across all related activities including skills and capacity building, technology development and localisation of industries where relevant.
The Vision considers the objectives of the smart grid and the contribution it is expected to make to the respective stakeholder groups with the aim of identifying the priority interventions and characteristics of the smart grid.
The Vision also describes the smart grid and the expectations thereof in terms of key success factors, performance requirements, principle characteristics and the key applications identified to deliver on these.
Metrics and targets are furthermore suggested as a framework against which to monitor the transformation of the national electricity infrastructure into the envisaged smart grid and to gauge the value of the resulting contribution to the country.

South African National Energy Development Institute
2013/05/30
11
Part A: Context
2 Vision Purpose
South Africa’s electricity supply industry stands at the threshold of critical transformation. This moment presents an opportunity for innovation to improve service delivery and to enhance the industry sustainability. However, it also requires important decisions to be made for the optimal deployment of available resources that will provide the best platform for the economic and technological needs of the country – now and into the foreseeable future.
The purpose of the Vision is to describe the aspirational future state of the ESI in South Africa.
The Vision defines, through a process of careful consideration and consultation, a common picture of a smart grid that is relevant to South Africa and the challenges the industry faces. Having an agreed definition or collective understanding of the smart grid Vision in South Africa is imperative for alignment of effort and integration into a coherent national system. A clear vision will enable numerous role players and stakeholders involved in multiple solutions and applications over an extended period of implementation to be “pulling in the same direction”.
The aim is to balance practical realism with a suitably ambitious and aspirational Vision so that the economy and society can reap optimum benefit from the significant infrastructure investments that will necessarily be made in the immediate future.
In describing this vision it is recognised that the electricity industry is dynamic and that a level of “grid smartness” exists and is currently being pursued/implemented. It is furthermore recognised that energy supports and leads economic development and should be responsive to the ever-increasing complexity of power supply and consumption requirements. The Vision may therefore continue to evolve in time, but is intended to describe, as best possible with current information, what the aspirations are amidst the changing landscape.
The Vision forms part of a comprehensive framework that is being created for a smart grid in South Africa as illustrated in Figure 1. In addition to the Vision (1), the framework will consist of an “as is” analysis (2) of the industry status at present; a gap analysis (3) to identify the variance between the current status and the defined Vision; a strategy and roadmap (4) broadly suggesting the approach for achieving the ideal national position as described by the smart grid Vision; supported by a business case or value proposition (5) for establishing a national smart grid. The business case, combined with pilot findings and lessons learned, will inform clear direction on the required and prioritised functionalities (6) and implementation guidelines (7) to aid role players and stakeholders with appropriate technology’ system selection and implementation where required.
Figure 1 Comprehensive Framework to guide the Smart Grid implementation in South Africa
The development of the Vision will follow a consultative and inclusive approach to accomplish the necessary paradigm shift amongst all stakeholders (refer Figure 2 below). Consultation is inevitably an iterative process that requires time, but brings about a collective understanding, stakeholder alignment and the motivation for change amongst the relevant role players. The SASGI workgroup provides the platform for the process to develop the Vision and, subsequently, also

South African National Energy Development Institute
2013/05/30
12
other critical aspects of the smart grid framework (e.g. the business case and roadmap).: Implementation experience and performance feedback from the industry will continually serve to refine the implementation approach, again following an iterative process to develop the most appropriate guidelines for South Africa.
While the strategy and roadmap will follow from the Vision, the Vision does assume that the implementation of smart grid applications can be approached in a modular way i.e. any role player has the freedom to prioritise the implementation of an aspect of the smart grid to suit specific leverage opportunities or areas of constraint or need. This suggests that while the national vision, strategy and roadmap will provide the overall direction, the respective utilities in the industry could start their specific journey at any point within the context of the vision that will create the greatest immediate benefit for them. Implementation of the full, envisaged scope and realisation of the full benefits of the smart grid may therefore be achieved over an extended, but non-prescribed, timeframe. The approach adopted must also be seen in the broader context of the structure of the electricity supply industry in South Africa. The industry currently consists of a dominant player who incorporates a vertically integrated business (Generation, Transmission, Distribution and Retail) and numerous autonomous bundled distribution utilities.
An analogy used by NETL for this ‘systems approach’ is that of a catalogue versus a novel. A catalogue can be constructed by collating many technology data sheets
and arranging them in some order, such as alphabetic. A catalogue may present valuable content, but no clear direction.
A novel is approached with an overall vision, followed by a storyline onto which the components and building blocks of the novel (characters, plots, chapters, and narrative) are built and integrated in a way that supports the vision and goals that were defined in order to deliver a coherent, meaningful story.
It is proposed that the South African grid should be advanced in a similar fashion; not by gathering a collection of interesting technologies and calling it modern, or smart, or intelligent, but by first defining a vision and then building the construct of a grid that serves a defined purpose. The Vision will hold up a view of the smart grid against which future decisions can be checked in terms of whether it “works” and whether it “fits” with the Vision and will allow progress against the Vision to be gauged along the long and arduous journey to realization.
Meaning of figure 2. What it is trying to tell you. Steps to building the case. Introducing change. Explain colouring.
This means that the Vision may be ambitious without compromising on critical requirements because of resource constraints. But, it also emphasises the need for the Vision to give clear direction that will ensure that disconnected, independent implementation of applications are aligned and can be integrated into the national network / system.
3 Background and context to the Vision
3.1 SOUTH AFRICA ESI
The bulk of the South African electricity supply (generation, transmission and distribution) infrastructure was designed several decades ago in a vastly different political, societal and technology context, to respond to relatively ‘simplistic’ supply needs (conceptually illustrated in Figure 3). The same, aging, infrastructure is now struggling to support rapidly growing and changing ‘21
st century’ network requirements (refer Appendix B for additional background to the South
African Transmission and Distribution grids).
Figure 2 Vision development approach

South African National Energy Development Institute
2013/05/30
13
The ESI stands at a critical juncture requiring urgent and significant infrastructure investment to maintain security and quality of supply, to respond to growing supply needs and to new challenges. Perhaps the biggest challenge will be of finding the right economic and environmental balance between these imperatives:
- Changing and more demanding customer expectations,
- Secure supply of electricity now and in the future,
- Diversified (and distributed) energy mix with a cleaner, more sustainable supply, and
- Affordable infrastructure capable of supporting economic growth and rapid technology advancements.
The transformation required of the ESI to support this evolving landscape can be illustrated as in Figure 4, in the growing complexity of the existing and anticipated demands on the energy system.
Figure 3 Historic energy system (conceptual) Figure 4 Transformed energy system (conceptual)1
While the challenge of responding to the changing energy system requirements is not unique to South Africa, South Africa is in a favourable position where this coincides with the need for infrastructure investments to maintain a stable platform for current and growing economic activity.
Smart grids are an essential part of these inevitable industry changes (e.g. replacement of aging infrastructure, clean energy, securing supply, introduction of electric vehicles and distributed generation), in addition to the other many challenges and doing so while managing escalating energy costs.
Furthermore, being in a position as an industry to give consideration to the most appropriate, collective approach prior to making an investment of this magnitude presents a defining opportunity to leverage global and local knowledge, experience and technology for the most appropriate, integrated solutions before embarking on this journey.
Aligning on this Vision may further present opportunities for leveraging economies of scale, localisation and the exchange of best practice.
3.2 SMART GRID
The concept of the smart grid has been around for many years, has evolved significantly over time and covers a broad spectrum of technologies and functions. The electricity grid related challenges experienced during the last decade in countries such as the USA, Europe, UK, etc. did however significantly accelerate the deployment of smart grid applications. While the drivers might have differed from country to country, the smart grid applications were successfully used to overcome and address their challenges at hand. As a result there are many smart grid definitions and explanations. Some definitions describe the smart grid in terms of function and/or technology capability and/or benefits offered. From all these, a few key elements common to most definitions emerge: communication, integration and automation that are sustainable, economic and secure.
1As presented in Smarter Energy for Smarter Cities, by IBM Global Energy and Utilities Industry
TRADITIONAL
ENERGY VALUE CHAIN
Nuclear
Coal/Natural Gas
Hydroelectric
UTILITY
Consumer
Power Flow
Periodic Information Flow
Continuous Information Flow
TRANSFORMED
ENERGY VALUE CHAIN
Nuclear
Coal/Natural Gas
Hydroelectric
UTILITY
Solar
Energy Storage
Wind
Wind
Solar
Solar Energy Storage
Energy Storage
Plug-in Vehicle
Wind

South African National Energy Development Institute
2013/05/30
14
A definition that SASGI has incorporated into the smart grid framework documentation:
The European Technology Platform Smart Grid (ETPSG) defines the smart grid as follows:
A Smart Grid is an electricity network that can intelligently integrate the actions of all users connected to it – generators, consumers and those that do both – in order to efficiently deliver sustainable, economic and secure
electricity supplies. Based on ETPSG definition, Smart Grid employs innovative products and services together with intelligent monitoring, control, communication, and self-healing technologies to:
Better facilitate and manage the connection and operation of all sources of energy.
Give consumers more choice so they can help to optimise energy use;
Provide consumers with greater information and choice of supply;
Significantly reduce the environmental impact of the whole electricity supply system;
Deliver enhanced levels of reliability and security of supply. Smart Grids deployment must include not only technology, market and commercial considerations, environmental impact, regulatory framework, standardization usage, ICT (Information & Communication Technology) and migration strategy but also societal requirements and governmental edicts. As a concept the smart grid is intuitive and elegant and an obvious progression for the electricity grid to increased automation, improved performance, improved efficiency, and integration of more applications. But, as with most large movements of technology change, the development phases of the initial, emerging smart grid technologies were not without growing pains and hard lessons learned. However, by 2011 the Gartner Hype Cycle (Figure 5) for smart grid technologies showed most related technologies had advanced far towards widespread adoption.
“After a new technology becomes available (trigger), the visibility of the new technology rises fast until it reached a maximum. At this point everybody is talking
about the new technology, and expectations are unrealistic high (inflated). As a result, people become disappointed when the technology cannot deliver to its
expectations, and it then starts to slide away into the so-called “through of disillusionment.” Now in principle two things can happen. After some time, there is a revival of the new technology—somewhat adapted and better fitted for its purpose, with somewhat reduced expectations compared to the initial ones—or the new
technology disappears from the scene. After the new technology climbs out of the through, widespread adaptation is achieved at the plateau of productivity.”2
2Smart Grid technology and the Gartner hype cycle, http://smartgridsherpa.com/blog/smart-grid-technology-and-the-gartner-hype-cycle, Peter Vaessen, principal consultant, DNV KEMA Energy & Sustainability. Paul Yang 2012, Presentation delivered at the Global Power and Utility 2012 conference, Gartner

South African National Energy Development Institute
2013/05/30
15
Figure 5 Smart grid Gartner Hype Cycle (2011)
Until recently South Africa has mostly lagged the world in the adoption of smart grid technologies. As a result of this lag, South Africa now has the opportunity, at a convenient time in our investment cycle, to leapfrog several technology development cycles and lessons learnt by the front-runners in implementation. From this vantage position the focus should be on capitalising on the improved global understanding of smart grid and to adopt applicable best practices to realising full and relevant benefits for South Africa.
3.3 POLICY CONTEXT
In South Africa, the electricity sector has become the focus of heightened policy interest in the context of escalating concerns over carbon emissions, security of supply, energy demand and economic growth. The most pertinent policies and regulations are highlighted to demonstrate the importance of a capable electrical infrastructure and the context to which a smart grid would significantly contribute (refer Appendix C for a more comprehensive list).
The National Energy Act, 2008 (No. 34 of 2008) sets out specific goals with respect to energy security and security of supply:
Ensure uninterrupted supply of energy to the country
Promote diversity of supply and energy resources
Facilitate effective management of energy demand and its conservation
Promote appropriate standards and specifications for the equipment, systems and processes used for producing, supplying and consuming energy
Ensure collection of data and information relating to energy supply, transportation and demand
Provide for optimal supply, transformation, transportation, storage and demand of energy that are planned, organised and implemented in accordance with a balanced consideration of security of supply, economics, customer protection and a sustainable development
Commercialise energy-related technologies
Ensure effective planning for energy supply, transportation and consumption
Contribute to the sustainable development of South Africa's economy
The Energy Security Master Plan – Electricity (2007- 2025) echoes these goals and provides for a good reference point to evaluate the current performance of the electricity supply industry against the defined Vision expectations. The Master Plan presents the following priorities for South Africa:
Supporting economic growth and development;
Improving the reliability of electricity infrastructure;
Providing a reasonably priced electricity supply;
Ensuring the security of electricity supply as set by a security of supply standard;
Diversifying the primary energy sources of electricity;
Meeting the renewable energy targets as set in the EWP;
Increasing access to affordable energy services;
Reducing energy usage through energy efficiency interventions;
Accelerating household universal access to electricity;
Clarifying some of the policy issues in the context of an evolving electricity sector.
The aging and stressed infrastructure of the ESI is challenged to deliver on many of these goals and national priorities. Investment in the grid refurbishment and expansion, and particularly investment in support of a smart grid, will contribute directly to the realisation of the objectives and goals of both the National Energy Act and the Energy Security Master Plan.

South African National Energy Development Institute
2013/05/30
16
The National Climate Change Response Policy White Paper (Department of Environmental Affairs, 2011) reaffirms South Africa’s undertaking and international commitments to slow down, and in due course, reduce carbon emissions. To achieve this necessitates a substantial integration of renewable energy into the electricity grid. It is important to note that the distribution grid, which includes all networks/grids operating at the 132kV level and below, will be critical in the realisation of this objective. Without a substantial level of grid intelligence, the renewable energy opportunities cannot be effectively pursued.
Government Regulation (GN) 773, published in terms of section 35 of the Electricity Regulation Act, establishes norms and standards for reticulation services in order to:
Maintain the quality of electricity supply;
Ensure the stability of the electricity network, and;
Minimise electricity load shedding and avoid blackouts
The Regulation includes specific measures for the roll out of smart metering to all customers with a monthly consumption of 1,000 kWh and above and for a “time of use” (TOU) tariff to be applicable to these customers by 1 January 2012. The Regulation is in effect since 2008, but the specified timeframe and details regarding smart grid and TOU tariff implementation as allowed for in the Regulation is under review. This Regulation establishes an important precedent for the introduction of a smart grid in South Africa and clearly demonstrated the national intent to move towards smart grid infrastructure.
During 2008 a comprehensive study was undertaken by EDI Holdings to determine the status of the assets in the electricity distribution industry. The study revealed, among other issues, that there is a significant underinvestment in infrastructure maintenance, refurbishment and strengthening. This was applicable across most of the electricity distribution utilities in South Africa. Furthermore an urgent need was identified in respect of people recruitment and development while there was a glaring absence of business efficiency and the optimal deployment of technology. It is estimated that South Africa will have to invest approximately R35bn (2012) in assets and management tools to address the current infrastructure related backlogs. ADAM was approved in 2012 by Cabinet (National Government) to be introduced as an asset turnaround strategy for the electricity distribution industry. While ADAM is not an end solution, it presents significant opportunities to enhance the performance of the EDI. The introduction of a smart grid Vision embedded in the roll out of ADAM could bring about significant cost savings while it will contribute to a more holistic and integrated solution.
Electricity presents inherent and unique safety risks, requiring stakeholders to prioritise the health and safety of employees and the general public. Smart grids offer the electricity industry opportunities to enhance employee and public health and safety by improving grid safety, providing better network information and reducing exposure time to faulty networks. With due consideration to training and change management, a smart grid will facilitate compliance with the requirements Occupational Health and Safety Act (No. 85 of 1993) and reduce electricity related incidences amongst employees and the public.
A smart grid therefore represents an enormous opportunity to contribute towards and enhance delivery on these policy objectives and national initiatives.
3.4 RELEVANCE TO SOUTH AFRICA
South Africa’s electricity industry is facing significant structural changes (refer the shift illustrated in Figure 3 and Figure 4) combined with the urgent need for major improvements to aging and inadequate (as a result of growing demand and increased footprint) infrastructure in the power supply and delivery system. Incorporating a greater intelligence into the new infrastructure presents an opportunity to create an energy system that is economically, socially and environmentally ethical, durable and resilient in the face of on-going global change.
The following specific considerations are driving the change to the electricity infrastructure for South Africa:
Table 1 Drivers for change and relevance of the smart grid to South Africa
Driver Description of the South African context and relevance of the Smart grid
Growing energy demand Even with consumption slowing from the forecasts used to develop the IRP2, electricity demand for South Africa is anticipated to grow exponentially within the next two decades requiring substantial investment in all related infrastructure.
Continued economic growth, changing electricity needs, structural changes in economic activities, increased utilisation of information and communication, electrical and electronic equipment and

South African National Energy Development Institute
2013/05/30
17
Driver Description of the South African context and relevance of the Smart grid
continued electrification are contributing to growing energy consumption and adding to peak demand.
Currently in South Africa, distribution losses amongst municipalities average 14%, almost double the target of 8%3.
Optimal utilisation of the available resources i.e. efficient use of energy, minimisation of losses and integration of distributed generation capacity, amongst others, will form an integral part of a holistic, cost effective solution.
Increased grid intelligence will aid with addressing these challenges.
Capacity expansion and diversified mix
In response to the growing energy demand, South Africa has embarked on a massive generation capacity building programme that will see the electricity supply capacity double within the next decade.
The renewable energy independent power producer procurement programme forms a significant component of the build programme, for the first time introduces significant RE into the South African energy mix and is a key component of the IRP 2. The introduction of RE, IPPs and distributed points of generation will add significantly to the complexity of the power network. The current grid and technology deployed are inadequate to respond effectively to these changing dynamics.
This build programme is associated with high capital investment resulting in a corresponding escalation in energy prices. Unless mitigated through improved efficiency, rampant electricity price increases will in turn negatively impact economic activity and growth.
Energy independence and security
South Africa is largely electricity independent with adequate coal supplies and an abundance of renewable energy resources. But, the country remains subject to fuel (mainly oil) supply challenges and rising / volatile fuel (coal, oil, gas) prices associated with decreasing availability and increasing demands globally.
Optimal utilisation of available resources therefore becomes an ever-growing imperative.
Environment and climate change South Africa’s current energy supply capacity is predominantly centralised and fossil fuel-dependent.
Increasing awareness of and commitments to environmental and sustainability issues, both globally and locally, is changing practices in the power sector. In South Africa this shift is particularly evident in the intensified focus on renewable energy and energy efficiency.
The changing dynamics of dispersed supply and variable resources such as wind and solar will place greater demands on the grid functionality and the traditional methods used for system planning and operations.
Economic growth Power supply is a general purpose technology, which affects the economy directly and/or indirectly through multiple channels. Electricity and energy availability is critical to support the projected economic growth and necessary development in the country4. South Africa remains an energy intensive country where power consumption and GDP is directly related. As the economy grows so the demands on the power system will therefore continue to increase.
The risk of inadequate and unreliable supply to the economy was evident during the severe supply constraints in 2008, when the inability to supply in the electricity needs of the country had an estimated impact of R 50 bn on GDP. Similarly, a 2004 study5 by researchers at the Berkeley National Laboratory found that power interruptions cost the American economy $80 billion per year; other estimates are as high as $150 billion per year.
This emphasises the importance of efficiency, reliability, quality and security of supply.
Policy and Regulation Refer Section 3.2 for the political drivers for improved electricity network infrastructure.
Technology advancement The smart grid constitutes an acceleration of and a coordinated approach to the ‘natural’ trend of automation and technological advancement of electricity supply infrastructure.
The various smart grid technologies have made rapid advancements during the preceding decade and combined with continued innovation, a range of new smart grid products and solutions are available. Smart grid technology will continue to mature and new technologies will enter the market. These technology advancements offer greater capability and choice, but it complicates the selection of appropriate, cost effective solutions from an overwhelming offering (as experienced by the Eskom AMI pilot initiative6)
At the same time, technology developments in other areas (e.g. data centres and electric vehicles) are increasing the demands on the required intelligence of the electricity network.
With respect to technology development, South Africa has by default become an industry follower. This offers the benefits of leap frogging learning curves, but the national position should remain open to identify any opportunities for localisation, customisation or where South Africa can play a technology leader role in the smart grid arena.
3EDI Holdings Ring-fencing Results 2008 to 2010 4 A study of Sub-Saharan Africa published by the University of Southern Denmark in 2012, estimated the annual economic growth drag of a weak power infrastructure to be about 2 percentage points. 5 Kristina Hamachi LaCommare and Joseph H. Eto, Understanding the Cost of Power Interruptions to U.S. Electricity Consumers, Ernest Orlando Lawrence Berkeley National Laboratory, September 2004, e.g., Figure ES-1 among other discussions in the paper: http://certs. lbl.gov/pdf/55718.pdf (September 2010). 6 Challenges and lessons learnt documented for the Eskom AMI pilot initiative.
South African National Energy Development Institute
2013/05/30
18
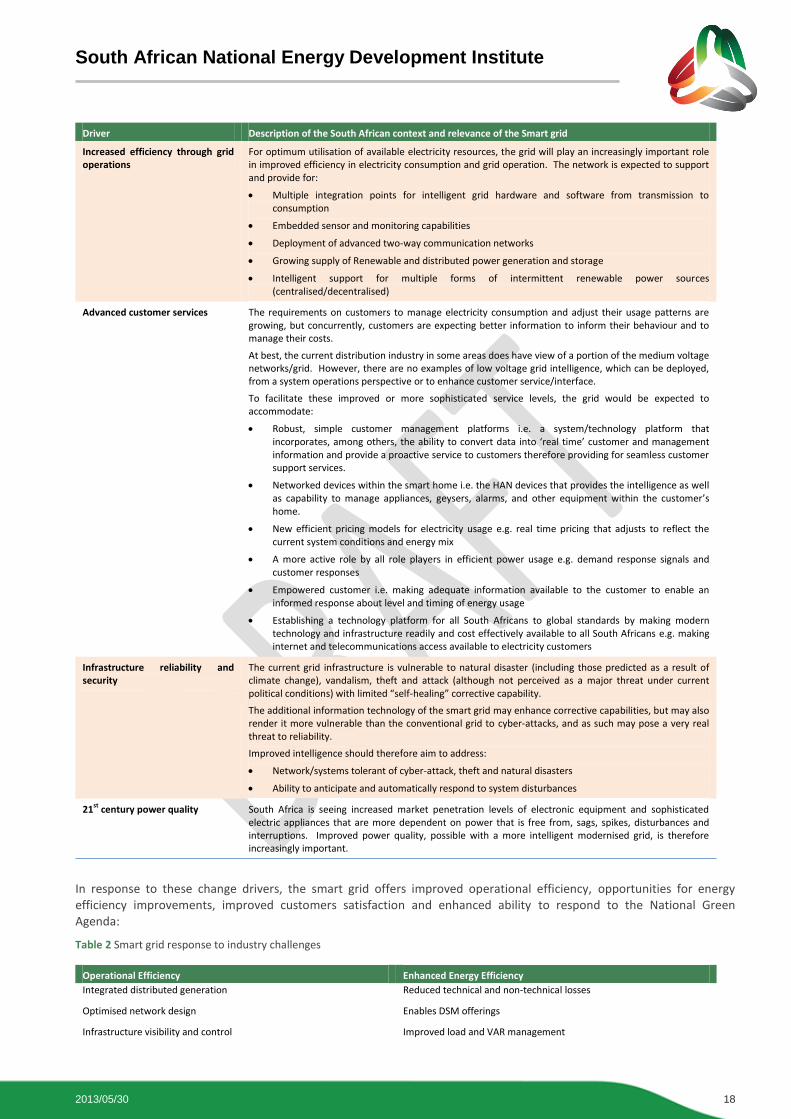
Driver Description of the South African context and relevance of the Smart grid
Increased efficiency through grid operations
For optimum utilisation of available electricity resources, the grid will play an increasingly important role in improved efficiency in electricity consumption and grid operation. The network is expected to support and provide for:
Multiple integration points for intelligent grid hardware and software from transmission to consumption
Embedded sensor and monitoring capabilities
Deployment of advanced two-way communication networks
Growing supply of Renewable and distributed power generation and storage
Intelligent support for multiple forms of intermittent renewable power sources (centralised/decentralised)
Advanced customer services The requirements on customers to manage electricity consumption and adjust their usage patterns are growing, but concurrently, customers are expecting better information to inform their behaviour and to manage their costs.
At best, the current distribution industry in some areas does have view of a portion of the medium voltage networks/grid. However, there are no examples of low voltage grid intelligence, which can be deployed, from a system operations perspective or to enhance customer service/interface.
To facilitate these improved or more sophisticated service levels, the grid would be expected to accommodate:
Robust, simple customer management platforms i.e. a system/technology platform that incorporates, among others, the ability to convert data into ‘real time’ customer and management information and provide a proactive service to customers therefore providing for seamless customer support services.
Networked devices within the smart home i.e. the HAN devices that provides the intelligence as well as capability to manage appliances, geysers, alarms, and other equipment within the customer’s home.
New efficient pricing models for electricity usage e.g. real time pricing that adjusts to reflect the current system conditions and energy mix
A more active role by all role players in efficient power usage e.g. demand response signals and customer responses
Empowered customer i.e. making adequate information available to the customer to enable an informed response about level and timing of energy usage
Establishing a technology platform for all South Africans to global standards by making modern technology and infrastructure readily and cost effectively available to all South Africans e.g. making internet and telecommunications access available to electricity customers
Infrastructure reliability and security
The current grid infrastructure is vulnerable to natural disaster (including those predicted as a result of climate change), vandalism, theft and attack (although not perceived as a major threat under current political conditions) with limited “self-healing” corrective capability.
The additional information technology of the smart grid may enhance corrective capabilities, but may also render it more vulnerable than the conventional grid to cyber-attacks, and as such may pose a very real threat to reliability.
Improved intelligence should therefore aim to address:
Network/systems tolerant of cyber-attack, theft and natural disasters
Ability to anticipate and automatically respond to system disturbances
21st century power quality South Africa is seeing increased market penetration levels of electronic equipment and sophisticated electric appliances that are more dependent on power that is free from, sags, spikes, disturbances and interruptions. Improved power quality, possible with a more intelligent modernised grid, is therefore increasingly important.
In response to these change drivers, the smart grid offers improved operational efficiency, opportunities for energy efficiency improvements, improved customers satisfaction and enhanced ability to respond to the National Green Agenda:
Table 2 Smart grid response to industry challenges
Operational Efficiency Enhanced Energy Efficiency
Integrated distributed generation
Optimised network design
Infrastructure visibility and control
Reduced technical and non-technical losses
Enables DSM offerings
Improved load and VAR management

South African National Energy Development Institute
2013/05/30
19
Operational Efficiency Enhanced Energy Efficiency
Improved asset and resource utilisation and optimisation
Skills development
Sustainable job creation
Knowledge management
Complements national energy efficiency policies and objectives
Supports IRP 2
Improved Customer Satisfaction Supports National Green Agenda
Reduction in outage frequency and duration
Improved power quality
Empowers customers to manage consumption patterns
Facilitates customer self service
Reduced energy costs
Community upliftment
Integrates RE generation and embedded / distributed generation
Enables wide adoption of alternative energy options
Further reduces GHG emissions via DSM, peak saving and electrification of public transport
Complements climate change policy and GHG legislation (inventory, reporting requirements)
Increasing the intelligence of the grid will enable the ESI to better respond to situations such as when generation capacity constraints are experienced, to better leverage technology to complement other energy resource availability, to support the growing demand, projected economic growth and climate change commitments and to dampen the impact of electricity price increases through efficiency and reduction of system losses. The innovation and technology development due to a smart grid implementation may also spark a renewed interest in the electricity industry as a possible career opportunity, enticing new skills and employees into the market. Certainly a smart grid will require skilled people to manage the development and maintenance thereof.
It is acknowledged that a smart grid will not address all network concerns and challenges, but for a relatively small additional cost (refer Appendix E: Cost case studies) to the planned electricity system infrastructure investment, it offers potential to improve operational efficiencies and significantly enhance the electricity network infrastructure so it may support the changing industry requirements, the drivers for change and deliver on the Vision described in the subsequent section of this document.
As such, a smart grid is a key enabler for the resolution of many South Africa’s described industry challenges as shown in Figure 6.
Figure 6 Smart grid as an enabler to address industry challenges
Forfeiting this opportunity to modernise and introduce intelligence into the grid whilst in the necessary process of infrastructure upgrading and strengthening would be like expanding the nation’s telecommunications system without taking advantage of today’s digital and wireless technologies.

South African National Energy Development Institute
2013/05/30
20
4 Scope of the smart grid Vision
With consideration of this document’s context and the broad goal to transform the existing electricity supply infrastructure to a more intelligent system, this Vision now crafts a smart grid aspiration with respect to the following system elements:
- Key success factors
- Principle characteristics
- Performance
- Applications (Technical solutions)
- Metrics
This Vision is intended to be outcome based i.e. the Vision aims to create an overall picture of the aspired network qualities, capabilities and functionalities, but is not intended to be prescriptive in terms of the implementation approach, technology specifications or timelines. The expectation is that each role-player’s need shall determine the applications prioritised for implementation. Not every industry role-player will start at the same point or follow a linear process, but rather will be guided by the Vision and smart grid framework to select suitable applications and to build in the same direction towards the same national, integrated objectives.
In the subsequent section of this document the smart grid Vision is described in terms of each of these system elements. This understanding of the Vision is initially compiled for discussion and consultation purposes, but once consensus is reached it will serve as a key element of the national smart grid framework to guide coherent and focussed implementation.

South African National Energy Development Institute
2013/05/30
21
Part B: Vision
The fundamental steps towards smart grid transformation begin with a clear vision of the objectives. The Vision aims to describe an overall picture of the smart grid and in doing so, takes a systems view of the grid that will steer an integrated national solution.
To achieve this, the Vision describes the smart grid in terms of key success factors, performance requirements, principle characteristics, applications and metrics necessary to realise the smart grid. See Figure 7.
Figure 7 A systems view of the smart grid
The Vision for the South African smart grid is described comprehensively in subsequent paragraphs in terms of each of these system elements, but can be summarised into a Smart Grid Vision Statement as:-
An economically evolved, technology enabled, electricity system that is intelligent, interactive, flexible and efficient and will enable South Africa’s energy use to be sustainable for future
generations.
Clarity is provided on the meaning of certain of the words in the vision statement below.
• Economically Evolved – affordable electricity system that meets the growing needs of the economy
• Technology enabled – fit for purpose ICT, processes, sensors, systems and applications
• Intelligent – from data to knowledge
• Interactive – ability to monitor, control and manage using two way communications throughout the complete value chain
• Flexible – appropriate, scalable and adaptable based on common standards
• Electricity system – the complete value chain of all interconnected equipment and components from generation to end use
• Sustainable – optimised and affordable from environmental and economic perspectives

South African National Energy Development Institute
2013/05/30
22
5 Smart grid objectives, costs and benefits
5.1 OBJECTIVES
Implementation of a national smart grid in South Africa aims to enable the following objectives by 2030:
20% sustainable reduction in South Africa’s peak energy demand relative to the 2012 national baseline projection.
100% grid availability to serve all critical loads as defined nationally and by each utility..
40% improvement in system efficiency (measured against the national and local 2012 technical and non-technical losses baseline) and asset utilization to achieve a load factor of 70%.
8 GW electricity capacity integrated into the Distribution networks from renewable energy sources.
Improved service delivery and service reliability to customers to achieve a customer satisfaction index that exceeds 80%.
5.2 COSTS AND BENEFITS
The transition to a smarter grid entails changes and enhancements to the complete grid value chain, from how the electricity utilities operate, to how the network is structured, to how the end user interacts with the grid infrastructure. It requires extensive alignment, cooperation and integration. But, as a result, it offers, and should offer, significant benefits throughout the value chain from the utilities to the customers and, importantly, to society as a whole.
The motivation for incorporating a smart grid solution into the planned infrastructure upgrades and expansions lie with the associated benefits to the respective stakeholders and the expectation that the benefits outweigh the costs. Estimated maintenance, refurbishment and strengthening backlog costs in the distribution network alone have been calculated at R27.5 bn (2008 values), growing at a rate of R2.5 bn per annum. This is a cost that must be incurred with or without a smart grid implementation. Incorporating greater intelligence into the grid might add to these costs
7, but
should deliver benefits commensurate with and in excess of the additional investment.
An investment of this magnitude does however require the associated value proposition to be compelling to all stakeholders.
The smart grid contributes value to stakeholders in four areas, see Figure 8:
Figure 8 A smart grid value contribution
The expected benefits to all stakeholders are considered prior to the vision definition as this should guide and influence the envisaged goals/targets. Stakeholders can effectively be grouped into four categories of beneficiaries, namely: Power Generators, Electricity Utilities, Customers and Society. The values with respect to each of the illustrated areas are considered for each stakeholder category and the costs and benefits for each are briefly summarised.
7The magnitude of additional costs depends on the complexity and extent of intelligence that is incorporated hence providing accurate cost implications is difficult. An EPRI study, The Power Delivery System of the Future”, completed in 2004 and updated in 2010 indicated a benefit-to-cost ratio for the implementation of a smart grid solution could be as high as five to one (5:1).

South African National Energy Development Institute
2013/05/30
23
5.2.1 Power Generators Eskom is the main electricity generator in the country, but a few small IPPs and utility generators, amongst others, also produce power. The national RE IPP procurement programme is however rapidly increasing the number of role players in the market.
The policy shift to RE IPP’s is opening opportunities for a more diverse energy mix and hence a more diverse geographic distribution of generators. Numerous distributed generators of varying capacity and intermittent power supply from RE sources present network integration and system operation challenges for the existing electricity network infrastructure.
The introduction of a smart grid will facilitate the changing generation landscape, requiring investment while offering critical capabilities, see Table 3:
Table 3 Costs and benefits to Power Generators
Power Generator Benefits Utility ‘Costs’ or Challenges
The smart grid provides new market opportunities for Generators, as new forms of generation are demanded.
While new market opportunities exist and the value of base-load generation is expected to increase, the potential for stranded assets, particularly high operating cost peaking units, is real. Generating companies that focus on renewable energy production may find a profitable niche that the smart grid can facilitate.
Enables the integration of new, intermittent power sources and distributed generation contributing to diversity, capacity development and offering greater sustainability benefits.
But, as the smart grid becomes populated with smaller, more decentralized units and the peak load is flattened as customers respond to price signals in the new market, the opportunity for peaking units with higher operating cost to operate will diminish.
5.2.2 Electricity Utilities In South Africa, Eskom (National Transmission and Distribution), 174 municipalities and 9 metros are responsible for delivering electricity to end-users. All utilities (municipal, metro and Eskom) are subject to annual assessments and reporting commitments with respect to service delivery objectives and performance. At present, utilities are confronted with severe maintenance and investment backlogs, impacting negatively on service delivery (Appendix B). They will therefore have to take focused action to create sustainable and effective electricity distribution networks.
The electricity industry is regulated by NERSA and historically the delivery of electricity has been approached on a least-cost basis.
From a utility perspective the most important benefits offered by the smart grid would be improved service delivery, revenue protection, improved reliability and improved efficiency of operations and utilisation of resources. Table 4 reflects some of the most significant costs and benefits for utilities.
Table 4 Costs and benefits to Utilities
Utility Benefits Utility ‘Costs’ or Challenges
Investments made by utilities to reduce operational and maintenance costs can add to the bottom line, at least until the next rate case. Smart grid investments create the opportunity to realise these savings, provide an opportunity to earn a return on the associated capital investments, and have the potential to improve service delivery and therefore customer satisfaction. Utilities have an interest in reducing costs to keep rate increases as low as possible for their customer base.
Given that much of the smart grid investment costs are expected to be recovered through a reduction in operational costs and assuming the utilities are able to recover the remaining costs from customers and earn a return on the investment, it would seem that the utilities would be motivated to implement a smart grid. This is particularly true if their customers also support (and believe in) the opportunities the smart grid is expected to deliver to them.
Smart Grid monetary investments in the distribution system will be necessary to establish the capacity and unlock the benefits of wider high bandwidth communications to all substations, intelligent electronic devices (IED) that provide adaptable control and protection systems, complete distribution system monitoring that is integrated with larger asset management systems, collaborative distributed intelligence, including dynamic sharing of computational resources of all intelligent electronic devices and distributed command and control to mitigate power quality events and improve reliability and system performance.
Improved relationship with and compliance to Regulatory and Government expectations and requirements
A further downside for utilities is the concern over reduced sales of KWh’s. The revenue required by utilities to ensure they recover their incremental costs is based on the projected volume of KWh’s sold. Solutions to this dilemma, such as the notion of decoupling the revenue from sales, are currently under consideration by the DOE and NERSA.
Improved environmental performance and compliance to ensure improved energy sustainability
South African National Energy Development Institute
2013/05/30
24
Utility Benefits Utility ‘Costs’ or Challenges
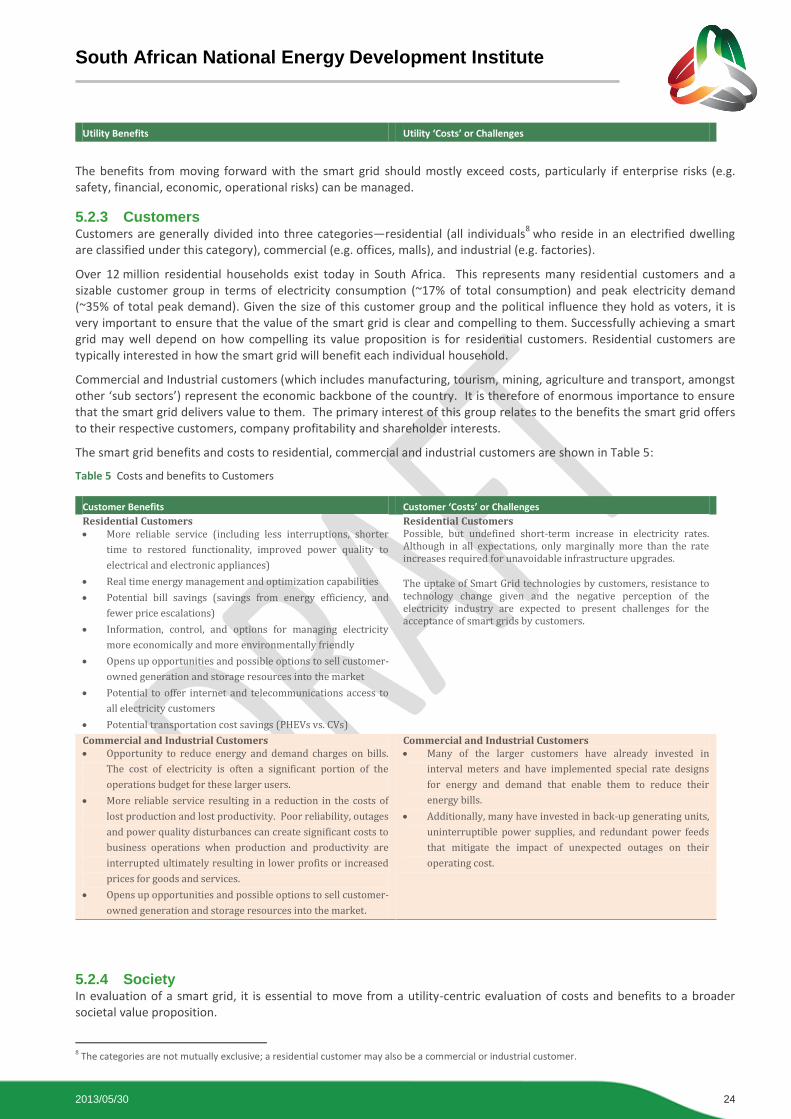
The benefits from moving forward with the smart grid should mostly exceed costs, particularly if enterprise risks (e.g. safety, financial, economic, operational risks) can be managed.
5.2.3 Customers Customers are generally divided into three categories—residential (all individuals
8 who reside in an electrified dwelling
are classified under this category), commercial (e.g. offices, malls), and industrial (e.g. factories).
Over 12 million residential households exist today in South Africa. This represents many residential customers and a sizable customer group in terms of electricity consumption (~17% of total consumption) and peak electricity demand (~35% of total peak demand). Given the size of this customer group and the political influence they hold as voters, it is very important to ensure that the value of the smart grid is clear and compelling to them. Successfully achieving a smart grid may well depend on how compelling its value proposition is for residential customers. Residential customers are typically interested in how the smart grid will benefit each individual household.
Commercial and Industrial customers (which includes manufacturing, tourism, mining, agriculture and transport, amongst other ‘sub sectors’) represent the economic backbone of the country. It is therefore of enormous importance to ensure that the smart grid delivers value to them. The primary interest of this group relates to the benefits the smart grid offers to their respective customers, company profitability and shareholder interests.
The smart grid benefits and costs to residential, commercial and industrial customers are shown in Table 5:
Table 5 Costs and benefits to Customers
Customer Benefits Customer ‘Costs’ or Challenges
Residential Customers More reliable service (including less interruptions, shorter
time to restored functionality, improved power quality to
electrical and electronic appliances)
Real time energy management and optimization capabilities
Potential bill savings (savings from energy efficiency, and
fewer price escalations)
Information, control, and options for managing electricity
more economically and more environmentally friendly
Opens up opportunities and possible options to sell customer-
owned generation and storage resources into the market
Potential to offer internet and telecommunications access to
all electricity customers
Potential transportation cost savings (PHEVs vs. CVs)
Residential Customers Possible, but undefined short-term increase in electricity rates. Although in all expectations, only marginally more than the rate increases required for unavoidable infrastructure upgrades. The uptake of Smart Grid technologies by customers, resistance to technology change given and the negative perception of the electricity industry are expected to present challenges for the acceptance of smart grids by customers.
Commercial and Industrial Customers Opportunity to reduce energy and demand charges on bills.
The cost of electricity is often a significant portion of the
operations budget for these larger users.
More reliable service resulting in a reduction in the costs of
lost production and lost productivity. Poor reliability, outages
and power quality disturbances can create significant costs to
business operations when production and productivity are
interrupted ultimately resulting in lower profits or increased
prices for goods and services.
Opens up opportunities and possible options to sell customer-
owned generation and storage resources into the market.
Commercial and Industrial Customers Many of the larger customers have already invested in
interval meters and have implemented special rate designs
for energy and demand that enable them to reduce their
energy bills.
Additionally, many have invested in back-up generating units,
uninterruptible power supplies, and redundant power feeds
that mitigate the impact of unexpected outages on their
operating cost.
5.2.4 Society In evaluation of a smart grid, it is essential to move from a utility-centric evaluation of costs and benefits to a broader societal value proposition.
8 The categories are not mutually exclusive; a residential customer may also be a commercial or industrial customer.

South African National Energy Development Institute
2013/05/30
25
The South African electricity ratepayers (directly) and society as a whole (indirectly through possible inflation impacts) will effectively bear the initial infrastructure investment costs for the smart grid, but, the value proposition projected for society is strong. Beyond the tangible, it also offers intangible benefits that are subject to a societal assessment of worth. This may differ for different aspects of society. For South Africa the following are key considerations, see Table 6
Table 6 Costs and benefits to Society
Societal Benefits Societal ‘Costs’ or Challenges
Reduced losses to society from power outages and power quality issues Reducing the probability of regional blackouts can prevent
significant losses to society.
Reducing by even 20% the cost of outages and power quality
issues that is currently estimated at a cost of R75 for every
kWh of unserved energy, will contribute.
It is anticipated that rising electricity tariffs to cover the costs of infrastructure investments will result in an initial economic impact i.e. both direct and indirect inflationary impacts. International case studies have shown that the costs are recovered rapidly through significant cost savings and benefits.
Improved operating efficiencies for utilities will reduce operation and maintenance and capital costs, keeping downward pressure on electricity prices for all customers. Reducing transmission and distribution losses
Reducing transmission congestion costs
Reduced operation and maintenance spending.
Eliminating or deferring large capital investments in
centralized generating plants, substations, and transmission
and distribution lines.
Improved National Security Has the potential to reduce the South African dependence on
foreign oil if the use of PHEVs can be accommodated and
integrated.
Reducing the probability (and consequences) of widespread
and long-term outages due to terrorist/ theft activity could
prevent significant societal costs.
Improved Environmental Conditions Reduction in total emissions — through conservation,
demand response, and reduced transmission and distribution
losses. This reduction in energy production provides a
corresponding reduction in all types of emissions.
Reduction in CO2 emissions — the smart grid and its ability to
support renewable energy, distributed generation, electric
vehicles and optimised resource utilisation / energy
efficiency, could significantly reduce emissions.
Improved public health — the impact of vehicle particulate
emissions in urban areas can be reduced as the number of
kilometre driven by CVs is offset by kilometre driven by
electric vehicles.
Reduction in the number of injuries and deaths due to contact
with grid assets.
Improved Economic Growth Creation of new jobs would persist following implementation
to support ongoing operation and maintenance of the smart
grid.
Demand for new products and services — this demand will be
created not only to build the smart grid but also to support
customers who wish to participate with it.
Creation of new electricity markets — such markets will
enable society to offer its electricity resources to the market,
creating the opportunity to earn a revenue stream on such
investments as demand response, distributed generation, and
storage.
Improved conditions for economic development — Economic
development depends on a reliable source of electric power at
a reasonable cost. A robust smart grid creates an environment
South African National Energy Development Institute
2013/05/30
26
Societal Benefits Societal ‘Costs’ or Challenges
attractive to new investment when compared to one with a
poor track record.
Reduced wholesale electricity prices compared with business
as usual – This reduction will be achieved through a reduction
in peak loads and energy conservation.
Reduced consumption of KWh’s through conservation,
demand response, and reduced transmission and distribution
losses –Besides providing an economic savings to society, this
efficiency improvement provides for a better utilisation of our
national resources.
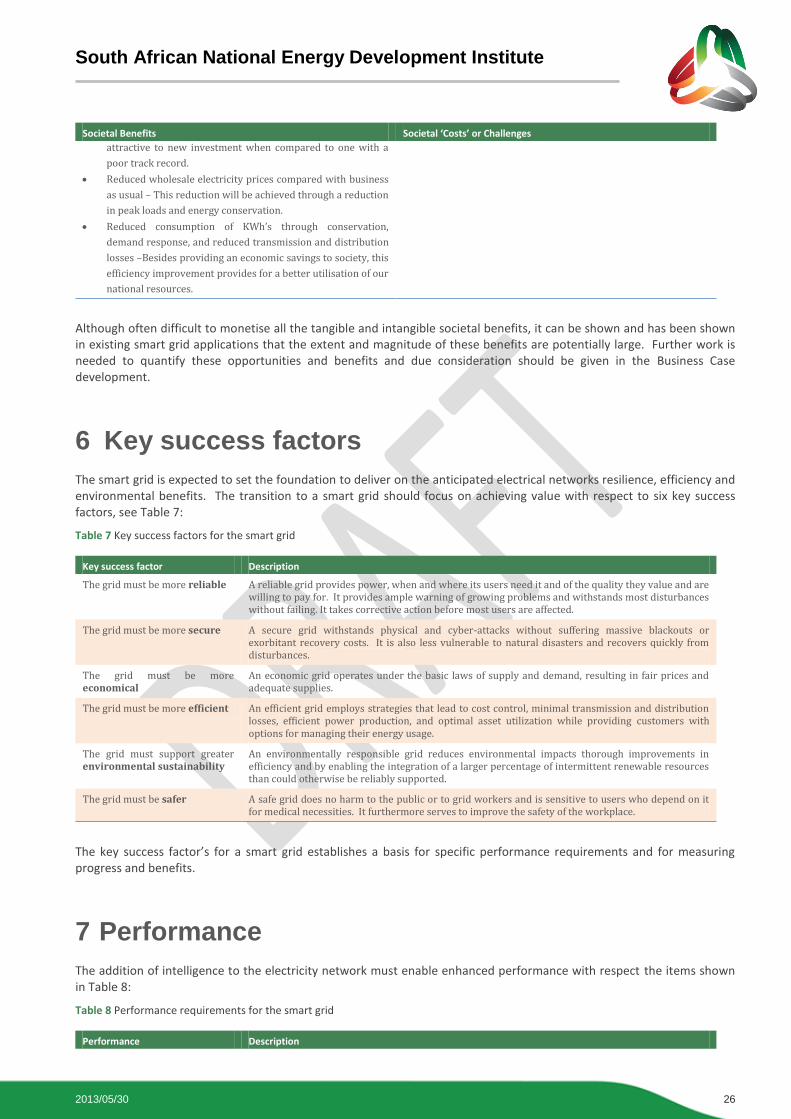
Although often difficult to monetise all the tangible and intangible societal benefits, it can be shown and has been shown in existing smart grid applications that the extent and magnitude of these benefits are potentially large. Further work is needed to quantify these opportunities and benefits and due consideration should be given in the Business Case development.
6 Key success factors
The smart grid is expected to set the foundation to deliver on the anticipated electrical networks resilience, efficiency and environmental benefits. The transition to a smart grid should focus on achieving value with respect to six key success factors, see Table 7:
Table 7 Key success factors for the smart grid
Key success factor Description
The grid must be more reliable A reliable grid provides power, when and where its users need it and of the quality they value and are willing to pay for. It provides ample warning of growing problems and withstands most disturbances without failing. It takes corrective action before most users are affected.
The grid must be more secure A secure grid withstands physical and cyber-attacks without suffering massive blackouts or exorbitant recovery costs. It is also less vulnerable to natural disasters and recovers quickly from disturbances.
The grid must be more economical
An economic grid operates under the basic laws of supply and demand, resulting in fair prices and adequate supplies.
The grid must be more efficient An efficient grid employs strategies that lead to cost control, minimal transmission and distribution losses, efficient power production, and optimal asset utilization while providing customers with options for managing their energy usage.
The grid must support greater environmental sustainability
An environmentally responsible grid reduces environmental impacts thorough improvements in efficiency and by enabling the integration of a larger percentage of intermittent renewable resources than could otherwise be reliably supported.
The grid must be safer A safe grid does no harm to the public or to grid workers and is sensitive to users who depend on it for medical necessities. It furthermore serves to improve the safety of the workplace.
The key success factor’s for a smart grid establishes a basis for specific performance requirements and for measuring progress and benefits.
7 Performance
The addition of intelligence to the electricity network must enable enhanced performance with respect the items shown in Table 8:
Table 8 Performance requirements for the smart grid
Performance Description

South African National Energy Development Institute
2013/05/30
27
Performance Description
Emergency response The smart grid must provide advanced analysis to predict problems before they occur and to assess problems as they develop. This should allow steps to be taken to minimize impacts and to respond more effectively.
Restoration It can take days or weeks to return the current grid to full operation after an emergency. A smart grid must enable faster restoration and at lower cost by making better information, control and communications tools available to assist operators and field personnel.
Routine operations The smart grid must provide operators with an understanding of the state and trajectory of the grid, should provide recommendations for secure operation, and allow appropriate controls to be initiated. Operators should be able to depend on the help of advanced visualization and control tools, fast simulations and decision support capabilities.
Optimisation The modern grid must provide advanced tools to understand conditions, evaluate options and exert a wide range of control actions to optimize grid performance from reliability, environmental, efficiency and economic perspectives.
System planning Grid planners must be able to analyse projected growth in supply and demand to guide their decisions about what to build, when to build and where to build. Smart grid data mining and modelling must provide much more accurate information to answer those questions.
8 Principle characteristics
Meeting the stated performance requirements requires the smart grid to include certain important characteristics’ or features. The Vision describes seven broad principal characteristics which constitute the smart grid (Table 9):
Table 9 Principle characteristics of the smart grid
Characteristic Description
Anticipates and responds to system disturbances (self-heals)
The grid must perform continuous self-assessments to detect, analyse, respond to, and as needed, restore grid components or network sections. It must establish a network capable of delivering: a) real-time monitoring (of voltage, currents and critical infrastructure) and reaction (rapid and
effective response to monitored events);
b) anticipation (“fast look-ahead simulation”); and
c) isolation where failures do occur (to prevent cascades) and mitigation around failures.
It must be capable of healing itself by performing continuous self-assessments to detect and analyse issues, take corrective action to mitigate them and, if needed, rapidly restore grid components or network sections. It must also handle problems too large or too fast-moving for human intervention. Acting as the grid’s “immune system,” self-healing is required to help maintain grid reliability, security, affordability, power quality and efficiency.
The self-healing grid must minimize disruption of service by employing modern technologies that can acquire data, execute decision-support algorithms, avert or limit interruptions, dynamically control the flow of power, and restore service quickly. Probabilistic risk assessments based on real-time measurements will identify the equipment, power plants, and lines most likely to fail. Real-time contingency analyses will determine overall grid health, trigger early warnings of trends that could result in grid failure, and identify the need for immediate investigation and action.
Communications with local and remote devices will help analyse faults, low voltage, poor power quality, overloads, and other undesirable system conditions. Then appropriate control actions will be taken, automatically or manually as the need determines, based on these analyses.
Enables active participation by customer (motivates and includes the customer)
Customer choices and increased interaction with the grid bring tangible benefits to both the grid and the environment, while reducing the cost of delivered electricity.
The smart grid must give customers information, control, and options that allow them to engage in new “electricity markets.” Grid operators will be able to treat willing customers as resources in the day-to-day operation of the grid. Well-informed customers must have the ability to modify consumption based on balancing their demands and resources with the electric system’s capability to meet those demands.
Demand-response (DR) programs present an opportunity to satisfy a basic customer need —greater choice in energy purchases. The ability to reduce or shift peak demand allows utilities to minimize capital expenditures and operating expenses while also providing substantial environmental benefits by reducing line losses and minimizing the operation of inefficient peaking power plants. In addition, emerging products like the plug-in hybrid vehicle will result in substantially improved load factors while also providing significant environmental benefits.
The grid must be able and suitably flexible to accommodate existing and anticipated technology developments adopted by customers.

South African National Energy Development Institute
2013/05/30
28
Characteristic Description
Smart Grid technologies to enable customer to make more intelligent decisions about their energy consumption and further encourage energy optimization through incentive schemes
Operates resiliently against attack and natural disaster
The smart grid must operate resiliently against natural disaster, must deter or withstand physical or cyber-attack and must contribute to improved public safety.
The grid must incorporate a system-wide solution that reduces physical and cyber vulnerabilities and enables a rapid recovery from disruptions. Resilience is critical to deter would-be attackers, even those who are determined and well equipped. Its decentralized operating model and self-healing features must be designed to make it less vulnerable to natural disasters than the existing grid.
Security protocols should contain elements of deterrence, detection, response, and mitigation to minimize impact on the grid and the economy. A less susceptible and more resilient grid will make it a more difficult target for thieves, hackers and terrorists.
Provides power quality for 21st century needs
Digital-grade power quality for those who need it avoids production and productivity losses, especially in digital-device environments.
The Smart grid is required to provide power quality (PQ) for the digital economy. It must monitor, diagnose, and respond to power quality deficiencies, leading to a reduction in the business losses currently experienced by customers due to insufficient power quality. New power quality standards will balance load sensitivity with delivered power quality. The smart grid might be required to supply varying grades of power quality at different pricing levels.
Accommodates all generation and storage options
Diverse resources with “plug-and-play” connections multiply the options for electrical generation and storage, including new opportunities for more efficient, cleaner power production.
The smart grid is required to seamlessly integrate all types and sizes of electrical generation and storage systems using simplified interconnection processes and universal interoperability standards to support a “plug-and-play” level of convenience. Large central power plants including environmentally friendly sources, such as wind and solar farms and advanced nuclear plants, will continue to play a major role even as large numbers of smaller distributed resources, including plug-in electric vehicles, are deployed.
Various capacities from small to large will be interconnected at essentially all voltage levels and will include distributed energy resources such as photovoltaic, wind, advanced batteries, plug-in hybrid vehicles, and fuel cells. It will most likely be easier and more profitable for commercial users to install their own generation such as highly efficient combined heat and power installations and electric storage facilities. The grid must be capable of facilitating these developments in a cost effective manner.
Enables new products, services, and markets
The smart grid will enable an open-access market that reveals waste and inefficiency and helps drive them out of the system while offering new customer choices such as green power products and a new generation of electric vehicles. Smart grids also reduce transmission congestion that in turn leads to more efficient electricity markets.
The smart grid will link buyers and sellers together across the value chain. It will support the creation of new electricity markets ranging from the home energy management system at the customers’ premises to the technologies that allow customers and third parties to bid their energy resources into the electricity market.
Customer response to price increases felt through real-time pricing is expected to mitigate demand and energy usage, driving lower-cost solutions and spurring new technology development. New, clean energy-related products will also be offered as market options.
The smart grid must support consistent market operation across regions. It will enable more market participation through increased transmission paths, aggregated demand response initiatives, and the placement of energy resources including storage within a more reliable distribution system located closer to the customer.
Optimizes assets and operates efficiently
Desired functionality at minimum cost must guide grid operations and allows fuller utilisation of all assets. The smart grid must allow more targeted and efficient grid maintenance programmes that will minimise equipment failures and provide for safer operations.
Operationally, the smart grid is required to improve load factors, lower system losses, and provide for a step change improvement in outage management performance. The availability of additional grid intelligence must give planners and engineers the knowledge to build what is needed when it is needed, extend the life of assets, repair equipment before it fails unexpectedly, and more effectively manage the work force that maintains the grid. Operational, maintenance, and capital costs should be reduced thereby keeping downward pressure on electricity prices.
Table 10 summarises these seven principle characteristics and allows a comparison between the existing grid and the vision of the smart grid with respect to these characteristics.
Table 10 Comparison of the existing and envisaged grid in terms of principle characteristics
Existing grid Principle characteristics Envisaged smart grid
Customers have limited information and opportunity for participation with power
Enables informed and greater participation by customers
Informed, involved, and active customers – demand response and distributed energy
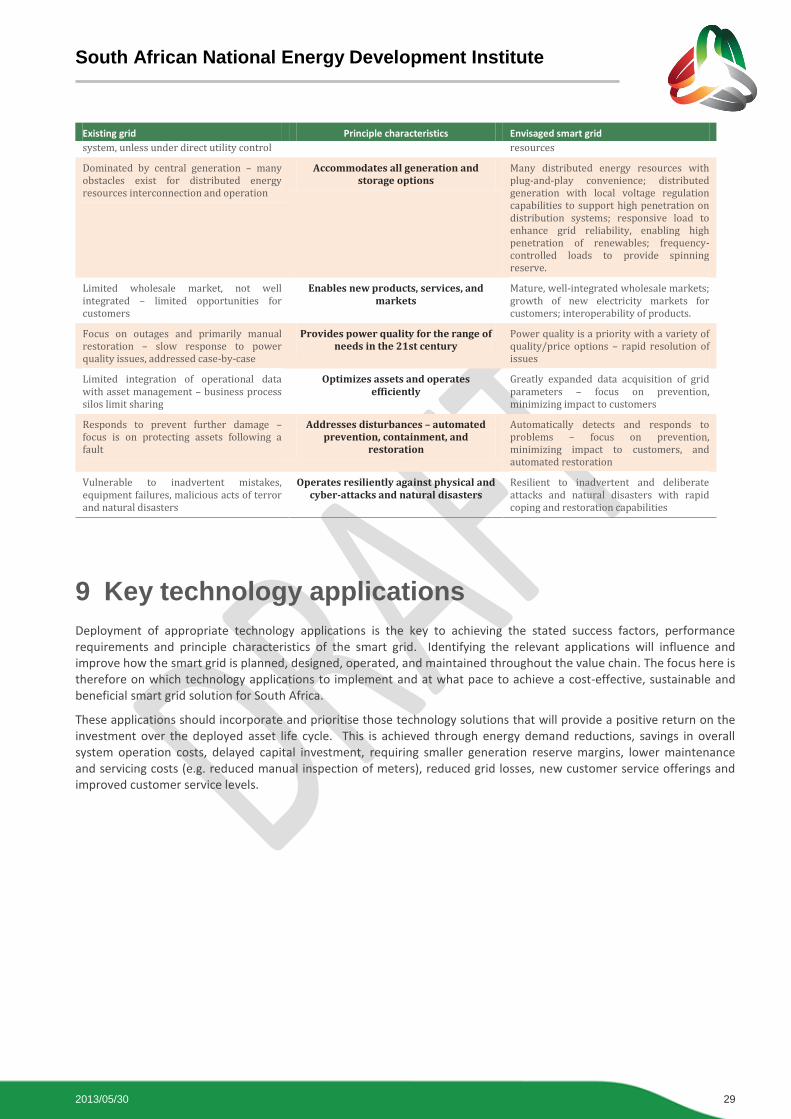
South African National Energy Development Institute
2013/05/30
29
Existing grid Principle characteristics Envisaged smart grid
system, unless under direct utility control resources
Dominated by central generation – many obstacles exist for distributed energy resources interconnection and operation
Accommodates all generation and storage options
Many distributed energy resources with plug-and-play convenience; distributed generation with local voltage regulation capabilities to support high penetration on distribution systems; responsive load to enhance grid reliability, enabling high penetration of renewables; frequency- controlled loads to provide spinning reserve.
Limited wholesale market, not well integrated – limited opportunities for customers
Enables new products, services, and markets
Mature, well-integrated wholesale markets; growth of new electricity markets for customers; interoperability of products.
Focus on outages and primarily manual restoration – slow response to power quality issues, addressed case-by-case
Provides power quality for the range of needs in the 21st century
Power quality is a priority with a variety of quality/price options – rapid resolution of issues
Limited integration of operational data with asset management – business process silos limit sharing
Optimizes assets and operates efficiently
Greatly expanded data acquisition of grid parameters – focus on prevention, minimizing impact to customers
Responds to prevent further damage – focus is on protecting assets following a fault
Addresses disturbances – automated prevention, containment, and
restoration
Automatically detects and responds to problems – focus on prevention, minimizing impact to customers, and automated restoration
Vulnerable to inadvertent mistakes, equipment failures, malicious acts of terror and natural disasters
Operates resiliently against physical and cyber-attacks and natural disasters
Resilient to inadvertent and deliberate attacks and natural disasters with rapid coping and restoration capabilities
9 Key technology applications
Deployment of appropriate technology applications is the key to achieving the stated success factors, performance requirements and principle characteristics of the smart grid. Identifying the relevant applications will influence and improve how the smart grid is planned, designed, operated, and maintained throughout the value chain. The focus here is therefore on which technology applications to implement and at what pace to achieve a cost-effective, sustainable and beneficial smart grid solution for South Africa.
These applications should incorporate and prioritise those technology solutions that will provide a positive return on the investment over the deployed asset life cycle. This is achieved through energy demand reductions, savings in overall system operation costs, delayed capital investment, requiring smaller generation reserve margins, lower maintenance and servicing costs (e.g. reduced manual inspection of meters), reduced grid losses, new customer service offerings and improved customer service levels.

South African National Energy Development Institute
2013/05/30
30
Figure 9 Envisaged smart grid initiatives and interfaces for South Africa
The following applications are included in the identified smart grid solution for South Africa:
Advanced Metering Infrastructure (AMI)
Customer Side Systems (CS)
Demand Response (DR)
Distribution Management System/Distribution Automation (DMS)
Transmission Enhancement Applications (TA)
Asset/System Optimization (AO)
Distributed Energy Resources (DER)
Information and Communications Integration (ICT)
The deployment of these applications directly correlates to achieving the key success factors of—reliability, economics, efficiency, environmental, safety and security as shown in Figure 10:

South African National Energy Development Institute
2013/05/30
31
Figure 10 Illustrating the correlation between applications and key success factors
The applications are roughly aligned to four functional areas of the smart grid. The four functional areas are defined as Customer Enablement (CE), Advanced Distribution Operations (ADO), Advanced Transmission Operations (ATO), and Advanced Asset Management (AAM) and correspond with the applications as illustrated in Figure 11 below.
Figure 11 Correlating the prioritised applications with the four functional areas
The final realization of a smart grid is a system that demonstrates all seven of the principal characteristics (Section Error! eference source not found.) across all four functional areas as shown in Table 11 below:
Table 11 Correlation between smart grid principle characteristics and functional areas.
Principle characteristic CE ADO ATO AAM
Enables informed and greater participation by customers
Accommodates all generation and storage options
Enables new products, services, and markets
Provides power quality for the range of needs in the 21st century
Optimizes assets and operates efficiently

South African National Energy Development Institute
2013/05/30
32
Principle characteristic CE ADO ATO AAM
Addresses disturbances – automated prevention, containment, and restoration
Operates resiliently against physical and cyber-attacks and natural disasters
The functional areas can be used to structure a “roadmap” of an ordered and cost effective strategy towards a smarter grid while keeping the Vision goals/targets in mind.
It is possible to use each functional area to develop a business case and then integrate these four business cases together to determine the most productive transformation plan for South Africa with its own limitations, priorities, and cost concerns. In a general sense, sequencing of the smart grid implementation within the functional areas with consideration of a “roadmap” can aid in the implementation and with maximizing the benefits (see Figure 12). A “roadmap”, based on this proposed approach, will be developed as part of the smart grid framework to provide industry guidance in terms of the Vision, but will not prescribe the journey that each utility should take.
Figure 12 Indicative smart grid sequencing roadmap
It should be recognised that smart grid benefits are optimised when applications across the respective functional areas are combined across the ESI (from Generation to Residential) as shown in Figure 11 above. As the functionalities from various applications combine, the potential benefits from the smart grid increases exponentially to all stakeholders. There is however a point when further investment in applications deliver smaller returns (see Figure 13). The Vision and overall SASGI smart grid framework aim is to assist with unlocking optimal benefits for the given investments.

South African National Energy Development Institute
2013/05/30
33
Figure 13 Accumulation of benefits (conceptual) as smart grid components are incorporated
As indicated previously, a cohesive smart grid framework shall allow each utility to identify functional areas with the most severe challenges in the utility network and to prioritise the selection of applications in terms of the most urgent need and greatest anticipated return. Each of the listed applications is therefore described briefly in the context of the functional area (CE, ADO, ATO, AAM) to which it is allocated (see Figure 14 below).
Figure 14 Comprehensive view of smart grid applications in each functional area
9.1 CUSTOMER ENABLEMENT (CE)
CE is primarily aimed at the customer side of the smart grid by providing users/customers with information, control and options, mainly involving AMI and DR capability. AMI includes smart meters for advanced measurement, an integrated two-way communications infrastructure, and an active interface to give customers and their home area networks access to information, and a meter data management system to process the vast amount of new data. Additionally, AMI provides information about conditions on the grid and interfaces with other utility enterprise systems that can benefit
South African National Energy Development Institute
2013/05/30
34
from its functionality. AMI‘s communication infrastructure, data, and interfaces with other enterprise systems are all critical links to the other three functional areas. The general solution set for delivering a smart grid solution within this functional area includes:
Smart meters that record interval energy usage, power quality parameters, other system operating parameters, and are equipped with remote connect/disconnect capability.
Two-way integrated communication system with adequate throughput and acceptable latency to support the exchange of data and information among customers, other Smart grid users, and all appropriate Smart grid processes, technologies and applications.
Customer portal that supports a wireless home area network and in-home display that enables customers to easily set preferences, control their smart devices, and interface with the smart grid.
Meter data management system that intelligently processes the vast amount of data produced by the smart meters, converts the data to information and integrates with other smart grid processes and technologies.
Time based prices that reflect the real cost of electricity provided to customers at frequencies needed to support market transactions.
Upgrades to utility legacy processes, technologies and applications needed to support the integration of other smart grid applications. For example, legacy Customer Information Systems and Information Technology architectures might need modification to support the increased transactional load and cross-functional nature inherent in the smart grid vision.
Customer educational programs to assist customers in their understanding of the benefits of the Smart grid and how they can take advantage of the new opportunities and options it provides to them.
Demand response programs that incentivise customers to participate in demand reducing activities.
Customer owned DERs that are interconnected, dispatchable by grid operators and provide financial incentives to the owners.
Customers benefiting from innovative incentive schemes to assist the grid during supply constraints and further reduce energy usage through real time feedback.
9.2 ADVANCED DISTRIBUTION OPERATIONS (ADO)
ADO is primarily aimed at the utility side of the smart grid, providing the increased information and granularity of control needed for a self-healing grid. ADO includes a distribution management system with advanced and ubiquitous sensors and distributed intelligence, advanced outage management capability, and distribution automation technologies.
It enables effective and efficient operation of a grid that employs extensive distributed generation of all types and sizes including perhaps millions of PHEVs and various types of micro-grids. It is also deeply integrated with a distribution GIS.
The ADO functional area provides important support to the Advanced Transmission Operations functional area. The general components to the delivery of an ADO includes:
Ubiquitous deployment of smart sensors that monitor distribution system operating parameters at all key locations
High level of granularity of smart switches enabling the distribution to be sectionalized into optimum size parts when needed
DMS equipped with advanced analysis and control algorithms to enable two-way power flow on the distribution system. DMS is used to take advantage of the ubiquitous system information and control capability to optimize operation and provide self-healing capability.
Distribution automation that autonomously reconfigures the distribution system to minimize the impact of disruptions.
Advanced Outage Management System that integrates ADO with CE to detect and diagnose local outages leading to a rapid dispatch of crews to repair the trouble. Customer calls to report trouble will no longer be needed to determine location and source of the trouble.
South African National Energy Development Institute
2013/05/30
35
GIS to provide the where dimension needed to support ADO and CE.
Micro-grid operation integrated with DMS and customer‘s Home Area Network (HAN) to identify when micro- grids should be operating in parallel or islanded mode.
Advanced protection and control systems (e.g. voltage regulation, VAR support, distribution automation, fault current interruption) that adapt and support two-way power flow.
9.3 ADVANCED TRANSMISSION OPERATIONS (ATO)
The ATO functional area is primarily aimed at improving transmission reliability and efficiency, while managing congestion on the transmission system. ATO also integrates certain aspects of distribution system operations with transmission operations. It enables the security constrained economic dispatch models available for use by utilities to more effectively utilise the distribution system as a resource. ATO includes substation automation, advanced protection and control, modelling, simulation and visualization tools, advanced grid control devices and materials, and the integration of all these tools with markets and utility operations and planning functions. The general approach to achieving intelligence in this functional area includes:
Substation Automation that collects information and control capabilities at each substation and communicates with other substations to ensure that broader system conditions are shared among these assets.
Integration with and linkage among ATO, ADO and ultimately with CE.
Wide Area Measurement System (WAMS) that are integrated with transmission operation centres to increase operator‘s situational awareness. WAMS will also reduce the time needed for key transmission algorithms to solve giving operators‘ new tools to better understand existing and projected conditions
Ubiquitous deployment of smart sensors that monitor transmission system operating parameters at all key locations
Modelling and simulation tools to enable operators to perform “what-if” scenarios and understand future operating risks
Advanced materials and power electronics devices to improve asset utilization, voltage management, power quality and flow control of large blocks of power
Advanced protection systems that adapt to system operating conditions
9.4 ADVANCED ASSET MANAGEMENT (AAM)
The AAM functional area is primarily aimed at improving the utilisation of transmission and distribution assets at the operational level and more effectively managing these assets from a life cycle perspective. AAM depends on the ubiquity of smart sensors that provide both operational and asset condition information that it acquires from the other three functional areas. The deep integration of that information significantly improves the effectiveness of enterprise asset management systems such as capacity planning, condition based maintenance, resource and work management, engineering design and construction. The general solution to achieving a smart solution in this functional area includes:
Ubiquitous deployment of smart sensors that monitor asset condition and health for all critical assets.
Dynamic ratings of assets to optimize their utilisation.
Condition monitoring algorithms that optimise when assets should be removed from service for maintenance and maximise their useful life.
Integration of smart grid intelligence with key asset management processes including system planning, maintenance, engineering, customer service, work and resource management.
10 Metrics
Metrics and targets provide a framework against which to monitor the transformation of the national electricity infrastructure into the envisaged smart grid and to gauge the value of the resulting contribution to the country. It is therefore a critical aspect of the Vision.

South African National Energy Development Institute
2013/05/30
36
At a high-level the smart grid objectives (refer Section 5.1) will serve as the metrics to track progress towards delivering on the South African Smart Grid Vision. But, it recognises that these metrics will be composed of several sub metrics that will require aggregation across industry sections and across entities/role players. It is also recognised that the metrics would represent an industry average, with varying targets and statuses for individual entities.
A monitoring system that can evaluate performance of the smart grid applications against these metrics should continually guide the national roll out. It is anticipated that performance against these metrics will be composed of a more detailed framework of KPIs across the industry that will be tracked and aggregated across the industry to report performance at this level. It is proposed that a standard framework and standard definition of metrics is agreed as part of the process to develop standards for smart grids. Appendix E captures suggestions of the scope that would contribute to each measure.
It is furthermore recognised that the metrics would have to be reviewed as the national smart grid framework that SASGI is working on, unfolds to ensure the targets remain both aspirational and realistic.
South African National Energy Development Institute
2013/05/30
37
11 Appendix A: Bibliography
1. National Energy Technology Laboratory (NETL) for the United States Department of Energy (USDoE) June 2009, A Vision for the Smart Grid, The Modern Grid Strategy, National Energy Technology Laboratory and the US Department of Energy Office of Electricity and Energy Reliability.
2. Electric Power Research Institute (EPRI) 2004 and 2010, Power Delivery System of the Future, EPRI.
3. Miller, Joe 2012, What is a Smart Grid?, Smartgridnews.com January 2012, viewed 22 February 2013, http://www.smartgridnews.com/artman/publish/commentary/What_Is_the_Smart_Grid-567.html#.USeLulqtw7Q
4. Electricity Regulation Act: Electricity Regulations for Compulsory Norms and Standards for Reticulation Services (GN 773), DME 2008.
5. National Energy Technology Laboratory (NETL) for the United States Department of Energy (USDoE) February 2008, Modern Grid Initiative Powering our 21
st-Century Economy, US Department of Energy National Energy
Technology Laboratory
6. University of San Diego School of Law 2006, The Energy Policy Initiatives Centre,
7. Salaris, G.M. Udine April 2011, From Smart Metering to Smart Grids: The Enel Vision, IEEE ISPLC
8. PriceWaterhouseCoopers 2011, Smart from the start: Managing smart grid programmes, Energy, Utilities and Mining roundtable discussion paper, PWC.
9. Giglioli, E Panzacchi, C and Senni, L, 2010, How Europe is approaching the smart grid, McKinsey & Company
10. OECD, 2013, OECD Economic Surveys: South Africa 2013, OECD Publishing. http://dx.doi.org/10.1787/eco_surveys-zaf-2013-en
11. South Africa Cities Network (SACN), 2011 State of City Finance Report, 2011
12. Auditor General, 2012, Consolidated General Report on the audit outcomes of Local Government 2010 – 11, RP216/2012, ISBN: 978-0-621-41079-2, SACN
13. Andersen TB and Dalgaard CJ, February 2012, Power Outages and Economic Growth in Africa, Department of Business and Economics, University of Southern Denmark, 2012.
14. Department of Energy 2011, Cost of Unserved Energy (COUE) – IRP Input Parameter information sheet, DOE
15. Subramoney K 2012, Advanced Metering Infrastructure (AMI) in South Africa, Eskom’s Challenges and Lessons Learned, 7
th Annual metering billing / CRM Asia 2012, Bangkok, 9 May 2012.
16. EPRI 2011 Estimating the Costs and Benefits of the Smart Grid, Electric Power Research Institute

South African National Energy Development Institute
2013/05/30
38
12 Appendix B: Industry overview
12.1 TRANSMISSION AND GENERATION SYSTEM
An efficient, reliable transmission system has had, and will continue to have, an essential role in satisfying South Africa’s growing thirst for electricity, being the most flexible and useable form of energy. Advanced digital technology, as well as power electronics, can raise transmission to a new level of performance, even as the emergence of remote renewable energy farms and increasing electricity market applications create new challenges.
Development and integration of large central station wind and solar farms, a national priority, will be held back until existing transmission capacity is increased using new technology (FACTS, optimized transmission dispatch, high capacity conductors, advanced storage, etc.) along with the addition of new high capacity high voltage direct current (HVDC)—800 kV—and high voltage alternating current (HVAC)— 765 kV lines. Bottom line: while it is true that today’s transmission is more advanced than distribution, the transition to a smart grid requires much more transmission capability and now is the time to make the required investment.
To place this in context, we should first understand the historic role of transmission, which was to connect remote generation to load areas and to interconnect isolated power systems. Interconnection provides multiple benefits by exploiting the diversity that can exist between differing systems:
Diversity between the times that peak loads occur, allowing the same generation equipment to supply more than one system’s load.
Diversity of outages, allowing spare equipment to support more than one system.
Diversity of fuel sources, allowing the most economical fuel choice for any given situation.
However, new and emerging requirements find transmission in roles it was not designed to perform. One example is the role of a market channel, connecting buyers and sellers across very large geographic regions. Excessive transmission-use variability and far less predictability are the result. Further complicating factors come with the penetration of renewable generation such as wind and solar. The emergence of the plug-in electric hybrid vehicle (PHEV), while initially an increased demand consideration, could one day play a significant role as a system energy storage resource. The PHEV could be used for storage and demand side management (an asset) in a smart grid environment, or it could create significant new uncontrolled demand (a liability) during peak load periods in the absence of a smart grid’s control characteristic. Coordinated operation of storage, demand response, and distribution-level generation will all be needed to address these and other 21st-century issues.
While recognizing that transmission and generation challenges are large, the first requirement for any such system remains the same—it must be extremely reliable. The importance of this aspect is perhaps best illustrated by the events of the 2008 Cape Town blackout which cost the SA economy about R50 billion.
Regulators and utility planners bat around a term called the “value of lost load,” referring to lost electrical load. In principle, it’s the amount the average customer would pay to avoid an outage. Economic losses cost 15 to 133 times more than to produce the ‘missing’ electricity. The estimated cost over the three months of load shedding in early 2008 ranged from R50 billion to R119 billion at the time (estimated 5000GWh lost). These estimates would suggest a potential drop in nominal GDP growth of 2.5-6%, if the unmet electricity needs were sustained at a rate of every fourth day for a year. In general, these direct costs are considered to be underestimates of the total costs because they do not account for the effect on confidence. A single 3-hour shutdown would lose the country around 2.25-3.55 billion Rand in today’s value. What would that loss mean? The lower estimate is equivalent to losing 27,108 to 40,900 low cost houses, or wasting one seventh of the annual low cost housing budget. It is equivalent to losing around 10,000 thirty-seat busses, or a whole train (locomotive plus thirty coaches) with ten kilometres of rail from public transportation. At the minimum wage level, it would provide a year’s employment to about one thousand five hundred people. Or, it could provide 9.2 days’ worth of the entire social

South African National Energy Development Institute
2013/05/30
39
grant) One hour of lost electricity is worth seventy four hours of social welfare. MONEYWEB: Garth Zietsman, Consultant Statistician. 17/08/2012
Perhaps the most important aspect of any such power system upgrade is integration. It would be entirely possible to have very advanced systems in place but if there is no integration between these entities on a national or at least an interconnection level, then there is still the potential for another blackout like the last one.
The same holds true for grid planning and energy/power markets. There is no way to optimize the planning of the interconnected power system if each entity does its own planning studies and makes its own recommendations for upgrades. This should be done on an interconnection-wide basis to maximize reliability and minimize cost. All solutions (FACTS, DR, distributed generation, etc) should be considered along with new transmission lines, but this should be done in a coordinated fashion. For wholesale power markets, the efficiency will only increase if there are more participants. The ideal power market would be a single market that spans the entire interconnection, where all loads and all generators have equal access. This would create a more efficient market, better identify needed areas of investment, allow the maximum opportunities to manage or eliminate congestion, and create opportunities for remote generation (like many renewables) to have the highest level of access to end users. In the final analysis, the right combination of new power lines and new technologies will be needed to meet the transmission mission, such as that stated by Eskom
Reliable and efficient, integrated grid operation requires that the resources of all power plants be available, without transmission constraints, to all parts of the system under a wide range of operating conditions and possible future scenarios…in a broad variety of operating and market conditions.
Given that transmission will need to become both smarter and bigger, the ability to build new transmission in a timely manner remains a key strategic issue, especially if large quantities of energy will need to be transported over large distances.
Electric power transmission and distribution losses include losses in energy between sources of supply and points of distribution and in the distribution to customers (these losses also include pilferage). The Electric power transmission and distribution losses in South Africa were 24,280,000,000 kWh in 2009, according to a World Bank report, published in 2010. Electric power transmission and distribution losses (% of output) in South Africa were 9.84 as of 2009. Its highest value over the past 38 years was 10.00% in 2004, while its lowest value was 4.20% in 1986.
12.2 DISTRIBUTION SYSTEM
While it is acknowledged that it is essential to take a holistic industry view, the focus of the current Smart grid Plan is on the distribution component of the electricity supply industry (ESI). Due to the generation challenges, which surfaced during 2007/08, significant attention is given to the generation related challenges. The transmission infrastructure in general performs well and it is underpinned by a well-defined investment plan
9. The latest Eskom annual report
8 results contain the
performance of, amongst others, their transmission system as well as their distribution system. From these results it is clear that the distribution system requires urgent attention. The South African electricity distribution industry (EDI) is confronted by numerous and significant challenges that impact directly on the sustainability of the industry and the ability to provide a reliable service to electricity customers. While the distribution grid has previously served South Africa well in many aspects, the electricity grid is aging, outmoded, and stressed. Estimated maintenance, refurbishment and strengthening backlogs in the distribution network were calculated at R27, 5bn (2008 values) and growing at a rate of R2, 5bn per annum
10. During
2007 the National Energy Regulator of South Africa (NERSA) conducted a survey on the condition of the electricity distribution infrastructure deployed by utilities in the South African electricity distribution industry (EDI)
11. The report on
the state of the EDI infrastructure revealed that in general the assets needed urgent rehabilitation and investment. Unless an immediate and direct intervention is initiated, it will be very difficult to recover the industry from its downward trajectory.
9Eskom 2011.Annual Report. 10EDI Holdings. 2008. Approach to Distribution Asset Management (ADAM) study. 11NERSA.2007. Infrastructure Audit Report.

South African National Energy Development Institute
2013/05/30
40
All indications are that the electricity distribution operating environment will change significantly over the next couple of years. There are various indications, amongst others, such as the introduction of electric vehicles, a drive to enhance the use of renewable energy options, interest in distributed generation and customer involvement, which reinforce the observation in respect of the predicted changes in the industry. Most of the existing distribution grid is not designed to accommodate for example; distributed generation, renewable solutions, or electric vehicles. This should however not be a surprise, since the current grid was not constructed with the 21st century power supply challenges in mind.
The cost to the economy due to electricity/power interruptions cannot be over emphasised. During the latter part of 2007 and the first quarter of 2008 unprecedented power outages because of generation constraints resulted in significant financial losses. An illustration of the situation being that on 25 January 2008 AngloGold Ashanti released a press statement stating: “Following notification from Eskom regarding interruptions to power supplies, AngloGold Ashanti has halted mining and gold recovery operations on all of its South African operations. Only underground emergency pumping work is being carried out. According to Eskom, the current situation arises from reduced generating capacity aggravated by problems associated with coal supplies to power stations caused by unusually heavy rainfall. Eskom has not yet indicated how long the present situation will continue but the company is in contact with the electricity supply body”.
While the availability of a more intelligent grid would not have removed all the challenges, it would have enabled the electricity supply industry (ESI) to better respond to situations such as when generation capacity constraints are experienced. At best, the existing distribution industry in some areas does have view of a portion of the medium voltage networks/grid. However, there are no examples yet of low voltage grid intelligence, which can be deployed, from a system operations perspective or to enhance customer service/interface.
Without investment in the infrastructure and the introduction of intelligence in the grid, the unreliability of the electricity supply will continue. Therefore without the desired interventions, the cost to the economy as well as the end customers because of distribution related outages will continue. Furthermore the current grid is vulnerable to attack (predominantly physical, but potentially also cyber where intelligence is introduced) and natural disaster with limited “self healing” capability.
The demand for electricity is projected to increase substantially towards 2030 and the cost to build new generation is increasing dramatically
12. Electricity prices have increased drastically over the past couple of years and the approved tariff
plan suggests that above inflation increases will continue into the foreseeable future. Without addressing the grid intelligence i.e. making it smarter, the projected economic growth targets are at risk. The current grid and technology deployed cannot support the projected economic growth or respond effectively to the broader dynamics affecting the grid.
South Africa has committed to the declining of CO2 emissions by 2035. To achieve this necessitate a substantial integration of Renewable Energy into the Electricity Network. It is important to note that the distribution grid, which includes all networks/grids operating at the 132kV level and below, will be critical in the realisation of this objective. Without a substantial level of grid intelligence the renewable opportunities cannot be effectively pursued.
Based on a sample of electricity distributor utilities in South Africa, the table below reflects the poor outage management and reliability of supply
13. The results highlight an inability to effectively report on incidents affecting the grid and deficient
management of infrastructure.
Municipality No. of Outages (Monthly) Average downtime per disruption
# 3 0 (Planned) 20 (Unplanned) 3 hrs to 1 week
# 5 20 (Planned) 30 (Unplanned) Planned – < 8 hours Unplanned – < 1 hour
# 11 6 (Planned) 6 (Unplanned) 6 – 48 hours
# 14 8 (Planned) 150 (Unplanned) Not available
# 19 1 (Planned) 3 (Unplanned) ½ hour
# 21 2 1 Hour
12Eskom. 2011. Annual report. 13Source: EDI Holdings, Ringfencing reports. South Africa results

South African National Energy Development Institute
2013/05/30
41
Municipality No. of Outages (Monthly) Average downtime per disruption
# 22 Not available Not available
# 23 1 (Planned) 2 (Unplanned) 2-3 Hours
The inability to effectively manage, control, and report on network dynamics also directly contributes to energy waste, leading to unnecessary CO2 emissions and rising costs. While the reasonable target for combined energy losses should be in the order of 8%, while industry data (refer Figure 15) suggests an average loss of approximately 14%. In the graph below, the KWh purchased refers to the energy procured from Eskom while the KWh sold refers to the energy sold by the respective entity to the end customers. The green line in the graph represents the percentage energy loss between what was purchased by the respective entity for resale and what was ultimately sold to the end customers
14. This graph
highlights the energy savings/improvement opportunity. However without upgrading and adding intelligence to the current grid, it would be very difficult to realise these opportunities.
Figure 15 Electricity industry losses performance data
13 Appendix C: Policy context
A list of relevant legislation and policy that shapes the context for smart grid implementation in South Africa is provided -alphabetically and not order of importance:
Legislation/Policy Description of focus Relevance to Smart Grids, EE, RE, DR, DSM
DME Universal Access Plan, 2004 The South African President in 2004 stated the policy goal of universal access to electricity by 2012 (i.e. universal access plan targets aimed to achieve in roughly 80% access by 2012). This goal requires a significant adjustment of annual connection targets and electrification budgets,based on accurate knowledge of the number of electrified and non-electrified households in South Africa.
Network expansion (and hence investment) is effectively a commitment under this plan. Adequate, accurate and available data is critical to tracking implementation of this plan. The first presents an opportunity to incorporate smart grid elements and the second suggests a need for grid intelligence.
DOE strategic plan The Department’s strategic plan seeks to deliver results along eight strategic objectives that include promoting
Smart grid infrastructure directly supports all the objectives of energy security, reliability, clean and
14 Source: EDI Holdings, Ringfencing reports. South Africa results

South African National Energy Development Institute
2013/05/30
42
Legislation/Policy Description of focus Relevance to Smart Grids, EE, RE, DR, DSM
energy security through reliable, clean, and affordable sources; universal access to energy sources, transformation of the energy sector, and strengthening the operations and management of the Department.
affordable.
DST 10 year innovation plan The grand challenge areas include: • Energy security - the race is on for safe, clean, affordable and reliable energy supply, and South Africa must meet its medium-term energy supply requirements while innovating for the long term in clean coal technologies, nuclear energy, renewable energy and the promise of the “hydrogen economy”. • Global-change science with a focus on climate change.
A smart grid critically serves the identified energy security, reliability, clean energy and climate change challenges.
Energy Efficiency Policy & Strategy, DME 2004
The vision of the strategy is to contribute to affordable energy for all, and to minimise the effects of energy usage on health & the environment. It is implemented through sector programmes
The strategy has no direct reference to a smart grid, but international experience has demonstrated opportunity for big improvements in energy efficiency on the electricity grid and in the energy users’ homes and officeswit the introduction of a smart grid.
Energy Security Master Plan, DME The Master Plan is premised on achieving certain goals that have been set for the electricity sector. Due to the uncertainty over the planning horizon, some assumptions are made regarding demand projections and the economic outlook. After consideration of the Energy White Paper and the regulatory policy framework, the current electricity generation, transmission and distribution sectors are appraised, in terms of the challenges confronting these sectors.
Focused research and development will enable meeting technical performance and capacity expansion objectives. Electricity/energy-based technology development and innovation is imperative to productivity and growth of the country.
Gauteng Integrated Energy Strategy
It aims to improve Gauteng's environment, reduce its contribution to climate change and tackle energy poverty, whilst promoting economic development.
Green Paper on Climate Change Response Strategy
climate change response objective of – * making a fair contribution to the global effort to achieve the stabilisation of greenhouse gas concentrations in the atmosphere at a level that prevents dangerous anthropogenic interference with the climate system; and * effectively adapt to and manage unavoidable and potential damaging climate change impacts through interventions that build and sustain South Africa’s social, economic and environmental resilience and emergency response capacity.
No direct reference, but the smart grid will contribute significantly to data collection and GHG and carbon reporting capability; and is critical to integration of clean energy (RE) and distributed generation into the electricity network.
Industrial Policy Action Plan (IPAP) 2010/11 – 2012/13, published Feb 2010
IPAP 2 Section 13.3 puts emphasis on the development of green industries in South Africa, specifically:
SWH
Wind
Photovoltaic power
Concentrated Solar Thermal power
Industrial Energy Efficiency
Water efficiency
Waste Management
Biomass and waste management
Energy-efficient vehicles
All listed green industry priority areas would be supported by and might rely heavily (e.g. energy efficient vehicles, integration of RE and utility services (waste, water and energy) integration) on a smart grid.
Integrated Resource Plan for Energy, 2010
This Policy-Adjusted IRP is recommended for adoption by Cabinet and for subsequent promulgation as the final IRP. This proposal is a confirmation of the RBS in that it ensures security of supply. It is a major step towards building local industry clusters and assists in fulfilling
Section 7 - Research Agenda for Next IRP Distributed generation, smart grid and off-grid generation Harnessing South Africa’s coal resource Decommissioning and waste management

South African National Energy Development Institute
2013/05/30
43
Legislation/Policy Description of focus Relevance to Smart Grids, EE, RE, DR, DSM
South Africa’s commitments to mitigating climate change as expressed at the Copenhagen climate change summit. The Policy-Adjusted IRP includes the same amount of coal and nuclear new builds as the RBS, while reflecting recent developments with respect to prices for renewables. In addition to all existing and committed power plants (including 10 GW committed coal), the plan includes 9,6 GW of nuclear; 6,3 GW of coal; 17,8 GW of renewables; and 8,9 GW of other generation sources.
Technology options * Small hydro * Regional hydro options (specifically Inga) * Biomass (including municipal solid waste and bagasse) * Storage; and * Energy efficiency demand side management Vision for 2050 Uncertainty & Risk factors
Long-Term Mitigation Scenarios, DEAT, October 2007
Develops scenarios to mitigate greenhouse gas emission and forms the basis of South Africa’s national mitigation policy direction.
The LTMS recognizes the importance of a low carbon future and provides an indication of the effort that has to be extended into changing the energy mix and economic activity of South Africa to achieve the required reduction in carbon.
National Energy Act, 2008 To ensure that diverse energy resources are available, in sustainable quantities and at affordable prices, to the South African economy in support of economic growth and poverty alleviation, taking into account environmental management requirements, international commitments and obligations and interactions amongst economic sectors; to establish institutions to be responsible for promotion of efficient generation and consumption of energy, energy modelling and planning, increased generation and consumption of renewable energies, energy research, contingency energy supply, holding of strategic energy minerals, adequate investment in, appropriate upkeep of and equitable access to energy infrastructure; to provide measures for the furnishing of certain data and information regarding energy demand, supply and generation; and to provide for matters connected therewith.
Chapter 4 focuses on the establishment of SANEDI. The institute is intended to: • Promote energy efficiency in the economy. • Increase the gdp per unit of energy consumed • Ensure energy resources used in optimal manner • Promote energy research and technology innovation • Increase players in the energy field • Facilitate effective management of energy demand and its conservation
National Energy Efficiency Strategy of the RSA
This Strategy allows for the immediate implementation of low-cost and no-cost interventions, as well as those higher-cost measures with short payback periods. These will be followed by medium-term and longer-term investment opportunities in energy efficiency. The Strategy acknowledges that there exists significant potential for energy efficiency improvements across all sectors of our national economy.
The South African National Energy Research Institute will be funded to carry out a dedicated programme of research and development for energy efficiency. The Strategy will support appropriate research and the possible adaptation of internationally available technologies and processes.
Occupational Health and Safety Act (No. 85 of 1993 ), Amended 2008 and Electrical Installation Regulations, 2009
The focus of the Act is to provide for the health and safety of persons at work and for the health and safety of persons in connection with the use of plant and machinery; the protection of persons other than persons at work against hazards to health and safety arising out of or in connection with the activities of persons at work; to establish an advisory council for occupational health and safety; and to provide for matters connected therewith.
The smart grid offers benefits for improved employee safety.
New unfamiliar technologies do however bring safety concerns, necessitating a focused effort on training and change management to ensure employee safety.
White Paper on Renewable Energy, November 2003
Sets out Government’s vision, policy principles, strategic goals and objectives for promoting and implementing renewable energy in South Africa. Establishes the basic framework within which the renewable energy industry can operate and grow. Provides an overview of the renewable energy resource of the country in a simplified
manner.
The white paper sets ambitious national targets for the introduction of RE into the national grid. It also identifies five key strategic areas to creating an enabling environment, including technology development. Smart grid technology is widely recognised as key to integrating variable power sources such as RE into the electricity network.
South African National Energy Development Institute
2013/05/30
44
14 Appendix D: Interpreting technology hype
As provided by Gartner.
Gartner Hype Cycles provide a graphic representation of the maturity and adoption of technologies and applications, and how they are potentially relevant to solving real business problems and exploiting new opportunities. Gartner Hype Cycle methodology provides a view of how a technology or application will evolve over time, providing a sound source of insight to manage its deployment within the context of specific business goals.
Each Hype Cycle drills down into the five key phases of a technology’s life cycle.
Technology Trigger: A potential technology breakthrough kicks things off. Early proof-of-concept stories and media interest trigger significant publicity. Often no usable products exist and commercial viability is unproven.
Peak of Inflated Expectations: Early publicity produces a number of success stories—often accompanied by scores of failures. Some companies take action; many do not.
Trough of Disillusionment: Interest wanes as experiments and implementations fail to deliver. Producers of the technology shake out or fail. Investments continue only if the surviving providers improve their products to the satisfaction of early adopters.
Slope of Enlightenment: More instances of how the technology can benefit the enterprise start to crystallize and become more widely understood. Second- and third-generation products appear from technology providers. More enterprises fund pilots; conservative companies remain cautious.
Plateau of Productivity: Mainstream adoption starts to take off. Criteria for assessing provider viability are more clearly defined. The technology’s broad market applicability and relevance are clearly paying off.

South African National Energy Development Institute
2013/05/30
45
15 Appendix E: Metrics
Metrics should serve to gauge the impact of the smart grid and guide adjustments and refinements to improve the contribution of the smart grid. The following should be given consideration in developing the comprehensive metrics in support of the stated smart grid objectives (Section 5.1):
Peak demand reduction for system and energy efficiency: Smart grid technologies of AMI, energy management systems, and grid-responsive devices and appliances coupled with dynamic pricing programmes will enable informed customer participation in demand response, as a key focus for peak demand reduction. Key performance measures include cyber security standards for smart metering to address security concerns at all stages of AMI deployments, development of smart appliances responsive to grid conditions and pricing signals, feasibility demonstration of peak demand reduction at select prototypical feeders, and an interim measure to track the progress trend toward the Vision targets.
Grid reliability & resilience: Distribution/feeder automation, micro-grid, and modelling tools will enable advanced distribution operations to reduce outage durations and frequencies, provide fast responses to outage events, and provide the differentiated reliability services to meet individual customer needs. Key performance measures include simulation tool development and integration of models into an operational distribution management system for planning/outage management/customer information services, and feasibility demonstrations of advanced distribution operational designs (adaptive circuit reconfiguration, distributed energy storage, and micro-grids) to provide differentiated reliability services and critical load protection.
Operational and system efficiency: Dynamic sensing, monitoring, and control technologies will reduce energy losses and enhance utilisation of available assets, all driving to improve the overall load factor. Key performance measures include a near-term reduction in line losses through conservation voltage reduction, smart chargers with grid awareness to charge PHEVs at off-peak periods according to customer choice, and diagnostic tools for condition-based maintenance to reduce the O&M costs.
Distributed and renewable energy integration for increased reliability, efficiency, and system security: Standards, voltage regulation, and protection coordination schemes are critically important for high penetration levels (>15%, as a rule of thumb) of distributed generation into the grid. Key performance measures include development of voltage regulation conditioners to address variability of renewable generation, protection solutions at both the utility and customer sides for voltage and frequency deviations under conditions where the distributed generation capacity varies with respect to the connected loads, and DC distribution architectures for buildings or communities to connect DC generation sources directly with DC loads.
Public and worker safety: The grid through its advance sensors will provide the utility solutions for managing potential risk to both the utility and public. These would involve detection of contact incidents at substation level with feeder identification capability, detection of dead-side return (“back-feed”) to broken conductors with the load side on the ground is a particular & significant problem, embedded technologies to improve present working practices by real time work management systems and isolation of faults to limit potential risk on public.

South African National Energy Development Institute
2013/05/30
46
16 Appendix F: Case studies
To develop and deploy a smart grid will add to the immediate investment requirements of the ESI, but if implemented pragmatically it should provide operational efficiencies and enhanced capabilities that will outweigh the additional costs.
Examples in Italy and the USA illustrate this experience with costs and benefits:
16.1 ITALY - FOCUS ON SERVICE DELIVERY AND COST REDUCTIONS
The Italian smart grid system (Telegestore), installed by Enel S.p.A. of Italy, could be regarded as one of the first smart grid deployments in the world. The installation was completed in 2005 at a project cost of 2.1 billion Euro. This project is providing an annual return of 500 million Euro and significant additional, non-quantified business and customer benefits are claimed. This resulted in a payback period of just more than 4 years.
The Telegestore system incorporates smart metering, network automation, workforce management, including all workers with hand-held tablet communications devices, and asset management. Around a quarter of all the company’s secondary substations are now remotely controlled, enabling much earlier interventions to correct faults. At the time of the case study compiled by PWC, the associated service level improvements were reported as: “supply interruptions being cut from 128 minutes in 2001 to 50 minutes in 2008 which, while it is still not comparable with some other countries, is quite good given the state of the network in Italy.”
Enel reported a reduction in operational costs from 80 Euro per customer in 2001 to 49 Euro per customer in 2008 and ascribed this cost reduction largely to the introduction of the Telegestore system.
Another benefit has been that smart meters have enabled a more flexible tariff structure, with bi-hourly or flexible tariffs, day and night, peak and non-peak, etc. so that customers can save money and adapt their energy usage to fit supply circumstances.
16.2 SAN DIEGO, USA – COMPREHENSIVE SMART GRID IMPLEMENTATION
The smart grid roll out in San Diego reportedly has a project cost of 490 million US Dollars and an annual operation and maintenance cost of 24 million US Dollars. The total annual benefit of this project is 14 million US Dollars with projected benefits of 1,433 million over 20 years and social benefits to the value of 1,369 million US Dollars.
The San Diego Gas and Electric (SDG&E) smart grid programme (for which utility was awarded the Power 2012 smart grid award) “empowers customers, increases renewable generation, integrates plug-in electric vehicles (PEVs) and reduces greenhouse gas emissions while maintaining and improving system reliability, operational efficiency, security and customer privacy.”
With this programme, the utility is aiming to enable a “smart customer” that is able to make more choices and have more control over energy decisions, a “smart utility” that manages a host of ever-advancing supply- and demand-side resources and the grid that integrates the two parties, and a “smart market” for customers and energy suppliers that preserves power quality and reliability on the grid while increasing price transparency.
The San Diego smart grid rollout has been extensive. All customer meters (1.4 million electric and 850,000 gas) have been upgraded. 18,000 rooftop solar units totalling 138 MW (3% of peak demand) have been installed and integrated. 1,600 PEVs are driving around town and plugging-in at various charging stations. On top of this, a host of other less-visible advancements (e.g.extensive deployment of updated SCADA systems, weather sensors, wireless communications infrastructure) are bringing the grid in San Diego out of the 20th Century and into the 21st Century.
All of this will help SDG&E meet the goal of supplying 33% of its electricity from renewable (mostly intermittent) sources while also accommodating potentially 200,000 PEVs by 2020,which would be difficult if not impossible to achieve without advanced technologies such as those being deployed as part of the smart grid programme.

South African National Energy Development Institute
2013/05/30
47
16.3 CALIFORNIA, USA – FOCUS ON SECURITY OF SUPPLY AND COST SAVING
In California, Pacific Gas & Electric’s drive to rollout smart metering (the initial focus) was prompted mainly by the experience of rolling blackouts in 2000 and 2001. Blackouts occurred on summer days when peak load was at its highest and demand exceeded supply. There were ways to interact with commercial customers who drew the heaviest loads by offering them demand programmes but, without smart meters, it was not possible to have a more dynamic way of managing demand from small commercial and residential customers.
Since 2001 a SmartRate tariff has been introduced with 25,000 residential customers active in the programme resulting in 16% peak demand savings on critical summer days.
Pacific Gas &Electric’s full deployment plan is a seven-year programme that will deliver substantial benefits. Operational cost savings of US$170 million associated with savings in meter reading and management costs as well as reduced revenue losses arising from older, inaccurate meters are anticipated with full implementation.