slrd area b, district of lillooet · slrd area b, district of lillooet & st’at’imc...
TRANSCRIPT

0
SLRD Area B, District of Lillooet
& St’at’imc
Agricultural Plan
Part 1: Background Report
February 28, 2014
1
Table of Contents
Acknowledgements ....................................................................................................................................... 1
Acronyms ...................................................................................................................................................... 2
Introduction .................................................................................................................................................. 3
Intent of Agricultural Plans ....................................................................................................................... 3
A Definition of Agriculture ........................................................................................................................ 3
The Agricultural Plan Process .................................................................................................................... 4
Methodology – Stakeholder Consultation .................................................................................................... 5
Engaging the St’at’imc Community ....................................................................................................... 6
Open Houses ......................................................................................................................................... 6
Technical Workshop .............................................................................................................................. 7
Three Surveys (Farmers, St’at’imc Members, Community Members) ................................................. 7
Stakeholder Interviews ............................................................................................................................. 7
Agricultural Stakeholder Interviews ..................................................................................................... 7
St’at’imc Stakeholder Interviews .......................................................................................................... 8
General context review ............................................................................................................................... 10
Community Overview ............................................................................................................................. 10
Planning Context ..................................................................................................................................... 10
Weather and Climate .............................................................................................................................. 11
Climate Change ....................................................................................................................................... 12
Water Resources ....................................................................................................................................... 1
Agricultural Capability ................................................................................................................................... 2
Growing Degree Days................................................................................................................................ 2
A Snapshot of Agriculture in Lillooet ........................................................................................................... 4
Farm Practices ........................................................................................................................................... 5
Farm Valuation .......................................................................................................................................... 6
Preliminary Market Opportunities Analysis .................................................................................................. 8
Capacity for Market Expansion ................................................................................................................. 8
Discussion of Key Economic Opportunity Issues ...................................................................................... 9
1. Cost of Land and Inputs .................................................................................................................. 10
2
2. St’at’imc Partnerships and Initiatives ............................................................................................. 11
3. Water .............................................................................................................................................. 12
4. Wildlife ............................................................................................................................................ 12
5. Economies of Scale and Product Diversification ............................................................................. 13
Spotlight on the Cattle Industry .......................................................................................................... 14
Spotlight on Viticulture ....................................................................................................................... 15
6. Labour ............................................................................................................................................. 16
7. Processing and Value-Added Infrastructure ................................................................................... 17
8. Transportation and Distribution ..................................................................................................... 18
9. Marketing and Sales ........................................................................................................................ 19
10. Consumer Awareness and Education ........................................................................................... 20
Summary of Opportunities and Challenges ............................................................................................ 22
References .................................................................................................................................................. 25
Appendix ....................................................................................................................................................... 0
I. Survey Results ........................................................................................................................................ 0
II. Notes from the Technical Workshop on November 6th, 2013 .................................................................. 4
III. Discussion of Land Use Policies and Regulations ..................................................................................... 7
Local and Regional Plans ......................................................................................................................... 13
St’at’imc Preliminary Draft Land Use Plan .......................................................................................... 13
The Lillooet Land Resource Management Plan (LRMP) ...................................................................... 14
The SLRD Integrated Sustainability Plan (ISP) ..................................................................................... 15
Regional Growth Strategy ................................................................................................................... 16
District of Lillooet Official Community Plan ........................................................................................ 17
SLRD Area B OCP Bylaw No. 1073 (2008)................................................................................................ 19
SLRD Areas A and B Zoning Bylaw, No. 670 ........................................................................................ 20
District of Lillooet Zoning Bylaw No. 400, 2011 .................................................................................. 21
IV. Agricultural Census Data for Area B .................................................................................................. 25
Agricultural Land Use: Number of Farms, Farming Area, and Crop and Livestock Production .......... 25
Farm Practices ..................................................................................................................................... 27
Farm Business Data ............................................................................................................................. 28
V. Soils and Agricultural Capability ............................................................................................................. 32
Surficial Geology ................................................................................................................................. 32

3
Soil Types ............................................................................................................................................ 32
Agricultural Capability Ratings ............................................................................................................ 32
Soil Groupings ..................................................................................................................................... 33
VI Lilllooet news article about Blue Goose ................................................................................................. 36
Historic Diamond S Ranch sold: New owner is Blue Goose Cattle Company ............................................. 36
4
List of Tables
Table 1. List of policy documents reviewed. ............................................................................................... 11
Table 2. Weather characteristics in Lillooet (Environment Canada, 2014). ............................................... 12
Table 3. Potential impacts of climate change on agriculture (adapted from CAIBC, 2012). ...................... 12
Table 4. Climate Projections for the SLRD in the 2020s, 2050s, and 2080s (PCICS, 2012). .......................... 0
Table 5. Aquifers in the Lillooet and Seton Portage areas (BC Water Resources Atlas, 2013). .................... 1
Table 6. Growing Degree Days (GDDs) for the Lillooet Area (Environment Canada, 2013). ........................ 3
Table 7. Land tenure arrangements for farms in SLRD Electoral Areas A & B. ............................................. 4
Table 8. Crop production in SLRD Electoral Areas A & B. ............................................................................. 5
Table 9. Farms in the SLRD Electoral Areas A & B reporting Best Management Practices. ......................... 6
Table 10. Farm capital values in SLRD Electoral Area B. ............................................................................... 6
Table 11. Farm expenses in the SLRD Electoral Areas A & B. ....................................................................... 7
Table 12. Gross farm receipts and gross margin........................................................................................... 7
Table 13. Average revenue per farm and per hectare. ................................................................................. 7
List of Figures Figure 1. Location of existing wells in the greater Lillooet Area (BC Water Resources Atlas, 2013). ........... 1
Figure 2. List of issues identified by local producers (Agricultural Plan survey, 2013). .............................. 10
1
Acknowledgements The Squamish Lillooet Area B Agricultural Plan is a strategy and policy framework document, resulting from a regional planning initiative led by the Squamish Lillooet Regional District (SLRD) in collaboration with: Ione Smith, P.Ag. Upland Consulting Andrea Lawseth, P.Ag. AEL Agroecological Consulting Joel Liman Drawing it Out the “Consulting Team” Yolanda Liman Drawing it Out Lisa Pedrini New Leaf Consulting The project was initiated and coordinated by the SLRD Planning Department, which included securing a 50/50 match funding agreement with the Investment Agriculture Foundation of BC. Project coordination, key input into the plan, and in-kind support were provided by the Working Group. Local citizens, stakeholders and participants of public meetings and focus groups provided invaluable input and feedback, for which the authors express much gratitude. Funding provided by the Investment Agriculture Foundation of B.C. (IAF) was through programs it delivers on behalf of Agriculture and Agri‐Food Canada (AAFC) and the BC Ministry of Agriculture and Lands. The IAF states: “Agriculture and Agri‐Food Canada (AAFC), the BC Ministry of Agriculture (AGRI), and the Investment
Agriculture Foundation of BC (IAF), are pleased to participate in the production and delivery of this project. We are committed to working with our industry partners to address issues of importance to the agriculture and agri‐food industry in British Columbia. Opinions expressed in this publication are those of the authors, etc. and not necessarily those of AAFC, AGRI, or IAF.”
2
Acronyms AAC Agricultural Advisory Committee
AAFC Agriculture and Agri-Food Canada
AGRI BC Ministry of Agriculture
ALC Agricultural Land Commission
ALR Agricultural Land Reserve
ARDCorp Agriculture Research and Development Corporation
BCAA BC Assessment Authority
BCAC BC Agriculture Council
BCCA BC Cattleman’s Association
BCCDC BC Centre for Disease Control
BCEMB BC Egg Marketing Board
BCMH BC Ministry of Health
BCMMB BC Milk Marketing Board
BC MPA BC Milk Producers Association
BCMoE BC Ministry of Environment
BCMSCD Ministry of Community, Sport, and Cultural Development
BSE Bovine Spongiform Encephalopathy
CFIA Canadian Food Inspection Agency
CLI Canadian Land Inventory
CSA Community Supported Agriculture
DPA Development Permit Area
DoL District of Lillooet
FIRB Farm Industry Review Board
FPPA Farm Practices Protection (Right to Farm) Act
IAF Investment Agriculture Foundation of BC
IHA Interior Health Authority
LGA Local Government Act
LTSA Land Title and Survey Authority of BC
LUI Land Use Inventory
MIR Meat Inspection Regulation
OCP Official Community Plan
PHSA Provincial Health Services Authority
REF Real Estate Foundation
SGS St’at’imc Government Services
SLRD Squamish Lillooet Regional District
SSFPA Small Scale Food Processor Association
UBCM Union of BC Municipalities
WWOOF Willing Workers on Organic Farms
3
Introduction
Intent of Agricultural Plans Recognizing agriculture as the highest and best use of agricultural land, Agricultural Plans focus on developing strategies to support a viable agricultural industry at the local level (Smith, 1998). These plans may be integrated into regional and local plans, and provide a forum for discussion concerning issues relevant to farming and the local food system. A food system is local when it allows farmers, processors, distributors, retailers, and their customers to interact face-to-face. This SLRD Area B Agricultural Plan was developed with the support and partnership of the District of Lillooet and the St’at’imc community, as it pertains to an area encompassed within the St’at’imc Northern Territory. This Agricultural Plan is unique amongst agricultural plans in BC in the fact that it was developed with extensive input from local First Nations community members. It is important to note that the Supreme Court of Canada has affirmed that Aboriginal Title continues to exist in British Columbia, that Aboriginal Title is an inherent right to the land itself, and includes the right to choose the uses to which the land is put. Aboriginal rights and title exist in BC and receive protection under Section 35(1) of the Constitution Act (1982). This Agricultural Plan will not limit treaty negotiations and settlements. Respecting the St’át’imc Vision and Principles by adhering to St’át’imc law and the Nxekmenlhkálha lti tmícwa (St’át’imc Land Use Plan), including the preliminary draft land use plan, are key steps necessary to accommodate St’át’imc Title and Rights.
A Definition of Agriculture
It can be difficult for any community to agree upon the terms used to describe food production at a local level. Definitions outlined by dictionaries, Statistics Canada, and the BC Assessment Authority (BCAA) help to provide a starting point for discussion. “Agriculture” according to the Merriam Webster dictionary:
The science, art, or practice of cultivating the soil, producing crops, and raising livestock and in varying degrees the preparation and marketing of the resulting products.
A “census farm” as described by Statistics Canada:
an agricultural operation that produces at least one of the following products intended for sale: crops (hay, field crops, tree fruits or nuts, berries or grapes, vegetables, seed); livestock (cattle, pigs, sheep, horses, game animals, other livestock); poultry (hens, chickens, turkeys, chicks, game birds, other poultry); animal products (milk or cream, eggs, wool, furs, meat); or other agricultural products (Christmas trees, greenhouse or nursery products, mushrooms, sod, honey, maple syrup products).
In the Agricultural Census, an agricultural operation is defined as: “a farm, ranch or other operation that produces agricultural products intended for sale.”

4
Farm status (or farm class) as determined by BCAA: a) land used for a qualifying agricultural use; b) land used for a purpose that contributes to a qualifying agricultural use; c) land used for a farmer’s dwelling; d) land in an agricultural land reserve (ALR) that is used for a retired farmer’s dwelling; e) land used for the training and boarding of horses when operated in conjunction with horse
rearing; and f) in some cases, vacant land associated with a farm.
A combination of the above-mentioned definitions, the project Terms of Reference, and discussions with farmers and other stakeholders were used to ensure that a variety of levels and types of food production were captured both in the Agricultural Plan to accurately reflect food production occurring in SLRD’s Area B and surrounding area.
The Agricultural Plan Process
The SLRD Planning Department developed the Agricultural Plan collaboratively with the consulting team, and the Agricultural Plan Working Group. At the outset of the Agricultural Plan, the goals of the process were determined to be to:
1. identify opportunities to strengthen farming and agricultural practices; 2. establish clear policies that serve to protect and promote agriculture, agricultural land; and, 3. contribute to local and regional food security and the community's long-term sustainability.
Specific objectives of the Agricultural Plan were to:
1. complete an inventory of lands, and water usage (under separate contract with the Ministry of Agriculture),
2. communicate with farmers to discover strengths, weaknesses, opportunities and threats affecting the agricultural industry and draw on the historic capacity and capabilities of the region,
3. engage St'at'imc Communities in the agricultural planning process, 4. conduct a market opportunities analysis for agricultural crops and products and, 5. propose policy on a wide range of issues to be determined that may include:
criteria to evaluate the various forms of Agricultural Land Commission applications (ALR exclusions, non-farm uses, and ALR subdivisions),
ways to support agriculture,
land uses ancillary to agriculture that will be supported;
land uses to be discouraged, and,
ways to implement and monitor progress of the plan
help those in the agricultural sector learn and implement best practices for agricultural business growth.
5
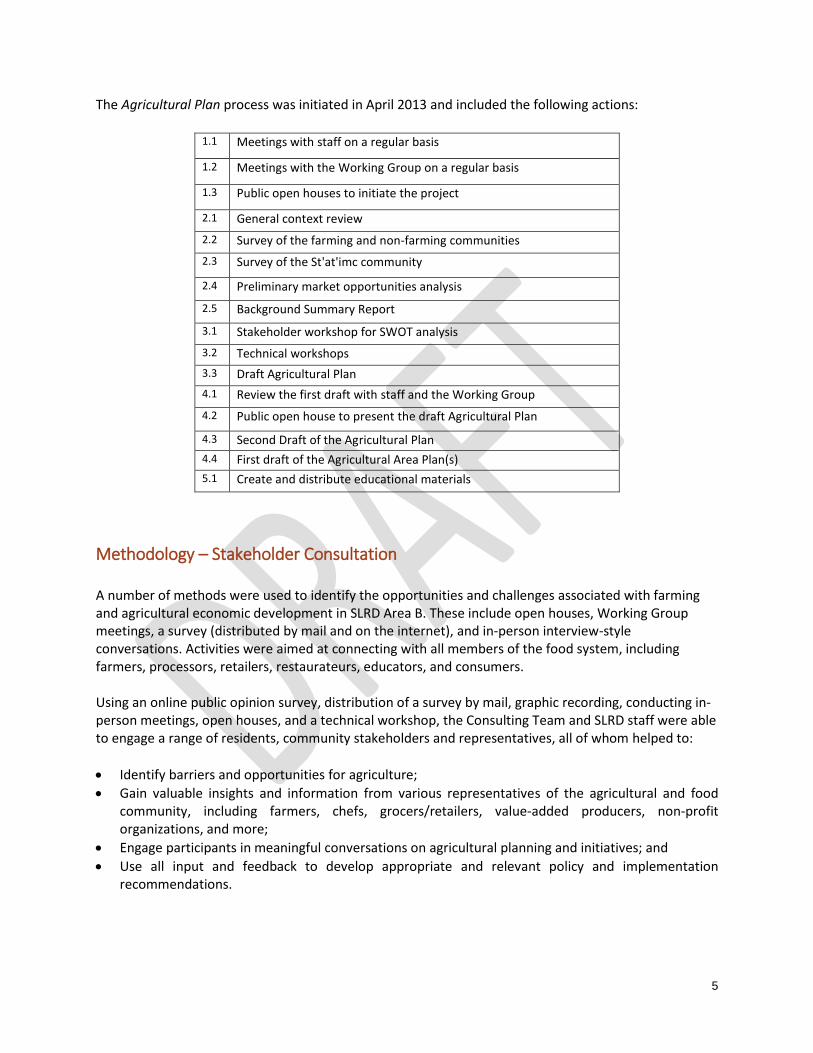
The Agricultural Plan process was initiated in April 2013 and included the following actions:
1.1 Meetings with staff on a regular basis
1.2 Meetings with the Working Group on a regular basis
1.3 Public open houses to initiate the project
2.1 General context review
2.2 Survey of the farming and non-farming communities
2.3 Survey of the St'at'imc community
2.4 Preliminary market opportunities analysis
2.5 Background Summary Report
3.1 Stakeholder workshop for SWOT analysis
3.2 Technical workshops
3.3 Draft Agricultural Plan
4.1 Review the first draft with staff and the Working Group
4.2 Public open house to present the draft Agricultural Plan
4.3 Second Draft of the Agricultural Plan
4.4 First draft of the Agricultural Area Plan(s)
5.1 Create and distribute educational materials
Methodology – Stakeholder Consultation A number of methods were used to identify the opportunities and challenges associated with farming and agricultural economic development in SLRD Area B. These include open houses, Working Group meetings, a survey (distributed by mail and on the internet), and in-person interview-style conversations. Activities were aimed at connecting with all members of the food system, including farmers, processors, retailers, restaurateurs, educators, and consumers. Using an online public opinion survey, distribution of a survey by mail, graphic recording, conducting in-person meetings, open houses, and a technical workshop, the Consulting Team and SLRD staff were able to engage a range of residents, community stakeholders and representatives, all of whom helped to:
Identify barriers and opportunities for agriculture;
Gain valuable insights and information from various representatives of the agricultural and food community, including farmers, chefs, grocers/retailers, value-added producers, non-profit organizations, and more;
Engage participants in meaningful conversations on agricultural planning and initiatives; and
Use all input and feedback to develop appropriate and relevant policy and implementation recommendations.

6
[INSERT GRAPHIC SHOWING KEY STAKEHOLDERS – PARTS OF THE FOOD SYSTEM] The public consultation process began in the spring of 2013 and continued throughout all stages of developing the Agricultural Plan, and will need to continue into the subsequent implementation stages.
Engaging the St’at’imc Community
A concerted effort was made to communicate and build relationships with the St’at’imc community. The St’at’imc Government Services (SGS) provided leadership for this process through their direct involvement on the Agricultural Plan Working Group. In direct consultation with the Intergovernmental Advisor for SGS, the consulting team settled on a multi-faceted approach to engage the Northern St’at’imc bands located within SLRD Area B. This involved developing a separate survey for St’at’imc members, attending St’at’imc events, and conducting interviews and focus groups with key representatives from these communities. These individuals were mainly comprised of representatives of the Northern St’at’imc governments including some Chiefs and Council members, economic development officers, natural resource coordinators, and project managers working on agricultural and environmental initiatives. The consulting team made efforts whenever possible to meet with St’at’imc members and leaders face-to-face within their community and at St’at’imc events. These meetings included a personal tour of Split Rock Environmental, attending the SEED symposium in June 2013, attending the Apricot Festival in 2013, and making a presentation on the Agricultural Plan at the Agriculture-Agroforestry Forum at the Cayoosh Creek Band Office on December 11, 2013. Each engagement opportunity with the St’at’imc community intended to assess their unique vision for agriculture in the region. This included their vision for agricultural development in the region and some of the challenges which community members associate with the expansion of agriculture.
Open Houses
Open Houses were held on June 20th and 21st 2013 to launch the Agriculture Plan. Members of the Agriculture Plan Working Group and the consulting team were on hand to greet community members at the Lillooet Rec Centre on the afternoon of June 20th in conjunction with the St’at’imc SEED symposium, and had a table at the Farmers Market on Friday June 21st. The purpose of the open houses were to introduce the Agriculture Plan’s goals and timeline to the public and start connecting with farmers and community members. Surveys were distributed to gain feedback around a vision for agriculture and food security and to identify key challenges and opportunities for food producers and consumers in the region. Approximately 35 people came to the June 20th event, which had great crossover attendance from the SEEDS symposium, and another 60-70 people came by the information table at the Farmers Market on the 21st. A second round of open houses were held on April 4th and 5th to introduce the Draft Agricultural Plan to the public.
7
Technical Workshop
On November 6th 2013, twenty-six people from the Lillooet, SLRD Area ‘B’, and St’at’imc Northern territory gathered to discuss opportunities for agricultural economic development in the region. Attendees included a mix of farmers, ranchers, First Nations members, and local government elected officials. Four guest speakers were featured: two joined to workshop virtually and two presented in person. After each guest speaker a small group discussion ensued to explore applicability of the issue to the Lillooet, SLRD Area B, and St’at’imc northern territory. A summary of speakers and their presentations as well as key points raised during the discussion period after each speaker is included in the Appendix.
Three Surveys (Farmers, St’at’imc Members, Community Members)
The Consulting Team collaborated with SLRD Staff and the Working Group to develop three surveys on food matters and agricultural development opportunities. The three surveys were developed to best target the interests of
Farmers
St’at’imc members
Community members Hard copies of the survey were distributed in person at the June 2013 open houses, made available at the Lillooet library, and were mailed to ranchers including self-addressed and stamped return envelopes to encourage completions rates. The surveys were also made available online to enable members of the interested public to provide input on a range of key issues outside of, or in addition to, formal meetings and public events. The survey received 130 responses between early August and the end of October 2013, which was well above the expected response level of 100 completed surveys. A total of 42 farmers, 22 St’at’imc members, and 66 Non-farming community members responded. Input received was used to develop the list of issues and priorities for the Market Opportunities Analysis and to refine the list of recommended actions. It is important to note that the survey participants do not represent a random sample due to the fact that they were able to self-select on their choice to fill out the survey (i.e. participation was voluntary), therefore results are not statistically significant. Full results from the public opinion survey can be found in the Appendix.
Stakeholder Interviews
Agricultural Stakeholder Interviews
The objectives for the stakeholder interviews were as follows:
Identify relationship-building opportunities between larger agricultural operations and smaller farms in order to craft recommendations for the Agricultural Plan;
8
Gain a better overview of the amount of funding and investment being leveraged towards agricultural projects in Lillooet and SLRD Area B;
Determine what plans for future value-added processing and distribution may exist; and
Gain a clearer picture of the level of economic development occurring in the local agricultural sector.
List of agricultural interviewees:
1. Sam Quinlan (Bitterbine Hops) 2. Ed Nichols (Country Store Grocery) 3. Rolf de Bruin (Fort Berens Winery) 4. Eckhard Zeidler (Texas Creek Ranch) 5. Kevin Boon (BC Cattlemen’s Association) 6. Randy Porter (Ashcroft Desert Hills Ranch) 7. Bob Sheridan (Buy Low Foods) * by phone
Efforts were made to contact Blue Goose Pure Foods multiple times with no success. Representatives have agreed to provide written answers to interview questions, however these have not been received as of the date of writing this report. A copy of an article from the local Lillooet News is included in the Appendix that provides some basic information about their plans. All detailed interview notes are provided in the Appendix.
St’at’imc Stakeholder Interviews
There were twelve interviews conducted with key St’at’imc community members aimed to identify appropriate roles for agriculture and food production in the Northern St’at’imc territory. Because of the unique vision the St’at’imc community has regarding tradition food harvesting, effort was made to reach community members whose interests extended beyond traditional agricultural production and into complimentary areas of agroforestry, natural products, community development, and cultural programming. These interviews attempted to gain in-depth insight into areas of complimentary practice with regional agricultural producers. In addition the interviews attempted to highlight areas of consideration where increased agricultural production could raise concerns about St’at’imc Rights & Title, ecological sustainability, and cultural heritage. The list of St’at’imc Interviewees included:
Chief Michelle Williams – Chief - Sekw’el’wás First Nation
Chief Kevin Whitney – Chief - T'it'q'et First Nation
Desmond Peters Jr – Lands Manager - Ts'kw'aylaxw First Nation
Gerald Michel – Lands Coordinator - Xwisten First Nation
Matt Manuel –Natural Resources Coordinator – Lillooet Tribal Council
Andra Forney – Community Forest Manager – Xaxlip Community Forest
Susannah Tedesco – Arts and Education Program Coordinator -Ucwalmicw Centre, T'it'q'et First Nation
Kim North – Project Manager –Splitrock Environmental - Sekw’el’wás First Nation
Jim McArthur – Intergovernmental Advisor – St’at’imc Government Services

9
Sue Senger – Wildlife and Lands Coordinator - St’at’imc Government Services
Denise Antoine – Wildlife and Lands Assistant -St’at’imc Government Services
Tamara Rampanen – Education Coordinator - St’at’imc Government Services
10
General context review
Community Overview The St’át’imc are the original inhabitants of the territory which extends north to Churn Creek and south to French Bar; northwest to the headwaters of Bridge River; north and east toward Hat Creek Valley; east to the Big Slide; south to the island on Harrison Lake and west of the Fraser River to the headwaters of Lillooet River, Ryan River and Black Tusk. Within SLRD Area B there are several communities or neighbourhoods:
T'ít'q'et (Lillooet)
Tsalalh (Seton Portage) – Shalalth,
Yalakom Valley,
Xwisten (Bridge River/West Pavilion),
Sekw'el'was (Cayoose Creek),
Texas Creek,
Xaxl’ip (Fountain),
Ts’kw’aylaxw (Pavilion), and
the Duffey Lake Corridor. These communities and the surrounding area encompass 3,461 square kilometres of land. SLRD Area B surrounds one incorporated municipality, the District of Lillooet, which functions as the main economic hub and service centre for the communities. Neighbouring jurisdictions include the Thompson Nicola Regional District to the north and the east, and the Cariboo Regional District to the north. Electoral Area B is home to approximately 1,750 people. 2006 Statistics Canada data reports that approximately 600 of those people are living outside of Indian Reserves (IR), and 1100 are living within IRs. The total population of the District of Lillooet, the closest service centre for residents of Area B, was 2,367 in 2011. Lillooet’s population in 2001 was 2,741, representing a decline of 15.2 per cent between 2001 and 2006. According to the Official Community Plan (OCP) for SLRD Area B, lands with agricultural potential are primarily located on the benches above the Fraser River and in the neighbourhoods of Texas Creek, Fountain, Pavilion Lake, West Pavilion, and the Yalakom Valley. The majority of these lands, with the exception of the Yalakom Valley, are designated as Agricultural Land Reserve (ALR). ALR lands are regulated by the Agricultural Land Commission (ALC). The mandate of the ALC is to preserve agricultural land and encourage the establishment and maintenance of farms.
Planning Context
Community planning occurs within a context of enabling legislation such as the Local Government Act that provides for policy plans, regulations in zoning or land use bylaws, and processes such as development permits. Across the SLRD, the promotion of the local agricultural industry is supported through various high level policy documents and regional initiatives which acknowledge and address the importance of protecting agriculturally viable land, planning for local food security, and

11
encouraging/facilitating local economic development opportunities. These high level policy documents and regional initiatives include the SLRD Integrated Sustainability Plan (ISP), the SLRD Regional Growth Strategy (RGS), the SLRD Energy Resilience Task Force, and the District of Lillooet Official Community Plan and Zoning Bylaw and the Electoral Area B Official Community Plan and Zoning Bylaw. The manner in which agriculture is considered at the policy level through land use plans in the RGS and OCPs, and subsequently through land use regulations in the zoning bylaws, is indicative of a regional government’s priorities in terms of supporting future agricultural activity. The RGS and OCPs provide a long term strategy for land use, development and servicing, and they contain development guidelines, which respond to broad community objectives and values. In contrast, a zoning bylaw provides detailed land use regulations according to specific land use categories called zones. Zoning Bylaws also address land use that impacts farmland by setting minimum parcel sizes, and the potential for subdivision of agricultural lands. A number of local and regional plans and regulations documents help to shape policy affecting agricultural activities in the SLRD Area B region. The following documents were reviewed and inform the content of this report (Table 1). Table 1. List of policy documents reviewed.
Document Title Status Year
St’at’imc Preliminary Draft Land Use Plan Draft 2004
Lillooet Land Resource Management Plan (LRMP) Draft 2004
Sustainable SLRD - Integrated Sustainability Plan Adopted 2013
SLRD Energy Resilience Task Force Report
SLRD Regional Growth Strategy Bylaw No. 1062 Adopted 2008, 2010
SLRD Area B OCP Bylaw No. 1073 Adopted 2008, 2010
District of Lillooet OCP Bylaw No 320 Adopted 2008, 2009
SLRD Areas A & B Zoning Bylaw No. 670 Adopted 1999, 2000
District of Lillooet Zoning Bylaw No 400 Adopted 2011
A discussion summarizing some of the specific items in the zoning and policies that may be applicable to the Agricultural Plan is provided in the Appendix.
Weather and Climate
The Coast Mountains prevent the flow of moist air into the Lillooet area and traps the movement of cold Arctic air from the Interior to the Coast. As a result, the climate is generally dry with periods of intense cold during winter months. Inversions and deep fog are common during the fall and winter. At the Environment Canada weather station in Lillooet, total annual rainfall has been recorded as 297.1 mm with total annual snowfall at 32.4 cm. Unlike coastal regions, rainfall is fairly consistent year round, with slightly less rain during spring months (February to May) and slightly more rain and snow during November, December, and January. From an agricultural perspective, there is likely not enough rainfall in the summer, requiring irrigation systems to be kept in place. Other climatic characteristics based on climate normals data from 1981-2010 at the Lillooet weather station include:
12
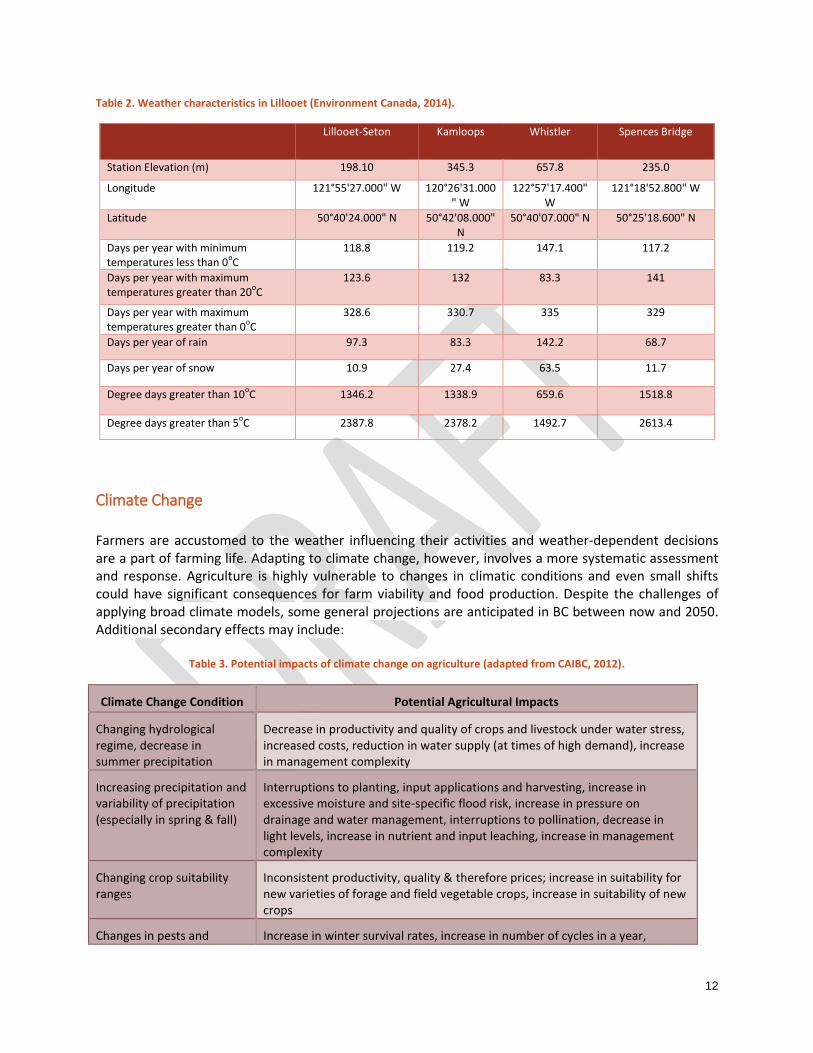
Table 2. Weather characteristics in Lillooet (Environment Canada, 2014).
Lillooet-Seton Kamloops Whistler Spences Bridge
Station Elevation (m) 198.10 345.3 657.8 235.0
Longitude 121°55'27.000" W 120°26'31.000" W
122°57'17.400" W
121°18'52.800" W
Latitude 50°40'24.000" N 50°42'08.000" N
50°40'07.000" N 50°25'18.600" N
Days per year with minimum temperatures less than 0
oC
118.8 119.2 147.1 117.2
Days per year with maximum temperatures greater than 20
oC
123.6 132 83.3 141
Days per year with maximum temperatures greater than 0
oC
328.6 330.7 335 329
Days per year of rain 97.3 83.3 142.2 68.7
Days per year of snow 10.9 27.4 63.5 11.7
Degree days greater than 10oC 1346.2 1338.9 659.6 1518.8
Degree days greater than 5oC 2387.8 2378.2 1492.7 2613.4
Climate Change
Farmers are accustomed to the weather influencing their activities and weather-dependent decisions are a part of farming life. Adapting to climate change, however, involves a more systematic assessment and response. Agriculture is highly vulnerable to changes in climatic conditions and even small shifts could have significant consequences for farm viability and food production. Despite the challenges of applying broad climate models, some general projections are anticipated in BC between now and 2050. Additional secondary effects may include:
Table 3. Potential impacts of climate change on agriculture (adapted from CAIBC, 2012).
Climate Change Condition Potential Agricultural Impacts
Changing hydrological regime, decrease in summer precipitation
Decrease in productivity and quality of crops and livestock under water stress, increased costs, reduction in water supply (at times of high demand), increase in management complexity
Increasing precipitation and variability of precipitation (especially in spring & fall)
Interruptions to planting, input applications and harvesting, increase in excessive moisture and site-specific flood risk, increase in pressure on drainage and water management, interruptions to pollination, decrease in light levels, increase in nutrient and input leaching, increase in management complexity
Changing crop suitability ranges
Inconsistent productivity, quality & therefore prices; increase in suitability for new varieties of forage and field vegetable crops, increase in suitability of new crops
Changes in pests and Increase in winter survival rates, increase in number of cycles in a year,

13
diseases introduction of new pests and diseases, increase in management costs, complexity, uncertainty, increase in delays or prevention of pollination
Increase in extreme weather events (storms, wind, extreme heat)
Decrease in productivity and quality, increase in building maintenance and damage costs, decrease in heating costs, increase in cooling and ventilation costs, interruptions to regional infrastructure and supply lines
Climate change impacts to other growing regions
Increase in feed or other input costs, increase in demand for food production/local food
Although there is general consensus regarding the impacts of climate change, how these might impact specific microclimates is uncertain - yet critical for agricultural producers concerned with the effects of climate change and precipitation within their specific locale. Modelling suggests that climate change in the SLRD will bring about an increase in GDDs, a decrease in spring snowfall, a decrease in summer rains, and an increase in frost-free days (Table 5).

0
Table 4. Climate Projections for the SLRD in the 2020s, 2050s, and 2080s (PCICS, 2012).
2020 change from 1961-1990
baseline 2050 change from 1961-1990
baseline 2080 change from 1961-1990
baseline
Characteristic Season Range Median Range Median Range Median
Mean Temperature Annual +0.5oC to +1.4
oC +1.0
oC +1.1
oC to +2.6
oC +1.7
oC +1.6
oC to +4.2
oC +2.7
oC
Precipitation Annual -0% to +7% +4% -1% to +11% +6% +3% to +16% +8%
Summer -13% to +10% -6% -21% to +5% -12% -32% to -1% -10%
Winter -2% to +8% +3% -4% to +14% +6% +2% to +24% +10%
Snowfall Winter -20% to +0% -6% -25% to -2% -15% -43% to -6% -20%
Spring -59% to -2% -29% -72% to -12% -51% -87% to -17% -72%
Growing Degree Days Annual +61 to +221 degree
days +135 degree
days +159 to +423 degree days
+273 degree days
+252 to +745 degree days
+461 degree days
Frost-free days Annual +8 to +24 days +15 days +15 to +40 days +27 days +23 to +67 days +42 days
Note: Growing degree days (GDDs) are a measure of heat accumulation to predict plant development rates. Pacific Climate Impacts Consortium (PCIC). www.plan2adapt.ca Accessed February 2014.
1
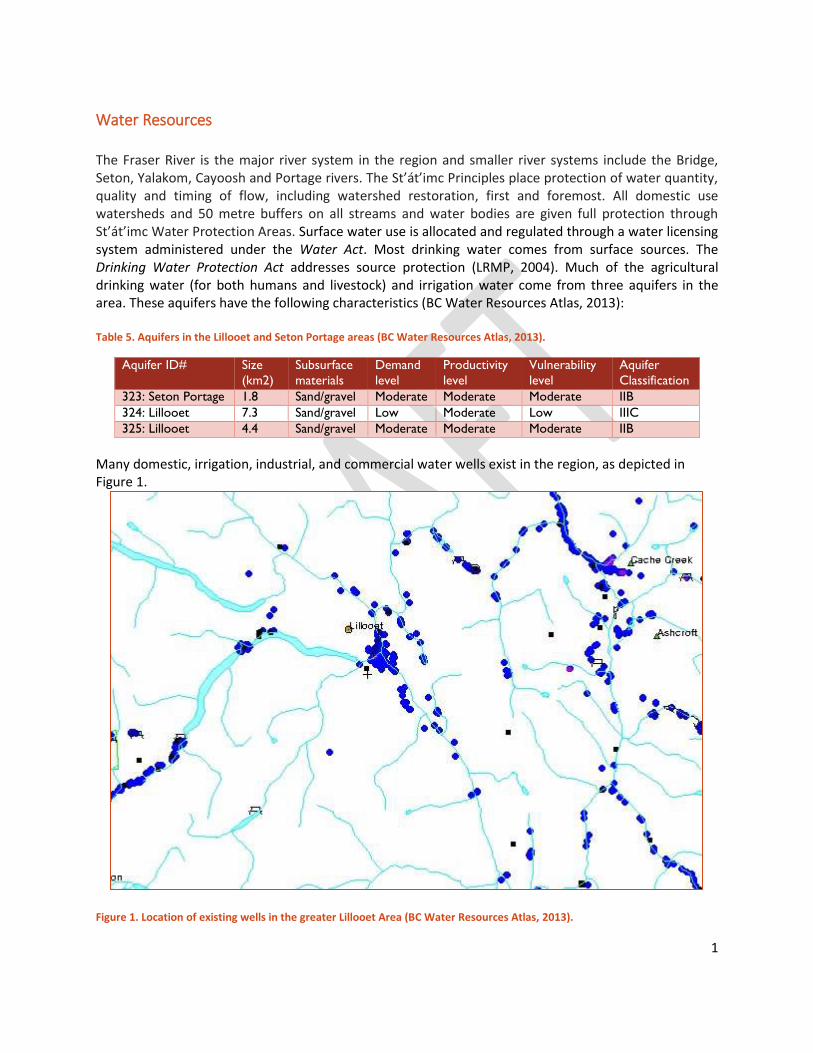
Water Resources The Fraser River is the major river system in the region and smaller river systems include the Bridge, Seton, Yalakom, Cayoosh and Portage rivers. The St’át’imc Principles place protection of water quantity, quality and timing of flow, including watershed restoration, first and foremost. All domestic use watersheds and 50 metre buffers on all streams and water bodies are given full protection through St’át’imc Water Protection Areas. Surface water use is allocated and regulated through a water licensing system administered under the Water Act. Most drinking water comes from surface sources. The Drinking Water Protection Act addresses source protection (LRMP, 2004). Much of the agricultural drinking water (for both humans and livestock) and irrigation water come from three aquifers in the area. These aquifers have the following characteristics (BC Water Resources Atlas, 2013): Table 5. Aquifers in the Lillooet and Seton Portage areas (BC Water Resources Atlas, 2013).
Aquifer ID# Size
(km2)
Subsurface
materials
Demand
level
Productivity
level
Vulnerability
level
Aquifer
Classification
323: Seton Portage 1.8 Sand/gravel Moderate Moderate Moderate IIB
324: Lillooet 7.3 Sand/gravel Low Moderate Low IIIC
325: Lillooet 4.4 Sand/gravel Moderate Moderate Moderate IIB
Many domestic, irrigation, industrial, and commercial water wells exist in the region, as depicted in Figure 1.
Figure 1. Location of existing wells in the greater Lillooet Area (BC Water Resources Atlas, 2013).
2
The region also includes several community watersheds around the District of Lillooet and along Anderson Lake:
Fountain Creek Community Watershed
Town Creek Community Watershed
Omin Brook Community Watershed
Spruce Creek Community Watershed The Water Sustainability Act modernization process was completed in 2013. It remains unclear as to how the new policies and regulations will impact local farmers. However, the proposed legislation includes the following new approaches:
Licensing ground water use (except for domestic);
Allow temporary use restrictions to protect Critical Environmental Flows and fish habitat; and
All agriculture water reserves to be created.
Agricultural Capability
A full description of soils and agricultural capability is provided in the Appendix. The general agricultural capability rating the Lillooet area is prime (Classes 1 – 3) so long as irrigation water is available (Talisman Projects Inc., 1978). The main limitations in the region are lack of soil moisture. Suggested improvements generally refer to irrigation, removal of surface stones, installation of drainage where necessary, or addition of nutrients. While soils vary from site to site, general recommendations for improvements to local soils for the purposes of agriculture include:
Ground levelling (areas should be individually evaluated in regard to erodibility and machinery limitations);
Applications of nutrients (fertilizers, manures, compost);
Stone picking;
Increasing organic matter content by adding animal manure, green manure, and/or compost; and
Irrigating, often at frequent short intervals. Neither topography nor stones are considered serious limitations for tree fruit or grape production.
Growing Degree Days
Growing degree days (GDD) are a weather-based indicator for assessing crop development. It is a measure of heat accumulation used to predict plant and pest development rates such as the date that a crop reaches maturity. Daily GDD values are added together from the beginning of the season, providing an indication of the energy available for plant growth. Growing degrees (GDs) are defined as the mean
3
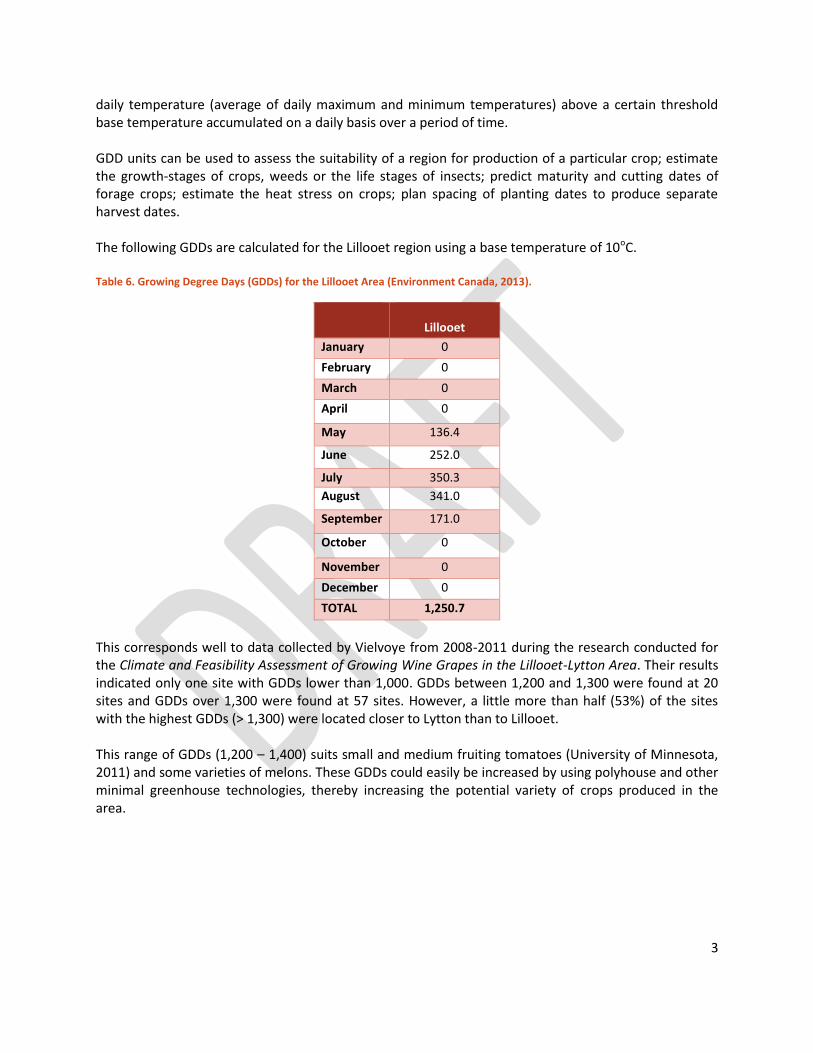
daily temperature (average of daily maximum and minimum temperatures) above a certain threshold base temperature accumulated on a daily basis over a period of time. GDD units can be used to assess the suitability of a region for production of a particular crop; estimate the growth-stages of crops, weeds or the life stages of insects; predict maturity and cutting dates of forage crops; estimate the heat stress on crops; plan spacing of planting dates to produce separate harvest dates. The following GDDs are calculated for the Lillooet region using a base temperature of 10oC. Table 6. Growing Degree Days (GDDs) for the Lillooet Area (Environment Canada, 2013).
Lillooet
January 0
February 0
March 0
April 0
May 136.4
June 252.0
July 350.3
August 341.0
September 171.0
October 0
November 0
December 0
TOTAL 1,250.7
This corresponds well to data collected by Vielvoye from 2008-2011 during the research conducted for the Climate and Feasibility Assessment of Growing Wine Grapes in the Lillooet-Lytton Area. Their results indicated only one site with GDDs lower than 1,000. GDDs between 1,200 and 1,300 were found at 20 sites and GDDs over 1,300 were found at 57 sites. However, a little more than half (53%) of the sites with the highest GDDs (> 1,300) were located closer to Lytton than to Lillooet. This range of GDDs (1,200 – 1,400) suits small and medium fruiting tomatoes (University of Minnesota, 2011) and some varieties of melons. These GDDs could easily be increased by using polyhouse and other minimal greenhouse technologies, thereby increasing the potential variety of crops produced in the area.
4
A Snapshot of Agriculture in Lillooet
Note:
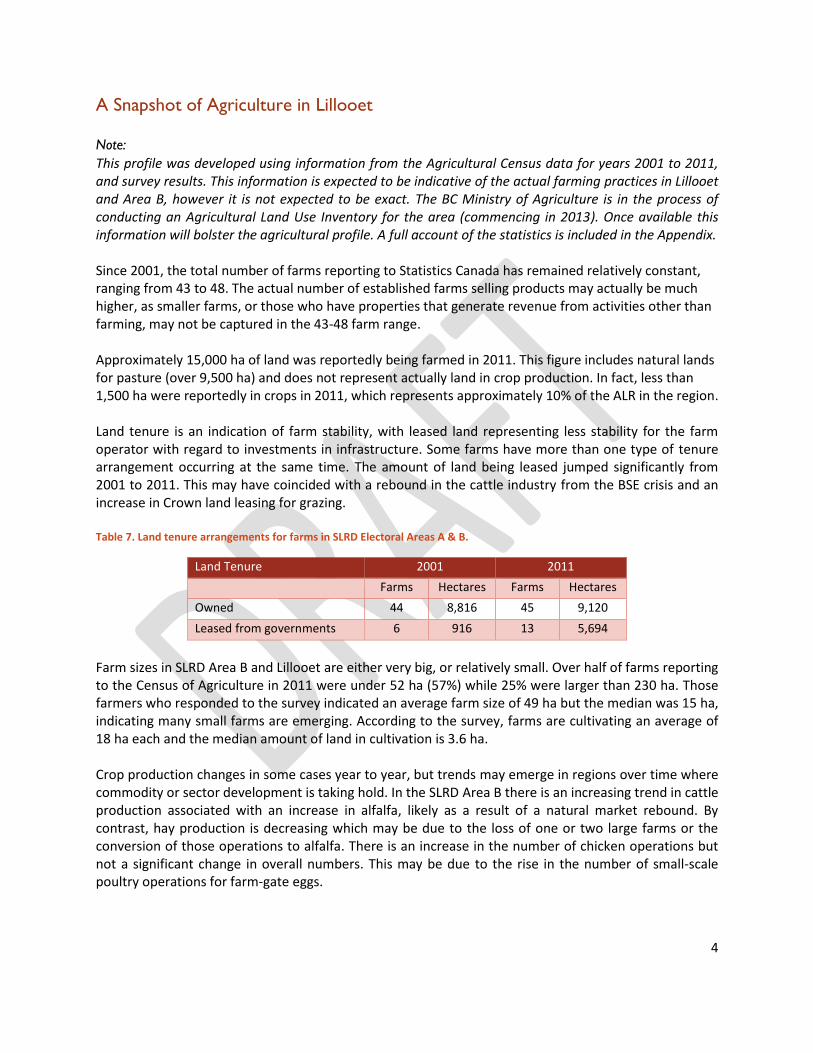
This profile was developed using information from the Agricultural Census data for years 2001 to 2011, and survey results. This information is expected to be indicative of the actual farming practices in Lillooet and Area B, however it is not expected to be exact. The BC Ministry of Agriculture is in the process of conducting an Agricultural Land Use Inventory for the area (commencing in 2013). Once available this information will bolster the agricultural profile. A full account of the statistics is included in the Appendix. Since 2001, the total number of farms reporting to Statistics Canada has remained relatively constant, ranging from 43 to 48. The actual number of established farms selling products may actually be much higher, as smaller farms, or those who have properties that generate revenue from activities other than farming, may not be captured in the 43-48 farm range. Approximately 15,000 ha of land was reportedly being farmed in 2011. This figure includes natural lands for pasture (over 9,500 ha) and does not represent actually land in crop production. In fact, less than 1,500 ha were reportedly in crops in 2011, which represents approximately 10% of the ALR in the region. Land tenure is an indication of farm stability, with leased land representing less stability for the farm operator with regard to investments in infrastructure. Some farms have more than one type of tenure arrangement occurring at the same time. The amount of land being leased jumped significantly from 2001 to 2011. This may have coincided with a rebound in the cattle industry from the BSE crisis and an increase in Crown land leasing for grazing. Table 7. Land tenure arrangements for farms in SLRD Electoral Areas A & B.
Land Tenure 2001 2011
Farms Hectares Farms Hectares
Owned 44 8,816 45 9,120
Leased from governments 6 916 13 5,694
Farm sizes in SLRD Area B and Lillooet are either very big, or relatively small. Over half of farms reporting to the Census of Agriculture in 2011 were under 52 ha (57%) while 25% were larger than 230 ha. Those farmers who responded to the survey indicated an average farm size of 49 ha but the median was 15 ha, indicating many small farms are emerging. According to the survey, farms are cultivating an average of 18 ha each and the median amount of land in cultivation is 3.6 ha. Crop production changes in some cases year to year, but trends may emerge in regions over time where commodity or sector development is taking hold. In the SLRD Area B there is an increasing trend in cattle production associated with an increase in alfalfa, likely as a result of a natural market rebound. By contrast, hay production is decreasing which may be due to the loss of one or two large farms or the conversion of those operations to alfalfa. There is an increase in the number of chicken operations but not a significant change in overall numbers. This may be due to the rise in the number of small-scale poultry operations for farm-gate eggs.
5
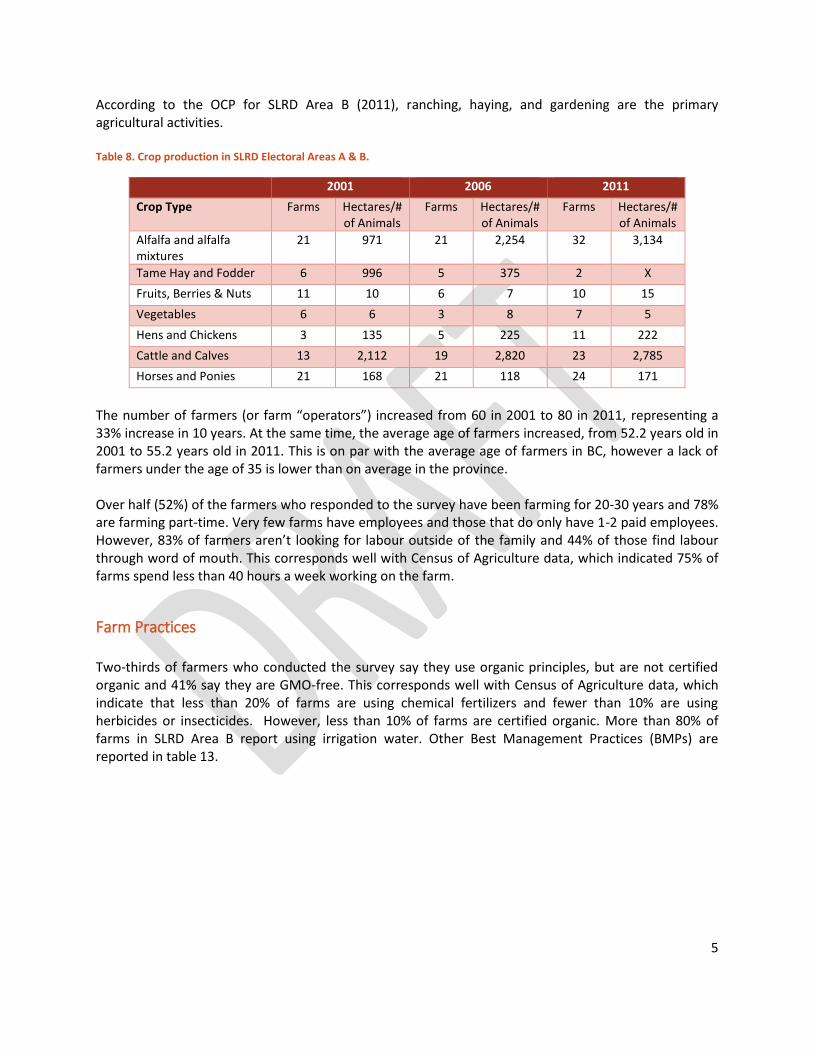
According to the OCP for SLRD Area B (2011), ranching, haying, and gardening are the primary agricultural activities. Table 8. Crop production in SLRD Electoral Areas A & B.
2001 2006 2011
Crop Type Farms Hectares/# of Animals
Farms Hectares/# of Animals
Farms Hectares/# of Animals
Alfalfa and alfalfa mixtures
21 971 21 2,254 32 3,134
Tame Hay and Fodder 6 996 5 375 2 X
Fruits, Berries & Nuts 11 10 6 7 10 15
Vegetables 6 6 3 8 7 5
Hens and Chickens 3 135 5 225 11 222
Cattle and Calves 13 2,112 19 2,820 23 2,785
Horses and Ponies 21 168 21 118 24 171
The number of farmers (or farm “operators”) increased from 60 in 2001 to 80 in 2011, representing a 33% increase in 10 years. At the same time, the average age of farmers increased, from 52.2 years old in 2001 to 55.2 years old in 2011. This is on par with the average age of farmers in BC, however a lack of farmers under the age of 35 is lower than on average in the province. Over half (52%) of the farmers who responded to the survey have been farming for 20-30 years and 78% are farming part-time. Very few farms have employees and those that do only have 1-2 paid employees. However, 83% of farmers aren’t looking for labour outside of the family and 44% of those find labour through word of mouth. This corresponds well with Census of Agriculture data, which indicated 75% of farms spend less than 40 hours a week working on the farm.
Farm Practices Two-thirds of farmers who conducted the survey say they use organic principles, but are not certified organic and 41% say they are GMO-free. This corresponds well with Census of Agriculture data, which indicate that less than 20% of farms are using chemical fertilizers and fewer than 10% are using herbicides or insecticides. However, less than 10% of farms are certified organic. More than 80% of farms in SLRD Area B report using irrigation water. Other Best Management Practices (BMPs) are reported in table 13.

6
Table 9. Farms in the SLRD Electoral Areas A & B reporting Best Management Practices (Census of Agriculture) *N/A indicates that the BMP was not measured in 2001 and/or 2006.
Best Management Practices Number of Farms and % of Total Reporting
2001 2006 2011
Crop rotation 5 (10%) 10 (23%) 8 (17%)
In-field winter grazing or feeding N/A N/A 20 (42%)
Rotational grazing N/A 18 (42%) 11 (23%)
Plowing down green crops 6 (14%) 4 (9%) 2 (4%)
Winter cover crops 0 (0%) 2 (5%) 2 (4%)
Nutrient management planning N/A N/A 10 (21%)
Windbreaks or shelterbelts (natural or planted) 4 (9%) 9 (21%) 9 (19%)
Buffer zones around water bodies N/A 4 (9%) 5 (10%)
Total number of reporting farms 44 43 48
Farm Valuation
Farms are worth more on paper now in the Lillooet and SLRD Area B region than they were a decade ago, but the cost of operating them is also going up. Total farm capital has increased dramatically in the region in the past 10 years, most likely due to a sharp increase in the value of land and buildings. The value of farm machinery, livestock, and poultry, has decreased. Total farm capital values over the last decade:
$24,327,342 in 2001
$34,342,954 in 2006
$109,353,033 in 2011 Table 10. Farm capital values in SLRD Electoral Area B.
2001 2006 2011
Farm Capital Subcategory
# of farms report
ing
Value $/farm
Value $ in millions
# of farms report
ing
Value $/farm
Value $ in
millions
# of farms
reporting
Value $/farm Value $ in
millions
Land and buildings
44 432,698 18.6 43 659,088 28.3 48 2,111,488 101.4
Farm machinery & equipment
44 74,640 3.3 43 98,869 4.3 35 24,664 0.9
Livestock and poultry
28 85,731 2.4 31 56,476 1.8 37 55,767 2.1
Total farm capital
44 552,894 24.3 43 798,673 34.3 48 2,278,188 109.4
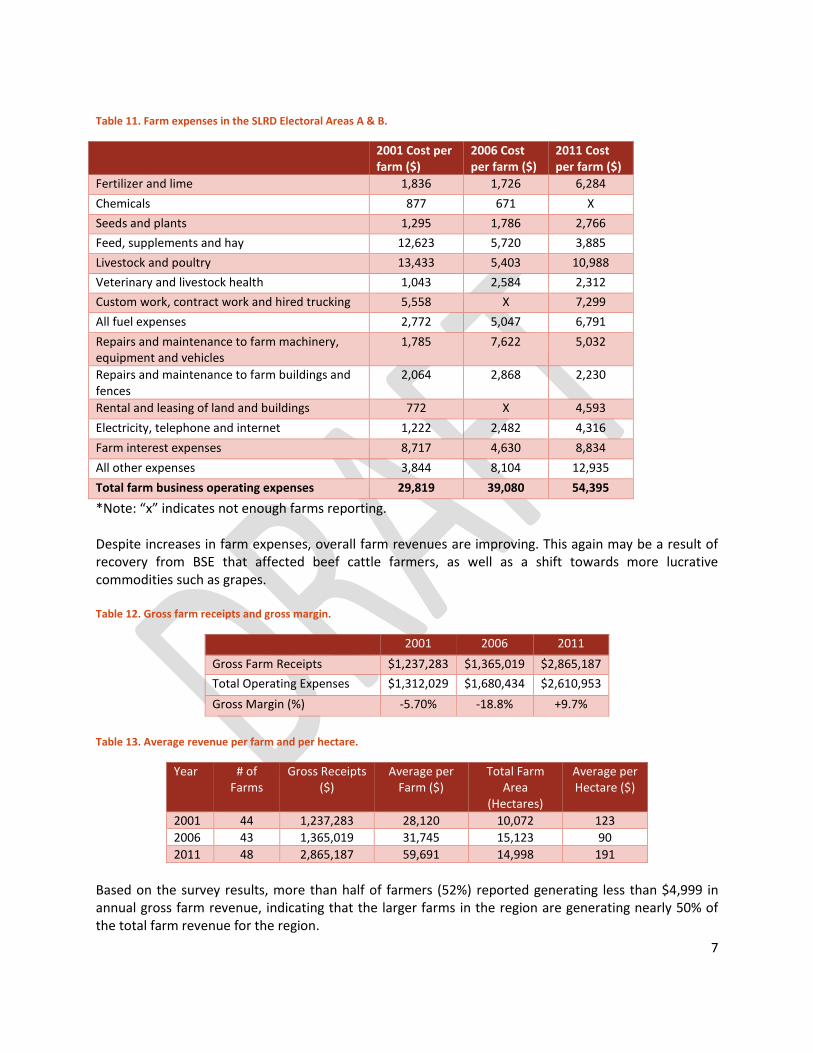
Farm expenses have risen in several categories, most notably fertilizers, fuel, electricity, phone, and internet.
7
Table 11. Farm expenses in the SLRD Electoral Areas A & B.
2001 Cost per farm ($)
2006 Cost per farm ($)
2011 Cost per farm ($)
Fertilizer and lime 1,836 1,726 6,284
Chemicals 877 671 X
Seeds and plants 1,295 1,786 2,766
Feed, supplements and hay 12,623 5,720 3,885
Livestock and poultry 13,433 5,403 10,988
Veterinary and livestock health 1,043 2,584 2,312
Custom work, contract work and hired trucking 5,558 X 7,299
All fuel expenses 2,772 5,047 6,791
Repairs and maintenance to farm machinery, equipment and vehicles
1,785 7,622 5,032
Repairs and maintenance to farm buildings and fences
2,064 2,868 2,230
Rental and leasing of land and buildings 772 X 4,593
Electricity, telephone and internet 1,222 2,482 4,316
Farm interest expenses 8,717 4,630 8,834
All other expenses 3,844 8,104 12,935
Total farm business operating expenses 29,819 39,080 54,395
*Note: “x” indicates not enough farms reporting. Despite increases in farm expenses, overall farm revenues are improving. This again may be a result of recovery from BSE that affected beef cattle farmers, as well as a shift towards more lucrative commodities such as grapes. Table 12. Gross farm receipts and gross margin.
2001 2006 2011
Gross Farm Receipts $1,237,283 $1,365,019 $2,865,187
Total Operating Expenses $1,312,029 $1,680,434 $2,610,953
Gross Margin (%) -5.70% -18.8% +9.7%
Table 13. Average revenue per farm and per hectare.
Year # of Farms
Gross Receipts ($)
Average per Farm ($)
Total Farm Area
(Hectares)
Average per Hectare ($)
2001 44 1,237,283 28,120 10,072 123
2006 43 1,365,019 31,745 15,123 90
2011 48 2,865,187 59,691 14,998 191
Based on the survey results, more than half of farmers (52%) reported generating less than $4,999 in annual gross farm revenue, indicating that the larger farms in the region are generating nearly 50% of the total farm revenue for the region.

8
Preliminary Market Opportunities Analysis The purpose of this Market Opportunities Analysis (MOA) is to identify opportunities for the local food sector to thrive in SLRD Area B, the District of Lillooet, and the Northern St’at’imc territory region. It was developed using a review of existing literature and research; responses from the farming and non-farming surveys; results from one-on-one interviews with local key stakeholders in the agricultural community; feedback at open houses; an inventory of retailers (including restaurants), distributors, processors, and others involved in the production and sale of food products; and a high level calculation of annual food demand and associated potential revenue for Lillooet and area farmers. It is preliminary and does not include primary research around crop suitability as this is very site-specific and would need to be evaluated on a case-by-case basis. The MOA is structured using the following subsections:
Capacity for market expansion
Discussion of ten key issues 1. Cost of land and inputs 2. St’at’imc partnerships and initiatives 3. Water 4. Wildlife 5. Economies of scale and crop diversification 6. Labour 7. Processing and value-added infrastructure 8. Transportation and distribution 9. Marketing and sales 10. Consumer awareness and education
Summary of key challenges
Summary of key opportunities
Capacity for Market Expansion
According to 2011 census figures, a population of 2,322 residents called Lillooet home and an additional 450 lived in the surrounding Area B region. The median income of Lillooet and Area B residents is $31,373 (males) and $17,585 (females) for a combined average of $22,542 (BCStats, 2006). By comparison, the median income across BC is $24,867 (BCStats, 2006). The community is characterized by a large proportion of 45-64 year-olds (36% compared to 30% provincially) and a smaller proportion of young adults (only 21% are aged 25-44 compared to 26% provincially) (StatsCan, 2011). Leading employment sectors are forestry (including wood product manufacturing), retail, and transportation. Educational services, hotels, restaurants, and health care also employ a large portion of the working population (StatsCan, 2011). Agriculture and the food sector do not figure prominently in regional employment figures. The current population of the Lillooet and Area B region is approximately 2,700 and is expected to reach 5,000 by 2036 (BC Stats, 2012). To measure food self-sufficiency, the BC Ministry of Agriculture developed a model, which estimates that 0.524 ha of land (irrigated and non-irrigated) is required to

9
produce an adequate and healthy diet for one person to live for one year (BC Ministry of Agriculture and Lands, 2006). Although approximately 15,000 ha of ALR is located in the Lillooet area, the vast majority is not being irrigated on a regular basis. In order to be self-sufficient in food security, 1,572 ha of irrigated land would need to be under cultivation. To sustain a future population of 5,000 that number will need to grow to 2,620 ha. In 2006 only 1,750 ha of ALR land was being irrigated in the entire SLRD region including Electoral Areas A, B, C, and D combined (BC Ministry of Agriculture, SLRD Ag In Brief series). The BC Ministry of Agriculture is currently undertaking an Agricultural Land Use Inventory (LUI) of the region. Once available, these results will indicate a greater resolution of data regarding the amount of land currently cultivated and irrigated in the Lillooet region specifically. It is likely that there is much room for enhancement of food production in the current farmland base as long as irrigation water is available. The LUI results will also provide an indication of the amount of underutilized ALR (either private lands or Crown land) that could be brought into production at a later date. In 2006, the average household (2.4 persons) in British Columbia consumed $8,000 in food per year (Harasymchuk and Rolston, 2012). There are 1,068 households in the Lillooet region and they spend over $8.5 million annually on food. At the same time, the total value of farm production in the region (farm gate receipts) was only $2.86 million (StatsCan, 2012), suggesting ample room in the market for growth and expansion. These economic figures suggest that the local food market is only 33% filled by local food production. It should be noted that these numbers are conservative as they represent rough estimates only and do not account for local food that is being exported out of the region. Therefore the actual proportion of local food supply meeting local demand could be much lower than 33%.
Discussion of Key Economic Opportunity Issues
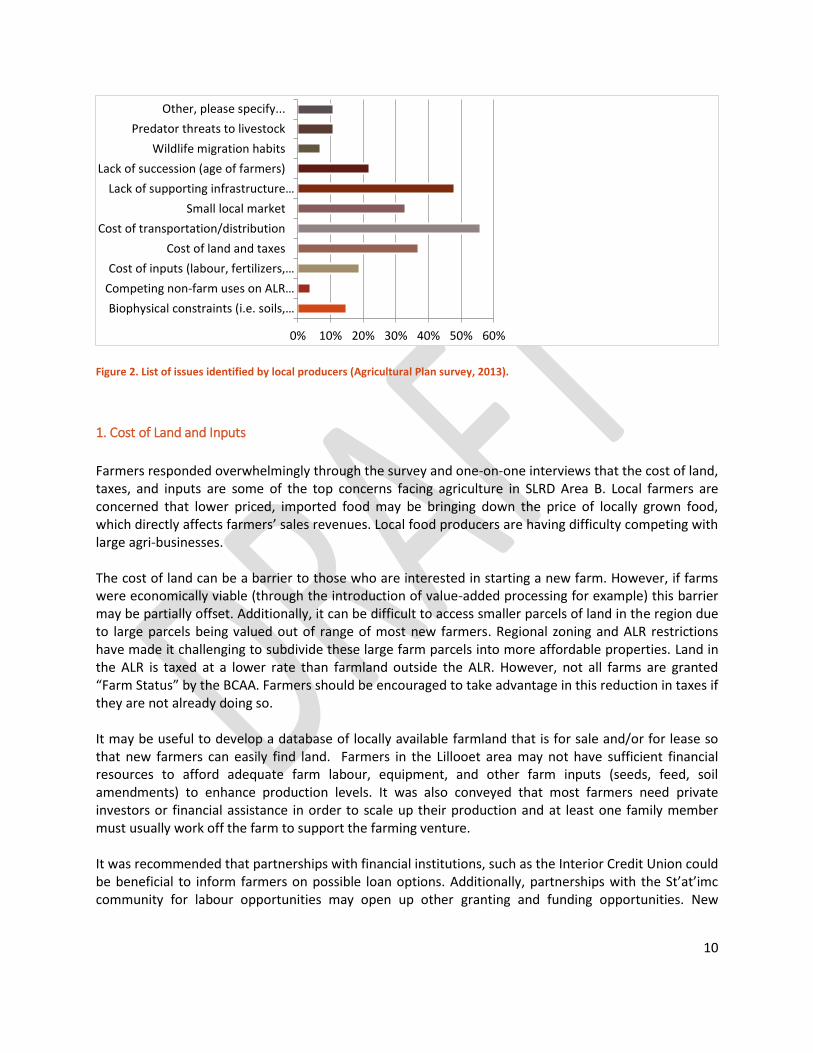
Top challenges as identified by farmers during the survey include water quantity (irrigation/livestock
watering), cost of land and taxes, cost of transportation & distribution, and a small local market.
10
Figure 2. List of issues identified by local producers (Agricultural Plan survey, 2013).
1. Cost of Land and Inputs
Farmers responded overwhelmingly through the survey and one-on-one interviews that the cost of land, taxes, and inputs are some of the top concerns facing agriculture in SLRD Area B. Local farmers are concerned that lower priced, imported food may be bringing down the price of locally grown food, which directly affects farmers’ sales revenues. Local food producers are having difficulty competing with large agri-businesses. The cost of land can be a barrier to those who are interested in starting a new farm. However, if farms were economically viable (through the introduction of value-added processing for example) this barrier may be partially offset. Additionally, it can be difficult to access smaller parcels of land in the region due to large parcels being valued out of range of most new farmers. Regional zoning and ALR restrictions have made it challenging to subdivide these large farm parcels into more affordable properties. Land in the ALR is taxed at a lower rate than farmland outside the ALR. However, not all farms are granted “Farm Status” by the BCAA. Farmers should be encouraged to take advantage in this reduction in taxes if they are not already doing so. It may be useful to develop a database of locally available farmland that is for sale and/or for lease so that new farmers can easily find land. Farmers in the Lillooet area may not have sufficient financial resources to afford adequate farm labour, equipment, and other farm inputs (seeds, feed, soil amendments) to enhance production levels. It was also conveyed that most farmers need private investors or financial assistance in order to scale up their production and at least one family member must usually work off the farm to support the farming venture. It was recommended that partnerships with financial institutions, such as the Interior Credit Union could be beneficial to inform farmers on possible loan options. Additionally, partnerships with the St’at’imc community for labour opportunities may open up other granting and funding opportunities. New
Biophysical constraints (i.e. soils,…
Competing non‐farm uses on ALR…
Cost of inputs (labour, fertilizers,…
Cost of land and taxes
Cost of transportation/distribution
Small local market
Lack of supporting infrastructure…
Lack of succession (age of farmers)
Wildlife migration habits
Predator threats to livestock
Other, please specify...
0% 10% 20% 30% 40% 50% 60%
11
viticulture operations have been successful at securing private investments and this may also be the case for other farms who are able to present a strong business case. This is discussed further below.
2. St’at’imc Partnerships and Initiatives
Several projects being spearheaded by the St’at’imc community present opportunities for partnerships with the agricultural community. The St’at’imc Education and Training Manager is working on a potential agricultural pilot project (sugar beets) for the community. Traditional food harvesting methods, such as berry picking, fishing, and hunting, are important priorities for the St’at’imc community. Traditional foods include saskatoon berries, soap berries, wild strawberries, huckleberries, cow parsnip, deer, moose, fish, mushrooms, coltfoot, and cacti. Medicinal plants also present an opportunity for the community to expand market opportunities. Split Rock environmental is one example of a St’at’imc territory business that has leveraged traditional harvesting and medicines into a successful small business operation. Many St’at’imc community members suggested appropriate agricultural activities would include vegetable production, organic farming, and native plant propagation. By contrast there was less support for the introduction of dairy farming to the area. The need to closely monitor water resources for irrigation and potential impacts on wildlife were noted as high priorities. As the St’át’imc have an inseparable connection to their land and long history within their community, it follows that community economic development (CED) should both benefit and involve the members of the community. CED for the St’át’imc is generally supported by the following principles:
community participation in planning;
diversification of economic activities;
benefit of local jobs and capacity building;
form of local control and ownership; and,
adherence to cultural and environmental values. With a large youth population, the St’át’imc are open to exploring community-driven opportunities or partnerships in CED based on St’át’imc priorities, for the benefit of both current and future generations. Recognition that improvement in First Nations diet will go a long way to addressing many of the health issues facing First Nations community members is important. Agriculture expansion and St’at’imc involvement is an opportunity to address overall community well-being. The potential of a St’át’imc joint venture similar to style and full-service amenities of Nk’Mip Cellars in Osoyoos was raised during the Economic Opportunity Assessment report (2008) and remains a viable option. The Canada-BC Environmental Farm Plan (EFP) Program, which provides funding to encourage producers to develop farm plans and implement beneficial management practices and continuously evaluate environmental performance, is not being accessed by FN’s due to jurisdictional issues (i.e. Federal lands are not eligible).

12
3. Water
Overall, Lillooet has a warm and dry climate relative to coastal BC. However, there is growing concern about the impact that both climate change and population growth will have on the quality and availability of water for irrigation and livestock. As part of the consultation process, farmers were asked to identify any specific biophysical constraints on their farms. Aside from steep slopes and stony soils in some locations, many farmers responded that they are faced with seasonal water scarcity challenges and a lot of unknown extreme weather variability due to climate change. Almost every summer during the height of the growing season, Lillooet and the surrounding region experiences some level of water restrictions. Ranchers generally do not have secure water licenses over range water sources. To increase the amount of land being brought into production, adequate water must be available for irrigation and livestock watering. However, there are concerns that water may not be as accessible in the future and there is a general lack of knowledge surrounding agricultural water sources, consumption rates, and whether or not water conservation practices are being employed by farmers. Farmers understand that climate change is expected to increase weather variability, in particular changes to precipitation patterns, timing of spring thaws and snow melts, and growing degree days. They understand that water shortages are likely to worsen, resulting in competition for limited water supplies. At the same time there is also an increasing awareness of the ecological needs for water within each river system and an understanding that a minimum amount of water is critical to the need of fish and other wildlife. The community may benefit from an in-depth research report on the use of water by farmers in the area. The BC Ministry of Agriculture’s Land Use Inventory and accompanying water balance model will help to answer many of these questions. Dissemination of information and resources for on-farm water conservation practices could be facilitated by agricultural organizations. Water allocation planning, which includes information and analysis of seasonal water flows, licensed use, and ecological requirements, is needed. This could include an inventory of available water (e.g., quantity and flow information) for agricultural and industrial development, domestic use, storage, conservation purposes, and fish and wildlife.
4. Wildlife
In the traditional territory and culture of St’at’imc First Nation wildlife plays a pivotal role. In particular, the spiritual species include grizzlies, mule deer, and salmon. The protection of their habitat and ecosystem health is paramount. Grizzlies play an especially large role in how the web of life in St’át’imc territory functions, and they require large areas of land to meet their needs. Maintaining their habitat can help ensure the conservation of many other native species. The areas noted as Grizzly Protection Areas in the St’at’imc Land Use Plan fall primarily outside the ALR. Mule deer are also a species of special management concern in St’át’imc territory, because of their cultural importance to the St’át’imc, their sensitivity to landscape changes in their winter ranges, and the vulnerability of their migration routes and fawning areas. The St’at’imc Land Use Plan restricts cattle grazing, chemical pesticide and herbicide use, and clearcutting within the Deer Protection Area. The
13
St’at’imc Deer Protection Area coincides with some of the ALR in the SLRD Area B, primarily near the communities of Pavilion, Fountain, and Cayoosh Creek. Fish species of cultural importance include four species of pacific salmon (sockeye, Chinook, coho and pink), steelhead, bull trout, white sturgeon, rainbow trout, kokanee, gwen7is, white fish, suckers, dolly varden, brown trout and brook trout. St’at’imc fish protection areas are designed to protect fish streams and the high intensity of St’át’imc cultural uses associated with these and adjacent areas. The first 50 metres on either side of all fish streams is a full protection area that coincides with St’át’imc Water Protection Areas. In addition, based on St’át’imc traditional use information, a cultural fish protection area extending one kilometre on either side of all fish streams has been established. The Best Management Practices that are supported by the Ministry of Agriculture through ARDCorp include a suite of agricultural activities aimed at minimizing the impact of farming on wildlife habitat. Many farmers and non-farmers are interested in protecting the habitat of species found in the Lillooet area by promoting best management practices through conservation-based farming. At the same time, the prevalence of deer, bears, cougars and coyotes have been a predation issues for crops and livestock. This issue has been raised by farmers in other regions of the province. In 2004 the IAF and ARDCorp funded research to explore wildlife and agriculture issues the through Wildlife Program Development initiative. The work involved the implementation of pilot wildlife damage compensation projects funded by the Business Risk Management Branch of the BC Ministry of Agriculture and Lands. Five pilot projects were conducted involving compensation for losses of forage to wild ungulates and waterfowl; and for losses of livestock to wild predators. Two major evaluation reports were produced: the BC Wildlife Damage Compensation Pilot Projects: Evaluation Report and the Wild Predator Loss Control and Compensation Project Evaluation The project supported a wide range of program development initiatives and opportunities aimed at addressing wildlife agriculture conflicts including:
BC Agriculture Wildlife Advisory Committee
Agriculture Wildlife Program
Provincial Agriculture Zone Wildlife Program
Landowner Enfranchisement projects For a full account of all the pilot projects funded through this initiative please refer to the Appendix of the BCAC Wildlife Program Development Report (2004). The BC Ministry of Environment works with the agricultural industry to respond to calls regarding conflicts between livestock and wildlife. This is spearheaded by a Steering Committee that meets irregularly and includes representatives from Ministry of Forests, Lands, and Natural Resource Operations (FLNRO), Ministry of Agriculture, Ministry of Environment, representatives from the ranching industry, and the BC Wildlife Federation (Mike Badry, pers. comm.). The BC Cattleman’s Association has done some work to assist ranchers in minimizing the impacts of predation on cattle and the BC Wildlife Federation has set
5. Economies of Scale and Product Diversification
Seasonal production volumes and lower economies of scale are major factors affecting the competitiveness of local food producers, particularly for fresh fruit and vegetables not subject to supply

14
management regulations. The relatively small size of produce farms, and minimal markets for local meat sales (due to MIR restrictions), reduces the opportunity for higher returns based on economies of scale that influence overhead costs (administrative and inputs). Furthermore, the lack of crop specialization means that many farmers are producing a little bit of a lot of things, rather than a lot of one or two things. For instance, Fountainhead Carrots is one of the only farms in the region growing and marketing a single product. While diversity of crops at the farm level is important for Integrated Pest Management and overall farm sustainability, the lack of farms focussing on two or three products per year means that lower returns are garnered relative to the high input costs previously discussed. Genetic diversity in crops can also be maintained through planting multiple varieties of a single crop; thereby obtaining ease of use in planting and management, while maintaining ecological principles. Some communities (e.g. Denman Island) have discussed holding an annual “crop cooperation meeting” for farmers during the planting and planning stages. The objective is for farmers to choose which crops they wish to grow that year specifically for the local market. Thereby, one year a farm may focus on carrots, cabbages, and mixed greens while the following year they may focus on peas, beans, and potatoes. This strategy ensures crop rotation on an annual basis without flooding local farmers markets and retailers with too much of any one locally-grown crop. There is an opportunity to increase the commercialization of the local produce industry. At one point in time Lillooet was known as the tomato capital, but this has been abandoned. The capacity to grow field tomatoes based on local climate conditions remains high. Historically there was a producer of melons, squash, and root crops who sold directly to Choices market. However it is believed that a lack of local labour resources led to the failure of that operation. Many community members noted a desire to purchase local dairy products. While the dairy quota system would be restrictive to farms wishing to sell fluid milk locally, the provincial Class D Producer Vendor Licence offered through the BC Milk Marketing Board under Amending Order 16 allows dairy farmers to process their raw milk into cheese for sale. This has been successful on Salt Spring Island, northern Vancouver Island, the Shuswap, and the Okanagan, and could be successful in the Lillooet area. During the one-on-one interviews, it was suggested that there is an overall willingness to collaborate and share information within the agricultural community and that the local retail market is generally underserved.
Spotlight on the Cattle Industry
[This will be formatted as a text box within the report]
Since 2003 the cattle sector was hit by successive impacts affecting its competitiveness that include: BSE outbreak; higher grain prices which significantly impact the cow/calf industry; currency exchange rates; US requirements with respect to ‘country of origin’ labeling, which in turn causes packing plants to avoid Canadian products due to the extra administrative load associated with tracking; increased costs for both fuel and fertilizer; and increased energy costs. The last ten years has been more down than up for the cattle industry, however last two years has seen a partial recovery of the market. However the industry has only just barely come back to 2002 levels. In the meantime, input costs have increased with inflation. The BCCA believes the industry is recovering

15
and is headed towards 3-10 years of improved profitability (Kevin Reed, pers. comm.). Confidence has been regained in the market and international opportunities are opening up, especially in Asia. Current droughts in other jurisdictions such as central and western USA means that there is a narrowing of supply throughout the world. BC beef has the reputation of being very high quality. Lillooet and the surrounding region is one of the more rugged terrains that cattle use for grazing in BC, but ranchers in the area have developed a unique skill set to utilize this terrain effectively. The land and forage (grass) require specific management practices to create high yields. There are also impacts locally from wildlife predators and the logging industry, which has developed roadways through grazing areas. Mountain Pine beetle has also taken away grazing rotation opportunities in the region. The MIR has had a large impact on cattle production in the Lillooet region. Producers speak of the need to now send their cows further and further afield for finishing and slaughter. Some question the traceability of the product in this larger system, and whether or not the product that is sold under their name is actually originating from their ranch. Many smaller producers, those with less than 100 head of cattle, have had to sell their operations because the profit margin simply became too small. The BCCA sees opportunities in agroforestry, trail rides (agritourism), and the development of niche products such at “natural” beef, as ways to increase profit margins of Lillooet and area ranchers. BC cattle producers’ advantages also include excellent cattle with good genetics, climate, land availability and market access.
Spotlight on Viticulture
[This will be formatted as a text box within the report]
Several studies, such as the Climate and feasibility assessment of growing wine grapes in the Lillooet-Lytton area by the BC Grapegrowers’ Association, and a large amount of investment capital have recently been delivered to the Lillooet area in the hopes of developing a new wine region in BC. The studies outline some key beneficial features of the area for grape production and initial field trials are promising. To date, two main players (Fort Berens and Texas Creek Ranch) have entered into grape production in the Lillooet area. The Fort Berens winery was started up in the spring of 2009 and now includes 20 acres of planted grapes and an additional 20 acres that will be brought into production in the future. The producers came to the Lillooet area from the Netherlands and were attracted to the area based on a combination of climate and land prices, which were lower than the Okanagan. A lot of research went into the location choice, including water sources and weather data. Consultants were hired to conduct a site suitability assessment and help to get the operation established. High investment capital was required, with business partners from outside of BC investing over $4 million. The building and equipment represented the highest costs. A loan for a portion of the investment was obtained from Farm Credit Canada. Texas Creek Ranch is an experimental grape vineyard, with about 3 acres of grafts from the current vineyard to be planted in the upcoming year. Challenges include finding nutrient inputs, such as manure, in the region that is of consistent quality. Texas creek ranch required an investment level of $1.5 million

16
before production and planting on a commercial scale. Basic expenses were $25,000/acre, which doesn’t include raising vines to production age (5 years).
6. Labour
Communities in the region have long based their economy on natural resources. Historically jobs have centered around gold rushes, railroad construction, mineral exploration and mining, hydro dam construction, highway projects, forestry, fishing, tourism, farming and ranching. Downturns have resulted in unemployment, wage disparities, rapid shifts in population, and lost opportunities for associated businesses (LRMP, 2004). Despite these challenges, people are attracted to the area by its beauty and quality of rural life. The main employment sectors include (LRMP, 2004):
public sector: 38%
forestry: 19%
tourism: 15%
agriculture: 12%, and
mining at 2%. While the agriculture sector employs 12% of the population, survey results suggest that the vast majority of farmers (78%) have additional work outside the farm. Very few farms have employees and those that do usually only have 1-2 paid employees. The labour issue is a bit of a “chicken and egg” problem for local farmers. Many acknowledge that additional labour resources are required in order for operations to scale up production; however most farms cannot afford to hire labour, even seasonally, at current profit margins. Therefore 83% of farmers who responded to the survey said that they aren’t looking for labour outside of family help. When labour is sought, it can be difficult to find help. The population in the region is aging, with many in retirement, and many members of the younger generation are leaving the region for higher paying work opportunities. Many members of the St’at’imc community are either underemployed or unemployed. Half (50%) of St’at’imc community members that provided input to the Agricultural Plan were not currently working. However 36% also said they were not interested in working in agriculture. Only roughly a quarter (27%) expressed an interested in full time seasonal farm work. Several stakeholders also mentioned the lure of the oil and gas sector in northern BC and felt that many people in the 25-55 year age range were leaving Lillooet on short-term work opportunities out of the region. When compared to international competitors in the agricultural industry many Lillooet producers are at a disadvantage. There are no (or few) low wage job seekers in the region, and those that do appear are often transient (such as those involved in the WWOOFing program) and/or uninterested in making long term work commitments for positions with low wages and few benefits.

17
7. Processing and Value-Added Infrastructure
The lack of access to local food processing infrastructure is a challenge for producers in SLRD Area B. There is enormous potential for value added local products that address changing trends in the food industry and offer increased economic returns over the sale of unprocessed and/or conventional food products. These include:
Canned goods
Sauces, marinades, jams
Baked goods
Frozen goods
Cheese products (utilizing BC’s Cottage Industry Program)
Meat and eggs Currently, in order to process livestock, or have eggs graded for sale, farmers must ship their livestock and eggs to outside facilities, which is cost prohibitive. The production volume of local food in the Lillooet area may not be large enough to support conventional processing facilities, but cooperative or other alternative models may be viable. Producers who were interviewed mentioned that there is a general demand for niche products inside and outside of the Lillooet and SLRD Area B region. Large consumer markets such as Whistler, Vancouver, and Kamloops are relatively nearby and can be accessed without too much difficulty. While many local farmers (85% based on survey results) indicate that they produce canned preserves or pickles, only 20% produce baked goods, or bath and/or beauty products. This apparent divergence between what is being produced and what is being purchased are potential areas for growth in value-added products in the region. There are also opportunities for the St’at’imc community to become increasing involved in value-added production. Based on the survey and interviews, 85% of St’at’imc members eat traditional foods and 73% are active in harvesting traditional foods. However, the majority (62%) say that they are not involved with the creation of value-added products. Of those that are, the products created include salves, pine baskets, jewelry, and birch canoes. Artist paintings, tattoos, and piercings were other culturally-relative creative endeavours that were mentioned. Community investment in the following resources may leverage the ability of producers to create value-added products:
Cold storage facilities: In order to extend the life of produce once cultivated, cold storage is necessary. This type of storage is required both as a transportation mechanism (refrigerated truck) for distribution and as a seasonal storage option. For instance, fresh fruits and vegetables could be frozen and sold locally year-round.
Food Hub, Commissary, or Commercial Kitchen: The Hub would provide an opportunity for farmers to rent space and equipment to create canned, pickled, baked, smoked, or other value-added products. This Hub could also provide a centre for food collection and drop-off and an extension of the farmers market.

18
Wine cellars and micro-breweries: The demand for alcoholic beverages is fairly consistent over time. Developing a local network of cellars and microbreweries to capture a portion of the alcohol market would likely be successful. Bitterbine Hops are interested in becoming a central processor, distributor and marketer of hops. Fort Berens winery is putting in 10,000 ft2 processing facility, warehouse, and expanded tasting room (going to 12,000 cases).
8. Transportation and Distribution
Not only do farmers need to ship livestock outside of the community to be processed; inputs, such as specialized animal feed and bulk soil amendments, are required to be brought in from outside the region. In such cases, farmers must travel long distances, taking them away from the farm, or pay high prices for an external distributor. Due to the fact that most agricultural inputs, equipment, and servicing come from outside the community, prices locally are much higher because they’ve internalized transportation and shipping costs. Support systems and infrastructure for collecting, storing, processing, and distributing food to major retail markets have long been established and operate efficiently at the provincial and national levels (Sysco and Overwaitea are examples). Despite support from local retailers, producers may have difficulty accessing this distribution system because:
Many producers are too small to meet production requirements of larger scale retail outlets;
Many producers in rural and outlying areas cannot efficiently transport products to a distribution point or center; and
There may be information gaps around labeling, quality control, traceability, and food safety. Additionally, having to distribute farm products to retailers and local restaurants individually can be problematic for farmers by taking them away from their farms and increasing costs dramatically for vehicles and fuel. Local restaurateurs and retailers are often unable to travel from farm to farm picking up agricultural products, usually due to time constraints. Similarly, residents are also unable or unwilling to visit each farm to buy their products at the farm gate, opting instead to buy products in the grocery stores at times when convenient for them. Grocery stores and food markets provide a key opportunity for increased local food sales aside from Direct Farm Marketing. These retailers include:
Buy Low Foods
Lillooet Foods
Country Store
Jones’ Market Transporting farm products into and out of the Lillooet area can be challenging. Extreme weather conditions cause road closures in some areas, particularly on Highway 99, between Pemberton and Lillooet. It was also noted that Canada Post has limited hours for the current pace of business. Some opportunities were identified through the public engagement sessions to address the challenges with transportation and distribution. These include:

19
Refrigerated Transportation: Improving access to large grocery stores (Foodland, etc.) by purchasing and managing a cold storage truck (this could be done cooperatively amongst a number of farms). Alternatively, several trucks deliver food products to Lillooet and make return trips to Kamloops, Vancouver, and other communities empty. This represents a potentially untapped market.
Bulk Input Buying: Farmers could coordinate input purchases to bring in a truck to deliver bulk farm inputs regularly to save collectively on travel costs.
Institutional Purchasing: Organizations that buy and sell prepared food can be targeted. While this is already happening to some degree, it could be improved upon. Farm-to-School programs, a local food purchasing policy for hospitals and care centres, and showcasing local products to chefs and restaurants are just some ideas. Additionally, local retailers have identified their desire to purchase directly from local farmers. Contract growing opportunities may exist in the region where farmers can grow products specifically to meet retail needs.
Direct Market Business Plans: Farmers financially benefit most from direct farm sales (farmers’ markets, farm gate, internet sales, Community Supported Agriculture (CSAs)) as direct sales typically reduce time and energy spent on distribution and help farmers retain a larger portion of revenues. An example of a Direct Farm Marketing Business Plan can be found here: http://www.agf.gov.bc.ca/busmgmt/bus_guides/direct_guide.htm
9. Marketing and Sales
Farmers in this region experience a limited customer base and some have experienced difficulty in selling to retail outlets, such as large grocery chains because they either need to produce more than they are capable of, or they need to be able to offer a consistent supply, which they cannot guarantee. Some restaurants have also been difficult to sell to as they require specific timing on delivery of products and demand a range of products, which may not be available. During the survey, residents said they often find it difficult to find local farm products at local stores and that there are not enough growers at the farmers market. Farmers also expressed difficulties attending the farmers market because they are very time-consuming and take them away from the farm at peak production times of the year. As a result, only 33% of farmers who responded to the survey sell at the farmers market. Farmers were asked to explain where they market their products through the survey. Of the farmer respondents, most grow products for their own use (80%), while 71% sell products locally. Only 20% (11 respondents) indicated that they sell their agricultural products beyond the Lillooet area, mainly in Greater Vancouver, Squamish, Whistler, and Pemberton. This represents an opportunity for increasing revenues by selling outside the local Lillooet market. Lillooet has excellent access to Vancouver, Sea-to-Sky, and Interior markets through, road, and air transportation. While growing for sale outside of the region is not an overarching goal of the agriculture
20
plan, the potential should not be underestimated. A significant increase in exports could likely accompany a significant increase in profit margins, thereby spurring local food production. Many opportunities for marketing farm products exist, including:
In-Store Advertising: advertising support in the store where their products are offered. Pictures of the farmers and their families could be presented along with information about each farm. Dedicated sections in local grocery stores (10 to 12 feet of shelf-space) could be set aside for local farm products. This area could be called “Lillooet Fresh” or similar.
Development of a Farmers’ Institute or Farmers’ Cooperative: This organization would have a different mandate than producer associations. The group could oversee a branding exercise for local foods, create a mentoring program to support new and existing farmers in the area, and improve information and knowledge transfer between farmers.
Branding for Local Food: The potential exists to utilize students for marketing and graphic design support. Educational institutions or local organizations could also offer marketing courses for farmers to help support them in their efforts.
Agritourism: An Agritourism Strategy could be developed for the region. Some agritourism options that were discussed included U-Pick promotions, trail rides and hikes, wine tastings, farm crawls, and more.
According to Lillooet retails, the biggest local product sales are:
Honey
Water and ice
Fountainview carrots
Garlic
Airport Gardens produce (tomatoes, squash, etc.) Some retailers have expressed frustration at the lack of diversity or variety of local produce, lamenting the overabundance of kale, chard, and other leafy greens and a lack what actually sells well in the store (tomatoes, green onions, melons, and other fruit). There is an opportunity for greater communication between growers and retailers in the area. Growers can sit down with retailers and find out how much they sell and let them know how much they may be able to provide.
10. Consumer Awareness and Education
Increasing consumer awareness of the benefits of eating local foods in turn raises the demand for fresh and processed local food products. During discussions with farmers, many felt that education around local food and the need to support local farmers is paramount to strengthening the local economy. Conversely, members of the community indicated awareness of several aspects of eating locally (healthy, fresh, supports the local economy), but that they would like to be able to shop for local

21
products at the main retail stores. There were also concerns expressed around the cost of local food and a lack of awareness around what is available. Some suggestions for educating and supporting the local community include:
Buy Local: In conjunction with a local foods branding exercise, an education campaign could be developed with a Buy Local focus. This education campaign could target children through the School District.
Nutritionist Partnerships: A program could be developed to teach people how to cook and eat seasonally with community nutritionists providing support on using different foods. Programs such as North Okanagan Community Kitchens could be used as a model.
School Partnerships: Farmers and other community members could work with local schools to develop educational programs on agriculture and growing food. Partnerships between farms and schools can receive support from many local businesses and organizations. It may serve as a useful pilot program for other interested farmers and schools. Currently there is a garden at George M. School. Tours of Split Rock Environmental could also be organized.
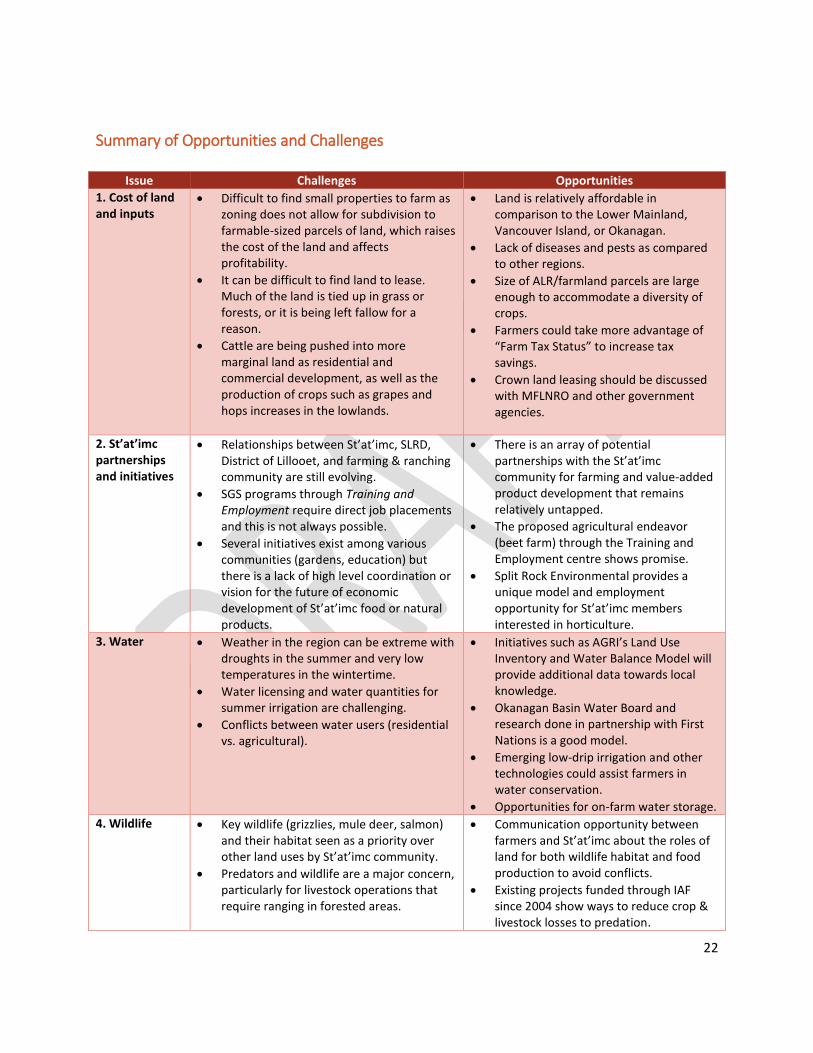
22
Summary of Opportunities and Challenges
Issue Challenges Opportunities
1. Cost of land and inputs
Difficult to find small properties to farm as zoning does not allow for subdivision to farmable-sized parcels of land, which raises the cost of the land and affects profitability.
It can be difficult to find land to lease. Much of the land is tied up in grass or forests, or it is being left fallow for a reason.
Cattle are being pushed into more marginal land as residential and commercial development, as well as the production of crops such as grapes and hops increases in the lowlands.
Land is relatively affordable in comparison to the Lower Mainland, Vancouver Island, or Okanagan.
Lack of diseases and pests as compared to other regions.
Size of ALR/farmland parcels are large enough to accommodate a diversity of crops.
Farmers could take more advantage of “Farm Tax Status” to increase tax savings.
Crown land leasing should be discussed with MFLNRO and other government agencies.
2. St’at’imc partnerships and initiatives
Relationships between St’at’imc, SLRD, District of Lillooet, and farming & ranching community are still evolving.
SGS programs through Training and Employment require direct job placements and this is not always possible.
Several initiatives exist among various communities (gardens, education) but there is a lack of high level coordination or vision for the future of economic development of St’at’imc food or natural products.
There is an array of potential partnerships with the St’at’imc community for farming and value-added product development that remains relatively untapped.
The proposed agricultural endeavor (beet farm) through the Training and Employment centre shows promise.
Split Rock Environmental provides a unique model and employment opportunity for St’at’imc members interested in horticulture.
3. Water Weather in the region can be extreme with droughts in the summer and very low temperatures in the wintertime.
Water licensing and water quantities for summer irrigation are challenging.
Conflicts between water users (residential vs. agricultural).
Initiatives such as AGRI’s Land Use Inventory and Water Balance Model will provide additional data towards local knowledge.
Okanagan Basin Water Board and research done in partnership with First Nations is a good model.
Emerging low-drip irrigation and other technologies could assist farmers in water conservation.
Opportunities for on-farm water storage.
4. Wildlife Key wildlife (grizzlies, mule deer, salmon) and their habitat seen as a priority over other land uses by St’at’imc community.
Predators and wildlife are a major concern, particularly for livestock operations that require ranging in forested areas.
Communication opportunity between farmers and St’at’imc about the roles of land for both wildlife habitat and food production to avoid conflicts.
Existing projects funded through IAF since 2004 show ways to reduce crop & livestock losses to predation.

23
Issue Challenges Opportunities
5. Economies of scale and crop diversification
There is no economy of scale in many of the smaller-scale operations, resulting in slim profit margins, so it is difficult to afford equipment or other infrastructure required to increase production.
There is frustration among retailers with the lack of availability of crops that sell well.
The availability of local products could be expanded upon through contract growing.
The climate in the region is good for tomatoes, melons, grapes, etc.
There are agroforestry opportunities and possible cooperation between forestry and agricultural resource sectors.
The establishment of new vineyards and the potential growth of the wine industry shows promise.
6. Labour The population in the region is aging, so it can be difficult to access labour resources.
Many of the younger generation are leaving the region for higher paying work opportunities.
A portion of the community, and St’at’imc in particular, are unemployed or underemployed and may be interested in working in agriculture.
Value-added food processing jobs can increase wages.
7. Processing and value-added infrastructure
In order to process livestock, or have eggs graded for sale, farmers must ship their livestock and eggs to outside facilities, which is cost prohibitive.
MIR restrictions have had severe negative impacts to the local ranching industry.
Opportunities for St’at’imc members to become involved in the production of value-added natural products.
Cold storage, food hubs/commissaries, and wine-tasting and microbreweries all exhibit strong market potential.
8. Transportation and distribution
The Lillooet area is isolated, which makes access to inputs and the customer market difficult.
The cost of distributing products and bringing in inputs from outside of the community such as equipment, services, fertilizer, and seeds can be prohibitive for small growers.
There are trucks that are returning back to the Lower Mainland from Lillooet to warehouse facilities that could accommodate some produce returning from the region.
Retailers can purchase directly from farmers in the region and send these products back to the Lower Mainland on trucks doing their return trip.
9. Marketing and sales
There is a somewhat lack of a unifying identity within the agricultural community, with a divide between ranchers and small-scale vegetable operators and emerging grape growers.
There is no local/regional branding for local/regional products.
The Lillooet region has a lot of marketing opportunities in terms of the landscape and aesthetics. The remoteness of the region is appealing and could be promoted more effectively as an agricultural region.
There is a demand for specialty niche agricultural products that are natural or organic. These can generate a higher return and could be expanded.
There is a proximity to markets such as Whistler, Vancouver, and Kamloops.
10. Consumer awareness and education
Members who are relatively new to the community don’t always know where to go or who to ask for local products.
Local products are not always featured or highlighted at retailers.
The District of Lillooet and the SLRD could play a role in promoting the agricultural potential of the region to attract more growers. They could also provide information to potential farmers

24
There is a general lack of education around the local food system in the schools.
about the biophysical and economic development capacity of the area.
Community supports “buying local”.
Partnerships between farmers, school districts, Interior Health Authority, and/or nutritionists could help bridge the awareness and education gap within the community.

25
References
Agriculture and Agri-Food Canada (AAFC), 1998. The Canadian System of Soil Classification, 3rd Edition.
http://sis.agr.gc.ca/cansis/taxa/cssc3/intro.html
Agriculture and Ranching – Summary of Input and Information, May 28, 2009. Prepared for: Southern Interior Beetle Action Coalition. Prepared by: SIBAC Staff http://www.sibacs.com/wp-content/uploads/2009/06/agriculture-and-ranching-summnary-may-20091.pdf Agricultural Land Commission (ALC), 2010. Agricultural Land Commission. Accessed October 2010.
http://www.alc.gov.bc.ca/legislation/legislation_main.htm
BC Agriculture Council, 2004. Wildlife Program Development report. BC Agriculture Council, Investment Agriculture Foundation and ARDCorp. http://www.bcac.bc.ca/sites/bcac.localhost/files/Ardcorp_Program_Documents/Wildlife%20Program%20Development%20Final%20REport%20(Dec%202010).pdf
BC Ministry of Agriculture and Lands (BC MAL), 2010. BC Agricultural Research and Development
Corporation. Canada-BC Environmental Farm Plan Program: Reference Guide. For use with the
publication: Canada-BC Environmental Farm Plan Planning Workbook. Published by BC Agricultural
Research and Development Corporation. Prepared by BC Ministry of Agriculture and Lands. 3rd Ed.
February 2010.
BC Water Resources Atlas, 2013. Ministry of Environment.
http://www.env.gov.bc.ca/wsd/data_searches/wrbc/
Environment Canada, 2013. Climate Normals. http://climate.weatheroffice.gc.ca/climate_normals
Accessed May 2013.
Kenk and Sondheim, 1987. The BC Ministry of Environment and Parks Thematic Mapping Geographic
Information System. CAPAMP. Volume 1: Data entry and validation procedures for soil, agriculture
capability, surficial geology and the all-purpose entity. MOEP Manual 10. Surveys and Resource Mapping
Branch, Ministry of Environment and Parks.
Talisman Projects Inc., 1978. Select standing committee on agriculture. ALR mapping for the Lillooet
region. Map 92I/12.
Statistics Canada, 2001 and 2006 and 2011. Agricultural Census Data.
University of Minnesota, 2011. Basics of high tunnel production.
http://swroc.cfans.umn.edu/prod/groups/cfans/@pub/@cfans/@swroc/documents/asset/cfans_asset_
330307.pdf

26
Young, G., Fenger, M.A., and H.A. Luttmerding. 1992. Soils of the Ashcroft Map Area. BC Ministry of Environment. MOE Technical Report 23 ISSN 0375-5886. Report No. 26 of the BC Soil Survey. Victoria, BC.

0
Appendix
I. Survey Results
The Consulting Team collaborated with SLRD Staff and the Working Group to develop three surveys on food matters and agricultural development opportunities. The three surveys were developed to best target the interests of
Farmers
St’at’imc members
Community members Hard copies of the survey were distributed in person at the June 2013 open houses, made available at he Lillooet library, and were mailed to ranchers including self-addressed and stamped return envelopes to encourage completions rates. The surveys were also made available online to enable members of the interested public to provide input on a range of key issues outside of, or in addition to, formal meetings and public events. The survey received nearly 200 responses between early August and the end of October 2013. Input received was used to develop the list of issues and priorities, determine opportunities and challenges, and refine the list of recommended actions. It is important to note that the survey participants do not represent a random sample due to the fact that they were able to self-select on their choice to fill out the survey (i.e. participation was voluntary), therefore results are not statistically significant. Full results from the public opinion survey can be found in the Public Consultation Summary Report (see Appendix).
Highlights of survey results:
Farmers:
52% of the farmers have been farming for 20-30 years (15/29)
Vast majority of food produced is just for personal use
Largest number of responses: o Apples (24 responses) o Garlic (23 responses) o Peas (23 responses) o Value-added: 50% (9/18) produce canned preserves/pickles
Marketing: o Easiest to sell: dried fruit (2), beef (4), fresh fruit (4), hay (5), garlic (5) o Hard to sell: beef/meat products (4), fruit (5) o 86% of products are produced for own use (24/28) o 71% for trade or barter (20/28) o 71% for sale in Lillooet and Area B (20/28) o 43% in the Greater SLRD (12/28)
Farmers markets: o 48% do not sell at farmers markets (13/27) o 33% sell at Lillooet farmers market (9/27)
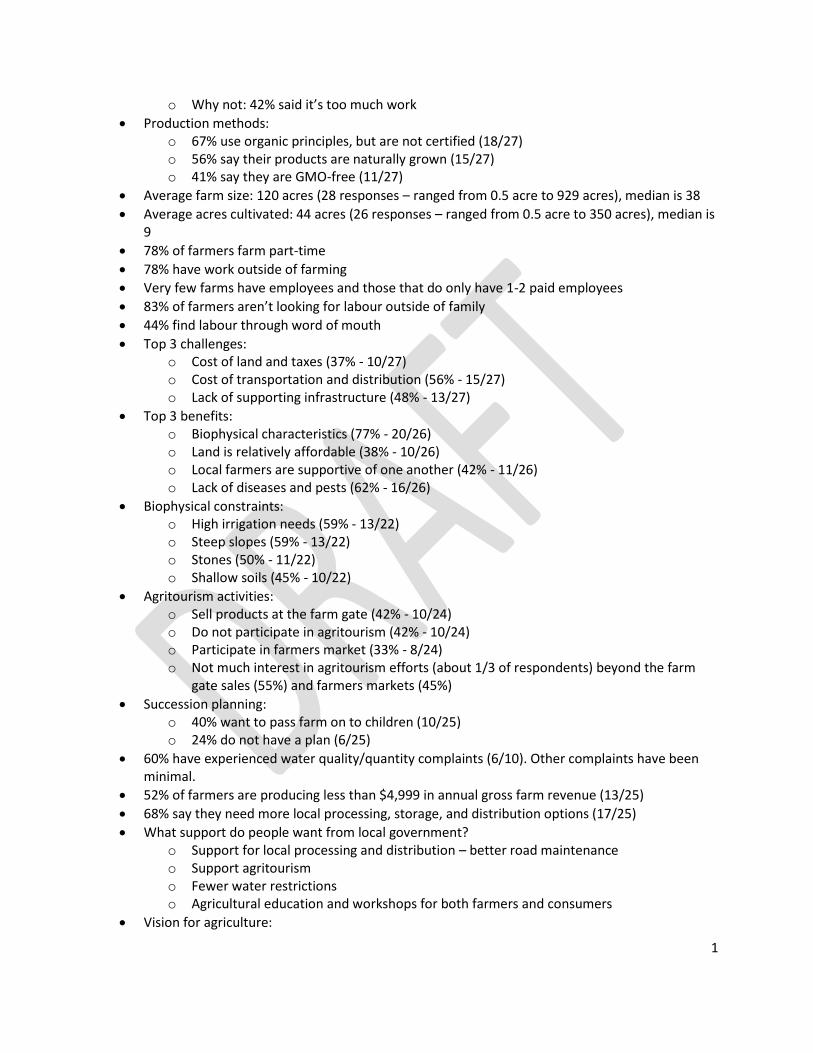
1
o Why not: 42% said it’s too much work
Production methods: o 67% use organic principles, but are not certified (18/27) o 56% say their products are naturally grown (15/27) o 41% say they are GMO-free (11/27)
Average farm size: 120 acres (28 responses – ranged from 0.5 acre to 929 acres), median is 38
Average acres cultivated: 44 acres (26 responses – ranged from 0.5 acre to 350 acres), median is 9
78% of farmers farm part-time
78% have work outside of farming
Very few farms have employees and those that do only have 1-2 paid employees
83% of farmers aren’t looking for labour outside of family
44% find labour through word of mouth
Top 3 challenges: o Cost of land and taxes (37% - 10/27) o Cost of transportation and distribution (56% - 15/27) o Lack of supporting infrastructure (48% - 13/27)
Top 3 benefits: o Biophysical characteristics (77% - 20/26) o Land is relatively affordable (38% - 10/26) o Local farmers are supportive of one another (42% - 11/26) o Lack of diseases and pests (62% - 16/26)
Biophysical constraints: o High irrigation needs (59% - 13/22) o Steep slopes (59% - 13/22) o Stones (50% - 11/22) o Shallow soils (45% - 10/22)
Agritourism activities: o Sell products at the farm gate (42% - 10/24) o Do not participate in agritourism (42% - 10/24) o Participate in farmers market (33% - 8/24) o Not much interest in agritourism efforts (about 1/3 of respondents) beyond the farm
gate sales (55%) and farmers markets (45%)
Succession planning: o 40% want to pass farm on to children (10/25) o 24% do not have a plan (6/25)
60% have experienced water quality/quantity complaints (6/10). Other complaints have been minimal.
52% of farmers are producing less than $4,999 in annual gross farm revenue (13/25)
68% say they need more local processing, storage, and distribution options (17/25)
What support do people want from local government? o Support for local processing and distribution – better road maintenance o Support agritourism o Fewer water restrictions o Agricultural education and workshops for both farmers and consumers
Vision for agriculture:

2
o Profitable o Expansion o Diversity o Optimistic outlook for the future o Focus on sustainable production methods
Community Members:
64% are gardeners (29/45), 56% are concerned citizens (25/45)
93% of respondents have a garden at home (41/44)
98% grow tree fruits (39/40), 90% grow vegetables (36/40), 80% grow herbs/flowers (32/40)
36% do not want to start an income generating farm (16/44)
Vision for agriculture: o Decreased water restrictions o Focus on organic and sustainable production methods o GMO free o Local processing opportunities o Local restaurants that showcase local food o Diverse small-scale agriculture
Current state: o Disconnected o Underappreciated o Not realizing fullest potential
Desired state: o Organic o Supportive local market o Job opportunities o Young farmers
Top 3 challenges: o Cost of land and taxes (42% - 18/43) o Cost of transportation/distribution (49% - 21/43) o Lack of supporting infrastructure(processing, cold storage) (44% - 19/43)
Top 3 benefits: o Biophysical characteristics (85% - 35/41) o Size of ALR/farmland parcels are large enough to accommodate a diversity of crops (41%
- 17/41) o Land is relatively affordable (54% - 22/41)
57% say they always support buying local (31/54)
Local products that are purchased: o Baked goods – 68% (34/50) o Canned preserves and pickles – 46% (23/50) o Wine, beer, spirits – 44% (22/50) o Vegetables – 46% (23/50)
Crops community members would like to see grown locally: o Nuts – 56% (29/52) o Dairy (cow) – 56% (29/52) o Poultry – 58% (30/52)
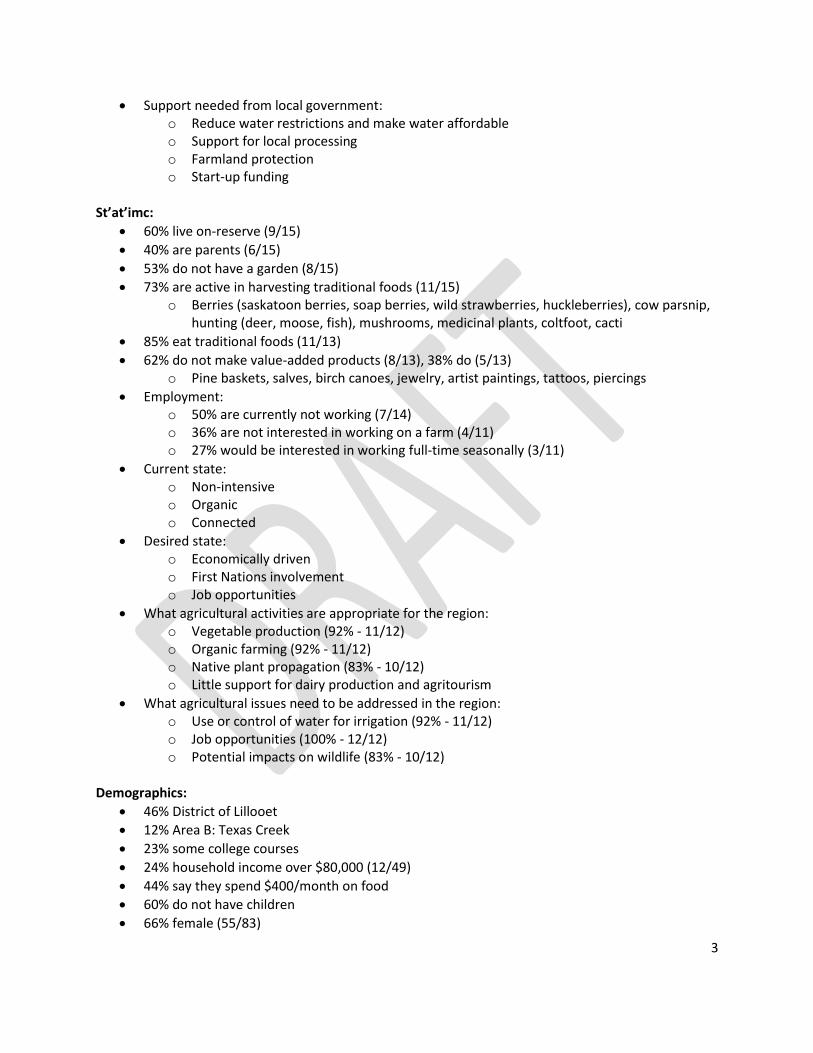
3
Support needed from local government: o Reduce water restrictions and make water affordable o Support for local processing o Farmland protection o Start-up funding
St’at’imc:
60% live on-reserve (9/15)
40% are parents (6/15)
53% do not have a garden (8/15)
73% are active in harvesting traditional foods (11/15) o Berries (saskatoon berries, soap berries, wild strawberries, huckleberries), cow parsnip,
hunting (deer, moose, fish), mushrooms, medicinal plants, coltfoot, cacti
85% eat traditional foods (11/13)
62% do not make value-added products (8/13), 38% do (5/13) o Pine baskets, salves, birch canoes, jewelry, artist paintings, tattoos, piercings
Employment: o 50% are currently not working (7/14) o 36% are not interested in working on a farm (4/11) o 27% would be interested in working full-time seasonally (3/11)
Current state: o Non-intensive o Organic o Connected
Desired state: o Economically driven o First Nations involvement o Job opportunities
What agricultural activities are appropriate for the region: o Vegetable production (92% - 11/12) o Organic farming (92% - 11/12) o Native plant propagation (83% - 10/12) o Little support for dairy production and agritourism
What agricultural issues need to be addressed in the region: o Use or control of water for irrigation (92% - 11/12) o Job opportunities (100% - 12/12) o Potential impacts on wildlife (83% - 10/12)
Demographics:
46% District of Lillooet
12% Area B: Texas Creek
23% some college courses
24% household income over $80,000 (12/49)
44% say they spend $400/month on food
60% do not have children
66% female (55/83)
4
II. Notes from the Technical Workshop on November 6th, 2013 Sculpting a regional agricultural identity: Marketing and branding for success Sandy Blue, Maple Ridge Economic Development Office, True North Fraser Pitt Meadows, Maple Ridge, and Mission partnered with BC Jobs Plan to develop a regional partnership to develop an agricultural marketing strategy and agrifood hub amongst the communities. The True North Fraser concept evolved over an 18 month timeline. Province helped with resources and expertise. Presentation link: http://uplandconsulting.ca/wp-content/uploads/Blue.pdf Small group discussion – how could an initiative like this work in Lillooet?
Very inspiring concept of working regionally on a brand
Could be based out of the economic development office
LIllooet and area is at a preliminary stage when compared to agriculture in the lower mainland
The Lilllooet “Rugged” branding was a good exercise and agricultural branding could be based off of that
Resource capacity is an issues (human and funding)
Need a critical mass of producers and products
Need champions who are willing to work on a volunteer-basis (we have this somewhat, Lillooet Food Matters etc)
Could be hard and expensive to get started or could be done with simplicity in mind
Lots of passersby in Lillooet, tourists going to Pemberton or Kamloops, it would be good to finally capitalize on these people
Lillooet and surrounding area could be branded as a good place to start a farm (climate is great, land relatively affordable)
Blue Goose and other players are coming to the area, outside money is arriving and we can’t stop it but we can direct it to good use
There are empty trucks leaving Lillooet all the time, these could be used to transport local products to Pemberton, Kamloops, other markets
Marketing and branding will open up opportunities and create jobs in the agricultural and food production industries
Water, agriculture, and climate change: Economic implications Nelson Jatel, Okanagan Basin Water Board Nelson discussed the work that the OBWB has done on the issue of water scarcity and agriculture and what it means for the future of urban and rural planning in BC. Presentation link: http://uplandconsulting.ca/wp-content/uploads/Jatel.pdf Small group discussion – what will the water and climate change impacts be on agriculture in the Lillooet region, and how can we adapt/mitigate?
Water data is so important to the future of agriculture in the area
Connections and partnerships are already in place, we just need to patch into them
5
List of questions could be developed to provide to students who are looking for research project ideas
From the First Nations perspective, water conservation is a jurisdictional issue. Don’t want provincial or local government making water decisions on First Nations territory
The agricultural committee could develop a list of specific challenges and obstacles as a way of “prioritizing the problems” - this will be achieved in the Ag Plan to some extent
Interesting that in the Okanagan most water is used in hay/grass production and not vineyards, could have implications for the future of water use in Lillooet if crop production shifts towards grapes
The Water Balance Model being done by the Ministry of Agriculture will provide answers to a lot of questions but may also bring up additional questions
Successful examples of First Nations agricultural business endeavours Joel Liman, First Nations and Agriculture Expert Joel provided an overview of some successful First Nations enterprises involving food and agriculture, including but not limited to Split Rock Nurseries, Nk Mip Cellars, and Siska Traditions. Presentation link: http://uplandconsulting.ca/wp-content/uploads/Liman.pdf Small group discussion – what opportunities for St’at’imc agri-business partnerships and opportunities exist in the region? Who are some of the key players needed to be mobilized to move forward?
There is a FoodSafe kitchen at Split Rock but not enough FoodSafe certified staff to use it
Don’t have a storefront at Split Rock, sell mainly at farmers markets. A storefront would be a good opportunity
There is a difference between agriculture and traditional food gathering
Regulations around sales of traditional foods and medicines are challenging
The St’at’imc Government Services Education & Training initiatives is working with a 20 year framework in mind
SGS Education and Training has to be tied to employment opportunities
Labour market study was done 2 years ago
Industry won’t talk partnerships if we don’t have skilled workers to offer
Ideas: microfiber, working farm schools, sugar beets
Developing processes for potential partnerships
There is a pilot project underway for an environmental technician and monitoring training program (12 students involved)
Working with Investment Agriculture Foundation to do a 5 year pilot project
There are existing St’at’imc land use plans and water use plans
Wild harvest areas are identified
There are 17 water projects underway (small hydro)
The plans are from 2004 and need updating
Looking at ways to protect native plants and medicines
There are signs of cattle destroying native grasses in the Fountain area, these are issues that cross the agriculture – First Nations divide
There are health issues (like diabetes) that band members are dealing with, so there is an opportunity to tie in community gardens, fresh local foods, with a health program for band members
6
A socio-economic report was completed in 2009 Small scale food processing: resources, opportunities, and success stories Candice Appleby, Executive Director, Small Scale Food Processors Association (virtually) Candice discussed some of the workshops and courses that SSFPA offers as well as some examples of successful value-added endeavours that have developed as a result. Presentation link: http://uplandconsulting.ca/wp-content/uploads/Appleby.pdf Small group discussion: what types of value-added opportunities exist in the Lillooet region? What would be relatively easy to process and what would be more difficult? What are some of the challenges? A wealth of information and resources exists on those websites, very happy to learn about it
Looking forward to exploring the website in more detail
Interested to hear about small-scale abattoirs, have any emerged from the SSFPA program
There is one being operated by the Grand Forks Agricultural Society – a mobile abattoir – they are processing pork, beef, poultry
Okanagan poultry slaughterhouse
Kootenays – there are 2 mobile slaughterhouses operating
The waste disposal associated with the carcasses is an issue, it needs to be disposed of at a special licensed facility.
The SSFPA website could be used to further market Lillooet products. So far there are no local products listed on the website
It is a user-based site so just needs input from local farmers
7
III. Discussion of Land Use Policies and Regulations The agricultural industry in BC is regulated by numerous government policies at federal, provincial and municipal levels. The regulations relate to environmental protection, health and safety, imports/exports and land use (see Appendix A for more details). Local, regional and provincial regulations were discussed to some extent at the open houses and through the survey. Challenges that were identified include: Meat Processing Regulations: Adopted in 2004, the Meat Inspection Regulation (MIR) sets out construction,
inspection and other requirements for provincially licensed slaughter facilities in BC. Compliance with the MIR became mandatory in September of 2007, and significant changes to licence classes were made in April 2010 (BC Laws, 2004). The number of licensed slaughter plants in B.C. has increased from 12 in 2004 to 37 in 2010 (BCMHS, 2010a).
Navigating Supply Management Systems: There is significant room in the regional market for increased egg and dairy production (both organic and non-organic). While supply management systems (e.g. quota) hinder the ability to easily enter the market, there are methods and strategies to overcome some of these challenges; all of which have been tested successfully in other communities. In particular, non-dairy (goat, sheep) milk and cheese could be produced at a larger scale and dairy cheese could be produced under special licensing. Housing Limits on ALR Land: There were many concerns expressed around the limits to housing in the ALR. Many felt that ALC policies and regulations limit potential cooperative farming ventures, resulting in a significant barrier to farming in the region. Some also felt that limited housing opportunities in the ALR restrict farmers’ ability to earn rental income to support their farming endeavours. However, it was unclear whether opinions were based on accurate data, suggesting clarity around housing allowances for ALR properties would be beneficial for the farming community at large. Currently, under ALC regulations, a local government may permit a secondary suite within a single family dwelling and an additional manufactured home for immediate family or for farm help. Health and Safety Permits: The threat of food-borne illnesses has received increased attention in recent years. Growers must keep records detailing their production practices, and Health & Safety permits from Interior Health are often required to sell prepared foods at Farmers Markets. Some farmers felt these requirements were onerous and prevented them from easily selling value-added or prepared foods at the markets. Crown land Tenure Agreements: There is some support amongst the farming community to explore Crown land tenure agreements and business arrangements in order to overcome limitations to fee simple ownership of ALR land. The high cost of land prevents outright ownership for some, while the limitations surrounding leasing reduce the types of tenure agreements possible. Many expressed frustration with the Land Title Act, which essentially limits leases to five years, after which the lessee can be granted title on the property. Without longer term leasing, licencing, or other renting arrangements there is minimal motivation for farmers to invest in crops, livestock, or equipment that will only become profitable in the long term.
8
Agriculture is included in federal policy through trade agreements, food safety and inspection, food labelling, and the promotion of quality of life through healthy eating. Agriculture and Agri-Food Canada focuses on domestic and international trade, farm income stabilization, research and development, and the regulation of animals and plants. It provides information, research and technology, and policies and programs towards the security of the food system, health of the environment and innovation for growth. Partners include the Canadian Dairy Commission, Canadian Food Inspection Agency, Canadian Grain Commission, Farm Credit Canada, and the Farm Products Council of Canada (AAFC, 2010) The Canadian Food Inspection Agency regulates food products, packaging and labelling. It is responsible for testing food products, setting requirements on traded goods, and protecting plants from pests and diseases (CFIA, 2010). Fisheries and Oceans Canada is responsible for protecting aquatic ecosystems and administers the Fisheries Act. Fisheries and Oceans Canada strives to work with commercial, recreational and First Nations fisheries to support sustainable aquaculture (DFO, 2010). Health Canada regulates agriculture indirectly by tracking outbreaks and diseases and overseeing environmental health programs. The Public Health Agency of Canada, together with Health Canada and the Canadian Food Inspection Agency, work cooperatively with health authorities to protect the public from food contamination outbreaks (HC, 2010). The Province of BC shares a mandate with the federal government to promote agriculture and health. Detailed descriptions of various provincial agencies and associated legislation involving farming and agriculture are provided below. They include the Ministry of Agriculture, the Agricultural Land Commission, and the Ministry of Community, Sports, and Cultural Development. In addition, several other areas of jurisdiction include food-related authority and a brief description of each is provided. Ministry of Agriculture The Ministry of Agriculture is responsible for providing a balanced approach that promotes economic and social development objectives with those of environmental sustainability for agriculture, aquaculture and food sectors in BC. In addition, the Ministry funds the Agricultural Land Commission and the BC Farm Industry Review Board (MAL, 2010). A wide variety of legislation affecting agricultural land, farm workers, and farm activities is administered by the Ministry of Agriculture, including:
Agri-Food Choice and Quality Act
Agricultural Produce Grading Act
Agrologists Act
Animal Disease Control Act
Bee Act
British Columbia Wine Act
Farm Income Insurance Act
Farm Practices Protection (Right to Farm) Act
Farming and Fishing Industries Development Act
Fish Inspection Act
Fisheries Act
Food Products Standards Act
Fur Farm Act
Game Farm Act
Greenbelt Act
Insurance for Crops Act
9
Land Act
Land Reserve Commission Act
Land Title and Survey Authority Act
Livestock Act
Local Government Act (sections 916-919 only)
Milk Industry Act (ss. 1-11, s.12 in respect of tank milk receivers licenses, ss. 13-43)
Natural Products Marketing (BC) Act
Plant Protection Act
Seed Potato Act
Veterinarians Act
Water Utility Act
Weed Control Act Key Players in Food Health and Safety The BC Ministry of Health Services (MHS) administers the Public Health Act and Food Safety Act and establishes standards and procedures aimed at protecting public health. The Food Safety Act was established in 2002 to consolidate food safety aspects of the Milk Industry Act, Meat Inspection Act, and Health Act under one statute administered by MHS (BCMHS, 2010). Regional Health Authorities administer the Food Premises Regulation under the Health Act and licence, inspect, and respond to complaints regarding food facilities under their jurisdiction. Interior Health is responsible for the inspection and enforcement of food safety regulations. In addition to the Food Premises Regulation, VCH administers the FOODSAFE training program (which teaches safe food handling procedures to those in the food services industry) and the Food Security Program. The BC Centre for Disease Control (BCCDC) operates its Food Protection Services Division under the Provincial Health Services Authority (PHSA). The PHSA addresses public health concerns regarding food and food protection by providing scientific expertise to the Regional Health Authorities and to the BCMHS (BCMHS, 2010). The BCCDC is responsible for the inspection and licensing of provincial dairies and abattoirs and for providing food safety guidelines, training and information, and laboratory services to Public Health Inspectors. In 2006, the Federal government provided BC with $2.64 million to enhance and promote food safety systems in the food processing industry (BCCDC, 2010). The partnership included:
BC Centre of Disease Control
Regional Health Authorities
Small Scale Food Processing Association
BC Food Processors Association
Food processing industry
BC Ministry of Agriculture and Lands The Provincial Meat Inspection Regulation Adopted in 2004, the Meat Inspection Regulation (MIR) sets out construction, inspection and other requirements for provincially licensed slaughter facilities in BC. Compliance with the MIR became mandatory in September of 2007, and significant changes to licence classes were made in April 2010 (BC Laws, 2004). The number of licensed slaughter plants in B.C. has increased from 12 in 2004 to 37 in 2010 (BCMHS, 2010a). Prior to the 2010 amendments, the MIR included three class levels of licensing for meat sold in the province: Class A: facilities providing slaughter and cut-and-wrap services; Class B: facilities only providing slaughter services; and
10
Class C: facilities operating without inspection until upgrades to full licencing are completed. This was introduced as a temporary measure in 2007 and has since been phased out. Amendments to the regulation in April 2010 introduced a graduated licensing system that includes two licences (Class D and Class E) designed to support local livestock and meat production in B.C.'s more remote and rural communities. Class D: allows on-farm slaughter of 1-25 animal units annually for direct sale to consumers or retail sales to secondary food establishments (e.g., restaurants and meat shops) within the boundaries of the regional district where the meat was produced. Class D licence holders may slaughter their own or other peoples' animals. Class D licences are only available in 10 provincially designated regional districts (designated areas). Class E: allows on-farm slaughter of 1-10 animal units annually for direct sale to consumers. Sales are restricted to the regional district in which the meat was produced, and operators are only permitted to slaughter their own animals. One animal unit means: combined weight, when measured alive, of 1,000 lbs (454 kg) of meat (e.g., beef, poultry, bison, etc.). Applications for Class D and E are reviewed on a case-by-case basis. Class D & E facilities must complete the SlaughterSafe training program, a food safety plan, and a site assessment with the local health authority (BCMH, 2011). SlaughterSafe is run by the regional health authorities (Interior Health) and was collaboratively designed by public health professionals and volunteer farmers in rural and remote communities. SlaughterSafe is part of a larger provincial government initiative to promote food safety and food security regarding livestock and meat production in remote communities. The MIR allows for innovative approaches, such as mobile slaughter facilities that can provide services to several rural communities. Many small scale producers, however, have criticized the MIR as restricting their ability to slaughter their animals in areas not served by provincially-licensed facilities. This created high costs associated with meat processing for farmers in more remote communities, such as the Gulf Islands, Sunshine Coast, and Central Coastal areas. Ministry of Environment The BC Ministry of Environment (MoE) manages and delivers a wide range of programs and services that support the Province’s environmental and economic goals. The Ministry is a leader in implementing the provincial government’s climate change initiatives and in promoting recreational opportunities, such as hunting, fishing and exploring BC’s parks. MoE is responsible for a wide variety of legislation affecting agricultural activities, such as the Drainage, Ditch and Dike Act, Environmental Management Act, Fish Protection Act, Integrated Pest Management Act, Water Protection Act, and Wildlife Act (MoE, 2010). MoE’s role in sustainable environmental management and stewardship includes implementation of BC’s Climate Action Plan and Living Water Smart Plan. Agricultural Waste Control Regulation: The Agricultural Waste Control Regulation (AWCR) is enforced under the Environmental Management Act (EMA). Agricultural waste discharges require authorization and can be regulated by a code of practice. Minor amendments were made to the AWCR in 2004 and 2008, to establish consistent rules for all boilers used in agriculture, as well as emission standards for biomass (wood‐fired) boilers used in agriculture. In October 2009 the MoE announced a review of the AWCR, which is still underway, to harmonize the standards in this regulation with other regulations, update handling and disposal of agricultural technologies regarding agricultural wastes, and for compliance and enforcement issues (BC Laws, 2008). Riparian Areas Regulation: The Riparian Areas Regulation (RAR) was enacted under Section 12 of the Fish Protection Act in 2004, and calls on local governments to protect riparian areas during residential, commercial, and industrial development by ensuring that proposed activities are subject to a science based assessment conducted

11
by a Qualified Environmental Professional (QEP) (MoE, 2010a). Riparian areas are defined as freshwater habitat areas along the border of streams, lakes, and wetlands. The RAR applies only to communities on the east side of Vancouver Island, the Lower Mainland and the Southern Interior, as these are the parts of the province that are experiencing the most rapid urban growth. A local government must ensure that its bylaws and permits under Part 26 of the Local Government Act provide a level of protection that is comparable to or exceeds that of RAR (MWLAP, 2006). Part 26 of the Local Government Act includes:
(a) removal, alteration, disruption or destruction of vegetation; (b) disturbance of soils; (c) construction or erection of buildings and structures; (d) creation of non-structural impervious or semi-impervious surfaces; (e) flood protection works; (f) construction of roads, trails, docks, wharves and bridges; (g) provision and maintenance of sewer and water services; (h) development of drainage systems; (i) development of utility corridors; (j) subdivision as defined in section 872 of the Local Government Act;
The RAR does not apply to agricultural activities, however, the construction of residential structures or other “development” activities within agricultural areas (such as within the ALR), would be subject to the RAR. It also applies to non-farming activities on non-ALR lands that may otherwise be used, designated, or zoned for agriculture. Other aquatic-related regulations also still apply to agricultural activities, such as the Water Act and Fisheries Act, and practices to encourage stewardship in agricultural lands are highly recommended (MWLAP, 2006). Ministry of Community, Sport, and Cultural Development Formerly the Ministry of Community and Rural Development, the BC Ministry of Community, Sport, and Cultural Development (MCSCD) is responsible for the administration and maintenance of a number of statutes establishing the legal framework for local governments in BC. The purpose of the MCSCD is to equip communities across BC to build strong, competitive economies (MCSCD, 2010). The four key pieces of policy and legislation administered by the MCSCD affecting agricultural land use at the local level are the Community Charter the Local Government Act, the Assessment Act and the Land Title Act. Community Charter: The Community Charter came into effect in 2004 and establishes the legal framework for core municipal powers (BC Laws, 2003). The purposes of the Charter are to provide municipalities and their councils (and to a lesser extent Regional Districts and their Boards) with: (a) A legal framework for the powers, duties and functions necessary to fulfil their purposes; (b) The authority and discretion to address existing and future community needs; and (c) The flexibility to determine the public interest of their communities and to respond to the different needs and changing circumstances of their communities. Local Government Act: The Local Government Act (LGA) establishes the legal framework for regional districts and contains important local government regulations concerning planning and land use. Under the Local Government Act and Community Charter, local governments are responsible for the development and implementation of official community plans (OCPs), land use zoning and other land use bylaws. The LGA provides several directions toward farming through local land use planning, including (RSBC, 1996):
Section 878 (1) stipulates that local governments may include in OCPs “policies…respecting the maintenance and enhancement of farming on land in a farming area or in an area designated for agricultural use the community plan”;

12
Section 903(5) states that “…a local government must not exercise the (zoning) powers under this section to prohibit or restrict the use of land for a farm business in a farming area unless the local government receives the approval of the minister responsible for the administration of the Farm Practices Protection (Right to Farm) Act.”
Section 917 provides the authority for local governments to adopt farm bylaws to regulate farm management activities in farm areas, subject to approval from the minister responsible for Agriculture;
Section 919.1 (1) provides local governments with the authority to designate a development permit area (DPA) for the “protection of farming.”
Assessment Act: The Assessment Act is administered by BC Assessment, a provincial Crown Corporation responsible for the classification of properties in B.C. for property assessment and tax purposes (RSBC, 1996a). Farm classification is a voluntary program providing the benefit of a low tax rate for assessed properties. Even though property may be zoned as agricultural land, or in the provincial ALR, farm classification will only be granted if the land (or at least a portion of it) is being actively used for primary agricultural production and it meets the other requirements of the Act. Only land can be classified as farm land - buildings (residences and outbuildings) are classified separately, typically as residential. Land qualifies for farm classification under the following conditions:
The land is used for “primary agricultural production”;
The land is the site of “a farmer’s dwelling”;
The land is used for training and boarding horses in a horse rearing operation;
The land otherwise contributes to primary agricultural production such as land used for drainage, irrigation, buffers and windbreaks.
Agricultural production for purely on-site consumption and the breeding and raising of pets, other than horses, does not qualify. A certain minimum amount of income must be produced from the primary agricultural production, and these requirements vary depending on the total land area. For example, a minimum annual value of $2,500 is required for land between 8,000 m
2 and 4.0 ha and $10,000 if the total land area is less than 8,000 m
2.
The Assessment Act has been criticized in the past as creating an unfair burden to small lot farmers and farmers who operate outside of the ALR. In 2009, the Farm Assessment Review Panel provided a report to the Provincial Government recommending a number of changes to the farm assessment process and Regulation 411/95 (Farm Assessment Review Panel, 2009). Prior to the review, assessment policy dictated that on a parcel of land, only that portion that was actually used for agricultural production would be classed as farm, with the remainder of the parcel classed as residential by default. This approach is commonly referred to as “split classification” of farm land, and it applied to farms both in and outside of the ALR. At the time of the review there were about 8,000 farms that were “split classified” around the province and this was of particular concern for smaller farms in the rural areas of southern Vancouver Island, the Gulf Islands, and the Lower Mainland, where property values are very high. Some of the Panel’s recommendations have been incorporated since the review, including the elimination of the split classification of farm properties in the ALR that are not used for other purposes and for non-ALR properties where at least 50% of the property is in, or contributes to, production, or 25% is in production and meets a higher income threshold ($10,000). For leased land, only the land actually in production will be classed as farm. Land Title and Survey Authority Act: The Land Title and Survey Authority of BC (LTSA) is a statutory corporation responsible for managing the land title and survey systems of BC and its mandate and responsibilities are set out in the Land Title and Survey Authority Act. The mandate of the LTSA is to create confidence by delivering assured land title and land survey systems essential to the property market and economic foundation of the province (LTSA, 2010).
13
As pertaining to agriculture, the LTSA provides specific directions regarding subdivision through the Land Title Act (RSBC, 1996b). Section 86 (1) states that an approving officer may refuse to approve a subdivision if:
(ix) the subdivision is unsuited to the configuration of the land being subdivided or to the use intended, or makes impracticable future subdivision of the land within the proposed subdivision or of land adjacent to it; (x) the anticipated development of the subdivision would unreasonably interfere with farming operations on adjoining or reasonably adjacent properties, due to inadequate buffering or separation of the development from the farm, or; (xi) despite subparagraph (ix), the extent or location of highways and highway allowances shown on the plan is such that it would unreasonably or unnecessarily increase access to land in an agricultural land reserve.
Section 219 of the Land Title Act states that a municipality or regional district may register a covenant on the title to land to protect specific characteristics of land in or adjacent to the ALR.
Local and Regional Plans
St’at’imc Preliminary Draft Land Use Plan
St’át’imc Preliminary Draft Land Use Plan has been developed by the St’át’imc Land and Resource Authority (SLRA), using information handed down through the generations since time immemorial. The vision is of a continuing and renewed relationship between St’át’imc people (úcwalmicw) and the land (tmicw) which: • respects St’át’imc cultural traditions - using the ways (nt'ákmen), laws (nxékmen) and standards of our people as passed down through the generations; • respects nature – putting the health of the water, the air, the plants, the animals and the land itself before all else; • is under St’át’imc authority – letting our people decide collectively how the land and resources of the St’át’imc territory will be managed; and, • serves the St’át’imc communities – recognizing that resources continue to provide sustenance in old and new ways to all our people. The St’át’imc goal is to ensure that the Nxekmenlhkálha lti tmícwa (St’át’imc Land Use Plan) provides for the needs of the four-legged people (e.g., deer, grizzly); the winged people (e.g., raptors); the root people (e.g. berries, medicinal plants); as well as the two-legged people (the St’át’imc). The methodology used by the SLRA in the development of the preliminary draft land use plan was designed to give life to the St’át’imc Vision and Principles through a St’át’imc ecosystem-based planning process. In particular, focusing first on what to leave behind on the land to sustain ecology and culture, rather than on resource extraction and short-term economic benefit. The St’át’imc Land Designations are:
Water Protection Areas – to ensure water quality, quantity and timing of flow to St’át’imc communities, domestic use watersheds and 50 metre no logging buffers on all streams and water bodies are included in Water Protection Areas.
Cultural Protection Area – all of St’át’imc territory is designated as a Cultural Protection Area, in which St’át’imc written authorization is required before land or resources are allocated, extracted or used.
Grizzly Protection Areas – to ensure that grizzlies’ food, shelter and security (safety) needs are met.
Deer Protection Areas – to ensure that migration corridors and wintering and fawning areas are protected.
14
Fish Protection Areas – to protect areas of high intensity St’át’imc use within one km of fish streams and to protect fish habitat through buffers along streams.
General Habitat Protection – to protect remaining old growth forests, ecosystems that are naturally rare, and remnants of heavily impacted ecosystems in St’át’imc territory; by maintaining habitat we seek to meet the needs (e.g., food and medicines) for all species and present and future generations of humankind.
Environmentally Sensitive Areas – to ensure that resource development and road building don’t occur on steep slopes or in areas where soils are poor/forests will have problems regenerating.
Community Economic Development – low impact St’át’imc economic activities (harvesting of traditional foods, low impact eco-tourism) are allowed in specified land designations; the location of other community economic development areas is the subject of an ongoing community process.
Restoration Areas –areas of St’át’imc territory that have been damaged by past human activities and require restoration, including the effects of hydro dams.
The Lillooet Land Resource Management Plan (LRMP)
From 1996-2001 the BC Ministry of Sustainable Resource Management undertook the Lillooet Land Resource Management Plan (LRMP). The plan provides strategic direction for provincially-administered land resources in the Lillooet area. While the document is now somewhat dated the planning process itself helped to identify several issues related to agriculture. These include:
Agricultural expansion is limited by the availability of affordable arable Crown land, irrigation water and rangelands.
Current ranching and agri-tourism operations require access to productive Crown range to remain viable.
Increasing competition for and conflict over Crown resources from other types of use and development.
Loss to livestock due to predator/livestock interactions. In order to overcome these challenges a number of agricultural objectives were identified through the LRMP process, including:
Enhance access to Crown Land to support the expansion and diversification of a sustainable agriculture industry
Maintain or enhance the productivity of agricultural lands by retaining existing water rights for irrigation and by identifying new sources of irrigation water
Minimize livestock/predator interactions
Minimize agricultural conflicts that may result from adjacent land uses such as community activities expansion, industrial activities, wildlife or recreational activities
Rangeland was given particular attention in the LRMP. Rangeland issues were identified as:
Improper range practices can degrade rangeland health and productivity, and negatively impact other resource values.
The viability of industries dependent on range agreements relies on the maintenance of current range agreements and the ability to capitalize on new grazing opportunities.
Noxious weed invasion decreases the health, productivity and biodiversity of rangelands.
Lack of a comprehensive inventory describing the current condition of rangeland resources. Rangeland objectives included:
Maintain or enhance sustainable livestock grazing on Crown range
Manage livestock grazing to maintain healthy and vigorous rangeland plant communities
Manage livestock to maintain and restore riparian areas in a properly functioning condition and, in community watersheds, to prevent declines in water quality

15
Prevent and control noxious weed invasion
Subject to available resources, increase knowledge and information about the range resource
The SLRD Integrated Sustainability Plan (ISP)
The SLRD adopted its ISP titled “Sustainable SLRD – Integrated Sustainability Plan” in 2013. The SLRD ISP is a high-level policy document that is comprehensive, long-term and is intended to guide SLRD legislative, policy and planning decisions, as well as corporate operations. The ISP delivers a vision, strategic plan and implementation process for creating a successful and sustainable region twenty years from now and beyond. Within this document, the Food and Agriculture Strategy Area addresses how the region supports an affordable and reliable food system and promotes agricultural activities within the region that nourishes residents’ appetite, celebrations and culture. The strategy is aimed at maintaining the integrity of the land while moving toward a more sustainable food system, from farm to fork to disposal. In the process of developing the ISP, the following Descriptions of Success for Food and Agriculture Strategy Area were utilized:
Within the ISP, Appendix B: List of Potential Actions for Consideration describes the list of initiatives identified to move the SLRD from the Current Reality toward the Desired Future as defined by the criteria for success and sustainability. Actions include everything from basic operational activities to the development of policies and strategic plans. [An initial longer list of actions was identified through input from the public and SLRD staff]. The list was then prioritized by the ISP Steering Committee and presented to SLRD managers for review. The following List of Food and Agriculture Actions were identified for consideration:
By 2030:
1. The region celebrates local food and related products, and the buy-local ethic of residents and
businesses supports the agricultural sector within the region.
2. The SLRD is known as a region that produces and celebrates healthy, sustainable, delicious and
organic foods and food products.
3. Sustainable agriculture and aquaculture, including local value-added processing and agri-tourism, is a
major contributor to the regional economy.
4. There is safe, nutritious and affordable local food throughout the region for all.
5. The region’s farmland, watercourses, riparian areas and watersheds are protected while still
supporting and enhancing farming and agricultural activities.
6. Agricultural land is preserved and protected regionally in perpetuity.
7. Conflicts between agricultural and non-agricultural land uses are minimized.
8. Farming is viewed as an attractive lifestyle and barriers to entering an agricultural career have been
reduced.
9. Farming practices are safe and sustainable, and contribute to regional food security.
10. Agricultural practices support young farmers, community gardens, alternative agriculture, farming
education and recreational programs.
11. Regional partners work together to protect agricultural lands and support the adoption of best
practices throughout the agricultural sector.
12. The necessary provincial resources and local/regional safeguards are in place to support agricultural
production and protect agricultural lands from flooding, disease infestation, invasive species and
other natural hazards.
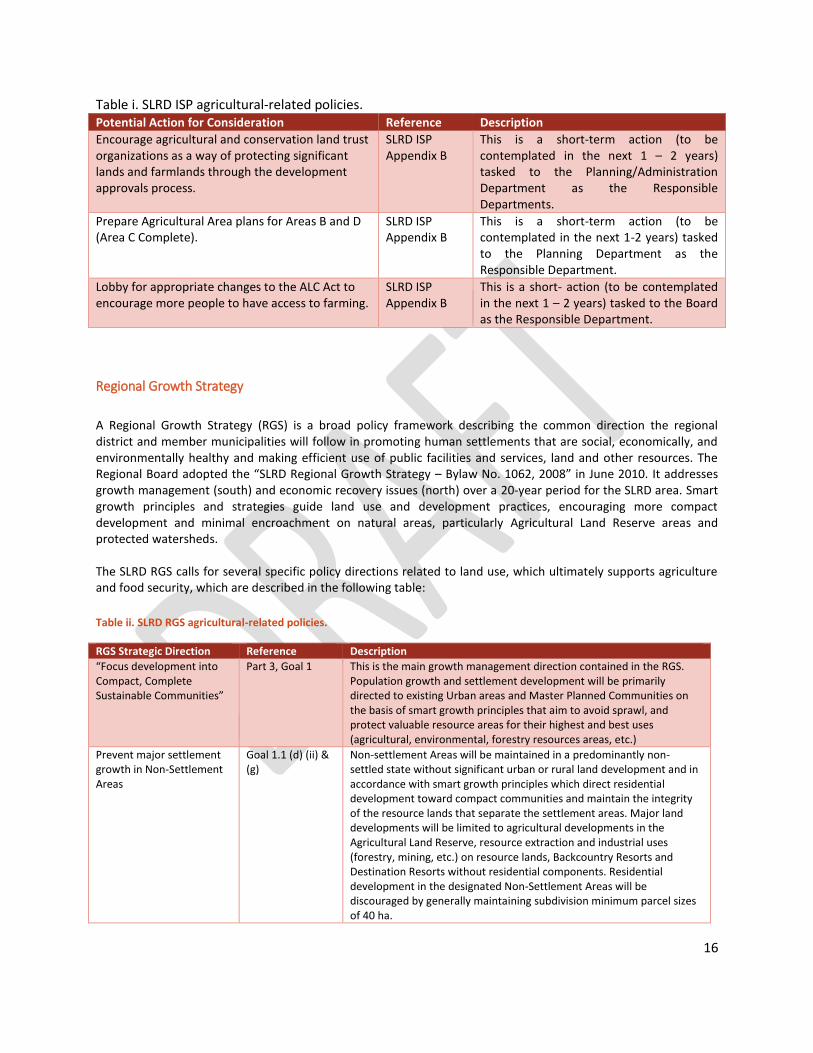
16
Table i. SLRD ISP agricultural-related policies. Potential Action for Consideration Reference Description
Encourage agricultural and conservation land trust organizations as a way of protecting significant lands and farmlands through the development approvals process.
SLRD ISP Appendix B
This is a short-term action (to be contemplated in the next 1 – 2 years) tasked to the Planning/Administration Department as the Responsible Departments.
Prepare Agricultural Area plans for Areas B and D (Area C Complete).
SLRD ISP Appendix B
This is a short-term action (to be contemplated in the next 1-2 years) tasked to the Planning Department as the Responsible Department.
Lobby for appropriate changes to the ALC Act to encourage more people to have access to farming.
SLRD ISP Appendix B
This is a short- action (to be contemplated in the next 1 – 2 years) tasked to the Board as the Responsible Department.
Regional Growth Strategy
A Regional Growth Strategy (RGS) is a broad policy framework describing the common direction the regional district and member municipalities will follow in promoting human settlements that are social, economically, and environmentally healthy and making efficient use of public facilities and services, land and other resources. The Regional Board adopted the “SLRD Regional Growth Strategy – Bylaw No. 1062, 2008” in June 2010. It addresses growth management (south) and economic recovery issues (north) over a 20-year period for the SLRD area. Smart growth principles and strategies guide land use and development practices, encouraging more compact development and minimal encroachment on natural areas, particularly Agricultural Land Reserve areas and protected watersheds. The SLRD RGS calls for several specific policy directions related to land use, which ultimately supports agriculture and food security, which are described in the following table:
Table ii. SLRD RGS agricultural-related policies.
RGS Strategic Direction Reference Description
“Focus development into Compact, Complete Sustainable Communities”
Part 3, Goal 1
This is the main growth management direction contained in the RGS. Population growth and settlement development will be primarily directed to existing Urban areas and Master Planned Communities on the basis of smart growth principles that aim to avoid sprawl, and protect valuable resource areas for their highest and best uses (agricultural, environmental, forestry resources areas, etc.)
Prevent major settlement growth in Non-Settlement Areas
Goal 1.1 (d) (ii) & (g)
Non-settlement Areas will be maintained in a predominantly non-settled state without significant urban or rural land development and in accordance with smart growth principles which direct residential development toward compact communities and maintain the integrity of the resource lands that separate the settlement areas. Major land developments will be limited to agricultural developments in the Agricultural Land Reserve, resource extraction and industrial uses (forestry, mining, etc.) on resource lands, Backcountry Resorts and Destination Resorts without residential components. Residential development in the designated Non-Settlement Areas will be discouraged by generally maintaining subdivision minimum parcel sizes of 40 ha.

17
Designation of a Special Planning Area for the future revitalization of Lillooet and Area
Goal 1.1 (i) Special Planning Areas will provide for more detailed sub-regional planning and will include the following areas identified on the Regional Settlement Planning Map 1 and the Lillooet & Area Settlement Planning Map 1d: (i) Lillooet and Area Sub-regional Economic Enhancement Strategy: The objectives are to establish economic development strategies in conjunction with Goal 4 of the RGS –Achieve a Sustainable Economy and to establish a framework for coordinated local government – First Nations land use planning through the ongoing OCP review process, assisted by transportation improvements (Goal 2). This strategy may identify suitable community revitalization, destination resort, tourism and resource industry development opportunities.
Economic Revitalization Efforts in the North
Part 3, Goal 3 The RGS supports economic revitalization efforts in the north through the preparation of a Lillooet and Area Sub-regional Economic Enhancement Strategy Economic Development Strategy for the North (The objectives are to establish economic development strategies in conjunction with Goal 4 of the RGS –Achieve a Sustainable Economy and to establish a framework for coordinated local government – First Nations land use planning through the ongoing OCP review process, assisted by transportation improvements (Goal 2). This strategy may identify suitable community revitalization, destination resort, tourism and resource industry development opportunities.)
Agricultural Area Plans for Lillooet and Pemberton Valley
RGS – Section 4.1 (e)
This is a sample of a strategic direction The RGS calls for the Undertaking of Agriculture Plans for Lillooet sub-region and the Pemberton Valley in conjunction with First Nations, Ministry of Agriculture and Lands and the Agricultural Land Commission that will provide the basis for new agricultural investment and protection of the ALR. This will be pursued by the regional district staff in consultation with farmers and the Ministry of Agriculture and Lands and subject to availability of funding.)
Invasive Species Management
RGS – Section 5.1.(f)
This is a sample of a strategic direction which supports the natural management of invasive species, whereby the SLRD and other agencies would consider alternatives to chemical treatments as a tool
District of Lillooet Official Community Plan
The District of Lillooet has a recently updated Official Community Plan – Bylaw No. 320 - adopted in 2009. The OCP notes that Lillooet contains large tracts of land which have been designated for Agricultural/Resource Use and this designation includes lands that are subject to the regulations and conditions imposed by the Agricultural Land Commission Act. In Section 4 of the OCP it specifically states “the District supports and encourages protection of agricultural lands and the enhancement of the local agricultural economy” and thus, has established the following objectives: to protect agricultural land for agricultural purposes and to support and enhance agricultural activity in Lillooet. The following table lists specific policies found in Section 4 – Agriculture / Resource Lands Designation of the District of Lillooet Official Community Plan – Bylaw No. 320:
Table iii. District of Lillooet OCP agricultural-related policies.
Policy Reference
The District will encourage economic development initiatives to recognize agriculture as a viable economic activity for Lillooet and to identify strategies to bring new agricultural developments and businesses to Lillooet.
District of Lillooet Official Community Plan – Bylaw No. 320, Policy 4.3.2

18
The District supports strategies to promote the agricultural attributes and historical successes of agriculture in Lillooet.
District of Lillooet Official Community Plan – Bylaw No. 320, Policy 4.3.3
The District will work with the Ministry of Agriculture to research and promote new agricultural opportunities such as grapes, speciality berries and fruits, market gardens and food processing facilities.
District of Lillooet Official Community Plan – Bylaw No. 320, Policy 4.3.4
The District will ensure zoning regulations are consistent with ALC policies regarding agri-tourism.
District of Lillooet Official Community Plan – Bylaw No. 320, Policy 4.3.5
The District recognizes the agricultural, recreational, and public use potential of Crown land in this category and supports the provincial government’s general policy of integrated multiple use land management.
District of Lillooet Official Community Plan – Bylaw No. 320, Policy 4.3.6
The District will discourage subdivision of lands within this category. Municipal utilities and services generally will not be provided to these lands. Where water services have been approved, they will be limited to domestic supply only on the basis of one connection per existing lot.
District of Lillooet Official Community Plan – Bylaw No. 320, Policy 4.3.7
The District will attempt to minimize conflicts between agricultural and other land uses (residential/recreational) through the use of:
access restrictions, where appropriate;
minimum distance setbacks for intensive agricultural operations;
fencing requirements and landscape buffers on the non-agricultural side of the development for residential or recreational developments adjacent to agricultural operations;
continued liaison with Provincial Ministries and Crown agencies in the planning, disposition, and management of Crown lands; and
compliance with the Farm Practices Protection Act (FPPA).
District of Lillooet Official Community Plan – Bylaw No. 320, Policy 4.3.8
Development Permit Area designations may be used to protect farming on lands designated for agricultural use.
District of Lillooet Official Community Plan – Bylaw No. 320, Policy 4.3.9
The District supports the ALC and the role of the Provincial Agricultural Land Commission in its efforts to protect and enhance farmland. Where land is in the ALR, minimum parcel sizes shall apply only when the land is:
excluded from the ALR; or
approved for subdivision within the ALR pursuant to the Agricultural Land Commission Act, regulations thereto, or orders to the Commission; or
exempted by the Agricultural Land Commission Act, regulations thereto, or orders of the Commission.
District of Lillooet Official Community Plan – Bylaw No. 320, Policy 4.3.10
The District will encourage all farming operations to comply with the following regulations and guidelines as administered by the province:
environmental guidelines for farming practise as produced by the provincial ministries;
regulations pertaining to agricultural waste control; and
code of Agricultural Practice for Waste Management.
District of Lillooet Official Community Plan – Bylaw No. 320, Policy 4.3.11
The District recognizes the importance of local food production and supports efforts to improve the local agricultural economy. Strategies include:
enhancing development opportunities for the local farmers market (e.g. new Downtown Square site);
support initiatives to increase agricultural awareness;
support development of community gardens and rooftop gardens; and
provide density bonusing for projects providing opportunities for local food production (e.g. rooftop gardens, edible landscapes, community gardens or greenhouses).
District of Lillooet Official Community Plan – Bylaw No. 320, Policy 4.3.12
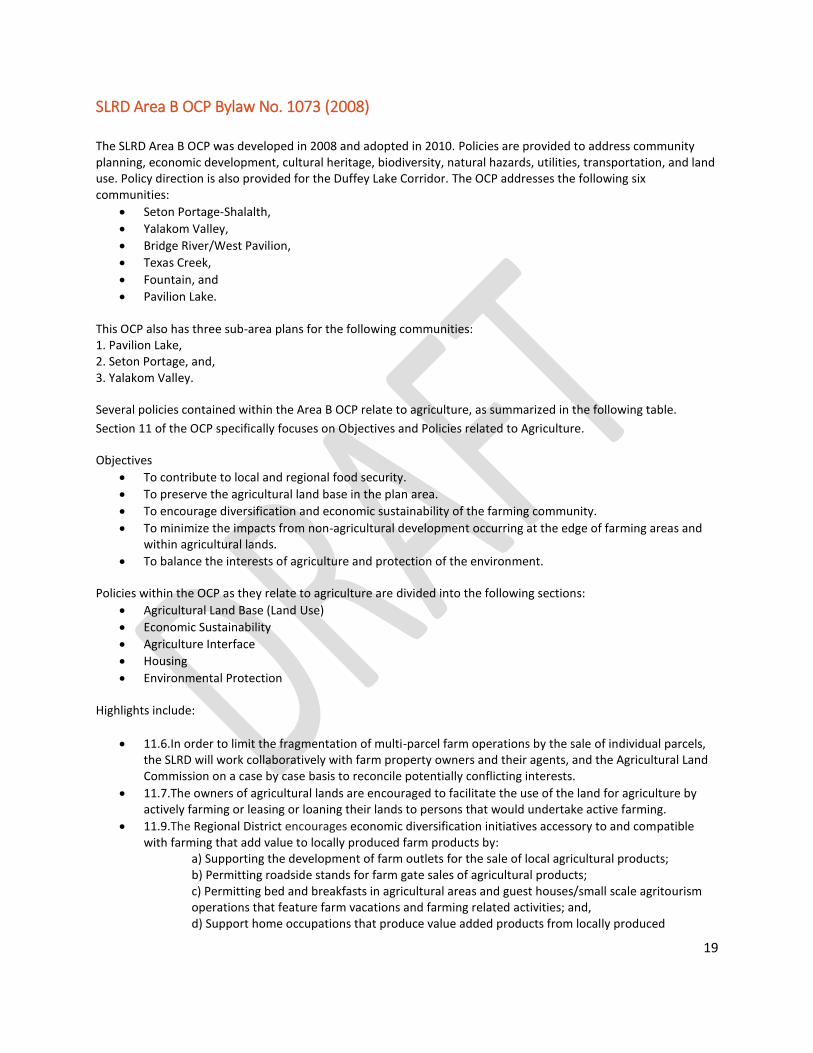
19
SLRD Area B OCP Bylaw No. 1073 (2008)
The SLRD Area B OCP was developed in 2008 and adopted in 2010. Policies are provided to address community planning, economic development, cultural heritage, biodiversity, natural hazards, utilities, transportation, and land use. Policy direction is also provided for the Duffey Lake Corridor. The OCP addresses the following six communities:
Seton Portage-Shalalth,
Yalakom Valley,
Bridge River/West Pavilion,
Texas Creek,
Fountain, and
Pavilion Lake. This OCP also has three sub-area plans for the following communities: 1. Pavilion Lake, 2. Seton Portage, and, 3. Yalakom Valley.
Several policies contained within the Area B OCP relate to agriculture, as summarized in the following table.
Section 11 of the OCP specifically focuses on Objectives and Policies related to Agriculture.
Objectives
To contribute to local and regional food security.
To preserve the agricultural land base in the plan area.
To encourage diversification and economic sustainability of the farming community.
To minimize the impacts from non-agricultural development occurring at the edge of farming areas and within agricultural lands.
To balance the interests of agriculture and protection of the environment.
Policies within the OCP as they relate to agriculture are divided into the following sections:
Agricultural Land Base (Land Use)
Economic Sustainability
Agriculture Interface
Housing
Environmental Protection Highlights include:
11.6.In order to limit the fragmentation of multi-parcel farm operations by the sale of individual parcels, the SLRD will work collaboratively with farm property owners and their agents, and the Agricultural Land Commission on a case by case basis to reconcile potentially conflicting interests.
11.7.The owners of agricultural lands are encouraged to facilitate the use of the land for agriculture by actively farming or leasing or loaning their lands to persons that would undertake active farming.
11.9.The Regional District encourages economic diversification initiatives accessory to and compatible with farming that add value to locally produced farm products by:
a) Supporting the development of farm outlets for the sale of local agricultural products; b) Permitting roadside stands for farm gate sales of agricultural products; c) Permitting bed and breakfasts in agricultural areas and guest houses/small scale agritourism operations that feature farm vacations and farming related activities; and, d) Support home occupations that produce value added products from locally produced

20
agricultural products.
11.12. Future development activities in the plan area shall result in minimal creation of new residential agriculture interfaces. Development and subdivisions at the residential - farm land interface shall be planned and mitigated as follows:
a) no road endings shall abut the ALR boundary, b) the ALR – residential boundary shall be fenced and buffered as per the Agricultural Land Commission’s Landscaped Buffer Specifications, and, c) Building setbacks and other mitigations will be considered as per the Ministry of Agriculture and Land’s Guide to Edge Planning.
11.14. As per the Agricultural Land Commission Act and regulations, additional dwellings are permitted where necessary for farm use, provided:
a) The property has farm classification under the Assessment Act; and, b) Supportive comments from the Regional Agrologist with the Ministry of Agriculture have been received.
11.16. Farmers are encouraged to prepare Environmental Farm Plans.
11.17. To promote the long term sustainability of agricultural production, ecosystem integrity, and human health, land use decision making shall apply the precautionary principle: When an activity raises threats of harm to human health or the environment, precautionary measures should be taken even if some cause and effect relationships are not fully established scientifically, and in this context, the proponent of an activity, rather than the public, should bear the burden of proof.
Table iv. Other SLRD Electoral Area B OCP agricultural-related policies.
Policy Subject Reference Policy Description
Agritourism Policies 3.6 and 3.8 The development of small- and medium-scale tourism operations is supported, including agritourism operations associated with farms. The development of Agricultural Land Reserve, or other lands with agricultural potential, for nonfarm uses, including golf courses, is not supported.
Organic & GMO-free Agriculture
Yalakom Valley Sub-Area Plan
Section 9.1 - 9.5
The policies contained in the Yalakom Valley Sub-Area
Plan section of the Area B OCP are related to farming
and food security. Several policies in the Agriculture
section demonstrate support for Ecosystem-Based
Conservation Planning Principles, discourage
genetically modified organisms in the Valley,
encourage soil & water conservation, and non-
chemical weed control.
SLRD Areas A and B Zoning Bylaw, No. 670
The zoning bylaw for SLRD Areas A & B contains no Agriculture zone, but “agriculture” is a permitted use in:
RR1 – Rural resource zone (2 ha minimum parcel area)
RR2 – Rural resource zone (8 ha minimum parcel area)
RR3 – Rural resource zone (40 ha minimum parcel area)
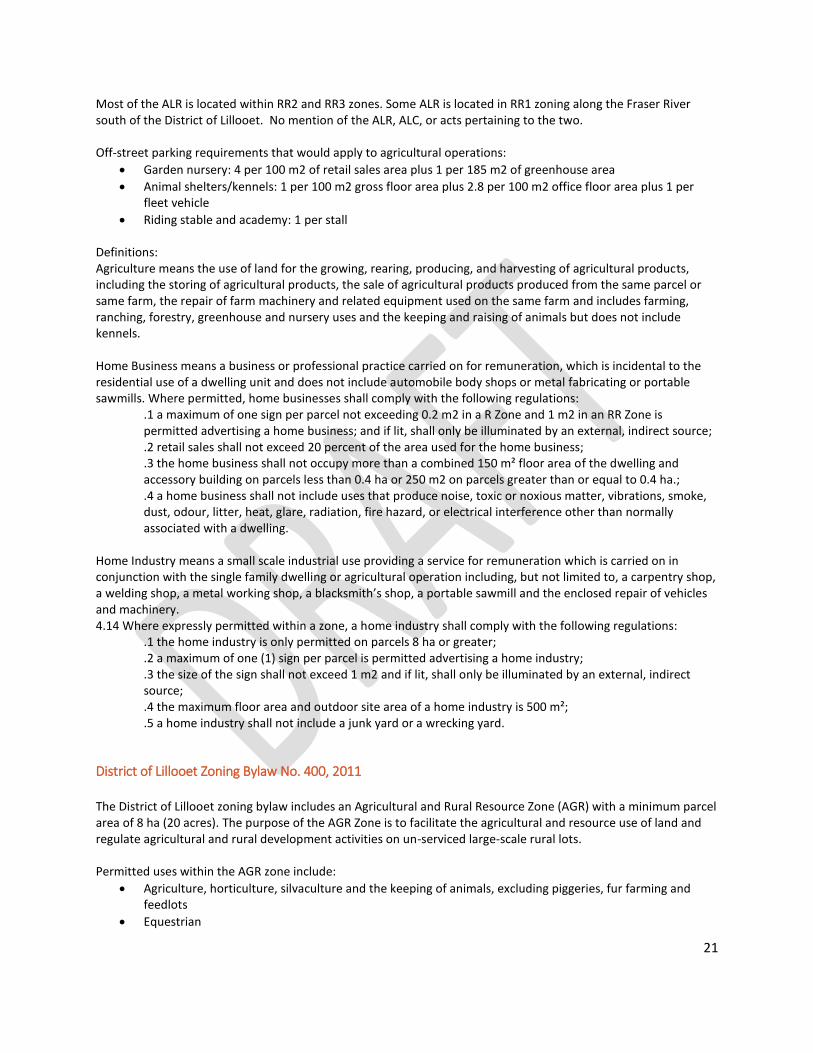
21
Most of the ALR is located within RR2 and RR3 zones. Some ALR is located in RR1 zoning along the Fraser River south of the District of Lillooet. No mention of the ALR, ALC, or acts pertaining to the two. Off-street parking requirements that would apply to agricultural operations:
Garden nursery: 4 per 100 m2 of retail sales area plus 1 per 185 m2 of greenhouse area
Animal shelters/kennels: 1 per 100 m2 gross floor area plus 2.8 per 100 m2 office floor area plus 1 per fleet vehicle
Riding stable and academy: 1 per stall Definitions: Agriculture means the use of land for the growing, rearing, producing, and harvesting of agricultural products, including the storing of agricultural products, the sale of agricultural products produced from the same parcel or same farm, the repair of farm machinery and related equipment used on the same farm and includes farming, ranching, forestry, greenhouse and nursery uses and the keeping and raising of animals but does not include kennels. Home Business means a business or professional practice carried on for remuneration, which is incidental to the residential use of a dwelling unit and does not include automobile body shops or metal fabricating or portable sawmills. Where permitted, home businesses shall comply with the following regulations:
.1 a maximum of one sign per parcel not exceeding 0.2 m2 in a R Zone and 1 m2 in an RR Zone is permitted advertising a home business; and if lit, shall only be illuminated by an external, indirect source; .2 retail sales shall not exceed 20 percent of the area used for the home business; .3 the home business shall not occupy more than a combined 150 m² floor area of the dwelling and accessory building on parcels less than 0.4 ha or 250 m2 on parcels greater than or equal to 0.4 ha.; .4 a home business shall not include uses that produce noise, toxic or noxious matter, vibrations, smoke, dust, odour, litter, heat, glare, radiation, fire hazard, or electrical interference other than normally associated with a dwelling.
Home Industry means a small scale industrial use providing a service for remuneration which is carried on in conjunction with the single family dwelling or agricultural operation including, but not limited to, a carpentry shop, a welding shop, a metal working shop, a blacksmith’s shop, a portable sawmill and the enclosed repair of vehicles and machinery. 4.14 Where expressly permitted within a zone, a home industry shall comply with the following regulations:
.1 the home industry is only permitted on parcels 8 ha or greater;
.2 a maximum of one (1) sign per parcel is permitted advertising a home industry;
.3 the size of the sign shall not exceed 1 m2 and if lit, shall only be illuminated by an external, indirect source; .4 the maximum floor area and outdoor site area of a home industry is 500 m²; .5 a home industry shall not include a junk yard or a wrecking yard.
District of Lillooet Zoning Bylaw No. 400, 2011
The District of Lillooet zoning bylaw includes an Agricultural and Rural Resource Zone (AGR) with a minimum parcel area of 8 ha (20 acres). The purpose of the AGR Zone is to facilitate the agricultural and resource use of land and regulate agricultural and rural development activities on un-serviced large-scale rural lots. Permitted uses within the AGR zone include:
Agriculture, horticulture, silvaculture and the keeping of animals, excluding piggeries, fur farming and feedlots
Equestrian

22
Extraction of raw materials from the land as approved by the Agricultural Land Commission on lands in the ALR including the preliminary grading, cutting or crushing of materials provided no further processing is permitted on the site, except where the product is regulated by the “Mines Regulation Act” or is being used on the premises
Agriculture permitted in other zones with the following restrictions: Rural Residential – RR-1 (minimum parcel area 0.175 ha or 0.43 acres)
Agriculture including the keeping of animals, where the minimum lot size is 0.2 ha [.5 acre] subject to Section 4.31 (Keeping of Animals), except piggeries, fur farming, horses for commercial use, feedlots and other intensive livestock production are excluded.
Rural Residential – RR-2 (minimum parcel areas are 2 ha (on well/septic), 1 ha (community water/septic, and 0.405 ha (1 acre) (community water/sewer)
Agriculture including the keeping of animals where the minimum lot size is .2 ha (0.5 acre) subject to Section 4.31 (Keeping of Animals), except piggeries, fur farming, horses for commercial use, feedlots and other intensive livestock production are excluded: except that on Lots 1 to 14 inclusive, District Lot 3 and District Lot 3056, Plan 38426 (Roshard Acres), the keeping of animals is prohibited.
Rural Residential – RR-3 (minimum parcel area is 8 ha)
Agriculture including the keeping of animals, where the minimum lot size is .4 ha [1 acre] subject to Section 4.31 (Keeping of Animals) except piggeries, fur farming, feed lots and other intensive livestock production are excluded.
Equestrian. Light Industrial – I1
Agricultural supply and service
Packing and crating
Warehousing and wholesale establishments General Industrial - I2
Agricultural supply and service
Farm machinery and heavy equipment sales and repairs
Food and beverage product, manufacturing processing, packaging and storage, excluding processing and packaging of fish and including only pre-dressed and government inspected meats and eviscerated poultry
Packing and crating
Warehousing and wholesale establishments Open Space Reserve – OSR (Minimum parcel area 8 ha (20 acres))
The purpose of the OSR Zone is to protect and preserve lands that are environmentally sensitive or hazardous in nature including community watershed and hillside areas within the Municipality that are to be retained as large undeveloped sites.
Permitted uses includes agriculture. Definitions in the Lillooet Zoning Bylaw that pertain to agriculture: Agriculture: Means the use of land, buildings or structures for growing, rearing, production and harvesting of agricultural products; and includes the processing of agricultural products harvested, reared or produced on the site and includes the storage and repair of farm equipment used in the agricultural operation of the site, as well as the keeping of bees, honey extracting, processing, packaging and sales. Specifically excluded are abattoirs.
23
Animal Unit: Means the number of livestock, poultry or other animals which would produce manure containing approximately 100 kg of nitrogen per year and as defined by the Ministry of Agriculture: 454 kg. liveweight of livestock, or approximately 1 horse, 1 cow/calf pair, 7 adult sheep/goats, 5 finishing pigs etc. Equestrian: Means the commercial accommodation of horses for the purpose of boarding, training, breeding, riding lessons, community riding functions or the stabling of horses for other persons. All borders would apply Farmers Market: Means the sale of farm produce from a licensed motor vehicle, open table or sun/rain shelter. Feedlot: Means a building, structure or enclosure used to feed beef cattle and/or other livestock by a means other than grazing, where the number of livestock is more than one hundred (100) animal units in such building, structure or enclosure. Home Based Business: Means an occupation or profession that is incidental to the principal residential use of a parcel occupied by a dwelling unit, including such uses as: home offices; studios; woodworking, upholstering and other home workshops; and, personal services except dry cleaners and laundromats. Home Industry: Means secondary or ancillary use of a lot in conjunction with a dwelling for purposes such as manufacturing, processing, fabricating, assembling, storing, distributing, testing, servicing, or repairing of goods or materials including vehicle repair, maintenance and auto body shops and excluding auto wrecking, manufacture of concrete products, bulk fuel or chemical storage or refining depots, animal or agriculture products processing, or the production of animal feeds, where lots are a minimum of 1 ha [2.47 acres] in size. Home Industry uses are permitted in rural residential, open space reserve and agricultural resource zones, as noted in the relevant bylaw section, where lots are larger than 1 hectare [2.47 acres] subject to the following regulations: .1 All activities associated with the Home Industry shall be entirely conducted within a completely enclosed building except where it involves agricultural uses; .2 No storage of materials, equipment or finished products is permitted outside an enclosed building; .3 Exclusive of the resident's own licensed vehicles, no more than three (3) vehicles for repair shall be parked outdoors; .4 No external indication shall exist that a building is used for any purpose other than normally associated with a dwelling except for a single non-illuminated sign not exceeding 0.2 square meters [2 square feet]; .5 Noise created by the Home Industry must not exceed 0 decibels (i.e. no noise) above ambient at the property lines; .6 No building containing a Home Industry shall be located within 4.5 meters [15 ft] of a lot line; .7 Employees of a Home Industry shall be restricted to members of a family residing on the lot plus two other people; .8 A Home Industry use shall be required to have a District of Lillooet Business License; .9 The operation of a Home Industry shall be limited to the hours between 7:00 a.m. and 9:00 p.m. Livestock: Means a farm animal/s considered an asset to an agricultural operation and includes cattle, horses, mules, donkeys, sheep, goats, swine, bison, llamas, alpacas, poultry and rabbits. The Lillooet Zoning Bylaw also includes the following regulations that may impact agriculture: Buffers 1. Any commercial, industrial or residential land use abutting an agricultural zone including land in the ALR shall provide and maintain a buffer on the non-agricultural side of the lot boundary that complies with the requirements of the Agricultural Land Commission’s Landscape Buffer Specifications, ALC 1993. Keeping of Animals 1. The keeping of animals, where permitted, shall be subject to the following regulations:

24
.1 On any parcel 2.0 ha or less in area, the total number of livestock, must not exceed one (1) animal unit for each 0.2 ha of parcel area; .2 despite Section 4.31.1, on any parcel 0.4 ha or less in area, the total number of poultry and/or fur bearing animals shall not exceed twenty-five (25). .3 All structures, pens, runs, enclosures and manure piles shall in addition be located to the satisfaction of the Medical Health Officer in respect of all nearby wells, lakes, streams, springs, groundwater or other bodies of water which in his opinion could suffer contamination therefrom and subject to the regulation of the Waste Management Act. Parking Requirements
Nursery/greenhouses: 1 parking space per 14 sq. meters [150 sq. ft] gross floor area of retail sales building
Vegetable stand: 3 parking spaces per sales clerk
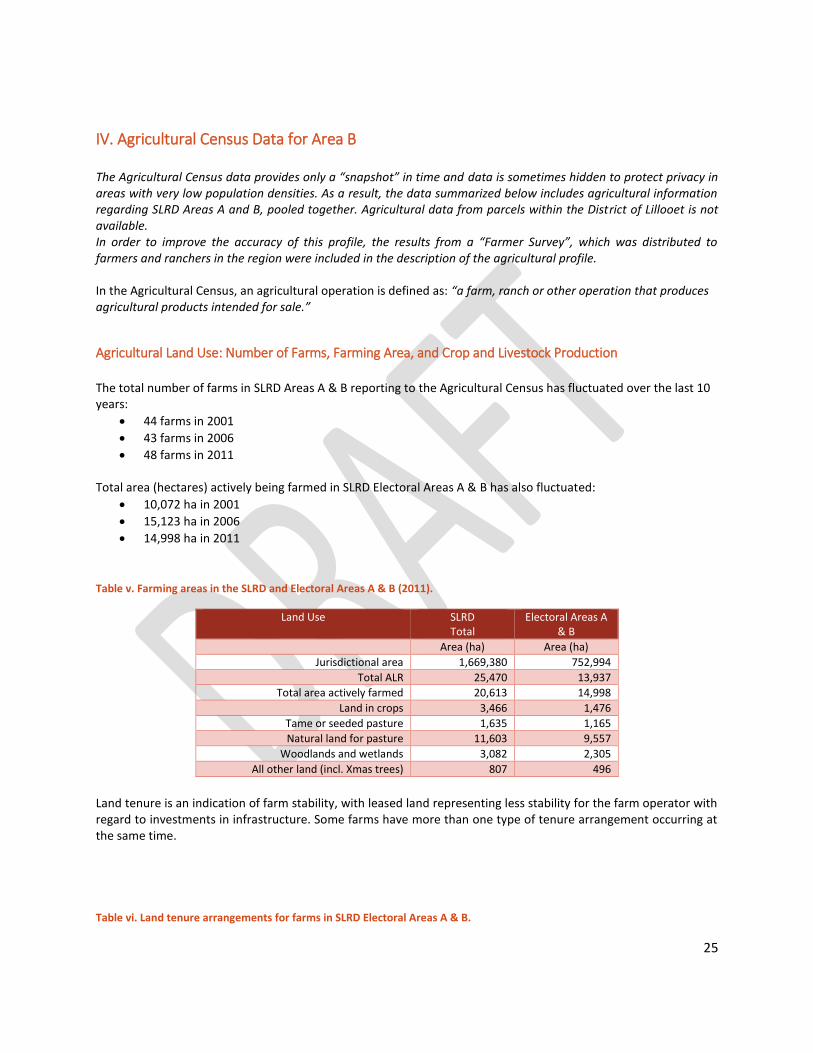
25
IV. Agricultural Census Data for Area B The Agricultural Census data provides only a “snapshot” in time and data is sometimes hidden to protect privacy in areas with very low population densities. As a result, the data summarized below includes agricultural information regarding SLRD Areas A and B, pooled together. Agricultural data from parcels within the District of Lillooet is not available. In order to improve the accuracy of this profile, the results from a “Farmer Survey”, which was distributed to farmers and ranchers in the region were included in the description of the agricultural profile. In the Agricultural Census, an agricultural operation is defined as: “a farm, ranch or other operation that produces agricultural products intended for sale.”
Agricultural Land Use: Number of Farms, Farming Area, and Crop and Livestock Production
The total number of farms in SLRD Areas A & B reporting to the Agricultural Census has fluctuated over the last 10 years:
44 farms in 2001
43 farms in 2006
48 farms in 2011 Total area (hectares) actively being farmed in SLRD Electoral Areas A & B has also fluctuated:
10,072 ha in 2001
15,123 ha in 2006
14,998 ha in 2011
Table v. Farming areas in the SLRD and Electoral Areas A & B (2011).
Land Use SLRD Total
Electoral Areas A & B
Area (ha) Area (ha)
Jurisdictional area 1,669,380 752,994
Total ALR 25,470 13,937
Total area actively farmed 20,613 14,998
Land in crops 3,466 1,476
Tame or seeded pasture 1,635 1,165
Natural land for pasture 11,603 9,557
Woodlands and wetlands 3,082 2,305
All other land (incl. Xmas trees) 807 496
Land tenure is an indication of farm stability, with leased land representing less stability for the farm operator with regard to investments in infrastructure. Some farms have more than one type of tenure arrangement occurring at the same time.
Table vi. Land tenure arrangements for farms in SLRD Electoral Areas A & B.

26
Land Tenure 2001 2006 2011
Farms Hectares Farms Hectares Farms Hectares
Owned 44 8,816 43 9,405 45 9,120
Leased from governments 6 916 9 X 13 5,694
Rented or leased from others 4 X 4 186 5 65
Crop-shared from others 1 X 2 X 3 X
Total 44 10,072 43 15,123 48 14,998
Table vii. Size of farms in SLRD Electoral Areas A & B.
Number of Farms by Size Category
Farm Size 2001 2006 2011
< 10 acres 11 6 4
10 to 69 acres 15 15 17
70 to 129 acres 2 5 4
130 to 179 acres 3 2 3
180 to 239 acres 0 2 3
240 to 399 acres 6 4 4
400 to 559 acres 2 4 2
560 to 759 acres 0 0 2
760 to 1,119 acres 1 0 2
1,120 to 1,599 acres 2 1 4
1,600 to 2,239 acres 0 1 1
2,240 to 2,879 acres 1 0 0
2,880 to 3,519 acres 0 1 1
3,520 acres 1 2 1
Total farms 44 43 48
Crop production changes in some cases year to year, but trends emerge in regions where commodity or sector development is taking hold. In the SLRD Areas A & B there is an increasing trend in alfalfa production and the amount of area under fruit, berry, and nut production. Cattle production has also risen in the past 10 years, likely as a result of a natural market rebound from the mad cow disease issue which arose in the early 2000’s. By contrast, hay production is decreasing.
Table viii. Crop production in SLRD Electoral Areas A & B.
2001 2006 2011
Crop Type Farms Hectares Farms Hectares Farms Hectares
Alfalfa and alfalfa mixtures
21 971 21 2,254 32 3,134
Tame Hay and Fodder 6 996 5 375 2 X
Oilseed and Grain 0 0 0 0 0 0
Fruits, Berries & Nuts 11 10 6 7 10 15

27
Vegetables 6 6 3 8 7 5
Hens and Chickens 3 135 5 225 11 222
Cattle and Calves 13 2,112 19 2,820 23 2,785
Sheep and Lambs 2 X 3 X 1 X
Goats 1 X 2 X 2 X
Horses and Ponies 21 168 21 118 24 171
Llamas and Alpacas 2 X 4 X 0 0
Honeybees 0 0 1 X 3 X
The number of farmers (or farm “operators”) has increased from 60 in 2001 to 80 in 2011, representing a 33% increase in 10 years. At the same time, the average age of farmers is increasing, from 52.2 years old in 2001 to 55.2 years old in 2011. This is on par with the average age of farmers in BC, however a lack of farmers under the age of 35 is lower than on average in the province. The number of operators working on a farm also provides an indication of farm size, or level of farming intensity on a per farm basis. In the Agricultural Census, up to three operators can be reported per farm. This is a count of distinct operators, therefore operators of two or more separate farms are included only once in the total (so the total will be less than the simple addition of the subcategories). The number of hours spent working on the farm per week also provides an indication of farming intensity. Table ix. Number of farm operators per farm in the SRLD Electoral Areas A & B.
2001 2006 2011
# of farms
Percentage # of farms
Percentage # of farms
Percentage
Farms with one operator 25 41.6% 20 33.3% 20 25%
Farms with two or more operators
20 33.3% 45 75% 55 68.8%
Total operators 60 100% 60 100% 80 100%
Table x. Amount of weekly labour on a per farm basis in the SLRD Areas A & B.
SLRD - Area
A & B
Lower
Mainland
BC Canada
< 20 hours 20 (25%) 4065 (46%) 13135 (44%) 92545 (31%)
20 to 40 hours 35 (44%) 2420 (28%) 9105 (30%) 83400 (28%)
> 40 hours 25 (32%) 2320 (26%) 7695 (26%) 117985 (40%)
Total number of
operators
80 (100%) 8800 (100%) 29925 (100%) 293925 (100%)
Farm Practices

28
The following tables present information regarding the use of specific farm practices by farm operators. More than 80% of farms in SLRD Electoral Areas A & B report using irrigation.
Table xi. Number farms in SLRD Electoral Areas A & B reporting the use of chemicals, fertilizers, and/or lime.
2001 2006 2011
Herbicides 3 (<10%) 4 (<10%) 4 (<10%)
Insecticides 1 (< 5%) 1 (< 5%) 4 (<10%)
Fungicides 1 (< 5%) 0 (< 5%) 1 (< 5%)
Commercial fertilizer 6 (< 20%) 8 (<20%) 8 (<20%)
Lime N/A (< 5%) 1 (< 5%) 1 (< 5%)
Total Number of Farms 44 43 48
Table xii. Farms in the SLRD Electoral Areas A & B reporting Best Management Practices.
Best Management Practices Number of Farms
2001 2006 2011
Crop rotation 5 10 8
In-field winter grazing or feeding N/A N/A 20
Rotational grazing N/A 18 11
Plowing down green crops 6 4 2
Winter cover crops 0 2 2
Nutrient management planning N/A N/A 10
Windbreaks or shelterbelts (natural or planted) 4 9 9
Buffer zones around water bodies N/A 4 5
Total 44 43 48
Table xiii. Organic farming trends in SLRD Electoral Areas A & B.
Number of Farms Reporting 2001 2006 2011
Organic products (certified) N/A (3) 11 (2) 3 (3)
Organic hay or field crops (certified) N/A 5 (0) 1 (1)
Organic fruits & veg (cerified) N/A (3) 3 (2) 2 (2)
Organic animals or animal products (certified) N/A 3 (0) 0 (0)
Farm Business Data
The majority of farms in the SLRD Electoral Areas A & B are run as sole proprietorships or partnerships.
Table xiv. Farm business types in SLRD Electoral Areas A & B.

29
2001 2006 2011
Business Type Number of Farms
Percentage Number of Farms
Percentage Number of Farms
Percentage
Sole proprietorship 24 54.5% 22 51.2% 19 39.6%
Partnership without a written agreement
9 20.5% 13 30.2% 20 41.7%
Partnership with a written agreement
2 4.5% 2 4.7% 0 0%
Family corporation 7 15.9% 5 11.6% 7 14.6%
Non-family corporation 1 2.3% 1 2.3% 2 4.2%
Other operating arrangements 0 0% 0 0% 0 0%
Total 44 100% 43 100% 48 100%
Total farm capital has increased dramatically in the region in the past 10 years, most likely due to a sharp increase in the value of land and buildings. The value of farm machinery, livestock, and poultry, has decreased. Total farm capital values:
$24,327,342 in 2001
$34,342,954 in 2006
$109,353,033 in 2011
Table xv. Farm capital values in SLRD Electoral Areas A & B.
2001 2006 2011
Farm Capital Subcategory
# of farms
Value $/farm
Value $ in
millions
# of farms
Value $/farm
Value $ in
millions
# of farms
Value $/farm
Value $ in
millions
Land and buildings 44 432,698 18.6 43 659,088 28.3 48 2,111,488 101.4
Farm machinery & equipment
44 74,640 3.3 43 98,869 4.3 35 24,664 0.9
Livestock and poultry
28 85,731 2.4 31 56,476 1.8 37 55,767 2.1
Total farm capital 44 552,894 24.3 43 798,673 34.3 48 2,278,188 109.4
Less than a third of farms report paying salaries and wages. This is likely due to the fact that revenues are paid directly to sole proprietors or partners, or that the income is directly reinvested into the farm.
Table xvi. Farm salaries and wages in the SLRD Electoral Areas A & B.
2001 2006 2011
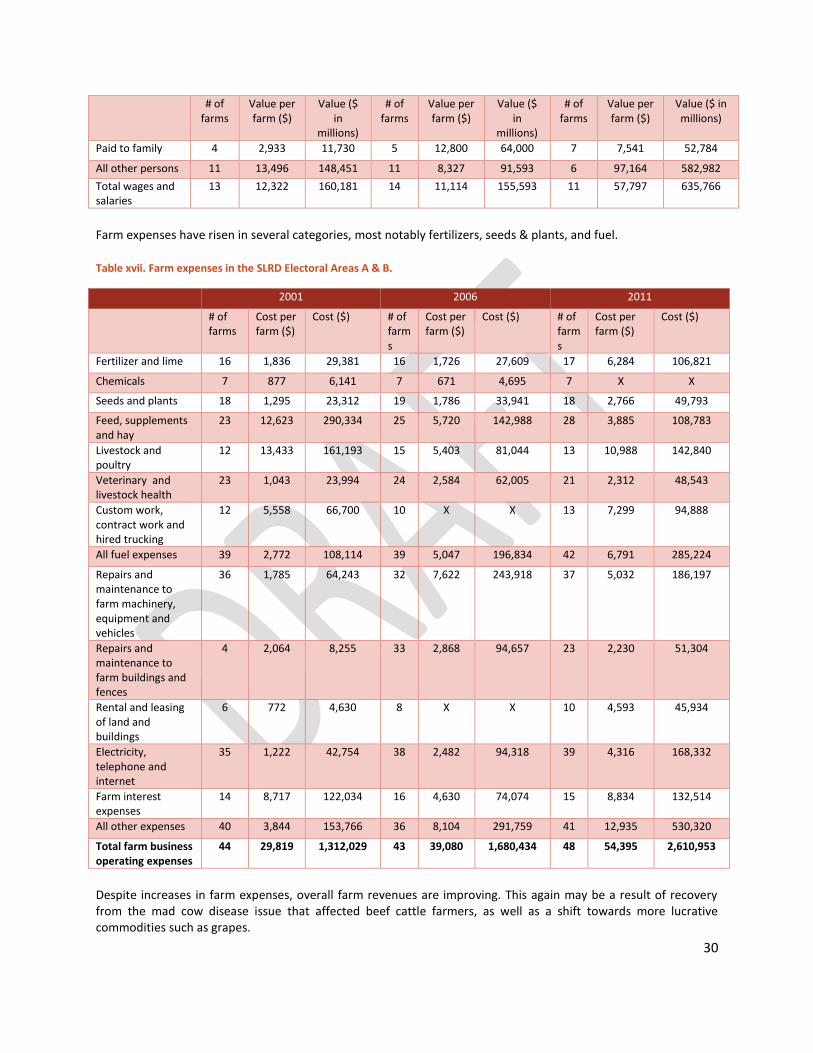
30
# of farms
Value per farm ($)
Value ($ in
millions)
# of farms
Value per farm ($)
Value ($ in
millions)
# of farms
Value per farm ($)
Value ($ in millions)
Paid to family 4 2,933 11,730 5 12,800 64,000 7 7,541 52,784
All other persons 11 13,496 148,451 11 8,327 91,593 6 97,164 582,982
Total wages and salaries
13 12,322 160,181 14 11,114 155,593 11 57,797 635,766
Farm expenses have risen in several categories, most notably fertilizers, seeds & plants, and fuel.
Table xvii. Farm expenses in the SLRD Electoral Areas A & B.
2001 2006 2011
# of farms
Cost per farm ($)
Cost ($) # of farms
Cost per farm ($)
Cost ($) # of farms
Cost per farm ($)
Cost ($)
Fertilizer and lime 16 1,836 29,381 16 1,726 27,609 17 6,284 106,821
Chemicals 7 877 6,141 7 671 4,695 7 X X
Seeds and plants 18 1,295 23,312 19 1,786 33,941 18 2,766 49,793
Feed, supplements and hay
23 12,623 290,334 25 5,720 142,988 28 3,885 108,783
Livestock and poultry
12 13,433 161,193 15 5,403 81,044 13 10,988 142,840
Veterinary and livestock health
23 1,043 23,994 24 2,584 62,005 21 2,312 48,543
Custom work, contract work and hired trucking
12 5,558 66,700 10 X X 13 7,299 94,888
All fuel expenses 39 2,772 108,114 39 5,047 196,834 42 6,791 285,224
Repairs and maintenance to farm machinery, equipment and vehicles
36 1,785 64,243 32 7,622 243,918 37 5,032 186,197
Repairs and maintenance to farm buildings and fences
4 2,064 8,255 33 2,868 94,657 23 2,230 51,304
Rental and leasing of land and buildings
6 772 4,630 8 X X 10 4,593 45,934
Electricity, telephone and internet
35 1,222 42,754 38 2,482 94,318 39 4,316 168,332
Farm interest expenses
14 8,717 122,034 16 4,630 74,074 15 8,834 132,514
All other expenses 40 3,844 153,766 36 8,104 291,759 41 12,935 530,320
Total farm business operating expenses
44 29,819 1,312,029 43 39,080 1,680,434 48 54,395 2,610,953
Despite increases in farm expenses, overall farm revenues are improving. This again may be a result of recovery from the mad cow disease issue that affected beef cattle farmers, as well as a shift towards more lucrative commodities such as grapes.

31
Table xviii. Gross farm receipts and gross margin.
2001 2006 2011
Gross Farm Receipts $1,237,283 $1,365,019 $2,865,187
Total Operating Expenses $1,312,029 $1,680,434 $2,610,953
Gross Margin (%) -5.70% -18.8% 9.7%
Table xix. Average revenue per farm and per hectare.
Year # of Farms Gross Receipts ($)
Average per Farm ($)
Total Farm Area (Hectares)
Average per Hectare ($)
2001 44 1,237,283 28,120 10,072 123
2006 43 1,365,019 31,745 15,123 90
2011 48 2,865,187 59,691 14,998 191

32
V. Soils and Agricultural Capability
Surficial Geology
Bedrock geology is a combination of sedimentary rock (including limestone) and volcanic deposits. Since the end of the most recent ice age approximately 12,000 to 10,000 years ago, several landslides and debris flows have altered the local landscape. Deposits in the area are a combination of colluvial and morainal (glacial till) origins (Young et al., 1992).
Soil Types
Soil types are categorized based on distinguishing characteristics and criteria that dictate soil management techniques. Soil classification facilitates the organization and communication of information about soils, as well as the understanding of relationships between soils and environmental factors. Differences in soils are the result of the interaction of many factors: climate, organisms, parent material, topography and time.
Agricultural Capability Ratings
The Agriculture Capability rating system is a method designed to enable consistent and objective assessment of land based on inherent limitations for crop production (Department of Regional Economic Expansion, 1969). It was developed in the 1960s as part of the Canada Land Inventory (CLI). Agriculture Capability ratings are based on soil, landscape, and climate properties, not crop yield data, and limitations may or may not be altered by management (ALC, 2010). Agriculture Capability ratings can be used to help determine appropriate crop choices, realistic target yields and assess and mitigate site-specific risks such as flooding, stoniness, steep slopes, or nutrient loss. In this classification, mineral and organic soils are each grouped into seven classes on the basis of soil and climate characteristics according to their potential for agricultural use. Lands in Classes 1 to 4 inclusive are considered capable of sustained agricultural production of most crops. Class 5 lands are considered capable of producing forage crops or specially adapted crops. Class 6 lands are capable of providing only pasture for livestock. Class 7 lands generally are incapable of use for either crops or livestock (they are usually rocky outcrops or wetlands). However, it is important to note that many successful farms in BC are located on Class 7 soils, indicating that some crops may be suited to sites that many others are not. In particular, cranberries and vineyards can often do well in Class 6 and 7 soils. Unimproved ratings are based on the conditions that exist at the time of the survey, without irrigation or other management systems in place. Improved ratings indicate the potential capability after existing limitations and/or hazards have been adequately alleviated. Improvements may include land grading, drainage, irrigation, diking, stone removal, salinity alleviation, subsoiling, and/or the addition of fertilizers or other soil amendments. Other important assumptions that are made based on the classification system (BC Ministry of Agriculture and Food, 1983) include:
Soils will be managed and cropped under a largely mechanized system.
Water is available for irrigation.
The following are not considered in the classification: distance to market, available transportation facilities, labour, location, farm size, type of ownership, cultural patterns, skill or resources of individual operators, and hazard of crop damage by storms.
The classification does not include capability ratings for trees, fruit orchards, vineyards/grapes, ornamental plants, recreation, or wildlife.
33
In BC, most soils were mapped for agricultural capability ratings in the 1980s, and these maps remain in use throughout the province. The associated Computer Assisted Planning, Assessment, and Map Production (CAPAMP) system (Kenk and Sondheim, 1987) has since been translated into Geographic Information System database files. The general agricultural capability limitation within the Lillooet and Area B region is lack of soil moisture and improvements generally refer to irrigation, removal of surface stones, installation of drainage where necessary, or addition of nutrients. While soils vary from site to site, general recommendations for improvements to local soils for the purposes of agriculture include:
Ground levelling (areas should be individually evaluated in regard to erodibility and machinery limitations);
Applications of nutrients (fertilizers, manures, compost);
Stone picking;
Increasing organic matter content by adding animal manure, green manure, and/or compost; and
Irrigating, often at frequent short intervals.
Soil Groupings
The following map indicates soil types and associated characteristics for the Lillooet and Cayoosh area. The soil type is indicated on the map by a two-letter code at the top of the symbol grouping. For example the soil grouping symbol: CG5/R:gh - The soil type is “CG” or “Cavanaugh” soil. Other numbers relate to slope, stoniness, and drainage. Maps for other subareas are presented in the Appendix. A summary of the soil characteristics of the major soil types is provided in the table below. For a complete listing of soil types please refer to Young et al. (1992).

34
Figure i. Soil groupings for the Lillooet area (Young et al., 1992).

35
Table xx. Soil characteristics of the major soil types in Electoral Area B and Lillooet (Young et al., 1992).
Soil Name Parent Material Soil Texture and pH Topography Stoniness Agricultural Capability Class Grazing Capability Class
Chasm (CM) Colluvial deposits. Eutric Brunisol.
Sand to sandy loam, neutral to mildly alkaline.
Moderately to extremely sloping.
Generally stony. Class 6 Suitable for grazing
Class 4 Suitable for pinegrass
Cairn Mountain (CR)
Colluvial deposits. Brunisol.
Gravelly sandy loam, neutral deposits.
Moderately to extremely sloping.
Moderately to extremely stony.
Classes 6 and 7 Suitable for grazing
Class 5 Suitable for pinegrass
Cavanaugh (CG)
Colluvial fan deposits. Eutric Brunisol.
Gravelly loamy sand or gravelly sand. Mildly to moderately alkaline.
Moderately to extremely sloping.
Moderately to extremely stony.
Classes 5 and 6 Suitable for grazing and pasture
Class 4 Suitable for bunchgrass
Holden (HD) Fluvioglacial deposits. Eutric Brunisol.
Gravelly sandy loam or loam overlying sand.
Very gently sloping to moderately rolling.
Moderately to very stony.
Classes 5 and 6 Suitable for grazing and pasture, forage and cereal grains.
Class 4 Suitable for pinegrass.
Timber (TM) Morainal deposits. Eutric Brunisol
Silt loam or silty clay loam. Moderately alkaline.
Gently sloping to strongly rolling.
Slightly to moderately stony.
Classes 5 and 6 Suitable for grazing and pasture.
Class 3 Suitable for bunchgrass
Tunkwa (TW) Morainal deposits. Luvisol.
Silt loam or loam. Mildly alkaline.
Gently sloping to strongly rolling
Slightly to very stony.
Classes 4, 5, and 6 Suitable for grazing, pasture, forage and cereal grains.
Classes 2 and 3 Suitable for pinegrass.
McLaren (ML)
Morainal deposits. Luvisol.
Gravelly sand loam or gravelly loam. Moderately alkaline.
Moderately rolling to steeply sloping.
Slightly to very stony.
Classes 5 and 6 Suitable for pasture and grazing.
Classes 2 and 3 Suitable for pinegrass.
Mellin (ME) Morainal deposits. Luvisol.
Sandy loam or loam. Acidic to neutral.
Moderately rolling to hilly.
Very to exceedingly stony.
Class 6 Suitable for grazing.
Class 5 Suitable for pinegrass.
Rocky Outcrop (RO)
Exposed bedrock with less than 10 cm of soil on the rock surface.
Bedrock Extremely sloping Not suited to soil-based agriculture.
Not suitable for crops. Not suitable for grazing.
36
VI Lilllooet news article about Blue Goose
Historic Diamond S Ranch sold: New owner is Blue Goose Cattle Company
http://www.lillooetnews.net/article/20130508/LILLOOET0101/305089994/-1/lillooet/historic-diamond-s-ranch-
sold
Wendy Fraser, May 8, 2013
The historic Diamond S Ranch at Pavilion has been sold to the Blue Goose Cattle Company of Toronto. Kevin Reed, Blue Goose chairman of the board and CEO, confirmed the sale in an interview with the News last week. “The deal to acquire the Diamond S closed the end of March,” said Reed. “We have acquired deeded acreage of approximately 15,000 acres, and around 600 head of cattle came with the sale.” He said the land purchase includes the ranch on top of Pavilion Mountain, along Highway 99 North and the valley bottom along Pavilion Creek. Blue Goose is a privately owned Canadian operation with a leading position in the organic and natural beef production markets. The company has operations in B.C., Ontario and Colorado. Under its stewardship, it has more than 700,000 acres of deeded, leased and licensed grazing land, as well as one of the largest organic cattle herds in North America. In addition to its certified organic beef operation, the Blue Goose company has two other components – certified organic rainbow trout and certified organic poultry. Reed described the Diamond S property as “ideal for continuation of what our core business is.” He said Blue Goose intends to invest in the Diamond S ranch, adding more cattle to the ranch operation and increasing the number of employees as well. “We’re one of the largest producers in North America of what I call ‘clean protein,’” said Reed. “Our customers are Whole Foods, Sobeys and Loblaws and high-end restaurants. I firmly believe that organic protein is in high demand.” The Diamond S is one of the oldest ranches in the province. The Pavilion Mountain portion of the Diamond S was once known as “Carson’s Kingdom” after Robert Carson, who acquired the land in 1866. The ranch stayed in the Carson family until 1942 when Colonel Victor Spencer purchased the ranch. Colonel Spencer was the son of a prominent Vancouver businessman who owned a chain of department stores called Spencer’s. In 1949, Spencer added to his holdings in the Pavilion area when he bought another historic ranch, the Bryson Ranch, located on the Pavilion Mountain plateau and in the valley below the mountain. Colonel Spencer also owned the Douglas Lake Ranch in the Nicola Valley, the Circle S Ranch at Dog Creek and Earlscourt, across the Fraser River from Lytton. Following Spencer’s death in 1960, his ranches were sold. Ted Termuende purchased the Diamond S in the 1960s and the Termuende family owned the ranch until its sale in March. Commenting on the Spencer family connection to the ranch, Kevin Reed noted, “Life is sometimes a full circle. “I used to coach the son of a good friend of mine and his name is Spencer Dyer. Prior to starting and running Blue Goose, I built a trust company here in Canada and I hired Spencer out of university and gave him his first job on Bay Street. He went on to work as investment banker and now he’s just joined us,” continued Reed. “I told him we

37
were buying Diamond S and asked him if he knew the history there. He said, ‘No, not really.’ His great-grandfather was Colonel Spencer, so I was able to tell him a bit of his family history. “Spencer just left Toronto to head to B.C. We have a finishing lot with an abattoir and a fertilizer plant in Salmon Arm. He just went out there two weeks ago to start learning that part of the business, so he’s pretty excited about getting out to the Diamond S too, to see where his family’s roots are and where his great-grandfather’s ashes are spread.” Reed concluded, “We deeply respect the history and the folklore and the opportunity associated with the ranch. We look forward to investing in it and expanding our organic beef operation there. We’re really honoured to take a place in history with that ranch. And we think this is a great business to be in.