p br it sh alberta aci columbia fic lillooet geochemical ... · by r.e. lett keywords: lillooet,...
TRANSCRIPT
Geochemical Surveys in the Lillooet Area (NTS Areas 092J, 092I, 092O,092P), Southwestern British Columbia
By R.E. Lett
KEYWORDS: Lillooet, Spences Bridge Group, re gionalgeo chem i cal sur vey, geo chem i cal sam ples
INTRODUCTION
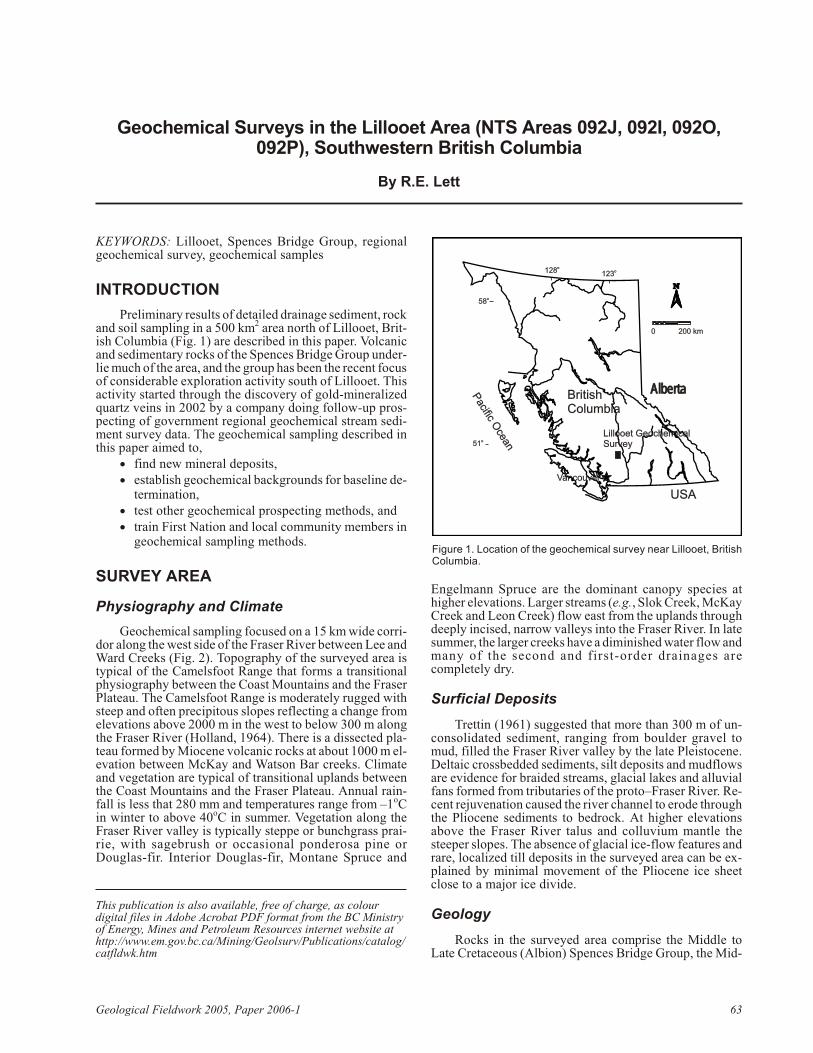
Pre lim i nary re sults of de tailed drain age sed i ment, rock and soil sam pling in a 500 km2 area north of Lillooet, Brit -ish Co lum bia (Fig. 1) are de scribed in this pa per. Vol ca nicand sed i men tary rocks of the Spences Bridge Group un der -lie much of the area, and the group has been the re cent fo cus of con sid er able ex plo ra tion ac tiv ity south of Lillooet. Thisac tiv ity started through the dis cov ery of gold-min er al izedquartz veins in 2002 by a com pany do ing fol low-up pros -pect ing of gov ern ment re gional geo chem i cal stream sed i -ment sur vey data. The geo chem i cal sampling described inthis paper aimed to,
• find new min eral de pos its,• es tab lish geo chem i cal back grounds for base line de -
ter mi na tion,• test other geo chem i cal pros pect ing meth ods, and• train First Na tion and lo cal com mu nity mem bers in
geo chem i cal sam pling meth ods.
SURVEY AREA
Physiography and Climate
Geo chem i cal sam pling fo cused on a 15 km wide cor ri -dor along the west side of the Fra ser River be tween Lee andWard Creeks (Fig. 2). To pog ra phy of the sur veyed area istyp i cal of the Camelsfoot Range that forms a tran si tionalphys i og ra phy be tween the Coast Moun tains and the Fra serPla teau. The Camelsfoot Range is mod er ately rug ged withsteep and of ten pre cip i tous slopes re flect ing a change fromel e va tions above 2000 m in the west to be low 300 m alongthe Fra ser River (Hol land, 1964). There is a dis sected pla -teau formed by Mio cene vol ca nic rocks at about 1000 m el -e va tion be tween McKay and Wat son Bar creeks. Cli mateand veg e ta tion are typ i cal of tran si tional up lands be tweenthe Coast Moun tains and the Fra ser Pla teau. An nual rain -fall is less that 280 mm and tem per a tures range from –1oCin win ter to above 40oC in sum mer. Veg e ta tion along theFra ser River val ley is typ i cally steppe or bunchgrass prai -rie, with sage brush or oc ca sional pon der osa pine orDouglas-fir. In te rior Douglas-fir, Montane Spruce and
Engelmann Spruce are the dom i nant can opy spe cies athigher el e va tions. Larger streams (e.g., Slok Creek, McKay Creek and Leon Creek) flow east from the up lands throughdeeply in cised, nar row val leys into the Fra ser River. In latesum mer, the larger creeks have a diminished water flow and many of the second and first-order drainages arecompletely dry.
Surficial Deposits
Trettin (1961) sug gested that more than 300 m of un -con sol i dated sed i ment, rang ing from boul der gravel tomud, filled the Fra ser River val ley by the late Pleis to cene.Deltaic crossbedded sed i ments, silt de pos its and mudflowsare ev i dence for braided streams, gla cial lakes and al lu vialfans formed from trib u tar ies of the proto–Fra ser River. Re -cent re ju ve na tion caused the river chan nel to erode throughthe Plio cene sed i ments to bed rock. At higher el e va tionsabove the Fra ser River ta lus and col lu vium man tle thesteeper slopes. The ab sence of gla cial ice-flow fea tures andrare, lo cal ized till de pos its in the sur veyed area can be ex -plained by min i mal move ment of the Pliocene ice sheetclose to a major ice divide.
Geology
Rocks in the sur veyed area com prise the Mid dle toLate Cre ta ceous (Albion) Spences Bridge Group, the Mid -
Geo log i cal Field work 2005, Pa per 2006-1 63
This pub li ca tion is also avail able, free of charge, as col ourdig i tal files in Adobe Ac ro bat PDF for mat from the BC Min is tryof En ergy, Mines and Pe tro leum Re sources internet website athttp://www.em.gov.bc.ca/Min ing/Geolsurv/Pub li ca tions/cat a log/catfldwk.htm
Lillooet Geochemical Survey Lillooet Geochemical Survey
VancouverVancouver
0 200 km0 200 km
BritishColumbiaBritishColumbia
Pacific O
cean
Pacific O
ceano51o51
o58o58
o128o128 o123o123
AlbertaAlberta
USAUSA
Fig ure 1. Lo ca tion of the geo chem i cal sur vey near Lillooet, Brit ishCo lum bia.

dle to Early Cre ta ceous Jack ass Moun tain Group, theEocene Ward Creek as sem blage and the Mio cene to Plio -cene Chil cotin Group. Spences Bridge and Jack ass Moun -tain rocks are ex posed as pan els within the Fra ser faultzone, a ma jor north west-trending dextral wrench fault sys -tem of Eocene age that com prises the Fra ser fault, the SlokCreek fault, the Hun gry Val ley fault and the Wat son Barthrust (Trettin, 1961; Read, 1988). Off sets across the faultare most likely in the or der of 130 km (Mon ger andJourneay, 1994). Cathro et al. (1998) de scribed the EarlyCre ta ceous Jack ass Moun tain Group as a south west-dip -ping as sem blage of volcaniclastic sed i men tary rocks de -pos ited as a sub ma rine fan com plex in a fore-arc en vi ron -ment rep re sented by Tyaughton Ba sin. In the sur veyedarea, the Spences Bridge Group com prises an up per unit ofgrey to green dacite, an de site and mi nor ba salt, and a lowerunit of vol ca nic arenite, con glom er ate, mi nor siltstone,
phyllitic argillite and rare car bo na ceous shale. Eocenerocks are vol ca nic peb ble con glom er ate, shale, rhyodaciteflows and tuffaceous wacke. Plio cene to Mio cene Chil cotin rocks are mainly ve sic u lar and amygdaloidal basalt withminor conglomerate and sandstone (Read, 1988).
Mineral Deposits
A clus ter of min eral oc cur rences in the north ern part ofthe sur veyed area forms part of the Wat son Bar Au belt.Cathro et al. (1998) de scribed five dis tinct styles of goldmin er al iza tion hosted by Jack ass Moun tain rocks:
• iron car bon ate–sil ica al ter ation zones en riched in Au,As, Sb and Hg
• thrust-hosted quartz-sul phide min er al iza tion
64 Brit ish Co lum bia Geo log i cal Sur vey
Fig ure 2. Gold by in stru men tal neu tron ac ti va tion anal y sis (INAA) in stream sed i ment sam ples taken dur ing1992 and 1994 re gional geo chem i cal sur veys in the Lillooet area.

• quartz-sul phide veins re lated to quartz-feld sparpor phyry sills in trud ing Jack ass Moun tain sed i -men tary rocks
• h igh-an g l e quar t z - su l ph ide ve ins andstockworks
• Au-en riched ho ri zons in the sed i men tary rocks
The larg est min eral oc cur rence in the sur veyedarea is the Wat son Bar de vel oped pros pect (MINFILE092O 051; MINFILE, 2005), where a shal low south -west-dip ping thrust (zone V) con tains an es ti mated136 962 t grad ing 14.33 g/t Au (Cathro et al., 1998).The Wat son Bar pros pect has been clas si fied as an epi -ther mal Au-Ag low-S de posit. Other smaller Au oc cur -rences in the area are the MAD (MINFILE 092O 092),Buster (MINFILE 092O 055) and Aston ish er(MINFILE 092O 054). Read (1988) doc u mented anum ber of perlite, vol ca nic glass and ben ton ite in dus -trial min eral occurrences in the surveyed area.
SURVEY METHODS
Sampling
In Au gust 2005, 25 stream sed i ment, 25 streamwa ter, 10 moss mat and 4 bulk sed i ment sam ples werecol lected from sites be tween Ward and Lee Creeks(NTS map sheets 092J, 092I, 092O and 092P). Sed i -ment typ i cal of that taken dur ing re con nais sance-scalegeo chem i cal sur veys was col lected in high-wet-strength Kraft pa per bags from mid and lat eral bars inac tive stream chan nels at lo ca tions se lected to avoid ex -tremes of high or low en ergy. Wa ter, taken from the ac -tive stream flow, was col lected in a 12 mL Nalgene®
bot tle rinsed with stream wa ter sev eral times be forecol lec tion. Liv ing moss, where at tached to boul dersand logs, was col lected in Kraft pa per bags from justabove the stream wa ter sur face. Field du pli cate sam -ples, gen er ally 2–3 m apart, were col lected from thesame type of ma te rial and stream en vi ron ment. In for ma tion about the sam ple, such as sed i ment tex ture, stream size andwater flow, was recorded at each site.
Ide ally, bulk sed i ment for prep a ra tion of a heavy min -eral con cen trate (HMC) frac tion was taken at the up streampoint of midchannel bars. At each HMC site a 5 gal lon plas -tic pail was lined with a heavy-duty poly eth yl ene plas ticbag (18 x 24 inches, 4 mil) and sed i ment was wet-sievedthrough a 12-mesh (1.68 mm) stain less steel sieve un til asam ple weight of 10–15 kg was ob tained. The sam ple wasweighed in the pail be fore the open ing was taped shut withblack elec tri cal tape and placed in a sec ond bag. Bulk sam -ples were shipped di rectly to the Geo log i cal Sur vey of Can -ada for prep a ra tion and anal y sis. Twenty-four rock sam ples were taken from out crops in the sur veyed area and five C-soil ho ri zon sam ples were collected from pits dug close toroads.
Sample Preparation
Fine-tex tured sed i ment and moss mat sed i ment sam -ples were pre pared in the BC Geo log i cal Sur vey Lab o ra -tory in Vic to ria. The sam ples were air dried and the –18mesh (<1 mm) frac tion re cov ered by gently disaggregatingthe sed i ment or by pound ing the moss mat be fore dry siev -ing through a 1 mm stain less steel screen. A split of the
1 mm frac tion was then screened to –80 mesh ASTM(<0.177 mm) and a sec ond split screened to –230 mesh(<0.063 mm). Con trol ref er ence ma te rial and sieved an a lyt -i cal du pli cate sam ples were in serted into each an a lyt i calblock of 20 sed i ment sam ples. Any re main ing –80 and –230mesh sed i ment was ar chived for fu ture anal y ses. Wa tersam ples were an a lyzed for pH and con duc tiv ity in the fieldus ing a cal i brated Hanna model HI 98129 me ter. A por tionof the wa ter sam ple was fil tered though a 0.45 µm fil ter andacid i fied with Seastar Base line 50% ni tric acid.
Sample Analysis
Pre pared stream sed i ment, moss sed i ment and rocksam ples, with qual ity-con trol rep li cate and stan dard ref er -ence ma te ri als, were an a lyzed at Acme An a lyt i cal Lab o ra -to ries Ltd., Van cou ver, BC for 37 trace and mi nor el e mentsby a com bi na tion of in duc tively cou pled plasma – massspec trom e try (ICP-MS) and in duc tively cou pled plasma –emis sion spec trom e try (ICP-ES) fol low ing aqua regia di -ges tion. Se lected –80 mesh frac tion sed i ment sam ples were also an a lyzed for Au and 32 trace el e ments at Actlabs,Ancaster, On tario by in stru men tal neu tron ac ti va tion anal -y sis (INAA). In stru men tal de tec tion lim its for se lected el e -ments are listed in Ta ble 1. Fil tered, acid i fied wa ter sam -ples, CANMET river wa ter SLRS 3, un fil tered wa ter
Geo log i cal Field work 2005, Pa per 2006-1 65
Element Units DL Mean % RSD GSBRM STSD 1 % Diff.
Ag_ICP ppb 2 81 8 274 300 9.1As_ICP ppm 0.1 5.50 1.9 17.9 17 5.2As_INA ppm 0.5 4.8 23.6 23.8 23 3.4Au_ICP ppb 0.2 99.60 56.4 8.7 8 8.4Au_INA ppb 2 33 17.0 23 8 96.8Ba_INA ppm 50 410 6.9 780 630 21.3Bi_ICP ppm 0.02 0.51 1.4 0.44 N.D. N.D.Cd_ICP ppm 0.01 0.23 6.2 0.9 0.8 11.8Co_ICP ppm 0.1 12.1 0.6 13.9 14 0.7Co_INA ppm 1 9.5 7.4 18 17 5.7Cr_ICP ppm 0.5 21.3 3.5 27.7 67 83.0Cr_INA ppm 5 37 0.0 58 67 14.4Cu_ICP ppm 0.01 178.50 0.6 34.22 36 5.1Fe_INA % 0.01 3.59 0.6 4.73 4.7 0.6Hg_ICP ppb 5 19 7 100 110 9.5LOI_GRAV % 0.01 4.15 2.6 29.5 31.6 6.9Mn_ICP ppm 1 459 0.1 3568 3740 4.7Mo_ICP ppm 0.01 14.25 2.9 1.06 2 61.4Ni_ICP ppm 0.1 13.35 0.8 19.5 18 8.0Pb_ICP ppm 0.01 6.90 0.46 33.11 34.00 2.70Sb_ICP ppm 0.02 0.19 9.6 2.3 2 14.0Sb_INA ppm 0.1 0.7 32.6 4.7 3.3 35.0Se_ICP ppm 0.1 3.50 1.0 1.9 N.D. N.D.V_ICP ppm 2 101 0.4 46 47 2.2
Zn_ICP ppm 0.1 54.40 1.2 154.2 165 6.8
TABLE 1. DETECTION LIMITS, PRECISION (% RSD) ANDACCURACY FOR ELEMENTS ANALYZED BY INSTRUMENTAL
NEUTRON ACTIVATION (_INA) AND AQUA REGIA – INDUCTIVELYCOUPLED PLASMA – MASS SPECTROMETRY (_ICP), LILLOOET
AREA GEOCHEMICAL SURVEY. ABBREVIATIONS: DL,INSTRUMENTAL DETECTION LIMIT; GSBRM, ANALYSIS OF
STSD 1 IDENTIFIED AS SAMPLE 92O20051008; STSD 1,RECOMMENDED ELEMENT VALUES BY LYNCH (1990) FORCANMET REFERENCE MATERIAL; MEAN, MEAN OF TWO
ANALYSES; % RSD, PERCENT RELATIVE STANDARD DEVIATIONFOR TWO ANALYSES; % DIFF., PERCENT DIFFERENCE
BETWEEN TWO ANALYSES; GRAV, LOSS-ON-IGNITION AT 550°C; ND, NOT DETERMINED BY CANMET

blanks and fil tered blanks were an a lyzed for ma jor andtrace el e ments by ICP-MS at Acme An a lyt i cal Lab o ra to -ries Ltd. De tec tion lim its for trace el e ments in wa ter rangefrom 0.05 to 0.1 ppb. Prep a ra tion of a heavy min eral con -cen trate (HMC) from the bulk sediment samples andanalysis of the HMC for Au and trace elements is still inprogress.
Quality Control
Re li able data in ter pre ta tion de pends on dis crim i nat ingbe tween real geo chem i cal trends and those vari a tions in tro -duced by sam pling and anal y sis. Con trol ref er ence stan -dards and an a lyt i cal du pli cates are there fore rou tinely in -serted into the batches of stream sed i ment, stream wa terand moss sed i ment sam ples sub mit ted for com mer cial anal -y sis to mea sure ac cu racy and pre ci sion. Na tional Geo -
chem i cal Re con nais sance (NGR) qual ity-con trol pro ce -dures used in this pro ject are based on anal y sis of sev en teen rou tine sed i ment or wa ter sam ples, a field du pli cate sam -ple, an an a lyt i cal du pli cate sam ple or wa ter blank, and Acon trol ref er ence sam ple in a block of 20 sam ples. Re sultsfrom this pro ject show that, for most el e ments, the com -bined an a lyt i cal and sam pling vari a tion ex pressed as a per -cent age dif fer ence be tween du pli cate sam ple val ues is lessthat 20%. Ta ble 1 lists mean con cen tra tion and per cent rel a -tive stan dard de vi a tion (% RSD) for a du pli cate pair of theBC Geo log i cal Sur vey sed i ment ref er ence ma te rial foreach el e ment. Also shown in Ta ble 1 is the per cent agedifference between analyses of stream sediment referencematerial STSD1 and the CANMET recommended value for this material (Lynch, 1990).
Pre ci sion (% RSD) for most el e ments other than Au,As (INAA) and Sb (INAA) is less than 10%. Lower pre ci -
66 Brit ish Co lum bia Geo log i cal Sur vey
Fig ure 3. Stream sed i ment and wa ter sam ple lo ca tions, 2005 de tailed geo chem i cal sur vey, Lillooet area. Sym -bols in di cate sites with anom a lous Au in stream sed i ment.

Geo log i cal Field work 2005, Pa per 2006-1 67
Sed. Moss Sed. Moss Sed. Moss Sed. Moss Sed. Moss
Ag_ICP ppb 53 71 46 76 73 82 110 103 88 94As_ICP ppm 31.4 69.3 4.5 5.8 17.8 66.3 289.2 353.9 184.1 290.4As_INA ppm 24.7 43.3 2.4 3.2 92.2 10.9 188.0 226.0 127.2 190.4Au_ICP ppb 2.6 6.7 0.7 0.7 1.5 7.9 29.6 28.8 9.6 27.0Au_INA ppb 17 92 2 5 3 6 331 494 23 426Ba_INA ppm 426 380 410 350 690 430 780 580 644 580Bi_ICP ppm 0.07 0.08 0.05 0.06 0.07 0.07 0.26 0.18 0.16 0.18Cd_ICP ppm 0.01 0.10 0.10 0.11 0.12 0.14 0.22 0.17 0.16 0.16Co_ICP ppm 13.7 14.6 13.7 12.1 15.4 14.8 29.5 24.7 21.5 24.1Co_INA ppm 11 10 11 8 19 13 22 17 19 17Cr_ICP ppm 40.2 45.1 41.6 46.8 46.9 51.6 54.2 54.1 52.7 54.0Cr_INA ppm 80 96 77 86 125 115 126 141 123 133Cu_ICP ppm 39.84 46.81 28.88 28.52 38.38 52.16 182.63 120.85 89.44 110.78Fe_INA % 2.76 2.66 2.60 2.43 4.74 3.27 5.46 3.50 4.38 3.49Hg_ICP ppb 204 214 32 59 60 242 3282 1035 461 739LOI_GRAV % 9.30 11.99 8.40 9.50 10.35 14.90 17.90 18.30 17.80 18.10Mn_ICP ppm 597 633 582 619 643 657 1080 821 897 796Mo_ICP ppm 0.64 0.73 0.40 0.54 0.48 1.01 2.58 1.41 2.04 1.37Ni_ICP ppm 32.4 34.6 33.1 34.4 36.7 38.0 43.4 41.0 41.7 40.4Pb_ICP ppm 4.70 5.55 4.58 4.81 5.12 5.38 8.49 12.61 7.72 9.43Sb_ICP ppm 0.8 1.6 0.2 0.4 0.4 2.2 7.8 6.9 3.4 5.5Se_ICP ppm 0.8 1.0 0.6 0.9 0.9 1.1 3.8 2.4 1.9 2.0V_ICP ppm 78 89 80 92 90 95 115 132 112 117
Zn_ICP ppm 60.7 66.2 59.1 65.3 68.3 67.9 93.6 83.5 80.1 78.2
Element UnitsMean Median 3rd Quartile Maximum 95th Percentile
TABLE 2. MOSS SEDIMENT (MOSS) AND STREAM SEDIMENT (SED.) STATISTICS, LILLOOET AREADETAILED GEOCHEMICAL SURVEY. MEAN, MEDIAN, 3RD QUARTILE, 95TH PERCENTILE, MAXIMUM AND
MINIMUM VALUES HAVE BEEN CALCULATED FROM DATA FOR 25 SEDIMENT AND 10 MOSS MATSAMPLES
-80 -230 -80 -230 -80 -230 -80 -230 -80 -230
Ag_ICP ppb 54 124 46 68 73 80 110 826 1.5 10.3As_ICP ppm 31.3 46.2 4.5 20.9 17.8 48.0 289.2 260.1 16.2 5.4Au_ICP ppb 2.6 6.5 0.7 0.9 1.5 2.2 29.6 59.5 19.7 27.0Bi_ICP ppm 0.07 2.39 0.05 0.08 0.10 0.09 0.26 0.17 2.6 1.9Cd_ICP ppm 0.11 0.14 0.10 0.14 0.10 0.14 0.22 0.22 2.2 1.6Co_ICP ppm 13.7 14.2 13.7 13.2 15.4 16.5 29.5 25.9 1.9 1.6Cr_ICP ppm 40.2 40.8 41.6 40.5 46.9 41.9 54.2 52.8 1.2 1.3Cu_ICP ppm 39.8 46.6 28.9 41.3 38.4 63.1 182.6 106.3 4.8 1.7Fe_ICP % 3.05 3.07 2.98 3.13 3.40 3.38 5.61 4.66 1.7 1.4Hg_ICP ppb 204 371 32 262 60 588 3282 999 54.7 1.7Mn_ICP ppm 597 664 582 638 643 674 1080 1286 1.7 1.9Mo_ICP ppm 0.6 0.6 0.4 0.6 0.5 1.5 2.6 2.1 5.2 1.4Ni_ICP ppm 32.4 32.0 33.1 32.3 36.7 33.1 43.4 39.7 1.2 1.2Pb_ICP ppm 4.80 5.60 4.60 5.20 5.10 6.20 8.50 9.20 1.7 1.5Sb_ICP ppm 0.82 1.17 0.22 0.41 0.40 1.53 7.79 3.95 19.5 2.6Se_ICP ppm 0.8 1.1 0.6 0.6 0.9 1.6 3.8 4.4 4.2 2.8V_ICP ppm 78 74 80 71 90 91 115 109 1.3 1.2
Zn_ICP ppm 60.7 65.7 59.1 64.3 68.3 76.3 93.6 82.7 1.4 1.1
3rd Quartile Maximum ContrastElement Units
Mean Median
TABLE 3. STATISTICS FOR THE –80 AND –230 MESH FRACTIONS OF STREAM SEDIMENT, LILLOOETAREA DETAILED GEOCHECMICAL SURVEY. MEDIAN, 3RD QUARTILE AND MAXIMUM VALUES HAVE
BEEN CALCULATED FROM DATA FOR TWENTY-FIVE –80 MESH AND THIRTEEN –230 MESH SEDIMENT SAMPLES. CONTRAST IS THE RATIO OF THE MAXIMUM VALUE TO THE 3RD QUARTILE

sion for Au by ICP-MS (56%) re flects the small sam ple(1 g) used for the anal y sis. Ac cu racy (dif fer ence be tweenre ported and rec om mended) for Au, Ba, Cd, Cr, Mo and Sbis greater than 10%. Low ac cu racy (>10%) for some of theel e ments (e.g., Cr) can be ex plained by a dif fer ence be -tween the meth ods used to pro duce the re ported and rec om -mended value. The rea son for a large dif fer ence (93%) be -tween the re ported and rec om mended Au value for STSD 1is pres ently un known. Per cent rel a tive stan dard de vi a tionval ues for As, Ba, Cu, Ni, Pb and Zn cal cu lated from du pli -cate anal y ses of the river wa ter stan dard SLRS 3 are lessthan 10%. Mean val ues for these el e ments are less than10% dif fer ent than their CANMET rec om mended value inthe wa ter stan dard. Fil tered wa ter blanks an a lyzed with thestream wa ter sam ples have less than 1.5 ppb Cu, less than1.5 ppb Zn and detectable Pb and As.
RESULTS
Previous Regional Survey Results
Fig ure 2 shows the con cen tra tion of Au in stream sed i -ment sam ples col lected dur ing pre vi ous re gional geo chem -i cal sur veys that cov ered the sur veyed area (Jackaman etal., 1992a, b; Jackaman and Matysek, 1994). The high estAu value (43 ppb) de tected in the area cov ered by de tailedsam pling is in sed i ment from Madson Creek, a north-flow -ing trib u tary of Wat son Bar Creek. This sed i ment also con -tains 343 ppm As and 14.2 ppm Sb in the sed i ment. Thesource of the Au and other anom a lous met als in Madsoncreek is the Au min er al iza tion at the Watson Bar developedprospect.
68 Brit ish Co lum bia Geo log i cal Sur vey
Fig ure 4. Stream sed i ment and wa ter sam ple lo ca tions, 2005 de tailed geo chem i cal sur vey, Lillooet area. Sym -bols in di cate sites with anom a lous As-Hg in stream sed i ment.
Detailed Survey Results: Drainage SampleType and Size Fraction Comparison
Fig ure 3 shows the lo ca tion of the steam sed i ment andwa ter sam ples col lected dur ing the de tailed sur vey. Listedin Ta ble 2 are se lected el e ment sta tis tics for stream sed i -ment and moss mat sam ples, in clud ing both 3rd quartile and95th per cen tile val ues. The 3rd quartile can be a more re al is -tic thresh old for a small dataset than the more tra di tional95th per cen tile. Both 3rd quartile and 95th per cen tile showthat most el e ments (e.g., Au, Ag, Cu, As, Hg, Mo, Pb) arehigher in the moss sed i ment than in the stream sed i ment.Matysek and Day (1988) re ported a sim i lar pat tern of el e -ment en hance ment in the moss sed i ment from streamsdrain ing Cu and Au min er al iza tion on Van cou ver Is land.Higher el e ment val ues most likely re flect cap ture of metal-rich sus pended sed i ment, in clud ing Au grains, by moss
dur ing pe ri ods of higher stream flow. Al though moss sed i -ment anal y sis can im prove geo chem i cal anom aly con trast(Matysek and Day, 1988), the moss is not pres ent in ev erystream due to the rel a tively dry climate. It therefore haslimited exploration application in the Lillooet area.
Ta ble 3 com pares the –80 mesh stream sed i ment geo -chem is try with that of the –230 mesh frac tion. Thirdquartile val ues show that el e ments are higher in the –230mesh frac tion of the sed i ment, with the ex cep tion of Cr andNi. Ex cept for Ag and Au, how ever, the geo chem i calanom aly con trast (ra tio of the max i mum to 3rd quartile) islarger in the –80 mesh frac tion. Al though the abil ity ofstream sed i ment geo chem is try to de tect Au min er al iza tionis im proved by us ing the –230 mesh frac tion, there are lim i -ta tions to us ing this frac tion, such as 1) the need to col lect alarger sam ple for prep a ra tion of enough ma te rial for anal y -sis, 2) the prob lem of lev el ling data pro duced from the two
Geo log i cal Field work 2005, Pa per 2006-1 69
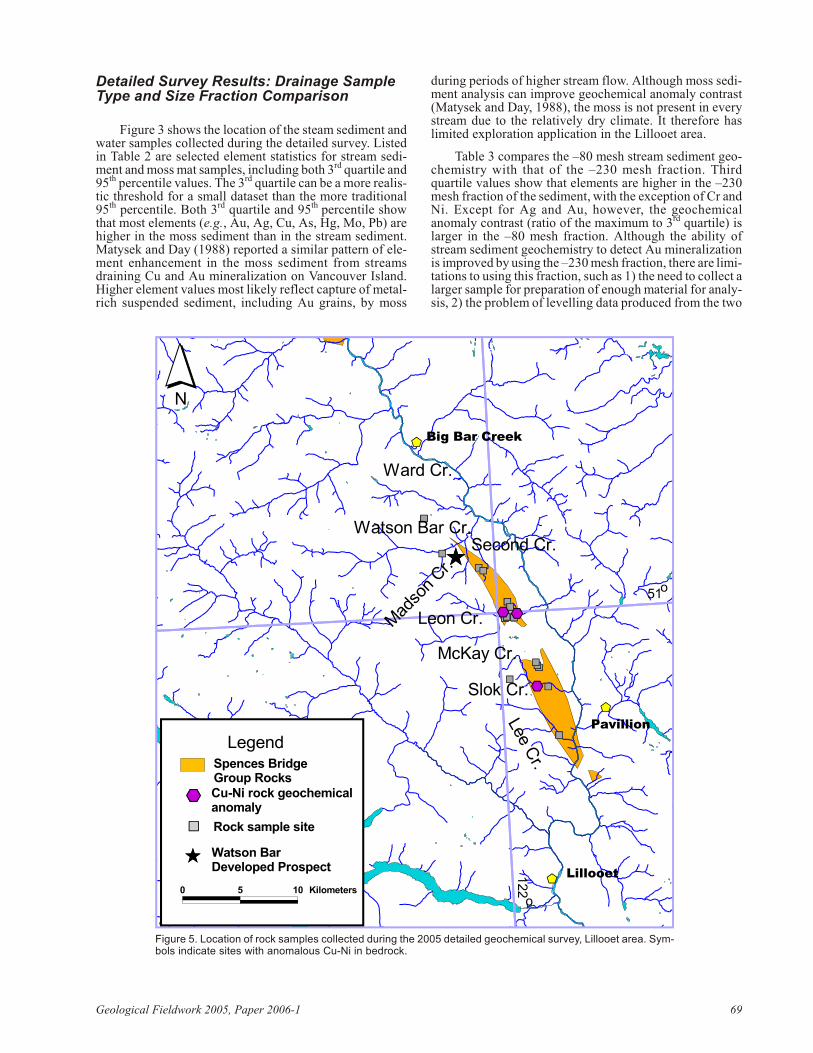
Fig ure 5. Lo ca tion of rock sam ples col lected dur ing the 2005 de tailed geo chem i cal sur vey, Lillooet area. Sym -bols in di cate sites with anom a lous Cu-Ni in bed rock.

size frac tions, and 3) the lower anom aly con trast for otherel e ments.
Detailed Survey Results: Sediment andWater Geochemistry
Sed i ment sam ples (–80 mesh frac tion) with more than10 ppb aqua regia – ICP-MS Au or 23 ppb INAA Au areiden ti fied on Fig ure 3. The multielement sig na ture ofstream anom a lies can help char ac ter ize the source min er al -iza tion. The high est Au value (311 ppb by INAA) is ac com -pa nied by 188 ppm As and 511 ppb Hg in sed i ment fromMatson Creek, which flows from the Wat son Bar epi ther -mal Au-Ag de posit. Wat son Bar creek sed i ment has only to25 ppb Au but up to 210 ppm As in the sed i ment. This com -pares to sed i ment with 21 ppb Au, 38 ppm As and 230 ppbHg taken from a sim i lar site in the creek dur ing the orig i nalre gional sur vey. Sam ples of the –80 mesh sed i ment withmore than 18 ppb As and 60 ppb Hg (3rd quartile) shown onFig ure 4 clus ter around the Wat son Bar de posit. The sed i -ment also has el e vated As, Bi, Cu and Mo val ues, but onlyback ground Au lev els. Anom a lous As and Hg can be de -tected 2 km from the Au min er al iza tion in Second Creek, astream flowing north into Watson Bar Creek.
Al though no other sam ples in the sur vey area haveanom a lous As and Hg, one sam ple from Slok Creek, closeto the con tact be tween the Spences Bridge and Jack assMoun tain groups, has 29 ppb Au de ter mined by aqua regia– ICP-MS but no de tect able Au by INAA. This dif fer encecan be ex plained by the char ac ter is tic high vari abil ity or‘nug get ef fect’ of Au in stream sed i ment. Stream wa ters areal ka line (me dian pH 8.3) and typ i cally have a high (50–100 ppm) dis solved Ca-Mg con cen tra tion. Con cen tra tionsof most trace heavy met als (e.g., Cr, Ag) are ei ther be low orjust above in stru ment de tec tion limit. Low con cen tra tionsof path finder met als (e.g., As, Cd, Pb, Cu, Zn) are de tect -able in the stream wa ter. For ex am ple, the high est amountsare 1.4 ppb Pb, 2.3 ppb Zn, 38 ppb Cu and 17.5 ppb As inwa ter from the up per reach of a branch of Sec ond Creek.
Two kilo metres down stream, the As level is 3.3 ppb andother met als are be low de tec tion limit.
Detailed Survey Results: Rock andOverburden Geochemistry
Ta ble 4 lists sta tis tics cal cu lated from data for 21 sam -ples of vol ca nic rock from the Spence’s Bridge Group col -lected as part of the sur vey (Fig. 5). The max i mum Au value de tected in the sam ple suite is 2.7 ppb and there are no highcon cen tra tions of those path finder el e ments char ac ter is ti -cally as so ci ated with Au min er al iza tion in the area (e.g.,As, Hg). How ever, Ta ble 4 re veals that the Spences BridgeGroup has rel a tively high back ground lev els for Cu, Ni andV. The ac tual back ground lev els for these and other el e -ments (e.g., Cr and Ba) may be even higher be cause theaqua regia di ges tion will not dis solve all of the alu mi no sili -cate and ox ide min er als and there fore will not lib er ate all ofthe sil i cate-bound metal. Fig ure 5 shows the lo ca tions ofsam ples with more than 65 ppm Cu and 48 ppm Ni. Thesesam ples also have el e vated V and ap pear to clus ter near thefault-bounded con tact of the Spences Bridge Group. Theanom a lous Cu and Ni could be ex plained by fault-con -trolled serpentinization of mafic or ultra mafic rocks in thevol ca nic stra tig ra phy. Fur ther anal y sis of the rock sam plesby INAA is in prog ress. Ta ble 5 lists sta tis tics cal cu latedfrom aqua regia – ICP-MS data for five C-ho ri zon soil sam -ples col lected on pla teau area un der lain ba salt. The C-ho ri -zon soil sam ples have a rel a tively uni form dis tri bu tion ofel e ments, and no anom a lous Au val ues were detected.
CONCLUSIONS
De tailed stream geo chem i cal stud ies in an area northof Lillooet re veal that,
• sed i ment and moss sed i ment in streams drain ing theWat son Bar Au-Ag de posit have anom a lous As and Hgval ues, with vary ing amounts of Au. Ar senic and Hg aregeo chem i cal pathfinders for the epi ther mal Au-Ag min -
70 Brit ish Co lum bia Geo log i cal Sur vey
Element Mean Median3rd
Quartile
Max-
imum95th Per-
centile
Ag_ICP 47 35 46 259 72As_ICP 4.8 4.9 7.0 12.2 10.7Au_ICP 0.7 0.5 0.9 2.7 1.80Bi_ICP 0.1 0.0 0.1 0.2 0.15Cd_ICP 0.10 0.07 0.10 0.35 0.31Co_ICP 18.4 17.9 20.9 39.9 33.3Cr_ICP 49.4 37.0 67.0 128.5 115.7Cu_ICP 52.0 46.1 65.9 129.61 88.78Fe_ICP 3.5 3.6 4.4 6.27 5.05Hg_ICP 10 7.0 14.0 45 35Mn_ICP 665 664.0 820.0 1164 1064Mo_ICP 0.38 0.35 0.49 0.59 0.58Ni_ICP 41.2 28.0 48.2 180.7 125.8Pb_ICP 3.53 3.24 3.39 12.63 5.42Sb_ICP 0.15 0.14 0.18 0.43 0.36V_ICP 121 110 163 252 228
Zn_ICP 59.7 54.6 71.6 125.3 77.20
TABLE 4. STATISTICS CALCULATED FROMANALYTICAL DATA FOR 21 SAMPLES OF VOLCANIC
ROCK FROM THE SPENCES BRIDGE GROUP,LILLOOET AREA DETAILED GEOCHEMICAL SURVEY
Element Mean Median3rd
Quartile
Max-
imum95th Per-
centile
Ag_ICP 76 60 101 135 128As_ICP 6.7 6.1 8.3 9.4 9.2Au_ICP 2.6 2.2 3.1 3.6 3.5Bi_ICP 0.08 0.08 0.08 0.10 0.10Cd_ICP 0.17 0.18 0.18 0.21 0.20Co_ICP 18.00 19.20 19.40 22.40 21.80Cr_ICP 64.7 64.8 67.4 73.0 71.9Cu_ICP 49.76 48.70 55.34 56.72 56.44Fe_ICP 4.24 4.19 4.20 4.70 4.60Hg_ICP 46 39 55 93 85Mn_ICP 576 611 619 806 769Mo_ICP 0.63 0.60 0.61 0.82 0.78Ni_ICP 65.60 62.80 67.00 78.70 76.40Pb_ICP 4.85 4.47 4.97 6.40 6.11Sb_ICP 0.36 0.35 0.37 0.51 0.48Se_ICP 0.2 0.2 0.2 0.3 0.3V_ICP 86 88 88 98 96
Zn_ICP 70.4 73.4 76.8 81.2 80.3
TABLE 5. STATISTICS CALCULATED FROMANALYTICAL DATA FOR FIVE C-HORIZON SOIL
SAMPLES, LILLOOET AREA DETAILEDGEOCHEMICAL SURVEY

er al iza tion. Dis solved metal in al ka line stream wa -ter flow ing from the Au-min er al ized area fall to lev -els ap proach ing in stru ment de tec tion limit within2 km downstream.
• the –230 mesh frac tion of stream sed i ment and –80mesh frac tion of moss sed i ment typ i cally havehigher metal con tents than the –80 mesh frac tion ofstream sed i ment. How ever, ex cept for Au and Ag,geo chem i cal anom aly con trast for el e ments in the–80 mesh stream sed i ment is larger than the –230mesh stream sed i ment frac tion.
• Au and As lev els in the sed i ment are sim i lar to thosefound in a pre vi ous re gional geo chem i cal survey.
• one sed i ment sam ple from Slok Creek has de tect -able Au mea sured by aqua regia ICP-MS but noother anom a lous metal. Rock and C-ho ri zon soilsam ples have no anom a lous Au, As or Hg, but el e -vated Cu and Ni val ues could re flect the pres ence ofmafic rocks as so ci ated with faulting.
ACKNOWLEDGMENTS
The Ts’kw’aylaxw Band Coun cil is ac knowl edged forsup port ing the sur vey car ried out over their as serted tra di -tional lands west of the Fra ser River. Garrett Larochellefrom the Ts’kw’aylaxw Band helped with much of the geo -chem i cal sam pling, and his spon ta ne ous en thu si asm in thefield is very much ap pre ci ated. I learned much from Garrettabout Ts’kw’aylaxw tra di tions and cul ture dur ing the sur -vey. I also ap pre ci ate the as sis tance from Colin Smith dur -ing the ini tial stages of the field work and guid ance fromMike Cathro on re gional ge ol ogy and sur vey lo gis tics.Last, but not least, Rudi Durfeld is grate fully ac knowl -edged for gen er ously pro vid ing ac com mo da tion at hiscamp, for his hos pi tal ity and for his will ing ness to ex -change in for ma tion about the Wat son Bar property. NickMassey kindly edited a draft of the paper.
REFERENCES
Cathro, M.S., Durfeld, R.M. and Ray, G.E. (1998): Epi ther malmin er al iza tion on the Wat son Bar prop erty (92/01E),Clinton Min ing Di vi sion, south ern BC; in Geo log i cal Field -
work 1997, BC Min is try of En ergy, Mines and Pe tro leumRe sources, Pa per 1998-1, pages 21-1–21-13.
Hol land, S.S. (1964): Land forms of Brit ish Co lum bia; BC Min is -try of En ergy, Mines and Pe tro leum Re sources, Bul le tin 48,138 pages.
Jackaman, W. and Matysek, P.F. (1994): Brit ish Co lum bia Re -gional Geo chem i cal Sur vey, NTS 92I (Ashcroft); BC Min is -try of En ergy, Mines and Pe tro leum Re sources, RGS 40 andGeo log i cal Sur vey of Can ada, Open File 2666, URL<http://www.em.gov.bc.ca/Min ing/Geolsurv/Geochinv/rgs/sheets/92i.htm> [Dec 2005].
Jackaman, W., Matysek, P.F. and Cook, S.J. (1992a): Brit ish Co -lum bia Re gional Geo chem i cal Sur vey NTS 92P —Bonaparte Lake; BC Min is try of En ergy, Mines and Pe tro -l e u m R e s o u r c e s , R G S 3 6 , U R L<http://www.em.gov.bc.ca/Min ing/Geolsurv/Geochinv/rgs/sheets/92p.htm> [Dec 2005].
Jackaman, W., Matysek, P.F. and Cook, S.J. (1992b): Brit ish Co -lum bia Re gional Geo chem i cal Sur vey, NTS 92O (TasekoLakes); BC Min is try of En ergy, Mines and Pe tro leum Re -sources, RGS 35, URL <http://www.em.gov.bc.ca/Min ing/Geolsurv/Geochinv/rgs/sheets/92o.htm> [Dec 2005].
Lynch, J. (1990): Pro vi sional el e ment val ues for eight new geo -chem i cal lake sed i ment and stream sed i ment ref er ence ma -te ri als: LKSD 1, LKSD 2, LKSD 3, LKSD 4, STSD 1, STSD 2, STSD 3, STSD 4; Geostandards News let ter, Vol ume 14,no 1 pages 153–167.
Matysek, P.F. and Day, (1988): Geo chem i cal ori en ta tion sur veys:north ern Van cou ver Is land, field work and pre lim i nary re -sults; in Geo log i cal Field work, 1987, BC Min is try of En -ergy, Mines and Pe tro leum Re sources, Pa per 1988-1, pages493–502.
MINFILE (2005): MINFILE BC min eral de pos its da ta base; BCMin is try of En ergy, Mines and Pe tro leum Re sources, URL<http://www.em.gov.bc.ca/Min ing/Geolsurv/Minfile/>[Nov 2005].
Mon ger, J.W.H and Journeay, J.M. (1994): Guide to the ge ol ogyand tec tonic evo lu tion of the south ern Coast Moun tains;Geo log i cal Sur vey of Can ada, Open File 2490, 77 pages.
Read, P.B. (1988): Ter tiary stra tig ra phy and in dus trial min er als,Fra ser River to Gang Ranch, south west ern Brit ish Co lum bia (92I/5, 92I12, 92I/13, 92J/16, 92O/1, 92O/8, 92 P/4); BCMin is try of En ergy, Mines and Pe tro leum Re sources, OpenFile 1988-29, map and notes.
Trettin, H.P. (1961): Ge ol ogy of the Fra ser River val ley be tweenLillooet and Big Bar Creek; BC Min is try of En ergy, Minesand Pe tro leum Re sources, Bul le tin 44, 109 pages.
Geo log i cal Field work 2005, Pa per 2006-1 71

72 Brit ish Co lum bia Geo log i cal Sur vey