slides 3 q15_final
TRANSCRIPT

Sysco 3Q15 Earnings ResultsSysco 3Q15 Earnings Results
May 4, 2015

Statements made in this press release or in our earnings call for the third quarter of fiscal 2015 that look forward in time or that express management’s beliefs, expectations orhopes are forward-looking statements within the meaning of the Private Securities Litigation Reform Act of 1995. Such forward-looking statements reflect the views of managementat the time such statements are made and are subject to a number of risks, uncertainties, estimates, and assumptions that may cause actual results to differ materially from currentexpectations. These statements include our plans and expectations related to and the benefits and expected timing of our business transformation initiatives, expectations andefforts regarding management of operating expenses, our plans and expectations related to and the benefits of the proposed merger with US Foods, and our plans and expectationsrelated to acquisitions. These statements also include expectations regarding our sales growth, operating expense growth and operating performance results, trends in our locally-managed business and overall sales mix, market conditions and trends, tax rates, growth opportunities, inflation, fuel expense, interest expense, our expense management and costper case performance, share repurchases and diluted shares outstanding, debt repayment and related sources of funding for repayments, business transformation costs andexpenses, investments in technology resources, free cash flow and capital expenditures. The success of our business transformation initiatives and expectations regarding ouroperating performance are subject to the general risks associated with our business, including the risks of interruption of supplies due to lack of long-term contracts, severeweather, crop conditions, work stoppages, intense competition, technology disruptions, dependence on large regional and national customers, inflation risks, the impact of fuelprices, adverse publicity, and labor issues. Risks and uncertainties also include risks impacting the economy generally, including the risks that the current general economicconditions will deteriorate, or consumer confidence in the economy may not increase and decreases in consumer spending, particularly on food-away-from-home, may not reverse.Market conditions may not improve. If sales from our locally managed customers do not grow at the same rate as sales from regional and national customers, our gross marginsmay continue to decline. Our ability to meet our long-term strategic objectives to grow the profitability of our business depends largely on the success of our BusinessTransformation Project. There are various risks related to the project, including the risk that the project and its various components may not provide the expected benefits in ouranticipated time frame, if at all, and may prove costlier than expected; the risk that the actual costs of the ERP system may be greater or less than currently expected because wehave encountered, and may continue to encounter, the need for changes in design or revisions of the project calendar and budget, including the incurrence of expenses at an earlieror later time than currently anticipated; the risk that our business and results of operations may be adversely affected if we experience delays in deployment, operating problems,cost overages or limitations on the extent of the business transformation during the ERP implementation process; and the risk of adverse effects to our business, results ofoperations and liquidity if the ERP system, and the associated process changes, do not prove to be cost effective or do not result in the cost savings and other benefits at the levelsthat we anticipate. Planned deployments in the coming quarters are dependent upon the success of the ERP system and the updates at the current locations. We may experiencedelays, cost overages or operating problems when we deploy the system to additional locations. Our plans related to and the timing of the implementation of the ERP system, as wellas the cost transformation and category management initiatives, are subject to change at any time based on management’s subjective evaluation of our overall business needs. Wemay fail to realize anticipated benefits, particularly expected cost savings, from our cost transformation initiative. If we are unable to realize the anticipated benefits from our costcutting efforts, we could become cost disadvantaged in the marketplace, and our competitiveness and our profitability could decrease. We may also fail to realize the full anticipatedbenefits of our category management initiative, and may be unable to successfully execute the initiative in our anticipated timeline. Capital expenditures may vary from thoseprojected based on changes in business plans and other factors, including risks related to the implementation of our business transformation initiatives and our regional distributioncenters, the timing and successful completions of acquisitions, construction schedules and the possibility that other cash requirements could result in delays or cancellations ofcapital spending. Periods of high inflation, either overall or in certain product categories, can have a negative impact on us and our customers, as high food costs can reduceconsumer spending in the food-away-from-home market, and may negatively impact our sales, gross profit, operating income and earnings. Expanding into international marketspresents unique challenges and risks, including compliance with local laws, regulations and customs and the impact of local political and economic conditions, and such expansionefforts may not be successful. Any business that we acquire may not perform as expected, and we may not realize the anticipated benefits of our acquisitions. Expectationsregarding the accounting treatment of any acquisitions may change based on management’s subjective evaluation. Expectations regarding tax rates are subject to various factorsbeyond management’s control. The consummation of the merger with US Foods is subject to regulatory approval and the satisfaction of certain conditions, and we cannot predictwhether the necessary conditions will be satisfied or waived and the requisite regulatory approvals received. The Federal Trade Commission is seeking a preliminary injunction in theU.S. District Court for the District of Columbia that, if granted, would prevent the parties from closing the transaction while a parallel administrative proceeding determines thelegality of the merger. We also may be subject to other potential antitrust or similar lawsuits at the state level. Sysco and US Foods may be required to take certain actions to obtainregulatory approval for the merger, including the divestiture of assets, which could negatively impact the projected benefits of the merger. Sysco has signed a definitive agreementto divest 11 US Foods’ distribution centers to Performance Food Group (PFG) contingent upon closing of the proposed merger with US Foods for an aggregate consideration of $850million in cash and will be required to make certain payments to PFG if the divestiture package is cancelled. Termination of the merger agreement with US Foods could also requireSysco to make a termination payment of $300 million to US Foods, which could adversely impact Sysco’s stock price, liquidity and financial condition. As a result of uncertaintiessurrounding the proposed merger, prospective suppliers and customers may delay or decline to enter into agreements with us, and we may also lose current suppliers andcustomers, and fail to retain key employees. The pending merger and our current pre-merger integration planning efforts may divert our management’s attention from day-to-daybusiness operations and the execution of our business transformation initiatives, which could result in performance shortfalls. Integration of the businesses of Sysco and US Foodsmay be more difficult, costly or time consuming than expected, and the merger may not result in any or all of the anticipated benefits, including cost synergies. We may fail to retainsome of US Foods’ vendors and customers after the proposed merger. In relation to the merger, we have issued additional debt and our level of indebtedness and the terms of ourindebtedness could adversely affect our business and liquidity position. For a discussion of additional factors impacting Sysco’s business, see the Company’s Annual Report on Form10-K for the year ended June 28, 2014, as filed with the Securities and Exchange Commission, and the Company’s subsequent filings with the SEC. Sysco does not undertake toupdate its forward-looking statements
2
Forward-Looking Statements
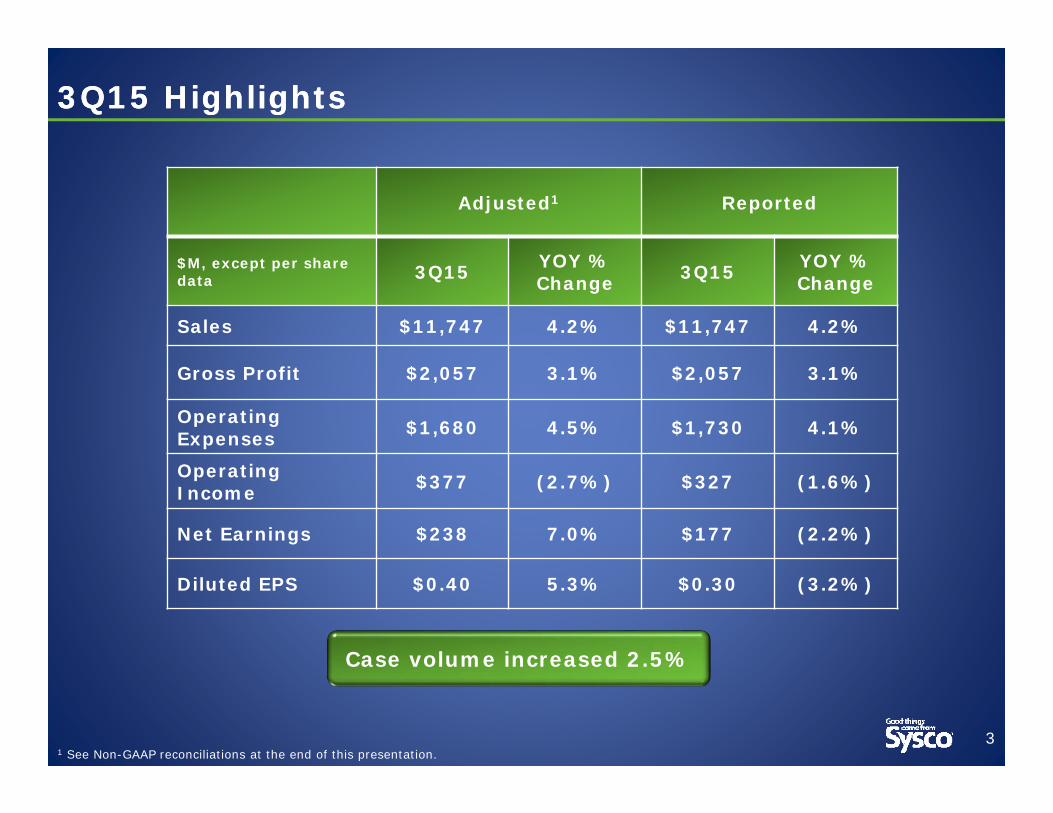
3Q15 Highlights 3Q15 Highlights
31 See Non-GAAP reconciliations at the end of this presentation.
Adjusted1 Reported
$M, except per share data 3Q15 YOY %
Change 3Q15 YOY %Change
Sales $11,747 4.2% $11,747 4.2%
Gross Profit $2,057 3.1% $2,057 3.1%
Operating Expenses $1,680 4.5% $1,730 4.1%
Operating Income $377 (2.7%) $327 (1.6%)
Net Earnings $238 7.0% $177 (2.2%)
Diluted EPS $0.40 5.3% $0.30 (3.2%)
Case volume increased 2.5%

4
Business Transformation Update Business Transformation Update
Already exceeded original 3-year, $600 million target for annualized savings
Continued rollout and successful execution of Category Management Focused on growing volumes via innovation and strategic
partnership with suppliers
Moving forward with a cohesive, enterprise-wide module-centric approach for our technology platform Expect this change to result in smoother conversions,
better execution, and an improved experience for customers

5
M&A Update M&A Update
Pacific Star Recently completed the transaction to acquire 50% of this leading
foodservice distributor in Mexico
Tannis Trading (subsequent to Q3 close) Expands our presence in Canada’s 4th largest market
US Foods Trial related to the FTC’s motion for a preliminary injunction begins on
May 5th and will last up to seven trial days
If ruling is in our favor, we will proceed to closing unless the decision is appealed
In the event of an unfavorable ruling, we would assess, together with US Foods’ ownership whether to pursue the case further
Remain resolute in our belief that this transaction is pro-competitive, good for our customers and will accelerate Sysco’s business transformation
6
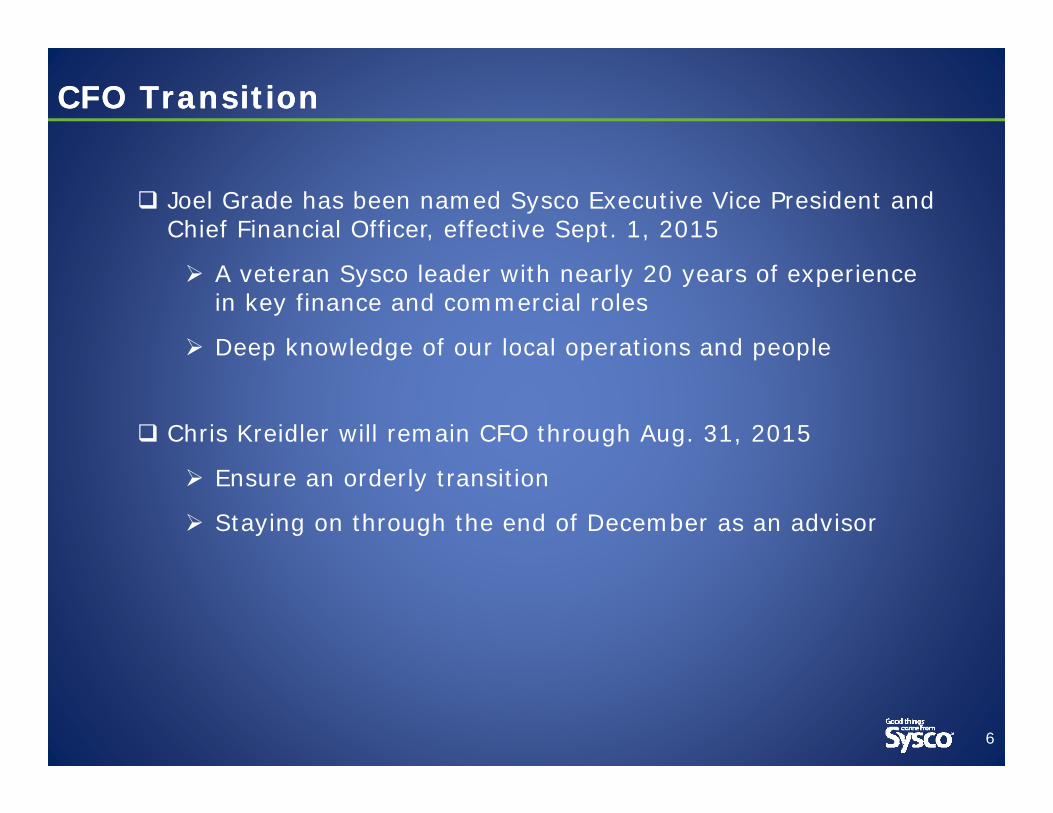
CFO TransitionCFO Transition
Joel Grade has been named Sysco Executive Vice President and Chief Financial Officer, effective Sept. 1, 2015
A veteran Sysco leader with nearly 20 years of experience in key finance and commercial roles
Deep knowledge of our local operations and people
Chris Kreidler will remain CFO through Aug. 31, 2015
Ensure an orderly transition
Staying on through the end of December as an advisor

Key TakeawaysKey Takeaways
7
Encouraged by continued case growth in our locally- and corporate-managed business
Leadership team making good progress in driving out initiatives to enhance gross profit dollar growth and expense management
The steps being taken will reinforce our leadership position in the ever-evolving foodservice industry

3Q15 Highlights 3Q15 Highlights
81 See Non-GAAP reconciliations at the end of this presentation.
Adjusted1 Reported
$MM, except per share data 3Q15 YOY %
Change 3Q15 YOY %Change
Sales $11,747 4.2% $11,747 4.2%
Gross Profit $2,057 3.1% $2,057 3.1%
Operating Expenses $1,680 4.5% $1,730 4.1%
Operating Income $377 (2.7%) $327 (1.6%)
Net Earnings $238 7.0% $177 (2.2%)
Diluted EPS $0.40 5.3% $0.30 (3.2%)
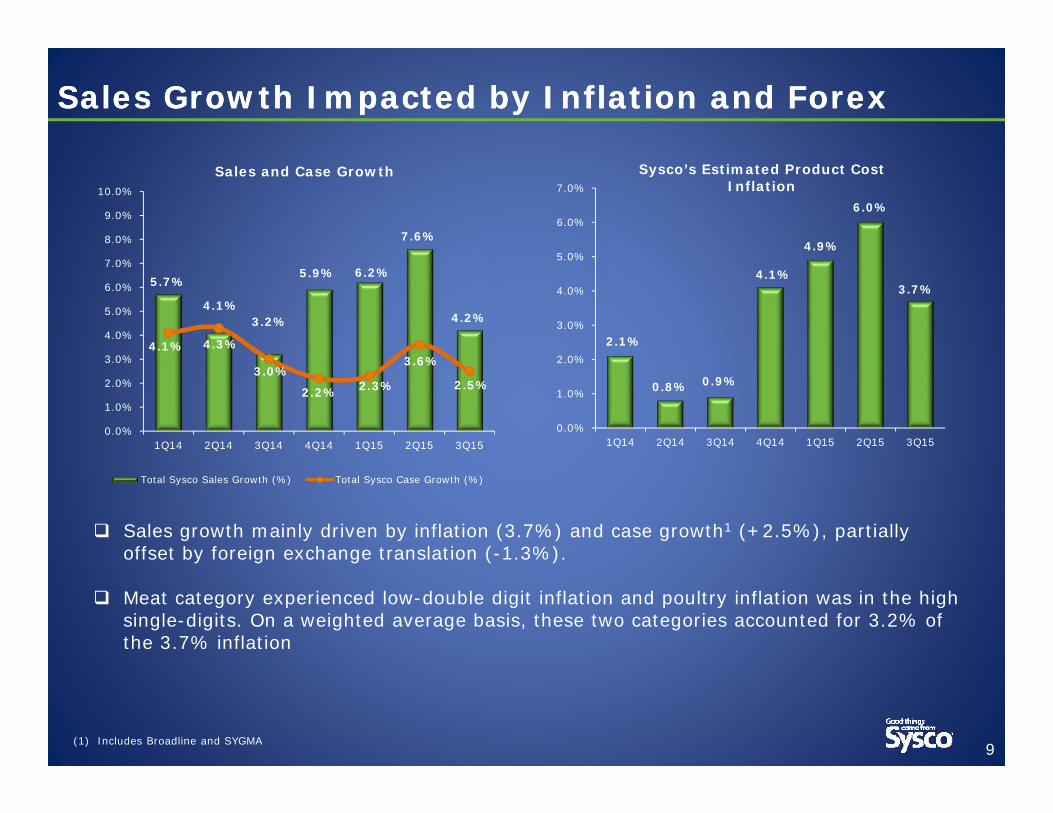
Sales Growth Impacted by Inflation and ForexSales Growth Impacted by Inflation and Forex
5.7%
4.1%3.2%
5.9% 6.2%
7.6%
4.2%
4.1% 4.3%
3.0%
2.2% 2.3%
3.6%
2.5%
0.0%
1.0%
2.0%
3.0%
4.0%
5.0%
6.0%
7.0%
8.0%
9.0%
10.0%
1Q14 2Q14 3Q14 4Q14 1Q15 2Q15 3Q15
Sales and Case Growth
Total Sysco Sales Growth (%) Total Sysco Case Growth (%)
(1) Includes Broadline and SYGMA 9
Sales growth mainly driven by inflation (3.7%) and case growth1 (+2.5%), partially offset by foreign exchange translation (-1.3%).
Meat category experienced low-double digit inflation and poultry inflation was in the high single-digits. On a weighted average basis, these two categories accounted for 3.2% of the 3.7% inflation
2.1%
0.8% 0.9%
4.1%
4.9%
6.0%
3.7%
0.0%
1.0%
2.0%
3.0%
4.0%
5.0%
6.0%
7.0%
1Q14 2Q14 3Q14 4Q14 1Q15 2Q15 3Q15
Sysco’s Estimated Product Cost Inflation
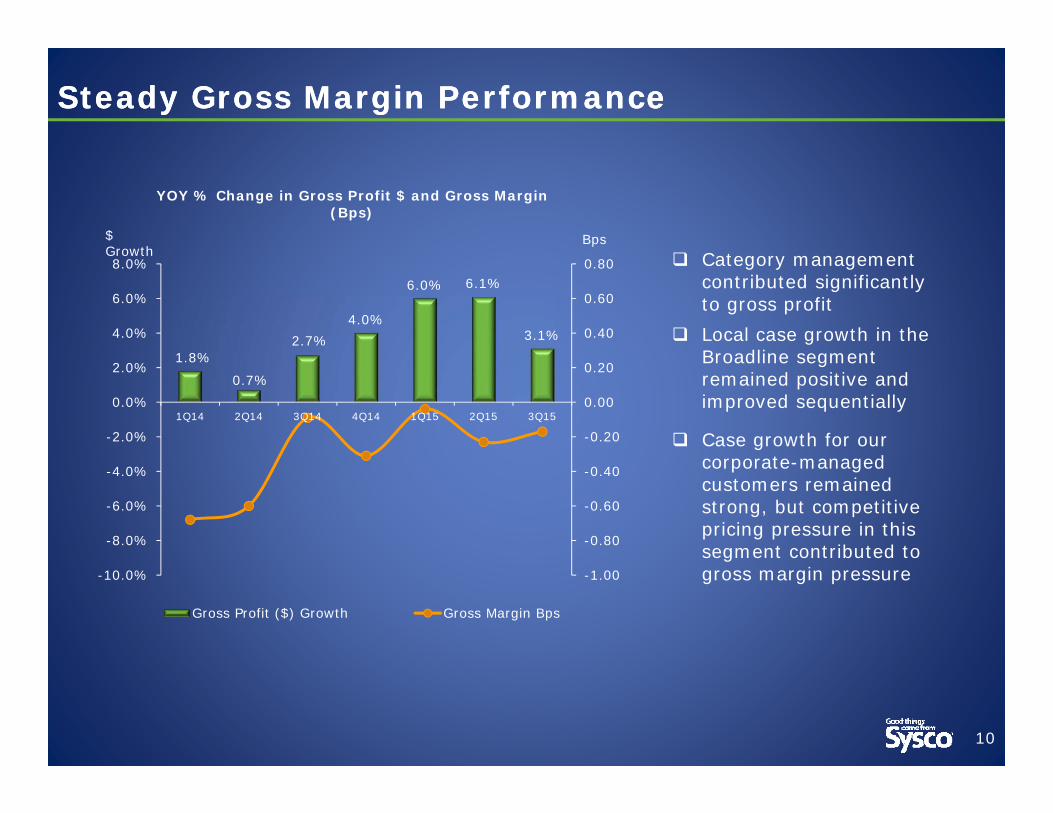
Steady Gross Margin PerformanceSteady Gross Margin Performance
10
1.8%
0.7%
2.7%4.0%
6.0% 6.1%
3.1%
-1.00
-0.80
-0.60
-0.40
-0.20
0.00
0.20
0.40
0.60
0.80
-10.0%
-8.0%
-6.0%
-4.0%
-2.0%
0.0%
2.0%
4.0%
6.0%
8.0%
1Q14 2Q14 3Q14 4Q14 1Q15 2Q15 3Q15
YOY % Change in Gross Profit $ and Gross Margin (Bps)
Gross Profit ($) Growth Gross Margin Bps
$ Growth
Bps Category management
contributed significantly to gross profit
Local case growth in the Broadline segment remained positive and improved sequentially
Case growth for our corporate-managed customers remained strong, but competitive pricing pressure in this segment contributed to gross margin pressure
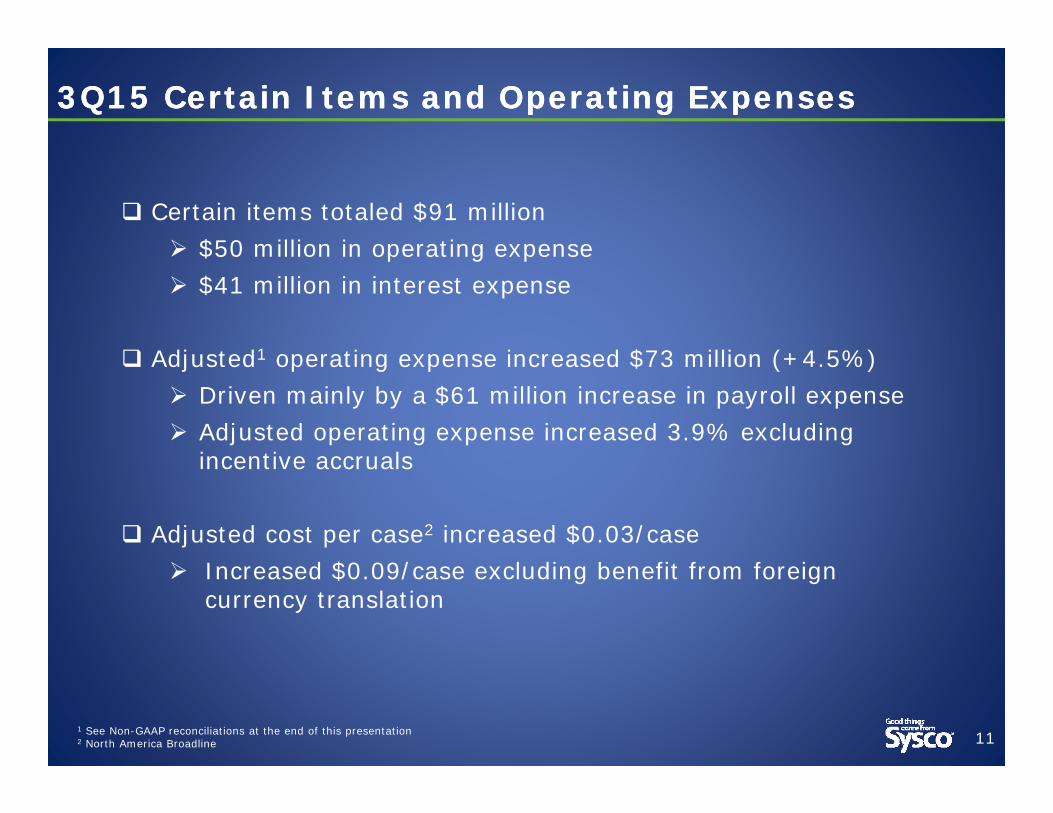
3Q15 Certain Items and Operating Expenses3Q15 Certain Items and Operating Expenses
111 See Non-GAAP reconciliations at the end of this presentation2 North America Broadline
Certain items totaled $91 million $50 million in operating expense $41 million in interest expense
Adjusted1 operating expense increased $73 million (+4.5%) Driven mainly by a $61 million increase in payroll expense Adjusted operating expense increased 3.9% excluding
incentive accruals
Adjusted cost per case2 increased $0.03/case Increased $0.09/case excluding benefit from foreign
currency translation

Favorable Tax Rate in 3Q15Favorable Tax Rate in 3Q15
12
Effective tax rate 34% vs. 39% in 3Q14 3Q15 rate impacted by the favorable resolution of a
state tax matter. 3Q14 rate elevated due to the non-deductible portion of
legal settlement
Normalized tax rate is approximately 37%Lower than historical rates due to
o Increasing amount of business earnings in international jurisdictions that have lower tax rates
o Reduced state taxes from legal restructurings

13
Cash Flow Cash Flow
1) Capital expenditures are net of proceeds from sales of plant and equipment2) Free cash flow may not foot due to rounding; see non-GAAP reconciliations3) Adjusted for merger and integration-related spending and timing of pension contributions; see non-GAAP reconciliations
($MM) 39 Weeks FY15
39 Weeks FY14 $ Chg.
Cash Flow from Operations $860 $848 $12
Capital Expenditures, net1 ($422) ($364) ($58)
Free Cash Flow2 $439 $484 ($46)
Adjusted Free Cash Flow3 $617 $531 $86
Dividends Paid $517 $498 $19
Adjusted Free Cash Flow grew 16% during the first 3 quarters of FY15
+16%

$125 $122 $117$133
$119
$179
$139
$0
$20
$40
$60
$80
$100
$120
$140
$160
$180
$200
1Q14 2Q14 3Q14 4Q14 1Q15 2Q15 3Q15
($M)
Strategic Investments in Capital Expenditures Strategic Investments in Capital Expenditures
14
$0
$50
$100
$150
$200
$250
$300
$350
$400
$450
$500
FY14 FY15
IT- Capital Spending for Acquisition IT-Other Fleet Facilities
$387
$437
Gross Capex – 39WKS ($MM) Net Capex($M)
Capital spending for merger integration planning totaled $53 million

GuidanceGuidance
15
Unless we repurchase shares during the fourth quarter, we estimate that our diluted shares outstanding may be greater than 597 million shares for the fiscal year
Plan to pay off $300 million in bonds that come due in mid-June
Expect to be at the high end of our range for net capital expenditures of $500 to 550 million for fiscal 2015
17
Non-GAAP Reconciliations

18
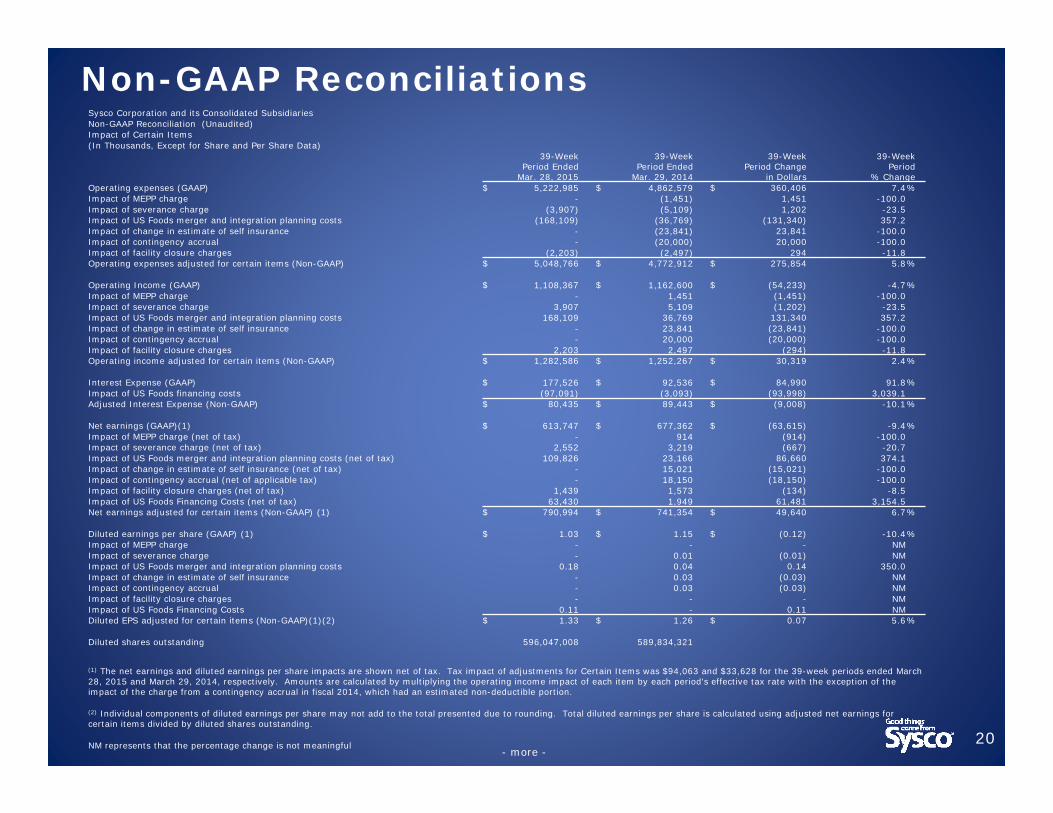
Non-GAAP ReconciliationsSysco Corporation and its Consolidated SubsidiariesNon-GAAP Reconciliation (Unaudited)Impact of Certain Items(In Thousands, Except for Share and Per Share Data)
Sysco’s results of operations are impacted by certain items which include multiemployer withdrawal charges (MEPP), severancecharges, US Foods merger and integration planning costs, charges from facility closures and US Foods related financing costs.Additional items in FY14 include a change in estimate of self-insurance and charges from a contingency accrual. These FY15 and FY14items are collectively referred to as "Certain Items". Management believes that adjusting its operating expenses, operating income,interest expense, net earnings and diluted earnings per share to remove these charges provides an important perspective ofunderlying business trends and results and provides meaningful supplemental information to both management and investors that isindicative of the performance of the company's underlying operations and facilitates comparisons on a year-over-year basis.
The company uses these non-GAAP measures when evaluating its financial results as well as for internal planning and forecastingpurposes. These financial measures should not be used as a substitute for GAAP measures in assessing the company’s results ofoperations for the periods presented. An analysis of any non-GAAP financial measure should be used in conjunction with resultspresented in accordance with GAAP. As a result, in the tables that follow, each period presented is adjusted to remove the CertainItems noted above.

Non-GAAP Reconciliations
19
Sysco Corporation and its Consolidated SubsidiariesNon-GAAP Reconciliation (Unaudited)Impact of Certain Items(In Thousands, Except for Share and Per Share Data)
- more -
13-Week Period Ended
Mar. 28, 2015
13-Week Period Ended
Mar. 29, 2014
13-Week Period Change
in Dollars
13-Week Period
% ChangeOperating expenses (GAAP) $ 1,730,190 $ 1,662,116 $ 68,074 4.1%Impact of MEPP charge - - - NMImpact of severance charges (365) (1,512) 1,147 -75.9
Impact of US Foods merger and integration planning costs (49,609) (32,416) (17,193) 53.0
Impact of change in estimate of self insurance - - - NM
Impact of contingency accrual - (20,000) 20,000 -100.0
Impact of facility closure charges - (1,022) 1,022 -100.0Operating expenses adjusted for certain items (Non-GAAP) $ 1,680,216 $ 1,607,166 $ 73,050 4.5%
Operating Income (GAAP) $ 327,308 $ 332,625 $ (5,317) -1.6%Impact of MEPP charge - - - NMImpact of severance charge 365 1,512 (1,147) -75.9Impact of US Foods merger and integration planning costs 49,609 32,416 17,193 53.0Impact of change in estimate of self insurance - - - NMImpact of contingency accrual - 20,000 (20,000) -100.0Impact of facility closure charges - 1,022 (1,022) -100.0Operating income adjusted for certain items (Non-GAAP) $ 377,282 $ 387,575 $ (10,293) -2.7%
Interest Expense (GAAP) $ 69,550 $ 32,224 $ 37,326 115.8%Impact of US Foods financing costs (41,331) (2,925) (38,406) 1,313.0Adjusted Interest Expense (Non-GAAP) $ 28,219 $ 29,299 $ (1,080) -3.7%
Net earnings (GAAP) (1) $ 176,955 $ 180,937 $ (3,982) -2.2%Impact of MEPP charge (net of tax) - - - NMImpact of severance charge (net of tax) 243 922 (679) -73.6
Impact of US Foods merger and integration planning costs (net of tax) 32,960 19,769 13,191 66.7
Impact of change in estimate of self insurance (net of tax) - - - NMImpact of contingency accrual (net of applicable tax) - 18,049 (18,049) -100.0Impact of facility closure charges (net of tax) - 623 (623) -100.0Impact of US Foods Financing Costs (net of tax) 27,460 1,784 25,676 NMNet earnings adjusted for certain items (Non-GAAP) (1) $ 237,618 $ 222,084 $ 15,534 7.0%
Diluted earnings per share (GAAP) (1) $ 0.30 $ 0.31 $ (0.01) -3.2%Impact of MEPP charge - - - NMImpact of severance charge - - - NMImpact of US Foods merger and integration planning costs 0.06 0.03 0.03 100.0Impact of change in estimate of self insurance - - - NMImpact of contingency accrual - 0.03 (0.03) -100.0Impact of facility closure charges - - - NMImpact of US Foods Financing Costs 0.05 - 0.05 NMDiluted EPS adjusted for certain items (Non-GAAP) (1) (2) $ 0.40 $ 0.38 $ 0.02 5.3%
Diluted shares outstanding 598,921,070 590,470,283
(1) The net earnings and diluted earnings per share impacts are shown net of tax. Tax impact of adjustments for Certain Items was $30,642 and $21,816 for the 13-week periods ended March 28, 2015 and March 29, 2014, respectively. Amounts are calculated by multiplying the operating income impact of each item by each quarter's effective tax rate with the exception of the impact of the charged from a contingency accrual in fiscal 2014, which had an estimated non-deductible portion.
(2) Individual components of diluted earnings per share may not add to the total presented due to rounding. Total diluted earnings per share is calculated using adjusted net earnings for certain items divided by diluted shares outstanding.
NM represents that the percentage change is not meaningful
Non-GAAP Reconciliations
20
Sysco Corporation and its Consolidated SubsidiariesNon-GAAP Reconciliation (Unaudited)Impact of Certain Items(In Thousands, Except for Share and Per Share Data)
39-Week Period Ended
Mar. 28, 2015
39-Week Period Ended
Mar. 29, 2014
39-Week Period Change
in Dollars
39-Week Period
% ChangeOperating expenses (GAAP) $ 5,222,985 $ 4,862,579 $ 360,406 7.4%Impact of MEPP charge - (1,451) 1,451 -100.0Impact of severance charge (3,907) (5,109) 1,202 -23.5Impact of US Foods merger and integration planning costs (168,109) (36,769) (131,340) 357.2Impact of change in estimate of self insurance - (23,841) 23,841 -100.0Impact of contingency accrual - (20,000) 20,000 -100.0Impact of facility closure charges (2,203) (2,497) 294 -11.8Operating expenses adjusted for certain items (Non-GAAP) $ 5,048,766 $ 4,772,912 $ 275,854 5.8%
Operating Income (GAAP) $ 1,108,367 $ 1,162,600 $ (54,233) -4.7%Impact of MEPP charge - 1,451 (1,451) -100.0Impact of severance charge 3,907 5,109 (1,202) -23.5Impact of US Foods merger and integration planning costs 168,109 36,769 131,340 357.2Impact of change in estimate of self insurance - 23,841 (23,841) -100.0Impact of contingency accrual - 20,000 (20,000) -100.0Impact of facility closure charges 2,203 2,497 (294) -11.8Operating income adjusted for certain items (Non-GAAP) $ 1,282,586 $ 1,252,267 $ 30,319 2.4%
Interest Expense (GAAP) $ 177,526 $ 92,536 $ 84,990 91.8%Impact of US Foods financing costs (97,091) (3,093) (93,998) 3,039.1Adjusted Interest Expense (Non-GAAP) $ 80,435 $ 89,443 $ (9,008) -10.1%
Net earnings (GAAP)(1) $ 613,747 $ 677,362 $ (63,615) -9.4%Impact of MEPP charge (net of tax) - 914 (914) -100.0Impact of severance charge (net of tax) 2,552 3,219 (667) -20.7Impact of US Foods merger and integration planning costs (net of tax) 109,826 23,166 86,660 374.1Impact of change in estimate of self insurance (net of tax) - 15,021 (15,021) -100.0Impact of contingency accrual (net of applicable tax) - 18,150 (18,150) -100.0Impact of facility closure charges (net of tax) 1,439 1,573 (134) -8.5Impact of US Foods Financing Costs (net of tax) 63,430 1,949 61,481 3,154.5Net earnings adjusted for certain items (Non-GAAP) (1) $ 790,994 $ 741,354 $ 49,640 6.7%
Diluted earnings per share (GAAP) (1) $ 1.03 $ 1.15 $ (0.12) -10.4%Impact of MEPP charge - - - NMImpact of severance charge - 0.01 (0.01) NMImpact of US Foods merger and integration planning costs 0.18 0.04 0.14 350.0Impact of change in estimate of self insurance - 0.03 (0.03) NMImpact of contingency accrual - 0.03 (0.03) NMImpact of facility closure charges - - - NMImpact of US Foods Financing Costs 0.11 - 0.11 NMDiluted EPS adjusted for certain items (Non-GAAP)(1)(2) $ 1.33 $ 1.26 $ 0.07 5.6%
Diluted shares outstanding 596,047,008 589,834,321
(1) The net earnings and diluted earnings per share impacts are shown net of tax. Tax impact of adjustments for Certain Items was $94,063 and $33,628 for the 39-week periods ended March 28, 2015 and March 29, 2014, respectively. Amounts are calculated by multiplying the operating income impact of each item by each period's effective tax rate with the exception of the impact of the charge from a contingency accrual in fiscal 2014, which had an estimated non-deductible portion.
(2) Individual components of diluted earnings per share may not add to the total presented due to rounding. Total diluted earnings per share is calculated using adjusted net earnings for certain items divided by diluted shares outstanding.
NM represents that the percentage change is not meaningful- more -
Non-GAAP Reconciliations
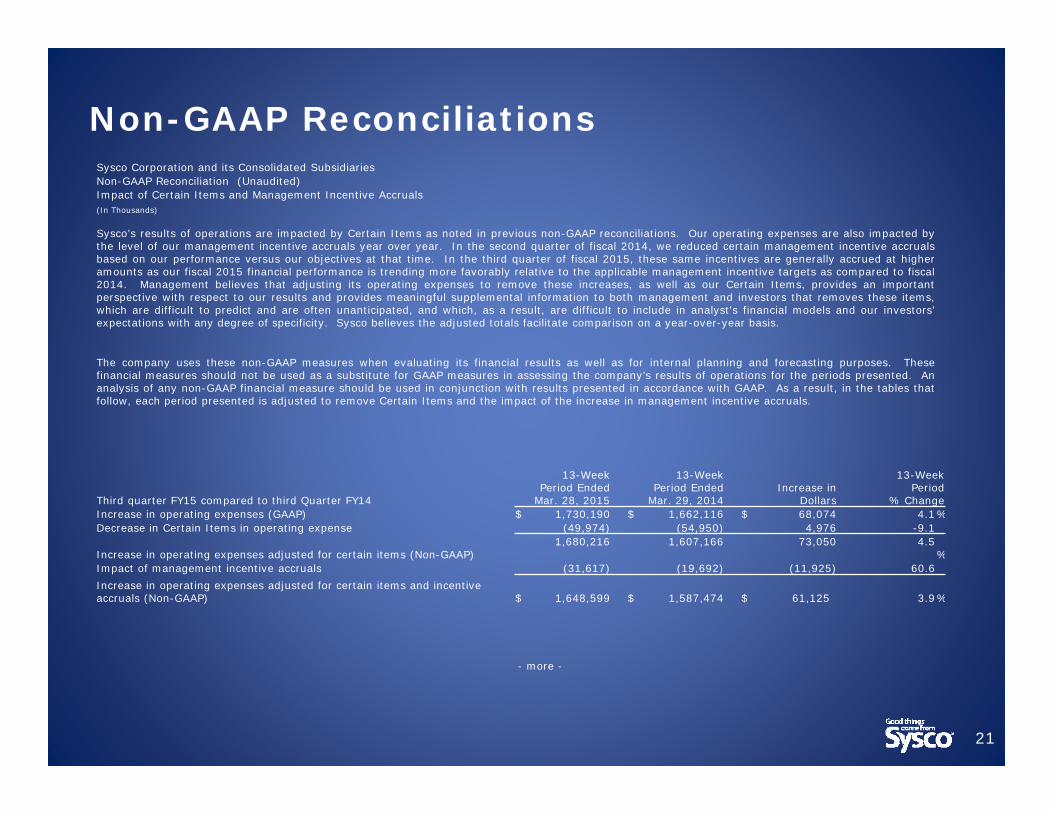
21
- more -
Sysco Corporation and its Consolidated SubsidiariesNon-GAAP Reconciliation (Unaudited)Impact of Certain Items and Management Incentive Accruals(In Thousands)
Sysco’s results of operations are impacted by Certain Items as noted in previous non-GAAP reconciliations. Our operating expenses are also impacted bythe level of our management incentive accruals year over year. In the second quarter of fiscal 2014, we reduced certain management incentive accrualsbased on our performance versus our objectives at that time. In the third quarter of fiscal 2015, these same incentives are generally accrued at higheramounts as our fiscal 2015 financial performance is trending more favorably relative to the applicable management incentive targets as compared to fiscal2014. Management believes that adjusting its operating expenses to remove these increases, as well as our Certain Items, provides an importantperspective with respect to our results and provides meaningful supplemental information to both management and investors that removes these items,which are difficult to predict and are often unanticipated, and which, as a result, are difficult to include in analyst's financial models and our investors'expectations with any degree of specificity. Sysco believes the adjusted totals facilitate comparison on a year-over-year basis.
The company uses these non-GAAP measures when evaluating its financial results as well as for internal planning and forecasting purposes. Thesefinancial measures should not be used as a substitute for GAAP measures in assessing the company’s results of operations for the periods presented. Ananalysis of any non-GAAP financial measure should be used in conjunction with results presented in accordance with GAAP. As a result, in the tables thatfollow, each period presented is adjusted to remove Certain Items and the impact of the increase in management incentive accruals.
Third quarter FY15 compared to third Quarter FY14
13-Week Period Ended
Mar. 28, 2015
13-Week Period Ended
Mar. 29, 2014Increase in
Dollars
13-Week Period
% ChangeIncrease in operating expenses (GAAP) $ 1,730,190 $ 1,662,116 $ 68,074 4.1%Decrease in Certain Items in operating expense (49,974) (54,950) 4,976 -9.1
Increase in operating expenses adjusted for certain items (Non-GAAP)1,680,216 1,607,166 73,050 4.5
%Impact of management incentive accruals (31,617) (19,692) (11,925) 60.6Increase in operating expenses adjusted for certain items and incentive accruals (Non-GAAP) $ 1,648,599 $ 1,587,474 $ 61,125 3.9%

Non-GAAP Reconciliations
22
- more -
Sysco Corporation and its Consolidated SubsidiariesNon-GAAP Reconciliation (Unaudited)Free Cash Flow and Adjusted Free Cash Flow(In Thousands)
Free cash flow represents net cash provided from operating activities less purchases of plant and equipment and includes proceeds from sales of plantand equipment. Adjusted free cash flow adjusts out the cash impact of our Certain Items representing primarily payments for US Foods merger andintegration planning costs and a payment for a contingency accrual that arose in fiscal 2014. It also adjusts for a contribution to our retirement plan,which creates a year over year variance from timing. We made a $50 million contribution to our qualified pension plan in the first 39 weeks of fiscal2015, while there was no contribution to this plan in the first 39 weeks of fiscal 2014 due to its funding in the fourth quarter of fiscal 2013. Syscoconsiders free cash flow and adjusted free cash flow to be liquidity measures that provide useful information to management and investors about theamount of cash generated by the business after the purchases and sales of buildings, fleet, equipment and technology, which may potentially be used topay for, among other things, strategic uses of cash including dividend payments, share repurchases and acquisitions. Adjusted free cash flow furtherprovides the amount of cash generated excluding larger payments sometimes incurred with our Certain Items and timing of pension contributions.However, free cash flow may not be available for discretionary expenditures, as it may be necessary that we use it to make mandatory debt service orother payments Free cash flow and adjusted free cash flow should not be used as a substitute in assessing the company’s liquidity for the periodspresented. An analysis of any non-GAAP financial measure should be used in conjunction with results presented in accordance with GAAP. In the tablethat follows, free cash flow and adjusted free cash flow for each period presented are reconciled to net cash provided by operating activities.
39-Week Period Ended
Mar. 28, 2015
39-Week Period Ended
Mar. 29, 2014
39-Week Period Change
in Dollars
39-Week Period
% ChangeNet cash provided by operating activities (GAAP) $ 860,499 $ 848,064 $ 12,435 1.5%Additions to plant and equipment (437,286) (387,451) (49,835) -12.9Proceeds from sales of plant and equipment 15,404 23,695 (8,291) -35.0Free Cash Flow (Non-GAAP) $ 438,617 $ 484,308 $ (45,691) -9.4%Cash impact of Certain Items 128,069 46,409 81,660 -176.0Timing impact of pension contribution 50,000 - 50,000 Adjusted Free Cash Flow (Non-GAAP) $ 616,686 $ 530,717 $ 85,969 16.2%
Adjustments represent the cash impact of Certain Items with the exception of US Foods financing costs, which does not impact either Non-GAAP measuresince these costs did not require cash payment in either period. Adjustments for the first 39 weeks of fiscal 2015 include $107.0 million related to USFoods merger and integration planning costs, $17.2 million related to the payment of a contingency accrual that arose in the last 39 weeks of fiscal 2014that was considered a Certain Item in fiscal 2014 and $3.8 million for all remaining applicable Certain Items. Adjustments for the first 39 weeks of fiscal2014 include $25.6 million related to a payment for a withdrawal from a multiemployer plan, $17.3 million related to US Foods merger and integrationplanning costs and $3.4 million for all remaining applicable Certain Items. These amounts will differ from the earnings impact of Certain Items as thetiming of payments for these items may occur in a different period from the period the Certain Item charges were recognized in the Statement ofConsolidated Results of Operations.
Non-GAAP Reconciliations
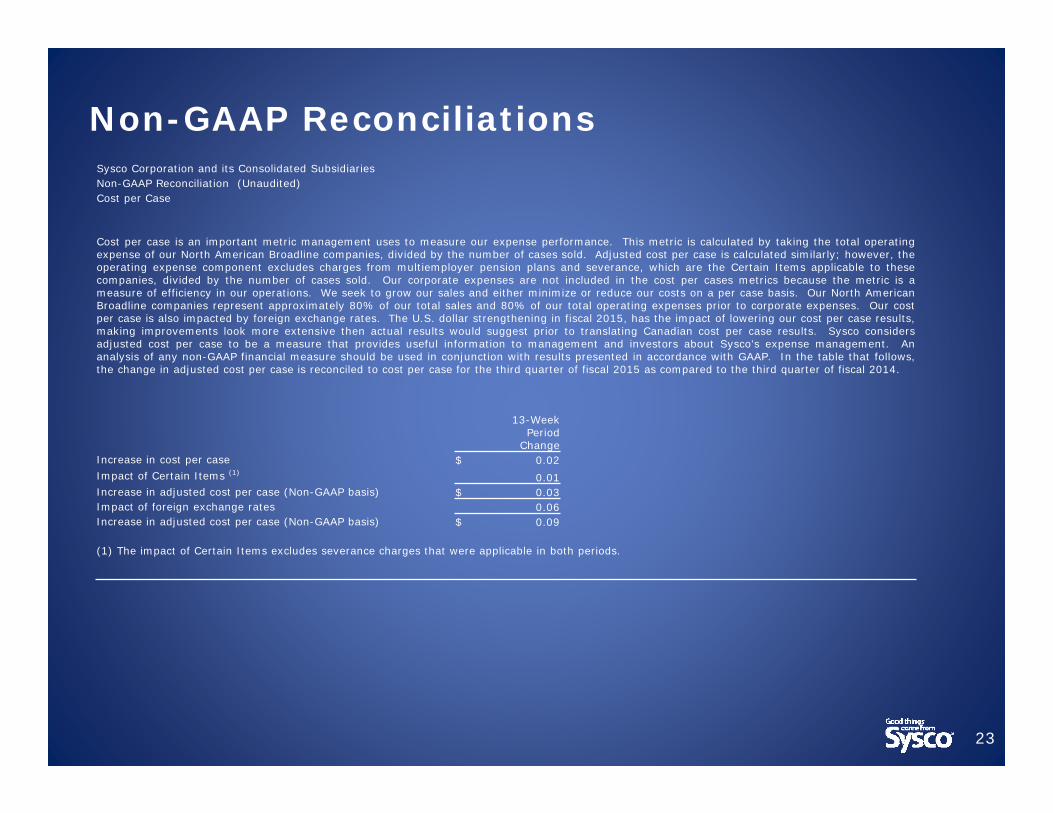
23
Sysco Corporation and its Consolidated SubsidiariesNon-GAAP Reconciliation (Unaudited)Cost per Case
Cost per case is an important metric management uses to measure our expense performance. This metric is calculated by taking the total operatingexpense of our North American Broadline companies, divided by the number of cases sold. Adjusted cost per case is calculated similarly; however, theoperating expense component excludes charges from multiemployer pension plans and severance, which are the Certain Items applicable to thesecompanies, divided by the number of cases sold. Our corporate expenses are not included in the cost per cases metrics because the metric is ameasure of efficiency in our operations. We seek to grow our sales and either minimize or reduce our costs on a per case basis. Our North AmericanBroadline companies represent approximately 80% of our total sales and 80% of our total operating expenses prior to corporate expenses. Our costper case is also impacted by foreign exchange rates. The U.S. dollar strengthening in fiscal 2015, has the impact of lowering our cost per case results,making improvements look more extensive then actual results would suggest prior to translating Canadian cost per case results. Sysco considersadjusted cost per case to be a measure that provides useful information to management and investors about Sysco's expense management. Ananalysis of any non-GAAP financial measure should be used in conjunction with results presented in accordance with GAAP. In the table that follows,the change in adjusted cost per case is reconciled to cost per case for the third quarter of fiscal 2015 as compared to the third quarter of fiscal 2014.
13-Week Period
ChangeIncrease in cost per case $ 0.02 Impact of Certain Items (1) 0.01 Increase in adjusted cost per case (Non-GAAP basis) $ 0.03 Impact of foreign exchange rates 0.06 Increase in adjusted cost per case (Non-GAAP basis) $ 0.09
(1) The impact of Certain Items excludes severance charges that were applicable in both periods.