skills for youth employment and rural development ... · cluster-based common facility centres ......
TRANSCRIPT

Skills for Youth Employment and Rural Development Programme in Zimbabwe: An Assessment of Firms in Economic Subsectors
ILO Country Office for Zimbabwe and Namibia


Skills for Youth Employment and Rural Development Programme in Zimbabwe: An Assessment of Firms in Economic Subsectors
September 2015
ILO Country Office for Zimbabwe and Namibia

Copyright © International Labour Organization 2015First Published 2015
Publications of the International Labour Office enjoy copyright under Protocol 2 of the Universal Copyright Convention. Nevertheless, short excerpts from them may be reproduced without authorization, on condition that the source is indicated. For rights of reproduction or translation, application should be made to ILO Publications (Rights and Permissions), International Labour Office, CH-1211 Geneva 22, Switzerland, or by email: [email protected]. The International Labour Office welcomes such applications, Libraries, institutions and other users registered with reproduction rights organizations may make copies in accordance with the licences issued to them for this purpose. Visit www.ifrro.org to find the reproduction rights organization in your country.
Skills for Youth Employment and Rural Development Programme in Zimbabwe: An Assessment of Firms in Economic SubsectorsFirst published 2015
ISBN 978-92-2-130647-4 (print)ISBN 978-92-2-130648-1 (web pdf)
The designations employed in the ILO publications, which are in conformity with United Nations practice, and the presentation of material therein do not imply the expression of any opinion whatsoever on the part of the International Labour Office concerning the legal status of any country, area or territory or of its authorities, or concerning the delimitation of its frontiers.
The responsibility for opinions expressed in signed articles, studies and other contributions rests solely with their authors, and publication does not constitute an endorsement by the International Labour Office of the opinions expressed in them.
Reference to names of firms and commercial products and processes does not imply their endorsement by the International Labour Organization, and any failure to mention a particular firm, commercial product or process is not a sign of disapproval.
ILO publications and electronic products can be obtained through major booksellers or ILO local offices in many countries, or direct from ILO Publications, International Labour Office, CH-1211 Geneva 22, Switzerland. Catalogues or lists of new publications are available free of charge from the above address, or by email: [email protected] our website: www.ilo.org/pubIns
Designed in ZimbabwePrinted by the International Labour Office Country office for Zimbabwe and Namibia

Contents
List of Acronyms .............................................................................................. VII
Foreword .......................................................................................................... IX
Executive summary ............................................................................................ 1
1. Background and Introduction ........................................................................ 4
1.1 Training for Rural Economic Empowerment ...................................................................4
1.2 Quality Improvement In Informal Apprenticeships (QIA) in Zimbabwe ...........................5
1.3 Implementation of the programme ................................................................................6
1.4 The economic subsector analysis ..................................................................................6
2. Study design and methodology ...................................................................... 9
2.1 Conceptual framework for the study ..............................................................................9
2.2 Methodology ................................................................................................................10
3. Literature review: An overview of subsector trends at national level ............. 12
3.1 The imperative for solar energy solutions .....................................................................12
3.2 Poultry industry ...........................................................................................................14
3.3 Potato production ........................................................................................................16
3.4 Art and Crafts ..............................................................................................................16
3.5 Piggery ........................................................................................................................17
3.6 Cattle fattening industry ...............................................................................................18
3.7 Dairy Value Chain ........................................................................................................19
3.8 Small-scale furniture making .......................................................................................22
3.9 Catering ......................................................................................................................23
3.10 Clothing subsector .....................................................................................................24
3.11 Home Décor ..............................................................................................................25
3.12 Welding and metal fabrication ...................................................................................25
3.13 Horticulture ...............................................................................................................26
3.14 Beekeeping (apiculture) ............................................................................................27
3.2 Conclusion: Potential is the common denominator ......................................................28
4. Viability analysis of projects across the subsectors ....................................... 29
4.1 Introduction - defining the key indicators ....................................................................29
4.2 Profitability ..................................................................................................................29
4.3 Productivity .................................................................................................................30
5. Findings from the subsector assessment ..................................................... 31
5.1 Clustering of youth and implications for productivity ....................................................34
5.2 Employment created by the projects ...........................................................................34
5.3 Jobs map for the horticulture subsector ......................................................................36
5.4 Brief insight into the impact of income changes among programme beneficiaries .......37
6. Has it been all rosy? Main challenges to projects’ viability ........................... 39
6.1 Limited value chain and pricing influence: ..................................................................39
6.2 Value addition hindrances ...........................................................................................40
6.3 Legal registration and designated work-space hurdles .................................................40
6.4 The inadequacy of the start-up kits .............................................................................40
7. Strategies for mitigating challenges. ............................................................. 42
7.1 Strengthening value chain benefits for young people running ventures ........................42
7.2 Value addition as a strategy .........................................................................................42
7.3. Cluster-based Common Facility Centres ......................................................................43
7.4 Envisaging an agricultural/food supply chain common/collective sales point ................44
8. Concluding remarks and key lessons learnt ................................................. 49
9. Determinants of the success and/or failure of projects ................................. 50
9.1 Determinants of Success .............................................................................................50
9.2 Causes of failures and dropouts ..................................................................................51
Annex: Assessment of the economic subsectors .............................................. 53

VII
List of Acronyms
BKAZ Beekeepers Association of Zimbabwe
CFC Common Facility Centre
DDP Dairy Development Programme
DIC District Implementation Committee
DLPD Department of Livestock Production and Development
GDP Gross Domestic Product
IEE Indigenization and Economic Empowerment
ILO International Labour Organization
MC Master Craftsperson
MFI Micro Finance Institution
NGO Non Governmental Organization
NPM Net Profit Margin
NSC National Steering Committee
PIC Provincial Implementation Committee
QIA Quality Improvement In Informal Apprenticeship
SAEC Sustainable African Energy Consortium
SLF Sustainable Livelihoods Framework
SME Small and Medium-Sized Enterprise
TREE Training for Rural Economic Empowerment
TWG Technical Working Group
ZESA Zimbabwe Electricity Supply Authority


IX
Foreword
The International Labour Organization is guided by its Constitution, which upholds as part
of its values the need to respect the dignity of work. It is accepted that this value is a
necessity in establishing and maintaining sustainable development in the world. At the
international level, the ILO has contributed to development through advocacy, research
and technical programmes aimed at the world of work. In this regard, the ILO adopted the
Decent Work Agenda as a means of addressing poverty through creating opportunities for
productive jobs and enterprise development. This has been translated at the country level
through the Decent Work Country Programme which has four objectives:
¡ Promoting jobs;
¡ Guaranteeing rights at work;
¡ Extending social protection; and
¡ Promoting social dialogue
Through the Decent Work Country Programme for Zimbabwe (2012 – 2015), the ILO has
promoted entrepreneurship, skills development, job creation and sustainable livelihoods
through a priority targeting the promotion of productive employment and decent jobs.
In its work, the ILO Country Office for Zimbabwe and Namibia has been guided by the
national economic blueprint, the Zimbabwe Agenda for Sustainable Socioeconomic
Transformation (ZimAsset), where job creation has been prioritized. Since 2010, the ILO
has implemented the ILO Skills for Youth Employment and Rural Development Programme
in Zimbabwe. The objective of the programme has been to strengthen skills development
systems that improve employability, promote access to employment opportunities and
increase incomes for inclusive and sustainable growth for the country’s youths. The
programme has been implemented at two levels, in both rural and urban areas, through
Training for Rural Economic Empowerment (TREE) and Quality Improvement in Informal
Apprenticeships in Zimbabwe (QIA). The TREE methodology has been used by the ILO
to promote income generation and local development in the rural areas. More than
6 500 young people in rural Zimbabwe have been reached and they have been engaged
in diverse economic ventures after receiving skills development training and access to
microfinance institutions. The QIA component reached over 3 300 urban youths who
were informal apprentices attached to more than 2 300 Master Craftspersons in order to
learn various trades.

X
This assessment has been initiated in order to look at the success of the TREE and
QIA methodologies in delivering the project objectives. It seeks to answer whether the
beneficiaries have managed to gain skills and viable employment opportunities through
the project. It also goes further in questioning whether the ventures the youths have
engaged in are viable. The assessment has noted the success factors within the project
and a number of recommendations have been made to inform future interventions
on youth employment. What is apparent from the assessment is that the programme
has had a clear impact on the youths who have benefited from it. The success of the
TREE methodology has resulted in it being adopted by the Government of Zimbabwe
as a national framework for youth economic empowerment. The ILO Country Office for
Zimbabwe and Namibia will continue to support the Government of Zimbabwe, as well
as employers’ and workers’ organisations to create sustainable decent work in Zimbabwe.
Hopolang PhororoDirectorILO Country Office for Zimbabwe and Namibia

1
Executive summary
This report gives a detailed account of economic subsector analyses of various projects
under the ILO Skills for Youth Employment and Rural Development Programme in
Zimbabwe. The programme supports the Government of Zimbabwe, employers and
workers organizations, the private sector, civil society and other partners in the country,
to address the challenges of youth employment and rural development. The programme
is funded by the Government of Denmark and implemented by the International Labour
Organization.
The developmental objective of the programme is to strengthen skills development
systems that improve employability, promote access to employment opportunities and
increase incomes for inclusive and sustainable growth among the country’s youth. In
terms of its immediate objectives, the programme aims to:
¡ Achieve quality improvements in traditional apprenticeships in the informal
economy to the benefit of young men and women in the country
¡ Enable the development of market-driven community-based technical and
vocational skills for young people in rural areas to close the rural-urban skills
gap, and
¡ Equip more young women and men in the informal and rural economy with
skills that will improve their employability in more productive and decent work.
The goals of this subsector analysis study are to have a better appreciation of the
efficacy of the initiatives being implemented under both the Training for Rural Economic
Empowerment (TREE) and the Quality Improvements In Informal Apprenticeships (QIA)
methodologies that were applied in the implementation of the programme. The study
seeks to establish if: the programme was successful in enhancing young people’s skills
for employment; employment opportunities were created; and if youth business ventures
were viable as a result of young men and women participating in the programme. It was
also anticipated that the study would yield key lessons and best practices that would
inform future programming.
The study used a mixed methodology, employing document review, interviews and focus
group discussions with beneficiaries, as well as in-depth interviews with the programme’s
managers and implementers, as data collection methods.

2
The study shows that young entrepreneurs active in the apiculture and hairdressing
subsectors had highest profitability, probably due to their low input costs after initial
set-up cost. Horticulture businesses came third in terms of profitability, the main reason
being high volume of produce. Home décor and welding businesses were fourth and
fifth with the main challenges being access to markets. In the case of home décor, there
was increased competition from cheap imported products while in the case of welding,
product market opportunities were not fully explored.
Young entrepreneurs active in potato production came sixth and it was noted that produce
was often sold to aggregators at lower prices. Solar product retailers came seventh but
low demand and uptake of solar-products in communities was noted. Poultry production
came eighth, being affected by and lack of refrigeration facilities and poor market linkages
that led to poultry producers being compelled to feed their birds beyond their optimal
maturity stages. Catering businesses came ninth and low prices in the subsector were
noted due to general liquidity problems affecting potential customers.
Clothing, in tenth place, was noted to be affected by the influx of cheap second-hand
clothes imports finding their way onto the Zimbabwean market. Carpentry products, at
eleventh place, were facing similar market linkage challenges as welding, though to a
slightly greater extent due to market flooding in this subsector. Next in order of profitability
were piggery (twelfth) and dairy farming (thirteenth) with challenges emanating from the
sale of primary products to middle level buyers, who went on to process and add value to
the products, thus fetching higher retail value at the market. The least profitable project
in the study was cattle fattening (fourteenth), which faced similar problems as piggery
and dairy farming, but to a more significant extent, making the initiative virtually non-
viable.
With the exception of cattle fattening, the other projects profiled in the study were shown
to be viable, particularly at a time when many companies and ventures are collapsing
due to the difficult socioeconomic environment prevailing in the country.
The skills component of the programme proved vital for the success of the various
initiatives profiled in this study.
In conclusion, drawing on the empirical evidence and subsequent analysis the youth
empowerment initiatives implemented by the skills programme were found to be effective.
With evidence of improvements in income and subsequent improvement in quality of life
among the beneficiaries of the training programme the initiative’s relevance was clearly
demonstrated.

3
The young beneficiaries of the programme experienced several related challenges
following the training interventions as they endeavoured to establish viable ventures by
applying the skills they had acquired. Among these challenges were first and foremost,
lack of access to finance, scarce assets and production equipment, poor understanding
of how to get their products to market and gaps in methods of value addition. The study
thus highlights the need for provision of common facility or shared service centres for
young men and women, which would enable them to work in and link with markets. Key
recommendations are to focus on value addition of primary products and to strengthen
market linkages to enhance the profitability of youth business ventures. The report gives
further detail on the findings of the subsector analysis and subsequent recommendations.

4
1. Background and IntroductionThe ILO Skills for Youth Employment and Rural Development Programme in Zimbabwe
is funded by the Government of Denmark and implemented by the International Labour
Organization in support of the Government of Zimbabwe, employers and workers
organizations, the private sector, civil society and other partners, to address the challenges
of youth employment and rural development. The development objective of the programme
is to strengthen skills development systems that improve employability, promote access
to employment opportunities and increase incomes for inclusive and sustainable growth
among the country’s youth. In terms of its immediate objectives, the programme aims to:
¡ Achieve quality improvements in traditional apprenticeships in the informal
economy to the benefit of young men and women
¡ Enable the development of market-driven community-based technical and
vocational skills for young people in rural areas, to close the rural-urban skills
gap, and
¡ Equip more young women and men in the informal and rural economy with
skills that will improve their employability in more productive and decent work.
The skills training strategy focuses broadly on the introduction and implementation of the
two methodologies described below.
1.1 Training for Rural Economic Empowerment
The Training for Rural Economic Empowerment (TREE) is an ILO methodology that
promotes income generation and local development, emphasizing the role of skills and
knowledge for creating new economic and employment opportunities. In its first five years,
the programme has created employment and income generation opportunities for more
than 6 500 youth in rural Zimbabwe and supported local structures with a mandate to
reach young women and men with employment creation support services, from national
to community level; building the capacity of both institutions and their staff and supporting
them to provide better services. The programme also makes microfinance available to the
youth by facilitating access to business loans following the training, to both individuals
and groups. Recognizing the successes of the TREE methodology, the Government of
Zimbabwe has adopted it as a national framework for the economic empowerment of youth
and has recommended that the programme be rolled out nationally. Projects supported
under the TREE methodology include horticulture, livestock and cattle fattening, piggery,
bee-keeping, poultry, dairy, solar energy (green jobs) and small-scale fish farming.

5
1.2 Quality Improvement In Informal Apprenticeships (QIA) in Zimbabwe
Informal Apprenticeship (IA) refers to the traditional system of skills transmission for a
trade from a Master Craftsperson (MC) to a young person who learns the trade on the
job by way of observation, imitation and repetition and by working with and assisting their
MC. Traditionally, IAs have arguably been one of the most important sources of skills
acquisition in Africa, including Zimbabwe. Despite the huge potential of IA to reach out
to a large number of youth it has, been restricted to the family members, friends and
acquaintances of MCs. In realizing this potential, the ILO applied its QIA methodology
to tap into this important mode of skills acquisition and open it up to youth outside
the circle of family and friends. Since its inception in 2010, the QIA methodology has
reached out to more than 2 300 MCs, of which over 1 300 are actively participating in the
programme and benefiting from the capacity development measures. So far, over 3 300
apprentices have been linked to these MCs. The programme has also supported systems
and structures at district, provincial and national level in selected urban areas to address
shortcomings in systems of informal apprenticeship. The programme also provides
assistance to the MCs by working with industry experts and microfinance institutions
to improve their businesses in selected demand driven trades, and is thus successfully
creating self and wage employment opportunities for the youth on completion of their
apprenticeship. The QIA projects include arts and crafts, welding and sheet metal work,
carpentry and joinery, motor vehicle mechanics, cosmetology (beauty and personal care),
fashion design and clothing, plumbing and home décor, as well as hotel and catering.
These programmes also include a post-training strategy of making microfinance and
business development service markets work for the youth and their self-help groups or
cooperatives. Furthermore, the programme develops value chains, assuring clear roles
for the private sector; for example, farmers’ organizations, input suppliers, warehouse
operators, buyers, traders and manufacturers are involved in skills training, as trade
or industry experts. Evidence suggests that once the subsistence requirements of the
producers’ families and local communities have been met, there are three main sources
of demand: export markets (international and regional), domestic urban and rural
markets and value added food processing. The involvement of the private sector is vital
in facilitating access to high value markets.

6
1.3 Implementation of the programme
As a means of building local ownership of the ILO Skills for Youth Employment and
Rural Development Programme in Zimbabwe, implementation is carried out through
existing local government structures. This ensures the development of local capacities for
sustainability once ILO support ceases. These local structures are:
i. National Steering Committee (NSC)
ii. Technical Working Group (TWG)
iii. Provincial Implementation Committee (PIC)
iv. District Implementation Committee (DIC)
v. Ward Implementation Committee (WIC).
1.4 The economic subsector analysis
It was agreed to undertake an economic subsector assessment of the ILO Skills for Youth
Employment and Rural Development Programme in Zimbabwe in order to assess the
efficacy of the initiatives being implemented under the TREE and the QIA methodologies.
Key questions the subsector analysis was intended to answer were:
¡ Whether the initiatives under the TREE and QIA methodologies had enhanced
young women and men’s acquisition of skills for wage and self-employment
and if so, to what extent.
¡ The extent to which the programme as a whole promoted access to sustainable
and decent wage and/or self-employment for the young people across the
various subsectors it has been supporting.
¡ Whether there was improvement in income levels and contribution towards
poverty reduction among vulnerable young women and men.
¡ Whether the projects demonstrated sufficient potential to merit future support
by the ILO and other development partners.
7
1.4.1 Specific objectives of the subsector assessment
More specifically, the subsector assessment sought to:
¡ Critically appraise the levels of skills acquisition by young men and women
under the TREE and QIA methodologies in view of the needs of the economic
subsectors, as well as to interrogate the application of these skills in livelihood
improvement.
¡ Interrogate the viability of projects under the TREE and QIA, based on key
economic indicators, such as profitability and productivity.
¡ Critically assess the number and quality of jobs created for young men and
women under the TREE and QIA methodologies within those subsectors
supported by the programme.
¡ Interrogate changes in income levels for young men and women after the
training and support under the ILO Skills for Youth Employment and Rural
Development Programme in Zimbabwe.
¡ Identify the key success factors of projects under the TREE and QIA
methodologies.
¡ Identify key challenges to the viability of projects under the ILO Skills for Youth
Employment and Rural Development Programme in Zimbabwe.
¡ Draw and document important lessons and best practices on youth skills for
employment training from the TREE and QIA methodologies
¡ Document stories of significant impact vis a vis socioeconomic empowerment
(such as livelihood improvement, accumulation of assets, improvement
of quality of life and well-being, increased capacity to access better health
care services and send children to school; as well as strengthening of social
standing accruing to young men and women benefitting from the ILO Skills for
Youth Employment and Rural Development Programme in Zimbabwe.

8
1.4.2 Expected outputs
It was anticipated that the subsector assessment would generate two outputs as indicated
below.
¡ A economic subsector assessment report for the ILO Skills for Youth Employment
and Rural Development Programme in Zimbabwe, with economic analysis of
the supported projects disaggregated by subsector.
¡ A compendium of stories of significant change accruing to the direct
beneficiaries (those young men and women participating in the programme),
as well as the indirect beneficiaries (such as families and dependents of the
young people in the programme, as well as the communities in which they live
in), based on the social and economic benefits of the various projects under
the TREE and QIA methodologies.
This report is the first output of the study. With respect to its structure, the following section
will look at the conceptualization of the subsector assessment followed by methodological
perspectives considered in the research.
Thereafter, a review of the literature of the subsectors covered in the study will be
undertaken in order to create a contextual basis for the ILO Skills for Youth Employment
and Rural Development Programme in Zimbabwe. This is important from the perspective
of understanding the difficulties and opportunities faced by the subsectors at national
level, to assist in deepening understanding of the status of the initiatives supported by
the programme under review. Following the literature review is the empirical section of
the report, which provides the results of the analysis of the projects selected under this
assessment. This section includes the challenges encountered, as well as proposed
solutions to alleviate them. Conclusions are then drawn, along with key lessons to inform
future programming.
9
2. Study design and methodology
2.1 Conceptual framework for the study
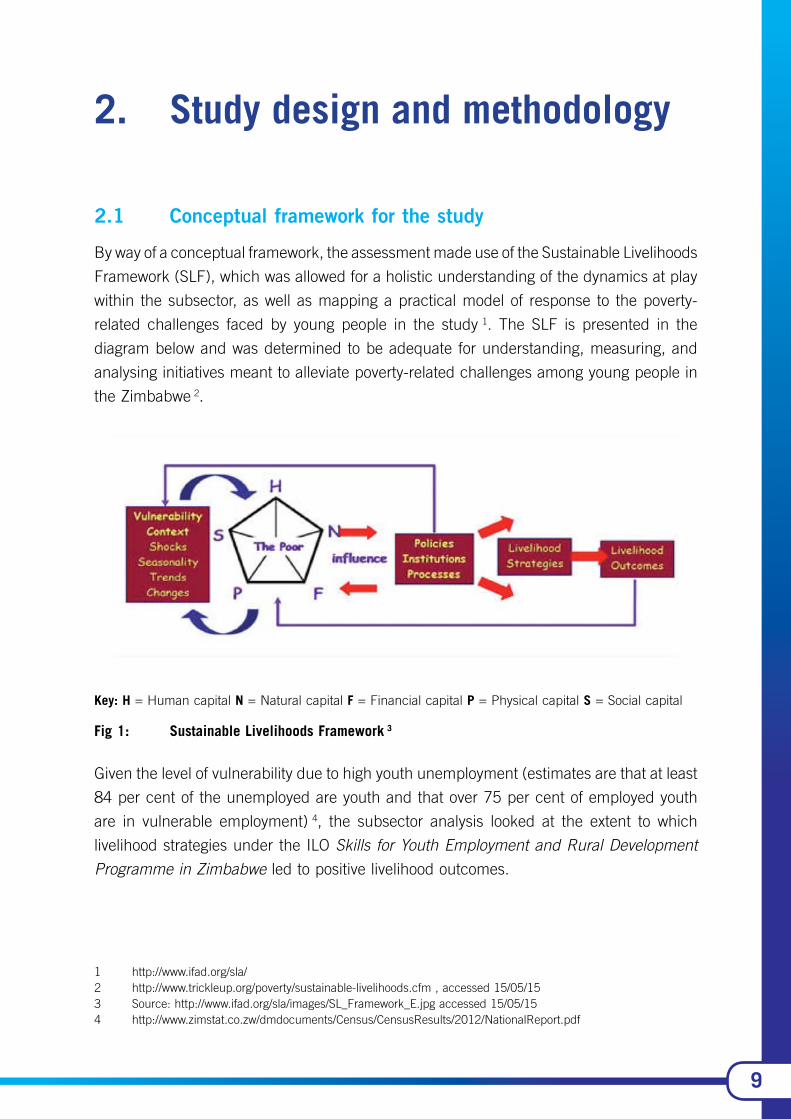
By way of a conceptual framework, the assessment made use of the Sustainable Livelihoods
Framework (SLF), which was allowed for a holistic understanding of the dynamics at play
within the subsector, as well as mapping a practical model of response to the poverty-
related challenges faced by young people in the study 1. The SLF is presented in the
diagram below and was determined to be adequate for understanding, measuring, and
analysing initiatives meant to alleviate poverty-related challenges among young people in
the Zimbabwe 2.
Key: H = Human capital N = Natural capital F = Financial capital P = Physical capital S = Social capital
Fig 1: Sustainable Livelihoods Framework 3
Given the level of vulnerability due to high youth unemployment (estimates are that at least
84 per cent of the unemployed are youth and that over 75 per cent of employed youth
are in vulnerable employment) 4, the subsector analysis looked at the extent to which
livelihood strategies under the ILO Skills for Youth Employment and Rural Development
Programme in Zimbabwe led to positive livelihood outcomes.
1 http://www.ifad.org/sla/2 http://www.trickleup.org/poverty/sustainable-livelihoods.cfm , accessed 15/05/153 Source: http://www.ifad.org/sla/images/SL_Framework_E.jpg accessed 15/05/154 http://www.zimstat.co.zw/dmdocuments/Census/CensusResults/2012/NationalReport.pdf

10
The assessment sought to understand the extent to which the programme contributed to
the alleviation of youth poverty, with special regard to expansion youth:
¡ Physical capital, such as infrastructure, production equipment and technologies
¡ Human capital, including skills, knowledge and attitudes
¡ Economic/financial capital − capital base (including cash, credit/debt, savings
and other economic assets), and
¡ Social capital, for example, social resources (networks, social claims, social
relations, affiliations and associations) 5.
2.2 Methodology
The study took a mixed methods approach, whereby elements of cross sectional
analysis and descriptive case studies were employed across the programme’s economic
subsectors. The subsectors covered in the study are listed below.
Agriculture Manufacturing Services
Poultry
Dairy
Piggery
Potato production
Cattle fattening
Horticulture
Carpentry and joinery
Arts and crafts
Clothing
Welding and metal
fabrication
Catering
Cosmetology
Home décor
Solar energy (green jobs)
Table 1: Profiled subsectors
5 Acholo, M, McNamara, N and Morse, S. (2009). ‘Sustainable Livelihood Approach: A Critical Analysis of Theory and Practice’. Geographical Paper 189. Retrieved: http://www.reading.ac.uk/nmsruntime/saveasdialog.aspx?lID=48667

11
A total of 14 randomly selected projects were visited and reviewed under this assessment;
eight were under the QIA, and six under the TREE methodologies. While some of the
profiled projects such as carpentry and joinery, welding and metal fabrication, as home
décor and clothing were reviewed on a case-by-case basis, in others (such as potato
farming), groups of beneficiaries were brought together to share their experiences in
group discussions. Efforts were made to ensure that at least two project beneficiaries
under each subsector were interviewed. The measures for profitability and productivity
(detailed in a later section) are based on average figures from the various projects. Section
4 provides the relevant details.
2.2.1 Data Collection
A number of data collection methods were used, including review of relevant programme
documents and reports as background information and to draw parameters for primary
data collection. Thereafter, primary data was collected from selected projects at community
level, using both individual interviews and focus group discussions. As previously noted,
project site visits were also undertaken in order to ascertain the physical existence
and operations of the various ventures being run by the youth who benefitted from the
programme. Specific tools were developed to undertake the primary data collection.
Interviews were also undertaken with key programmeg staff as a way of following up on
issues emerging from the data collection at beneficiary level.
Analysis of data, particularly on the economic indicators of the profiled projects was
undertaken using standard measures for productivity and profitability. Details of these are
provided in the relevant section. The remaining qualitative findings were analysed based
on key study research questions.
12
3. Literature review: An overview of subsector trends at national level
This section gives a broad overview of the national status and trends in the economic
subsectors that included projects under the ILO Skills for Youth Employment and Rural
Development Programme in Zimbabwe. The literature review will create the context
for the assessing the performance of the youth projects being implemented under this
programme.
3.1 The imperative for solar energy solutions
Zimbabwe is facing a severe energy crisis, with reports by the Sustainable African Energy
Consortium (SAEC) revealing that of the country’s over three million households only 44
per cent are electrified 6. The country’s sole power utility company, Zimbabwe Electricity
Supply Authority (ZESA) has struggled to generate sufficient power for industrial and
domestic consumption since the beginning of the economic downturn. With daily
domestic demand of about 2 200MW, the country’s installed capacity has only been able
to feed an average of 1 100MW 7, with frequent fluctuations occurring due to archaic and
equipment and recurrent breakdowns at the main power generation stations. Indeed,
with power outages reportedly happening on average 56 days a year and ZESA’s inability
to provide uninterrupted power supply to urban areas, it is apparent that rural areas will
suffer even less reliable electricity supply, despite the scaling up of rural electrification
programmes to enable greater access to electricity there 8. While 68 per cent of the
country’s population lives in the rural areas, rural electrification is only at approximately
ten per cent, leaving the vast majority of rural communities in energy poverty 9.
6 http://www.zimbabwesituation.com/news/zimsit_w_allafrica-com-zimbabwe-battles-with-energy-poverty/ accessed 6/23/2015
7 see Theafricareport.com : Electricity: Zimbabwe in acute power deficit | Southern Africa8 http://www.magenta-global.com.sg/subsaharaafricasolar2014/9 ibid

13
Over 83 per cent of rural households reportedly rely on traditional biomass, while over
70 per cent use paraffin 10 for cooking and lighting. The challenge of energy poverty is
pervasive across Africa, with studies indicating that with the exception of South Africa
and Egypt, no more than 20 per cent (and in some countries as few as five per cent)
of people across the African continent have access to electricity at all 11. Furthermore,
it is reported that only one in six (16.67 per cent) of rural inhabitants in sub-Saharan
Africa has access to electricity with the rest remaining trapped in energy poverty 12. This
therefore points to the need for a clear policy framework that supports the development
of clean energy sources 13.
Until recently, the lack of electricity in many poor areas was seen as an inevitable fact of
life, but the growth of solar energy is fast changing this narrative and rural communities
in Zimbabwe are no exception. While studies have shown that Zimbabwe is one of the
best solar radiation belts in the world, averaging 3 000 hours, and 2 100 kilowatt hours
per square metre per year, equivalent to 300 days of sunshine per year, this resource
is seriously under-utilised. Statistics released by the country’s energy regulatory body in
2012, reveal that only five per cent of the country’s energy balance is provided by solar
energy, as shown in the graph below. 14
Fig 2: Sources of Energy in Zimbabwe
10 http://www.africayouthskills.org/Renewable_Energy accessed 6/23/201511 See more at: http://www.un.org/africarenewal/magazine/october-2006/solar-power-cheap-energy-source-
africa#sthash.3A6bc3gd.dpuf accessed 6/23/201512 http://www.scientificamerican.com/article/pay-as-you-go-solar-energy/ accessed 6/23/201513 http://www.thezimbabwean.co/lifestyle/education/64224/new-solar-system-solution-to.html accessed 6/23/201514 see http://www.chronicle.co.zw/solar-energy-solution-to-zim-power-deficit/ accessed 06/07/15

14
Due to their modular nature, solar power systems, are uniquely suited to address the
energy needs of decentralised rural populations. As solar energy is increasingly recognized
as a sustainable alternative to hydro and thermal power generation solar energy subsector
initiatives are bound to have traction regarding job creation.
3.2 Poultry industry
The poultry industry has become a leading industry in Africa and has made a significant
contribution towards poverty reduction and employment creation over the last decade.
Its predominant outputs are meat and eggs, both of which are among the most popular
sources of protein globally 15. Over the last decade, there has been a five per cent
annual increase in chicken meat output from African countries, which has increased the
continent’s share of global production. Chicken meat is typically from ‘broilers’. Broilers
are specially bred for large-scale and efficient meat production. While indigenous breeds
exist, they are typically consumed in only small volumes and are less efficient meat
producers.
Zimbabwe’s poultry industry has shown massive growth due to a surging demand for
chicken meat and eggs. In fact the post-dollarization 16 era (from 2009 onwards) has
been characterised by production of day-old broiler chicks reaching 64 million and 78.4
million tonnes of meat by 2013. This represents an average growth of around 40 per cent
since the industry bottomed out in 2009. Day-old chick production peaked at 8.4 million
in September 2014 − an increase of 22 per cent compared with the previous year’s peak
of 6.2 million 17. These trends are illustrated in the figure on the next page.
15 A Strategic Plan for Zimbabwe’s Poultry Industry: Building capacity and productivity in the Broiler and Egg Sectors December 2014
16 Zimbabwe stopped its local currency and adopted US Dollar as the national currency. South African Rand and Botswana Pula are also the accepted currencies in the market
17 http://www.finxzimbabwe.com/economy/295-high-fixed-costs-affect-stock-feed-industry

15
Fig 3: Broiler meat production trends, 2013 to March 2015 Source: Livestock Sector Overview: 2014-2015
In observing the increase in commercial poultry production in Zimbabwe, it is noteworthy
that smallholder production from both the communal farming sector and backyard flocks
in urban areas makes a significant contribution to chicken meat and egg requirements.
The shift to chicken consumption comes on the back of a significant increase in price
of beef. Added to this is the fact that broiler production is a short-cycle process and
generates income on a relatively regular basis; with as many as eight production cycles
being possible within a calendar year. Chicken meat and egg production can also be
carried out all year round, thereby providing a regular source of income.
Nonetheless, poultry production is still being outstripped by consumption and Zimbabwe
continues to import broiler meat. A consequence of this is that the market has been
flooded by cheap imported chickens with the unfortunate result of undermining local
producers 18. In the 2013 budget statement, government sought to intervene to protect
the local poultry industry by reviewing tariffs on chicken imports upwards by 40 per
cent, or $1.50/kg. However, despite the challenges currently faced by poultry producers,
including the high prices of feed − which usually correlates with high maize prices
(particularly in poor agricultural seasons) − the demand for poultry products currently
appears to be insatiable and projects in this economic subsector have great potential to
thrive.
18 Tatenda Zengeni 2014 The competitiveness and performance of the Zimbabwe poultry Industry - http://www.static1squarespace.com/static/522446331e4b0a46e5f1b8ces/t/55349db7e4bcfb9b5b7aeab3/1429511607260/Tatenda+Zengeni_Competitiveness+of+the+Zimbabwe+Poultry+Industry.pdf

16
3.3 Potato production
Many Zimbabweans are adopting potatoes as a basic food and an alternative starch to
the staple maize meal. With rising demand for both table potatoes and processed potato
products this industry has been expanding over the past 15 years. In 2013, a total of
11 300 ha was put under table potato production and the nation produced a total of
397 600 tonnes of table potatoes from that crop 19. Potato farming offers a high return
on capital invested, which has resulted in the crop becoming very popular. Unfortunately,
smallholder farmers have limited capacity to grow potatoes due to the high cost of seed.
Other significant costs can also be incurred in the purchase of fertilisers and pesticides
for the control of pests and diseases.
In 2012, the government declared potatoes a strategic food security crop, but unfortunately
not much has been done to support farmers and intensify production of this crop. Many
are reluctant to take up potato production because it is a capital-intensive crop. Weak
extension services for farmers who want to venture into potato farming has also attributed
to this reluctance.
To ensure food security in Zimbabwe in the wake of climate change there is need to
invest in local production and diversify in the agricultural sector, with potato production
being one avenue for more considered attention.
3.4 Art and Crafts
The art and crafts subsector in Zimbabwe includes fine art such as painting, drawing,
sculpture and photography; and crafts such as basketry, crocheting, beadwork and
pottery, which have an enormous potential for contributing to both national and household
income through local and export sales. According to the Indigenization and Economic
Empowerment (IEE) General Regulations 21 of 2010 20, marketing and distribution of
local art and crafts, are among the 14 sectors reserved for indigenous Zimbabweans. The
art and crafts subsector contributes roughly 0.5 per cent towards national employment
figures, with an estimated 28 700 actively employed across the subsector 21. One of
the key challenges in this area is poor coordination and segmentation, coupled with
underfunding (which has led to lack of affordable working space and equipment for
artists). This has negatively impacted on its ability to contribute more significantly to the
economy 22.
19 See more at: http://www.manicapost.com/growing-potatoes-with-nature/#sthash.lU9RKk7O.dpuf accessed 6/25/2015
20 Government of Zimbabwe (2010): Indigenization and Economic Empowerment (General) Regulations 2121 Labour Force and Child Labour Survey 201422 https://www.newsday.co.zw/2015/05/08/arts-sector-funding-segmented-nacz/ accessed 6/26/2015

17
The main market for the non-fine art products, such as baskets, is tourists (62.5 per
cent) and the general public (28.6 per cent), but inadequate access to these markets
is limited. Studies have shown that the art and crafts subsector has great potential 23,
particularly in view of the growth anticipated in the tourism sector up to the year 2021 24.
A need for incentives has been identified for incentives to support indigenous players to
enter this potentially lucrative subsector by offering training in the relevant skills 25. There
have been numerous calls for training and capacity building of actors in the art and crafts
subsectors in areas such as quality improvement, packaging and export marketing, as
well as knowledge on trade agreements and business management. There have also
been efforts to organize entrepreneurs already in the art and crafts subsectors to join
group savings schemes and to form clusters, which would help leverage resources, work
spaces access to markets, as well as collective bargaining and ensuring their interests
are taken care of.
3.5 Piggery
In Zimbabwe, piggery continues to have the potential to be a meaningful contributor to
the economy, especially in rural and marginalized areas, as well as to be a viable source
of income for small-scale producers, who contribute about 80 per cent of total national
production. Between 2010 and 2013, there was a notable increase in pig rearing in
the country, as indicated in the graph below by an increase in slaughter figures, from
121 137 pigs in 2010, to about 145 927 in 2013 26.
Fig 4: Trends in Gross Slaughtered Pigs 2010-2014 Source: Livestock Sector Overview: 2014-2015
23 See Zimstat(2012): The Cultural Statistics Survey Report 201224 Reviving Zimbabwe’s Tourism Industry: Opportunities for Private Investors, presentation by Shingi Munyeza,
Group CEO, African Sun Limited, accessed on African Financials Investors, November 200925 Tourism Sector PIP Empowerment Factsheet626 http://www.cfuzim.org/images/review15.pdf
18
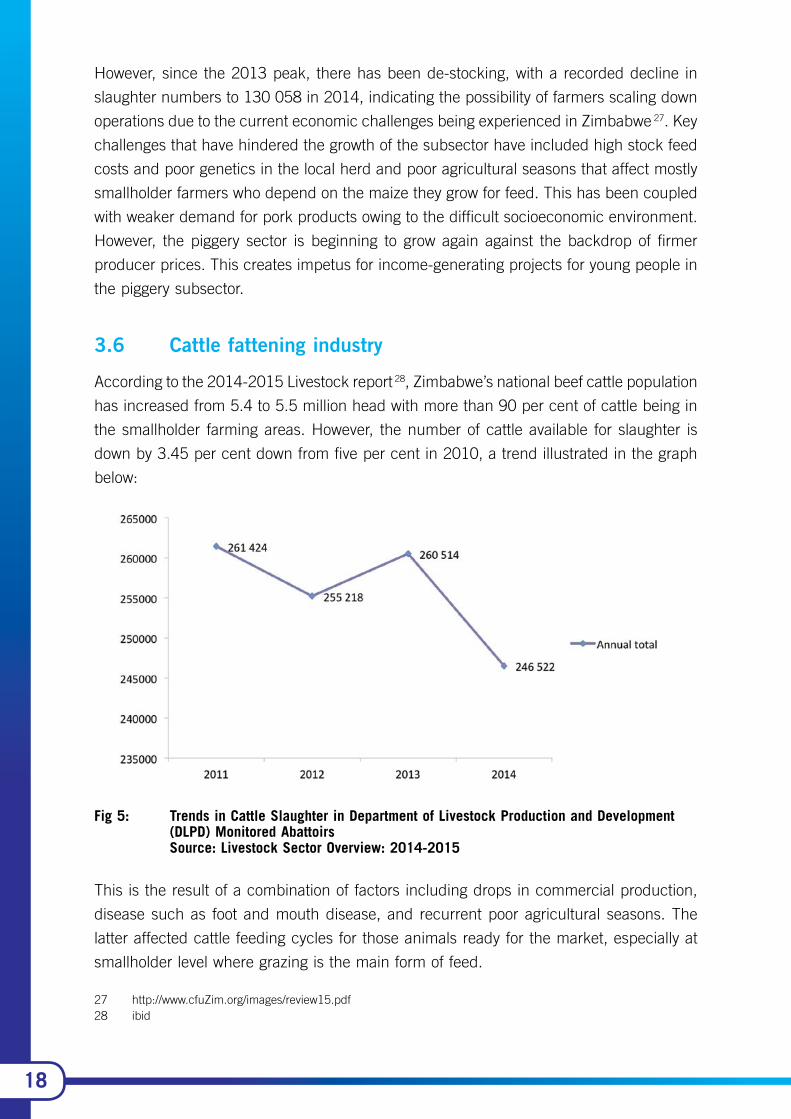
However, since the 2013 peak, there has been de-stocking, with a recorded decline in
slaughter numbers to 130 058 in 2014, indicating the possibility of farmers scaling down
operations due to the current economic challenges being experienced in Zimbabwe 27. Key
challenges that have hindered the growth of the subsector have included high stock feed
costs and poor genetics in the local herd and poor agricultural seasons that affect mostly
smallholder farmers who depend on the maize they grow for feed. This has been coupled
with weaker demand for pork products owing to the difficult socioeconomic environment.
However, the piggery sector is beginning to grow again against the backdrop of firmer
producer prices. This creates impetus for income-generating projects for young people in
the piggery subsector.
3.6 Cattle fattening industry
According to the 2014-2015 Livestock report 28, Zimbabwe’s national beef cattle population
has increased from 5.4 to 5.5 million head with more than 90 per cent of cattle being in
the smallholder farming areas. However, the number of cattle available for slaughter is
down by 3.45 per cent down from five per cent in 2010, a trend illustrated in the graph
below:
Fig 5: Trends in Cattle Slaughter in Department of Livestock Production and Development (DLPD) Monitored Abattoirs
Source: Livestock Sector Overview: 2014-2015
This is the result of a combination of factors including drops in commercial production,
disease such as foot and mouth disease, and recurrent poor agricultural seasons. The
latter affected cattle feeding cycles for those animals ready for the market, especially at
smallholder level where grazing is the main form of feed.
27 http://www.cfuZim.org/images/review15.pdf28 ibid

19
Matabeleland South represents the worst extreme in terms of decline in beef cattle
production. Being in the arid or semi-arid regions of the country, decline in meat
production is a recurring feature due to drought and dependence on rain-fed grazing,
low fertility of cattle breeds and sub economic production practices among smallholder
farmers.
Communal and smallholder farmers across Zimbabwe generally retain livestock as an
important livelihood asset, however, weather extremes and problems such as poor crop
yields related to climate change have induced many to find innovative ways to survive
through cattle fattening. In regions such as Matabeleland South, where cattle fattening
projects are primary, many continue to explore this activity as a means of earning a
sustainable livelihood.
The term ‘cattle fattening’ defines the feeding of beef cattle ready for slaughter with
a balanced high energy diet for a period of 70 to 120 days under confinement. This
increases live weights and improves the degree of finish 29. It is also done to take advantage
of seasonal beef price fluctuations at the abattoir, with prices being generally favourable
from October to February. A well-fed animal can fetch as much as US$2 000 or more.
While cattle fattening has provided a viable livelihood alternative for many smallholder
farmers, those who lack proper beef cattle fattening skills suffer poor returns 30. Lack of
knowledge at the small-scale farming level has contributed to low productivity driven by
poor calving rates and low live mass weight at sale. The high levels of Rural District Council
cattle marketing levies (10.5 per cent of the sale price of cattle) have also reduced the
viability of cattle-fattening among smallholder and communal farmers. Nonetheless, feed-
lots offer an opportunity for ensuring sustainable livelihoods, particularly in communities
with poor crop production 31.
3.7 Dairy Value Chain
The annual milk demand in Zimbabwe has remained steady since 2011, at around 120
million litres, while production lags by around 55 million litres. Annual milk production
increased from 54.7 million litres in 2013 to 55.5 litres in 2014. It is anticipated that
milk production will further increase in 2015, judging by the first quarter increase from
13.1 million litres in 2014 to 13.4 million litres in 2015 32. The commercial milking herd
increased by seven per cent, from 26 000 to 28 000, between 2014 and 2015 and it is
anticipated that the herd size will increase by a further 22 per cent by year-end because
of the import of dairy heifers under the Dairy Revitalization Programme currently being
implemented.
29 Feedlot Economics 2015. Department of animal production and technology, Chinhoyi University of Technology Zimbabwe email [email protected]
30 http://www.thezimbabwean.co/business/agriculture/66692/fattening-the-calf.html31 http://www.cfuzim.org/images/review15.pdf32 Livestock Sector Overview: 2014-2015

20
The deficit in the milk supply is currently covered by imports from South Africa. Despite
current circumstances, the country’s capacity to outpace existing yield is evident, given
past performance 33.
Challenges faced by the dairy industry are primarily concentrated at the producer and
processor level. Large scale producers face challenges in significant production costs due
to high feed prices, depleted herds and stringent policy tariffs. Less experienced small
to medium scale farmers are constrained by an historical infrastructure framework that
is skewed towards large-scale players 34: a lack of animal husbandry education, business
insight and productive resources. Many of these farmers are unable to access the finance
needed to invest in growing herds and output.
Small-scale producers continue to face viability challenges. The average dairy farm
incurs costs of US$0.67 to produce one litre of milk, against a producer price of $0.58
per litre. The key factors affecting viability are the high cost of feed concentrate as a
result of low production of local maize and wheat, which have necessitated the import
of these key raw materials. Poor rains in the 2014-15 season have also led to reduced
yields of maize silage, an important aspect for on-farm grown dairy feed 35. Inefficiency
in farm management due to inadequate training for most new farmers in the dairy sector
compounds these problems. It is anticipated that costs of feed will further increase in the
second half of the year due to the maize production deficit. Increased instability in grid
electricity supplies puts production costs under further pressure.
Since independence in 1980, the Zimbabwe Government has adopted a policy of
encouraging farmers in the small-scale, communal and resettlement schemes, to
participate in the dairy sector. To spearhead this initiative, in 1983, government set up
the peasant sector development programme (now known as the Dairy Development
Programme − DDP). This programme was mandated to implement dairy development
projects in these areas. The National Dairy Development Strategy of 1987 gives the
overall objective as to develop dairy units to ensure a broad-based, viable production of
sufficient wholesome milk and its derivatives, to meet the national needs at an affordable
cost.
Data available from the DDP indicates that milk production within the smallholder sector
dropped from 2.7 million litres in 1990, to 1.5 million litres in 1998 and 1.13 million litres
in 2011. Most projects suffered a further slump during the period 2006 to 2008, with
some closing down as a result of the then hyperinflationary environment 36.
33 ZIMStat Q42013 Digest; The National Livestock Development Program 2014-201834 Livestock Sector Overview: 2014-201535 http://www.fao.org/docrep/016/ap106e/ap106e.pdf36 http://www.snvworld.org/download/publications/an_evaluation_of_smallholder_diary_production_in_zimbabwe.

21
The major constraining factors hindering growth in smallholder dairy are poor
commercialization, weak organization/governance, and low productivity. Huge opportunities
exist in the current demand-supply deficit, while threats lie in the non-availability of dairy
stock and reduced service provision from a cash strapped DDP and public institutions.
Fig 6: Small holder dairy products by year Source: SNV Evaluation of Smallholder Dairy programmes in Zimbabwe.
Donor funds and direct government support have helped meet both capital and recurrent
costs of implementing dairy development initiatives in Zimbabwe. However, despite the
efforts by the donor community and government, the milk contribution from the smallholder
dairy sector has, to date, remained fairly insignificant 37 and has failed to surpass the
three per cent mark, despite the fact that similar initiatives in Kenya and Rwanda have
produced impressive results. The fact that the bulk of prime land in Zimbabwe now lies
in the hands of smallholder farmers suggests that any future milk promotion schemes
should target this sector 38.
The relationship between processors and smallholder dairy farmers includes a number of
obstacles that act as constraining factors in the supply of raw milk. Producer prices are a
key source of boundaries in processor-supplier relationships and tend to be determined
by the processors. The producer price determination system, which is set on a basic
producer price with payments and/or penalties based on quality assessments, is perceived
to be flawed. Previously, the government Dairy Services tested milk for quality and sent
the results to processors 39.
37 ibid38 Dairy Services Data, LMAC: Livestock Sector Analysis and Development of an Investment Framework for
Smallholder Livestock Production in Zimbabwe Final Report Volume 1, Facts and Analysis, 201339 Chinogaramombe, G., Muchenje, V., Mapiye, C., Ndlovu, T., Chimonyo, M. and Musemwa, L. 2008. Challenges
for Improving Smallholder Dairy Production in the Semiarid Areas of Zimbabwe
22
Today, processors test milk for quality, determine the producer prices and quality and
pay the farmers. The producer price of milk takes a long time to change as they are
less responsive to milk production cycles. Trends in the cost of production may be due
to the fact that stock feed and veterinary chemicals are more frequently affected by
inflation, thus squeezing farmer margins. Processors, on the other hand, are adamant
that producer prices are determined by market forces of supply and demand, and are
currently depressed by low productivity, poor quality and import pressure 40.
3.8 Small-scale furniture making
The popularity of furniture produced by informal and small-scale furniture makers is on
the rise in Zimbabwe. Producers in this subsector manufacture furniture contend that
they cater for all socioeconomic classes at affordable prices. Owing to liquidity challenges
in the economy, as well as the high prices of furniture in department stores, many people
prefer to go to small-scale furniture makers where prices are negotiable. In places such
as Harare’s high-density suburbs of Glenview, Machipisa, Budiriro and Kuwadzana, small
scale producers even supply products to large furniture businesses in Harare 41.
According to the Informal Woodworkers’ Association, 18 500 people are currently engaged
in informal carpentry and furniture making in the capital. Some of these carpenters
and furniture makers are trained and seasoned former employees of big furniture
manufacturing companies that have folded as a result of the economic environment.
Apart from those working in ‘home industries’ where there are dedicated spaces for
artisanal workers and traders, most of these carpenters prefer to work informally in back
yards, evading operational costs, rentals and taxes for the land and resources they use.
A vast number of informal carpenters learn their trade from observing and working for
and with experienced furniture manufacturers and only graduate from this site-based
informal training (learning by participation), after they have gained experience as a wage-
employee with a furniture company or when they start their own venture with their own
team of apprentices 42.
These small-scale furniture manufacturers face specific challenges; they begin as
unknown entities, making it difficult to break into the market. As demand for their
products increases due to their lower prices and flexibility in pricing, they often fail to
meet demand 43.
40 ibid41 http://www.thezimmail.co.zw/2014/11/17/informal-carpentry-hammers-away-revenue/ accessed 02.07.1542 http://www.jsd-africa.com/Jsda/v10n2_Summer2008/PDF/NOTES_Dirwai-%20Towards%20rural.pdf43 ibid

23
Challenges of accessing capital and equipment are major hindrances, coupled with the
challenge of adequate skill as informally trained trades-persons. Despite these challenges
there is evidence that small-scale carpentry and furniture making results in sustainable
livelihoods, with some even earning more than their formally employed counterparts in
the bigger furniture making companies. The subsector therefore has significant potential
as an area of intervention for creating employment for young people if challenges can be
addressed.
3.9 Catering
With the increase in unemployment in the country, small-scale catering businesses have
also thrived. These are dominated primarily by female players selling lunches from the
boots of their cars at strategic points, in caravans at industrial sites, or actually catering
for small events. The informalisation of the Zimbabwe economy has created demand
for small-scale catering services, since workers in informal traders and small to medium
enterprises (SMEs) often prefer to buy affordable food from these emerging caterers who
operate close to their work places rather than from restaurants and other formal food
outlets 44. A study by Njaya in 2014 made very interesting findings regarding urban food
vending; the evidence showed that emerging caterers were not only realizing sustainable
livelihoods for themselves, but were also creating additional employment and providing
food services to the poor, as they searched for means of survival within the city centre
and industrial sites 45.
Research shows that the major challenge facing youth, especially women, in the small-
scale catering business is the lack of finance, which manifests in failure to procure
adequate cooking equipment, coupled with inadequate storage facilities for perishable
and non-perishable ingredients and inability to buy raw materials in bulk (which is
cheaper). As a result, the businesses struggle for viability, with the participants virtually
living from hand to mouth 46.
Youth in this subsector also faced skills challenges, with a lack of experience and weak
business management skills. The resulting, poor quality control can lead to inferior
products and compromises their competitiveness.
44 Kuada, J., 2009. Gender, social networks, and entrepreneurship in Ghana. Journal of African Business, 10(1): 85-103.
45 Njaya T (2014): Operations of Street Food Vendors and their Impact on Sustainable Urban Life in High Density Suburbs of Harare, in Zimbabwe. Asian Journal of Economic Modelling, 2014, 2(1): 18-31
46 Zinyemba A& Changamire T (2014): International Journal of Business, Economics and Management, 2014, 1(11): 372-381
24
Even in scenarios where product quality is not a concern, the operating space for small-
scale caterers is often a challenge, with the affordable facilities often lacking adequate
amenities such as water, electricity and garbage disposal. Apart from those cooking from
home, the caterers end up doing food preparation in facilities that do not meet local
authority by-laws regarding food preparation for commercial sale. Consequently, many
small-scale caterers end up operating without a license. This inevitably makes tendering
for larger functions difficult and limits the growth of actors in this subsector 47.
3.10 Clothing subsector
The clothing subsector is a leading employer within the manufacturing SMEs in the
country, absorbing a number of players, including lowly skilled personnel, as the trade is
relatively easy to learn 48. This subsector has typically been dominated by women perhaps
because home décor and clothing are considered ‘domestic’ trades which have been
socioculturally assigned to women. However, there is an increasing number of male actors
within the subsector. Clothing has been considered a ‘soft landing’ by many unemployed
people, with some turning to it as a livelihood strategy, or to supplement income 49. Most
tailors occupy small working spaces in buildings in central business districts, typically
leasing one or two rooms. They often employ an assistant and will subcontract when large
orders are received. Working from home is also common among tailors and dressmakers.
Small-scale tailors specializing in the lower end of the clothing market have been badly
affected by an increase in imports of second-hand clothes, which are traded at affordable
prices at open markets in the vicinity of urban centres. This has forced many in this
subsector to also turn to trading second-hand clothes 50. The challenges brought about
by cheap clothing imports have been so great that even the bigger companies have taken
a knock in revenues and profitability. Calls continue to be made for stronger protectionism
in this sector in order to cushion small and large-scale local manufacturers from cheap
imports. Pressure from those in the subsector have also resulted in the Government of
Zimbabwe, through the Ministry of Finance, announcing policy measures to ban the
importation of second-hand clothes, particularly from neighbouring Mozambique 51.
47 International Journal of Business, Economics and Management, 2014, 1(11): 372-38148 http://www.saprin.org/zimbabwe/research/zim_trade_lib.pdf49 https://www.newsday.co.zw/2015/03/18/reprieve-for-clothing-manufacturers/50 http://www.saprin.org/zimbabwe/research/zim_trade_lib.pdf51 Government of Zimbabwe (2015):THE 2015 MID-YEAR FISCAL POLICY REVIEW STATEMENT.

25
3.11 Home Décor
Home décor generally refers to the decorating and furnishing of interior spaces within the
home 52, dealing with aspects such as fabric installation, such as curtains, rugs, cushions
and mats, to enhance the interior aesthetics of homes. In Zimbabwe, home décor has
been traditionally taught in secondary school and can now be taken up at a professional
level. Traditionally, home décor skills have been handed down from mothers to daughters
through informal skills transfer. As an economic subsector, home décor has provided
opportunities for young women to earn incomes through fulfilling orders received from
individuals within their communities for a fee. This subsector is strongly linked to the
textile industry as a source of fabric, yarn and other raw materials, as is clothing.
Today, with the textile industry in Zimbabwe on the verge of collapse due to high
operating costs, obsolete equipment, electricity shortages and untenable competition
from cheap imports 53, home décor practitioners have also struggled to obtain affordable
locally produced raw materials for their work. Often, there has also been dependence on
cheap imports, for which they are unable to guarantee genuine and durable home décor
products for their clients. The generally depressed socioeconomic environment currently
prevailing has also resulted in low demand for home décor products, as people focus
on survival and feeding their families. This has reduced the profitability of home décor,
though it still remains a viable livelihood option for those trained and practicing it.
3.12 Welding and metal fabrication
This industry, traditionally characterised by a monopolistic formal sector, has seen an
increase in informal sector activities over the years, as the formal companies closed down
due to viability challenges 54. Indeed, like many other economic sectors, welding and
metal fabrication is following the same rapid informalization trends. Seasoned artisans
have found themselves setting up individual enterprises due to being retrenched and in
the process recruiting assistants with various skills sets, with some acquire training on
the job. This has led to a huge number of informal apprenticeships occurring within the
subsector, thereby creating opportunities for otherwise untrained young people to learn
and train on the job in these the small ventures 55.
52 See http://interiordec.about.com/cs/faqsondecorating/f/faq_interiordec.htm , accessed 20/07/1553 http://www.herald.co.zw/textile-industry-on-the-brink-of-collapse/ accessed 16/07/1554 http://www.saprin.org/zimbabwe/research/zim_trade_lib.pdf55 http://ir.uz.ac.zw/jspui/bitstream/10646/1077/1/Muchabaiwa_thesis.pdf

26
Indeed, with sustained demand for the more affordable products manufactured, such
as window frames, agricultural tools, door frames and other building materials, the
small-scale metal fabrication subsector continues to absorb graduates from vocational
training centres. A number of challenges continue to be encountered in the subsector,
however, among them access to affordable finance for working capital and acquisition of
machinery and lack of working and shelf space for their products 56. Linkages to markets
also present challenges to the welders and fabricators, with middlemen taking advantage
of them and paying them low prices for their products.
3.13 Horticulture
Historically, horticulture has been a significant factor in the agricultural sector’s large
contribution to Zimbabwe’s gross domestic product (GDP). In just ten years, prior to the
fast-track land reform programme, the country built a highly successful horticulture sector.
In 1999, peak sales were recorded from horticulture, falling just behind tobacco as the
largest foreign currency earner in the sector and contributing about four per cent to the
country’s GDP in the process. With the advent of the fast-track land reform programme
in 2000, the smallholder farming base broadened and horticultural production also grew
among indigenous farmers 57. This was expected to improve the quality and quantity
of horticultural produce, but unfortunately the smallholder farmers encountered major
challenges. Key among these were lack of capital for inputs and agricultural implements,
as economic growth decelerated and financial institutions became reluctant to support
emerging farmers, since the newly acquired farmland could not be used as collateral. As
a result, the horticulture’s contribution to national income decreased from its all-time high
of $142 million in 1999, to less than $40 million by 2013 58. With the gradual improvement
in economic indicators from 2008-2013, horticultural production has begun to grow again
and indicators point to the sector retaining its great potential as a key contributor to the
economy at large, as well as a creator of jobs and enterprise development opportunities
for young people. Various key issues are crucial to optimise the potential of horticulture
as a viable livelihood alternative in the country.
56 ibid57 Governance over Fruit and Fresh Vegetables in Zimbabwe - http://www.ruzivo.co.zw/publications/working.papers.
html?download+51:Governance%20over%20Fresh%20Fruit%20and%%20Vegitables%20in%20Zimbabwe58 http://www.financialgazette.co.zw/horticultural-sector-still-in-the-doldrums/

27
The aspects that need to be strengthened to ensure horticulture realises this potential
include:
i. The need to ensure that the subsector is aligned with the global nature and
dynamic demands of related industry;
ii. Enhancement of production among smallholder horticulture farmers in terms
of quantity and quality to ensure that they ultimately become important
suppliers of export produce;
iii. Improvement of effectiveness and efficiency (logistics in general), along the
horticulture supply chain;
iv. Enhancement of produce marketing, and development of a value-added
strategy; and
v. Strengthening constructive and mutually beneficial partnerships among
horticultural producers, government and other stakeholders within the
subsector 59.
3.14 Beekeeping (apiculture)
From about 2005, Zimbabwe has registered a significant increase in the number of
beekeepers and beehives in the country. On average, the country has been producing
about 427 000 metric tonnes of honey per year. Few indigenous beekeepers have
successfully commercialised their apiculture initiatives 60, although the government has
been promoting training in beekeeping through the establishment of an apiculture section
within the Ministry of Agriculture. This unit trains the ministry’s extension workers in
beekeeping and the extension officers, in turn, train farmers and undertake community
outreach programmes to promote apiculture. Unfortunately the apiculture section is
under resourced and has been unable to have a meaningful impact.
Some of the general constraints in the apiculture subsector, particularly among small-scale
practitioners, include lack of access to credit, absence of a supportive policy framework
for apiculture, lack of quality control measures, the remoteness of producers and low
appreciation from the public about the practice.
59 Rural Agriculture Revitalisation Program SNV – Netherlands Development Organisation Horticulture Subsector Study report, September 2014
60 http://www.sundaymail.co.zw/?p=16702 accessed 6/24/2015

28
With numerous groupings and cooperatives emerging in the country, especially after the
Api-Africa Expo conference hosted by Zimbabwe in 2014, the role of apiculture as a
livelihood alternative and source of income for marginalised rural communities has been
on the rise 61. Prices of honey are not controlled by government, but tend instead to
depend on the beekeeper’s ability to bargain on the market. Net returns can be as high as
45 per cent, allowing for a decent income and sustainable livelihood among communities
practising apiculture. Furthermore, there have been initiatives by NGOs such as Practical
Action Southern Africa, as well as the Bee Keepers’ Association of Zimbabwe (BKAZ), that
provide support to small-scale honey producers product quality improvement, sharing
information on markets and bargaining for fair prices. Apiculture continues to grow as a
means of economic empowerment in rural areas across the country 62.
3.2 Conclusion: Potential is the common denominator
This section provided an overview of national status and trends in the various economic
subsectors being profiled in this assessment. The common denominator across all of them
is the fact that in spite of the prevailing socioeconomic difficulties in the country, there is
vast potential in the majority of the subsectors to provide viable livelihood alternatives for
young people, with the possible exception of cattle fattening, whose challenges will receive
further attention in a later section. Given the various forms of emerging demand, and
opportunities opening up due to the decline or collapse of larger-scale actors, adequate
spaces are available for young people to run projects and entities that could provide them
with sustainable incomes.
Each of the projects has fitted into gaps and opportunities that have opened up in the
economy at macro level, on which youth groups can leverage to their socioeconomic
benefit. Having clarified that the interventions under the ILO programme are relevant
in Zimbabwe, the next question is to find out how well they have been doing. Another
question would be, how viable these youth projects have been, based on key economic
indicators. It is the answers to these questions that forms the crux of this assessment and
the following section will attempt to do so based on venture profitability and productivity.
61 http://www.sundaymail.co.zw/?p=16702 accessed 6/24/201562 Situation Analysis of the Beekeeping Industry in Botswana, Lesotho, Malawi, Mozambique, South Africa,
Swaziland, Zambia and Zimbabwe http://www.beekeeping.com/articles/us/beekeeping_regional_situational-analysis.pdf accesses 6/24/2015

29
4. Viability analysis of projects across the subsectors
4.1 Introduction - defining the key indicators
The analysis of viability will be anchored on the profitability and productivity of the projects
under study. It will also give an overview of the quantity and quality of the jobs created
by the projects, and try to establish which of the subsectors are performing better, by
comparing ratios across them. Due to the records available during data collection, all
variables are recorded in monetary terms. The ratios that have been applied are defined
and explained below.
4.2 Profitability
Profitability looks into the financial condition and performance of the projects. It shows
how effectively a project is being run and how it is performing, in other words, its capacity
to make a profit, with profit being what is left over from income earned, after deduction
of all costs related to production. In this assessment, the best measure for this was the
Net Profit Margin Ratio (NPMR), which represents the venture’s bottom line. It indicates
how much profit is being made per dollar of sales after all related expenses. The formula
for calculating net profit margin ratio is:
Net Profit Margin =Net Profit
Revenue
While acknowledging the numerous arguments as to the value that constitutes a viable
net profit margin, a threshold ‘in excess of ten per cent’ of each dollar of net sales (or
as the ratio itself, in excess of 0.1) was determined as acceptable to deem a venture
sufficiently profitable to continue operating. This was based on arguments from the
literature 63 and from experiences noted in a range of other small businesses as well 64 65.
The threshold was determined in order to allow generic assessment of profitability across
the ventures, notwithstanding the various dynamics and market structures within the
respective subsectors.
63 see http://www.accountingtools.com/questions-and-answers/what-is-net-profit-margin.html accessed 25/08/1564 see http://www.democraticunderground.com/discuss/duboard.php?az=view_all&address=104x3262153 ,
accessed 25/08/1565 see http://smallbusiness.chron.com/net-profit-percentage-goals-business-23447.html#, accessed 25/08/15

30
4.3 Productivity
Productivity looks into the efficiency of the production process. It quantifies the ratio of
output against input. Productivity is a crucial factor in a project. It has to do with the
measure of output per unit input, that is to say, the value added due to the application
of one unit of input. In this case, productivity is measured as a ratio of total sales/
revenue against the total value of costs incurred in the project’s production cycle.
Operating performance or efficiency in the production process will be calculated using
the productivity ratio, which is calculated as:
Productivity Ratio =Revenue
Cost Inputs
This ratio shows how efficiently inputs are being applied in the production process. If the
ratio is less than or equal to one, then there is inefficient use of resources in the project’s
production cycle.
All figures referred to in this assessment are in United States Dollars (USD$). The following
section will give the findings from the analysis of the projects in terms of their technical
profitability and productivity under the set criteria. Further discussion then attempts to
rationalise and explain the results.
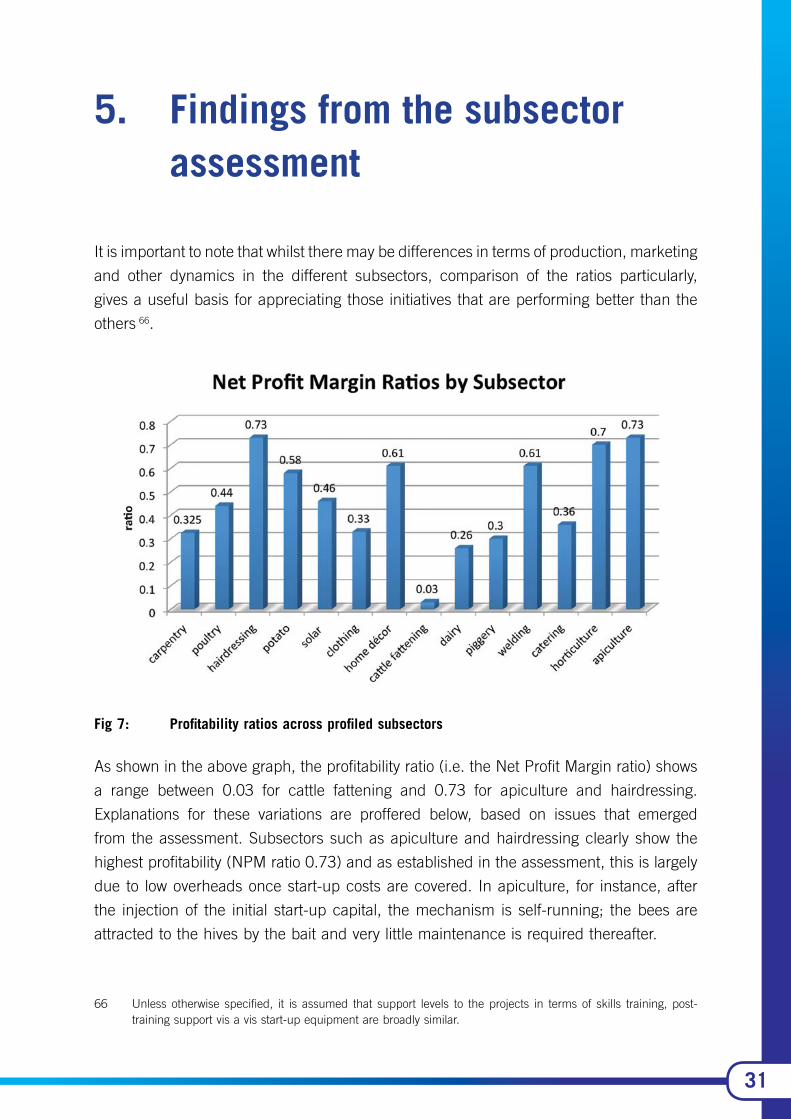
31
5. Findings from the subsector assessment
It is important to note that whilst there may be differences in terms of production, marketing
and other dynamics in the different subsectors, comparison of the ratios particularly,
gives a useful basis for appreciating those initiatives that are performing better than the
others 66.
Fig 7: Profitability ratios across profiled subsectors
As shown in the above graph, the profitability ratio (i.e. the Net Profit Margin ratio) shows
a range between 0.03 for cattle fattening and 0.73 for apiculture and hairdressing.
Explanations for these variations are proffered below, based on issues that emerged
from the assessment. Subsectors such as apiculture and hairdressing clearly show the
highest profitability (NPM ratio 0.73) and as established in the assessment, this is largely
due to low overheads once start-up costs are covered. In apiculture, for instance, after
the injection of the initial start-up capital, the mechanism is self-running; the bees are
attracted to the hives by the bait and very little maintenance is required thereafter.
66 Unless otherwise specified, it is assumed that support levels to the projects in terms of skills training, post-training support vis a vis start-up equipment are broadly similar.
32
This undoubtedly lowers the overheads, and combined with the general affordability of
the protective suits and other materials required in harvesting, apiculture becomes a low
input venture with high output on harvesting of the honey. However, it is worth noting that
the high profits are seasonal. Similarly, as noted under hairdressing, clients would bring
their own braids and chemicals to get their hair done and the hairdresser supplies only
labour and the rented facility (i.e. the chair, dryer and washing basin) some even have
a rent-a-chair arrangement in the salon. This means the cost of procuring materials for
hairdressing such as the hair-pieces and chemicals are removed from the hairdresser’s
recurrent expenditure and there are no further costs associated with the project.
Horticulture also has a high net profit margin (0.7), which can be attributed to the regular
consumption patterns of this subsector’s produce. Horticultural produce, such as tomatoes
and vegetables form a part of everyday meals, hence turnover at the market tends to be
quicker, and huge volumes may also be traded at a time. Indeed, the volumes sold are a
major contributory factor to the high ratio of input costs is spread across a larger output,
providing an economy-of-scale leverage.
Projects in the welding and metal fabrication subsectors, as well as in carpentry and
joinery, tend to thrive where there was access to industrial equipment and where hosting
facilities charge low rentals. This explains the relatively high NPMR for the profiled welding
and metal fabrication projects (0.61) that were based at common facility centres and
had access to equipment and affordable rentals. Other projects, such as potato farming
(NPMR 0.58) are affected in terms of profitability by limited access to markets, where
the producers end up opting for exploitative middle men, who buy their potatoes at low
prices, only to resell them in urban centres at much higher prices.
For poultry production (NPMR 0.44), profitability was lowered by the fact that the young
people had no cold storage facilities for their chickens beyond six weeks of maturity.
This forces them to keep the birds alive until they were bought. This increases the cost
of inputs, particularly feed. As was noted in the assessment, selling of solar products
(NPMR 0.46) is affected by low demand of the products offered, as potential customers
struggle economically in the prevailing environment. This is coupled with a slow but
gradually growing appreciation of the real value of solar powered home gadgets and tools.
The profitability of subsectors such as carpentry and clothing was affected by competition
and high overheads, such as rentals and utility bills. Particularly for carpentry, without
markets beyond the production sites where many other carpenters also manufacture
their furniture, business is bound to be low and thus profitability will be limited. The
clothing subsector was being affected by cheap clothes imports, encouraging clients to
opt for cheaper alternatives.

33
Dairy farming’s profitability is affected by limitations in terms of value addition. Few
consumers consume milk in its raw state, forcing the young dairy farmers to sell to
companies that process and package the milk at depressed prices. It is for this reason
that the NPM ratio is lower than that of other subsectors. Subsectors such as catering
and piggery were also affected by lower on the market, forcing the prices down in order
to stay afloat.
Cattle fattening − the odd one out
As can be seen from the profitability graph above, the cattle fattening project profiled
under this study was the worst performing in terms of profit (NPMR 0.03), with the
following explanation.
¡ Beneficiaries were travelling large distances to the nearest urban centre -
Gwanda in Matabeleland South Province - to sell their live beasts after fattening
them. Travelling with the live beasts means high transport costs and having to
go through the applications for permits to travel with them.
¡ At the market place, the cattle are graded as super grade, but the prices offered
by buyers are at the lower commercial or economy grades, thus fetching lower
prices per kilogram. Because of the hassle of returning the cattle home, the
beneficiaries are compelled to sell at the lower price, just to break even.
So how much is being taken home by the youth?
Save for the cattle fattening project whose shortcomings were touched on above and will
receive more attention in a later section of the report, the profit margins of their ventures
mean that the beneficiaries earn between $0.26 to $0.73 from every dollar worth of
sales, resulting in incomes ranging between $100-$400 per month for the majority of the
beneficiaries in the assessment. Even in considering a median value in terms of income
of $250, accruing to beneficiaries across the subsectors, this is a reasonable income in
view of the conditions of suppressed aggregate demand prevailing in Zimbabwe.

34
The majority of civil servants do not earn beyond $400 per month. It should also be noted
that some of the project beneficiaries are reportedly earning between $1 000-$2 000
per month from their initiatives. Indeed, in an era where loss-making is the order of the
day, even for well-established businesses, the ILO Skills for Youth Employment and Rural
Development Programme in Zimbabwe has provided livelihood alternatives for vulnerable
young people even if the profits are modest.
5.1 Clustering of youth and implications for productivity
It is of interest that the concept of clustering the youth into groups after training to ease
the process of issuing start-up kits for their respective trades has a bearing on venture
productivity. This assessment argues that the variations in the efficiency of the production
processes in the different subsectors affects the number of beneficiaries who are still
members in these groups. The efficiency of the production cycle is dependent on the
ratio of beneficiaries against start-up kits. This assertion is premised on the assumption
that the start-up kits given in each subsector offered the same capacity to start and run
projects. Those subsectors that showed the most efficient use of resources were those
where young people who had been trained dropped out of the post-training ventures. The
subsector most affected by this was poultry, where a total of eight out of a group of ten
who started off in the chicken project at Odzi dropped out for various reasons.
5.2 Employment created by the projects
While the study was unable to establish exact numbers due to sampling and time
constraints, it noted that in terms of employment creation, the primary beneficiary is
the trained young person, who, after training and starting up a venture, will employ an
assistant or two to help with manufacturing or production of the products they are trading.
It was also noted that the additional employees in these new ventures were typically
semi-skilled or totally un-skilled, creating the opportunity for the trained young person to
transfer skills acquired to their new assistants. Hiring costs also limit the recruitment of
seasoned artisans into the youth ventures, particularly in the early days when they yet to
establish a sizeable market share.
A case study demonstrating significant potential for employment generation was observed
in the carpentry subsector, as profiled in the Harare case study. The beneficiary in this
case, now has under his wing a mix of 25 permanent employees with diverse skills sets.

35
Since he has managed to establish an end market for his products, as well as to open
retail shops, he had to take up trained and experienced employees who were already in
the following trades:
¡ Welding and metal fabrication
¡ Carpentry
¡ Joinery
¡ Upholstery
¡ Spring making.
These tradesmen had already been operating from the High Glen home industry in Glen
View, but decided to join the beneficiary since the growth of his venture provided them
with job security and a guaranteed salary. The beneficiary set up his business in such a
way that he purchases all the materials used in the various aspects of manufacturing and
pays for the labour of the tradesmen. He is basically running a low cost manufacturing
labour intensive workshop with limited technology. In this case, good quality employment
was created that is evidenced by his wage bill, which is a reflection of the quality of the
employment created. This case study goes to show the potential in terms of employment
creation within and even across subsectors, with greater influence by youth beneficiaries
on the value chain. The issue of value chains will be discussed in greater detail in a later
section.

36
5.3 Jobs map for the horticulture subsector
In observation of the potential for full and part time labour in the horticultural subsector
− not just for the youth but for surrounding community members − this assessment
made efforts to illustrate the employment creation opportunities at one site under the
programme. The diagram is shown below.
Fig 8: Horticultural ‘jobs map’
According to testimonies of local community members, the ILO Skills for Youth Employment
and Rural Development Programme in Zimbabwe had presented the community with
opportunities to earn income as they were recruited or part-time cultivation. Land
preparation, planting, weeding and harvesting is carried out by the youth beneficiaries.
Local transporters are given contracts to transport products to the market whenever the
need arises. There were testimonies from widows and other vulnerable members of the
community as to how they had also indirectly benefitted from the young people’s initiatives
that were being supported in the programme.

37
5.4 Brief insight into the impact of income changes among programme beneficiaries
It was noteworthy that beneficiaries of the ILO Skills for Youth Employment and Rural
Development Programme in Zimbabwe generally reported that their incomes had
improved since the post-training support to start up their own small business ventures.
In trying to understand and quantify the changes in income, this assessment traced any
changes in movable and immovable assets acquired after their participation in the ILO
initiative. The assessment also interrogated changes in expenditure and in the number
of dependents, as well as in the quality of beneficiaries’ support and contribution to their
dependents. It was first assumed that such changes were a direct result of changes in
income from the young people’s ventures as a result of receiving ILO support, and this
was later confirmed. Changes were seen in the following categories.
(i) Rent and domestic expenses
In general, beneficiaries said they are now able to: contribute more towards household
and other family expenses; be better positioned to buy food and other domestic non-food
requirements; pay school fees for their children, siblings or other dependents. In the
urban areas, most of the beneficiaries were able to move out of their family homes and
wean themselves from parents and guardians to start lives of self-reliance, using income
from the project.
(ii) Health care
Given that health care in Zimbabwe is expensive, most of the beneficiaries reported
that both they and their dependents are now accessing better health care. There were
accounts of now being able to provide for the health needs of their dependents. One
beneficiary narrated being able to take care of her husband’s medical bills, since he was
temporarily incapacitated in an accident in November 2014.
(iii) Buying land and building homesteads
In the rural areas, some of the beneficiaries managed to find places of their own or build
their own homesteads, while others improved their homesteads using the income they
were receiving from their ILO supported ventures.

38
(iv) Marriage
In Zimbabwean culture, young men have to pay a bride-price in order to marry and
young men are socialised to aspire towards this as they grow up. Many young men
attributed the ILO programme to their ability to pay the bride price and start and support
their families, with the blessings of their in-laws.
From the information gathered, both the beneficiaries’ income and the quality of their
lives improved.

39
6. Has it been all rosy? Main challenges to projects’ viability
Indications of viability and provision of tangible livelihood options for youth are noted
despite the country’s difficult socioeconomic environment however, there have also
been challenges and constraints that would need to be addressed in order to avoid
compromising that viability and sustainability. The following section gives details of some
of the challenges.
6.1 Limited value chain and pricing influence:
Owing to various factors, it was clear that project beneficiaries lack sufficient influence
in the value chain of production and retail of finished products or services. This was
revealed when beneficiaries were forced to place themselves at the mercy of unscrupulous
middlemen, who purchased their commodities at very low prices, only to resell them
at a large profit due to better access to markets. Lack of basic transport and storage
facilities such as freezers, the beneficiaries were anxious to dispose of their products
quickly in order to recoup their costs. Thus products that were too heavy or expensive
to transport, such as furniture, or perishables, such as vegetables, milk and meat, were
taken advantage of by middlemen, who reduced their prices. The benefit of being able
to influence the product value chain is demonstrated by the Harare carpentry example
discussed, where the youth beneficiary exerted control over the production distribution
and retail of his products, all to his financial gain. Less fortunate was the Gwanda cattle
fattening project, where they were was compelled to sell their premier beef at only $3.20
per kilogram, yet the intermediary reportedly fetched $7.50 per kilogram.

40
6.2 Value addition hindrances
In most of the subsectors sampled, it was noted that if the beneficiaries added value to
their products, they would exponentially increase their income margins. For instance,
it was noted that the price of dairy products doubled after processing and packaging.
Although the project beneficiaries intimated that they had learned skills in value addition
during their training, they lacked the financial resources to undertake the various
processes. This shortcoming will continue to keep down their financial returns.
6.3 Legal registration and designated work-space hurdles
In the case of the urban beneficiaries, an over arching challenge is the failure of the youth
to set themselves up in designated places. They cited bureaucracy and prohibitive costs
in registering and securing designated workspaces. The net effect of failing to secure
designated workspace has resulted in continual collisions with municipal and other
authorities enforcing by-laws that disallow doing business in undesignated areas. The
amount of time lost in hiding or running away from municipal authorities is productive
time lost in the business, which inevitably has a negative effect on revenue. Operating
from designated places also provides access to peak client volumes. Furthermore,
undesignated workspaces may not have the requisite facilities and amenities such as
water and sanitation and electricity that also influence productivity.
6.4 The inadequacy of the start-up kits
The startup kits and/or capital were seen as critical for getting the beneficiaries to start off
the ventures in which they had received training. This concept was deemed to be more
holistic in comparison with other youth skills development initiatives, where young people
were simply trained and then expected to get started in their new business. However,
a few challenges were noted, with the first one being the inadequacy of the equipment
provided. As illustrated by a group of young people trained in catering in the city of
Bulawayo, getting started as caterers required industrial/heavy duty cooking equipment
rather than what had been provided. This was compounded by the fact that up to ten
young people were clustered around the project equipment, so that making effective use
of these already scarce resources became even more difficult. While some beneficiaries
made the best use of what was availed, not all the youth were interested in starting up
ventures. Others would hold on to equipment, or even sell it, at the expense of those young
people who genuinely wanted to set up their own ventures. In other instances, members
of the same group lived far away from each other, making access to components in the
already limited start-up kit even more difficult for some of the youth. While the challenge

41
of access to industrial equipment was solved with respect to the Common Facility Centres
for carpentry, joinery and metal fabrication at the time of the assessment, there was no
similar model for those in catering and related services. In the next section, a suggestion
is proffered as part of strategies to mitigate the challenges identified.

42
7. Strategies for mitigating challenges
7.1 Strengthening value chain benefits for young people running ventures
This section of the report reflects on possible strategies to deal with some of the challenges
faced by youth beneficiaries as they venture into their own initiatives post training. In the
first instance, for as long as young people running their own ventures continue to focus
on primary production and do not seek to establish links with the market beyond that
level of interface, they will continue to ‘feed’ their products to middle men, who offer
exploitative prices. Deliberate efforts to establish links with the market therefore becomes
a key factor in ensuring better value for products, a process that will naturally affect
the value chain. The youth probably need post-training support on market linkages and
appreciation of value chain analysis vis a vis leveraging for opportunities to get better
value for their products. The elimination of the unscrupulous middle man, or at least
managing them so that they do not dictate market prices is central to devising a winning
strategy in the context of the youth ventures.
The use of common facilities might also be useful in closing the gap between producers
and the market. Synergies need to be encouraged among the beneficiaries in similar or
related trades. For example, the transport challenge can be addressed by potato farmers
hiring a common truck to ferry their produce and sharing the transport costs, just as
the participants in projects in Mutoko and Murehwa were doing. The beauty of using
common facilities, such as the truck, is that costs are split, without reducing the produce
revenue.
7.2 Value addition as a strategy
As already implied, value addition (coupled with the market linkages already discussed)
is one of the best ways of ensuring that young people benefitting from the ILO programme
get optimum value for their products. The imperative to procure value–addition equipment
and set up the appropriate operating facility is paramount for institutions concerned with
establishing sustainable livelihood initiatives for young people, especially from the skills
development perspective. Regarding the challenges of operationalizing value addition
processes, the youth may stand a more realistic chance if they work from the same places
43
where possible, where the relevant industrial equipment might be centralised. In reality,
the purchase of the heavy duty equipment that might be necessary for value addition is
only be sustainable for any funder, when approached from a shared perspective. The
more youth who can converge to a common place for various value addition processes,
the more cost-effective it is for them to access the technology, while still controlling their
individual ventures. In this respect, efforts such as that in Mutoko and Murehwa to
provide a value-addition facility under the programme, is worthy of mention. It would be
beneficial if this approach could be adopted across the other subsectors.
7.3. Cluster-based Common Facility Centres
It goes without saying that in the context of limited resources there is a need to support
young people with equipment to make their enterprises more viable. The idea of
common facility centres might be the most appropriate. Premised on clusters of related
projects, such as carpentry and joinery, or steel fabrication and welding, such facilities
pool industrial machinery and equipment and provide the youth entrepreneurs with an
opportunity to access the equipment to the benefit of their production processes. It is
noteworthy that the ILO has developed and implemented such an innovative model in
the city of Bulawayo, where a ‘manufacturing’ Common Facility Centre is fully operational.
The Bulawayo facility was structured to act as a manufacturing hub for wooden and metal
furniture-makers. It is fully endowed with industrial equipment that is open for use among
the ILO programme beneficiaries, including the Master Craftspersons, at a nominal fee,
and to other outsiders at a fee as well.
Components of the CFC in this cluster are:
¡ Industrial equipment for carpentry and metal fabrication
¡ Work stations
¡ Exclusive specialized machinery operators
The beneficiaries and Master Craftspersons bring their materials to the facility, perform
the required process, pay the service fee to the facility and go back to their workshops for
finishing and assembling the final product. The fees thus accumulated take care of the
facility’s operational costs, such as rentals, utility bills, maintenance of equipment and
attendants’ salaries. It is also envisaged that this fee will be used to procure additional
machines, as well maintaining the equipment. Exclusive specialized machinery operators
guarantee the efficient use and maintenance of the equipment that is used communally
by the beneficiaries.
44
The CFC is playing a critical role in improving the quality of products, enhancing productivity
and increasing income for the beneficiaries. This means more business, more income
and more employment opportunities for other young people in these ventures. In view of
the vast advantages of such a model, this could be replicated in areas where beneficiaries
of the training programme are based, clustering relevant subsectors. Another example is
home décor and clothing, which both require industrial sewing machines, over-locking
machines and other related equipment. Hairdressing and cosmetology could form another
cluster, with the CFC taking the nature of, say, a beauty parlour/salon in the central
business district. Each of the young people working in that facility would then contribute
towards meeting the overheads, such as rentals and utilities, from the income generated
while working and sharing the facilities within the CFC. In this light, it is commendable
that the project has already embraced this thinking and has also established a CFC for
the Clothing subsector in Marondera district. The project has also purchased machines
for establishing carpentry CFCs in GlenView (Harare) and Mutare (Manicaland), as well
as more machines for the Bulawayo CFC. Operationalization of the planned CFCs will
serve an extremely valuable purpose for the youth under the project.
7.4 Envisaging an agricultural/food supply chain common/collective sales point
While common facility centres seem easier to envisage from the perspective of
manufacturing, a common sales facility that maximizes linkages of agricultural products
to the market would also be beneficial. Such a facility could be thought of as linking
primary agricultural production with the food supply chain; a place where young people
in horticultural production, cattle fattening, dairy or any other related production can
showcase their products for a more or less guaranteed market. Figures 10 and 11 attempt
to give a visual illustration of how such a facility could look and work.

45
Fig 10: Proposed common facility centre (agriculture sector)
To illustrate how such a facility could work, think of a man and a woman walking into
the facility. Here they are able to buy affordable lunch, which they can sit in and enjoy in
comfort. The woman can buy fresh farm produce for her family’s evening meal, as well
as meat from the butchery. She can also buy fresh milk or fish, processed meat, such as
biltong (dried ready-to-eat beef fillets). They could also have a lunch of barbecued meat,
quickly done at the barbeque facility within the facility.
The rationale behind such a facility being a ‘common sales point’ in the agricultural cluster
is given below. The kitchen facility can be operated by young people trained in catering
who will run the kitchen as a franchise/independent company. They will be responsible
for its viability and maintain separate books of accounts. The kitchen can also operate
in arrangement with other young producers trained under the programme, so that the
horticulturalists supply them with tomatoes, onions, potatoes and other vegetables, The
young people venturing in cattle fattening will supply the kitchen with good quality meat
at competitive rates, while also supplying the butchery side of with meat for sale to the
general public. The same will apply to the poultry and dairy producers.
There could even be other spin-off opportunities for youth trained in the other subsectors.
For instance, the facility might need welders to enhance security through the installation
of burglar bars or reinforcing doors that give access to various units in the facility. A young
person trained in motor mechanics and operating a truck could be hired for transport of
produce from the points of production to the facility.

46
Those venturing into carpentry and joinery could be contracted to manufacture the
furniture for the eating and sales areas. This example, in simplistic terms, provides a
basis for such a CFC, showing how it could create an ecosystem of supply and demand
that guarantees both markets and better value for the trained young people across the
various subsectors.
Each component is run as a franchise/independent business and the youth whose
ventures are housed in such a facility then contribute to the overheads and utilities. To
strengthen their business management, the young people in the various franchises could
then opt to have a common finance and administrative unit that manages their finances
based on separate accounts. This would make it cheaper to pay for such critical services
to the sustainable running of the facility. The figure on the next page attempts to give a
two dimensional artistic impression of how the facility would look.

47
Fig 11: Agricultural supply chain in common sales point facility

48
This assessment argues that such a facility can provide a holistic market linkage mechanism
that interconnects young people in agricultural and food supply chain ventures across the
project’s economic subsectors. These linkages among the subsectors have also been
demonstrated above. Common industrial equipment, such as cold rooms required by the
milk producers, the meat fatteners and the horticulturalists will be provided. Industrial
stoves and food preparation equipment can also be installed and accessed by the
relevant young entrepreneurs operating from the facility centre. With a vibrant business
management unit in terms of finance and administration, the chances of unsustainability
and non-profitability for such as facility are minimal, assuming it is in a strategic location.
Lessons could be drawn from a privately run yet related facility called Halfway House
located about 133km in the eastern direction from the capital Harare towards Mutare.
For the young people housed in the facility, the process of acquiring the necessary
licensing to operate would be eased, as it will be done under the banner of the facility.
This model will also address the challenges of operating in undesignated areas, especially
for the youth in the agricultural value chain.

49
8. Concluding remarks and key lessons learnt
This subsector assessment has explored a number of projects under the ILO Skills
for Youth Employment and Rural Development Programme in Zimbabwe in terms of
profitability, productivity and efficacy in creating tangible socioeconomic opportunities
for youth. Based on empirical evidence and the analysis in this study, the efficacy of the
initiatives under the programme, particularly in a difficult socioeconomic environment
such as exists in Zimbabwe cannot be over-emphasized. With evidence of improvements
in income, however modest, and subsequent improvement in quality of life among
beneficiaries of the training programme, the relevance of the initiative is undeniable.
In exploring the various challenges being encountered by the programme’s beneficiaries
following their training and as they endeavour to establish their own ventures, the
assessment has created a basis for supporting activities, especially though provision of
clustered CFCs to provide the young entrepreneurs with working places and links with
markets.
The ILO has practically addressed the important socioeconomic needs of vulnerable young
people in Zimbabwe. Such an initiative, should be continued coupled with a greater role of
both the public and private sectors and by way of financial, technical and administrative
support. For the purposes of related future programming, however, there are a number
of key lessons that need to be taken cognizance of vis-à-vis the determinants of success
or failure of the projects.

50
9. Determinants of the success and/or failure of projects
9.1 Determinants of Success
9.1.1 The Skills component of the programme
What has emerged as key to both the start-up, as well as the success and viability of the
youth projects profiled in the assessment, is the enablement of skills acquisition for the
various young people. In virtually every case, the vulnerability of the youth beneficiaries
and their lack of sustainable livelihood options was anchored in their having no skills
for either employment or for setting up their own initiatives. The ILO Skills for Youth
Employment and Rural Development Programme in Zimbabwe clearly reversed this
predicament, by providing various forms of training from the formal at vocational training
centres, to the informal, through agricultural extension workers right through to informal
apprenticeships. These core skills combined with all, or some of the elements mentioned
below led to the successes recorded.
9.1.2 Age and maturity of beneficiaries
It was noted that across all subsectors, beneficiaries aged between 28 and 32 years had
started projects that were relatively more stable and sustainable compared to those of
younger beneficiaries. Even through the rough patches where their ventures struggled for
viability, the older beneficiaries managed to soldier on. The socioeconomic responsibilities
they face, including young families and an increase in the number of dependents, are
probably one of the influences behind their attitude towards the training and all that
followed. Maturity, which does not always necessarily come with age becomes a key
success determinant among the beneficiaries.
9.1.3 Access to equipment
Beneficiaries trained under the QIA methodology, who had access to facilities with
equipment managed to continue operating by applying the skills they had acquired. The
availability of industrial equipment at affordable rates proved a key contributor to success
for the beneficiaries. Common facility centres such as the one in Mpopoma in Bulawayo,
virtually guarantees the success of beneficiaries’ projects.
51
9.1.4 Business management training
Financial management and appreciating the value of every dollar a project makes was
seen to be a key success determinant of the youth ventures. Beneficiaries given business
training though the ILO intervention had better organised projects, that were better
managed financially, as well as being more sustainable.
9.1.5 Level of vulnerability/need of beneficiaries
Those beneficiaries who entered into the programme with virtually no other alternative,
seemed establish relatively more successful and sustainable ventures when compared to
their counterparts. Thus, the levels of vulnerability and need on the part of the beneficiaries,
therefore become key determinants in both the retention of beneficiaries, as well as their
subsequent establishment of successful ventures following the training. The targeting of
the project beneficiaries based on the criteria of vulnerability has worked well, with the
majority of the beneficiaries using their skills to generate income for themselves and their
families.
9.2 Causes of failures and dropouts
9.2.1 Proximity to borders
In border towns, beneficiaries tended to leave projects to look for greener pastures in
neighbouring countries. There is a general belief that life is better on the other side and
this is the motivating factor of leaving the projects. The key lesson here is that projects
close to borders will likely have high attrition rates, for as long as the socioeconomic
environment in the country is perceived to be worse than that in neighbouring countries.
In some cases, the beneficiaries went to South Africa on completing their training, and it
is reported that the skills they acquired helped them obtain decent jobs in South Africa.
9.2.2 Impatience of beneficiaries
It is of importance to note that in general, the young people tended to be impatient.
They look for opportunities that bring quick results in terms of income, to solve their
socioeconomic problems. So beneficiaries tended to leave the slower, projects offering
longer-term solutions. This is the reason for the few cases the start-up kits were sold, as
the youth involved looked for quick financial returns.

52
9.2.3 Lack of start-up capital/post-training support
Access to finance for setting up a new business is a crucial factor for those venturing
into self-employment. In subsectors such as Arts and Crafts, failure to access start-up
capital or credit lines crippled the chances of the beneficiaries applying their acquired
skills. In other subsectors, beneficiaries failed to scale up or improve on their production
processes because they did not have the means or credit or the benefit of post-training
support.
The project tried to piloted access to finance by setting up a skills fund with two
microfinance institutions (MFIs), namely Microking and the Women Development and
Credit Union (WDSCU). However, the MFIs did not deliver the services to the beneficiaries
according to expectations. The Microking fund was withdrawn, while the other MFI used
the funds for other purposes and did not return them to the ILO. Nonetheless, it should
be noted that microfinance plays a catalytic role in setting up and expanding businesses
and its lack will leave beneficiaries at subsistence level.
9.2.4 Spread and ownership of start-up equipment
Beneficiaries were placed in groups of about five and provided with start-up kits. They
were not given access to premises where they could practice their trade as a group, using
the start-up kits, which resulted in problems. Accountability for equipment is difficult
to establish and enforce, especially where the youth have no common place in which
to work and share the equipment. In a few cases, equipment went missing while in
others, beneficiaries had difficulty in using the toolkits collectively, as they got involved in
arguments over who would use it and when.

53
Annex: Assessment of the economic subsectors
A. Carpentry and joinery
Under the carpentry subsector, two supported projects were assessed, one in Bulawayo
and the other in Harare. The outputs from the assessment of the projects are given below:
1.1 Project 1: Bulawayo
Revenue flows from the first carpentry project profiled in Bulawayo were shown to be
fairly stable, with the beneficiary making an average of four wardrobes a month, plus a
few other furniture items, which were not selling as consistently. Two types of wardrobes
were produced. The market value of the lower priced wardrobe is set at $100 and that of
the higher priced wardrobe at $200. The beneficiary sells an average of three low priced
wardrobes and one of the higher priced each month. Total monthly revenue accruing
from sales stood at $500 on average. The cost structure of this business comprised the
materials used in manufacture, plus rentals. The rentals are inclusive of electricity, water
bills and refuse collection. These costs are broken down as shown below:
¡ Rentals $100
¡ Timber $30
¡ Boards $100
¡ Cutting costs $10
¡ Part-time labour costs $40
¡ Other materials $20
Total costs as per the account given came to a sum total of $300.

54
Profit margin for this enterprise was recorded at $200 per month. Calculation for the net
profit margin is as shown below.
Net Profit Margin=
200
500
= 0.40
This means that for every $1 of sales, the project has a return of $0.40, in other words,
each dollar sale is bringing in 0.40 cents of income.
Calculation of the productivity ratio therefore, given revenue of $500 against the total
costs that the business incurred of $300 is as follows.
Productivity Ratio=
500
300
= 1.67
Thus every dollar of inputs generates $1.67 of revenue, reflecting that every unit of input
employed contributes an excess of 67 per cent to the output. Based on the earlier criteria
of a Net Profit Margin Ratio greater than 0.1, this project was noted to be technically
profitable, as well as running efficiently.
1.2 Project 2: Harare
In comparison to the Bulawayo case, a beneficiary in Harare, operating from the High
Glen home industry site ran a more robust and highly organized operation. This operation
produces a wide range of furniture items, including beds, wardrobes, room dividers,
two-piece kitchen units and dining suits. He has secured stable and reliable markets
in Matabeleland North, with a long-term contract, and managed to open his own shop
in Mhangura town, in Mashonaland West province. Total revenue received from his
operations averages $15 000 a month broken down as per information supplied below.
¡ Matabeleland North $10 000
¡ Mhangura $5 000

55
The business costs are: labour costs, rentals, transport and material costs. Materials
include galvanized pipes, timber, bison boards, springs, fabric and other consumables.
The costs are broken down as shown below.
¡ Rent $100
¡ Materials $7 000
¡ Labour $3 615
¡ Transport $540
Total costs faced by the enterprise translate to an average $11 255 per month.
Profit margin for this enterprise amounts to $3 745 per month on average.
Net Profit Margin=
3 745
15 000
= 0.25
Thus, for every $1 of sales the beneficiary has a return of $0.25. Every dollar of sales is
bringing in 0.25 cents of income.
As shown earlier, the venture’s costs were calculated at $11,255, while revenue was
$15,000 per month. The productivity ratio calculation as shown below is therefore:
Productivity Ratio=
15 000
11 255
= 1.33
Thus, every dollar of inputs generates $1.33 of revenue. The ratio reflects that every unit
of input contributes an excess of 33 per cent to the output.
Based on the criteria of a net profit margin ratio of greater than 0.1 and a productivity
ratio of greater than 1, this project was identified as both profitable and running efficiently.
However, due to higher operational costs, it was observed to have a relatively lower net profit
margin (0.25) than the Bulawayo venture (0.40). Despite this, this beneficiary benefits
from higher turnover and broader market links, giving him a comparative advantage and
a much bigger net monthly profit than Bulawayo venture.

56
B. Poultry production
The project visited in Odzi district in Manicaland province had a chicken run catering
for 150 birds. In a 10-week operating cycle 67, the beneficiaries received a revenue of $1
050. Each bird is sold at a price of $7.
Business costs include stock-feed purchases, vaccines, purchase of day old chicks,
electricity, to provide light and warmth for the chickens, and food for business operators
while at work. The cost breakdown is shown below.
¡ Day-old chicks $135
¡ Stock feeds $370
¡ Vaccines $21
¡ Electricity $50
¡ Food $15
The total costs faced by the project in one production cycle were $591. Against the
revenue of $1 050 received, the project’s profit was $459. The net profit margin is
calculated below.
Net Profit Margin=
459
1 050
= 0.44
Thus for every dollar of sales, the project is making a return of $0.44.
As indicated above the revenue was $1 050, while costs came to $591. The productivity
ratio is therefore as follows.
Productivity Ratio=
1 050
591
= 1.78
67 The beneficiaries reported that after the 6 weeks of rearing the chickens to maturity, it took 4 weeks to sell all of them. However, if they had refrigeration facilities they could slaughter the mature birds and store them, but instead they were forced to continue feed them till they could find buyers

57
This means that every dollar of inputs generates $1.78 worth of revenue. In other words,
every input employed contributes an excess of 78 per cent to the output. Therefore,
based the criteria of a net profit margin ratio greater than 0.1, and having a productivity
ratio of greater than 1, this project was technically profitable as well as running efficiently.
C. Hair Dressing
The revenue and cost structure for those in this subsector was fairly straightforward.
At the Mutare project visited, the only costs incurred were those of renting a chair and
labour costs. The cost of renting incorporates other costs like city council levies and
electricity. Chair rental was $80 and labour costs average $30 per month on average.
The average revenue received in each month is $400. The profit from such operations
is therefore $290. A calculation of the net profit margin for the venture is shown below.
Net Profit Margin=
290
400
= 0.73
In this regard every dollar the beneficiary is spending is bringing them a return of $0.73.
With the costs incurred, the productivity ratio is therefore as below:
Productivity Ratio=
400
110
= 3.64
This means that every dollar worth of inputs generates $3.64 of revenue. Thus every
input employed contributes an excess of 264 per cent to the output. Based on the set
criteria net profit margin ratio greater than 0.1 with a productivity ratio of greater than 1,
this project was technically both profitable and running efficiently.
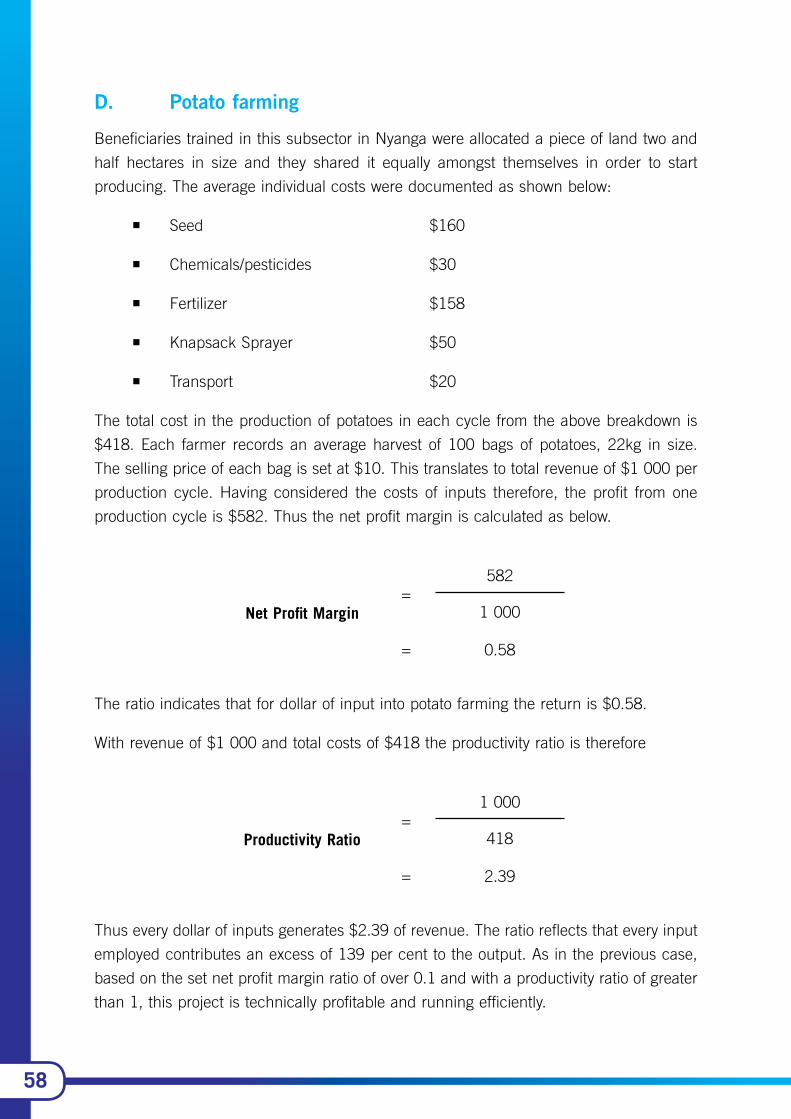
58
D. Potato farming
Beneficiaries trained in this subsector in Nyanga were allocated a piece of land two and
half hectares in size and they shared it equally amongst themselves in order to start
producing. The average individual costs were documented as shown below:
¡ Seed $160
¡ Chemicals/pesticides $30
¡ Fertilizer $158
¡ Knapsack Sprayer $50
¡ Transport $20
The total cost in the production of potatoes in each cycle from the above breakdown is
$418. Each farmer records an average harvest of 100 bags of potatoes, 22kg in size.
The selling price of each bag is set at $10. This translates to total revenue of $1 000 per
production cycle. Having considered the costs of inputs therefore, the profit from one
production cycle is $582. Thus the net profit margin is calculated as below.
Net Profit Margin=
582
1 000
= 0.58
The ratio indicates that for dollar of input into potato farming the return is $0.58.
With revenue of $1 000 and total costs of $418 the productivity ratio is therefore
Productivity Ratio=
1 000
418
= 2.39
Thus every dollar of inputs generates $2.39 of revenue. The ratio reflects that every input
employed contributes an excess of 139 per cent to the output. As in the previous case,
based on the set net profit margin ratio of over 0.1 and with a productivity ratio of greater
than 1, this project is technically profitable and running efficiently.

59
E. Solar Energy project
While project beneficiaries trained in solar energy systems had not installed any household
solar system due to the high cost implications on the part of clients, particularly in rural
areas, they had, however, used their training and the support they were given within the
project to get into solar lantern merchandising. Their costs were largely those of transport
and purchasing the lanterns. On average, a project beneficiary in this subsector supplies
four lanterns a month.
Costs involved are as below.
¡ Purchase price for four lanterns $120
¡ Transport $9
The total costs incurred per month on average are therefore $129. The revenue realized
from the selling of the lanterns was noted to be an average of $240 a month, with 4
lanterns sold at $60 each. Therefore, the profit from the venture is $111. Calculation of
the net profit margin yields the results below.
Net Profit Margin=
111
240
= 0.46
From the sale of lanterns a project beneficiary trained in this subsector gets a return of
$0.46 on every dollar they spend.
Given the costs and revenue presented above the productivity ratio would then be:
Productivity Ratio=
240
1.29
= 1.86
Thus every dollar of inputs generates $1.86 in revenue. In other words, the ratio reflects
that every input employed contributes an excess of 86 per cent to the output. Based on
a net profit margin ratio greater than 0.1 and with a productivity ratio of greater than 1,
this project is technically profitable, as well as running efficiently.

60
F. Clothing
In assessment of the project beneficiary in Bulawayo who was profiled, it was noted that
an average of 12 outfits are produced for various clients in each month. The associated
cost of the production of the outfits is the rentals for the building where the trained
beneficiary (designer) works. Clients provide their own materials, while the beneficiary
applies their expertise in the design and actual sewing of the garments. The rental
expenses are inclusive of town council levies and electricity, amounting to $200 per
month. For producing an outfit, the designer is paid $25 and total revenue per month
would therefore amount to $300. With costs factored in, the profit would be $100 a
month.
This gives a net profit margin of:
Net Profit Margin=
100
300
= 0.33
Thus for every dollar spent, the beneficiaries reap a return of $0.33.
The calculation of productivity ratio then yields the following result.
Productivity Ratio=
300
200
= 1.50
Thus, every dollar of inputs generates $1.50 of revenue. In other words, the ratio reflects
that every input employed contributes an excess of 50 per cent to the output. Based on
the set criteria of a net profit margin ratio greater than 0.1 and having a productivity ratio
of greater than 1, this project was technically both profitable and running efficiently.

61
G. Home Décor
The project beneficiary profiled from this subsector was working primarily from her family
home and so her costs were those for electricity and cost of materials, with the breakdown
as below:
¡ Material $75
¡ Electricity $10
The total cost of $85 corresponds to the costs faced by the project in the last month
of business. In this same month, revenue was $220 and so the profit was $135. This
resulted in a net profit margin of:
Net Profit Margin=
135
220
= 0.61
Therefore, every dollar of sale in the business results in a profit of $0.61.
The productivity ratio was
Productivity Ratio=
220
85
= 2.59
Thus every dollar of inputs generates $2.59 in revenue. This reflects that every input
employed contributes an excess of 159 per cent to the output. Based on the set NPR
criteria and with a productivity ratio of greater than 1, this project was technically profitable
and running efficiently.

62
H. Livestock production and cattle fattening
The beneficiaries profiled under this particular subsector were from Gwanda and had
been practicing cattle fattening and had managed one production cycle since their
training. The costs up to the point of sale were as follows:
¡ Costs of purchasing cattle $800
¡ Cost of feeds $140
¡ Cost of medicines $50
¡ Cost of transport $20
¡ Allowance for maintenance of cattle pen $30
Total costs of the 45-day 68 production cycle were $1 040. The two cows that were fattened
had a combined weight of 334kg and were sold at $3.20 a kilogram. The total revenue
received was thus $1 068.80 and the profit was $28.80 leaving a net profit margin of:
Net Profit Margin=
28.80
1 068.80
= 0.03
Therefore, the beneficiaries reaped $0.03 from every dollar worth of sales in their first
production cycle.
The resulting Productivity Ratio is therefore:
Net Profit Margin=
1 068.80
1 040
= 1.03
This means that every dollar worth of inputs, the project generates $1.03 worth of
revenue, reflecting that every input employed contributes an excess of three per cent to
the output. Based on the set net profit margin ratio of being greater than 0.1 and with a
productivity ratio of greater than 1, this project was not profitable and was running close
to inefficiency.
68 Beneficiaries had not completed the 90-day cycle

63
I. Dairy farming
Based on the project profiled under this subsector, in Makoni district of Manicaland
province, production was mainly of fresh milk and beneficiaries sold an average of 200
litres a month at $1.00 a litre. The costs that go into the business include stock feeds,
artificial insemination and employee’s salary of the employee. The breakdown is below.
¡ Stock feeds $84
¡ Hay $5
¡ Artificial insemination $30
¡ Part-time pen maintenance labour cost $30
Total cost incurred in the production cycle is therefore $149 and with the total revenue
at $200, average profit realized per month would be $51. The net profit margin therefore
becomes:
Net Profit Margin=
51
200
= 0.26
This means that for every dollar sale the beneficiaries return is $0.26.
The Productivity Ratio therefore becomes:
Productivity Ratio=
200
149
= 1.34
Thus every dollar of inputs generates $1.34 of revenue, reflecting that every input
employed contributes an excess of 34 per cent to the output. Based on the criteria of an
NPMR greater than 0.1 and having a productivity ratio of greater than 1, this project was
technically profitable, as well as running efficiently.
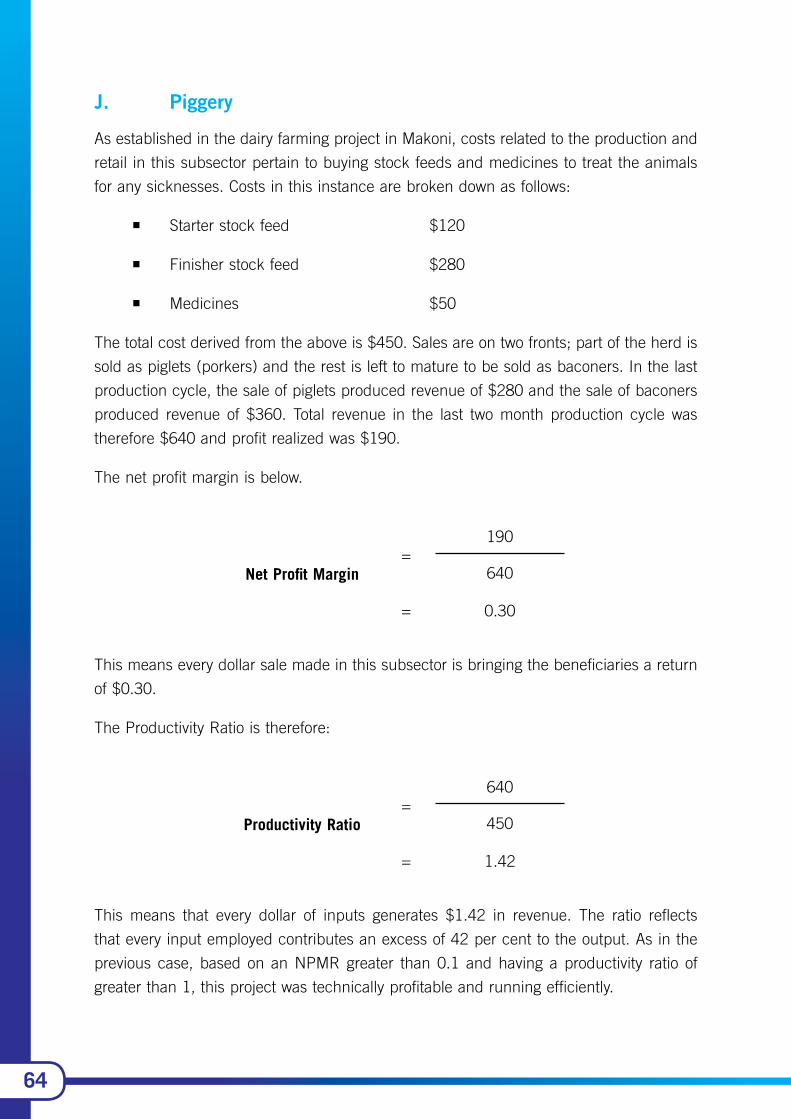
64
J. Piggery
As established in the dairy farming project in Makoni, costs related to the production and
retail in this subsector pertain to buying stock feeds and medicines to treat the animals
for any sicknesses. Costs in this instance are broken down as follows:
¡ Starter stock feed $120
¡ Finisher stock feed $280
¡ Medicines $50
The total cost derived from the above is $450. Sales are on two fronts; part of the herd is
sold as piglets (porkers) and the rest is left to mature to be sold as baconers. In the last
production cycle, the sale of piglets produced revenue of $280 and the sale of baconers
produced revenue of $360. Total revenue in the last two month production cycle was
therefore $640 and profit realized was $190.
The net profit margin is below.
Net Profit Margin=
190
640
= 0.30
This means every dollar sale made in this subsector is bringing the beneficiaries a return
of $0.30.
The Productivity Ratio is therefore:
Productivity Ratio=
640
450
= 1.42
This means that every dollar of inputs generates $1.42 in revenue. The ratio reflects
that every input employed contributes an excess of 42 per cent to the output. As in the
previous case, based on an NPMR greater than 0.1 and having a productivity ratio of
greater than 1, this project was technically profitable and running efficiently.

65
K. Welding and metal fabrication
The beneficiary whose venture was profiled for this subsector was housed at a vocational
training centre in Bulawayo. His overhead costs were comprised of nominal rentals, cost
of materials and labour. These were broken down as follows:
¡ Rent $25
¡ Materials $80
¡ Part-time wage $30
Total cost in this enterprise in the last month of operations was $135. As per the financial
records the total revenue was $350 and the profit was $215. To this effect the net profit
margin is as below.
Net Profit Margin=
215
350
= 0.61
On average, the beneficiaries get a reward of $0.61 from every dollar of sales they make.
The Productivity Ratio for this particular venture is:
Productivity Ratio=
350
135
= 2.59
This means that every dollar worth of inputs generates $2.59 worth of revenue. The ratio
reflects that every input employed contributes an excess of 159 per cent. Therefore,
based on the set criteria of an NPMR greater than 0.1 and having a productivity ratio of
greater than 1, this project was technically profitable, as well as running efficiently.

66
L. Catering
At the catering project visited under the assessment, the beneficiary sells an average of
800 plates of food per month at a dollar per plate. The costs related to the operations
include labour, utility bills and cost of ingredients used in the preparation of food. The
costs are broken down as follows:
¡ Labour cots $100
¡ Levies and utility bills $15
¡ Cost of ingredients $400
The total monthly costs for the project were $515 and the revenue received was $800.
Thus, the profit is $285. The net profit margin therefore becomes:
Net Profit Margin=
285
800
= 0.36
Thus, on average, the beneficiary gets a reward of $0.36 from every dollar sale made.
The Productivity Ratio is then calculated as:
Productivity Ratio=
800
515
= 1.55
This means that every dollar of inputs generates $1.55 revenue. The ratio reflects that
every input employed contributes an excess of 55 per cent to the output. Based on the
set criteria of an NPMR greater than 0.1 and with a productivity ratio of greater than 1,
this project was technically profitable, as well as running efficiently.

67
M. Horticulture
Under this economic subsector, two projects were assessed, with the first being in the
Macheke area of Murehwa district of Mashonaland East province, while the other project
was in Mutoko district of the same province. The Macheke project concentrates on tomato
production while the one in Mutoko has a crop rotation of rape, carrots and ground nuts.
The cost structure for the Macheke project is as given below.
Macheke Project
¡ Seed $70
¡ Fertilizer $1 162
¡ Chemicals $968
¡ Wages for part-time labour $100
¡ Power costs $1 040
¡ Rent $250
The total cost, for a three month production cycle according to the account presented by
the project beneficiary, is $3 590. With an average land size of one hectare of production,
after a three-month production cycle, the expected harvest is 800 crates of tomatoes (each
crate being about 30kg in weight). The selling price of tomatoes fluctuates drastically in
response to market supply. When the market is saturated, prices drop as low as $4
per crate and when the market is in short supply, price rises as high as $30. For the
purposes of the study the average price of $17per crate, as confirmed by the beneficiaries,
was used. This resulted in revenue from the tomato venture in the previous production
cycle being $13 600 and the profit therefore, factoring in the costs mentioned above, is
$10 010.
Net Profit Margin=
10 010
13 600
= 0.74
Thus for every dollar of sales, the project is making a return of $0.74.

68
The revenue was $13 600 and the cost was $3 590. The productivity ratio is therefore:
Productivity Ratio=
13 600
3 590
= 3.79
This means that every dollar of inputs generates $3.79 of revenue. The ratio in reflects
that every input employed contributes an excess of 279 per cent to the output. Based on
the criteria of an NPMR greater than 0.1 and having a productivity ratio of greater than
1, this project was technically profitable and running efficiently.
Mutoko Project
The cost structure as presented by the profiled beneficiary in Mutoko is shown below.
¡ Seed $123
¡ Fertilizer $358
¡ Chemicals $56
¡ Part-time labour costs $100
¡ Power costs $320
¡ Transport $935
The total cost from the last four month production cycle was noted to be $1 892. The
beneficiary’s horticultural venture was on a half-a-hectare portion of land, which was
further sub-divided into four, with a quarter portion growing carrots, another quarter
planted with rape (kale) and groundnuts on the remaining half portion. In each production
cycle the average revenue from the sale of the rape crop is reportedly $2 250; revenue
from sale of carrots is $1 800; and revenue from the sale of groundnuts is $1 280. This
implies that revenue from one production cycle of $5 330 and the profit is $3 438.
Calculation of the Net Profit Margin is therefore:
Net Profit Margin=
3 438
5 330
= 0.65
Thus for every dollar of sales the project is making the return is $0.65.

69
With revenue at $5 330 and costs amounting to $1 892. Calculation of the Productivity
ratio is therefore:
Productivity Ratio=
5 330
1 892
= 2.82
Every dollar of inputs generates revenue of $2.82. The ratio therefore reflects that every
input employed contributes an excess of 182 per cent to the output. Thus, based on an
NPMR greater than 0.1 and with a productivity ratio of greater than 1, this project was
technically profitable and running efficiently.
N. Apiculture
Apiculture holds some interesting details about its cost structure and return. As a subsector,
it proved to be the least capital and labour intensive venture among those reviewed. In an
account given by a beneficiary from the Chimanimani district of Manicaland province, the
start-up costs were as follows:
¡ Bee hives $132
¡ Bee suit kit $65
¡ Bees wax $10
¡ Bee smoker $8
¡ Bee brush $3
¡ Bee knife $3
¡ Bucket $5
The total set-up costs, according to the profiled beneficiary amounted to $226. With
each beneficiary having an average of 11 hives per four-month production cycle, the
expected harvest per hive is 25 kilograms of honey. From 11 hives, this translates to
275 kilograms, with a selling price of $3 per kg for unprocessed honey and $6 per kg
for processed honey. Since the amount of honey harvested after processing could not be
established, this assessment used the values given for unprocessed honey.

70
This gives revenue from one production cycle of $825, with a profit of $599 and a net
profit margin as below:
Productivity Ratio=
599
825
= 0.73
Thus for every dollar of sales the project is making a return of $0.73.
With revenue of $825 and costs at $226, the productivity ratio is below
Productivity Ratio=
825
226
= 3.65
Thus every dollar of inputs generates $3.65 in revenue. The ratio reflects that every input
employed contributes an excess of 265 per cent to the output. Based on an NPMR
greater than 0.1 and with a productivity ratio greater than 1, this project was technically
profitable and running efficiently.

71
Notes
.......................................................................................................................................
.......................................................................................................................................
.......................................................................................................................................
.......................................................................................................................................
.......................................................................................................................................
.......................................................................................................................................
.......................................................................................................................................
.......................................................................................................................................
.......................................................................................................................................
.......................................................................................................................................
.......................................................................................................................................
.......................................................................................................................................
.......................................................................................................................................
.......................................................................................................................................
.......................................................................................................................................
.......................................................................................................................................
.......................................................................................................................................
.......................................................................................................................................

72
Notes
.......................................................................................................................................
.......................................................................................................................................
.......................................................................................................................................
.......................................................................................................................................
.......................................................................................................................................
.......................................................................................................................................
.......................................................................................................................................
.......................................................................................................................................
.......................................................................................................................................
.......................................................................................................................................
.......................................................................................................................................
.......................................................................................................................................
.......................................................................................................................................
.......................................................................................................................................
.......................................................................................................................................
.......................................................................................................................................
.......................................................................................................................................
.......................................................................................................................................

Design & Layout by Tinashe Moses - Greenedge Consultants

ILO Country Office for Zimbabwe and Namibia8 Arundel Office Park, Norfolk Road,
Mount PleasantP.O. Box 210, Harare, Zimbabwe
Tel: +263 4 369 805 - 12, +263 4 369 822 - 3Fax: +263 4 369 813 - 4
E-mail: [email protected]