six sigma - a collaborative approach to improving iowa …€¦ · · 2018-04-09offering better...
TRANSCRIPT

July 2017 ❘ qualityprogress.com22 QP
FEATURESIX SIGMA

Offering better value and achieving better patient care with lean Six Sigmaby Linda Duncan and Sherri Luchs
on value, PSH leadership set direction for the organization to pursue daily and established five strategic imperatives:1. Achieve the highest levels of quality, safety and
value.2. Educate and invest in people for personal and
professional success.3. Create an extraordinary patient experience.4. Create innovation through research.5. Develop and differentiate our regional inte-
grated academic healthcare system.To move forward on these imperatives, a value
improvement steering committee was formed and its members, which included senior lead-ership, identified the framework they believed would best achieve these strategic objectives: the lean method.
We enlisted Cardinal Health to coach us through adoption of the lean method. Cardinal Health is a major international supplier of healthcare supplies, with a consulting arm that provides teaching and coaching services to healthcare organizations that want to adopt lean principles.
The effort would give management and caregiv-ers a foundation of lean systems and practices and eventually expand to include Six Sigma concepts
(lean Six Sigma (LSS)) with the goal of cre-ating a self-sustaining improvement culture at PSH.
Just the Facts
A Pennsylva-nia hospital undertook an organizationwide improvement effort to enhance the quality of its services.
Silo thinking was prohibiting collaboration, communication, and effective and efficient patient care.
After several failed improve-ment attempts, the hospital realized the key to effective and sus-tainable change is involving process owners and changing the culture.
Penn State Health (PSH) is an academic health system in south central Pennsylvania with more than 10,000 staff members (including 1,100 physicians and 2,200 nurses) across two hospitals (an adult hospital and a freestanding children’s hospital) and its college of medicine.
PSH and its college of medicine form a collab-orative organization and, like other healthcare organizations across the country, have had to assess the value it offers patients and the pro-cesses by which care is delivered. Quality scores were mediocre, the hospital’s census (the per-centage of available beds occupied by patients) was consistently more than 85%, patients had to wait several months to see specialists and costs were higher than those of competitors.
With such a large footprint—annually, the orga-nization has nearly 30,000 hospital admissions and about as many surgical procedures, and more than 65,000 emergency room visits—the need to improve was urgent.
To ensure a coordinated and focused effort
qualityprogress.com ❘ July 2017 23QP

July 2017 ❘ qualityprogress.comQP
FEATURESIX SIGMA
24
Planning for improvementThe system’s operational excellence program office (OpEx) was charged with the rollout and ongoing management of the LSS initiative. With a healthy dose of skepticism, we began studying how other healthcare organizations sought and achieved large, organizationwide improve-ments using LSS tools and concepts.
Although we recognized the benefits of an LSS approach, we remained concerned about using the method in an academic medical center. Would it be possible to find the substantial cost savings and new reve-nue improvements leadership was seeking?
We soon realized there wasn’t enough desire or commitment in the organization for us to accomplish this alone. With only a handful of PSH staff having lean or Six Sigma experience, we did not have the in-house capabilities to introduce the method and move our large, complex organization forward with the strategic imperatives.
Leadership recognized we needed more change-management expertise—indi-viduals with a proven ability to engage process owners—as we tried to implement changes. We also needed to establish the narrow metrics-based approach to problem identification and analysis on the front line (the gemba), as well as a broad value stream perspective of organiza-tional problems and solutions—an ability to coordinate the impact of one function with another.
Most importantly, we wanted to disseminate a control and manage-ment system—the value improvement system—to monitor, manage and sustain change. Building such a system from scratch would be lengthy at best, and likely impossible.
Getting started with LSSThere was consensus among PSH leader-ship to start improvements in three key areas: the emergency department (ED),
perioperative services and the medical group. (For LSS deployment, the latter was eventually split into medicine and sur-gical specialty clinics.) Leadership came to this conclusion based on: + Needs in those areas, such as patient
flow and patient-access issues that restricted capacities.
+ Potential to achieve cost savings and generate revenue.
+ Readiness of the leadership of those areas to tackle problems.
+ Potential to establish proof of the concept that would eventually help all facets and departments of PSH’s transformation.Before considering the LSS method, we
had tried several approaches to improving flow and efficiency in these areas.
For example, at least four attempts, including two expensive consulting engagements, were made to improve turnover time in the perioperative ser-vices operating rooms (OR). Similarly,
Process and outcome indicator Target Control
limitProcess owner/data monitor
System/source What to check Frequency/
timeAction if control limit is exceeded
Reporting structure
Outcome
Decrease mean TAT in HVI services of a sustained < 60 minutes per day average for transfer
< 60 minutes
60 minutes
Nurse manager
Surginet TAT report
Wheels out, wheels in HVI transfer cases
WeeklyRIE and sponsor to evaluate RCA; plan and develop course of action with leadership
Weekly RIE and sponsor
Process
Establish a primary contact or aide for the HVI team
100% 100% Nurse manager N/A Schedule Weekly
RIE and sponsor to evaluate RCA; plan and develop course of action with leadership
Weekly RIE and sponsor
Inpatient to complete medical record form 12: document incomplete forms
90% < 90% Nurse manager
Manual process N/A Weekly
RIE and sponsor to evaluate RCA; plan and develop course of action with leadership
Weekly RIE and sponsor
Implement transport guidelines and document variations
90% < 90% Nurse manager
Manual process N/A Weekly
RIE and sponsor to evaluate RCA; plan and develop course of action with leadership
Weekly RIE and sponsor
TAT = turnaround timeHVI = Heart and Vascular InstituteRIE = rapid improvement eventRCA = root cause analysis
TA B L E 1
Control plan

qualityprogress.com ❘ July 2017 QP 25
we struggled for many years to improve patient flow and satisfaction in our ED and in some of our busy medical clinics. These attempts typically involved changes that didn’t engage the staff and faculty mem-bers who owned the process and often weren’t sustainable.
Our LSS deployment began with edu-cating PSH senior leadership, the value improvement steering committee and leadership from each of the four target areas. We conducted workshops with leadership and frontline staff from each of the four target areas to establish a value stream map of the many steps and processes that took place in the tar-get areas. Individuals working in those areas identified problems and bottle-necks, and surfaced ideas that could be addressed with the rapid improvement event (RIE) method.
“The outcome of the workshops was to get alignment and visibility of an entire value stream,” said Chris Dillinger, Cardinal Health lead consultant at PSH. “They had some ‘a-ha’ moments as people saw the process beyond their silo. With the map, they had created a place to articulate
where the pain and redundancy existed.” It was important, added Dillinger, for
workshop attendees to see the process through patients’ eyes—not from the per-spective of working in the process. “We tried to change the lens that they were looking through,” he said.
RIEsOver a six-month period, we conducted a total of 16 RIEs—four in each of the four target areas—focusing on quick-hit value by implementing do-it-now solutions by applying lean tools to reduce waste. The expectation was the cross-functional group would learn the RIE process by participating in the events and eventually growing into RIE leaders.
The key facet of an RIE, however, is that the people responsible for changing the process are the people working in the pro-cess. The effect on employee engagement was palpable in the initial RIEs.
Staff finally began identifying and com-municating issues and frustrations with bad processes, breakdowns and barri-ers—some that could be addressed only with leadership engagement. This became
clear to leadership as teams presented the steps they went through during the RIEs, the root causes that were unearthed and the plan for implementing solutions in five to 30 days.
The ability to affect how leadership viewed frontline work excited the RIE teams. It also was eye opening for those leaders as they began to see how even simple processes were convoluted, subject to random decision making and in need of ongoing Band-Aids to keep them functioning.
It was rewarding for ground-level employees to present to leadership:
“Here’s the solution, and by the way, we’ve already fixed half of it.” Before deploying the value improvement system, it was unheard of to improve something so rap-idly—or for it to be done by frontline staff. This impressed leaders and made it easy for them to say, “Keep it going.”
This became evident after an RIE was conducted to improve the turnaround time for cardiac surgery patients. The RIE team, which included nurses and physicians from the Heart and Vascular Institute (HVI) and perioperative services nurses and aides, examined the flow of patients from their inpatient beds to the OR. Table 1 shows the control plan the RIE team developed, and Figure 1 shows sustainable results.
Shortly following the proof of the concept for the RIEs, there was demand from across the organization for opera-tional teams to try this new method. To date, we have completed RIEs in diverse operational units across the organization including its college of medicine (curric-ulum development process in medical education and case management in com-parative medicine) and the medical group (clinic operations flow and scheduling), and for various hospital functions such as supply chain management, patient care and revenue cycle.
OpEx also ran into a common problem with healthcare RIEs: Physicians were too busy to participate for the full duration of the project. The physicians’ participation
F I G U R E 1
HVI RIE turnaround time—60-day progress
48
57
40
21
31
64
4347
52
59
3834 34
72
52
44
59
31
0
10
20
30
40
50
60
70
80
Nov. 3Nov. 10
Nov. 17Nov. 24
Dec. 1Dec. 8
Dec. 15Dec. 22
Dec. 29Jan. 5
Jan. 12Jan. 19
TAT minutes
TAT average: 46 minutesTAT goal: 60 minutes
HVI = Heart and Vascular InstituteRIE = rapid improvement eventTAT = turnaround time

July 2017 ❘ qualityprogress.comQP
FEATURESIX SIGMA
26
typically had been limited, and they would bring “homework” (clinical work) to try to stay involved with their patients.
We continue to struggle with finding the best way to fully engage physicians with respect to their time and their undi-vided involvement. Many of the process problems we experience are the result of decisions made by physicians, so getting them to see the broader, value stream outcomes of their decisions is necessary for change to occur.
Black Belt projectsIn addition to RIEs, OpEx also deployed and led larger, multidepartment Black Belt (BB) projects, with revenue impact antic-ipated to be greater than $250,000. BB
projects involve about 10 team members: subject matter experts related to the proj-ect scope, process owners, Champions and executive sponsors from throughout the organization and specific to the depart-ments affected by the project.
BB projects take four to 12 months to complete and rely on data and statistical analyses to illuminate problems in new ways. This helps overcome preconceived ideas of a problem as well as biased solutions. The projects illustrate the change management effectiveness of the define, measure, analyze, improve and control (DMAIC) process in overcoming emotion-driven perspectives in favor of data and process thinking. DMAIC helps teams slow down and rigorously analyze
a problem to find the best solution collectively.
A BB project, for example, was orga-nized to address scheduling problems in family medicine. The scheduling process had been subject to repeated improve-ment attempts by a variety of disciplines, and strong opinions existed about how to correct the situation.
Going into the BB project, participants believed a centralized scheduling pod should be disbanded, and a decentralized scheduling process developed instead. The BB project team went to the gemba and dug deep into the data to find the real root causes of the scheduling problems.
Because of their analysis, the team redesigned the scheduling process
F I G U R E 2
Scheduling value stream mapPatient
requiring visit
Whatmessage pool
do agents use?
Phone tree hasmultiple levels
Variance in access to bookshelf Wrong
greeting used
Unclear if patient is new?
Variety ofvisit types
Transfers notpart of standard
process
Primary carephysician not
available for acute
Visit slots arenot rolling overautomatically
Patient wantsonly primary
care physician
Messagesare not viewed
Patient is unsure how to get
to practice
Nurses do notschedule atsome sites
Visit notavailable or
needs unmet
Not everyone atsite can schedule
Patient back in queue
Patient back in queue
E-message practice9 sites,35 message pools
Patient enters phone tree• Listens to options• Selects option
Call identifiedand routed• Automated system
identifies call• Call routed to
available agent
Agent answers call• Identify practice
on phone display• Greet caller• Go to practice
bookshelf• 10.1 FTE, 9 agents,
3 nurses
Patient identified• Agent collects
demographic information: name,birth date
• Electronic records system used
• New patient mini-registration
Document andterminate callComplete additionaldocumentation, notes of call
Schedule visit• Find opening• Document reason
for visit• Document location
code• Document type of
reminder• Resource primary
care provider• New patient uses
short registration• E-message practice
Agent determinespatient needs• Patient explains
need• Agent matches
need to visit type–3 primary (new,acute, return),31 sub-visit
• Decision tree used for practice
preference
Nurse receives e-messageContacts provider
Site contacts patientRequires return callwithin 24-48 hrs.
30 secs.
CT: 10-30 secs.VA:BVA: 30 secs.NVA:% VA: 0
CT: 30 secs.VA:BVA: 30 secs.NVA:% VA: 0
CT: 2 secs.VA:BVA: 2 secs.NVA:% VA: 0
CT: 20–30 secs.VA: 20–30 secs.BVA: NVA:% VA: 100
TotalsCT: 3 mins., 32 secs.–2,884 mins., 32 secs.VA: 2 mins., 50 secs.–4 mins., 30 secs.BVA: 42 secs.–1 min., 2 secsNVA: 0–2,879 mins.% VA: 80–0.16
CT: 1 min.VA: 1 min.BVA: NVA:% VA: 100
CT: 1 min.–48 hrs.VA: 1 min.BVA: NVA: 47 hrs. 59 mins.% VA: 100–0.034
CT: 30 secs.–2 mins.VA: 30 secs.–2 mins.BVA: *NVA:% VA: 100
30 secs.2 secs. 20–30 secs. 30 secs.–2 mins. 1 min. 1 min.–48 hrs.
0–30 mins.
FTE = full-time equivalentCT = cycle time VA = value addedBVA = business value addedNVA = nonvalue added

qualityprogress.com ❘ July 2017 QP 27
and changed how physicians manage their individual schedules. The changes enabled family medicine to take advan-tage of open appointment slots that were not being filled, increasing the fill rate. This improvement has the potential to increase revenue by about $1 million a year.
Several LSS tools were used to help the BB project team analyze and under-stand the true root cause of the call center failure. The work included, among other things, a value stream map (Figure 2), a voice of the customer survey and a cause and effect matrix. A capability analysis (Figure 3) demonstrated the changes required to achieve success.
Early wins and organizational learningThe results revealed our improvement efforts were worthwhile, but they didn’t paint the full picture of how PSH had changed. Our mission clearly states we are a learning organization “committed to enhancing the quality of life through improved health, the professional prepa-ration of those who will serve the health needs of others and the discovery of knowledge that will benefit all.”
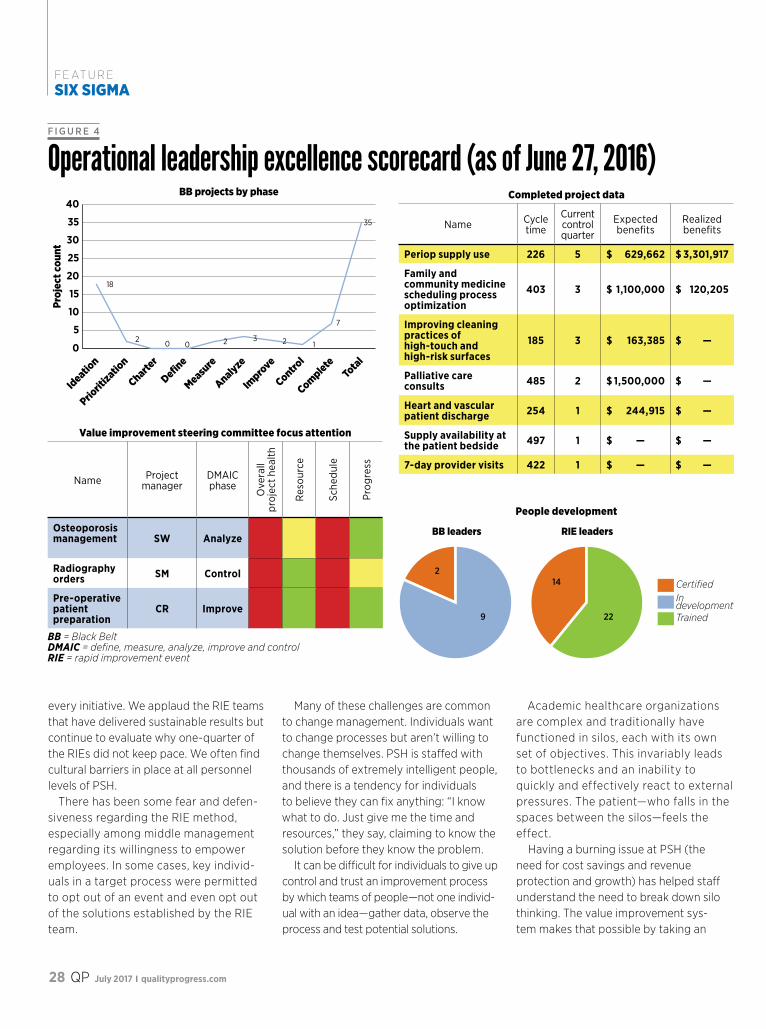
The value improvement system is prov-ing to be another way for us to discover knowledge and improve the well-being of patients and providers. Figure 4 (p.
28) is an example of our monthly score-card, which is distributed to operational leadership.
With each event and project that takes place at the gemba, our cultural benefits grow. We are creating an understanding of different points of view and roles. This did not exist prior to the value improve-ment system. We are helping people in all disciplines focus on good solutions rather than cling to entrenched methods. As we attempt to change the entire organization, we are breaking down barriers in and across functions.
In addition to improving alignment, we also want to improve the sustainability of
F I G U R E 3
Capability analysis for average talk time summary report
120 140 160 180 200 220 240
USL
Actual (overall) capabilityAre the data below the limit?
Z potential = 1.29
Z actual = 1.09Low High
0 6How capable is the process? Customer requirements
Upper specification 180Target *Lower specification *
Process characterization Mean 155.37Standard deviation (overall) 22.618
Actual (overall) capability Pp * Ppk 0.36 Z bench 1.09 % out of specification 13.80 PPM (DPMO) 138,036
Comments* The defect rate is 13.80%, which estimates the percentage of parts from the process that are outside the spec limits.
Actual (overall) capability is what the customer experiences.
Potential (within) capability is what could be achieved if process shifts and drifts were eliminated.
Pp = process performancePpk = process performance indexPPM (DPMO) = parts per million (defects per million opportunities)
“The outcome of the work-shops was to get alignment and visibility of an entire value stream. They had some ‘a-ha’ moments as people saw the process beyond their silo. With the map, they had created a place to articu-late where the pain and redun-dancy existed.”
—Chris Dillinger, Cardinal Health lead
consultant at PSH
July 2017 ❘ qualityprogress.comQP
FEATURESIX SIGMA
28
every initiative. We applaud the RIE teams that have delivered sustainable results but continue to evaluate why one-quarter of the RIEs did not keep pace. We often find cultural barriers in place at all personnel levels of PSH.
There has been some fear and defen-siveness regarding the RIE method, especially among middle management regarding its willingness to empower employees. In some cases, key individ-uals in a target process were permitted to opt out of an event and even opt out of the solutions established by the RIE team.
Many of these challenges are common to change management. Individuals want to change processes but aren’t willing to change themselves. PSH is staffed with thousands of extremely intelligent people, and there is a tendency for individuals to believe they can fix anything: “I know what to do. Just give me the time and resources,” they say, claiming to know the solution before they know the problem.
It can be difficult for individuals to give up control and trust an improvement process by which teams of people—not one individ-ual with an idea—gather data, observe the process and test potential solutions.
Academic healthcare organizations are complex and traditionally have functioned in silos, each with its own set of objectives. This invariably leads to bottlenecks and an inability to quickly and effectively react to external pressures. The patient—who falls in the spaces between the silos—feels the effect.
Having a burning issue at PSH (the need for cost savings and revenue protection and growth) has helped staff understand the need to break down silo thinking. The value improvement sys-tem makes that possible by taking an
F I G U R E 4
Operational leadership excellence scorecard (as of June 27, 2016)40
35
30
25
20
15
10
5
0
Proj
ect c
ount
18
2 2 3 2 1
7
35
0 0
Ideation
Priorit
ization
Charter
Define
Measure
Analyze
Impro
ve
Control
CompleteTotal
BB projects by phase
CertifiedIn developmentTrained
BB leaders RIE leaders
2
9 22
14
Completed project data
Name Cycle time
Current control quarter
Expected benefits
Realized benefits
Periop supply use 226 5 $ 629,662 $ 3,301,917
Family and community medicine scheduling process optimization
403 3 $ 1,100,000 $ 120,205
Improving cleaning practices of high-touch and high-risk surfaces
185 3 $ 163,385 $ —
Palliative care consults 485 2 $ 1,500,000 $ —
Heart and vascular patient discharge 254 1 $ 244,915 $ —
Supply availability at the patient bedside 497 1 $ — $ —
7-day provider visits 422 1 $ — $ —
Value improvement steering committee focus attention
Name Project manager
DMAIC phase
Ove
rall
proj
ect h
ealth
Res
ourc
e
Sche
dule
Prog
ress
Osteoporosis management SW Analyze
Radiography orders SM Control
Pre-operative patient preparation
CR Improve
People development
BB = Black BeltDMAIC = define, measure, analyze, improve and controlRIE = rapid improvement event

qualityprogress.com ❘ July 2017 QP 29
end-to-end, patent-centric perspective of care-delivery processes. Working on the complete patient value stream gets silos and departments communicating and collaborating.
In the end, success comes down to tireless adherence to LSS principles
Linda Duncan is the chief operational excellence officer at Penn State Milton S. Hershey Medical Center in Hershey, PA. She earned her MBA from Capital College, Pennsylvania State University in Harrisburg.
Sherri Luchs is a Black Belt at Penn State Milton S. Hershey Medical Center. She earned her master’s degree in healthcare from Capital College, Pennsylvania State University.
BIBLIOGRAPHYGraban, Mark, Lean
Hospitals: Improving Quality, Patient Safety, and Employee Engagement, second edition, CRC Press, 2012.
Koenigsaecker, George, Leading the Lean Enterprise Transformation, second
(principles drive behaviors and change culture), constancy and visibility of change efforts, and expanding the value improve-ment system to all staff and faculty.
PSH is growing and changing in myriad ways. The best way to keep the value improvement system strong is to expand
and produce great results across our hospitals, the college of medicine and our growing system of allied provider organizations. This relentless problem solving will result in a culture that inspires, implements and manages change flexibly and efficiently.
edition, CRC Press, 2009.Kotter, John P., Leading
Change, Harvard Business Review Press, 2012.
Mann, David, Creating a Lean Culture: Tools to Sustain a Lean Conversion, second edition, CRC Press, 2010.
Martyn, Mike, and Bryan
Crowell, Own the Gap: Building a Team-Based Daily Kaizen Culture, SISU Press, 2012.
Shook, John, Managing to Learn: Using the A3 Management Process, Lean Enterprise Institute, 2008.
Suneja, Aneesh, Lean
Doctors: A Bold and Practical Guide to Using Lean Principles to Transform Healthcare Systems, One Doctor at a Time, ASQ Quality Press, 2010.
Toussaint, John, Roger A. Gerald and Emily Adams, On the Mend: Revolutionizing Healthcare to Save Lives and
Transform the Industry, Lean Enterprise Institute, 2010.
Wellman, Joan, Patrick Hagan and Howard Jeffries, Leading the Lean Healthcare Journey: Driving Culture Change to Increase Value, CRC Press, 2011.
Academic healthcare organizations are complex and traditionally have functioned in silos, each with its own set of objectives. This invariably leads to bottlenecks and an inabil-ity to quickly and effectively react to external pressures. The patient—who falls in the spaces between the silos—feels the effect.