site investigation report and environmental hazard …
TRANSCRIPT
SITE INVESTIGATION REPORT AND ENVIRONMENTAL HAZARD EVALUATION
East Kapolei II Pesticide Mixing and Loading Site
Ewa, Oahu, Hawaii TMK (1) 9-1-017: Parcel 93 (Portion)
Prepared For: HAWAII STATE DEPARTMENT OF HAWAIIAN HOME LANDS
P.O. Box 1879 Honolulu, Hawaii 96805
Prepared By: ENVIROSERVICES & TRAINING CENTER, LLC
505 Ward Avenue, Suite 202 Honolulu, Hawaii 96814
Project No. 09-2012
March 2010
Site Investigation Report & EHE TOC i ETC Project No. 09-2012 East Kapolei PML Site March 2010
TABLE OF CONTENTS
1.0 CERTIFICATIONS AND LIMITATIONS................................................................................. 1
2.0 INTRODUCTION AND PURPOSE............................................................................................. 2
3.0 BACKGROUND ............................................................................................................................ 3
3.1 SITE DESCRIPTION........................................................................................................................ 3 3.2 SITE GEOLOGY............................................................................................................................. 4 3.3 SITE HYDROGEOLOGY.................................................................................................................. 4 3.4 HISTORICAL LAND USE................................................................................................................ 4 3.5 FUTURE LAND USE....................................................................................................................... 5 3.6 CONTAMINANTS OF CONCERN ..................................................................................................... 6 3.7 CONCEPTUAL SITE MODEL........................................................................................................... 6
3.7.1 Receptors of Concern ............................................................................................................. 7 3.7.2 Exposure Pathways................................................................................................................. 8
3.8 PROJECT ACTION LEVELS .......................................................................................................... 10
4.0 INVESTIGATION HISTORY.................................................................................................... 11
4.1 UNIVERSITY OF HAWAII/HAWAII DEPARTMENT OF AGRICULTURE - 1990 ................................. 12 4.2 HAWAII DEPARTMENT OF HEALTH - 2000.................................................................................. 12 4.3 UNITED STATES ENVIRONMENTAL PROTECTION AGENCY - 2000 .............................................. 12 4.4 ENVIROSERVICES & TRAINING CENTER LLC - 2007.................................................................. 12 4.5 HAWAII DEPARTMENT OF HEALTH (NO REPORT) - 2007............................................................ 13 4.6 UNITED STATES ENVIRONMENTAL PROTECTION AGENCY (NO REPORT) - 2009 ........................ 13 4.7 HAWAII DEPARTMENT OF HEALTH (NO REPORT) - 2009............................................................ 13 4.8 AREA-WIDE INVESTIGATION...................................................................................................... 14 4.9 SUMMARY OF HISTORIC DATA................................................................................................... 14
5.0 SUMMARY OF DATA QUALITY OBJECTIVES.................................................................. 17
5.1 PROBLEM STATEMENT ............................................................................................................... 17 5.2 DECISION MAKING..................................................................................................................... 17 5.3 DECISION INPUTS ....................................................................................................................... 18 5.4 INVESTIGATION BOUNDARIES .................................................................................................... 18 5.5 DECISION RULES ........................................................................................................................ 18 5.6 DECISION ERROR........................................................................................................................ 18 5.7 SAMPLING DESIGN ..................................................................................................................... 19
6.0 FIELD ACTIVITIES................................................................................................................... 20
6.1 SELECTION OF DECISION UNITS ................................................................................................. 20 6.2 SURFACE AND SUBSURFACE SOIL SAMPLING ACTIVITIES .......................................................... 21
6.2.1 Surface Soil Sample Collection............................................................................................. 21 6.2.2 Spill Area Subsurface Soil Sample Collection ...................................................................... 21 6.2.3 Investigation Area Trench Sample Collection ...................................................................... 22
6.3 SUMMARY OF ENVIRONMENTAL SAMPLES................................................................................. 22
7.0 SAMPLE CONTROL PROCEDURES...................................................................................... 24
7.1 SAMPLE IDENTIFICATION ........................................................................................................... 24 7.2 SAMPLE CHAIN-OF-CUSTODY AND TRANSPORTATION............................................................... 24 7.3 SAMPLE PRESERVATION AND HANDLING PROCEDURES ............................................................. 25 7.4 LABORATORY ANALYTICAL PROCEDURES................................................................................. 25
8.0 FIELD OBSERVATIONS........................................................................................................... 27

Site Investigation Report & EHE TOC ii ETC Project No. 09-2012 East Kapolei PML Site March 2010
9.0 DATA QUALITY......................................................................................................................... 28
9.1 LABORATORY QUALITY CONTROL............................................................................................. 28 9.2 FIELD QUALITY CONTROL.......................................................................................................... 28 9.3 DATA QUALITY ASSESSMENT .................................................................................................... 29
10.0 ANALYTICAL RESULTS AND DISCUSSION....................................................................... 31
11.0 ENVIRONMENTAL HAZARD EVALUATION ..................................................................... 39
11.1 PREVIOUS INVESTIGATIONS ....................................................................................................... 40 11.2 MAGNITUDE AND EXTENT OF CONTAMINATION ........................................................................ 40 11.3 COMPARISON TO DOH EALS..................................................................................................... 41
11.3.1 Arsenic ............................................................................................................................. 42 11.3.2 Dioxins/Furans ................................................................................................................ 43 11.3.3 Pentachlorophenol........................................................................................................... 46 11.3.4 Ametryn............................................................................................................................ 47 11.3.5 Atrazine............................................................................................................................ 48 11.3.6 Simazine........................................................................................................................... 49 11.3.7 Trifluralin ........................................................................................................................ 50
11.4 SUMMARY OF ENVIRONMENTAL HAZARDS................................................................................ 51
12.0 CONCLUSIONS .......................................................................................................................... 53
12.1 SPILL AREAS .............................................................................................................................. 53 12.2 INVESTIGATION AREAS .............................................................................................................. 54 12.3 OUTSIDE PML SITE.................................................................................................................... 55 12.4 FUTURE ACTIVITIES ................................................................................................................... 56
13.0 REFERENCES............................................................................................................................. 57
TABLES TABLE 1: DEFAULT DOH EALS FOR SOIL .................................................................................................... 10 TABLE 2: SUMMARY OF PRIMARY SAMPLES, SAMPLE DEPTHS, ESTIMATED VOLUMES, AND ANALYSES...... 23 TABLE 3: SAMPLE HANDLING AND PRESERVATION....................................................................................... 25 TABLE 4: FIELD REPLICATE CALCULATIONS................................................................................................. 30 TABLE 5: ANALYTICAL DATA – REPORTED CONCENTRATIONS, PRIMARY ANALYSES .................................. 31 TABLE 6: ANALYTICAL DATA – SECONDARY ANALYSES.............................................................................. 33 TABLE 7: ANALYTICAL DATA – TCLP ANALYSES ........................................................................................ 33 TABLE 8: SORPTION COEFFICIENTS AND LEACHING POTENTIAL ................................................................... 35 TABLE 9: ADJUSTED DIOXIN TEQ AND ARSENIC DATA................................................................................ 36 TABLE 10: ADJUSTED PENTACHLOROPHENOL AND TRIAZINE PESTICIDE DATA............................................ 38 TABLE 11: SUMMARY OF ENVIRONMENTAL HAZARDS.................................................................................. 51 TABLE 12: IMPACTED SOIL VOLUMES, SPILL AREAS .................................................................................... 53 TABLE 13: IMPACTED SOIL VOLUMES, INVESTIGATION AREAS..................................................................... 55
APPENDICES Appendix I: Figures & Photographs Appendix II: Summary Tables of Historic Data Appendix III: Summary of TEQ Calculations & Laboratory Reports

Site Investigation Report & EHE 1 ETC Project No. 09-2012 East Kapolei PML Site March 2010
1.0 CERTIFICATIONS AND LIMITATIONS
EnviroServices & Training Center (ETC), LLC has completed this Site Investigation Report and Environmental Hazard Evaluation for the project site. ETC’s findings and conclusions presented in this report are professional opinions based solely upon visual observations of the project site, government laws/guidance documents, and upon interpretation of the laboratory data and field measurements gathered at the time and location of the study.
This report is intended for the sole use and purpose of ETC’s Client, exclusively for the project site indicated. The scope of services performed in execution of these site investigation activities may not be appropriate for satisfying the needs of other users, and any use or reuse of this report or the findings and conclusions presented herein is at the sole risk of said user.
ETC makes no guarantee or warranty; either expressed or implied, except that our services are consistent with good commercial or customary practices designed to conform to acceptable industry standards and governmental laws/guidance documents. No warranty or representation, expressed or implied, is included or intended in its proposal, contracts, or reports. Information stated in this report applies only to the site as outlined and apply to the conditions present at the time of site investigation activities.
Prepared By: Damon Hamura Project Manager
Site Investigation Report & EHE 2 ETC Project No. 09-2012 East Kapolei PML Site March 2010
2.0 INTRODUCTION AND PURPOSE
This Site Investigation Report and Environmental Hazard Evaluation (SIR-EHE) provides documentation of site investigation activities performed at the East Kapolei II Pesticide Mixing and Loading Site (referred to herein as the “East Kapolei PML site” or “the property”). EnviroServices & Training Center, LLC (ETC) was contracted by the Hawaii State Department of Hawaiian Home Lands (DHHL) to provide environmental engineering services in support of future remedial action at the East Kapolei PML site. This SIR-EHE has been prepared to satisfy Task 2.9 (“Perform Environmental Hazard Evaluation”) in Attachment A: Scope of Work as described in the June 30, 2009 Agreement for Remedial Action between DHHL and the Hawaii State Department of Health (DOH).
This SIR-EHE provides a detailed description of additional site characterization activities conducted at the East Kapolei PML site to further delineate the extent of chemical impacts in site soils and to provide additional data to be used in scoping applicable and appropriate remedial alternatives. Furthermore, this SIR-EHE compares current and historic data to appropriate Hawaii Department of Health (DOH) Environmental Action Levels (EALs) and identifies environmental hazards associated with residual contaminant concentrations at the property due to former pesticide mixing and loading operations.
Previous environmental investigations have identified elevated concentrations of contaminants typically associated with historic sugar cane cultivation in soils within the East Kapolei PML site. DHHL plans to identify and implement appropriate remedial actions to address environmental hazards associated with the elevated contaminant concentrations. Gaps in the existing data previously included the estimation of mean contaminant concentrations in site soils within various areas of the PML site and estimations of the vertical extent of contamination. As such, the overall goal for the site investigation was to obtain additional data to further delineate the extent and magnitude of contaminant impacts by filling data gaps and to facilitate estimating site remediation costs.
For the purposes of this investigation, analytical data were compared to DOH EALs for areas where a current or potential source of drinking water is not threatened and where the nearest surface water body is greater than 150 meters from the site.
Site Investigation Report & EHE 3 ETC Project No. 09-2012 East Kapolei PML Site March 2010
3.0 BACKGROUND
3.1 Site Description
The project site is the former Oahu Sugar Company pesticide mixing and loading area located near Kualakai Parkway approximately 1.2 miles east of Kapolei and 2.0 miles southwest of Waipahu. A map illustrating the site location is included as Figure 1 in Appendix I. The site was previously occupied by two abandoned buildings and several elevated aboveground storage tanks. These structures were recently demolished (December 2009) and documentation of site demolition activities is provided in the January 2010 Demolition and Disposal Report, East Kapolei II, Former Pesticide Mixing and Loading Site, Ewa, Oahu, Hawaii prepared by ETC on behalf of DHHL.
The East Kapolei PML site consists of approximately 0.634-acres that are part of a larger 374.515-acre parcel owned by DHHL and identified as Tax Map Key (TMK): (1) 9-1-017:093, Honouliuli, Ewa, Oahu, Hawaii (see Appendix I, Figure 2). The property is located within the State Urban District and is zoned by the City and County of Honolulu for agricultural use.
The East Kapolei PML site has no street address and is accessible via cane haul roads from Palehua Road, an unimproved roadway. The property is centrally located within agricultural fields that either remain fallow or are currently under short-term lease to agricultural tenants, primarily Aloun Farms, for commercial cultivation of fruit and vegetables. Existing uses in the vicinity of the property include the Ewa Villages Golf Course to the south, the West Loch Golf Course to the east, and city of Kapolei to the west. The nearest existing residences to the East Kapolei PML site are located in the Ewa Villages community and in the DHHL’s “Kanehili” (East Kapolei I) development, situated approximately 0.7 miles southeast and 0.7 miles to the southwest, respectively.
The East Kapolei PML site is situated at an elevation of approximately 100 feet above mean sea level (msl) and the topography suggests a slight surface gradient to the south. No drinking water wells are located within one mile of the property, and the nearest surface water body is the West Loch of Pearl Harbor, located approximately 1.6 miles to the east.
The East Kapolei PML site was formerly characterized by abandoned, derelict buildings and several elevated storage tanks surrounded by a chain-link fence (see Appendix I, Figures 3 and 4). Ground cover within the fenced area consisted primarily of crushed coral covering native clay. A concrete-lined irrigation ditch runs adjacent to and through the fenced area. Prior to site sampling activities, all structures at the property were demolished. At the time of sample collection, ground cover consisted of bare soil with limited vegetation.
The East Kapolei PML site is not in use and is fenced off and locked. Warning signs are posted around the property. Outside of the fenced area, groundcover generally consists of loose native soil in the field areas, coral and cinder used as a base for the field roads, and concrete pads adjacent to the site gates.

Site Investigation Report & EHE 4 ETC Project No. 09-2012 East Kapolei PML Site March 2010
3.2 Site Geology
The East Kapolei PML site is situated at an elevation of approximately 100 feet above msl. Soil at the property is classified by the U.S. Department of Agriculture (USDA) Soil Conservation Service as Honouliuli clay (HxA). The Honouliuli Series consists of well-drained soils on coastal plains in the Ewa area. These soils developed in alluvium derived from basic igneous rock. Honouliuli clay is dark reddish-brown, very sticky and very plastic clay, with 0 to 2 percent slopes underlain with coral reef limestone. Permeability is moderately slow, runoff is slow, and the erosion hazard is no more than slight. Workability is slightly difficult because of the very sticky and very plastic clay. The shrink-swell potential is high (USDA, 1972).
Observations made during recent and previous subsurface investigations at the site indicated that existing site soils generally consist of a dark reddish-brown clay interspersed with relatively thin layers of coralline material. Deeper soils exhibited a very plastic consistency, which impeded previous direct-push sampling efforts at greater depths, slowed hollow-stem auger drilling for monitoring well installation, and slowed groundwater recharge into boreholes.
3.3 Site Hydrogeology
According to Mink & Lau, 1990, the site is located above two aquifers within the Pearl Harbor Aquifer Sector, Ewa Aquifer System. The upper aquifer is a basal, unconfined formation in sedimentary (nonvolcanic) lithology. Groundwater within this upper aquifer is currently used but is neither a drinking water source nor ecologically important. This groundwater source is considered replaceable, moderately saline, and has a high vulnerability to contamination. The lower aquifer is a basal, confined aquifer in horizontally extensive lavas. The groundwater in this lower aquifer is neither a drinking water source nor ecologically important, and is further characterized as being an irreplaceable formation with a low salinity (between 250 and 1000 milligrams Cl- per liter) and low vulnerability to contamination.
The depth to groundwater in three monitoring wells previously installed within the site ranged from 79 to 85 feet below existing ground surface.
3.4 Historical Land Use
The East Kapolei PML site and surrounding lands were in sugarcane cultivation for over 100 years from approximately 1890 to 1994. Ewa Plantation Company operated the first sugar plantation in the area from 1890 to 1970, followed by Oahu Sugar Company, who leased the Project Site and surrounding lands from the Estate of James Campbell until 1994.

Site Investigation Report & EHE 5 ETC Project No. 09-2012 East Kapolei PML Site March 2010
Ewa Plantation Company constructed the existing buildings at the project site in 1953. The site was actively used for the storage, mixing, and loading of agricultural pesticides for approximately 40 years up to 1994. Pesticides were stored, mixed, and loaded onto trucks for distribution and dispersal in the plantation fields. In the 1950s, pentachlorophenol with diesel or kerosene was also mixed and applied. It is suspected that soils at the site became contaminated as a result of periodic chemical spills over the years. Such spills were typically not cleaned up by the plantation. Storm water runoff and truck movement from the site appear to have dispersed pesticides and contaminants outside the currently fenced area.
Activities on the East Kapolei PML site ceased when Oahu Sugar Company shut down operations in 1994. Through a condemnation proceeding, the State of Hawaii acquired the Project Site on August 22, 1994 by Land Court Document No. 2181717, recorded at the State of Hawaii Bureau of Conveyances on September 21, 1994. The site has not been utilized since plantation activities ceased.
Two abandoned buildings and several elevated storage tanks were located on the site, but have since been removed (see Appendix I, Figures 3 and 4). DHHL completed consultation with the State Historic Preservation Division (SHPD) of the Department of Land and Natural Resources (DLNR) regarding the historic significance of the structures on the Project Site prior to demolition. In a letter dated May 14, 2009, SHPD provided a determination regarding the historic significance of the site. SHPD determined that, although the structures on the property are eligible for nomination to the National Register for their association with sugar plantations in Hawaii, “demolition will be [a] ‘no adverse effect to a historic property agreed upon mitigation.’ The Architectural Inventory Survey and photographs are an appropriate mitigation and no further mitigation is needed. Work may proceed.”
3.5 Future Land Use
Following completion of remediation activities, DHHL proposes the redevelopment of the East Kapolei PML site and surrounding lands as part of the agency’s “East Kapolei II” community. DHHL’s master plan for “East Kapolei II” shows the site as located within a five-acre lot. No residential units will be located on the site itself, however, future land uses to be hosted at the site are contingent upon the selected methods of remediation.
“East Kapolei II” will include 1,000 affordable, for-sale homes to be constructed by DHHL for native Hawaiian beneficiaries and 1,000 affordable rental units to be constructed by other agencies for the general public. Public facilities planned within the “East Kapolei II” development include schools, parks, and the Kroc Center, a major new community center to be built by the Salvation Army. The planned land uses in the vicinity of the Project Site are illustrated in Figure 5. The “East Kapolei II” community and DHHL’s regional development plans are described in the agency’s May 2008 Kapolei Development Plan. DHHL’s mission is to manage effectively the Hawaiian Home Lands Trust and to develop and deliver lands to native Hawaiians. DHHL works in partnership with other government agencies, private sector entrepreneurs, and non-profit organizations to carry out this mission. This work includes collaborative visioning, long-range planning, resource allocation, and project-specific joint ventures. DHHL believes that these partnerships benefit not only its native Hawaiian beneficiaries but the larger community as well.

Site Investigation Report & EHE 6 ETC Project No. 09-2012 East Kapolei PML Site March 2010
The “East Kapolei II” development is an example of DHHL’s effective partnerships with government agencies, the private sector, and community organizations to develop its lands and improve community life. For the planned residential development, DHHL has reduced the cost of homes to beneficiaries and lessees by providing infrastructure, promoting energy efficiency, and partnering with developers. As noted above, the Salvation Army and DHHL are partnering to bring about a multi-service community complex in “East Kapolei II” with a broad range of programs to serve the public. In coordination with DLNR by way of a licensing agreement with the Hawaii State Department of Transportation (DOT), DHHL is protecting a unique ecosystem and the red ilima (abutilon menziesii) in a designated plant conservation reserve within “East Kapolei II”. DHHL’s partnership with the DOT and other agencies facilitated the construction of Kualakai Parkway and related infrastructure improvements to the benefit of the greater Kapolei community.
3.6 Contaminants of Concern
Multiple lines of evidence, including data obtained from previous investigations at the site and descriptions of historic use, were used to identify the contaminants of concern (COC) for the East Kapolei PML site. A summary of the information obtained during previous environmental investigation activities and used to determine the COC described herein is provided in Section 4.0. The suspected sources of contamination at the East Kapolei PML site include the bulk storage, mixing, and distribution of pesticides and herbicides during sugarcane cultivation operations. Specifically, COC included:
Arsenic (metal associated with historic pesticides);
Polychlorinated dibenzo-dioxins/polychlorinated dibenzo-furans (dioxins/furans, associated with pentachlorophenol);
Pentachlorophenol (chlorinated herbicide); and
Triazine pesticides (specifically ametryn, atrazine, simazine, and trifluralin).
Note that other chlorinated herbicides and organochlorine pesticides were excluded from the COC list based on historical data. Pentachlorophenol and triazine pesticides were included based on elevated concentrations (i.e., exceeding appropriate action levels) in recent samples and based on their common usage in the Hawaii sugar industry.
3.7 Conceptual Site Model
A conceptual site model (CSM) was prepared as part of the Site Investigation Work Plan. A CSM provides a generalized framework regarding site-specific conditions relevant to potential contaminants, contaminant sources, migration pathways, routes of exposure, potential receptors, and environmental hazards (i.e., leaching to groundwater/ discharge to surface waters, ecological toxicity) that may be affected by the contaminants. Establishment of this framework is essential for assessing environmental hazards associated with the contaminants, determining what receptors are at risk, determining appropriate remedial strategies, and addressing unacceptable hazards.

Site Investigation Report & EHE 7 ETC Project No. 09-2012 East Kapolei PML Site March 2010
The following environmental hazards were initially considered:
Direct exposure threats to human health;
Intrusion of subsurface vapors into buildings;
Leaching and subsequent threats to groundwater resources;
Threats to terrestrial habitats; and
Gross contamination and general resource degradation concerns.
Preliminary evaluation of environmental hazards based on the historical data concluded that the primary environmental hazard posed by arsenic, dioxins/furans, and pentachlorophenol at the site is direct exposure threats to human health and that the primary environmental hazard posed by triazine pesticides is leaching and potential impacts to groundwater (see CSM diagram in Appendix I). These considerations were used to identify and create decision units for the site investigation. Decision units for areas suspected to have been primarily impacted by arsenic and dioxins were designated based on hypothetical exposure areas (i.e., 5000-square foot areas). Decision units for areas suspected to have been primarily impacted by triazine pesticides (as well as pentachlorophenol, arsenic, and dioxins) were designated based on apparent concentrated spill areas.
3.7.1 Receptors of Concern
When identifying potential receptors, plausible exposure under both current and future land-use was evaluated. Accordingly, potential receptors were identified for both current and future use scenarios. For the purposes of this investigation, the following potential receptors were identified.
Future Site Users
Current land use plans identify residential development surrounding the existing East Kapolei PML site. The use of the area encompassing and including the current East Kapolei PML site has not been identified. Exposure pathways for future site users include:
Inhalation of particulates from surface soil
Dermal contact with soil
Incidental ingestion of soil

Site Investigation Report & EHE 8 ETC Project No. 09-2012 East Kapolei PML Site March 2010
Future Residents in Surrounding Areas
Future residents of surrounding dwellings may be exposed to contaminants stemming from the East Kapolei PML site. Exposure pathways for future residents in surrounding areas include:
Inhalation of fugitive dust from site soil
Dermal contact with soil and sediment from surface water runoff
Incidental ingestion of soil and sediment from surface water runoff
Site Construction Worker
The future land use scenarios could include the development of the site. As a result, the construction worker would be present during development. It is assumed that construction workers could be exposed to contaminated soil. Specifically, the exposure pathways for a construction worker include:
Inhalation of fugitive dust from soil
Dermal contact with soil
Incidental ingestion of soil
Aquatic Ecological Receptors
Although remote due to the site’s distance to the nearest surface water body, aquatic ecological habitats may be impacted by contaminants through sediment runoff and dissolved chemicals that may enter the groundwater (and subsequently migrate to surface waters).
3.7.2 Exposure Pathways
Exposure is defined as the contact of an organism with a chemical or physical agent. An exposure pathway is defined as “the course a chemical or physical agent takes from a source to an exposed organism.” It describes “a unique mechanism by which an individual or population is exposed to chemicals or physical agents at or originating from a site (USEPA, 1989).” In order for an exposure pathway to be considered potentially complete, four elements must exist: 1) a source or release from a source; 2) a transport/exposure media; 3) an exposure point (point of contact with the contaminated medium); and 4) an exposure route. The potential exposure pathways present at the property are described below.
A. Soil Exposure Pathway
Direct contact with soil may result in incidental oral ingestion and/or dermal absorption of COC. Although generally associated with surface soil, direct contact may also occur with subsurface soil during trenching and excavation work.

Site Investigation Report & EHE 9 ETC Project No. 09-2012 East Kapolei PML Site March 2010
B. Air Exposure Pathway
Air exposure pathways become potential routes of exposure when COC enter the air via volatilization or via adsorption to fugitive dust particles. Volatilization occurs when COC partition to the air. Such volatilization may occur from surface soil, subsurface soil, and/or groundwater. When considering volatilization from subsurface soil or groundwater, transport of COC occurs through void spaces in unsaturated soils, asphalt, and concrete to the outdoor air or to future indoor air through foundation cracks. For this site, volatilization is not considered to be a concern due to the semi- to non-volatile nature of the COC.
Generation of fugitive dust may occur through disturbance of affected soil, such as wind or construction activities. Dust particles may be inhaled, may settle on human skin and be ingested (hand to mouth), and/or may settle on vegetation that may be ingested by humans.
C. Sediment Exposure Pathway
Receptors may be exposed to COC in sediment from the property as a result of surface runoff during storm events to nearby drainageways, which may eventually discharge to the ocean. Sediment may accumulate in the marine environment and be available for contact with various receptors. Recreational users of the marine environment (swimmers, surfers, fishermen) may come into direct contact with sediment and be exposed through oral ingestion and/or dermal absorption. Ecological receptors may live directly in the impacted sediment and may be exposed to COC through feeding within the sediment. As a secondary transport mechanism, COC may accumulate in ecological receptors (i.e., fish, shellfish), then be ingested by human receptors.
D. Groundwater Exposure Pathway
Groundwater beneath the site may have been impacted by surface spills through leaching from impacted soils, particularly associated with triazine pesticides. Receptors may be exposed to COC in the groundwater by direct contact or by inhaling volatile COC emitted from the groundwater to air. For this site, direct contact with groundwater is not anticipated since the aquifer is not considered to be usable as a drinking water resource and the depth to groundwater (approximately 80 feet below ground surface) makes direct human contact very unlikely. Inhalation of volatile COC is not anticipated due to the semi- to non-volatile nature of the COC. Although direct exposure to groundwater at the property is unlikely, the potential exists for contaminants that may leach into the groundwater to migrate or be drawn into downgradient wells.
Ecological receptors may also be affected in shallow marine environments within groundwater discharge zones. This is the primary concern associated with the groundwater exposure pathway.

Site Investigation Report & EHE 10 ETC Project No. 09-2012 East Kapolei PML Site March 2010
3.8 Project Action Levels
The Action Levels (ALs) used to evaluate data obtained from this investigation are the DOH EALs for areas where a current or potential source of drinking water is not threatened and where the nearest surface water body is greater than 150 meters from the site. The ALs listed are default (or the lowest) EALs for unrestricted (i.e., residential) land use and are intended to address potential direct exposure and leaching hazards as discussed in Section 3.7.
Table 1: Default DOH EALs for Soil
Contaminants of Concern EAL
Arsenic 20 mg/kg
Dioxins/Furans TEQ 450 ng/kg
Pentachlorophenol 3.0 mg/kg
Ametryn (Triazine Pesticide) 11 mg/kg
Atrazine (Triazine Pesticide) 2.1 mg/kg
Simazine (Triazine Pesticide) 0.25 mg/kg
Trifluralin (Triazine Pesticide) 32 mg/kg

Site Investigation Report & EHE 11 ETC Project No. 09-2012 East Kapolei PML Site March 2010
4.0 INVESTIGATION HISTORY
A number of environmental investigations have been performed throughout the East Kapolei PML site and surrounding areas. Findings from these investigations indicate the presence of various pesticides and pesticide-related chemicals in site soils at elevated concentrations. The primary sources of site-specific information include the following documents:
Miles, C.J., Yanagihara, K., Ogata, S., Van De Berg, G., and Boesch, R. 1990. Soil and Water Contamination at Pesticide Mixing and Loading Sites on Oahu, Hawaii. Conducted by the University of Hawaii and Hawaii State Department of Agriculture. Printed in: Bulletin of Environmental Contamination and Toxicology. 44:955-962. January 8.
U.S. EPA. 2000. Extent of Contamination, Oahu Sugar Company Site, Ewa, Hawaii, December 2000. U.S. EPA Work Assignment No. 0-125, Lockheed Martin Work Order No. R1A00125, U.S. EPA Contract No. 68-C9-223.
Hawaii State Department of Health. 2000. Site Inspection – Ewa Sugar Mill/Oahu Sugar Co. Pesticide Mixing and Loading Site. EPA Site ID Number HISFN0905536, submitted to EPA Region IX, July 3, 2000.
AMEC Earth and Environmental Inc. 2004. Phase I Environmental Site Assessment at East Kapolei Brownfield, Kapolei, Hawaii. Prepared for the State of Hawaii DBEDT, ASO Log No. 02-131. September.
EnviroServices & Training Center, LLC. 2007. Final Site Investigation and Preliminary Remedial Alternatives Analysis Report, East Kapolei – Brownfields, Former Oahu Sugar Company, Pesticide Mixing and Loading Areas, Kapolei, Oahu, Hawaii TMK (1)-9-1-017: Parcel 088. Prepared for the State of Hawaii DBEDT. August.
Environet, Inc. 2009. Phase I Environmental Site Assessment, East Kapolei Brownfields Site, Kapolei, Oahu, Hawaii 96707, TMK (1) 9-1-17: 71 (portion). Prepared for the State of Hawaii DHHL. January 22.
Data from other sources (i.e., DOH HEER Office, EPA Region 9) are available and have been reviewed, but such data have not been officially compiled into reports for release. Summary tables of the existing data have been included as Appendix II and a portion of the corresponding sample locations are shown in Appendix I, Figure 5.

Site Investigation Report & EHE 12 ETC Project No. 09-2012 East Kapolei PML Site March 2010
4.1 University of Hawaii/Hawaii Department of Agriculture - 1990
As documented in an article published on January 8, 1990 in the Bulletin of Environmental Contamination and Toxicology, the researchers collected discrete soil samples at the East Kapolei PML site during active operations. Analytical data indicated elevated concentrations of ametryn, atrazine, and DDT in the soil samples. Although the locations of these samples could not be accurately identified, the data helped to identify COC targeted for further investigation.
4.2 Hawaii Department of Health - 2000
As documented in the July 3, 2000 Site Inspection – Ewa Sugar Mill/Oahu Sugar Co. Pesticide Mixing and Loading Site, discrete soil sample data collected by the DOH in May 1997 and September 1999 indicated the presence of elevated metals, pesticides/herbicides, and dioxins concentrations in site soils. Specifically, arsenic, lead, zinc, pentachlorophenol, dalapon, and dioxins concentrations exceeded current default DOH EALs.
4.3 United States Environmental Protection Agency - 2000
As a follow up to the Site Inspection conducted by the DOH, the U.S. EPA conducted additional sampling at the East Kapolei PML site and documented findings in the December 2000 Extent of Contamination, Oahu Sugar Company Site, Ewa, Hawaii report. Discrete soil sample data indicated concentrations of metals, pesticides/herbicides, and dioxins at concentrations exceeding current default DOH EALs. The data generally indicated that the extent of contamination was limited to within the original fence line of the East Kapolei PML site. However, dioxins concentrations appeared to extend beyond the original fence line and therefore triggered the construction of the second, outer fence line.
4.4 EnviroServices & Training Center LLC - 2007
Under a contract with the Hawaii Department of Business, Economic Development, and Tourism (DBEDT), ETC conducted additional sampling at the East Kapolei PML site to screen for depth of contamination, delineate the extent of dioxin impacts to surface soils outside of the fence line using multi-increment sampling protocols, and screen for contaminant concentrations in the underlying groundwater. The resultant data was presented in the August 2007 Final Site Investigation and Preliminary Remedial Alternatives Analysis Report, East Kapolei – Brownfields, Former Oahu Sugar Company, Pesticide Mixing and Loading Areas, Kapolei, Oahu, Hawaii TMK (1)-9-1-017: Parcel 088.
Site Investigation Report & EHE 13 ETC Project No. 09-2012 East Kapolei PML Site March 2010
Discrete data indicated relatively low to non-detectable contaminant concentrations in subsurface soils (with the exception of dioxins concentrations, which were slightly higher than the current DOH EAL). Multi-increment soil sampling data from two “rings” of decision units located outside of the East Kapolei PML site fence line indicated the presence of elevated dioxin concentrations beyond the southwest gate, but limited to areas within the second ring of decision units. Groundwater data indicated that pesticide/herbicide concentrations in the groundwater samples were generally below method detection limits and/or default DOH EALs.
4.5 Hawaii Department of Health (No Report) - 2007
The DOH HEER Office collected triplicate multi-increment samples from surface soils within the East Kapolei PML site, in a low-lying area adjacent to the former boiler structure. The DOH’s intent was to determine whether leaching of pesticides in the soil was a significant concern. The triplicate samples were initially analyzed for total concentrations of pesticides and herbicides. After receipt of the sample data, the samples were further analyzed for select pesticides and herbicides using Synthetic Precipitation Leaching Procedure (SPLP) extraction methodology to determine the amount of contaminant that would leach out of the soil (via calculation of sorption coefficients). Although problems were encountered with sample holding times and therefore data was deemed suspect, results indicated that there may be a potential for contaminants to leach out of the soil into the underlying groundwater.
4.6 United States Environmental Protection Agency (No Report) - 2009
The U.S. EPA funded the collection of eighty-two discrete soil samples from assumed depths of 0 to 1 feet below ground surface (bgs) and 1 to 2 feet bgs in areas outside of and adjacent to the East Kapolei PML site. All samples were analyzed for dioxins and arsenic. Data generally indicated that dioxin concentrations outside the East Kapolei PML site fence line were relatively low, with only three of the eighty-two discrete samples having dioxin TEQ values exceeding the DOH EAL. However, arsenic data suggests a pattern of arsenic impacted soil at depths of 1 to 2 feet bgs outside of the southwestern gate and within the adjacent dirt roadway. Arsenic was detected at concentrations as high as 519 mg/kg in these areas.
4.7 Hawaii Department of Health (No Report) - 2009
In 2009, the DOH HEER Office funded a bench-scale study to determine whether the specific contaminants (particularly dioxins) could be treated using a thermal desorption technology. Multi-increment triplicate samples were collected from two separate decision units – the boiler room (low-lying area adjacent to the former boiler structure) and the spill area (soil beneath an apparent mixing tank embedded within the storage structure). The multi-increment samples were analyzed for dioxins, pentachlorophenol, and DDT. Analytical data to determine the baseline concentrations indicated very high dioxin TEQs in both decision units, as well as elevated pentachlorophenol/slightly elevated DDT concentrations.
Site Investigation Report & EHE 14 ETC Project No. 09-2012 East Kapolei PML Site March 2010
4.8 Area-Wide Investigation
Note that an area-wide investigation was completed by TetraTech EM Inc. in December 2007 on the entire 404-acre property initially targeted for development, excluding approximately three acres centered on the East Kapolei PML site and approximately 83 acres on the western portion of the property where drainage basins were being excavated. Findings of the investigation indicated that “there are no elevated concentrations of chemicals of potential concern in the soil that suggest conditions are not suitable for residential reuse, or that any additional sampling or evaluation is necessary.” These findings were documented in TetraTech EM Inc.’s December 12, 2007 Final Site Assessment Report, East Kapolei Affordable Housing Project, Kapolei, Oahu, Hawaii prepared for DOH HEER Office.
Based on this information, the bulk of the planned “East Kapolei II” community is being developed on land that has been deemed by the DOH as appropriate for residential development. Therefore, DHHL is focusing its efforts to address residual contamination at the East Kapolei PML site.
4.9 Summary of Historic Data
In general, data from these previous investigations have indicated that the East Kapolei PML site has been impacted by arsenic, dioxins/furans, pentachlorophenol, and triazine pesticides. Patterns within the data suggest that the areas beneath the elevated ASTs, beneath a mixing tank built into the patio of the office/storage structure, and behind the boiler building contain the highest contaminant concentrations (Appendix I, Figure 5). Specifically:
Arsenic concentrations as high as 160 mg/kg (sample SM-2), dioxin concentrations as high as 752,000 ng/kg (sample S-1), and pentachlorophenol concentrations as high as 310 mg/kg (sample SM-1) were identified in soil beneath the elevated ASTs.
Dioxin concentrations as high as 581,720 ng/kg (sample “Spill Area 2”) and pentachlorophenol concentrations as high as 32.7 mg/kg (sample “Spill Area 3”) were identified in soil beneath the mixing tank within the office/storage building.
Dioxin concentrations as high as 1,814,480 ng/kg (in parts per million range, sample “Boiler Room 2”), pentachlorophenol concentrations as high as 28.4 mg/kg (sample “Boiler Room 3”), ametryn concentrations as high as 120 mg/kg (sample S-1a,b,c), atrazine concentrations as high as 86 mg/kg (sample S-1a,b,c), and trifluralin concentrations as high as 190 mg/kg (sample S-1a,b,c) were identified in soil behind the boiler building.
The data from samples collected within the East Kapolei PML site were used to formulate the COC for the current site investigation and these COC were chosen since they were consistently identified at elevated concentrations.

Site Investigation Report & EHE 15 ETC Project No. 09-2012 East Kapolei PML Site March 2010
In addition to surface and subsurface soil data, groundwater data from historical investigations were also evaluated. Three, 2-inch diameter groundwater monitoring wells were installed by ETC (documented in the August 2007 Final Site Investigation and Preliminary Remedial Alternatives Analysis) within (MW3) and immediately adjacent to (MW2 and MW4) the fenced areas of the East Kapolei PML site (Appendix I, Figure 5). These monitoring wells were installed at depths of 90 to 100 feet below existing ground surface and groundwater in these wells were measured at 80 to 85 feet below existing ground surface. Data from groundwater samples collected from these wells indicated that all analyte concentrations (including arsenic, pentachlorophenol, and triazine pesticides) were either below method detection limits or below applicable default DOH EALs. As such, data suggested that contaminants from the East Kapolei PML site did not significantly impact underlying groundwater and that groundwater would not be included as a medium of concern for the current investigation.
Historical investigations also suggest that there are contaminant impacts in soils outside of the existing East Kapolei PML site fence line. In particular, data obtained by ETC and documented in the August 2007 Final Site Investigation and Preliminary Remedial Alternatives Analysis indicate that dioxin impacts extend beyond the fence line, generally outside of the southwest gate, beyond decision units 8, 9, and 10 from the first “ring” of decision units, but limited to within the second “ring” of decision units. Similarly, discrete sample data collected by the US EPA in 2009 indicate that elevated arsenic concentrations exist in soil at depths of approximately 1 to 2 feet bgs in the same area and extending out to the south of the PML site, within the intersection of the coral/dirt roads. Finally, limited data collected by the DOH/EPA in the July 2000 Site Inspection indicate the presence of elevated dioxin TEQ concentrations (composite sample SDa,b,c at 1,400 ng/kg) in soil/sediment accumulated in the concrete-lined ditch adjacent to the East Kapolei PML site. Although the extent of dioxin impacts were not determined, DHHL and DOH decided that soil/sediment from sections of the concrete lined ditch located adjacent to and southwest (downgradient) of the East Kapolei PML site would be removed from the ditch during site remediation activities and addressed similar to other dioxin-impacted soil.
Through extensive discussions with the DOH HEER Office regarding historic data available to-date, the objectives of the current investigation were developed. The following points were agreed upon:
The lateral extents of off-site dioxin impacts were delineated within the decision unit rings from the August 2007 Final Site Investigation and Preliminary Remedial Alternatives Analysis. Therefore, dioxin-impacted soil located beyond the East Kapolei PML site fence line will need to be addressed with impacted soil located within the fence line.
The lateral extents of off-site arsenic impacts were delineated based on discrete sampling data obtained by the U.S. EPA in their 2009 investigation. Therefore, arsenic-impacted soil located beyond the East Kapolei PML site fence line will need to be addressed with impacted soil located within the fence line.

Site Investigation Report & EHE 16 ETC Project No. 09-2012 East Kapolei PML Site March 2010
The lateral extents of pentachlorophenol and triazine pesticide impacts were defined by historical data as being within “spill areas” of the site, or areas immediately beneath or adjacent to the former ASTs, storage structure, and boiler room where the highest dioxin concentrations were identified.
There are currently no significant COC impacts to groundwater based on groundwater data documented in the August 2007 Final Site Investigation and Preliminary Remedial Alternatives Analysis. The three existing monitoring wells will need to be decommissioned in accordance with DOH HEER Office guidance during site remediation.
Accumulated soil/sediment located within the concrete-lined ditch located adjacent to and continuing west towards the new Kualakai Parkway were impacted with dioxins at elevated concentrations. Therefore, the soil/ sediment in the ditch will need to be addressed with other impacted soil.
Based on these findings, the December 2009 Site Investigation Work Plan was developed. The objectives of the work plan were to address the following:
Vertical delineation of COC-impacted soil within the East Kapolei PML site.
Quantification of the volume of soil impacted by specific COC within the East Kapolei PML site.
Obtaining this information by quantifying mean COC concentrations in the surface and subsurface soil within decision units throughout the East Kapolei PML site. These decision units would be delineated based on the locations of historic structures and through review of historic data.

Site Investigation Report & EHE 17 ETC Project No. 09-2012 East Kapolei PML Site March 2010
5.0 SUMMARY OF DATA QUALITY OBJECTIVES
The data quality objectives (DQO) process described in the Site Investigation Work Plan was used to define the criteria for environmental data collection operations. The DQOs were formulated to identify: 1) the reason for the investigation; 2) the inputs to the decision-making process; 3) the boundaries of the investigation; 4) the decision rules to be applied; 5) the potential decision errors and tolerable limits; and 6) the optimal sampling design to be used in the investigation.
5.1 Problem Statement
Previous environmental investigations at the East Kapolei PML site indicated the presence of elevated COC concentrations in site soils. The suspected sources of contamination include historic spills/leaks/releases from the former mixing and loading ASTs, historic overfilling of mobile tanks, and historic spills/leaks/releases from mobile tanks. Existing data suggest that the highest COC concentrations were typically found within the fenced area of the site, adjacent to existing structures and beneath existing ASTs. The extent of contamination was generally delineated within the existing fence line, with the exception of arsenic, which was found at elevated concentrations in near surface (approximately 1 to 2 feet bgs) soils adjacent to and outside of the fence line.
The primary goals for this investigation were to obtain refined estimates of COC-impacted soil areas and volumes to assist in evaluating appropriate remedial alternatives. For the purposes of the investigation activities described herein, the problem statement was formulated:
“In order to obtain more refined volume estimates of residual COC-impacted soil at the East Kapolei PML site, additional data for surface and subsurface soils is needed to evaluate appropriate remedial alternatives.”
5.2 Decision Making
The decision statements were then formulated based on the principal study questions for the project (i.e., the decisions to be made, the key unknown/unresolved issues) and the feasible alternative actions that may be taken based on the outcome of the investigation. The decision statements for this project were identified as follows:
Decision Statement 1: Determine whether mean COC concentrations in surface soil within the identified decision units within the East Kapolei PML site exceed ALs and may require additional investigation and/or corrective actions to mitigate exposure pathways; if not then decision unit will not be included in the area requiring corrective actions.
Decision Statement 2: Determine whether mean COC concentrations in subsurface soil within the identified decision units within the East Kapolei PML site exceed ALs and may require additional investigation and/or corrective actions to mitigate exposure pathways; if not then no further action regarding subsurface soil is required.

Site Investigation Report & EHE 18 ETC Project No. 09-2012 East Kapolei PML Site March 2010
5.3 Decision Inputs
The inputs to the decision were identified as new data obtained through the analysis by a National Environmental Laboratory Accreditation Conference (NELAC)-certified laboratory using standardized analytical methods (i.e., standard EPA analytical methods described in the Third Edition of SW-846 On-line Test Methods for Evaluating Solid Waste Physical/Chemical Methods) and through comparison to current DOH EALs.
5.4 Investigation Boundaries
The populations of interest were identified as surface and subsurface soil (soil particles that pass through a 2-millimeter sieve) within the fence line of the East Kapolei PML site. The investigation was not considered to be constrained by temporal boundaries since the COC being investigated are relatively persistent in the environment and will not greatly vary in concentrations in the soil over relatively short time periods.
5.5 Decision Rules
The decision rules were then formulated to govern the decision-making process. Using the information gathered in the previous steps of the DQO process, the following decision rules were formulated:
“If COC concentrations in surface and/or subsurface soil decision units at the property exceed the ALs established for this project, then additional activities may need to be performed to evaluate and/or mitigate exposure pathways to potential receptors. If COC concentrations in surface and/or subsurface soil decision units at the property are below the ALs, then no additional activities will need to be performed for the specific decision unit and the exposure pathways for the specific decision unit will be considered incomplete.”
5.6 Decision Error
Decision errors occur when sample data misleads the decision maker(s) into making a wrong decision and therefore taking the wrong response action. The possibility of a decision error exists since decisions are based on sample data that may be inaccurate due to random and systematic errors incurred at different stages of acquisition.
In order to control the various sources of decision error, a sampling methodology designed to minimize the sources of significant decision error was selected (multi-increment sampling). In addition, it was deemed prudent to incorporate a statistics-based bench mark for margin of error. As such, the relative standard deviation was identified as a means to evaluate the potential effect of error on the investigation process. Furthermore, to account for uncertainty in the data due to variance, it was determined that one standard deviation from the mean would be added to reported concentrations as recommended in DOH guidance.
Site Investigation Report & EHE 19 ETC Project No. 09-2012 East Kapolei PML Site March 2010
5.7 Sampling Design
The multi-increment sampling approach was selected to obtain representative samples that exhibit mean concentrations of the media being sampled and that accounts for the variability of concentrations within that media. The multi-increment sampling methodology takes into account the need for sufficiently accurate and precise sample data. The methodology includes requirements for: 1) collection of random samples; 2) collection of a larger number of samples; and 3) collection of a physically larger volume than standard discrete sampling methodologies. Since mean concentrations would be obtained using the multi-increment sampling methodology, defining the appropriate decision units was considered to be essential for meeting the project DQOs.
In general, the former East Kapolei PML site was divided into twelve surface decision units, with each decision unit ranging from roughly 1,000 square feet to less than 5,000 square feet in area. Three of these surface decision units were considered spill area decision units, or areas where the highest COC concentrations were anticipated based on their location in relation to the historic contaminant sources (i.e., in the immediate vicinity of storage and mixing equipment).
The nine remaining surface decision units were considered investigation area decision units, or areas outside of the immediate vicinity of contaminant sources that may have been impacted through other mechanisms. These decision units were sized to be consistent with hypothetical exposure areas (i.e., maximum 5,000 square feet in area) to be consistent with the investigation of the nearby field areas.
The three spill area decision units consisted of four separate “layers” in order to identify the vertical extent of COC impacts. These layers included a 0 to 0.5-foot layer, 0.5-foot to 2-foot layer, 2-foot to 5-foot layer, and 5-foot to 10-foot layer. The data obtained would provide a clearer picture of the volume of soil impacted by COC in these areas considered to be the most contaminated.
Five of the nine investigation area decision units also included subsurface layers to identify the vertical extent of certain COC impacts. These layers consisted of a 0 to 0.5-foot layer, 0.5-foot to 2-foot layer, and 2-foot to 3-foot layer. Similar to the spill area decision units, depth layers would provide a better estimate of COC-impacted soil volumes.
Site Investigation Report & EHE 20 ETC Project No. 09-2012 East Kapolei PML Site March 2010
6.0 FIELD ACTIVITIES
This section provides information regarding the selection of decision units and the specific field methods employed to perform sampling activities during this site investigation. The activities described herein were performed in general accordance with available sections of the DOH HEER Office Technical Guidance Manual for Implementation of the Hawaii State Contingency Plan, Interim Final and the DOH’s Summer 2008 (Updated October 2008) Evaluation of Environmental Hazards at Sites with Contaminated Soil and Groundwater.
6.1 Selection of Decision Units
In general, the former East Kapolei PML site was divided into twelve surface decision units, with each decision unit ranging from roughly 1,000 square feet to less than 5,000 square feet in area (see Appendix I, Figure 6). Three of these surface decision units (SA1 to SA3) were considered spill area decision units, or areas where the highest COC concentrations were anticipated based on their location in relation to the historic contaminant sources (i.e., in the immediate vicinity of storage and mixing equipment).
The nine remaining surface decision units were considered investigation area decision units (IA1 to IA4 and IAT1 to IAT5), or areas outside of the immediate vicinity of contaminant sources that may have been impacted through other mechanisms. These decision units were sized to be consistent with hypothetical exposure areas (i.e., maximum 5,000 square feet in area) and to be consistent with the investigation of the nearby field areas.
The three spill area decision units consisted of four separate “layers” in order to identify the vertical extent of COC impacts. These layers included a 0 to 0.5-foot layer (SA1.A to SA3.A), 0.5-foot to 2-foot layer (SA1.B to SA3.B), 2-foot to 5-foot layer (SA1.C to SA3.C), and 5-foot to 10-foot layer (SA1.D to SA3.D). It was anticipated that the data obtained would provide a clearer picture of the volume of soil impacted by COC in these areas considered to be the most contaminated.
Five of the nine investigation area decision units also included subsurface layers to identify the vertical extent of certain COC impacts. These layers consisted of a 0 to 0.5-foot layer (IAT1.A to IAT5.A), 0.5-foot to 2-foot layer (IAT1.B to IAT5.B), and 2-foot to 3-foot layer (IAT1.C to IAT5.C). Similar to the spill area decision units, it was anticipated that depth layers would provide a better estimate of COC-impacted soil volumes.
The lateral extent of these decision units were initially established using a topographic survey provided in a State Plane, North American Datum 1983 coordinate system. Using coordinates uploaded from the topographic survey to handheld global positioning system (GPS) instrumentation, ETC personnel then mobilized to the East Kapolei PML site to physically demarcate the decision unit boundaries. Aluminum spikes and surveyors’ tape were used to provide physical markers showing the decision unit boundaries.
Site Investigation Report & EHE 21 ETC Project No. 09-2012 East Kapolei PML Site March 2010
6.2 Surface and Subsurface Soil Sampling Activities
Sample collection activities were divided into three phases: surface soil sample collection, Spill Area subsurface soil sample collection, and Investigation Area trench sample collection. A total of thirty-one primary multi-increment soil samples and six field replicate multi-increment soil samples were collected as part of this investigation. A summary of the decision units, sample depths, volumes of soil represented, and the primary analyses have been included in Table 2.
6.2.1 Surface Soil Sample Collection
Surface soil samples were collected from all twelve surface decision units using pre-cleaned stainless steel trowels. Each sample consisted of fifty soil increments and each increment consisted of soil from the ground surface to 0.5 feet deep. Care was taken to ensure that each increment had a representative amount of soil from the entire 0- to 0.5-foot column of soil and that the volume of each increment was consistent. Rocks and debris were not included with each increment. The soil increments were collected using a stratified, random pattern within each decision unit, ensuring the overall fifty-increment sample represented all portions of the decision unit area. All soil increments from the same multi-increment sample were placed into new, 1-gallon sized resealable polyethylene bags and each bag was labeled with the sample identification, date/time of sample collection, and the initials of the collector. The samples were then placed in a designated sample cooler with ice pending delivery to the laboratory. The decision unit areas are shown in Figure 6, Appendix I.
6.2.2 Spill Area Subsurface Soil Sample Collection
Subsurface multi-increment soil samples collected from within the Spill Area decision units (SA1 through SA3) were collected in a stratified, random manner using a direct-push rig equipped with stainless steel core samplers and operated by Geotek Hawaii. The core samplers were driven into the ground and soil increments from each depth layer (0.5-feet to 2-feet, 2-feet to 5-feet, and 5-feet to 10-feet) were extracted and placed within the appropriate resealable plastic bag. Soil increments were extracted from the soil cores by cutting out a section of the core length-wise, ensuring a representative aliquot of soil from the targeted depth interval was obtained. A total of twenty soil increments were collected from each decision unit within the Spill Areas. All soil increments from the same multi-increment sample were placed into new, 1-gallon sized resealable polyethylene bags and each bag was labeled with the sample identification, date/time of sample collection, and the initials of the collector. The samples were then placed in a designated sample cooler with ice pending delivery to the laboratory.
Site Investigation Report & EHE 22 ETC Project No. 09-2012 East Kapolei PML Site March 2010
6.2.3 Investigation Area Trench Sample Collection
Subsurface multi-increment soil samples collected from the Investigation Area decision units targeted for trenching (IAT1 through IAT5) were collected in a stratified, random manner from within trenches created using a backhoe. The backhoe was used to excavate 3-foot deep trenches within each decision unit, with the intention that the trenches provide a representative vertical cross-section of subsurface soil throughout the decision unit. In general, ETC personnel excavated diagonal trenches to obtain the maximal coverage of the decision unit areas (for example, excavate one trench diagonally across a rectangular decision unit, then excavate a second trench diagonally in the opposite direction of the first trench across the decision unit, resulting in an “X” pattern). The excavated soil was placed adjacent to the trench from which it originated to facilitate replacement of the soil after sample collection activities were completed.
After exposing a representative cross-section, ETC personnel collected fifty soil increments from each depth layer (0.5-feet to 2-feet and 2-feet to 3-feet) in a stratified, random manner using pre-cleaned, stainless steel trowels and aluminum foil-lined stainless steel bowls (to retain soil increments). All soil increments from the same multi-increment sample were placed into new, 1-gallon sized resealable polyethylene bags and each bag was labeled with the sample identification, date/time of sample collection, and the initials of the collector. The samples were then placed in a designated sample cooler with ice pending delivery to the laboratory.
Upon completion of sample collection, the soil excavated from the trenches was returned to the trench from which the soil originated. In no instance was soil removed from the site, other than the volumes required for sample analyses.
6.3 Summary of Environmental Samples
A summary of the environmental samples collected from the East Kapolei PML site during this investigation is provided with corresponding analyses in Table 2.
Site Investigation Report & EHE 23 ETC Project No. 09-2012 East Kapolei PML Site March 2010
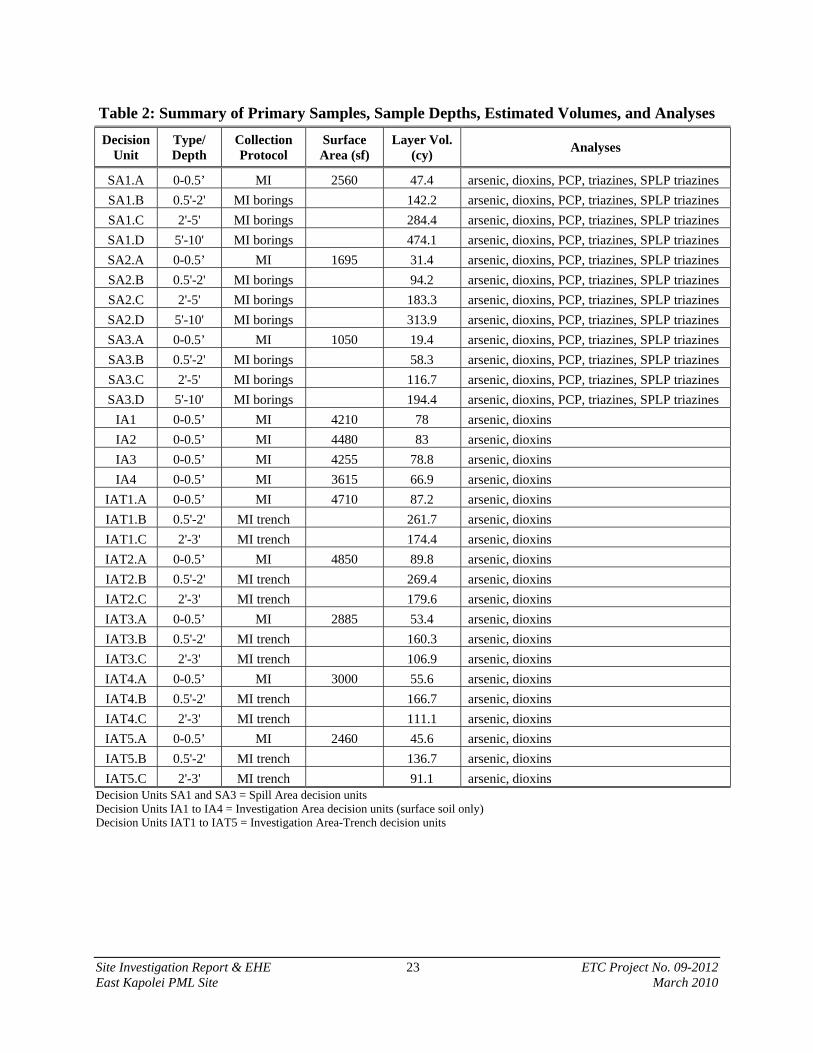
Table 2: Summary of Primary Samples, Sample Depths, Estimated Volumes, and Analyses
Decision Unit
Type/ Depth
Collection Protocol
Surface Area (sf)
Layer Vol. (cy)
Analyses
SA1.A 0-0.5’ MI 2560 47.4 arsenic, dioxins, PCP, triazines, SPLP triazines
SA1.B 0.5'-2' MI borings 142.2 arsenic, dioxins, PCP, triazines, SPLP triazines
SA1.C 2'-5' MI borings 284.4 arsenic, dioxins, PCP, triazines, SPLP triazines
SA1.D 5'-10' MI borings 474.1 arsenic, dioxins, PCP, triazines, SPLP triazines
SA2.A 0-0.5’ MI 1695 31.4 arsenic, dioxins, PCP, triazines, SPLP triazines
SA2.B 0.5'-2' MI borings 94.2 arsenic, dioxins, PCP, triazines, SPLP triazines
SA2.C 2'-5' MI borings 183.3 arsenic, dioxins, PCP, triazines, SPLP triazines
SA2.D 5'-10' MI borings 313.9 arsenic, dioxins, PCP, triazines, SPLP triazines
SA3.A 0-0.5’ MI 1050 19.4 arsenic, dioxins, PCP, triazines, SPLP triazines
SA3.B 0.5'-2' MI borings 58.3 arsenic, dioxins, PCP, triazines, SPLP triazines
SA3.C 2'-5' MI borings 116.7 arsenic, dioxins, PCP, triazines, SPLP triazines
SA3.D 5'-10' MI borings 194.4 arsenic, dioxins, PCP, triazines, SPLP triazines
IA1 0-0.5’ MI 4210 78 arsenic, dioxins
IA2 0-0.5’ MI 4480 83 arsenic, dioxins
IA3 0-0.5’ MI 4255 78.8 arsenic, dioxins
IA4 0-0.5’ MI 3615 66.9 arsenic, dioxins
IAT1.A 0-0.5’ MI 4710 87.2 arsenic, dioxins
IAT1.B 0.5'-2' MI trench 261.7 arsenic, dioxins
IAT1.C 2'-3' MI trench 174.4 arsenic, dioxins
IAT2.A 0-0.5’ MI 4850 89.8 arsenic, dioxins
IAT2.B 0.5'-2' MI trench 269.4 arsenic, dioxins
IAT2.C 2'-3' MI trench 179.6 arsenic, dioxins
IAT3.A 0-0.5’ MI 2885 53.4 arsenic, dioxins
IAT3.B 0.5'-2' MI trench 160.3 arsenic, dioxins
IAT3.C 2'-3' MI trench 106.9 arsenic, dioxins
IAT4.A 0-0.5’ MI 3000 55.6 arsenic, dioxins
IAT4.B 0.5'-2' MI trench 166.7 arsenic, dioxins
IAT4.C 2'-3' MI trench 111.1 arsenic, dioxins
IAT5.A 0-0.5’ MI 2460 45.6 arsenic, dioxins
IAT5.B 0.5'-2' MI trench 136.7 arsenic, dioxins
IAT5.C 2'-3' MI trench 91.1 arsenic, dioxins Decision Units SA1 and SA3 = Spill Area decision units Decision Units IA1 to IA4 = Investigation Area decision units (surface soil only) Decision Units IAT1 to IAT5 = Investigation Area-Trench decision units

Site Investigation Report & EHE 24 ETC Project No. 09-2012 East Kapolei PML Site March 2010
7.0 SAMPLE CONTROL PROCEDURES
This section provides information regarding specific control procedures utilized during site activities to maintain control over sample management. Such procedures were discussed in the December 2009 Site Investigation Work Plan.
7.1 Sample Identification
The sample identification, or sample naming, procedure describes the naming convention for samples collected and analyzed during this field investigation. The following format was used for multi-increment soil samples collected at the property.
DU.X where: DU = decision unit designation (SA-spill area, IA-investigation area, or IAT-
investigation area trench) X = depth layer For SA decision units, A=0-0.5 ft, B=0.5-2 ft, C=2-5 ft, D=5-10 ft For IA decision units, A=0-0.5 ft For IAT decision units, A=0-0.5 ft, B=0.5-2 ft, C=2-3 ft
Field replicate samples were labeled in a similar manner as described above using fictitious depth layer designations such that the samples were indistinguishable from primary samples.
The labeling method was used for all samples collected at the site. Each sample container (resealable plastic bag) was labeled with the sample ID, date/time of sampling, and sampler’s initials using an indelible ink marker.
7.2 Sample Chain-of-Custody and Transportation
Chain of custody documentation, described in the December 2009 Site Investigation Work Plan, was maintained to track possession of the samples. All samples collected during the investigation were recorded on chain of custody forms. Information included on the chain of custody forms included:
Sample ID number
Matrix
Date and time of collection
Number and type of containers
Analytical method to be performed
Number of pages

Site Investigation Report & EHE 25 ETC Project No. 09-2012 East Kapolei PML Site March 2010
An ETC representative retained custody of the samples at all times prior to hand delivery to TestAmerica – Honolulu in Aiea, Hawaii. Upon delivery of the samples, ETC representatives signed the chain of custody form to indicate the date and time custody of the samples were relinquished and a TestAmerica employee signed the form to indicate the change in custody. Copies of the completed chain of custody forms have been included with the laboratory data packages in Appendix III.
7.3 Sample Preservation and Handling Procedures
Sample handling and preservation were conducted in compliance with the respective method requirements. Table 3 below summarizes these requirements.
Table 3: Sample Handling and Preservation
Analyte Analytical
Method Sample Container Size, Type Preservation Holding Time
Arsenic EPA 6010B/6020 1-gallon resealable polyethylene bag none 6 months
Dioxins/furans EPA 8290 1-gallon resealable polyethylene bag Dark, 4° C* 30 days*
Pentachlorophenol EPA 8151A 1-gallon resealable polyethylene bag Cool, 4° C 14 days
Triazine Pesticides EPA 8270CM 1-gallon resealable polyethylene bag Cool, 4° C 14 days Note: Preservation and holding times in accordance with EPA SW-846 On-Line Revision 3: Test Methods for Evaluation Solid Wastes. *Preservation and holding time specified for EPA Method 8290 are recommendations. The method states that dioxins/furans are very
stable in the environment and holding times under the preservation conditions may be as high as a year.
7.4 Laboratory Analytical Procedures
ETC delivered a total of thirty-one primary multi-increment samples and six field replicate multi-increment samples to TestAmerica – Honolulu (TA-H) in Aiea, Hawaii with completed chain of custody documentation. TA-H performed multi-increment subsampling in accordance with the EPA’s November 2003 Guidance for Obtaining Representative Laboratory Analytical Subsamples from Particulate Laboratory Samples (EPA 600/R-03/027), which included air-drying, sieving, and obtaining representative subsamples using either an appropriate mechanical splitter or through multi-increment sampling protocols. TA-H was instructed to analyze the processed samples for total arsenic via EPA Method 6010B, dioxins/furans via EPA Method 8290, pentachlorophenol via EPA Method 8151A, and/or triazine pesticides via EPA Method 8270C Modified.
TA-H was also instructed to perform additional analyses on the twelve primary multi-increment samples and two field replicate multi-increment samples collected from the Spill Area decision units. These analyses included pentachlorophenol using the Synthetic Precipitation Leaching Procedure (SPLP) via EPA Method 1312/8270C, SPLP triazine pesticides via EPA Method 1312/8270C Modified, total organic carbon (TOC) via EPA Method 9060A Modified, clay fraction analysis (physical analysis to approximate the percentage of clay particles during sieving using a 250 micrometer sieve), RCRA8 metals using the Toxicity Characteristic Leaching Procedure (TCLP) via EPA Method 1311/6010/7000 series (surface samples only), TCLP pentachlorophenol via EPA Method 1311/8270C (surface samples only), and TCLP organochlorine pesticides via EPA Method 1311/8081 (surface samples only).

Site Investigation Report & EHE 26 ETC Project No. 09-2012 East Kapolei PML Site March 2010
The SPLP analyses were run to assess the mobility of pentachlorophenol and triazine pesticides in soil within the Spill Area decision units (SA1 through SA3). The TOC and clay fraction analysis were run to assess some of the physical parameters of the soil within the Spill Area decision units to provide further information regarding contaminant mobility. The TCLP analyses were run on soil from the Spill Area decision units (anticipated to contain the highest contaminant concentrations) to determine whether, if excavated, these soils would be considered a RCRA-regulated (hazardous) waste.

Site Investigation Report & EHE 27 ETC Project No. 09-2012 East Kapolei PML Site March 2010
8.0 FIELD OBSERVATIONS
In general, the soils at the East Kapolei PML site consisted of a brown silty clay material mixed with gravel at ground surface. The field sampling team observed a number of areas where thin layers of silty soils were underlain by asphalt pavement. Furthermore, areas of compacted coral fill materials, including varying sizes of coralline rock, were interspersed with the brown silty clay. Immediately outside of the site fencing, soils generally consisted of a brown to reddish brown, plastic silty clay. Large, deep cracks (2- to 4-inches wide and 12- to 24-inches deep) were observed in the areas between the East Kapolei PML site and the adjacent agricultural fields. The adjacent dirt roadways consisted of a mixture of coral fill, asphalt, deteriorating concrete, and brown silty clay.
Observations made during subsurface sampling activities utilizing the direct push rig indicated the presence of a brown silty clay from ground surface to 10 feet bgs, interspersed with coral fill material generally at depths ranging from ground surface to 5 feet bgs. Olfactory observations made during sampling of subsurface soil in the Spill Areas indicated the presence of a chemical odor, particularly in soil from SA2.
Observations made during trenching activities were consistent with observations made during surface sampling and subsurface sampling using the direct push rig. Brown silty clay mixed with gravel was encountered from ground surface to depths of 0.5 feet bgs, with brown silty clay observed at greater depths. Interspersed with the brown silty clay were areas consisting of coral fill material.
Site Investigation Report & EHE 28 ETC Project No. 09-2012 East Kapolei PML Site March 2010
9.0 DATA QUALITY
Data obtained from an investigation should be of sufficient quality to ensure that site characterization data are adequate to accurately define impacts to the site and to evaluate potential environmental hazards. The identification of site impacts and potential environmental hazards is crucial for the decision-making process and more specifically for this project, the proper selection of remedial alternatives to ensure that the appropriate environmental hazards are addressed. The integration of quality control procedures during both the laboratory and field sampling aspects of the site investigation help to ensure that the resultant data can be considered sufficiently reliable for evaluating future site activities.
9.1 Laboratory Quality Control
Laboratory quality control procedures for soil analyses followed the specific US EPA methods as described in SW-846. Procedures included the measurement of surrogate standard recoveries, method blanks, laboratory control samples (LCS), matrix spike (MS) samples, and MS Duplicate (MSD) samples. Quality control data are initially reviewed by the laboratory project managers to ensure that data meets acceptable standards for use and reliability. In instances where potential problems were encountered during analyses (i.e., relative percent differences or percent recoveries exceed initially specified control limits, matrix interferences, etc.), the laboratory project manager evaluated the issue and made a determination on how such problems affect the data usability. In these instances, data qualifiers or flags are used to indicate which data may be affected by the issue.
Generally, ETC personnel evaluate the laboratory data packages as they become available. For this particular project, review of laboratory quality control data did not reveal any significant issues associated with data usage. The most consistent issue identified was the elevated reporting limits for dioxins/furans. Due to the high concentrations of these chemicals in the soil samples analyzed, dilutions were needed to obtain concentration values. In certain instances, the dioxins/furans concentrations were higher than could be quantified by the laboratory methods. In these situations, the laboratory had to estimate the concentration values. ETC determined that this would not affect the overall decision-making process since the resultant concentrations were well above the action levels identified for this project. Therefore, laboratory accuracy at these elevated levels was not considered crucial.
9.2 Field Quality Control
The data obtained through collection of multi-increment replicate samples (triplicates) were used for field quality control purposes. As discussed in the December 2009 Site Investigation Work Plan, ETC collected one primary multi-increment sample and two field replicate multi-increment samples (i.e., field triplicate samples) at a frequency of approximately one set of field triplicate samples for every ten primary multi-increment samples (10%) for quality control purposes. The primary sample and the two field replicate samples were collected in the same manner, as if three separate multi-increment samples were being collected from the same decision unit.
Site Investigation Report & EHE 29 ETC Project No. 09-2012 East Kapolei PML Site March 2010
Three decision units were selected for triplicate sampling and were specified in the Site Investigation Work Plan. Surface soil field replicate samples were collected from decision units SA2 and IAT5. Subsurface soil field replicate samples were collected from decision unit IAT1. Table 4 below presents the reported concentrations, means, standard deviations, and relative standard deviations.
9.3 Data Quality Assessment
As described in the December 2009 Site Investigation Work Plan, since data from multi-increment samples theoretically provides estimates of the mean concentrations in the particular decision unit being assessed, a measure of the variation from the mean is needed to evaluate how that variation affects the decision making process. In an effort to account for variance in the data, standard deviations were calculated from the triplicate samples collected during the investigation (see Table 4 below). These standard deviations, coupled with the calculated means of the triplicate samples, were used to obtain relative standard deviations (RSDs) for each set of triplicate samples. The RSDs were then reviewed to determine the effects of total error on the data set. As shown in Table 4, a wide range of RSD values were observed for the various decision units and COC.
These standard deviations were then added to the reported concentrations for each COC and presented as “adjusted” concentrations. The adjusted concentrations were then used to make decisions regarding whether COC concentrations present a specific environmental hazard for the decision unit.
An overall review and evaluation of both laboratory quality control and field quality control information indicated that analytical data obtained during the site investigation can be relied upon to make decisions regarding site conditions and contaminant levels. Although some level of uncertainty exists regarding the exact concentrations of dioxins/furans at high levels, such uncertainty does not affect the overall data usability since such concentrations are orders of magnitude higher than the project action level. Similarly, uncertainty exists due to the elevated standard deviations and relative standard deviations calculated for certain COC. However, such uncertainty does not significantly affect the overall decision-making process for the site. For example, the addition of the high, calculated standard deviations to the reported concentrations for pentachlorophenol, ametryn, and atrazine resulted in the finding that all results exceed their respective default DOH EALs. In this particular situation, this is not a significant issue since all decision units affected will already need to be addressed due to elevated dioxins/furans TEQ concentrations existing in these same decision units. In other words, regardless of the pentachlorophenol, ametryn, and atrazine concentrations, these decision units require additional evaluation due to the elevated dioxins/furans concentrations, which are generally considered to be the risk-driver for the site.

Site Investigation Report & EHE 30 ETC Project No. 09-2012 East Kapolei PML Site March 2010
Table 4: Field Replicate Calculations
Spill Area, Surface Soil Investigation Area,
Subsurface Investigation Area, Surface
Soil Analyte
SA2.A SA2.E SA2.F IAT1.B IAT1.D IAT1.E IAT5.A IAT5.D IAT5.E
Arsenic 57.1 45.2 90 3.63 3.92 6.75 6.68 7.12 7.49
Mean 64.1 4.77 7.10
SD 23.21 1.72 0.41
RSD 36% 36% 6%
TOC 53,000 43,000 70,000
Mean 55,333.33
SD 13,650.40
RSD 25%
NA NA
Dioxin TEQ 350,420 453,020 335,410 324 545 196 10,980 5,410 15,897
Mean 379,616.67 355.00 10,762.33
SD 64,010.64 176.55 5,246.89
RSD 17% 50% 49%
PCP 53.8 99.4 50.4
Mean 67.87
SD 27.36
RSD 40%
NA NA
Ametryn 73.4 77.1 117
Mean 89.17
SD 24.18
RSD 27%
NA NA
Atrazine 12.4 16.5 7.22
Mean 12.04
SD 4.65
RSD 39%
NA NA
Simazine 0.572 0.627 0.855
Mean 0.68
SD 0.15
RSD 22%
NA NA
Trifluralin 0.577 0.382 5.09
Mean 2.02
SD 2.66
RSD 132%
NA NA
Notes: NA = not analyzed SD = standard deviation RSD = relative standard deviation TOC = total organic carbon Dioxin TEQs calculated using 2005 World Health Organization TEFs PCP = pentachlorophenol Dioxin TEQ results in nanograms per kilogram (ng/kg), all other results in milligrams per kilogram (mg/kg)
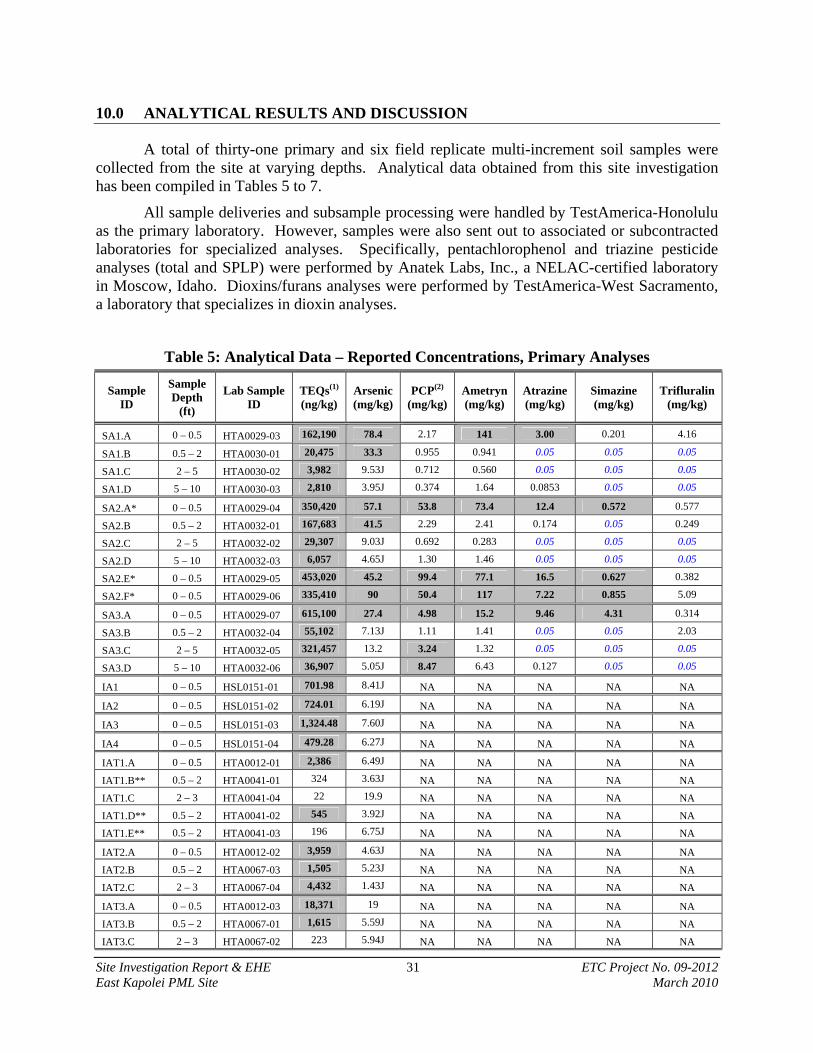
Site Investigation Report & EHE 31 ETC Project No. 09-2012 East Kapolei PML Site March 2010
10.0 ANALYTICAL RESULTS AND DISCUSSION
A total of thirty-one primary and six field replicate multi-increment soil samples were collected from the site at varying depths. Analytical data obtained from this site investigation has been compiled in Tables 5 to 7.
All sample deliveries and subsample processing were handled by TestAmerica-Honolulu as the primary laboratory. However, samples were also sent out to associated or subcontracted laboratories for specialized analyses. Specifically, pentachlorophenol and triazine pesticide analyses (total and SPLP) were performed by Anatek Labs, Inc., a NELAC-certified laboratory in Moscow, Idaho. Dioxins/furans analyses were performed by TestAmerica-West Sacramento, a laboratory that specializes in dioxin analyses.
Table 5: Analytical Data – Reported Concentrations, Primary Analyses
Sample ID
Sample Depth
(ft)
Lab Sample ID
TEQs(1) (ng/kg)
Arsenic (mg/kg)
PCP(2) (mg/kg)
Ametryn (mg/kg)
Atrazine (mg/kg)
Simazine (mg/kg)
Trifluralin (mg/kg)
SA1.A 0 – 0.5 HTA0029-03 162,190 78.4 2.17 141 3.00 0.201 4.16
SA1.B 0.5 – 2 HTA0030-01 20,475 33.3 0.955 0.941 0.05 0.05 0.05
SA1.C 2 – 5 HTA0030-02 3,982 9.53J 0.712 0.560 0.05 0.05 0.05
SA1.D 5 – 10 HTA0030-03 2,810 3.95J 0.374 1.64 0.0853 0.05 0.05
SA2.A* 0 – 0.5 HTA0029-04 350,420 57.1 53.8 73.4 12.4 0.572 0.577
SA2.B 0.5 – 2 HTA0032-01 167,683 41.5 2.29 2.41 0.174 0.05 0.249
SA2.C 2 – 5 HTA0032-02 29,307 9.03J 0.692 0.283 0.05 0.05 0.05
SA2.D 5 – 10 HTA0032-03 6,057 4.65J 1.30 1.46 0.05 0.05 0.05
SA2.E* 0 – 0.5 HTA0029-05 453,020 45.2 99.4 77.1 16.5 0.627 0.382
SA2.F* 0 – 0.5 HTA0029-06 335,410 90 50.4 117 7.22 0.855 5.09
SA3.A 0 – 0.5 HTA0029-07 615,100 27.4 4.98 15.2 9.46 4.31 0.314
SA3.B 0.5 – 2 HTA0032-04 55,102 7.13J 1.11 1.41 0.05 0.05 2.03
SA3.C 2 – 5 HTA0032-05 321,457 13.2 3.24 1.32 0.05 0.05 0.05
SA3.D 5 – 10 HTA0032-06 36,907 5.05J 8.47 6.43 0.127 0.05 0.05
IA1 0 – 0.5 HSL0151-01 701.98 8.41J NA NA NA NA NA
IA2 0 – 0.5 HSL0151-02 724.01 6.19J NA NA NA NA NA
IA3 0 – 0.5 HSL0151-03 1,324.48 7.60J NA NA NA NA NA
IA4 0 – 0.5 HSL0151-04 479.28 6.27J NA NA NA NA NA
IAT1.A 0 – 0.5 HTA0012-01 2,386 6.49J NA NA NA NA NA
IAT1.B** 0.5 – 2 HTA0041-01 324 3.63J NA NA NA NA NA
IAT1.C 2 – 3 HTA0041-04 22 19.9 NA NA NA NA NA
IAT1.D** 0.5 – 2 HTA0041-02 545 3.92J NA NA NA NA NA
IAT1.E** 0.5 – 2 HTA0041-03 196 6.75J NA NA NA NA NA
IAT2.A 0 – 0.5 HTA0012-02 3,959 4.63J NA NA NA NA NA
IAT2.B 0.5 – 2 HTA0067-03 1,505 5.23J NA NA NA NA NA
IAT2.C 2 – 3 HTA0067-04 4,432 1.43J NA NA NA NA NA
IAT3.A 0 – 0.5 HTA0012-03 18,371 19 NA NA NA NA NA
IAT3.B 0.5 – 2 HTA0067-01 1,615 5.59J NA NA NA NA NA
IAT3.C 2 – 3 HTA0067-02 223 5.94J NA NA NA NA NA

Site Investigation Report & EHE 32 ETC Project No. 09-2012 East Kapolei PML Site March 2010
Sample ID
Sample Depth
(ft)
Lab Sample ID
TEQs(1) (ng/kg)
Arsenic (mg/kg)
PCP(2) (mg/kg)
Ametryn (mg/kg)
Atrazine (mg/kg)
Simazine (mg/kg)
Trifluralin (mg/kg)
IAT4.A 0 – 0.5 HTA0012-04 14,606 8.14J NA NA NA NA NA
IAT4.B 0.5 – 2 HTA0062-01 2,382 3.31J NA NA NA NA NA
IAT4.C 2 – 3 HTA0062-02 27,860 0.751 NA NA NA NA NA
IAT5.A*** 0 – 0.5 HTA0012-05 10,980 6.68J NA NA NA NA NA
IAT5.B 0.5 – 2 HTA0062-03 2,328 8.61J NA NA NA NA NA
IAT5.C 2 – 3 HTA0062-04 2,580 3.27J NA NA NA NA NA
IAT5.D*** 0 – 0.5 HTA0029-02 5,410 7.12J NA NA NA NA NA
IAT5.E*** 0 – 0.5 HTA0029-01 15,897 7.49J NA NA NA NA NA
DOH EALs 450 20 3.0 11 2.1 0.25 32
Notes: NA = not analyzed (1) = Dioxin/furan TEQs calculated based on 2005 World Health Organization TEFs, calculation shown in Appendix III. (2) = PCP refers to pentachlorophenol Blue, italicized values indicate results below method detection limit (MDL), MDL value shown. J = estimated value, concentration less than reporting limit but exceeds MDL Boldfaced, shaded value indicates concentration exceeds default DOH EAL. DOH EAL = Summer 2008 (March 2009 Update) default DOH EAL for sites above non-drinking water aquifers and that are greater
than 150 meters from the nearest surface water body. *Samples SA2.A, SA2.E, and SA2.F are field replicates, values used to calculate mean and standard deviation for surface soils in Spill
Areas **Samples IAT1.B, IAT1.D,and IAT1.E are field replicates, values used to calculate mean and standard deviation for subsurface soils
in Spill Areas and Investigation Areas ***Samples IAT5.A, IAT5.D, and IAT5.E are field replicates, values used to calculate mean and standard deviation for surface soils
in Investigation Areas
As indicated in Table 5, samples from the three Spill Areas (SA1 to SA3) contained the highest dioxins/furans TEQ concentrations, as anticipated. The Spill Areas also contained elevated concentrations of arsenic, pentachlorophenol, and triazine pesticides. In general, COC concentrations were highest in the first 0.5 feet of soil in each of the three Spill Areas. The data shows that COC concentrations generally become significantly lower in each successive depth layer (0.5- to 2-foot layer, 2- to 5-foot layer, and 5- to 10-foot layer). Spill Area 3 is the only exception to this pattern, with dioxins/furans TEQs and pentachlorophenol concentrations remaining relatively high, even in the 5- to 10-foot layer.
The Investigation Areas (IA1 to IA4, IAT1 to IAT5) of the site also contain elevated dioxins/furans TEQ concentrations, particularly in the surface soils (top 0.5 feet of soil). Similar to the Spill Areas, dioxins/furans TEQ concentrations tend to be lower in deeper layers, with the exception being in decision unit IAT4, where the concentration in the 2- to 3-foot layer is higher than the concentration at the surface. The data also indicate that elevated dioxins/furans TEQ concentrations in decision units IAT1 and IAT3 only exist in the top 0.5 feet of soil and the top 2-feet of soil, respectively, with concentrations in deeper layers detected below the 450 ng/kg EAL. Furthermore, the data indicates that arsenic concentrations in the Investigation Areas are below the background EAL of 20 mg/kg.

Site Investigation Report & EHE 33 ETC Project No. 09-2012 East Kapolei PML Site March 2010
Table 6: Analytical Data – Secondary Analyses
Sample ID
Sample Depth
(ft)
SPLP PCP
(mg/l)
SPLP Ametryn
(mg/l)
SPLP Atrazine
(mg/l)
SPLP Simazine
(mg/l)
SPLP Trifluralin
(mg/l)
Clay Fraction
Total Organic Carbon (mg/kg)
SA1.A 0 – 0.5 0.220 12.3 0.188 0.05 0.05 49.32% 27,000
SA1.B 0.5 – 2 0.05 0.05 0.05 0.05 0.05 23.45% 10,000
SA1.C 2 – 5 0.05 0.05 0.05 0.05 0.05 33.95% 2,900J
SA1.D 5 – 10 0.05 0.070J 0.05 0.05 0.05 39.07% 1,700
SA2.A* 0 – 0.5 3.93 3.80 0.858 0.05 0.05 41.36% 53,000
SA2.B 0.5 – 2 0.05 0.05 0.05 0.05 0.05 33.00% 48,000
SA2.C 2 – 5 0.05 0.05 0.05 0.05 0.05 31.74% 41,000
SA2.D 5 – 10 0.103 0.075J 0.05 0.05 0.05 40.65% 4,000J
SA2.E* 0 – 0.5 3.91 4.46 1.52 0.385 0.05 38.92% 43,000
SA2.F* 0 – 0.5 3.44 2.51 0.462 0.05 0.05 36.91% 70,000
SA3.A 0 – 0.5 0.270 1.25 0.698 0.05 0.05 27.99% 25,000
SA3.B 0.5 – 2 0.05 0.05 0.05 0.05 0.05 34.75% 24,000
SA3.C 2 – 5 0.094 0.05 0.05 0.05 0.05 33.8% 2,300J
SA3.D 5 – 10 0.845 0.354 0.05 0.05 0.05 38.65% 2,400J
Notes: Blue, italicized values indicate results below MDL, MDL value shown. J = estimated value, concentration less than reporting limit but exceeds MDL
Data from secondary analyses indicate that pentachlorophenol and triazine pesticides (minus trifluralin) are leachable from site soils based on SPLP data. A further evaluation of the leaching potential is presented in calculations summarized in Table 8.
Table 7: Analytical Data – TCLP Analyses
Analyte SA1.A SA2.A SA3.A Toxicity
Threshold
Arsenic 0.0089 0.2430J 0.0089 5
Barium 0.6380J 0.5060J 0.7410J 100
Cadmium 0.0057J 0.0229J 0.0109J 1
Chromium 0.0272J 0.2620 0.0849J 5
Lead 0.0607J 0.0100J 0.0851J 5
Mercury 0.000283 0.00028 0.00028 0.2
Selenium 0.0041 0.0041 0.0041 1
Silver 0.0123 0.0123 0.0123 5
Pentachlorophenol 0.059J 0.630 0.05 100
Chlordane 0.005 0.005 0.005 0.03
Endrin 0.002 0.002 0.002 0.02
Heptachlor 0.002 0.002 0.002 0.008
Heptachlor epoxide 0.002 0.002 0.002 0.008
Lindane (Gamma-BHC) 0.05 0.05 0.05 0.4
Methoxychlor 0.05 0.05 0.05 10
Toxaphene 0.05 0.05 0.05 0.5
Notes: All results in mg/L Blue, italicized values indicate results below MDL, MDL value shown. J = estimated value, concentration less than reporting limit but exceeds MDL

Site Investigation Report & EHE 34 ETC Project No. 09-2012 East Kapolei PML Site March 2010
Data from TCLP analyses of surface soils within the Spill Areas, the area and layer anticipated to contain the highest COC concentrations, indicate that all detected concentrations are below the respective toxicity threshold criteria identified in 40 CFR 261.24. As such, the soil would not be considered a RCRA-regulated hazardous waste based on toxicity characteristics.
Furthermore, through discussions with the DOH and review of certain sections of the CFR, it was determined that although it is suspected that the dioxin-contaminated soil is associated with the use of pentachlorophenol and other pesticides at the East Kapolei PML site, such soil would not be considered a F-listed waste since it is believed that the farmers’ exemption provided in 40 CFR 262.70 would apply. The farmers’ exemption indicates that farmers disposing of waste pesticides from their own use at the site upon which the pesticides were used are exempt from hazardous waste rules provided that the pesticides were being used in the manner intended and that cleaning of the pesticide containers was performed in accordance with accepted practices and product labeling at the time. Specifically, 40 CFR 262.10(f) states: “A farmer who generates waste pesticides which are hazardous waste and who complies with all the requirements of §262.70 is not required to comply with other standards in this part or 40 CFR parts 270, 264, 265, or 268 with respect to such pesticides.” The farmers’ exemption in 40 CFR 262.70 states: “A farmer disposing of waste pesticides from his own use which are hazardous wastes is not required to comply with standards in this part or other standards in 40 CFR parts 264, 265, 268, or 270 for those wastes provided he triple rinses each emptied pesticide container in accordance with §261.7(b)(3) and disposes of the pesticide residues on his own farm in a manner consistent with the disposal instructions on the pesticide label.”
The DOH concurs that contaminated soils at the East Kapolei PML site are likely from the use of pesticides in the manner intended and cleaning of product containers were conducted in accordance with accepted practices and labeling instructions at the time; and not associated with the improper disposal of excess or waste pesticides. Therefore, based on the TCLP data and DOH’s concurrence with DHHL (the generator) that the impacted soil falls under the farmers’ exemption, it is anticipated that soil from the East Kapolei PML site would not be considered a RCRA hazardous waste.

Site Investigation Report & EHE 35 ETC Project No. 09-2012 East Kapolei PML Site March 2010
Table 8: Sorption Coefficients and Leaching Potential
Sample ID
PCP Mass Ratio
Kd-PCP
(cm3/g)
Ametryn Mass Ratio
Kd-Ametryn (cm3/g)
Atrazine Mass Ratio
Kd-Atrazine (cm3/g)
Simazine Mass Ratio
Kd-Simazine (cm3/g)
Trifluralin Mass Ratio
Kd-Trifluralin
(cm3/g)
SA1.A 203% *0 174% *0 125% *0 249% NC 12% 150
SA1.B 52% 18 53% 18 - - - - - -
SA1.C 70% 8.5 89% 2.4 - - - - - -
SA1.D 134% NC 85% 3.4 586% NC - - - -
SA2.A* 146% *0 104% *0 138% *0 87% 2.9 87% 3.1
SA2.B 22% 72 21% 76 287% NC - - 201% NC
SA2.C 72% 7.7 177% NC - - - - - -
SA2.D 158% *0 103% *0 - - - - - -
SA2.E* 79% 5.4 116% *0 184% *0 1228% *0 131% NC
SA2.F* 137% *0 43% 27 128% *0 58% 14 10% 180
SA3.A 108% *0 164% *0 148% *0 12% 15 159% NC
SA3.B 45% 24 35% 36 - - - - 25% 61
SA3.C 58% 14 38% 33 - - - - - -
SA3.D 200% *0 110% *0 394% NC - - - - Notes: Mass Ratio = total contaminant mass in the SPLP solution (reported concentration in solution multiplied by volume of solution used)
divided by contaminant mass in the soil sample (reported concentration in soil multiplied by mass of soil used). Kd = sorption coefficient *0 = total contaminant mass in SPLP solution exceeds contaminant mass in the soil sample, Kd value of “1” estimated NC = contaminant not detected in SPLP analysis, mass ratio exceeds 100% using ½ SPLP MDL, minimum Kd value could not be
estimated - = contaminant not detected in either soil sample or SPLP extract Kd values less than 20 cm3/g indicate potential leaching hazard Boldfaced, shaded values = contaminant concentrations in the soil sample exceed leaching EAL and Kd value less than 20 cm3/g
As shown in Table 8, calculations using both total and SPLP pentachlorophenol and triazine pesticides data indicate that the contaminant concentrations present at the site, particularly in the surface soils, have a potential to leach out of the soil into underlying groundwater.

Site Investigation Report & EHE 36 ETC Project No. 09-2012 East Kapolei PML Site March 2010
Table 9: Adjusted Dioxin TEQ and Arsenic Data
Sample ID TEQs
(ng/kg)
Adjusted TEQs
(ng/kg)
Arsenic (mg/kg)
Adjusted Arsenic (mg/kg)
SA1.A 162,190 226,201 78.4 101.61
SA1.B 20,475 20,652 33.3 35.02
SA1.C 3,982 4,159 9.53J 11.25
SA1.D 2,810 2,987 3.95J 5.67
SA2.A* 350,420 414,431 57.1 80.31
SA2.B 167,683 167,860 41.5 43.22
SA2.C 29,307 29,484 9.03J 10.75
SA2.D 6,057 6,234 4.65J 6.37
SA2.E* 453,020 517,031 45.2 46.92
SA2.F* 335,410 399,421 90 91.72
SA3.A 615,100 679,111 27.4 50.61
SA3.B 55,102 55,279 7.13J 8.85
SA3.C 321,457 321,634 13.2 14.92
SA3.D 36,907 37,084 5.05J 6.77
IA1 701.98 5,949 8.41J 8.82
IA2 724.01 5,971 6.19J 6.6
IA3 1,324.48 6,571 7.60J 8.01
IA4 479.28 5,726 6.27J 6.68
IAT1.A 2,386 7,633 6.49J 6.9
IAT1.B** 324 501 3.63J 5.35
IAT1.C 22 199 19.9 21.62
IAT1.D** 545 722 3.92J 5.64
IAT1.E** 196 373 6.75J 8.47
IAT2.A 3,959 9,206 4.63J 5.04
IAT2.B 1,505 1,682 5.23J 6.95
IAT2.C 4,432 4,609 1.43J 3.15
IAT3.A 18,371 23,618 19 19.41
IAT3.B 1,615 1,792 5.59J 7.31
IAT3.C 223 400 5.94J 7.66
IAT4.A 14,606 19,853 8.14J 8.55
IAT4.B 2,382 2,559 3.31J 5.03
IAT4.C 27,860 28,037 0.751 2.0955

Site Investigation Report & EHE 37 ETC Project No. 09-2012 East Kapolei PML Site March 2010
Sample ID TEQs
(ng/kg)
Adjusted TEQs
(ng/kg)
Arsenic (mg/kg)
Adjusted Arsenic (mg/kg)
IAT5.A*** 10,980 16,227 6.68J 7.09
IAT5.B 2,328 2,505 8.61J 10.33
IAT5.C 2,580 2,757 3.27J 4.99
IAT5.D*** 5,410 10,657 7.12J 7.53
IAT5.E*** 15,897 21,144 7.49J 7.9
DOH EALs 450 450 20 20
Notes: Blue, italicized values indicate results below MDL, MDL value shown. J = estimated value, concentration less than reporting limit but exceeds MDL Boldfaced, shaded value indicates concentration exceeds default DOH EAL. DOH EAL = Summer 2008 (March 2009 Update) default DOH EAL for sites above non-
drinking water aquifers and that are greater than 150 meters from the nearest surface water body.
*Samples SA2.A, SA2.E, and SA2.F are field replicates, values used to calculate mean and standard deviation for surface soils in Spill Areas
**Samples IAT1.B, IAT1.D,a dn IAT1.E are field replicates, values used to calculate mean and standard deviation for subsurface soils in Spill Areas and Investigation Areas
***Samples IAT5.A, IAT5.D, and IAT5.E are field replicates, values used to calculate mean and standard deviation for surface soils in Investigation Areas
Table 9 presents the adjusted dioxins/furans TEQ and adjusted arsenic concentrations calculated using standard deviations from the appropriate set of field replicate samples (see Table 4). As indicated, the addition of one standard deviation did not result in significant changes to the findings. The primary change was to the dioxins/furans TEQ concentration for sample IAT1.B, which had a reported concentration below the default DOH EAL and an adjusted dioxins/furans TEQ concentration exceeding the default EAL. Similarly, the reported arsenic concentration in sample IAT1.C was below the DOH EAL, however the adjusted arsenic concentration just exceeds the DOH EAL.
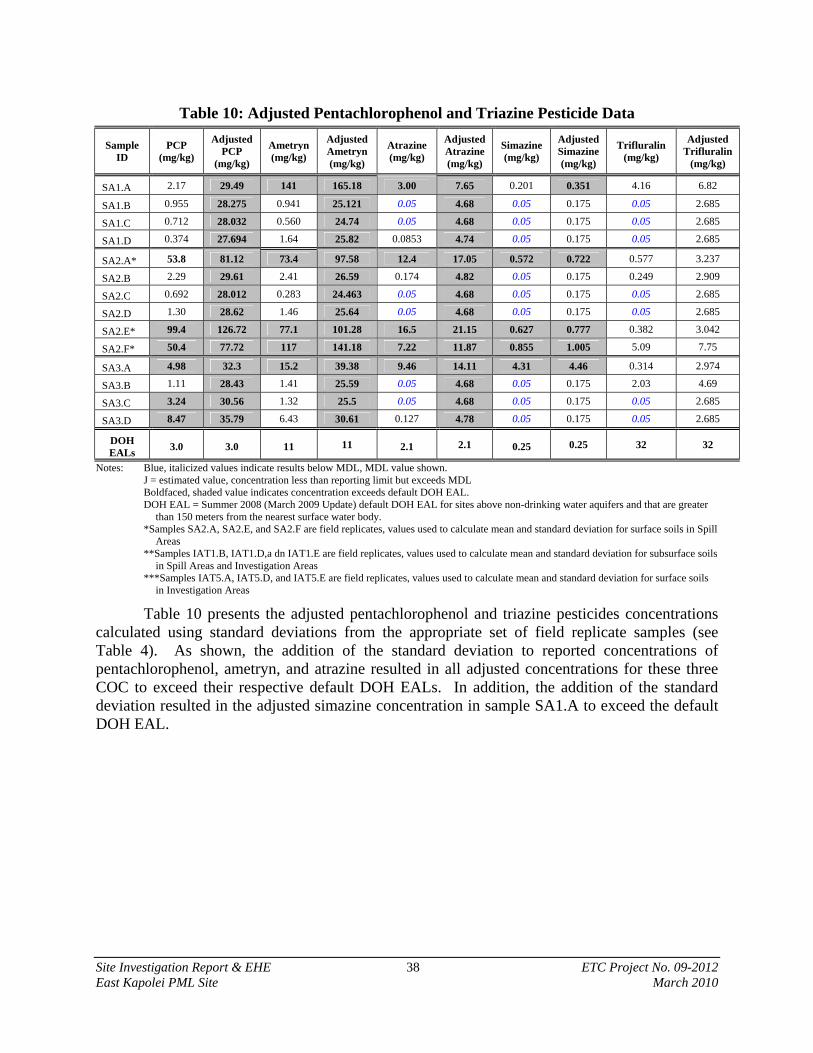
Site Investigation Report & EHE 38 ETC Project No. 09-2012 East Kapolei PML Site March 2010
Table 10: Adjusted Pentachlorophenol and Triazine Pesticide Data
Sample ID
PCP (mg/kg)
Adjusted PCP
(mg/kg)
Ametryn (mg/kg)
Adjusted Ametryn (mg/kg)
Atrazine (mg/kg)
Adjusted Atrazine (mg/kg)
Simazine (mg/kg)
Adjusted Simazine (mg/kg)
Trifluralin (mg/kg)
Adjusted Trifluralin
(mg/kg)
SA1.A 2.17 29.49 141 165.18 3.00 7.65 0.201 0.351 4.16 6.82
SA1.B 0.955 28.275 0.941 25.121 0.05 4.68 0.05 0.175 0.05 2.685
SA1.C 0.712 28.032 0.560 24.74 0.05 4.68 0.05 0.175 0.05 2.685
SA1.D 0.374 27.694 1.64 25.82 0.0853 4.74 0.05 0.175 0.05 2.685
SA2.A* 53.8 81.12 73.4 97.58 12.4 17.05 0.572 0.722 0.577 3.237
SA2.B 2.29 29.61 2.41 26.59 0.174 4.82 0.05 0.175 0.249 2.909
SA2.C 0.692 28.012 0.283 24.463 0.05 4.68 0.05 0.175 0.05 2.685
SA2.D 1.30 28.62 1.46 25.64 0.05 4.68 0.05 0.175 0.05 2.685
SA2.E* 99.4 126.72 77.1 101.28 16.5 21.15 0.627 0.777 0.382 3.042
SA2.F* 50.4 77.72 117 141.18 7.22 11.87 0.855 1.005 5.09 7.75
SA3.A 4.98 32.3 15.2 39.38 9.46 14.11 4.31 4.46 0.314 2.974
SA3.B 1.11 28.43 1.41 25.59 0.05 4.68 0.05 0.175 2.03 4.69
SA3.C 3.24 30.56 1.32 25.5 0.05 4.68 0.05 0.175 0.05 2.685
SA3.D 8.47 35.79 6.43 30.61 0.127 4.78 0.05 0.175 0.05 2.685
DOH EALs
3.0 3.0 11 11 2.1 2.1 0.25 0.25 32 32
Notes: Blue, italicized values indicate results below MDL, MDL value shown. J = estimated value, concentration less than reporting limit but exceeds MDL Boldfaced, shaded value indicates concentration exceeds default DOH EAL. DOH EAL = Summer 2008 (March 2009 Update) default DOH EAL for sites above non-drinking water aquifers and that are greater
than 150 meters from the nearest surface water body. *Samples SA2.A, SA2.E, and SA2.F are field replicates, values used to calculate mean and standard deviation for surface soils in Spill
Areas **Samples IAT1.B, IAT1.D,a dn IAT1.E are field replicates, values used to calculate mean and standard deviation for subsurface soils
in Spill Areas and Investigation Areas ***Samples IAT5.A, IAT5.D, and IAT5.E are field replicates, values used to calculate mean and standard deviation for surface soils
in Investigation Areas
Table 10 presents the adjusted pentachlorophenol and triazine pesticides concentrations calculated using standard deviations from the appropriate set of field replicate samples (see Table 4). As shown, the addition of the standard deviation to reported concentrations of pentachlorophenol, ametryn, and atrazine resulted in all adjusted concentrations for these three COC to exceed their respective default DOH EALs. In addition, the addition of the standard deviation resulted in the adjusted simazine concentration in sample SA1.A to exceed the default DOH EAL.

Site Investigation Report & EHE 39 ETC Project No. 09-2012 East Kapolei PML Site March 2010
11.0 ENVIRONMENTAL HAZARD EVALUATION
The Environmental Hazard Evaluation (EHE) process was developed by the Hawaii DOH to serve as a link between site investigation activities and the proposed response activities to be undertaken and evaluated in a Remedial Alternatives Analysis (RAA). The EHE is intended to identify potential environmental hazards associated with contaminant concentrations in site media through comparison with DOH EALs established for common environmental hazards. A summary of these common environmental hazards are listed below:
Contaminated Soil
Direct Exposure: exposure to contaminants via incidental ingestion, dermal absorption, and inhalation of vapors or dust in outdoor air
Vapor Intrusion: emission of volatile contaminants from soil into overlying buildings
Leaching: leaching of contamination from soil by infiltration of surface water (rainfall, irrigation, etc.) and downward migration of leachate into underlying groundwater
Terrestrial ecotoxicity: toxicity to terrestrial flora and fauna
Gross contamination: potentially mobile free product, odors, aesthetics, explosive hazards, and general resource degradation
Contaminated Groundwater
Drinking water toxicity: toxicity concerns associated with contamination of groundwater used as a current or potential drinking water source
Vapor intrusion: emission of volatile contaminants from groundwater into overlying buildings
Aquatic ecotoxocity: discharges of contaminated groundwater to surface water bodies and toxicity to aquatic organisms, including fish and shellfish used for human consumption
Gross contamination: potentially mobile free product, odors, aesthetics, explosive hazards, and general resource degradation

Site Investigation Report & EHE 40 ETC Project No. 09-2012 East Kapolei PML Site March 2010
11.1 Previous Investigations
Historical investigations, summarized in Section 4.0, indicated that substantial impacts associated with the COC were identified within the East Kapolei PML site, particularly in the areas immediately surrounding the mixing and loading operations (i.e., the Spill Areas identified in the existing investigation). Although other contaminants were tested for in previous investigations based on their suspected use in sugarcane cultivation operations, the data suggest that the COC identified for the current investigation were the most consistently identified at elevated concentrations. Therefore, the current investigation was performed to obtain a better estimation of the extent and magnitude of contamination within the East Kapolei PML site.
Historical investigations also suggest that there are contaminant impacts in soils outside of the existing East Kapolei PML site fence line. In particular, data obtained by ETC and documented in the August 2007 Final Site Investigation and Preliminary Remedial Alternatives Analysis indicate that dioxin impacts extend beyond the fence line, generally outside of the southwest gate, beyond decision units 8, 9, and 10 from the first “ring” of decision units, but limited to within the second “ring” of decision units. Similarly, discrete sample data collected by the US EPA in 2009 indicate that elevated arsenic concentrations exist in soil at depths of approximately 1 to 2 feet bgs in the same area and extending out to the south of the PML site, within the intersection of the coral/dirt roads. Finally, limited data collected by the DOH/EPA in the July 2000 Site Inspection indicate the presence of elevated dioxin TEQ concentrations in soil/sediment accumulated in the concrete-lined ditch adjacent to the East Kapolei PML site. Although the extent of dioxin impacts were not determined, DHHL and DOH decided that soil/sediment from sections of the concrete lined ditch located adjacent to and southwest (downgradient) of the East Kapolei PML site would be removed from the ditch during site remediation activities and addressed similar to other dioxin-impacted soil.
11.2 Magnitude and Extent of Contamination
Based on review of current and historic data, the extent of COC impacts to soils at concentrations exceeding default DOH EALs within and adjacent to the East Kapolei PML site is shown in Figures 7 through 9 in Appendix I. In general, the highest dioxins/furans TEQ concentrations were identified in the surface soil within the Spill Areas (decision units SA1 through SA3, see Appendix I, Figure 8), with decreasing concentrations in the Investigation Areas (decision units IA1 through IA4 and IAT1 through IAT5, see Appendix I, Figure 8) and the lowest concentrations out beyond the fence line. The dioxins/furans TEQ concentrations also appeared to decrease with depth, however the concentrations within the 5- to 10-foot depth layers of the Spill Area still contained elevated concentrations (e.g., vertical delineation of dioxins/furans contamination has not been completed). Elevated dioxin concentrations were also identified in surface soils outside the southwest gate, but limited to within the second ring of decision units described in the August 2007 Final Site Investigation and Preliminary Remedial Alternatives Analysis report.
Arsenic concentrations were elevated within the Spill Areas, but concentrations generally decreased with depth and appeared to be limited to the top 2 feet of soil. Although elevated arsenic concentrations were not identified in the Investigation Areas, discrete sample data from outside of the fence line indicated elevated arsenic concentrations in the 1- to 2-foot layer of soil outside the southwest gate and within the intersection of the coral/dirt roadways.

Site Investigation Report & EHE 41 ETC Project No. 09-2012 East Kapolei PML Site March 2010
Historic data indicated that elevated pentachlorophenol and triazine pesticide concentrations were generally limited to the Spill Areas of the East Kapolei PML site. Therefore, pentachlorophenol and triazine pesticides were only analyzed for soil samples within the Spill Areas. Data from the current investigation indicate that elevated concentrations were generally limited to the surface soil layer (with the exception of decision unit area SA3, where elevated pentachlorophenol concentrations were found within the 5- to 10-foot soil layer). However, uncertainty in the data measured by the calculated standard deviation (and thus the adjusted concentrations) requires that the assumption be made that pentachlorophenol and triazine pesticide contamination extend to 10 feet bgs.
Based on an overall evaluation of all available data compared to default DOH EALs, the following conclusions were made regarding the extent of contamination:
Dioxin contamination exists within surface soils of all areas of the East Kapolei PML site (within the fence line) to depths of at least 10 feet bgs within the Spill Areas; to 5 feet in decision units IAT2, IAT4, and IAT5; to 2 feet bgs in decision units IAT1 and IAT3; and to 1 feet bgs in decision units IA1 through IA4. Discussions with DOH indicate that anything beyond 10 feet bgs would not be considered a significant issue since soil beyond 10 feet bgs would not be considered accessible to site users. It is also anticipated that dioxin contamination in soils outside of the fence line extend to a depth of 1 feet bgs and it is assumed that all soil and sediment in the concrete-lined ditch, from immediately adjacent to the PML site and downgradient (to Kualakai Parkway) is impacted with dioxins/furans at concentrations exceeding the default DOH EAL.
Arsenic contamination exists in the top 2 feet of soil within the Spill Areas and within the top 2 feet of soil outside of the East Kapolei PML site fence line, within the coral/dirt roadways immediately adjacent to the southwest gate and within the roadway intersection.
Pentachlorophenol and triazine pesticide contamination exists within the Spill Areas of the East Kapolei PML site down to 10 feet bgs.
11.3 Comparison to DOH EALs
Analytical data were initially compared to current, default DOH EALs to identify areas of concern. In particular, historical data for areas within the East Kapolei PML site boundaries (i.e., within the fence line) were screened using the default DOH EALs to assist with establishing decision unit boundaries and selecting COC for the current investigation. Data from the current investigation was used to identify existing environmental hazards. Historical data for areas outside of the East Kapolei PML site boundaries (i.e., outside of the fence line) were used to assess the lateral extent of COC impacts and identify existing environmental hazards. The following subsections present the environmental hazards and associated DOH EALs for the various COC. All DOH EALs are for soil based on unrestricted land use scenarios, assuming that groundwater beneath the site is not a current or potential drinking water source and the nearest surface water body is greater then 150 meters from the property.

Site Investigation Report & EHE 42 ETC Project No. 09-2012 East Kapolei PML Site March 2010
11.3.1 Arsenic
Environmental hazards and associated DOH EALs for arsenic are presented in the table below.
Environmental Hazards DOH EALs
Direct Exposure 20 mg/kg (background)
Vapor Emissions -
Terrestrial Ecotoxicity 20 mg/kg (background)
Gross Contamination 1,000 mg/kg
Leaching Batch Test
PML Site, Spill Areas
Data for samples collected from within the Spill Area decision units indicate reported concentrations of arsenic exceeded the Hawaii background EAL of 20 mg/kg (pertains to both direct exposure and terrestrial ecotoxicity hazards) in samples SA1.A (0- to 0.5-foot layer), SA1.B (0.5- to 2-foot layer), SA2.A (0- to 0.5-foot layer), SA2.B (0.5- to 2-foot layer), SA2.E (0- to 0.5-foot layer, field replicate of SA2.A), SA2.F (0- to 0.5-foot layer, field replicate of SA2.A), and SA3.A (0- to 0.5-foot layer); with the highest detected concentration being 90 mg/kg. Reported arsenic concentrations did not exceed the gross contamination EAL and arsenic is not considered to be significantly leachable under neutral pH conditions.
Calculation of the adjusted arsenic values were performed by adding the standard deviation of 23.21 mg/kg (calculated for surface soils in the Spill Areas using reported concentrations from replicate samples SA2.A, SA2.E, and SA2.F) to surface soil results in the Spill Areas. The standard deviation of 1.72 mg/kg (calculated for subsurface soils in the Investigation Areas using reported concentrations from replicate samples IAT1.B, IAT1.D, and IAT1.E) to subsurface soil results in the Spill Areas. The calculated relative standard deviations were 36% and 36%, respectively.
Additions of the standard deviations to the reported concentrations did not change the findings. All reported concentrations that were below the Hawaii background EAL remained below the EAL. PML Site, Investigation Areas
Data for samples collected from within the Investigation Area decision units indicate reported concentrations of arsenic were below the Hawaii background EAL of 20 mg/kg in all Investigation Area samples.
Calculation of the adjusted arsenic values were performed by adding the standard deviation of 0.41 mg/kg (calculated for surface soils in the Investigation Areas using reported concentrations from replicate samples IAT5.A, IAT5.D, and IAT5.E) to surface soil results in the Investigation Areas. The standard deviation of 1.72 mg/kg (calculated for subsurface soils in the Investigation Areas using reported concentrations from replicate samples IAT1.B, IAT1.D, and IAT1.E) was added to subsurface soil results in the Investigation Areas. The calculated relative standard deviations were 6% and 36%, respectively.

Site Investigation Report & EHE 43 ETC Project No. 09-2012 East Kapolei PML Site March 2010
Addition of the standard deviations to the reported concentrations resulted in one sample (IAT1.C, 2- to 3-foot layer) having an adjusted arsenic concentration of 21.62 mg/kg, just above the Hawaii background EAL of 20 mg/kg. Outside PML Site
Discrete soil sample data from the 2009 EPA investigation indicated the presence of arsenic concentrations exceeding the Hawaii background EAL of 20 mg/kg in certain samples collected from 0- to 1-feet bgs and 1- to 2-feet bgs. The elevated arsenic concentrations were generally identified in discrete samples collected from the south and southwest of the East Kapolei PML site, located outside of the southwest gate and within the coral/dirt roadway intersection. Although there were two discrete surface (0- to 1-foot bgs) samples and four discrete near-surface (1- to 2-foot bgs) samples that had arsenic concentrations exceeding the Hawaii background EAL, concentrations were on the lower range of values and were not considered to be indicative of the entire area. Based on the data, the areas with elevated arsenic concentrations were considered to pose a direct exposure hazard to future site users.
11.3.2 Dioxins/Furans
Environmental hazards and associated DOH EALs for dioxins/furans are presented in the table below.
Environmental Hazards DOH EALs
Direct Exposure 450 ng/kg
Vapor Emissions -
Terrestrial Ecotoxicity -
Gross Contamination 1,000 mg/kg
Leaching 0.19 mg/kg
PML Site, Spill Areas
Data for samples collected from the Spill Area decision units indicate all reported concentrations of dioxins/furans TEQ in the Spill Area samples exceeded the direct exposure Tier 2 EAL of 450 ng/kg. Furthermore, reported concentrations in samples SA2.A, SA2.E, SA2.F, SA3.A, and SA3.C exceeded the soil leaching EAL of 0.19 mg/kg (190,000 ng/kg).
Calculation of the adjusted dioxin TEQ values were performed by adding the standard deviation of 64,011 ng/kg (calculated for surface soils in the Spill Areas using reported concentrations from replicate samples SA2.A, SA2.E, and SA2.F) to surface soil results in the Spill Area. The standard deviation of 177 ng/kg (calculated for subsurface soil in the Spill Areas using reported concentrations from replicate samples IAT1.B, IAT1.D, and IAT1.E) was added to subsurface soil results in the Spill Areas. The calculated relative standard deviations were 17% and 50%, respectively.
Use of the adjusted dioxin TEQ values did not change any of the findings from the reported concentrations.

Site Investigation Report & EHE 44 ETC Project No. 09-2012 East Kapolei PML Site March 2010
PML Site, Investigation Areas
Data for samples collected from the Investigation Area decision units indicate reported concentrations of dioxins/furans TEQ in the Investigation Area samples IA1 – IA4, IAT1.A, IAT1.D, IAT2.A – IAT2.C, IAT3.A, IAT3.B, IAT4.A, IAT4.B, IAT4.C, IAT5.A, IAT5.B, IAT5.C, IAT5.D, and IAT5.E exceeded the direct exposure Tier 2 EAL of 450 ng/kg. None of the reported concentrations exceeded the soil leaching EAL.
Calculation of the adjusted dioxin TEQ values were performed by adding the standard deviation of 5,247 ng/kg (calculated for surface soils in the Investigation Areas using reported concentrations from replicate samples IAT5.A, IAT5.D, and IAT5.E) to surface soil results in the Investigation Areas. The standard deviation of 177 ng/kg (calculated for subsurface soil in the Investigation Areas using reported concentrations from replicate samples IAT1.B, IAT1.D, and IAT1.E) was added to subsurface soil results in the Investigation Areas. The calculated relative standard deviations were 49% and 50% respectively.
Use of the adjusted dioxin TEQ values did not change any of the findings from the reported concentrations, with the exception of sample IAT1.B, which exceeded the direct exposure Tier 2 EAL of 450 ng/kg.
Note that the reported concentrations in surface samples collected from decision units IA1 through IA4 (located between the original PML site fence line and the second PML site fence line) ranged from 479.28 ng/kg to 1,324.48 ng/kg, which were relatively similar in magnitude to the Tier 2 EAL of 450 ng/kg as compared to concentrations in other areas of the site. The standard deviation of 5,247 ng/kg obtained from triplicate samples collected from decision unit area IAT5 (situated in closer proximity to the Spill Areas, or the suspect source areas of contamination) may not be indicative of the actual variance in these particular decision units (IA1 through IA4). Lacking triplicate data for soil samples from these specific areas, a more appropriate method to quantify variance may be adding the RSD from the IAT5 triplicate samples (49%) to the reported concentrations from IA1 through IA4. This would result in values ranging from 714.13 ng/kg to 1,973.48 ng/kg.
Outside PML Site
Data from the July 3, 2000 Site Inspection – Ewa Sugar Mill/Oahu Sugar Co. Pesticide Mixing and Loading Site indicate that soil/sediment within the section of concrete-lined ditch adjacent to the PML site contains dioxins/furans TEQ concentrations exceeding the direct exposure Tier 2 EAL. It is also assumed that soil/sediment in downgradient portions of the concrete-lined ditch (southwest of the PML site to Kualakai Parkway) also contain elevated dioxins/furans TEQ concentrations.

Site Investigation Report & EHE 45 ETC Project No. 09-2012 East Kapolei PML Site March 2010
Data from the August 2007 Final Site Investigation and Preliminary Remedial Alternatives Analysis report indicate that dioxins/furans TEQ concentrations exceeded the direct exposure Tier 2 EAL approximately 50 feet south-southwest of the PML site within decision units 8, 9, and 10 from the first “ring” of decision units (located adjacent and to the north-northwest of the current decision units IA1 through IA4) but were below the direct exposure Tier 2 EAL within the second “ring” of decision units approximately 50 feet beyond the first ring. Data from multi-increment samples collected from decision units 11 through 19 from the first “ring” of decision units (located adjacent to the current decision units IA1 through IA4) indicated dioxin TEQ concentrations were below the Tier 2 EAL. Comparing this data with the recent data obtained from decision units IA1 through IA4 shows a discernable concentration gradient in this direction (i.e., topographically upgradient), with the highest dioxin concentrations in the suspect Spill Areas gradually decreasing within the fenced PML site to below the DOH EAL in areas outside of the fence line. This pattern is consistent with speculation made by the U.S. EPA and the DOH during earlier investigations that culminated in the construction of the outer fence line of the PML site.
Although data indicates that dioxin TEQ concentrations in the surface soil decision units IA1 through IA4 exceed the Tier 2 EAL, it is believed that if decision units IA1 through IA4 were broken up into smaller decision units, such smaller decision units would continue to show a descending concentration gradient towards the north-northwest fence line and beyond. It is suspected that the soil increments collected from portions of decision units IA1 through IA4 in closer proximity to the Spill Areas contributed to the higher mean dioxin TEQ concentrations obtained for the overall decision unit. In other words, smaller decision units situated closer to the Spill Areas would likely exhibit dioxin TEQ concentrations higher than the mean and smaller decision units closer to the PML fence line (and therefore farther from the Spill Areas) would likely exhibit dioxin TEQ concentrations lower than the mean.
Discrete soil sample data from the 2009 EPA investigation indicated one discrete surface soil sample with a dioxins/furans TEQ concentration of 470 ng/kg (sample EK-20) approximately 250 feet southwest of the PML site. Furthermore, the investigation identified two discrete near-surface soil samples (1- to 2-feet bgs) with dioxins/furans TEQ concentrations of 480 ng/kg (sample EK-11) and 880 ng/kg (sample EK-46) adjacent to the north-northeast of the PML site. Based on discussions with the DOH, the dioxins/furans TEQ concentrations in these three discrete samples were not considered to be representative of the concentrations in the immediate vicinity based on other existing data from nearby samples and based on the mean concentrations reported in decision unit rings from the August 2007 Final Site Investigation and Preliminary Remedial Alternatives Analysis report. Therefore, these data points do not indicate a potential direct exposure hazard in these areas.

Site Investigation Report & EHE 46 ETC Project No. 09-2012 East Kapolei PML Site March 2010
11.3.3 Pentachlorophenol
Environmental hazards and associated DOH EALs for pentachlorophenol are presented in the table below.
Environmental Hazards DOH EALs
Direct Exposure 3.0 mg/kg
Vapor Emissions -
Terrestrial Ecotoxicity 5.0 mg/kg
Gross Contamination 500 mg/kg
Leaching 7.3 mg/kg
PML Site, Spill Areas
Data for samples collected from the Spill Area decision units indicate reported concentrations of pentachlorophenol exceeded the direct exposure EAL of 3.0 mg/kg in Spill Area samples SA2.A (0- to 0.5 feet bgs layer), SA2.E (0- to 0.5 feet bgs layer, replicate of SA2.A), SA2.F (0- to 0.5 feet bgs layer, replicate of SA2.A), SA3.A (0- to 0.5 feet bgs layer), SA3.C (2- to 5-foot bgs layer), and SA3.D (5- to 10-foot bgs layer).
Pentachlorophenol concentrations in SA2.A, SA2.E, SA2.F, and SA3.D also exceeded the terrestrial ecotoxicity and leaching EALs.
Calculation of the adjusted pentachlorophenol concentrations were performed by adding the standard deviation of 27.36 mg/kg (calculated for Spill Area soil samples using reported concentrations from replicate samples SA2.A, SA2.E, and SA2.F) to reported concentrations in the Spill Areas. The calculated relative standard deviation was 40%.
All adjusted pentachlorophenol concentrations exceeded the direct exposure, terrestrial ecotoxicity, and leaching EALs since the calculated standard deviation of 27.36 mg/kg alone exceeds the direct exposure, terrestrial ecotoxicity, and leaching EALs. Although leachable pentachlorophenol values were obtained using SPLP extractions, the calculated adsorption coefficients generally suggest that the pentachlorophenol is leachable from soils at the site.
PML Site, Investigation Areas and Outside PML Site
Historical data indicate that elevated pentachlorophenol concentrations were generally limited to the designated Spill Areas. Data collected for areas outside of the Spill Areas indicate pentachlorophenol concentrations below default DOH EALs. Therefore, pentachlorophenol analyses were limited to soil sample collected from within the Spill Area decision units.

Site Investigation Report & EHE 47 ETC Project No. 09-2012 East Kapolei PML Site March 2010
11.3.4 Ametryn
Environmental hazards and associated DOH EALs for ametryn are presented in the table below.
Environmental Hazards DOH EALs
Direct Exposure 110 mg/kg
Vapor Emissions -
Terrestrial Ecotoxicity -
Gross Contamination 500 mg/kg
Leaching 11 mg/kg
PML Site, Spill Areas
Data for samples collected from the Spill Area decision units indicate reported concentrations of ametryn exceeded the soil leaching EAL of 11 mg/kg in all Spill Area surface soil samples (SA1.A, SA2.A, SA2.E, SA2.F, and SA3.A). The reported concentration of ametryn in sample SA1.A and in replicate sample SA2.F also exceeded the direct exposure EAL of 110 mg/kg.
Calculation of the adjusted ametryn concentrations were performed by adding the standard deviation of 24.18 mg/kg (calculated for Spill Area soil samples using reported concentrations from replicate samples SA2.A, SA2.E, and SA2.F) to reported concentrations in the Spill Areas. The calculated relative standard deviation was 27%.
All adjusted ametryn concentrations exceeded the soil leaching EAL since the calculated standard deviation of 24.18 mg/kg alone exceeds the soil leaching EAL.
In addition, the adjusted ametryn concentrations for sample SA1.A and the adjusted mean concentration of the replicate samples (SA2.A, SA2.E, and SA2.F) for SA2.A exceeded the direct exposure EAL.
Although leachable ametryn values were obtained using SPLP extractions, the calculated adsorption coefficients generally suggest that the ametryn is leachable from soils at the site.
PML Site, Investigation Areas and Outside PML Site
Historical data indicate that elevated ametryn concentrations were generally limited to the designated Spill Areas. Data collected for areas outside of the Spill Areas indicate ametryn concentrations below default DOH EALs. Therefore, ametryn analyses were limited to soil sample collected from within the Spill Area decision units.

Site Investigation Report & EHE 48 ETC Project No. 09-2012 East Kapolei PML Site March 2010
11.3.5 Atrazine
Environmental hazards and associated DOH EALs for atrazine are presented in the table below.
Environmental Hazards DOH EALs
Direct Exposure 2.1 mg/kg
Vapor Emissions -
Terrestrial Ecotoxicity -
Gross Contamination 500 mg/kg
Leaching 13 mg/kg
PML Site, Spill Areas
Data for samples collected from the Spill Area decision units indicate reported concentrations of atrazine exceeded the direct exposure EAL of 2.1 mg/kg in all Spill Area surface soil samples (SA1.A, SA2.A, SA2.E, SA2.F, and SA3.A). The reported concentration of atrazine in one of the surface soil replicate samples (SA2.E) also exceeded the soil leaching EAL of 13 mg/kg.
Calculation of the adjusted atrazine concentrations were performed by adding the standard deviation of 4.65 mg/kg (calculated for Spill Area soil samples using reported concentrations from replicate samples SA2.A, SA2.E, and SA2.F) to reported concentrations in the Spill Areas. The calculated relative standard deviation was 39%.
All adjusted atrazine concentrations exceeded the direct exposure EAL since the calculated standard deviation of 4.65 mg/kg alone exceeded the direct exposure EAL.
In addition, the adjusted atrazine concentration for SA2.A and the adjusted mean concentration for samples SA2.A, SA2.E and SA2.F exceeded the soil leaching EAL of 13 mg/kg.
Leachable atrazine concentrations were obtained using SPLP extractions. The calculated adsorption coefficients suggest that atrazine is leachable from surface soils (SA1.A, SA2.A, SA2.E, SA2.F, and SA3.A), however adjusted concentrations in SA2.A, SA2.E, SA2.F, and SA3.A would be the only instances where leachable atrazine concentrations would pose an environmental hazard. PML Site, Investigation Areas and Outside PML Site
Historical data indicate that elevated atrazine concentrations were generally limited to the designated Spill Areas. Data collected for areas outside of the Spill Areas indicate atrazine concentrations below default DOH EALs. Therefore, atrazine analyses were limited to soil sample collected from within the Spill Area decision units.

Site Investigation Report & EHE 49 ETC Project No. 09-2012 East Kapolei PML Site March 2010
11.3.6 Simazine
Environmental hazards and associated DOH EALs for simazine are presented in the table below.
Environmental Hazards DOH EALs
Direct Exposure 4.0 mg/kg
Vapor Emissions -
Terrestrial Ecotoxicity -
Gross Contamination 500 mg/kg
Leaching 0.25 mg/kg
PML Site, Spill Areas
Data for samples collected from the Spill Area decision units indicate reported concentrations of simazine exceeded the soil leaching EAL of 0.25 mg/kg in Spill Area surface samples SA2.A, SA2.E, SA2.F, and SA3.A. The reported concentration of simazine in Spill Area surface soil sample SA3.A also exceeded the direct exposure EAL of 4.0 mg/kg.
Calculation of the adjusted simazine concentrations were performed by adding the standard deviation of 0.15 mg/kg (calculated for Spill Area soil samples using reported concentrations from replicate samples SA2.A, SA2.E, and SA2.F) to reported concentrations in the Spill Areas. The calculated relative standard deviation was 22%.
Addition of the standard deviation to the reported concentrations resulted in Spill Area surface sample SA1.A exceeding the soil leaching EAL, in addition to the findings based on the reported concentrations. As such, all adjusted simazine concentrations in Spill Area surface samples (SA1.A, SA2.A, SA2.E, SA2.F, and SA3.A) exceeded the soil leaching EAL of 0.25 mg/kg and the adjusted simazine concentration in Spill Area surface soil sample SA3.A also exceeded the direct exposure EAL of 4.0 mg/kg.
Leachable simazine concentrations were obtained using SPLP extractions. The calculated adsorption coefficients suggest that simazine is leachable from surface soils (SA1.A, SA2.A, SA2.E, SA2.F, and SA3.A).
PML Site, Investigation Areas and Outside PML Site
Historical data indicate that elevated simazine concentrations were generally limited to the designated Spill Areas. Data collected for areas outside of the Spill Areas indicate simazine concentrations below default DOH EALs. Therefore, simazine analyses were limited to soil sample collected from within the Spill Area decision units.

Site Investigation Report & EHE 50 ETC Project No. 09-2012 East Kapolei PML Site March 2010
11.3.7 Trifluralin
Environmental hazards and associated DOH EALs for trifluralin are presented in the table below.
Environmental Hazards DOH EALs
Direct Exposure 63 mg/kg
Vapor Emissions -
Terrestrial Ecotoxicity -
Gross Contamination 100 mg/kg
Leaching 32 mg/kg
PML Site, Spill Areas
Data for samples collected from the Spill Area decision units indicate reported concentrations of trifluralin in all Spill Area soil samples were below the default EAL of 32 mg/kg (pertaining to soil leaching).
Calculation of the adjusted trifluralin concentrations were performed by adding the standard deviation of 2.66 mg/kg (calculated for Spill Area soil samples using reported concentrations from replicate samples SA2.A, SA2.E, and SA2.F) to reported concentrations in the Spill Areas. The calculated relative standard deviation was 132%.
Addition of the standard deviation to the reported concentrations did not result in any changes, all trifluralin concentrations remained below the default EAL of 32 mg/kg. Therefore, there are no environmental hazards associated with trifluralin.
PML Site, Investigation Areas and Outside PML Site
Historical data indicate that elevated trifluralin concentrations were generally limited to the designated Spill Areas. Data collected for areas outside of the Spill Areas indicate trifluralin concentrations below default DOH EALs. Therefore, trifluralin analyses were limited to soil sample collected from within the Spill Area decision units.

Site Investigation Report & EHE 51 ETC Project No. 09-2012 East Kapolei PML Site March 2010
11.4 Summary of Environmental Hazards
An overall summary of environmental hazards by decision unit at the East Kapolei PML site is provided in Table 11 below. The summary is based on adjusted COC concentrations. Note that there were no vapor emissions or gross contamination hazards identified.
Table 11: Summary of Environmental Hazards
Decision Unit
Type/ Depth
Layer Vol. (cy)
Direct Exposure Terrestrial Ecotoxicity
Leaching to Groundwater
SA1.A 0-0.5’ 47.4 Dioxins, As, PCP, ametryn, atrazine As, PCP PCP, ametryn, simazine
SA1.B 0.5'-2' 142.2 Dioxins, As, PCP, atrazine As, PCP PCP, ametryn
SA1.C 2'-5' 284.4 Dioxins, PCP, atrazine PCP PCP, ametryn
SA1.D 5'-10' 474.1 Dioxins, PCP, atrazine PCP PCP, ametryn
SA2.A 0-0.5’ 31.4 Dioxins, As, PCP, ametryn, atrazine As, PCP Dioxins, PCP, ametryn, atrazine, simazine
SA2.B 0.5'-2' 94.2 Dioxins, As, PCP, atrazine As, PCP PCP, ametryn
SA2.C 2'-5' 183.3 Dioxins, PCP, atrazine PCP PCP, ametryn
SA2.D 5'-10' 313.9 Dioxins, PCP, atrazine PCP PCP, ametryn
SA3.A 0-0.5’ 19.4 Dioxins, As, PCP, atrazine, simazine
As, PCP Dioxins, PCP, ametryn, atrazine, simazine
SA3.B 0.5'-2' 58.3 Dioxins, PCP, atrazine PCP PCP, ametryn
SA3.C 2'-5' 116.7 Dioxins, PCP, atrazine PCP Dioxins, PCP, ametryn
SA3.D 5'-10' 194.4 Dioxins, PCP, atrazine PCP PCP, ametryn
IA1 0-0.5’ 78 Dioxins
IA2 0-0.5’ 83 Dioxins
IA3 0-0.5’ 78.8 Dioxins
IA4 0-0.5’ 66.9 Dioxins
IAT1.A 0-0.5’ 87.2 Dioxins
IAT1.B 0.5'-2' 261.7 Dioxins
IAT1.C 2'-3' 174.4 As As
IAT2.A 0-0.5’ 89.8 Dioxins
IAT2.B 0.5'-2' 269.4 Dioxins
IAT2.C 2'-3' 179.6 Dioxins
IAT3.A 0-0.5’ 53.4 Dioxins
IAT3.B 0.5'-2' 160.3 Dioxins
IAT3.C 2'-3' 106.9
IAT4.A 0-0.5’ 55.6 Dioxins
IAT4.B 0.5'-2' 166.7 Dioxins
IAT4.C 2'-3' 111.1 Dioxins
IAT5.A 0-0.5’ 45.6 Dioxins
IAT5.B 0.5'-2' 136.7 Dioxins
IAT5.C 2'-3' 91.1 Dioxins

Site Investigation Report & EHE 52 ETC Project No. 09-2012 East Kapolei PML Site March 2010
Outside of the East Kapolei PML site fence line, direct exposure and terrestrial ecotoxicity hazards associated with elevated arsenic concentrations exist in surface and near surface soil south and southwest of the PML, generally adjacent to the southwest gate and within the coral/dirt road intersection. Furthermore, direct exposure hazards associated with elevated dioxins/furans TEQ concentrations exist in surface soil southwest of the site out to the second decision unit ring identified in the August 2007 Final Site Investigation and Preliminary Remedial Alternatives Analysis report and within portions of the concrete-lined ditch adjacent to and southwest of the PML site. The estimated extent of direct exposure hazards and leaching to groundwater hazards are presented in Appendix I, Figures 10 and 11.

Site Investigation Report & EHE 53 ETC Project No. 09-2012 East Kapolei PML Site March 2010
12.0 CONCLUSIONS
Data obtained to-date at the East Kapolei PML site and for areas immediately adjacent to the East Kapolei PML site indicate elevated COC concentrations, particularly within the designated Spill Areas, or areas where the bulk of the pesticide mixing and loading operations occurred. COC concentrations (specifically arsenic and dioxins/furans) generally tended to decrease with increased distance from the Spill Areas and with increased depth. Exceptions to this occurred with arsenic (highest concentrations located outside of PML site in near surface soils within the coral/dirt road intersection) and dioxins in the Spill Area decision unit SA3 (high concentrations remain in the 5- to 10-foot bgs layer).
The data indicate that while the lateral extent of contamination has been generally delineated, the vertical extent of contamination has not been delineated. Based on discussions with the DOH HEER Office, calculations of the total volume of soil impacted by COC will need to be estimated based on assumed depths through evaluation of the patterns in the data.
12.1 Spill Areas
For the Spill Areas, total volume of impacted soil will be based on a depth of 10 feet bgs. Soil beneath 10 feet bgs is considered by the DOH to be unavailable to direct contact by surface receptors in unrestricted land use scenarios. Furthermore, the reported COC concentrations associated with leaching concerns at these depths were generally below their respective DOH EALs pertaining to soil leaching hazards. Total volumes of impacted soil in the Spill Areas with the associated environmental hazards are presented in Table 12, below.
Table 12: Impacted Soil Volumes, Spill Areas
Decision Unit Depth Layer Environmental Hazards Total Volume (cy)
SA1 0’ – 0.5’ Direct exposure, terrestrial ecotoxicity, leaching to groundwater 47
0.5’ – 2’ Direct exposure, terrestrial ecotoxicity, leaching to groundwater 142
2’ – 5’ Direct exposure, terrestrial ecotoxicity, leaching to groundwater 284
5’ – 10’ Direct exposure, terrestrial ecotoxicity, leaching to groundwater 474
SA2 0’ – 0.5’ Direct exposure, terrestrial ecotoxicity, leaching to groundwater 31
0.5’ – 2’ Direct exposure, terrestrial ecotoxicity, leaching to groundwater 94
2’ – 5’ Direct exposure, terrestrial ecotoxicity, leaching to groundwater 183
5’ – 10’ Direct exposure, terrestrial ecotoxicity, leaching to groundwater 314
SA3 0’ – 0.5’ Direct exposure, terrestrial ecotoxicity, leaching to groundwater 19
0.5’ – 2’ Direct exposure, terrestrial ecotoxicity, leaching to groundwater 58
2’ – 5’ Direct exposure, terrestrial ecotoxicity, leaching to groundwater 117
5’ – 10’ Direct exposure, terrestrial ecotoxicity, leaching to groundwater 194
The total volume of soil impacted by COC in the Spill Areas is approximately 1,957 cubic yards (in-place, compacted). The environmental hazards associated with direct exposure, terrestrial ecotoxicity, and leaching to groundwater were identified for the entire volume. Dioxins/furans TEQ concentrations in the impacted soil from all decision units were well above the 1,000 ng/kg (1 part per billion) level.

Site Investigation Report & EHE 54 ETC Project No. 09-2012 East Kapolei PML Site March 2010
Although terrestrial ecotoxicity hazards were identified to be associated with the elevated arsenic and pentachlorophenol concentrations, ETC does not believe that this hazard is considered significant. There are no known terrestrial ecological habitats in the immediate vicinity of the site and the East Kapolei PML site is currently and has historically been located in an area used for commercial agricultural operations. Anticipated future use does not include plans that would be conducive to terrestrial ecological habitats and/or use by endangered species. Furthermore, the primary concern is human direct exposure and remedies to address this hazard would also address terrestrial ecotoxicity concerns (since the ecotoxicity EALs for arsenic and pentachlorophenol are equal to or higher than the direct exposure EALs). Therefore, the terrestrial ecotoxicity hazard will no longer be considered for the Spill Areas.
12.2 Investigation Areas
For the Investigation Areas, total volume of impacted soil will be based on a depth of 5 feet bgs for decision units IAT1, IAT2, IAT4, and IAT5 (since dioxins and arsenic concentrations still exceeded their respective EALs at the 3-foot bgs depth limit of the trenches). For decision unit IAT3, the total volume of impacted soil will be based on a depth of 2 feet bgs (since COC concentrations in the 2- to 3-foot bgs layer were below default DOH EALs). For decision units IA1 to IA4, the total volume of impacted soil will be based on a depth of 2 feet bgs (since the dioxins concentrations in the 0- to 0.5-foot layer were close to the EAL and elevated concentrations are not anticipated to extend beyond the 2 foot depth). Total volumes of impacted soil in the Investigation Areas with the associated environmental hazards are presented in Table 13, below.
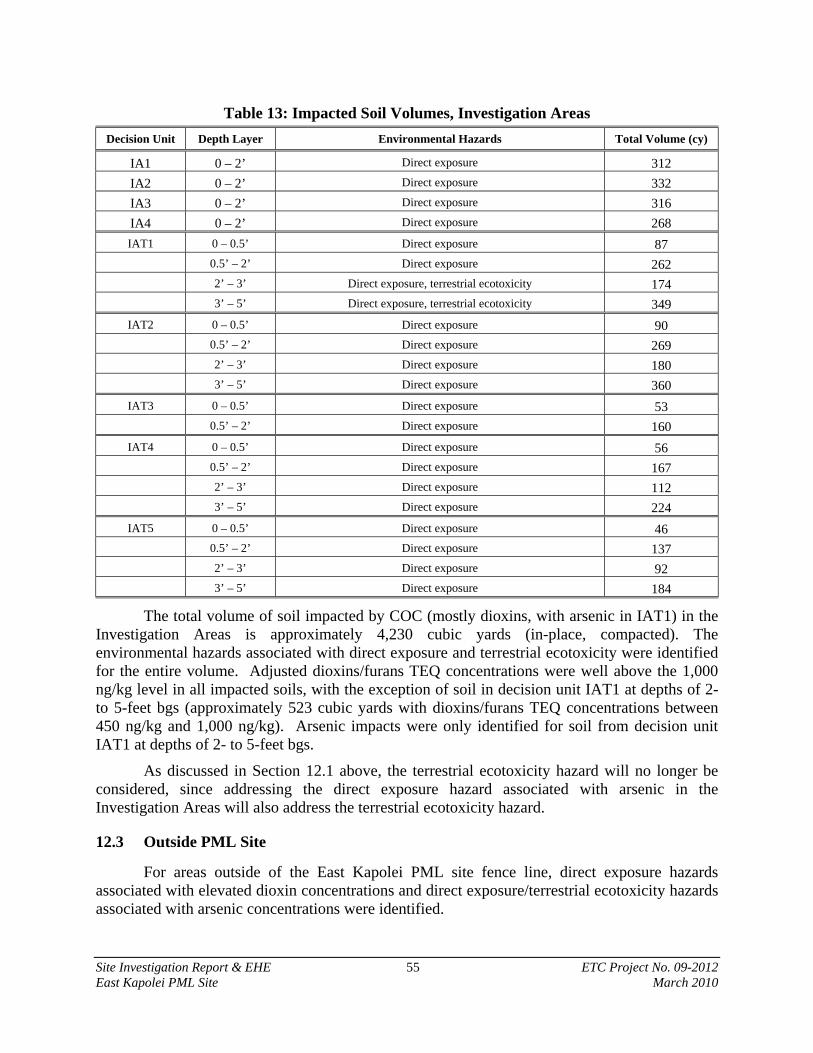
Site Investigation Report & EHE 55 ETC Project No. 09-2012 East Kapolei PML Site March 2010
Table 13: Impacted Soil Volumes, Investigation Areas
Decision Unit Depth Layer Environmental Hazards Total Volume (cy)
IA1 0 – 2’ Direct exposure 312
IA2 0 – 2’ Direct exposure 332
IA3 0 – 2’ Direct exposure 316
IA4 0 – 2’ Direct exposure 268
IAT1 0 – 0.5’ Direct exposure 87
0.5’ – 2’ Direct exposure 262
2’ – 3’ Direct exposure, terrestrial ecotoxicity 174
3’ – 5’ Direct exposure, terrestrial ecotoxicity 349
IAT2 0 – 0.5’ Direct exposure 90
0.5’ – 2’ Direct exposure 269
2’ – 3’ Direct exposure 180
3’ – 5’ Direct exposure 360
IAT3 0 – 0.5’ Direct exposure 53
0.5’ – 2’ Direct exposure 160
IAT4 0 – 0.5’ Direct exposure 56
0.5’ – 2’ Direct exposure 167
2’ – 3’ Direct exposure 112
3’ – 5’ Direct exposure 224
IAT5 0 – 0.5’ Direct exposure 46
0.5’ – 2’ Direct exposure 137
2’ – 3’ Direct exposure 92
3’ – 5’ Direct exposure 184
The total volume of soil impacted by COC (mostly dioxins, with arsenic in IAT1) in the Investigation Areas is approximately 4,230 cubic yards (in-place, compacted). The environmental hazards associated with direct exposure and terrestrial ecotoxicity were identified for the entire volume. Adjusted dioxins/furans TEQ concentrations were well above the 1,000 ng/kg level in all impacted soils, with the exception of soil in decision unit IAT1 at depths of 2- to 5-feet bgs (approximately 523 cubic yards with dioxins/furans TEQ concentrations between 450 ng/kg and 1,000 ng/kg). Arsenic impacts were only identified for soil from decision unit IAT1 at depths of 2- to 5-feet bgs.
As discussed in Section 12.1 above, the terrestrial ecotoxicity hazard will no longer be considered, since addressing the direct exposure hazard associated with arsenic in the Investigation Areas will also address the terrestrial ecotoxicity hazard.
12.3 Outside PML Site
For areas outside of the East Kapolei PML site fence line, direct exposure hazards associated with elevated dioxin concentrations and direct exposure/terrestrial ecotoxicity hazards associated with arsenic concentrations were identified.
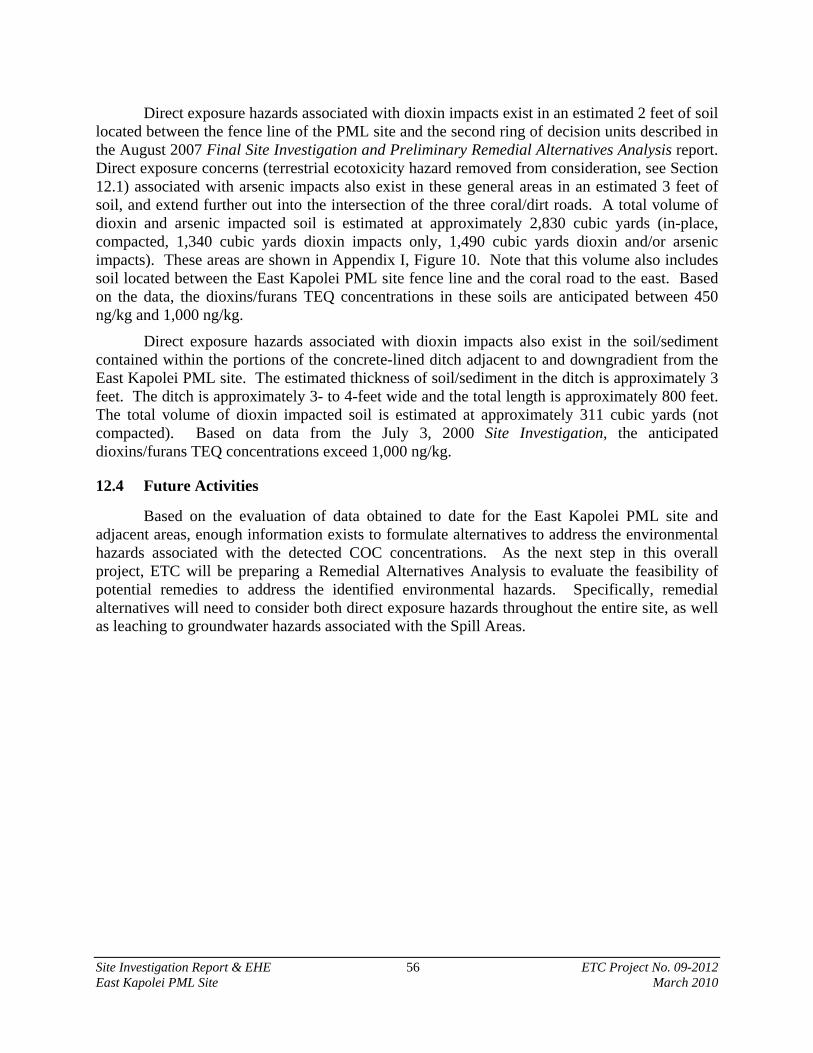
Site Investigation Report & EHE 56 ETC Project No. 09-2012 East Kapolei PML Site March 2010
Direct exposure hazards associated with dioxin impacts exist in an estimated 2 feet of soil located between the fence line of the PML site and the second ring of decision units described in the August 2007 Final Site Investigation and Preliminary Remedial Alternatives Analysis report. Direct exposure concerns (terrestrial ecotoxicity hazard removed from consideration, see Section 12.1) associated with arsenic impacts also exist in these general areas in an estimated 3 feet of soil, and extend further out into the intersection of the three coral/dirt roads. A total volume of dioxin and arsenic impacted soil is estimated at approximately 2,830 cubic yards (in-place, compacted, 1,340 cubic yards dioxin impacts only, 1,490 cubic yards dioxin and/or arsenic impacts). These areas are shown in Appendix I, Figure 10. Note that this volume also includes soil located between the East Kapolei PML site fence line and the coral road to the east. Based on the data, the dioxins/furans TEQ concentrations in these soils are anticipated between 450 ng/kg and 1,000 ng/kg.
Direct exposure hazards associated with dioxin impacts also exist in the soil/sediment contained within the portions of the concrete-lined ditch adjacent to and downgradient from the East Kapolei PML site. The estimated thickness of soil/sediment in the ditch is approximately 3 feet. The ditch is approximately 3- to 4-feet wide and the total length is approximately 800 feet. The total volume of dioxin impacted soil is estimated at approximately 311 cubic yards (not compacted). Based on data from the July 3, 2000 Site Investigation, the anticipated dioxins/furans TEQ concentrations exceed 1,000 ng/kg.
12.4 Future Activities
Based on the evaluation of data obtained to date for the East Kapolei PML site and adjacent areas, enough information exists to formulate alternatives to address the environmental hazards associated with the detected COC concentrations. As the next step in this overall project, ETC will be preparing a Remedial Alternatives Analysis to evaluate the feasibility of potential remedies to address the identified environmental hazards. Specifically, remedial alternatives will need to consider both direct exposure hazards throughout the entire site, as well as leaching to groundwater hazards associated with the Spill Areas.

Site Investigation Report & EHE 57 ETC Project No. 09-2012 East Kapolei PML Site March 2010
13.0 REFERENCES
AMEC Earth and Environmental Inc. 2004. Phase I Environmental Site Assessment at East Kapolei Brownfield, Kapolei, Hawaii. Prepared for the State of Hawaii DBEDT, ASO Log No. 02-131. September.
Environet, Inc. 2009. Phase I Environmental Site Assessment, East Kapolei Brownfields Site, Kapolei, Oahu, Hawaii 96707, TMK (1) 9-1-17: 71 (portion). Prepared for the State of Hawaii DHHL. January 22.
EnviroServices & Training Center, LLC. 2007. Final Site Investigation and Preliminary Remedial Alternatives Analysis Report, East Kapolei – Brownfields, Former Oahu Sugar Company, Pesticide Mixing and Loading Areas, Kapolei, Oahu, Hawaii TMK (1)-9-1-017: Parcel 088. Prepared for the State of Hawaii DBEDT. August.
EnviroServices & Training Center, LLC. 2009. Site Safety & Health Plan, Site Demolition and Remedial Investigation, East Kapolei Pesticide Mixing and Loading (PML) Area, Kapolei, Oahu, Hawaii. September.
EnviroServices & Training Center, LLC. 2009. Community Involvement Plan, East Kapolei II Pesticide Mixing and Loading Site, Ewa, Oahu, Hawaii. Prepared for the State of Hawaii DHHL. October.
EnviroServices & Training Center, LLC. 2009. Site Demolition and Hazardous Materials Disposal Plan, East Kapolei II, Former Pesticide Mixing and Loading Site, Ewa, Oahu, Hawaii. Prepared for the State of Hawaii DHHL. November.
EnviroServices & Training Center, LLC. 2009. Site Investigation Work Plan, East Kapolei II Pesticide Mixing and Loading Site, Ewa, Oahu, Hawaii TMK (1) 9-1-017: Parcel 93 (Portion). Prepared for State of Hawaii DHHL. December.
Hawaii State Department of Health. 2000. Site Inspection – Ewa Sugar Mill/Oahu Sugar Co. Pesticide Mixing and Loading Site. EPA Site ID Number HISFN0905536, submitted to EPA Region IX, July 3, 2000.
Hawaii State Department of Health. 2007. Review by R. Brewer on June 28, 2007. Summary Sheet of Sampling Results + technical review memo. February 14.
Hawaii State Department of Health. 2008. (Updated October 2008) Evaluation of Environmental Hazards at Sites with Contaminated Soil and Groundwater. Summer.
Hawaii State Department of Health. 2008. Technical Guidance Manual for Implementation of the Hawaii State Contingency Plan, Interim Final. November.
Macdonald, G.A., Abbot, A.T. and Peterson, F.L. 1983. Volcanoes and the Sea. University of Hawaii Press.

Site Investigation Report & EHE 58 ETC Project No. 09-2012 East Kapolei PML Site March 2010
Miles, C.J., Yanagihara, K., Ogata, S., Van De Berg, G., and Boesch, R. 1990. Soil and Water Contamination at Pesticide Mixing and Loading Sites on Oahu, Hawaii. Conducted by the University of Hawaii and Hawaii State Department of Agriculture. Printed in: Bulletin of Environmental Contamination and Toxicology. 44:955-962. January 8.
Mink, John F. and Stephen L. Lau. 1990. Aquifer Identification and Classification for Oahu: Groundwater Protection Strategy for Hawaii. Technical Report No. 179. Water Resources Research Center, University of Hawaii at Manoa. February.
Tetra Tech EM Inc. 2007. Final Site Assessment Report, East Kapolei Affordable Housing Project, Kapolei, Oahu, Hawaii. Prepared for the State of Hawaii DOH HEER Office. December 12.
U.S. Department of Agriculture Soil Conservation Service. 1972. Soil Survey of the Islands of Kauai, Oahu, Maui, Molokai, and Lanai, State of Hawaii.
U.S. EPA. 1989. Risk Assessment Guidance for Superfund: Volume 1 – Human Health Evaluation Manual, Part A, Interim Final. EPA/540/1-89/002. December.
U.S. EPA. 2000. Data Quality Objectives Process for Hazardous Waste Site Investigations (EPA QA/G-4) Final. EPA/600/R-00/007. January.
U.S. EPA. 2000. Extent of Contamination, Oahu Sugar Company Site, Ewa, Hawaii, December 2000. U.S. EPA Work Assignment No. 0-125, Lockheed Martin Work Order No. R1A00125, U.S. EPA Contract No. 68-C9-223.
U.S. EPA. SW-846 On-line Test Methods for Evaluating Solid Waste, Physical/Chemical Methods.
U.S. EPA. 2003. Guidance for Obtaining Representative Laboratory Analytical Subsamples from Particulate Laboratory Samples (EPA 600/R-03/027). November.

APPENDIX I
FIGURES & PHOTOGRAPHS

APPENDIX II
SUMMARY TABLES OF HISTORIC DATA

APPENDIX III
SUMMARY OF TEQ CALCULATIONS & LABORATORY REPORTS

APPENDIX I
FIGURES & PHOTOGRAPHS

ETC Project 09-2012
March 2010
Figure 1 - Location MapSite Investigation Report & Environmental
Hazard EvaluationEast Kapolei PML Site
Ewa, Oahu, Hawaii
H - 1F R E
E W A YTO H ON O L U L U
FA R R I N G TON H I G HW AY
F OR T
WEAVER
ROAD
WA I PA H U
PALEHUA
ROAD
W E S TL O C H
TON A N
A K UL I
E WA
MA K A K I L O
K A P O L E I
RE NT O
NRO A D
B A R B E R S P O I N TN AVA L A I R S TAT I O N
K A PO L E I PA RKWAY
G E I G E R R O A D
I R OQ UO
I SR O A
D
FORT
WEAVER
ROAD
PROJECTSITE
I
ISLAND OF OAHU
PROJECTVICINITY
I1:36,000Absolute Scale
0 1,500 3,000 4,500 6,000750Feet
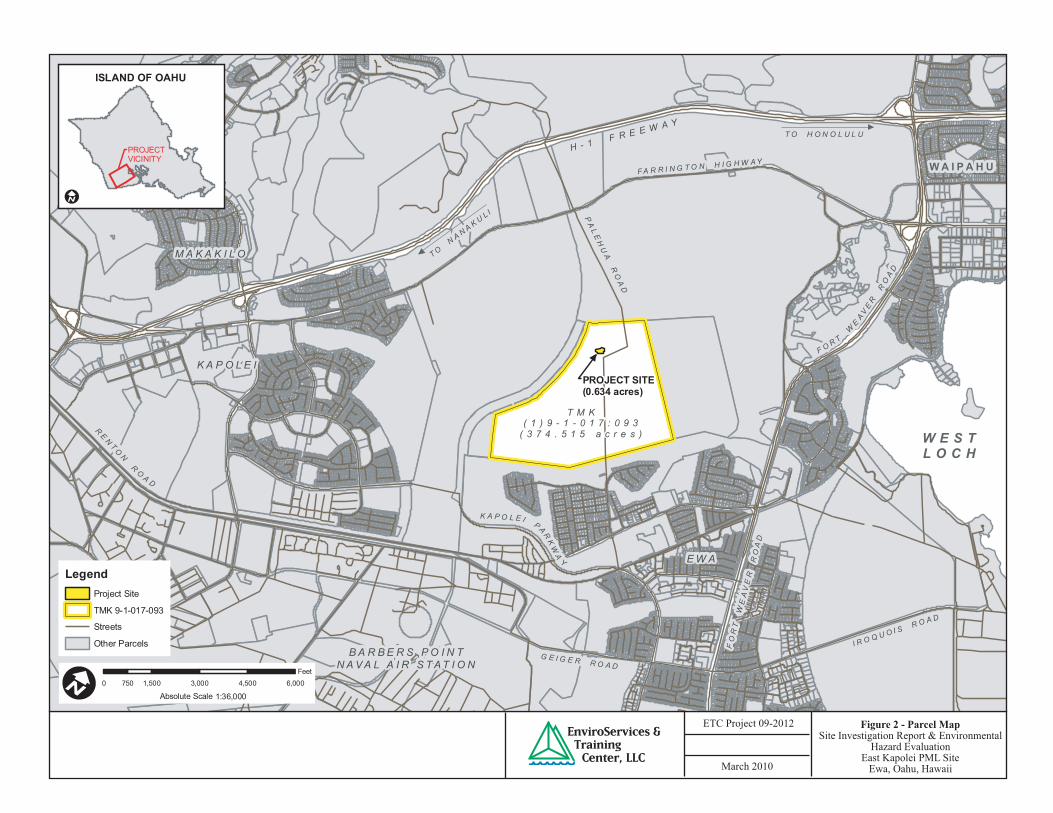
ETC Project 09-2012
March 2010
Figure 2 - Parcel MapSite Investigation Report & Environmental
Hazard EvaluationEast Kapolei PML Site
Ewa, Oahu, Hawaii
H - 1F R E E W
A YTO H O N O L U L U
FA R R I N G TON H I G HW AY
F OR T
WEAVER
ROAD
WA I PA H U
PALEHUA
ROAD
W E S TL O C H
TON A
N AK U
L I
EW A
MA KA K I L O
KA P O L E I
RENTON
ROA D
B A R BE R S PO I N TNAVA L A I R S TAT I O N
K A PO L E I P A RKWA
Y
G E I G E R R O A D
I R OQ U O
I SR O A
D
FORT
WEAVER
ROAD
PROJECT SITE(0.634 acres)
T M K( 1 ) 9 - 1 - 0 1 7 : 0 9 3( 3 7 4 . 5 1 5 a c r e s )
LegendProject Site
TMK 9-1-017-093
Streets
Other Parcels
I 0 1,500 3,000 4,500 6,000750Feet
1:36,000Absolute Scale
I
ISLAND OF OAHU
PROJECTVICINITY

ETC Project 09-2012
March 2010
Figure 3 - Project Site Prior to DemolitionSite Investigation Report & Environmental
Hazard EvaluationEast Kapolei PML Site
Ewa, Oahu, Hawaii
I 0 50 100 150 20025Feet
1:1,200Absolute Scale
PALEHUA
ROAD
PALEHUA
ROAD
BoilerBuilding
StorageBuilding
Tanks
Pesticide mixing area adjacent to storage building.
View of pesticide storage tanks looking northeast.
View of storage building looking northeast.
Pesticide mixing tank located between the storage buildingand the storage tanks.
PROJECTSITE
View of storage building looking west, with part of the boilerbuilding visible in the foreground.
Utility PoleUtility Pole
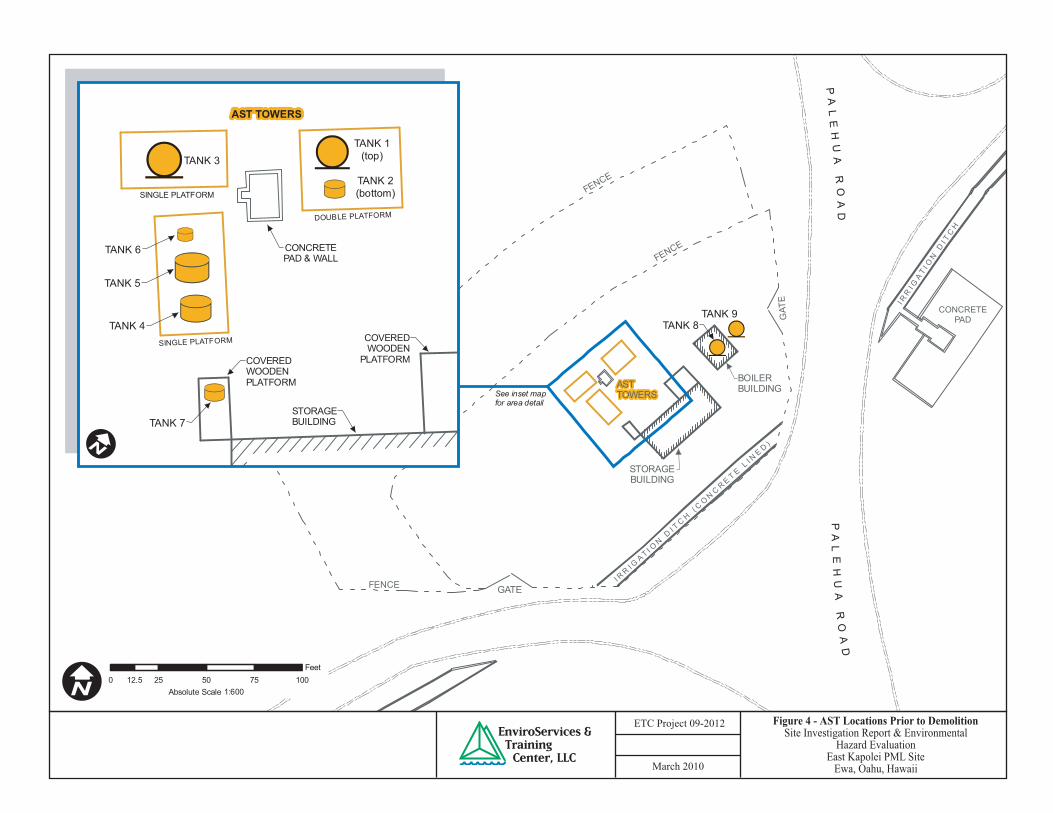
ETC Project 09-2012
March 2010
Figure 4 - AST Locations Prior to DemolitionSite Investigation Report & Environmental
Hazard EvaluationEast Kapolei PML Site
Ewa, Oahu, HawaiiGATE
GATE
CONCRETEPAD
I RRI GA TI ONDI TCH( CONCR ET E
L INE D)
I RRI GAT IONDI TCH
STORAGEBUILDING
BOILERBUILDINGAST
TOWERS
PALEHUA
ROAD
PALEHUA
ROAD
See inset mapfor area detail
FENCE
FENCE
FENCE
I 0 25 50 75 10012.5Feet
1:600Absolute Scale
I
AST TOWERS
COVEREDWOODENPLATFORM
CONCRETEPAD & WALL
COVEREDWOODENPLATFORM
UTUTUT
UTTANK 7
"! "!UTSINGLE PLATFORM
SINGLE PLATFORM
TANK 4
TANK 5
TANK 6
DOUBLE PLATFORM
TANK 3TANK 1(top)
TANK 2(bottom)
STORAGEBUILDING
"!"!TANK 8
TANK 9


Historic PML Operations
Primary Contaminant
Source
Primary Release
Mechanism
Mechanical Transport
Secondary Contaminant
Source
Surface Soil
Secondary Release
Mechanism
Percolation/Infiltration
Groundwater
SedimentStorm Water
Runoff
Dust Emissions
Subsurface Soil
Ambient Air
Pathway
Exposure Route
Leaching
Potential Exposure Routes and Receptors
On-Site Human
Ingestion
Dermal contact X
X
APPENDIX I - CONCEPTUAL SITE MODEL DIAGRAM
EAST KAPOLEI PML SITE, CURRENT CONDITIONS
Surface SoilInhalation
Off-Site Human
Site WorkerAquatic
Ecological
Ingestion
Dermal contact X
XInhalation
Ingestion
Dermal contact
XInhalation
Ingestion
Dermal contact X
XInhalation
Ingestion
Dermal contactInhalation
XXXX
X XX
X XXX
XXXX
XX
XXX
X
X
X
X

Photographic DocumentationSite Investigation & Environmental
Hazard EvaluationEast Kapolei II Pesticide Mixing & Loading Site
Ewa, Oahu, Hawaii
Project 09-2012
March 2010
Aerial photograph depicting the East Kapolei PML Site after completion of sample collection activities.

Photographic DocumentationSite Investigation Report & Environmental
Hazard EvaluationEast Kapolei II Pesticide Mixing & Loading Site
Ewa, Oahu, Hawaii
Project 09-2012
March 2010
Photo 1: ETC personnel laying out decision units
Photo 4: View of site conditions prior to sample collectionPhoto 3: Aluminum spikes used for decision unit layout
Photo 2: Decision unit boundaries marked using surveyors’ tape

Photographic DocumentationSite Investigation Report & Environmental
Hazard EvaluationEast Kapolei II Pesticide Mixing & Loading Site
Ewa, Oahu, Hawaii
Project 09-2012
March 2010
Photo 5: View of Geoprobe direct-push rig operation
Photo 8: Typical view of core sampler decontaminationPhoto 7: Typical view of soil boring from Spill Area
Photo 6: collection of soil boring from Spill Area

Photographic DocumentationSite Investigation Report & Environmental
Hazard EvaluationEast Kapolei II Pesticide Mixing & Loading Site
Ewa, Oahu, Hawaii
Project 09-2012
March 2010
Photo 9: Typical view of trench excavation
Photo 12: View of polyethylene sheeting placed over SA3 aftersample collection tom minimize storm water infiltration
Photo 11: ETC personnel collecting soil increment from trench
Photo 10: Typical view of trench prior to sample collection

APPENDIX II
SUMMARY TABLES OF HISTORIC DATA

Table 1: 1990 UH/Dept. of Ag Data
Sample Location Depth (cm) Diuron Atrazine Terbacil Ametryn Hexazinone DDT DDE DDD
Boring 1 0 - 10 ND 3472 ND 17664 2.19 6.339 0.304 1.867
10 - 17 ND 1613 ND 8333 1.25 2.39 0.110 0.570
17 - 30 0.27 147.3 1.4 623.9 1 0.418 0.030 0.079
30 - 61 0.71 16.94 3.3 69.32 1.15 0.048 0.009 0.018
152 - 183 1.22 2.68 ND 184.8 2.08 ND ND ND
244 - 274 1.05 1.6 ND 53.4 1.38 ND ND ND
Boring 2 0 - 15 1.26 6.77 3.38 19.71 0.23 0.025 0.060 0.100
61 - 91 0.08 0.03 1.43 1.59 0.1 ND ND ND
152 - 183 ND 0.09 0.32 2.06 0.18 ND ND ND
244 - 274 ND 0.8 ND 3.03 0.25 ND ND ND
Boring 3 0 - 18 1.1 5.36 1.43 7.42 ND ND 0.004 0.005
61 - 91 0.06 0.12 0.71 0.53 ND ND ND ND
152 - 183 0.22 0.32 0.43 0.38 ND ND ND ND
244 - 274 0.18 0.61 ND 0.53 0.11 ND ND ND
0.06 0.01 0.05 0.02 0.02 0.003 0.002 0.004
4.5 2.1 160 11 400 1.7 1.4 2.0
Location of borings are unknown.ND = not detectedMDL = method detection limit (ppm wet weight)DOH EAL = Summer 2008 (October 2008 Update) Hawaii Department of Health, Default Tier 1 Environmental Action Levels, NDW, >150m
Shading and bold type = exceedance of the EAL
MDL
DOH EAL

Table 2: Surface Soil Sample Data, DOH May 1997/September 1999Metals and Pesticides Only
Sample ID S1 S2 S3 S4 S5 (bg) S6 (S4 dup) DOH EALArsenic 29.9 27.2 51.7 13.9 11.5 13 20Chromium 127 84.1 69 67.8 74.3 65 500Lead 153 200 230 43.1 8.6 43.9 200Mercury 0.64 0.82 0.3 nd<0.06 nd<0.05 nd<0.05 4.7Zinc 1740 1900 1120 241 107 233 600PCP (SVOC) 8.1 1.4 1.1 nd<4.3 nd<0.37 nd<4.3 3PCP (ChlorHerb) 13 0.98 8.9 0.55 nd<0.042 0.46 3DDE 0.11 nd<0.038 nd<0.0034 0.0037 nd<0.0037 0.0046 1.4DDD nd<0.038 0.057 0.0073 nd<0.0034 nd<0.0037 0.0058 2DDT 0.068 0.3 0.0039 0.0051 0.0056 0.0069 1.72,4-D nd<0.21 0.62 nd<0.21 0.38 nd<0.21 0.41 0.98Dalapon nd<2.1 nd<2.3 nd<2.1 nd<2.0 nd<2.1 nd<2.0 1.4Dioxin TEQ (ppt) 752,000 -- -- 73700 -- -- 450
DOH EAL = Summer 2008 (October 2008 Update) Hawaii Department of Health, Default Tier 1 Environmental Action Levels, NDW, >150m

Table 3: Soil Sample Data - Metals, EPA December 2000
Sample ID Depth Arsenic Barium Cadmium Chromium Cobalt Copper Lead Manganese Mercury Nickel Vanadium Zinc
BG 0-1 14 290 nd<5.3 120 56 30 7 2000 nd<0.11 53 220 120
SB 0-1 16 130 nd<5.2 180 35 140 270 1600 0.54 65 110 3500
S-1a,b,c 0-1 39 190 nd<3.1 170 33 180 300 820 0.92 71 110 2400
1-2 22 210 0.81 100 29 35 30 1100 0.16 44 170 440
2-3 NA NA NA NA NA NA NA NA NA NA NA NA
3-4 NA NA NA NA NA NA NA NA NA NA NA NA
S-7 0-1 18 140 nd<2.5 77 44 49 16 1600 nd<0.1 95 130 260
S-8 0-0.25 NA NA NA NA NA NA NA NA NA NA NA NA
S-9 0-0.25 NA NA NA NA NA NA NA NA NA NA NA NA
S-10 0-0.25 NA NA NA NA NA NA NA NA NA NA NA NA
SDa,b,c 0-1 18 150 nd<2.6 95 47 52 14 1800 nd<0.01 110 140 140
SF-1 0-1 11 260 nd<2.7 93 55 29 6.4 2000 0.16 51 210 120
SF-2 0-1 9.6 270 nd<5.5 94 57 30 7.4 2100 nd<0.11 54 220 130
SF-3 0-1 8.9 300 nd<2.8 100 58 30 6.9 2100 nd<0.11 53 220 120
SF-4 0-1 43 280 nd<2.7 84 57 35 6.1 2200 nd<0.11 57 210 130
0-1 50 150 nd<1.5 62 22 55 210 680 0.15 57 68 720
1-2 NA NA NA NA NA NA NA NA NA NA NA NA
2-3 NA NA NA NA NA NA NA NA NA NA NA NA
0-1 160 230 nd<2.9 160 33 170 240 880 nd<1.3 95 130 2000
1-2 NA NA NA NA NA NA NA NA NA NA NA NA
2-3 NA NA NA NA NA NA NA NA NA NA NA NA
0-1 30 250 nd<2.7 100 22 72 350 690 nd<0.39 52 76 3000
1-2(1)NA NA NA NA NA NA NA NA NA NA NA NA
2-3(1)NA NA NA NA NA NA NA NA NA NA NA NA
1-2 NA NA NA NA NA NA NA NA NA NA NA NA
2-3 NA NA NA NA NA NA NA NA NA NA NA NA
SP-1 0-1 12 150 nd<2.7 62 34 33 35 1300 0.16 54 130 130
0-1 16 190 nd<5.5 75 43 34 33 1500 nd<0.11 54 170 170
1-2 NA NA NA NA NA NA NA NA NA NA NA NA
2-3 NA NA NA NA NA NA NA NA NA NA NA NA
SP-3 0-1 16 200 nd<2.8 91 49 41 39 1800 nd<0.11 68 170 270
1-2 NA NA NA NA NA NA NA NA NA NA NA NA
2-3 NA NA NA NA NA NA NA NA NA NA NA NA
1-2 NA NA NA NA NA NA NA NA NA NA NA NA
2-3 NA NA NA NA NA NA NA NA NA NA NA NA
20 750 12 500 40 230 200 NA 4.7 150 110 600
DOH EAL = Summer 2008 (October 2008 Update) Hawaii Department of Health, Default Tier 1 Environmental Action Levels, NDW, >150m
NA = not analyzed
S-1c
SM-1
SM-2
SM-3
EALs
SM-4
SP-2
SP-4
SP-6

Table 4: Soil Sample Data - Pesticides, EPA December 2000
Sample ID Depth DDD DDE DDT delta-BHC Dieldrin Endrin Aldehyde Chlordane
BG 0-1 nd<0.035 nd<0.035 nd<0.035 nd<0.018 nd<0.035 nd<0.035 nd<0.018
SB 0-1 0.034 0.04 0.067 nd<0.017 0.0027 nd<0.035 0.0068
S-1a,b,c 0-1 nd<0.041 nd<0.041 nd<0.041 0.079 0.049 nd<0.041 nd<0.02
1-2 NA NA NA NA NA NA NA
2-3 NA NA NA NA NA NA NA
3-4 NA NA NA NA NA NA NA
S-7 0-1 nd<0.34 nd<0.34 nd<0.34 nd<0.0.17 nd<0.34 nd<0.34 nd<0.0.17
S-8 0-0.25 NA NA NA NA NA NA NA
S-9 0-0.25 NA NA NA NA NA NA NA
S-10 0-0.25 NA NA NA NA NA NA NA
SDa,b,c 0-1 nd<0.35 nd<0.35 nd<0.35 nd<0.018 nd<0.036 nd<0.35 nd<0.17
SF-1 0-1 nd<0.037 nd<0.037 nd<0.037 nd<0.018 nd<0.037 nd<0.037 nd<0.018
SF-2 0-1 nd<0.037 nd<0.037 nd<0.037 nd<0.018 nd<0.037 nd<0.018 nd<0.018
SF-3 0-1 nd<0.038 nd<0.038 nd<0.038 nd<0.019 nd<0.039 nd<0.038 nd<0.019
SF-4 0-1 nd<0.036 nd<0.036 nd<0.036 nd<0.018 nd<0.036 nd<0.036 nd<0.018
0-1 nd<0.034 0.014 nd<0.034 0.013 nd<0.034 nd<0.034 nd<0.017
1-2 NA NA NA NA NA NA NA
2-3 NA NA NA NA NA NA NA
0-1 nd<0.038 0.043 0.22 0.14 nd<0.038 0.084 0.0095
1-2 NA NA NA NA NA NA NA
2-3 NA NA NA NA NA NA NA
0-1 0.13 0.081 0.31 nd<0.018 nd<0.036 0.036 nd<0.018
1-2(1) NA NA NA NA NA NA NA
2-3(1) NA NA NA NA NA NA NA
1-2 NA NA NA NA NA NA NA
2-3 NA NA NA NA NA NA NA
SP-1 0-1 nd<0.036 nd<0.036 0.035 nd<0.018 nd<0.036 nd<0.036 0.0032
0-1 nd<0.038 nd<0.038 0.041 nd<0.019 nd<0.038 nd<0.038 nd<0.019
1-2 NA NA NA NA NA NA NA
2-3 NA NA NA NA NA NA NA
SP-3 0-1 nd<0.037 nd<0.037 nd<0.037 nd<0.018 nd<0.037 nd<0.018 nd<0.018
1-2 NA NA NA NA NA NA NA
2-3 NA NA NA NA NA NA NA
1-2 NA NA NA NA NA NA NA
2-3 NA NA NA NA NA NA NA
2 1.4 1.7 0.09 0.03 0.06 7
DOH EAL = Summer 2008 (October 2008 Update) Hawaii Department of Health, Default Tier 1 Environmental Action Levels, NDW, >150m
NA = not analyzed
S-1c
SM-1
SM-2
SM-3
EALs
SM-4
SP-2
SP-4
SP-6

Table 5: Soil Sample Data - Herbicides, EPA December 2000
Sample ID Depth Ametryn Glyphosate Diuron Atrazine Simazine Terbacil Trifluralin Propiconazole 2,4-D Dalapon Picloram
BG 0-1 nd<0.69 nd<5.25 nd<0.087 nd<0.69 nd<0.69 nd<0.69 nd<0.69 nd<0.11 0.047 nd<0.0099 nd<0.03
SB 0-1 3.6 34 3.02 nd<6.9 nd<6.9 nd<6.9 nd<6.9 nd<1.1 0.64 nd<0.02 nd<0.059
S-1a,b,c 0-1 120 4.61 16.5 86 nd<8 nd<8 190 nd<1.3 1.7 nd<0.01 nd<0.031
1-2 35 26 0.5 nd<0.67 nd<0.67 nd<0.67 nd<0.67 NA NA NA NA
2-3 NA NA NA NA NA NA NA NA NA NA NA
3-4 NA NA NA NA NA NA NA NA NA NA NA
S-7 0-1 nd<6.7 nd<5.07 0.0788 nd<6.7 nd<6.7 nd<6.7 0.77 nd<1.1 0.024 nd<0.0098 nd<0.029
S-8 0-0.25 NA NA NA nd<14 NA NA NA NA NA NA NA
S-9 0-0.25 NA NA NA nd<14 NA NA NA NA NA NA NA
S-10 0-0.25 NA NA NA nd<15 NA NA NA NA NA NA NA
SDa,b,c 0-1 nd<6.9 nd<5.36 0.0613 nd<6.9 nd<6.9 nd<6.9 nd<6.9 nd<1.1 0.026 nd<0.01 nd<0.03
SF-1 0-1 nd<0.73 nd<5.47 0.0765 nd<0.73 nd<0.73 nd<0.73 nd<0.73 nd<0.11 nd<0.02 nd<0.01 nd<0.03
SF-2 0-1 nd<0.72 nd<5.42 0.047 nd<0.72 nd<0.72 nd<0.72 nd<0.72 nd<0.11 0.12 nd<0.0099 nd<0.03
SF-3 0-1 nd<0.75 nd<1.131 0.0504 nd<0.75 nd<0.75 nd<0.75 nd<0.75 nd<0.12 0.061 nd<0.01 nd<0.03
SF-4 0-1 nd<0.71 nd<5.32 0.0235 nd<0.71 nd<0.71 nd<0.71 nd<0.71 nd<0.11 0.034 nd<0.0099 nd<0.03
0-1 2.1 2.43 0.683 nd<3.4 nd<3.4 nd<3.4 nd<3.4 nd<0.052 nd<0.2 nd<0.0099 0.044
1-2 NA NA NA nd<7.1 NA NA NA NA NA NA NA
2-3 NA NA NA NA NA NA NA NA NA NA NA
0-1 8 5.93 3.03 nd<7.6 nd<7.6 0.94 1.9 nd<1.2 0.62 0.037 nd<0.03
1-2 NA NA NA nd<0.8 NA NA NA NA NA NA NA
2-3 NA NA NA NA NA NA NA NA NA NA NA
0-1 13 21.8 10.1 3 2.9 nd<3.2 nd<7.1 nd<1.1 0.32 nd<0.0099 nd<0.03
1-2(1) NA NA NA nd<0.72 NA NA NA NA NA NA NA
2-3(1) NA NA NA NA NA NA NA NA NA NA NA
1-2 NA NA NA nd<0.72 NA NA NA NA NA NA NA
2-3 NA NA NA NA NA NA NA NA NA NA NA
SP-1 0-1 nd<7.1 2.63 0.188 nd<7.1 nd<7.1 nd<7.1 nd<7.1 nd<1.1 0.18 nd<0.01 nd<0.03
0-1 nd<3.8 2.52 0.374 nd<3.8 nd<3.8 nd<3.8 nd<3.8 nd<0.58 0.1 nd<0.0099 nd<0.03
1-2 NA NA NA nd<0.77 NA NA NA NA NA NA NA
2-3 NA NA NA NA NA NA NA NA NA NA NA
SP-3 0-1 nd<7.3 nd<5.48 0.2 nd<7.3 nd<7.3 nd<7.3 nd<7.3 nd<1.1 0.057 nd<0.01 nd<0.03
1-2 NA NA NA nd<7.7 NA NA NA NA NA NA NA
2-3 NA NA NA NA NA NA NA NA NA NA NA
1-2 NA NA NA nd<7.1 NA NA NA NA NA NA NA
2-3 NA NA NA NA NA NA NA NA NA NA NA
11 1.9 4.5 2.1 0.25 160 32 160 0.98 1.4 NA
DOH EAL = Summer 2008 (October 2008 Update) Hawaii Department of Health, Default Tier 1 Environmental Action Levels, NDW, >150m
NA = not analyzed
EALs
S-1c
SM-1
SM-2
SM-3
SM-4
SP-2
SP-4
SP-6

Table 6: Soil Sample Data - Dioxins, PCP, Tetrachlorophenol, EPA December 2000
Sample ID Depth Dioxin TEQ (ppt) 2,3,4,6-Tetrachlorophenol Pentachlorophenol
BG 0-1 65 nd<0.35 nd<0.35
SB 0-1 63100 nd<3.5 1.6
S-1a,b,c 0-1 333600 nd<4.1 15
1-2 271000 NA 22
2-3 33400 NA NA
3-4 42000 NA NA
S-7 0-1 2300 nd<8.5 nd<8.5
S-8 0-0.25 1700 NA 0.09
S-9 0-0.25 1500 NA nd<0.363
S-10 0-0.25 1700 NA nd<1.874
SDa,b,c 0-1 1400 nd<8.7 nd<8.7
SF-1 0-1 64 nd<1.8 nd<1.8
SF-2 0-1 89 nd<1.8 nd<1.8
SF-3 0-1 84 nd<1.9 nd<1.9
SF-4 0-1 207 nd<1.8 nd<1.8
0-1 94300 0.57 17
1-2 3600 NA 310
2-3 1300 NA NA
0-1 44400 0.36 7.5
1-2 360 NA nd<0.399
2-3 640 NA NA
0-1 98000 nd<9 1.7
1-2(1) 2900 NA 14
2-3(1) 2000 NA NA
1-2 2900 NA 14
2-3 2000 NA NA
SP-1 0-1 4800 nd<3.6 nd<3.6
0-1 10900 nd<3.9 nd<3.9
1-2 2300 NA nd<0.388
2-3 900 NA NA
SP-3 0-1 8500 nd<3.7 nd<3.7
1-2 1900 NA nd<0.384
2-3 220 NA NA
1-2 270 NA nd<0.359
2-3 370 NA NA
450 3.3 3
DOH EAL = Summer 2008 (October 2008 Update) Hawaii Department of Health, Default Tier 1 Environmental Action Levels, NDW, >150m
NA = not analyzed
EALs
S-1c
SM-1
SM-2
SM-3
SM-4
SP-2
SP-4
SP-6
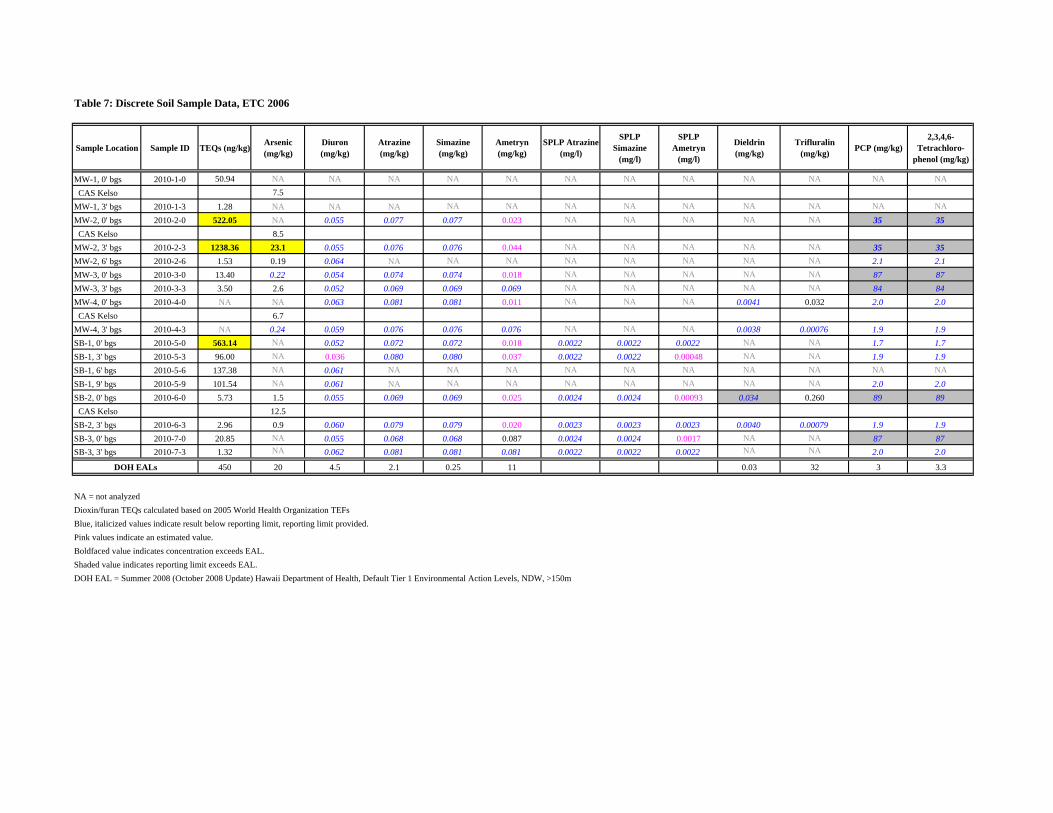
Table 7: Discrete Soil Sample Data, ETC 2006
Sample Location Sample ID TEQs (ng/kg)Arsenic (mg/kg)
Diuron (mg/kg)
Atrazine (mg/kg)
Simazine (mg/kg)
Ametryn (mg/kg)
SPLP Atrazine (mg/l)
SPLP Simazine
(mg/l)
SPLP Ametryn
(mg/l)
Dieldrin (mg/kg)
Trifluralin (mg/kg)
PCP (mg/kg)2,3,4,6-
Tetrachloro-phenol (mg/kg)
MW-1, 0' bgs 2010-1-0 50.94 NA NA NA NA NA NA NA NA NA NA NA NA
CAS Kelso 7.5
MW-1, 3' bgs 2010-1-3 1.28 NA NA NA NA NA NA NA NA NA NA NA NA
MW-2, 0' bgs 2010-2-0 522.05 NA 0.055 0.077 0.077 0.023 NA NA NA NA NA 35 35
CAS Kelso 8.5
MW-2, 3' bgs 2010-2-3 1238.36 23.1 0.055 0.076 0.076 0.044 NA NA NA NA NA 35 35
MW-2, 6' bgs 2010-2-6 1.53 0.19 0.064 NA NA NA NA NA NA NA NA 2.1 2.1
MW-3, 0' bgs 2010-3-0 13.40 0.22 0.054 0.074 0.074 0.018 NA NA NA NA NA 87 87
MW-3, 3' bgs 2010-3-3 3.50 2.6 0.052 0.069 0.069 0.069 NA NA NA NA NA 84 84
MW-4, 0' bgs 2010-4-0 NA NA 0.063 0.081 0.081 0.011 NA NA NA 0.0041 0.032 2.0 2.0
CAS Kelso 6.7
MW-4, 3' bgs 2010-4-3 NA 0.24 0.059 0.076 0.076 0.076 NA NA NA 0.0038 0.00076 1.9 1.9
SB-1, 0' bgs 2010-5-0 563.14 NA 0.052 0.072 0.072 0.018 0.0022 0.0022 0.0022 NA NA 1.7 1.7
SB-1, 3' bgs 2010-5-3 96.00 NA 0.036 0.080 0.080 0.037 0.0022 0.0022 0.00048 NA NA 1.9 1.9
SB-1, 6' bgs 2010-5-6 137.38 NA 0.061 NA NA NA NA NA NA NA NA NA NA
SB-1, 9' bgs 2010-5-9 101.54 NA 0.061 NA NA NA NA NA NA NA NA 2.0 2.0
SB-2, 0' bgs 2010-6-0 5.73 1.5 0.055 0.069 0.069 0.025 0.0024 0.0024 0.00093 0.034 0.260 89 89
CAS Kelso 12.5
SB-2, 3' bgs 2010-6-3 2.96 0.9 0.060 0.079 0.079 0.020 0.0023 0.0023 0.0023 0.0040 0.00079 1.9 1.9
SB-3, 0' bgs 2010-7-0 20.85 NA 0.055 0.068 0.068 0.087 0.0024 0.0024 0.0017 NA NA 87 87
SB-3, 3' bgs 2010-7-3 1.32 NA 0.062 0.081 0.081 0.081 0.0022 0.0022 0.0022 NA NA 2.0 2.0
450 20 4.5 2.1 0.25 11 0.03 32 3 3.3
NA = not analyzed
Dioxin/furan TEQs calculated based on 2005 World Health Organization TEFs
Blue, italicized values indicate result below reporting limit, reporting limit provided.
Pink values indicate an estimated value.
Boldfaced value indicates concentration exceeds EAL.
Shaded value indicates reporting limit exceeds EAL.
DOH EAL = Summer 2008 (October 2008 Update) Hawaii Department of Health, Default Tier 1 Environmental Action Levels, NDW, >150m
DOH EALs

Table 8: Multi-Increment Soil Sample Data, ETC 2006
Sample Location Sample IDTEQs
(ng/kg)Adjusted TEQ Values (ng/kg)
Arsenic (mg/kg)
Diuron (mg/kg)
Atrazine (mg/kg)
Simazine (mg/kg)
Ametryn (mg/kg)
Dieldrin (mg/kg)
Trifluralin (mg/kg)
PCP (mg/kg)2,3,4,6-
Tetrachloro-phenol (mg/kg)
Ring 1, DU1 2010-01-1 57.80 70.41 NA NA NA NA NA NA NA NA NA
Ring 1, DU2 2010-01-2 38.97 47.48 NA NA NA NA NA NA NA NA NA
Ring 1, DU3 2010-01-3 51.87 63.19 NA NA NA NA NA NA NA NA NA
Ring 1, DU4 2010-01-4 146.22 178.13 NA NA NA NA NA NA NA NA NA
Ring 1, DU5 2010-01-5 52.59 64.07 NA NA NA NA NA NA NA NA NA
Ring 1, DU6 2010-01-6 47.39 57.72 NA NA NA NA NA NA NA NA NA
Ring 1, DU7 2010-01-7 156.04 190.09 NA NA NA NA NA NA NA NA NA
Ring 1, DU8 2010-01-8 369.82 450.51 NA NA NA NA NA NA NA NA NA
Ring 1, DU9 2010-01-9 484.75 590.52 NA NA NA NA NA NA NA NA NA
Ring 1, DU10 2010-01-10 819.30 998.07 NA NA NA NA NA NA NA NA NA
Ring 1, DU11 2010-01-11 190.12 231.60 NA NA NA NA NA NA NA NA NA
Ring 1, DU12 2010-01-12 80.27 97.79 NA NA NA NA NA NA NA NA NA
Ring 1, DU13 2010-01-13 69.94 85.20 NA NA NA NA NA NA NA NA NA
Ring 1, DU14 2010-01-14 67.86 82.67 NA NA NA NA NA NA NA NA NA
Ring 1, DU15 2010-01-15 74.01 90.16 NA NA NA NA NA NA NA NA NA
Ring 1, DU16 2010-01-16 83.74 102.01 NA NA NA NA NA NA NA NA NA
Ring 1, DU17 2010-01-17 77.57 94.50 NA NA NA NA NA NA NA NA NA
Ring 1, DU18 2010-01-18 79.41 96.73 NA NA NA NA NA NA NA NA NA
Ring 1, DU19 2010-01-19 285.64 347.97 NA NA NA NA NA NA NA NA NA
Phase I ESA Area 2010-03-1 15.70 19.13 4.4 0.022 0.055 0.067 0.067 0.0034 0.00067 1.7 1.7
Replicate, Ring 1, DU1 2010-04-1 37.26 45.39 NA NA NA NA NA NA NA NA NA
Replicate, Ring 1, DU1 2010-04-2 53.25 64.86 NA NA NA NA NA NA NA NA NA
Replicate, Ring 1, DU18 2010-05-01 84.37 102.77 NA NA NA NA NA NA NA NA NA
Replicate, Ring 1, DU18 2010-05-02 91.98 112.05 NA NA NA NA NA NA NA NA NA
Ring 2, DU11 2010-02-11 172.36 209.97 NA NA NA NA NA NA NA NA NA
Ring 2, DU12 2010-02-12 353.37 430.48 NA NA NA NA NA NA NA NA NA
Ring 2, DU13 2010-02-13 141.44 172.30 NA NA NA NA NA NA NA NA NA
Replicate, Ring 2, DU13 2010-08-1 144.86 176.47 NA NA NA NA NA NA NA NA NA
450 450 20 4.5 2.1 0.25 11 0.03 32 3 3.3
NA = not analyzed
Dioxin/furan TEQs calculated based on 2005 World Health Organization TEFs
Adjusted TEQ Values = TEQ values plus highest calculated RSD (21.82%).
Blue, italicized values indicate result below reporting limit, reporting limit provided.
Pink values indicate an estimated value.
Boldfaced value indicates concentration exceeds EAL.
DOH EALs

Table 9: Groundwater Sample Data, ETC 2006
Sample Location Sample IDDissolved Arsenic (mg/l)
Diuron (mg/l)Atrazine
(mg/l)Simazine
(mg/l)Ametryn
(mg/l)Dieldrin (mg/l) Trifluralin (mg/l) PCP (mg/l)
2,3,4,6-Tetrachloro-phenol (mg/l)
Glyphosate (mg/l)
MW-2 2010-2 0.0020 0.0010 0.0019 0.0019 0.0019 0.000096 0.000019 0.054 0.054 0.0046
MW-3 2010-3 0.0020 0.0014 0.00096 0.0019 0.0019 0.000096 0.000019 0.052 0.052 0.0046
MW-4 2010-4 0.0020 0.0010 0.00093 0.0019 0.0019 0.000096 0.000019 0.050 0.050 0.0046
Replicate MW-3 2010-7 0.0020 0.0013 0.00088 0.0019 0.0019 0.000096 0.000019 0.053 0.053 0.0046
Development Water 2010-8 0.0011 0.00062 0.00069 0.0019 0.0019 0.000094 0.000019 0.048 0.048 0.0046
0.069 0.2 0.35 0.01 0.15 0.00071 0.02 0.013 0.01 0.6
Blue, italicized values indicate result below reporting limit, reporting limit provided.
Pink values indicate an estimated value.
Shaded value indicates reporting limit exceeds EAL.
DOH EAL = Summer 2008 (October 2008 Update) Hawaii Department of Health, Default Tier 1 Environmental Action Levels, NDW, >150m
DOH EALs

Table 10: Multi-Increment Soil Sample Data, DOH 2007
Sample ID SL01 SL02 SL03 Default EAL
Pentachlorophenol 11 ND 8.3 3
2,3,4,6-Tetrachlorophenol ND ND ND 3.3
Diuron 0.46 0.51 0.57 4.5Chlorinated Herbicides (mg/kg)
2,4-D ND ND 400 0.98
2,4-DB ND ND ND
2,4,5-T ND ND ND
2,4,4,5-TP ND ND ND
Dalapon ND ND ND 1.4
Dicamba ND ND ND
Dichloropropene ND ND ND
Dinoseb ND ND ND
MCPA ND ND ND
MCPP ND ND ND
Dioxins TEQ (ppb) 144.95 NA NA 0.45
Trifluralin 49 58 63 32
Atrazine 8 33 41 2.1
Ametryn 9 27 35 11
Dieldrin ND ND ND 0.03
Simazine ND ND ND 0.25

Table 11: SPLP Soil Sample Data and Kd Values, DOH 2007
Sample ID SL01 Kd (SL01) SL02 Kd (SL02) SL03 Kd (SL03) Composite Kd (Composite)
SPLP (g/l)
Pentachlorophenol ND ND ND
Diuron 0.013 15 0.014 16 0.0041 120 5.1 86
Dieldrin ND<0.0095 ND<0.004 ND<0.010
Trifluralin 0.012 4100 0.0043 13000 0.012 5200 12 5000
Ametryn 0.0077 1100000 0.0076 3500 0.78 25 600 30
Simazine 0.002 0.0011 0.002
Atrazine 0.33 3 0.13 230 0.79 32 1300 6.9
Kd values < 20 cm3/g indicate potential leaching hazards

Table 12: Discrete Soil Sample Data - Arsenic, Lead, Dioxins, EPA January 2009
Samples Collected at 1-foot Samples Collected at 2-feet
Sample ID Dioxin TEQ Arsenic Lead Sample ID Dioxin TEQ Arsenic Lead
EK-01 160 10 12 EK-01 48 19 11
EK-02 110 8 16 EK-02 110 9 20
EK-03 70 8 15 EK-03 37 9 18
EK-04 84 11 14 EK-04 44 8 23
EK-05 58 9 22 EK-05 27 13 16
EK-06 73 8 15 EK-06 75 9 21
EK-07 27 8 8 EK-07 63 90 9
EK-08 83 20 8 EK-08 73 56 18
EK-09 180 8 8 EK-09 280 95 15
EK-10 210 11 8 EK-10 210 10 15
EK-11 400 25 13 EK-11 480 30 14
EK-12 31 9 23 EK-21 50 14 10
EK-13 64 9 18 EK-22 70 30 8
EK-14 46 9 23 EK-23 200 7 11
EK-15 41 9 23 EK-24 8 519 80
EK-16 94 9 15 EK-25 8.4 202 12
EK-17 61 9 26 EK-26 360 7 8
EK-18 99 10 19 EK-27 15 8 7
EK-19 170 9 21 EK-28 8 12 18
EK-20 470 12 30 EK-29 18 19 8
EK-21 120 16 14 EK-30 62 16 9
EK-22 28 9 8 EK-31 39 -- --
EK-23 340 7 8 EK-32 10 21 7
EK-24 6.1 11 8 EK-33 5 7 8
EK-25 16 64 8 EK-34 13 7 12
EK-26 56 6 8 EK-35 15 11 44
EK-27 34 8 8 EK-36 110 44 9
EK-28 54 24 27 EK-37 40 14 8
EK-29 46 8 8 EK-38 130 67 8
EK-30 42 6 8 EK-39 63 43 8
EK-31 300 15 35 EK-40 18 105 14
EK-32 90 6 7 EK-41 15 112 128
EK-33 22 6 8 EK-42 6.6 308 203
EK-34 13 9 8 EK-43 80 8 17
EK-35 43 6 14 EK-44 65 10 21
EK-36 17 6 8 EK-45 9.5 8 18
EK-37 31 7 8 EK-46 880 20 27
EK-38 330 55 8 Mean 101.23 54.64 24.80
EK-39 23 6 8 Std Dev 167.58 100.71 38.66
EK-40 12 7 7 EALs 450 20 200
EK-41 6.4 25 12
EK-42 9.2 8 7
EK-43 34 8 16
EK-44 76 9 29
EK-45 94 7 17
EK-46 280 20 21
Mean 101.17 12.39 14.24Std Dev 111.61 11.34 7.46
EALs 450 20 200
Dioxin TEQ results in ng/kg
Blue, italicized values indicate result below reporting limit, reporting limit provided.

Table 13: Multi-Increment Soil Sample Data, DOH 2009
Sample Location TEQs (ng/kg) DDT (mg/kg) PCP (mg/kg)
Boiler Room 1 447180 0.701 89.4
Boiler Room 2 1814480 0.701 20.3
Boiler Room 3 868080 0.883 28.4
Spill Area 1 427480 4.04 21.5
Spill Area 2 581720 3.56 20.4
Spill Area 3 371360 2.41 32.7
DOH EALs 450 1.7 3
Collected by DOH HEER to be used in thermal desorption treatability study.
Dioxin/furan TEQs calculated based on 2005 World Health Organization TEFs
Blue, italicized values indicate result below reporting limit, reporting limit provided.
Boldfaced value indicates concentration exceeds EAL.
DOH EAL = Summer 2008 (October 2008 Update) Hawaii Department of Health, Default Tier 1 Environmental Action Levels, NDW, >150m

APPENDIX III
SUMMARY OF TEQ CALCULATIONS & LABORATORY REPORTS

Dioxins/Furans TEQ CalculationsEPA Method 8290 ModifiedAll results in picograms per gram (pg/g) = nanograms per kilogram (ng/kg) = parts per trillion (ppt)
Sample ID Lab Sample ID 2,3,7,8-TCDD1,2,3,7,8-
PentaCDD1,2,3,4,7,8-HexaCDD
1,2,3,6,7,8-HexaCDD
1,2,3,7,8,9-HexaCDD
1,2,3,4,6,7,8-HeptaCDD
1,2,3,4,6,7,8,9-OctaCDD
2,3,7,8-TetraCDF
1,2,3,7,8-PentaCDF
2,3,4,7,8-PentaCDF
1,2,3,4,7,8-HexaCDF
1,2,3,6,7,8-HexaCDF
2,3,4,6,7,8-HexaCDF
1,2,3,7,8,9-HexaCDF
1,2,3,4,6,7,8-HeptaCDF
1,2,3,4,7,8,9-HeptaCDF
1,2,3,4,6,7,8,9-OctaCDF
Total TEQ
1 1 0.1 0.1 0.1 0.01 0.0003 0.1 0.03 0.3 0.1 0.1 0.1 0.1 0.01 0.01 0.0003
SA1.A HTA0029-03 2200 10000 26000 110000 51000 6500000 41000000 3500 13000 11000 300000 48000 29000 31000 580000 110000 7500000
2200 10000 2600 11000 5100 65000 12300 350 390 3300 30000 4800 2900 3100 5800 1100 2250 162190
SA1.B HTA0030-01 100 1100 2800 15000 6200 630000 11000000 460 1250 1000 34000 6500 4900 5400 150000 8300 760000
100 1100 280 1500 620 6300 3300 46 37.5 300 3400 650 490 540 1500 83 228 20475
SA1.C HTA0030-02 250 1250 1250 1400 1250 43000 940000 250 1250 1250 4500 820 1500 970 14000 1250 38000
250 1250 125 140 125 430 282 25 37.5 375 450 82 150 97 140 12.5 11.4 3982
SA1.D HTA0030-03 44 1250 320 850 460 35000 370000 250 1250 1250 2600 380 260 310 8400 550 33000
44 1250 32 85 46 350 111 25 37.5 375 260 38 26 31 84 5.5 9.9 2810
SA2.A HTA0029-04 1100 24000 82000 330000 140000 13000000 20000000 8000 34000 29000 800000 130000 61000 110000 610000 350000 13000000
1100 24000 8200 33000 14000 130000 6000 800 1020 8700 80000 13000 6100 11000 6100 3500 3900 350420
SA2.B HTA0032-01 290 4800 20000 140000 45000 7500000 39000000 1400 1250 3900 230000 23000 2550 26000 2100000 99000 13000000
290 4800 2000 14000 4500 75000 11700 140 37.5 1170 23000 2300 255 2600 21000 990 3900 167683
SA2.C HTA0032-02 250 1250 2300 20000 3500 1300000 15000000 95 1250 1250 25000 1800 2300 1250 340000 12000 2500000
250 1250 230 2000 350 13000 4500 9.5 37.5 375 2500 180 230 125 3400 120 750 29307
SA2.D HTA0032-03 250 1250 1250 3400 560 160000 1600000 74 1250 1250 6500 1250 830 990 45000 5700 240000
250 1250 125 340 56 1600 480 7.4 37.5 375 650 125 83 99 450 57 72 6057
SA2.E HTA0029-05 1500 30000 97000 430000 180000 15000000 79000000 10000 54000 45000 1000000 170000 120000 150000 660000 530000 17000000
1500 30000 9700 43000 18000 150000 23700 1000 1620 13500 100000 17000 12000 15000 6600 5300 5100 453020
SA2.F HTA0029-06 1500 25000 68000 310000 130000 12000000 60000000 8300 36000 31000 700000 100000 82000 97000 440000 300000 12000000
1500 25000 6800 31000 13000 120000 18000 830 1080 9300 70000 10000 8200 9700 4400 3000 3600 335410
SA3.A HTA0029-07 3100 45000 130000 790000 270000 15000000 75000000 20000 80000 82000 1600000 230000 130000 230000 1500000 680000 19000000
3100 45000 13000 79000 27000 150000 22500 2000 2400 24600 160000 23000 13000 23000 15000 6800 5700 615100
SA3.B HTA0032-04 270 3500 10000 41000 18000 2000000 21000000 1200 2400 3600 91000 14000 12000 14000 300000 19000 1900000
270 3500 1000 4100 1800 20000 6300 120 72 1080 9100 1400 1200 1400 3000 190 570 55102
SA3.C HTA0032-05 250 830 420000 260000 46000 14000000 64000000 890 1250 1250 280000 1250 1250 1250 5100000 240000 21000000
250 830 42000 26000 4600 140000 19200 89 37.5 375 28000 125 125 125 51000 2400 6300 321457
SA3.D HTA0032-06 250 1250 2500 22000 4100 1700000 21000000 110 1250 1250 28000 1500 780 1250 440000 19000 3600000
250 1250 250 2200 410 17000 6300 11 37.5 375 2800 150 78 125 4400 190 1080 36907
IA1 HSL0151-01 11 89 190 690 400 25000 280000 14 40 48 270 130 100 4.8 6900 350 45000
11 89 19 69 40 250 84 1.4 1.2 14.4 27 13 10 0.48 69 3.5 13.5 715
IA2 HSL0151-02 25 60 130 700 340 26000 290000 15 57 68 470 160 86 11 7300 570 22000
25 60 13 70 34 260 87 1.5 1.71 20.4 47 16 8.6 1.1 73 5.7 6.6 731
IA3 HSL0151-03 16 130 290 1200 640 52000 590000 19 66 80 620 260 150 13 13000 630 68000
16 130 29 120 64 520 177 1.9 1.98 24 62 26 15 1.3 130 6.3 20.4 1345
IA4 HSL0151-04 19 49 87 380 190 19000 180000 7.4 32 39 310 120 61 4.8 3600 260 15000
19 49 8.7 38 19 190 54 0.74 0.96 11.7 31 12 6.1 0.48 36 2.6 4.5 484
IAT1.A HTA0012-01 51 440 1000 2900 1800 65000 540000 43 170 220 1300 600 460 30 18000 840 35000
51 440 100 290 180 650 162 4.3 5.1 66 130 60 46 3 180 8.4 10.5 2386
IAT1.B HTA0041-01 4 34 67 260 140 13000 130000 3.6 14 18 160 64 49 3 3200 110 11000
4 34 6.7 26 14 130 39 0.36 0.42 5.4 16 6.4 4.9 0.3 32 1.1 3.3 324
IAT1.C HTA0041-04 0.43 3.3 6.2 23 13 830 7300 0.73 1 1 7.4 4.6 3.5 1.15 160 8.6 520
0.43 3.3 0.62 2.3 1.3 8.3 2.19 0.073 0.03 0.3 0.74 0.46 0.35 0.115 1.6 0.086 0.156 22
IAT1.D HTA0041-02 11 110 180 470 320 19000 160000 7.4 19 23 180 120 81 2.7 3800 160 10000
11 110 18 47 32 190 48 0.74 0.57 6.9 18 12 8.1 0.27 38 1.6 3 545
TEFs

Dioxins/Furans TEQ CalculationsEPA Method 8290 ModifiedAll results in picograms per gram (pg/g) = nanograms per kilogram (ng/kg) = parts per trillion (ppt)
Sample ID Lab Sample ID 2,3,7,8-TCDD1,2,3,7,8-
PentaCDD1,2,3,4,7,8-HexaCDD
1,2,3,6,7,8-HexaCDD
1,2,3,7,8,9-HexaCDD
1,2,3,4,6,7,8-HeptaCDD
1,2,3,4,6,7,8,9-OctaCDD
2,3,7,8-TetraCDF
1,2,3,7,8-PentaCDF
2,3,4,7,8-PentaCDF
1,2,3,4,7,8-HexaCDF
1,2,3,6,7,8-HexaCDF
2,3,4,6,7,8-HexaCDF
1,2,3,7,8,9-HexaCDF
1,2,3,4,6,7,8-HeptaCDF
1,2,3,4,7,8,9-HeptaCDF
1,2,3,4,6,7,8,9-OctaCDF
Total TEQ
1 1 0.1 0.1 0.1 0.01 0.0003 0.1 0.03 0.3 0.1 0.1 0.1 0.1 0.01 0.01 0.0003TEFs
IAT1.E HTA0041-03 2.7 23 51 170 98 7400 80000 2.6 8.6 12 94 39 31 1.5 1700 63 6200
2.7 23 5.1 17 9.8 74 24 0.26 0.258 3.6 9.4 3.9 3.1 0.15 17 0.63 1.86 196
IAT2.A HTA0012-02 54 670 1500 4600 2700 140000 600000 32 190 240 2000 910 590 41 31000 1600 46000
54 670 150 460 270 1400 180 3.2 5.7 72 200 91 59 4.1 310 16 13.8 3959
IAT2.B HTA0067-03 17 140 200 1200 580 73000 590000 12 39 49 270 210 170 10 14000 320 55000
17 140 20 120 58 730 177 1.2 1.17 14.7 27 21 17 1 140 3.2 16.5 1505
IAT2.C HTA0067-04 32 320 440 3900 1200 200000 2100000 24 97 130 390 520 460 210 58000 2100 310000
32 320 44 390 120 2000 630 2.4 2.91 39 39 52 46 21 580 21 93 4432
IAT3.A HTA0012-03 240 1900 4000 24000 11000 610000 580000 240 1500 2000 19000 6900 5200 300 210000 13000 59000
240 1900 400 2400 1100 6100 174 24 45 600 1900 690 520 30 2100 130 17.7 18371
IAT3.B HTA0067-01 11 120 310 1300 590 70000 990000 14 44 59 450 220 180 13 13000 460 85000
11 120 31 130 59 700 297 1.4 1.32 17.7 45 22 18 1.3 130 4.6 25.5 1615
IAT3.C HTA0067-02 0.48 4.4 9.1 78 24 3700 57000 3.1 4.2 28 12 8.7 0.91 850 41 5700
0.48 4.4 0.91 7.8 2.4 37 17.1 0.31 0.126 8.4 1.2 0.87 0.091 85 0.41 57 0 223
IAT4.A HTA0012-04 200 2900 7200 21000 10000 370000 730000 170 1200 1400 12000 5200 2900 550 110000 8700 140000
200 2900 720 2100 1000 3700 219 17 36 420 1200 520 290 55 1100 87 42 14606
IAT4.B HTA0062-01 15 140 260 2000 640 110000 1500000 22 160 170 1800 450 220 57 3000 1300 110000
15 140 26 200 64 1100 450 2.2 4.8 51 180 45 22 5.7 30 13 33 2382
IAT4.C HTA0062-02 115 200 1200 24000 3200 1500000 15000000 120 290 340 5400 1000 670 550 350000 13000 2300000
115 200 120 2400 320 15000 4500 12 8.7 102 540 100 67 55 3500 130 690 27860
IAT5.A HTA0012-05 63 820 2500 14000 4400 430000 770000 140 960 1300 13000 3500 2400 450 100000 7500 110000
63 820 250 1400 440 4300 231 14 28.8 390 1300 350 240 45 1000 75 33 10980
IAT5.B HTA0062-03 15 160 430 2300 1000 84000 1100000 26 120 150 1700 540 380 37 25000 960 110000
15 160 43 230 100 840 330 2.6 3.6 45 170 54 38 3.7 250 9.6 33 2328
IAT5.C HTA0062-04 9.7 130 300 2700 810 98000 1100000 33 170 220 2400 650 490 53 26000 1100 150000
9.7 130 30 270 81 980 330 3.3 5.1 66 240 65 49 5.3 260 11 45 2580
IAT5.D HTA0029-02 250 330 940 3300 1600 190000 2300000 71 290 380 6300 1250 1250 1250 42000 2300 260000
250 330 94 330 160 1900 690 7.1 8.7 114 630 125 125 125 420 23 78 5410
IAT5.E HTA0029-01 250 700 2100 9700 3700 640000 7900000 220 930 920 19000 3000 2900 4300 110000 5000 770000
250 700 210 970 370 6400 2370 22 27.9 276 1900 300 290 430 1100 50 231 15897
The World Health Organizations' 2005 Toxic Equivalency Factor (TEF) scheme was used to weight each compound according to its relative toxicity for cancer risk evaluations.
Toxic Equivalencies (TEQs) were calculated using the TEFs.
DOH EAL = Summer 2008 (March 2009 Update) Hawaii Department of Health, Default Tier 1 Environmental Action Levels, NDW, >150m
Blue, italicized values indicate result below method detection limit (MDL), 1/2 MDL value shown and used to calculate adjusted concentrations.
Pink values indicate an estimated value.