simulation model calibration and validation: phase … contract report simulation model calibration...
TRANSCRIPT
SIMULATION MODEL
CALIBRATION AND VALIDATION:
PHASE II:
DEVELOPMENT OF IMPLEMENTATION
HANDBOOK AND SHORT COURSE
FINALCONTRACT REPORT
VTRC 07-CR5
BYUNGKYU "BRIAN" PARK, Ph.D.Faculty Research Scientist
andAssistant Professor of Civil Engineering
http://www.virginiadot.org/vtrc/main/online_reports/pdf/07-cr5.pdf
JONGSUN WONGraduate Research Assistant
Traffic Operations LaboratoryCenter for Transportation Studies
University of Virginia
Standard Title Page - Report on Federally Funded Project 1. Report No. 2. Government Accession No. 3. Recipient’s Catalog No. FHWA/VTRC 07-CR5 4. Title and Subtitle 5. Report Date
October 2006 6. Performing Organization Code
Simulation Model Calibration and Validation: Phase II: Development of Implementation Handbook and Short Course
7. Author(s) Byungkyu (Brian) Park and Jongsun Won
8. Performing Organization Report No. VTRC 07-CR5
9. Performing Organization and Address 10. Work Unit No. (TRAIS) Virginia Transportation Research Council 530 Edgemont Road 11. Contract or Grant No. Charlottesville, VA 22903 75583 12. Sponsoring Agencies' Name and Address 13. Type of Report and Period Covered
Final Contract Report December 2004–September 2006 14. Sponsoring Agency Code
Virginia Department of Transportation 1401 E. Broad Street Richmond, VA 23219
FHWA P.O. Box 10249 Richmond, VA 23240
15. Supplementary Notes
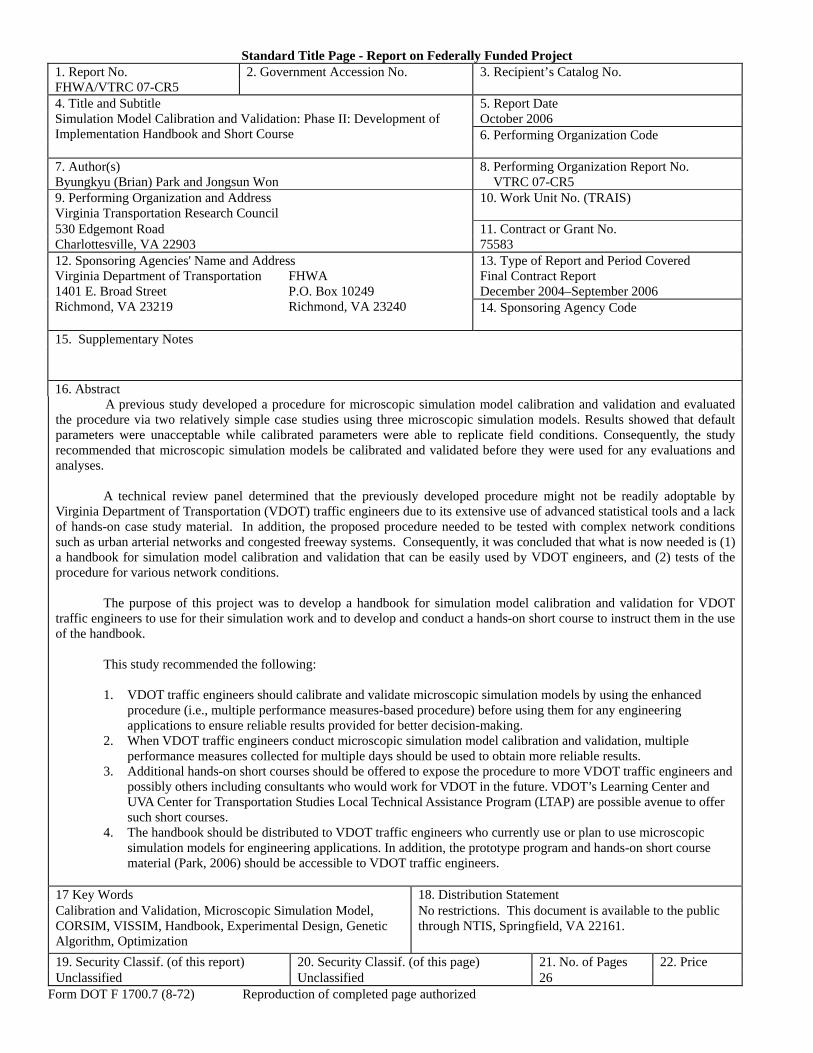
16. Abstract A previous study developed a procedure for microscopic simulation model calibration and validation and evaluated the procedure via two relatively simple case studies using three microscopic simulation models. Results showed that default parameters were unacceptable while calibrated parameters were able to replicate field conditions. Consequently, the study recommended that microscopic simulation models be calibrated and validated before they were used for any evaluations and analyses. A technical review panel determined that the previously developed procedure might not be readily adoptable by Virginia Department of Transportation (VDOT) traffic engineers due to its extensive use of advanced statistical tools and a lack of hands-on case study material. In addition, the proposed procedure needed to be tested with complex network conditions such as urban arterial networks and congested freeway systems. Consequently, it was concluded that what is now needed is (1) a handbook for simulation model calibration and validation that can be easily used by VDOT engineers, and (2) tests of the procedure for various network conditions. The purpose of this project was to develop a handbook for simulation model calibration and validation for VDOT traffic engineers to use for their simulation work and to develop and conduct a hands-on short course to instruct them in the use of the handbook. This study recommended the following:
1. VDOT traffic engineers should calibrate and validate microscopic simulation models by using the enhanced procedure (i.e., multiple performance measures-based procedure) before using them for any engineering applications to ensure reliable results provided for better decision-making.
2. When VDOT traffic engineers conduct microscopic simulation model calibration and validation, multiple performance measures collected for multiple days should be used to obtain more reliable results.
3. Additional hands-on short courses should be offered to expose the procedure to more VDOT traffic engineers and possibly others including consultants who would work for VDOT in the future. VDOT’s Learning Center and UVA Center for Transportation Studies Local Technical Assistance Program (LTAP) are possible avenue to offer such short courses.
4. The handbook should be distributed to VDOT traffic engineers who currently use or plan to use microscopic simulation models for engineering applications. In addition, the prototype program and hands-on short course material (Park, 2006) should be accessible to VDOT traffic engineers.
17 Key Words 18. Distribution Statement Calibration and Validation, Microscopic Simulation Model, CORSIM, VISSIM, Handbook, Experimental Design, Genetic Algorithm, Optimization
No restrictions. This document is available to the public through NTIS, Springfield, VA 22161.
19. Security Classif. (of this report) 20. Security Classif. (of this page) 21. No. of Pages 22. Price Unclassified Unclassified 26
Form DOT F 1700.7 (8-72) Reproduction of completed page authorized

FINAL CONTRACT REPORT
SIMULATION MODEL CALIBRATION AND VALIDATION: PHASE II: DEVELOPMENT OF IMPLEMENTATION HANDBOOK AND SHORT COURSE
Byungkyu “Brian” Park, Ph.D. Faculty Research Scientist
and Assistant Professor of Civil Engineering
Jongsun Won
Graduate Research Assistant
Traffic Operations Laboratory Center for Transportation Studies
University of Virginia
Project Manager Michael A. Perfater, Virginia Transportation Research Council
Contract Research Sponsored by Virginia Transportation Research Council
Virginia Transportation Research Council (A partnership of the Virginia Department of Transportation
and the University of Virginia since 1948)
Charlottesville, Virginia
October 2006 VTRC 07-CR5
ii
NOTICE
The project that is the subject of this report was done under contract for the Virginia Department of Transportation, Virginia Transportation Research Council. The contents of this report reflect the views of the authors, who are responsible for the facts and the accuracy of the data presented herein. The contents do not necessarily reflect the official views or policies of the Virginia Department of Transportation, the Commonwealth Transportation Board, or the Federal Highway Administration. This report does not constitute a standard, specification, or regulation. Each contract report is peer reviewed and accepted for publication by Research Council staff with expertise in related technical areas. Final editing and proofreading of the report are performed by the contractor.
Copyright 2006 by the Commonwealth of Virginia. All rights reserved.

iii
ABSTRACT A previous study developed a procedure for microscopic simulation model calibration and validation and evaluated the procedure via two relatively simple case studies using three microscopic simulation models. Results showed that default parameters were unacceptable while calibrated parameters were able to replicate field conditions. Consequently, the study recommended that microscopic simulation models be calibrated and validated before they were used for any evaluations and analyses. A technical review panel determined that the previously developed procedure might not be readily adoptable by Virginia Department of Transportation (VDOT) traffic engineers due to its extensive use of advanced statistical tools and a lack of hands-on case study material. In addition, the proposed procedure needed to be tested with complex network conditions such as urban arterial networks and congested freeway systems. Consequently, it was concluded that what is now needed is (1) a handbook for simulation model calibration and validation that can be easily used by VDOT engineers, and (2) tests of the procedure for various network conditions. The purpose of this project was to develop a handbook for simulation model calibration and validation for VDOT traffic engineers to use for their simulation work and to develop and conduct a hands-on short course to instruct them in the use of the handbook. This study recommended the following:
1. VDOT traffic engineers should calibrate and validate microscopic simulation models by using the enhanced procedure (i.e., multiple performance measures-based procedure) before using them for any engineering applications to ensure reliable results provided for better decision-making.
2. When VDOT traffic engineers conduct microscopic simulation model calibration and
validation, multiple performance measures collected for multiple days should be used to obtain more reliable results.
3. Additional hands-on short courses should be offered to expose the procedure to more
VDOT traffic engineers and possibly others including consultants who would work for VDOT in the future. VDOT’s Learning Center and UVA Center for Transportation Studies Local Technical Assistance Program (LTAP) are possible avenue to offer such short courses.
4. The handbook should be distributed to VDOT traffic engineers who currently use or
plan to use microscopic simulation models for engineering applications. In addition, the prototype program and hands-on short course material (Park, 2006) should be accessible to VDOT traffic engineers.
1
FINAL CONTRACT REPORT
SIMULATION MODEL CALIBRATION AND VALIDATION: PHASE II: DEVELOPMENT OF IMPLEMENTATION HANDBOOK AND SHORT COURSE
Byungkyu “Brian” Park, Ph.D.
Faculty Research Scientist and
Assistant Professor
Jongsun Won Graduate Research Assistant
Department of Civil Engineering
University of Virginia
INTRODUCTION
Microscopic traffic simulation models have been widely used in the evaluations of various traffic operations and management strategies including geometry changes, traffic signal timing plan updates, ramp metering, route guidance, etc. It is generally understood that the success of such evaluations is in large part dependent on the quality of the microscopic simulation model that is used in the analysis—in other words, whether or not the model used was well-calibrated and validated.
To achieve adequate reliability when applying simulation models, it is important that a rigorous calibration and validation procedure take place before the models are used. Changes to the parameters during calibration should be justified and defensible. Calibration efforts are done to achieve reasonable correspondence between field data and simulation model output. More and more transportation researchers and practitioners have realized the importance of model calibration and have spent significant time and effort to demonstrate the validity of their models.
The recent development of a systematic procedure for microscopic simulation model calibration and validation by Park and Qi (2004) significantly enhanced the state of the practice in microscopic simulation model calibration and validation. However, the procedure developed was not readily usable by Virginia Department of Transportation (VDOT) traffic engineers due to its extensive use of advanced statistical tools and a lack of hands-on case study material. In addition, the procedure needed to be tested with complex network conditions such as urban arterial networks and congested freeway systems. This project aimed to address these needs.
2
PURPOSE AND SCOPE
The purpose of this project was to provide tools that can be used by VDOT traffic engineers in conducting microscopic simulation model calibration and validation. To this end, the objectives of this project were (1) to develop a handbook that lays out practical methods for conducting microscopic simulation model calibration and validation; (2) to develop and conduct a hands-on simulation model calibration and validation short course to enable VDOT engineers to use the handbook; and (3) to enhance and refine the handbook based on additional case studies.
In addition, in order to validate and further enhance the simulation model calibration and validation procedure developed in a previous study by the author (Park and Qi, 2004), this study tested the procedure using two additional real transportation networks including an urban arterial network and a freeway system.
METHODS
The following five tasks were undertaken to accomplish the objectives of this study.
1. Develop a handbook and prototype calibration and validation program. This task included the development of a handbook on microscopic traffic simulation model calibration and validation as well as a prototype computer program that provides easy-to-follow guidelines to VDOT traffic engineers as they use the handbook.
2. Conduct hands-on short course. Once the handbook was developed, a short course
was developed as means for instructing VDOT personnel on the use of the handbook. Before conducting the short course, the project team worked with a focus group consisting of project review panel members and other VDOT personnel to finalize the short course material.
3. Select case study sites and conduct data collection. With help from VDOT personnel
from the Virginia Transportation Research Council (VTRC) and VDOT’s Northern Virginia (NOVA) District, the project team identified two case study locations. The team identified two case study locations to further test the previously developed microscopic simulation model calibration and validation under complex networks. The selected test sites were coded into VISSIM and CORSIM simulation programs. To account for variability in field data, multiple days of data were collected.
4. Conduct case studies and enhance the procedure. The microscopic simulation model
calibration and validation procedure developed in the previous study by the author was extensively evaluated via the conduct of the two case studies. The evaluation focused on validation as well as enhancements and refinements of the procedure.
5. Revise handbook. Based on the outcomes of the case studies, the handbook was
updated. The new case studies were included in the handbook, as were findings and enhancements made during the two case studies.

3
RESULTS AND DISCUSSION
Develop Handbook and Prototype Calibration and Validation Program
The first task of the project was to develop the calibration and validation handbook and the prototype calibration and validation program. In the handbook (Park and Won, 2006), the calibration and validation procedure that was developed from previous research was written in a way that can be easily understood by the target audience—VDOT engineers and staff. In the first part of the handbook, each step within the calibration and validation procedure was separately explained with examples and each technique used was presented with its definition and usage. At the end of each step, examples were included for better understanding. The second part of the handbook consists of four case studies using a proposed calibration and validation procedure with two simulation models, VISSIM and CORSIM. These four case studies include (1) an actuated isolated signalized intersection, (2) an actuated signalized corridor, (3) a highway basic segment with work-zone, and (4) a highway merging segment. With these case studies, detailed techniques that can be used for the calibration and validation procedure were provided. More details about the handbook are provided in Park and Won (2006).
In addition, a prototype calibration and validation program was developed which conducts calibration and validation of VISSIM and CORSIM simulation models. The program allows the users to:
• Conduct multiple runs for specific simulation model. • Display simulation outputs in histogram format. • Generate experimental design for the calibration parameter combinations using Latin
Hypercube Design (LHD). • Conduct multiple runs for the combinations of parameter sets from the experimental
design. • Generate X-Y plot of performance measure versus each calibration parameter that can
be used for feasibility test. • Optimize selected calibration parameters using a genetic algorithm (GA). • Watch animations of simulation models for the visualization purpose.
It should be noted that the program is a prototype that is targeted to help demonstrate
VDOT engineers and other staff the calibration and validation procedure with relatively simple networks. Consequently, it might require modifications to use it for other more complex networks.
Conduct Hands-on Short Course
Microsoft Powerpoint slides were developed for use as short-course material during the hands-on short course as well as for future reference of the calibration and validation procedure. Short course material consists of two major parts: (1) tutorials on calibration and validation method with examples, and (2) a case study using the calibration and validation prototype program developed in the previous task. Before conducting the formal short course, the project team held an informal mini-short course with several key simulation modeling experts. Based on
4
the comments and suggestions from these participants, the short course material and handbook were updated. The first microscopic simulation model calibration and validation short course was held on June 27, 2006, at the Knowledge Management Division in Charlottesville, Virginia. The reader should refer to the short course material for more specific details about the course (Park, 2006).
Select Case Study Sites and Conduct Data Collection/Reduction
After preliminary site visits, with help from VDOT personnel from VTRC and the NOVA District, the project team identified two case study locations. The team selected two test sites that cover an urban arterial network and a freeway system. These sites were selected because they provide complex network with non-trivial lane selection and freeway merging behaviors. The first case study site selected was four signalized intersections on Emmet Street in Charlottesville. The second site selected was I-66 in Arlington at Glebe Road (Exit 72) including the merge area at this interchange. The selected test sites were coded into VISSIM and CORSIM simulation programs. To account for variability in field data, multiple days of data were collected. Case Study 1: Charlottesville Network
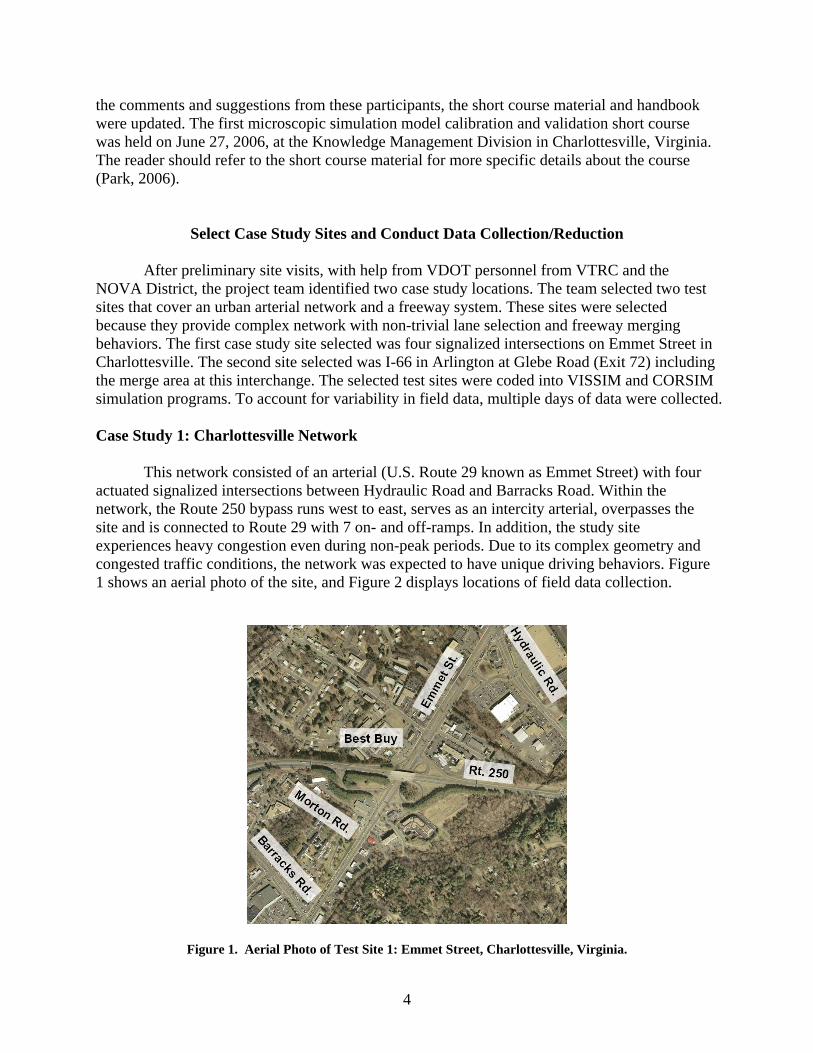
This network consisted of an arterial (U.S. Route 29 known as Emmet Street) with four actuated signalized intersections between Hydraulic Road and Barracks Road. Within the network, the Route 250 bypass runs west to east, serves as an intercity arterial, overpasses the site and is connected to Route 29 with 7 on- and off-ramps. In addition, the study site experiences heavy congestion even during non-peak periods. Due to its complex geometry and congested traffic conditions, the network was expected to have unique driving behaviors. Figure 1 shows an aerial photo of the site, and Figure 2 displays locations of field data collection.
Figure 1. Aerial Photo of Test Site 1: Emmet Street, Charlottesville, Virginia.
5
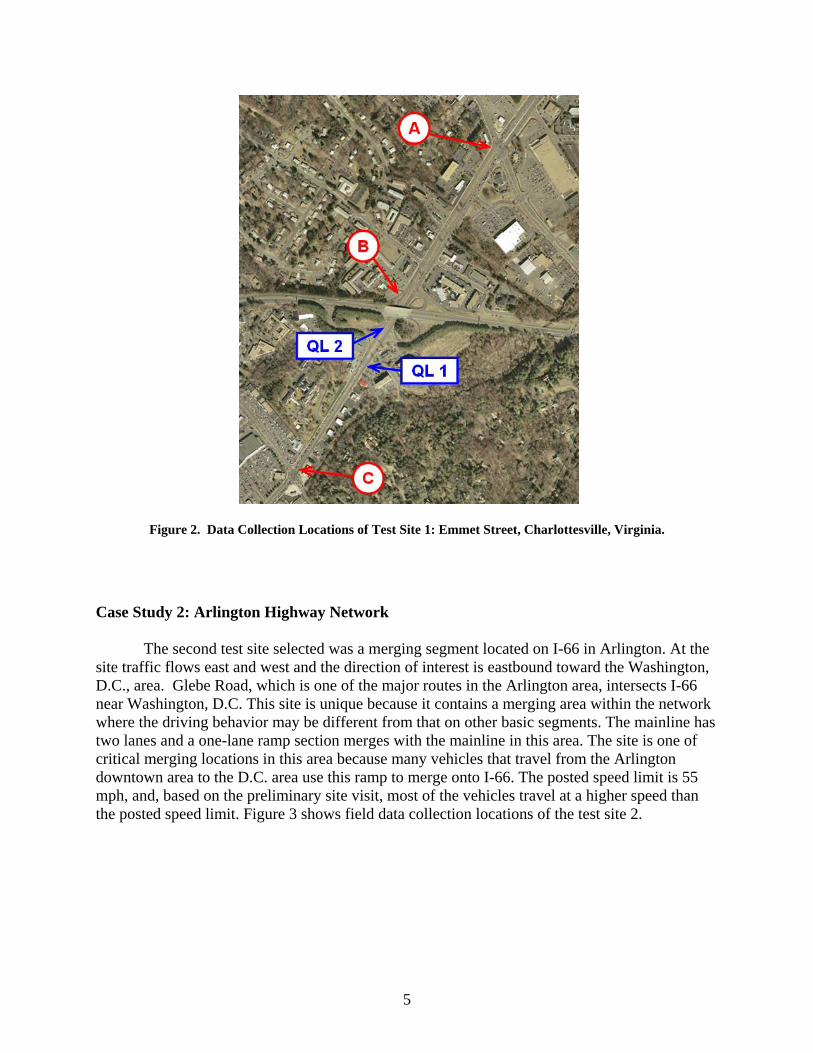
Figure 2. Data Collection Locations of Test Site 1: Emmet Street, Charlottesville, Virginia.
Case Study 2: Arlington Highway Network
The second test site selected was a merging segment located on I-66 in Arlington. At the site traffic flows east and west and the direction of interest is eastbound toward the Washington, D.C., area. Glebe Road, which is one of the major routes in the Arlington area, intersects I-66 near Washington, D.C. This site is unique because it contains a merging area within the network where the driving behavior may be different from that on other basic segments. The mainline has two lanes and a one-lane ramp section merges with the mainline in this area. The site is one of critical merging locations in this area because many vehicles that travel from the Arlington downtown area to the D.C. area use this ramp to merge onto I-66. The posted speed limit is 55 mph, and, based on the preliminary site visit, most of the vehicles travel at a higher speed than the posted speed limit. Figure 3 shows field data collection locations of the test site 2.
6
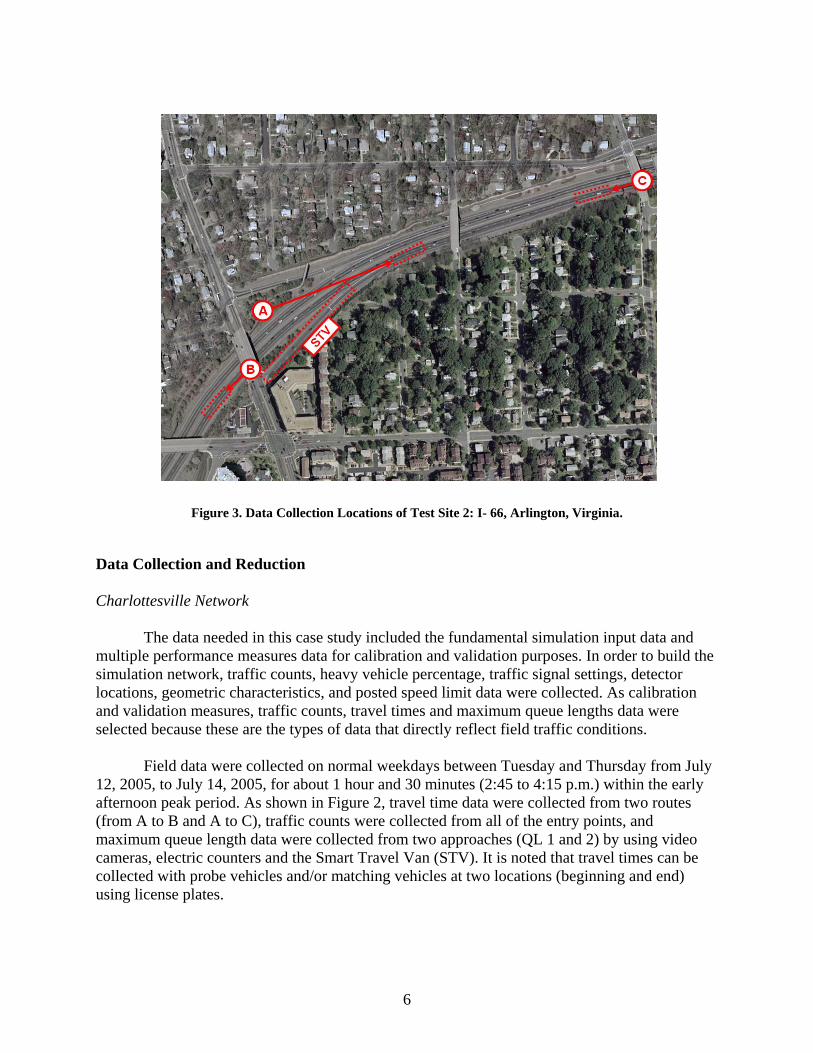
Figure 3. Data Collection Locations of Test Site 2: I- 66, Arlington, Virginia.
Data Collection and Reduction Charlottesville Network
The data needed in this case study included the fundamental simulation input data and multiple performance measures data for calibration and validation purposes. In order to build the simulation network, traffic counts, heavy vehicle percentage, traffic signal settings, detector locations, geometric characteristics, and posted speed limit data were collected. As calibration and validation measures, traffic counts, travel times and maximum queue lengths data were selected because these are the types of data that directly reflect field traffic conditions.
Field data were collected on normal weekdays between Tuesday and Thursday from July 12, 2005, to July 14, 2005, for about 1 hour and 30 minutes (2:45 to 4:15 p.m.) within the early afternoon peak period. As shown in Figure 2, travel time data were collected from two routes (from A to B and A to C), traffic counts were collected from all of the entry points, and maximum queue length data were collected from two approaches (QL 1 and 2) by using video cameras, electric counters and the Smart Travel Van (STV). It is noted that travel times can be collected with probe vehicles and/or matching vehicles at two locations (beginning and end) using license plates.
7
Arlington Highway Network
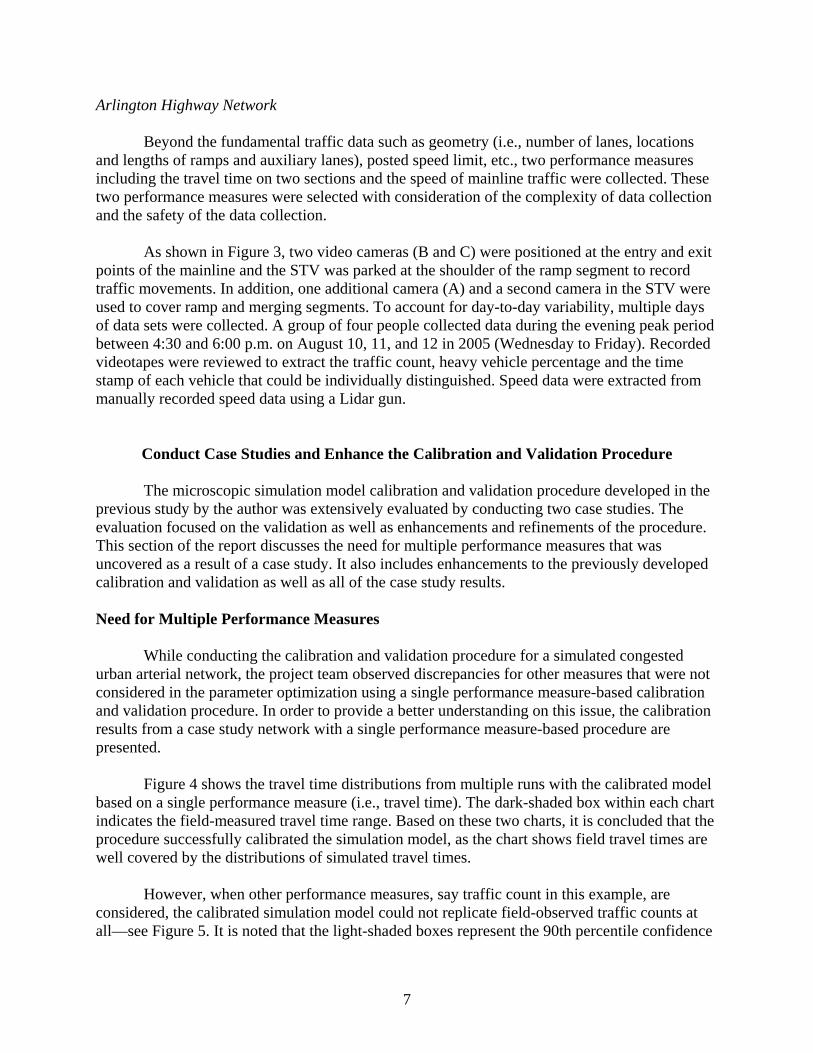
Beyond the fundamental traffic data such as geometry (i.e., number of lanes, locations and lengths of ramps and auxiliary lanes), posted speed limit, etc., two performance measures including the travel time on two sections and the speed of mainline traffic were collected. These two performance measures were selected with consideration of the complexity of data collection and the safety of the data collection.
As shown in Figure 3, two video cameras (B and C) were positioned at the entry and exit points of the mainline and the STV was parked at the shoulder of the ramp segment to record traffic movements. In addition, one additional camera (A) and a second camera in the STV were used to cover ramp and merging segments. To account for day-to-day variability, multiple days of data sets were collected. A group of four people collected data during the evening peak period between 4:30 and 6:00 p.m. on August 10, 11, and 12 in 2005 (Wednesday to Friday). Recorded videotapes were reviewed to extract the traffic count, heavy vehicle percentage and the time stamp of each vehicle that could be individually distinguished. Speed data were extracted from manually recorded speed data using a Lidar gun.
Conduct Case Studies and Enhance the Calibration and Validation Procedure
The microscopic simulation model calibration and validation procedure developed in the previous study by the author was extensively evaluated by conducting two case studies. The evaluation focused on the validation as well as enhancements and refinements of the procedure. This section of the report discusses the need for multiple performance measures that was uncovered as a result of a case study. It also includes enhancements to the previously developed calibration and validation as well as all of the case study results. Need for Multiple Performance Measures
While conducting the calibration and validation procedure for a simulated congested urban arterial network, the project team observed discrepancies for other measures that were not considered in the parameter optimization using a single performance measure-based calibration and validation procedure. In order to provide a better understanding on this issue, the calibration results from a case study network with a single performance measure-based procedure are presented.
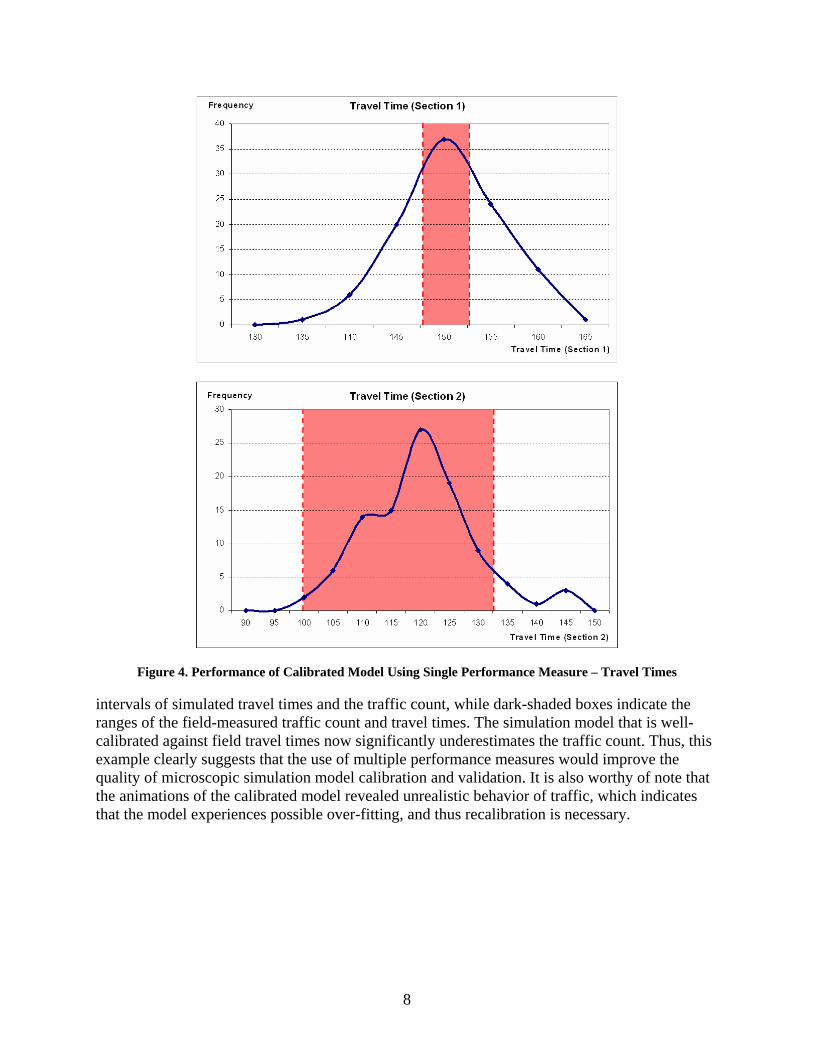
Figure 4 shows the travel time distributions from multiple runs with the calibrated model
based on a single performance measure (i.e., travel time). The dark-shaded box within each chart indicates the field-measured travel time range. Based on these two charts, it is concluded that the procedure successfully calibrated the simulation model, as the chart shows field travel times are well covered by the distributions of simulated travel times.
However, when other performance measures, say traffic count in this example, are
considered, the calibrated simulation model could not replicate field-observed traffic counts at all—see Figure 5. It is noted that the light-shaded boxes represent the 90th percentile confidence
8
Figure 4. Performance of Calibrated Model Using Single Performance Measure – Travel Times
intervals of simulated travel times and the traffic count, while dark-shaded boxes indicate the ranges of the field-measured traffic count and travel times. The simulation model that is well-calibrated against field travel times now significantly underestimates the traffic count. Thus, this example clearly suggests that the use of multiple performance measures would improve the quality of microscopic simulation model calibration and validation. It is also worthy of note that the animations of the calibrated model revealed unrealistic behavior of traffic, which indicates that the model experiences possible over-fitting, and thus recalibration is necessary.

9
Figure 5. Performance of Calibrated Model Using Single Performance Measure: Travel Times and Counts Enhanced Procedure with Multiple Performance Measures
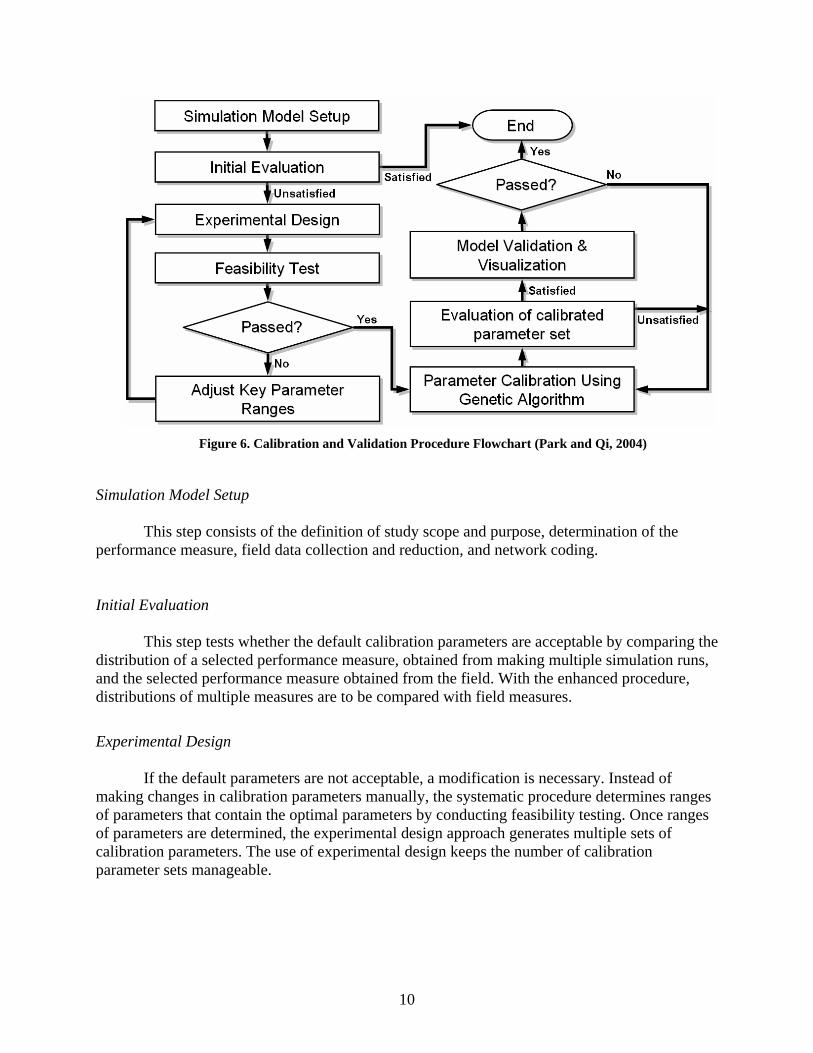
The enhanced procedure that considers multiple performance measures is almost identical to the one previously developed by Park and Qi (2004) except for those steps involved in the use of multiple performance measures, the enhanced elements are supplemented to the previous procedure. Figure 6 shows the flowchart of the previously developed calibration and validation procedure. The following section discusses the enhancements made to the microscopic simulation model calibration and validation procedure for the use of multiple performance measures.
10
Figure 6. Calibration and Validation Procedure Flowchart (Park and Qi, 2004)
Simulation Model Setup
This step consists of the definition of study scope and purpose, determination of the performance measure, field data collection and reduction, and network coding. Initial Evaluation
This step tests whether the default calibration parameters are acceptable by comparing the distribution of a selected performance measure, obtained from making multiple simulation runs, and the selected performance measure obtained from the field. With the enhanced procedure, distributions of multiple measures are to be compared with field measures.
Experimental Design
If the default parameters are not acceptable, a modification is necessary. Instead of making changes in calibration parameters manually, the systematic procedure determines ranges of parameters that contain the optimal parameters by conducting feasibility testing. Once ranges of parameters are determined, the experimental design approach generates multiple sets of calibration parameters. The use of experimental design keeps the number of calibration parameter sets manageable.
11
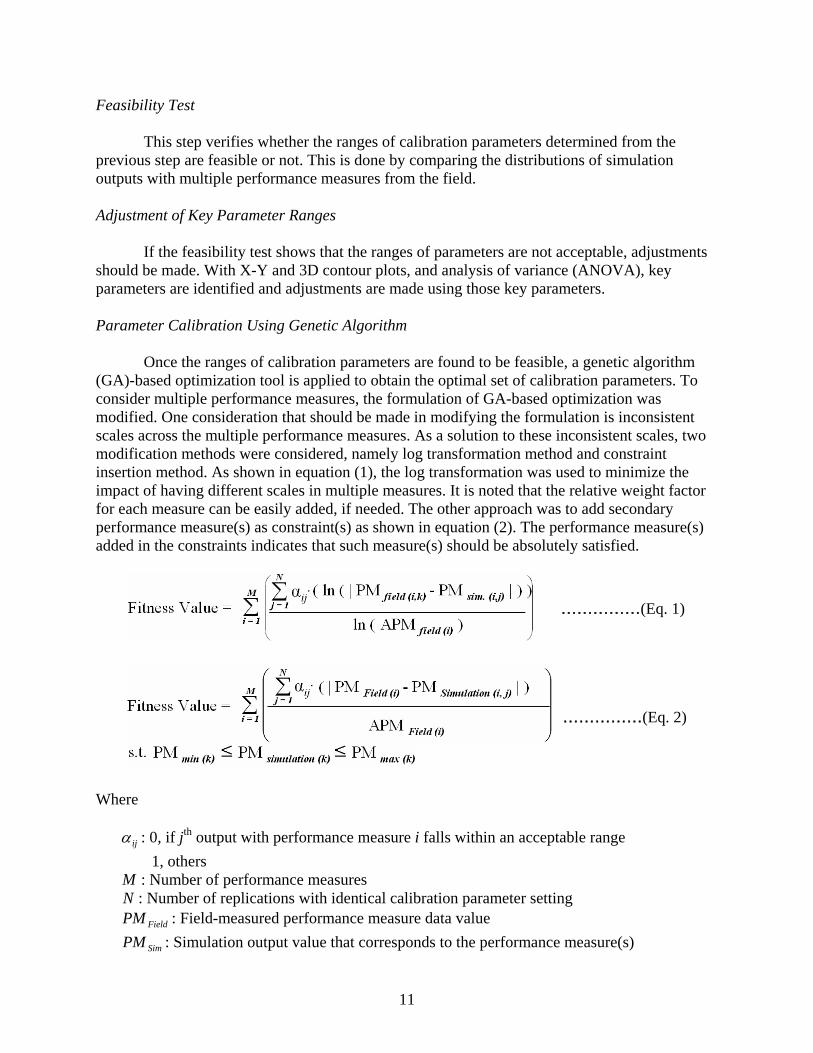
Feasibility Test
This step verifies whether the ranges of calibration parameters determined from the previous step are feasible or not. This is done by comparing the distributions of simulation outputs with multiple performance measures from the field. Adjustment of Key Parameter Ranges
If the feasibility test shows that the ranges of parameters are not acceptable, adjustments should be made. With X-Y and 3D contour plots, and analysis of variance (ANOVA), key parameters are identified and adjustments are made using those key parameters. Parameter Calibration Using Genetic Algorithm
Once the ranges of calibration parameters are found to be feasible, a genetic algorithm (GA)-based optimization tool is applied to obtain the optimal set of calibration parameters. To consider multiple performance measures, the formulation of GA-based optimization was modified. One consideration that should be made in modifying the formulation is inconsistent scales across the multiple performance measures. As a solution to these inconsistent scales, two modification methods were considered, namely log transformation method and constraint insertion method. As shown in equation (1), the log transformation was used to minimize the impact of having different scales in multiple measures. It is noted that the relative weight factor for each measure can be easily added, if needed. The other approach was to add secondary performance measure(s) as constraint(s) as shown in equation (2). The performance measure(s) added in the constraints indicates that such measure(s) should be absolutely satisfied.
……………(Eq. 1)
……………(Eq. 2)
Where
ijα : 0, if jth output with performance measure i falls within an acceptable range 1, others M : Number of performance measures N : Number of replications with identical calibration parameter setting
FieldPM : Field-measured performance measure data value
SimPM : Simulation output value that corresponds to the performance measure(s)

12
)(kMinPM : Minimum value of field measured performance measure data value
)(kMaxPM : Maximum value of field measured performance measure data value
)(iFieldAPM : Average value of ith performance measure data. Evaluation of the Parameter Set
This step is to confirm that the calibration parameters obtained from the GA optimization can replicate field conditions. This is because during GA optimization the number of replications is relatively small (usually less than five) such that the variability of the parameter set might have not been adequately considered. Thus, the distributions of the performance measures under the calibrated parameters are obtained by making multiple runs, say 100, and the distributions were compared with those of field measures. In addition, animations of selected percentile runs (e.g., 50 percentile and 90 percentile of performance measures) are carefully observed to ensure the calibrated parameters do not exhibit unacceptable vehicle maneuvers. Validation and Visualization
This step validates the calibrated parameters with a new dataset that has not been used in the calibration procedure by comparing a predicted condition under the calibrated parameter with the validation performance measure. It is critical to use visualization in this step.
In summary, the previously developed procedure was modified and/or enhanced to account for multiple performance measures. This was accommodated by making modifications into the GA-based optimization step. Case Study Results
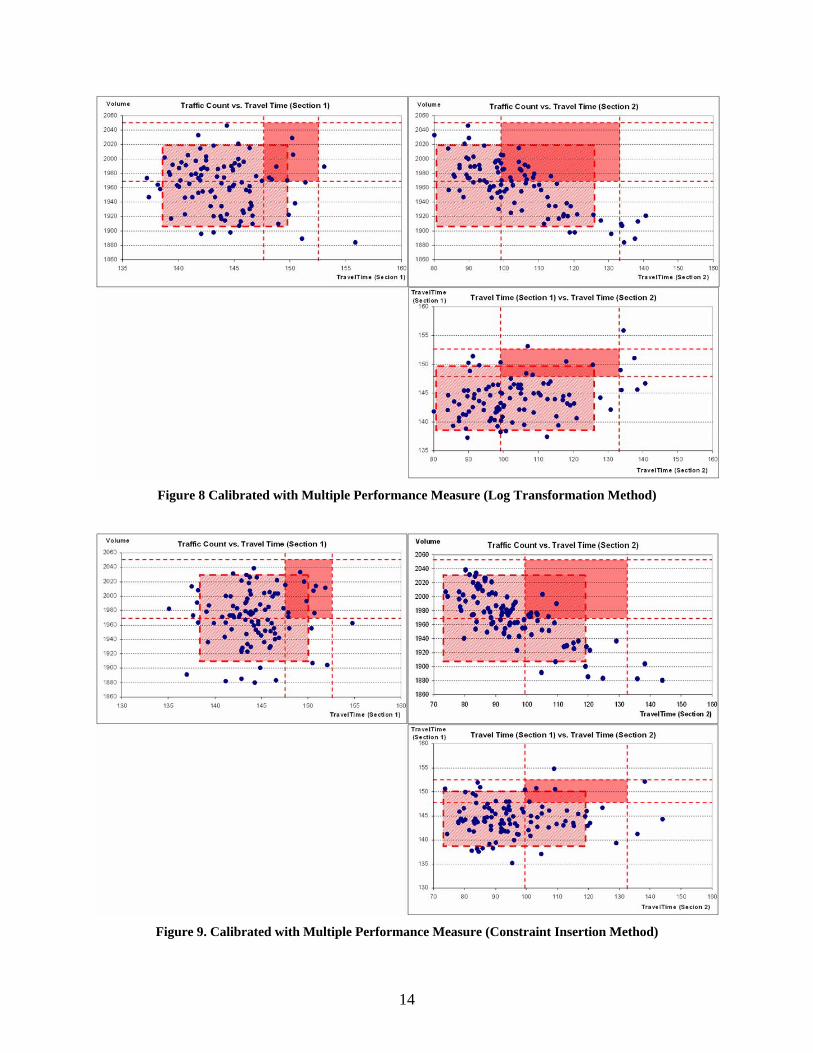
This section provides validity of the enhanced calibration and validation procedure by presenting the summary results of two case studies. The single performance measure-based calibration and validation procedure was applied and the results were compared with multiple performance measures. The multiple performance measures-based procedure was applied for the cases where a single performance measure-based procedure did not produce acceptable results. However, it is noted that the use of multiple performance measures-based procedure generally produces more reliable results. The results of the two case studies using both VISSIM and CORSIM simulation models are well documented in Park and Won (2006). Charlottesville Network: VISSIM The case study results using a single performance measure-based procedure for the Charlottesville network with the VISSIM model produced good matches with travel times but significant discrepancies for traffic count (see Figure 7). Thus, it was determined that this case would benefit from the multiple performance measures-based procedure. The enhanced procedure that calibrates and validates the model with the multiple performance measures was applied and a comparison of its results is shown in Figures 8 and 9. It

13
is noted that the light-shaded boxes represent the 90th percentile confidence intervals of simulated travel times and the traffic count, while dark-shaded boxes indicate the ranges of the field-measured traffic count and travel times. Figure 7 shows that even though travel times were matching, simulated traffic count was not close to field-measured count with a single performance measure based procedure. On the contrary, Figures 8 and 9 present the results with the multiple performance measures based procedure showing acceptable matches between field measurements of traffic counts as well as travel times and those from the calibrated model.
Figure 7. Calibrated Parameters with Single Performance Measure
14
Figure 8 Calibrated with Multiple Performance Measure (Log Transformation Method)
Figure 9. Calibrated with Multiple Performance Measure (Constraint Insertion Method)

15
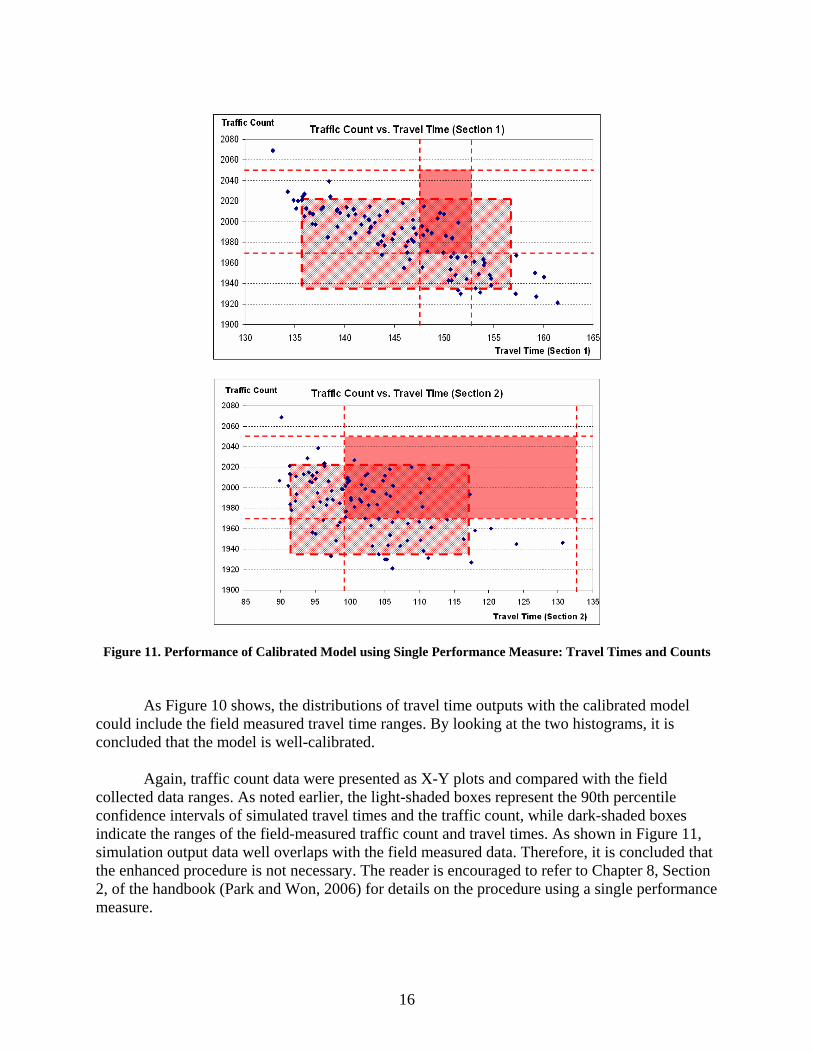
Charlottesville Network: CORSIM Another calibration and validation for the Charlottesville network (see Figures 1 and 2) was conducted using the CORSIM simulation program. The necessity of using multiple performance measures was determined by verifying simulation outputs that have been generated with the calibrated model using a single performance measure. In other words, if the calibrated model satisfies the criteria provided in the enhanced procedure, then it is not necessary to conduct the calibration procedure using multiple performance measures. This is because the enhanced procedure would produce similar results. Figures 10 and 11 show the results from multiple simulation runs with a calibrated model using a single performance measure. The results are presented in both histograms and X-Y plots to assist in determining the need for using multiple performance measures.
Figure 10. Performance of Calibrated Model Using Single Performance Measure: Travel Times
16
Figure 11. Performance of Calibrated Model using Single Performance Measure: Travel Times and Counts As Figure 10 shows, the distributions of travel time outputs with the calibrated model could include the field measured travel time ranges. By looking at the two histograms, it is concluded that the model is well-calibrated. Again, traffic count data were presented as X-Y plots and compared with the field collected data ranges. As noted earlier, the light-shaded boxes represent the 90th percentile confidence intervals of simulated travel times and the traffic count, while dark-shaded boxes indicate the ranges of the field-measured traffic count and travel times. As shown in Figure 11, simulation output data well overlaps with the field measured data. Therefore, it is concluded that the enhanced procedure is not necessary. The reader is encouraged to refer to Chapter 8, Section 2, of the handbook (Park and Won, 2006) for details on the procedure using a single performance measure.
17
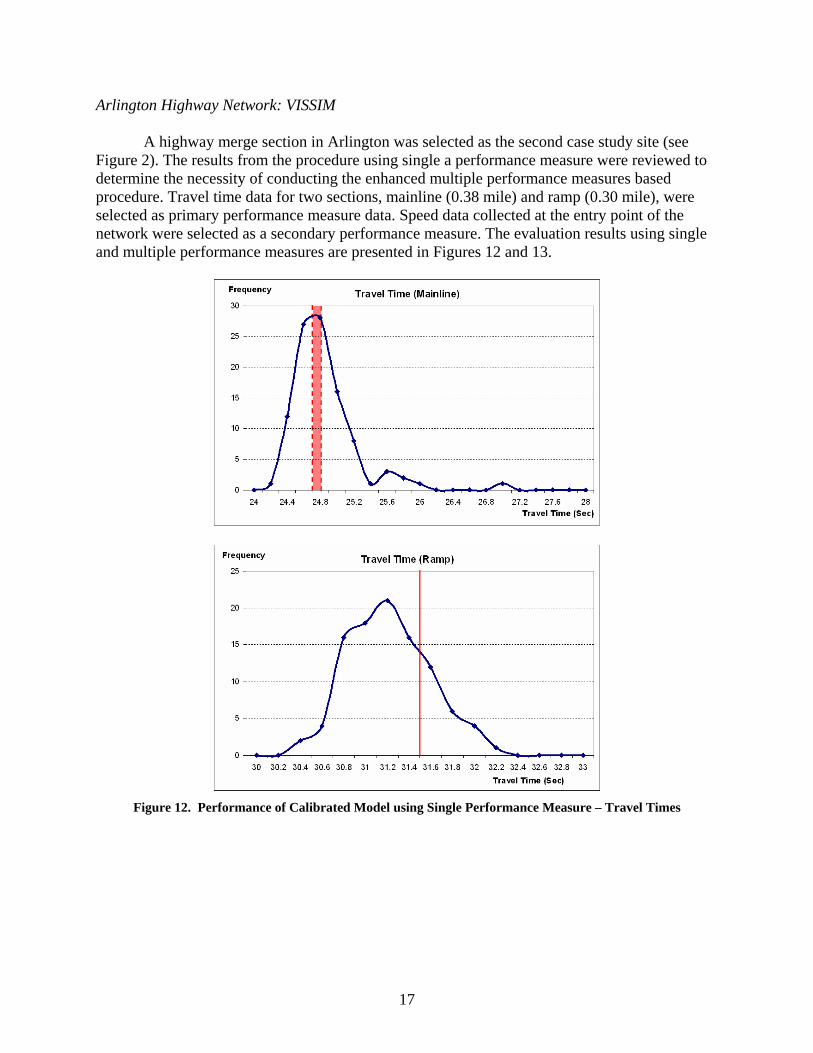
Arlington Highway Network: VISSIM A highway merge section in Arlington was selected as the second case study site (see Figure 2). The results from the procedure using single a performance measure were reviewed to determine the necessity of conducting the enhanced multiple performance measures based procedure. Travel time data for two sections, mainline (0.38 mile) and ramp (0.30 mile), were selected as primary performance measure data. Speed data collected at the entry point of the network were selected as a secondary performance measure. The evaluation results using single and multiple performance measures are presented in Figures 12 and 13.
Figure 12. Performance of Calibrated Model using Single Performance Measure – Travel Times

18
Figure 13. Performance of Calibrated Model using Single Performance Measure – Travel Times and Speed
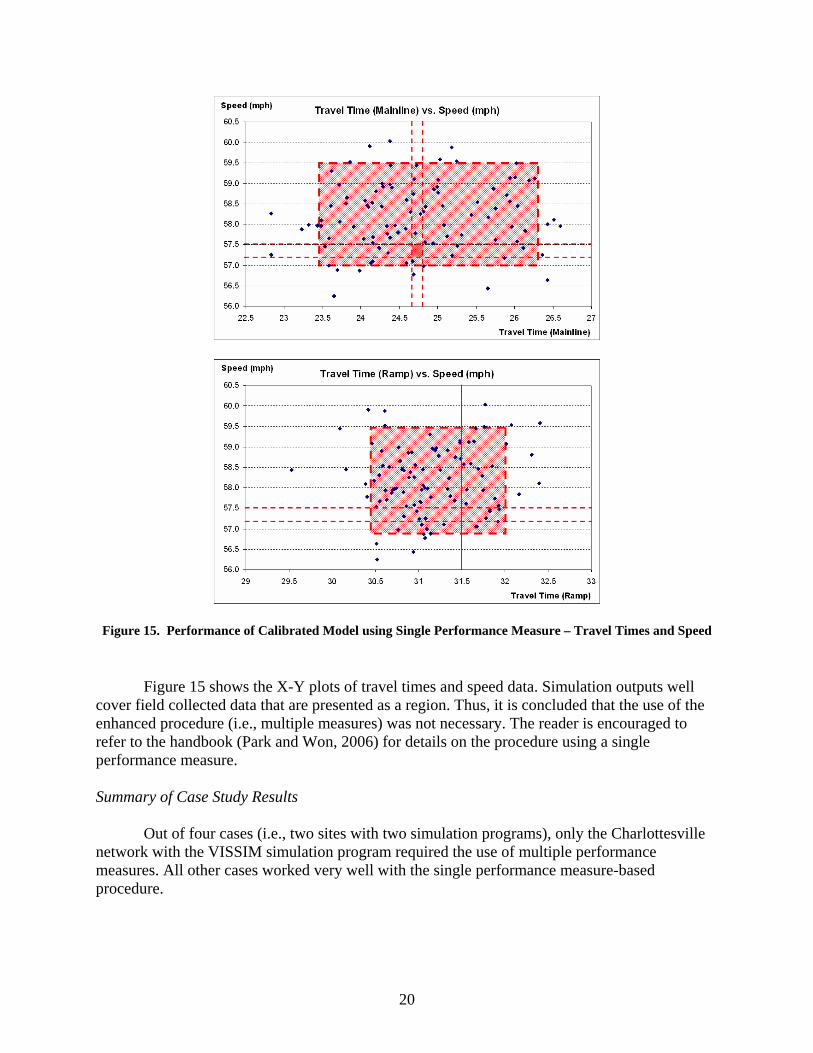
As shown in Figure 12, the travel time data collected from the field fall within the distributions of travel time outputs for two sections. Therefore, with two histograms, it is concluded that the model is well-calibrated when considering only a single performance measure. As mentioned earlier, speed data were used as a secondary performance measure and the results of multiple runs are presented in X-Y plot and compared with field collected data. As shown in Figure 13, simulation outputs well cover the field observed data that are presented as a dark-shaded region. Thus, it is concluded that the enhanced procedure using multiple performance measures was not necessary. The reader is encouraged to refer to the handbook (Park and Won, 2006) for details on the procedure using a single performance measure. Arlington Highway Network: CORSIM The Arlington highway network was calibrated and validated using CORSIM program. Multiple runs with a calibrated model using a single performance measure-based procedure were made and individual performance measures including travel times as well as speed data were

19
recorded for evaluation purposes. The results of both procedures using a single and multiple performance measures were presented in a histogram and X-Y plot as along with field-collected performance measure data ranges as shown in Figures 14 and 15.
Figure 14. Performance of Calibrated Model using Single Performance Measure – Travel Times
As shown in Figure 14, two distributions of travel time outputs cover field performance measure ranges that were collected over multiple days as a means of considering day-to-day variability. Thus, it is concluded that the model obtained after conducting the procedure is well-calibrated.
20
Figure 15. Performance of Calibrated Model using Single Performance Measure – Travel Times and Speed
Figure 15 shows the X-Y plots of travel times and speed data. Simulation outputs well cover field collected data that are presented as a region. Thus, it is concluded that the use of the enhanced procedure (i.e., multiple measures) was not necessary. The reader is encouraged to refer to the handbook (Park and Won, 2006) for details on the procedure using a single performance measure. Summary of Case Study Results
Out of four cases (i.e., two sites with two simulation programs), only the Charlottesville
network with the VISSIM simulation program required the use of multiple performance measures. All other cases worked very well with the single performance measure-based procedure.

21
Handbook Revision The handbook developed from Task 1 was updated after piloting of the hands-on short course, conducting new case studies, and enhancing the calibration and validation procedure. The following revisions were made to the handbook (Park and Won, 2006) as a result of these activities.
• a methodology that allowed users to calibrate and validate microscopic simulation
models using multiple performance measures • data collection and reduction efforts of two additional case studies that were
conducted after the short course
• case studies of applying calibration and validation procedure for two new sites with both VISSIM and CORSIM in which help users to better understand the procedure and easy to follow
• other minor changes to provide better understanding of the calibration and validation
procedure.
FINDINGS AND CONCLUSIONS • Case studies conducted for two additional sites (i.e., one urban arterial network and the other
freeway merging section) with VISSIM and CORSIM simulation programs proved that the previously developed microscopic simulation model calibration and validation procedure is adequate.
• The results of four case studies (i.e., two sites with two simulation programs) with multiple
performance measures supported that the multiple performance measure-based procedure is not always required: it was required for only one out of four cases. The results of the Charlottesville case study with VISSIM simulation program indicated that the enhanced procedure was effective.
• The case study results supported that two proposed methods (i.e., log transform method and
constraint method) for considering multiple performance measures were equally effective in microscopic simulation model calibration and validation.
• The hands-on short course, conducted in June 26, 2006, provided practical application
guidelines and case studies and proved that the handbook as well as the prototype program developed in this study was useful in training.
22
RECOMMENDATIONS 1. VDOT traffic engineers should calibrate and validate microscopic simulation models by
using the enhanced procedure developed in this study (i.e., the multiple performance measures–based procedure) before using them for any engineering applications to ensure that reliable results are provided for better decision-making.
2. When VDOT traffic engineers conduct microscopic simulation model calibration and
validation, multiple performance measures collected for multiple days should be used to obtain more reliable results.
3. Additional hands-on short courses should be offered to expose the procedure to more VDOT
traffic engineers and possibly others, including consultants who would work for VDOT in the future. Virginia’s Local Technical Assistance Program (LTAP) at the University of Virginia’s Center for Transportation Studies is a possible avenue to offer such short courses.
4. VDOT traffic engineers who currently use or plan to use microscopic simulation models for
engineering applications should consult the handbook developed in this study. The handbook is available at http:/www.virginiadot.org/vtrc/main/online_reports/pdf/07-cr5.pdf.
In addition, the prototype program and hands-on short course material developed in this study are available at http://faculty.virginia.edu/brianpark/SimCalVal/.
COSTS AND BENEFITS ASSESSMENT
Costs Assuming that short courses will be given by the Local Technical Assistance Program (LTAP), the costs involved in offering short courses would be minimal. In addition, to implement the recommended microscopic simulation model calibration and validation procedure, VDOT traffic engineers need to spend more time and effort in data collection; additional computation time would also be required.
Benefits The expected benefits of conducting short courses and implementing the proposed calibration and validation procedure are as follows:
• By taking the proposed short course, VDOT traffic engineers can understand the issues related to the use of microscopic simulation models and can better deal with consultants who would work for VDOT on simulation modeling related projects.

23
• By implementing the proposed calibration and validation procedure, VDOT engineers can obtain more reliable microscopic simulation outputs and become more confident in making recommendations to decision makers. This would improve chances of making optimal decisions on alternatives evaluations and would allow better resource allocations for VDOT.
REFERENCES Park, B. Microscopic Simulation Model Calibration and Validation Short Course Material with
Prototype Program, 2006. http://faculty.virginia.edu/brianpark/SimCalVal/. Accessed October 12, 2006.
Park, B., and Qi, H. Development and Evaluation of a Calibration and Validation Procedure for
Microscopic Simulation Models. VTRC 05-CR1. Virginia Transportation Research Council, Charlottesville, 2004.
Park, B., and Won, J. Microscopic Simulation Model Calibration and Validation Handbook.
VTRC 07-CR6. Virginia Transportation Research Council, Charlottesville, 2006.