roshydromet calibration/validation system for satellite ... · pdf fileroshydromet...
TRANSCRIPT

1
ROSHYDROMET ROSHYDROMET CALIBRATION/VALIDATION SYSTEM FOR CALIBRATION/VALIDATION SYSTEM FOR SATELLITE DATA AND PRODUCTSSATELLITE DATA AND PRODUCTS
GSICS Executive Panel 15 Guangzhou, 16 May 2014
State Research Center State Research Center ““ PLANETAPLANETA ””

2
((Launched Launched 1717.09..09.2009)2009)
((LaunchedLaunched 2020.0.011..2011)2011)
RUSSIAN EARTH OBSERVATION SATELLITE SYSTEMRUSSIAN EARTH OBSERVATION SATELLITE SYSTEM
((Launched Launched 22.07.2012 )22.07.2012 )
((Launched Launched 2525.0.066..2013)2013)

3
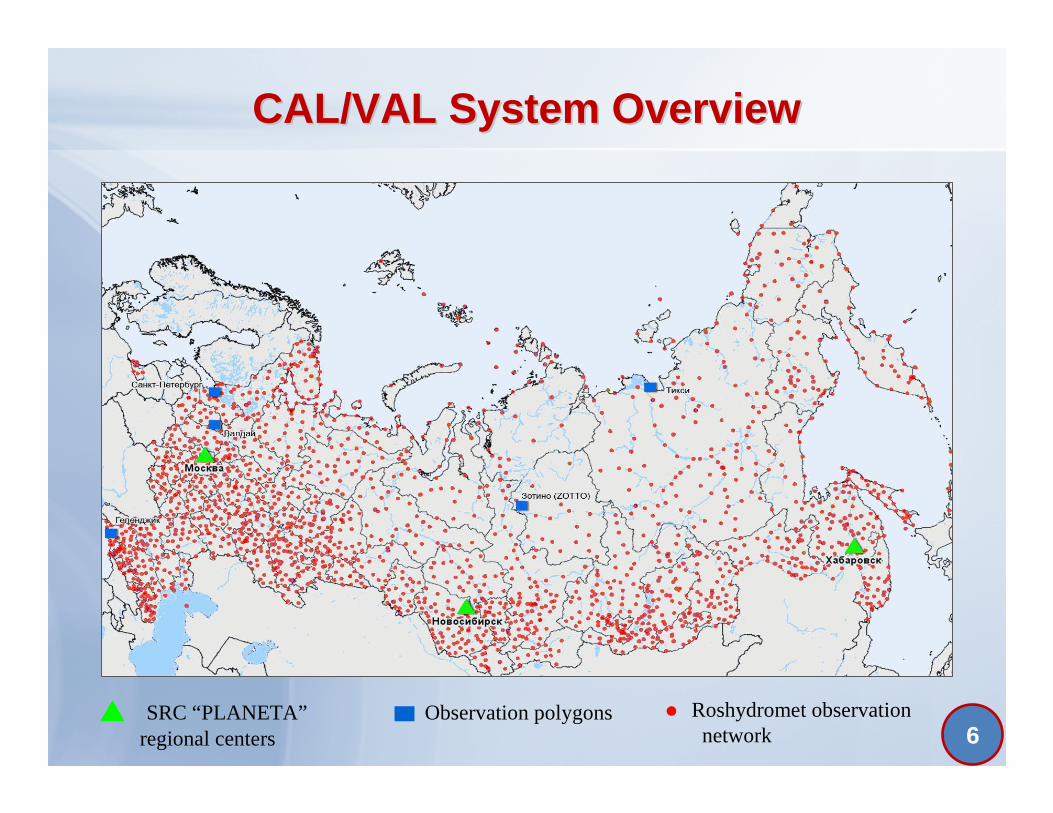
Roshydromet is continuing the deployment of ground-based calibration/validation system for satellite data and products. The system includes several CAL/VAL facilities based on Roshydromet observation network as well as on the measurement sites of other institutions, such as Russian Academy of Sciences (RAS), Saint Petersburg State University etc. An aircraft owned by Roshydromet is planned to be utilized in the future.
OverviewOverview

4
Main objectives Main objectives of Roshydromet CAL/VAL systemof Roshydromet CAL/VAL system
– Validation of L2 products - the assessment of L2 products accuracy
and reliability based on comparison with reference data (with known
accuracy). It is performed to ensure user confidence in satellite-based
products.
– Vicarious calibration - Post-launch calibration and characterization
of in-orbit calibration performance for current and future Russian
LEO, GEO, and HEO meteorological satellite instruments.
– Tests to confirm the predefined performance characteristics of the
instruments.
– Preparing corrective coefficients for instrument calibration and
tuning of data processing algorithms.

5
Functional block diagram Functional block diagram of Roshydromet Cal/Val systemof Roshydromet Cal/Val system
Site 1Petergof-Voeikovo
Site 2Valdai
Site 3ZOTTO
Site 4Gelendzhik
Module -1Validation of L2-
products
Atmospheric vertical profiles
Surface parameters
Cloudiness, aerosol and precipitation
parameters
Wind speed vertical profiles
Module -4Archiving and remote
access to ground truth observation
data
Roshydromet observation network and NWP data
Global ground-based network data
Roshydromet Cal/Val system
Module -3Archiving of
satellite data & products
METEOR-M and ELECTRO-L data
and products
Foreign satellite data and products
Module -2Calibration of
METEOR-M & ELECTRO-L instruments
Simulated data
OBSERVATION POLYGONS
MSU-MRMSU-GS
IKFS-2
MTVZA
BRLK «Severjanin»
6
CAL/VAL System Overview CAL/VAL System Overview
Observation polygonsSRC “PLANETA”regional centers
Roshydromet observationnetwork

7
Site 1. Peterhof Site 1. Peterhof ––Voeikovo Voeikovo
Fourier Transform Spectrometer Bruker IFS 120/125HR (SaintFourier Transform Spectrometer Bruker IFS 120/125HR (Saint-- Petersburg State University)Petersburg State University)
Registers of solar radiance spectra with high spectral resolution (up to 0.002 cm-1).
Provides:�Total water vapour content with accuracy of ~4%
�CH4 total column with accuracy of ~1.5%
�Ozone total column and vertical profile with accuracy of ~4%
Atmospheric vertical profiles
Cloudiness, aerosol and precipitation parameters
Wind speed vertical profiles
Instrumental facility

8
Microwave radiometer HATPRO
All-weather measurements in troposphere with high
temporal resolution:
� Temperature profile
� Humidity profile
� Total water vapour content
� Cloud liquid water.
Features:
� 14 spectral channels (7 in oxygen absorption band 0.5 cm and 7 in water vapour absorption band 1.35 cm);
� 24-hours automatic mode
Instrumental facility (continuation)
Site 1. Peterhof Site 1. Peterhof ––Voeikovo Voeikovo

9
Site 2. ValdaiSite 2. Valdai
� Standard meteorological and actinometrical observations.
� Weather radar data for area of 150-200 radius (MRL-5 and new Doppler radar)
� Water balance observations at Valdai lake area and small rivers in the vicinity.
� Precipitation measurements. This site is being used as a reference for intercomparison with different precipitation measurement techniques.
� Data archive on water balance observations.
Precipitation parameters Surface parameters
Measurements set of Russian State Hydrological Ins titute

10
Site 2. ValdaiSite 2. Valdai
Observations of daily precipitation
Total precipitation estimates (SEVIRI)
Участок с кустарниковойплощадкой (зимние осадки)
Участок с лесной площадкой
Участок с кустарниковойплощадкой
Участки для измерения
осадков
Ground-basedDoppler weather radar

11
ZOTTOZOTTO••••
CO2 and CH4 measurements at 301, 227, 158, 92, 52, and 4 m height
Aerosol measurements at 301, and 52 m height
CO measurements at 301, and 52 m height
Ozone, and NOx measurements at 30 m height
Meteorological measurements at 301, 227, 158, 92, 52, and 4 m height, and on the ground (Temperature, Wind, Humidity)
Biweekly flask sampling at 301 m height
Various irregular ecosystem measurements
O3 & CO total column measurements
Regular radiosonde measurements (about 80 km from ZOTTO)
Site 3. ZOTTOSite 3. ZOTTOAtmospheric vertical profiles
Surface parameters Wind speed vertical profiles
Measurements set of V.Sukachev Institute of Forest

12
Ground-based instruments for trace gases measurements including green-house gases.Measurements of CO2 concentration with the accuracy of 0.25 ppm, (~0.06% of regular concentration) and CH4 with accuracy of 3.2 ppmb(0.16 % of regular concentration)
Site 3. ZOTTOSite 3. ZOTTOInstrumental facility in the tower and ground-based

13
Diffraction monochromator at a measuring site
IR spectrometer for CO and CH4
total column measurementsSpectrometer is based on a diffraction monochromator of high spectral resolution (up to 0,2 cm-1 at 2÷3 µm band). Measurements are being made with direct solar irradiance.
Instrumental facility of A.M.ObukhovInstitute of Atmospheric Physics
Site 3. ZOTTOSite 3. ZOTTO

14
� Shore measurements
�Buoy measurements
�Boat-based measurements
Provides:
Site 4. Site 4. GelendzhikGelendzhik
Instrumental facility of P.Shirshov Institute of Oceanology (Black Sea)
Sea surface parameters Sea level winds

15
� GEO-to-LEO (GEO-monitored instrument, LEO-reference instrument)
� LEO-to-LEO (LEO-monitored instrument, LEO-reference instrument)
� GEO-to-GEO (GEO-monitored instrument, GEO-reference instrument)
� LEO-to-GEO-to-LEO or Double Difference Method (LEO-monitored
instrument, GEO-reference instrument, LEO-reference instrument)
GSICS intercalibration schemesGSICS intercalibration schemes

16
ELECTROELECTRO--L General DesignL General Design
• Three-axis high-precision stabilization
• In-orbit mass - 1500 kg
• Payload mass - 370 kg• Lifetime - 10 years• Longitude - 76E• Data dissemination format - HRIT/LRIT• Image repeat cycle – 30/15 min
Mission objectives
• Operational observation of theatmosphere and the Earth surface(MSU-GS)
• Heliogeophysical measurements
• Maintaining Data Collection Systemand COSPAS/SARSAT Service

17
MSUMSU--GS BGS Basicasic PPerformanceerformance CCharacteristicsharacteristicsNumber of channels• VIS
• IR
1037
Spectral range at half maximum of spectral response function (µm)
0.5-0.65; 0.65-0.80;0.8-0.9; 3.5-4.0;5.7-7.0; 7.5-8.5;8.2-9.2; 9.2-10.2;
10.2-11.2; 11.2-12.5
Image frame (deg x deg) 20 ± 0.5 x 20 ± 0.5
HRIT ground resolution in subsatellite point (km) 1.0 (VIS); 4.0 (IR)
S/N ratio for VIS channels ≥ 200
NE∆T at 300K (K)• in the band 3.5-4.0 µm• in the band 5.7-7.0 µm• in the band 7.5-12.5 µm
0.80.4
0.1-0.2
Power (W) ≤ 150
Weight (kg) ≤ 88
Lifetime of basic and reserve units (years) 10

18
Generation of syntheticGeneration of syntheticMSUMSU--GS measurements from AIRS/Aqua dataGS measurements from AIRS/Aqua data
(GEO (GEO –– to to –– LEO intercalibration)LEO intercalibration)
),d)(RN1
,(FTb eff λλλλλλλλϕϕϕϕ⋅⋅⋅⋅λλλλ==== ∫∫∫∫λλλλ∆∆∆∆
λλλλ
,d)(where eff λλλλλλλλϕϕϕϕ⋅⋅⋅⋅λλλλ====λλλλ ∫∫∫∫λλλλ∆∆∆∆
λλλλλλλλϕϕϕϕ==== ∫∫∫∫λλλλ∆∆∆∆
d)(N

19
Region of Interest for Region of Interest for
GEOGEO--toto --LEO intercalibrationLEO intercalibration

20
CHANNEL 7CHANNEL 7
CHANNEL 8CHANNEL 8
Original MSU-GS data Synthetic MSU-GS data (AIRS based)
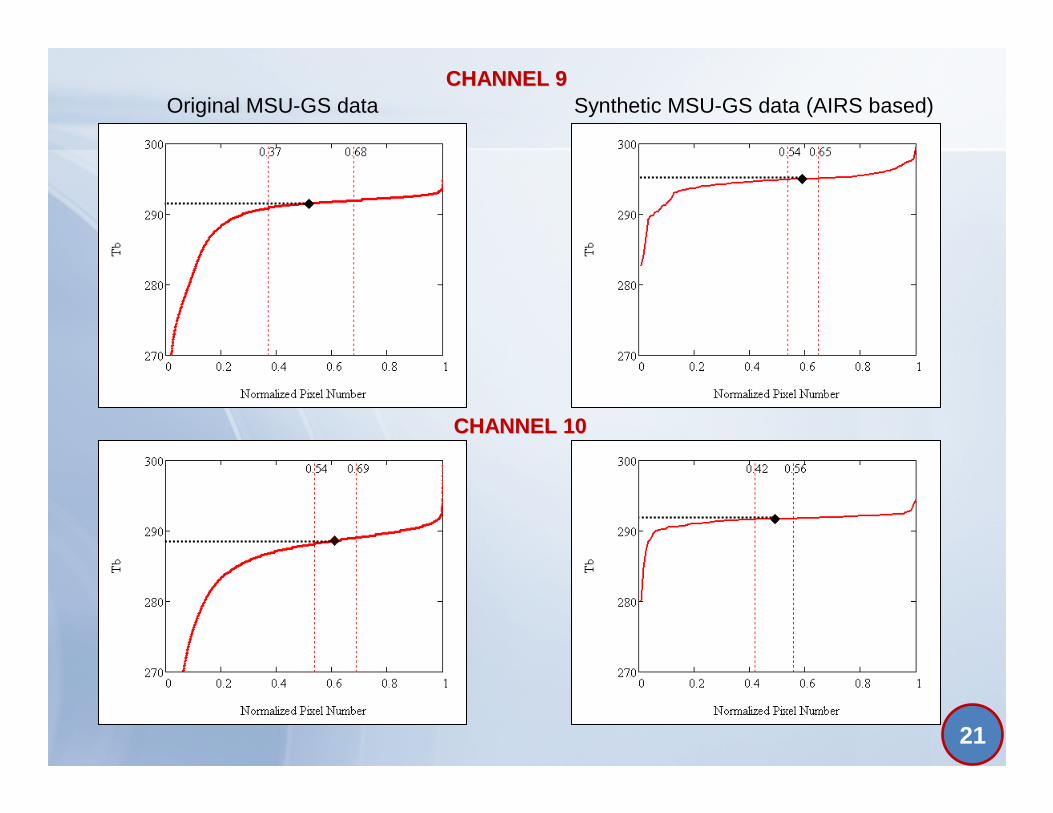
Methodical approach for comparison of brightness te mperatures TbMethodical approach for comparison of brightness te mperatures Tb
21
CHANNEL 9CHANNEL 9
CHANNEL 10CHANNEL 10
Original MSU-GS data Synthetic MSU-GS data (AIRS based)
22
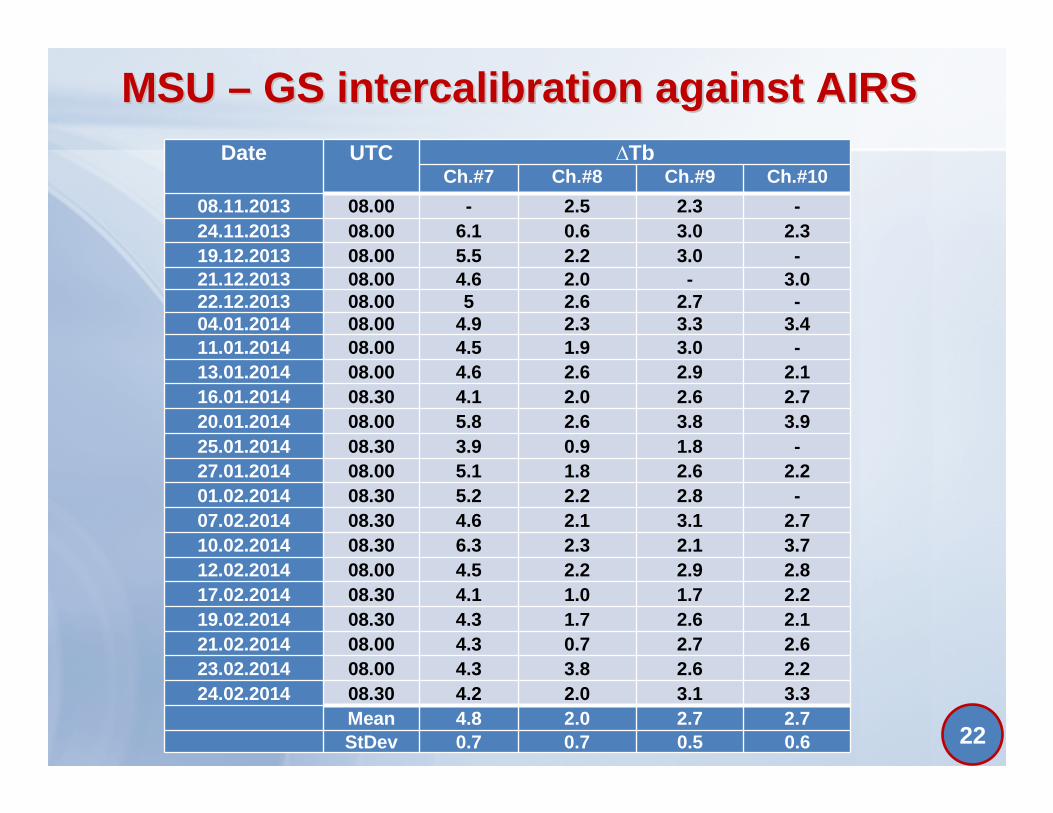
MSU MSU –– GS intercalibration against AIRSGS intercalibration against AIRSDate UTC ∆Tb
Ch.#7 Ch.#8 Ch.#9 Ch.#10
08.11.2013 08.00 - 2.5 2.3 -24.11.2013 08.00 6.1 0.6 3.0 2.319.12.2013 08.00 5.5 2.2 3.0 -21.12.2013 08.00 4.6 2.0 - 3.022.12.2013 08.00 5 2.6 2.7 -04.01.2014 08.00 4.9 2.3 3.3 3.411.01.2014 08.00 4.5 1.9 3.0 -13.01.2014 08.00 4.6 2.6 2.9 2.116.01.2014 08.30 4.1 2.0 2.6 2.720.01.2014 08.00 5.8 2.6 3.8 3.925.01.2014 08.30 3.9 0.9 1.8 -27.01.2014 08.00 5.1 1.8 2.6 2.201.02.2014 08.30 5.2 2.2 2.8 -07.02.2014 08.30 4.6 2.1 3.1 2.710.02.2014 08.30 6.3 2.3 2.1 3.712.02.2014 08.00 4.5 2.2 2.9 2.817.02.2014 08.30 4.1 1.0 1.7 2.219.02.2014 08.30 4.3 1.7 2.6 2.121.02.2014 08.00 4.3 0.7 2.7 2.623.02.2014 08.00 4.3 3.8 2.6 2.224.02.2014 08.30 4.2 2.0 3.1 3.3
Mean 4.8 2.0 2.7 2.7StDev 0.7 0.7 0.5 0.6

23
mean (∆Tb) = 4.8
stdev(∆Tb) = 0.6
Channel 7
Channel 8
Differences between synthetic and measured brightn ess Differences between synthetic and measured brightn ess temperatures temperatures
mean (∆Tb) = 2.0
stdev(∆Tb) = 0.7

24
Channel 9
Channel 10
Differences between synthetic and measured brightn ess Differences between synthetic and measured brightn ess temperatures (continuation)temperatures (continuation)
mean (∆Tb) = 2.7
stdev(∆Tb) = 0.5
mean (∆Tb) = 2.7
stdev(∆Tb) = 0.6

25
GEOGEO-- to to --GEO GEO IntercalibrationIntercalibration

26
MSUMSU--GS & SEVIRI Spectral Response Functions GS & SEVIRI Spectral Response Functions

27
SEVIRI & MSUSEVIRI & MSU--GS TGS TBB fieldsfields(with 0.5(with 0.5 °×°×°×°×°×°×°×°× 0.50.5°°°°°°°° averaging)averaging)
Comparison results:
Data,
2012
∆∆∆∆TSEV-MSU
,
K
StDev,
K
04.17 2.7 1.2
06.22 3.3 1.3
07.22 2.9 0.8
This can be explained by the different instruments calibration. A bias of 3.0K should be added to adjust MSU-GS data .

28
ConclusionConclusion
1. Roshydromet is now continuing deployment of the
CAL/VAL system for satellite data and products.
2. First experiments with intercalibration of MSU-GS
instrument IR channels (GEO-to-LEO and GEO-to-
GEO) have shown operability of the proposed
techniques.
3. Methods have been developed for instruments’
intercalibration of the forthcoming Meteor-M N2
satellite.