simulated effects of a seasonal precipitation change on the
TRANSCRIPT
Clim. Past, 6, 169–178, 2010www.clim-past.net/6/169/2010/© Author(s) 2010. This work is distributed underthe Creative Commons Attribution 3.0 License.
Climateof the Past
Simulated effects of a seasonal precipitation change on thevegetation in tropical Africa
E. S. Gritti 1,2,3,*, C. Cassignat2,*, O. Flores1, R. Bonnefille2, F. Chalie2, J. Guiot2, and D. Jolly3
1CEFE, UMR 5175 CNRS/Universite Montpellier II, 1919, route de Mende, 34293, Montpellier cedex 5, France2CEREGE, UMR 6635 CNRS/Aix-Marseille Universite, Europole Mediterraneen de l’Arbois BP80, 13545 Aix enProvence cedex 4, France3ISEM, UMR 5554 CNRS/Universite Montpellier II, Case 61, 34095 Montpellier cedex 5, France* These authors contributed equally to the work
Received: 27 January 2009 – Published in Clim. Past Discuss.: 10 March 2009Revised: 17 March 2010 – Accepted: 18 March 2010 – Published: 30 March 2010
Abstract. Pollen data collected in Africa at high (Ku-ruyange, valley swamp, Burundi) and low altitude (Victoria,lake, Uganda; Ngamakala, pond, Congo) showed that after6 ky before present (BP), pollen of deciduous trees increasetheir relative percentage, suggesting thus the reduction of theannual amount of precipitation and/or an increase of in thelength of the dry season. Until now, pollen-climate trans-fer functions only investigated mean annual precipitation,due to the absence of modern pollen-assemblage analogs un-der diversified precipitation regimes. Hence these functionsomit the potential effect of a change in precipitation season-ality modifying thus the length of the dry season. In thepresent study, we use an equilibrium biosphere model (i.e.BIOME3.5) to estimate the sensitivity of equatorial Africanvegetation, at specific sites, to such changes. Climatic sce-narios, differing only in the monthly distribution of the cur-rent annual amount of precipitation, are examined at theabove three locations in equatorial Africa. Soil characteris-tics, monthly temperatures and cloudiness are kept constantat their present-day values. Good agreement is shown be-tween model simulations and current biomes assemblages,as inferred from pollen data. To date, the increase of the de-ciduous forest component in the palaeodata around 6 ky BPhas been interpreted as the beginning of a drier climate pe-riod. However, our results demonstrate that a change in theseasonal distribution of precipitation could also induce theobserved changes in vegetation types. This study confirmsthe importance of taking into account seasonal changes inthe hydrological balance. Palaeoecologists can greatly ben-efit from the use of dynamic process based vegetation mod-
Correspondence to:E. S. Gritti([email protected])
els to acccount for modification of the length of the dry sea-son when they wish to reconstruct vegetation composition orto infer quantitative climate parameters, such as temperatureand precipitation, from pollen or vegetation proxy.
1 Introduction
One of the fundamental assumptions in plant ecology is that,on continental or global scales, the distribution and compo-sition of vegetation is strongly controlled by climatic condi-tions (Woodward, 1987; Stephenson, 1990) through the keyprocesses of photosynthesis, respiration and transpiration.The length of the dry season has often been emphasized as amajor control of vegetation structure and patterns in the trop-ics (Thomas, 1973; Box and Fujiwara, 2005; Vincens et al.,2007; Ngomanda et al., 2009). However, the relation be-tween vegetation composition and climate is often describedin a simple way using annual descriptors such as tempera-ture and precipitation (Bonnefille et al., 1990). Yet, precip-itation regimes are characterised by two main aspects (i.e.annual mean and month to month variability) modifying theduration and the intensity of the dry season(s) which have tobe considered in defining the suitable bioclimatic limits of avegetation type (Street-Perrott and Perrott, 1993). The mod-ern mega-climate of Africa is quite simple due to the simpletopography of the continent. Climatic zones related to theupper-level circulation tend to occur as symmetrical belts oneither side of the equator (Thompson, 1965). Consequentlytwo symmetric gradients of temperature and humidity spreadfrom the equator. The tropical climate is governed by theseasonal movement of the meteorological equator (i.e. inter-tropical convergence zone, ITCZ) in response to changes in
Published by Copernicus Publications on behalf of the European Geosciences Union.

170 E. S. Gritti et al.: Seasonal precipitation change and vegetation in tropical Africa
the location of maximum solar heating. The ITCZ migratesnorthward to ca. 15–24◦ N in June to August, and southwardto ca. 8◦ N in West Africa and to ca. 16◦ S in East Africain December and February, respectively (Hastenrath, 1988).The equatorial zone is therefore characterized by a doublerainfall maximum. In East Africa, the altitudinal effect onclimate associated with the local topography (Mt Kenya,5197 m; Mt Ruwenzori, 5120 m; Kilimandjaro, 5899 m; MtRungwe, 3176 m) is superimposed to this simple pattern andresults in a decrease of the temperature with altitude as-sociated with a complex distribution of rainfall (Osmaston,1989). During the period between 12 ky BP and 6 ky BP, theinsolation had a higher seasonal contrast compared to presentday values due to solar radiation changes associated with or-bital parameter development (Kutzbach and Street-Perrott,1985) thus inducing some changes in the seasonal pattern ofthe precipitation at regional scale. The COHMAP modellingproject (Kutzbach et al., 1993) simulated higher July precip-itation across a part of Africa due to the intensification ofthe summer monsoon. For instance, within the intertropicalbelt in Africa at 12 ky BP (respectively 6 ky BP), simulationsshow an increase of the July precipitation of ca. 4 mm day−1
(respectively ca. 2 mm day−1). However, in the equatorialhighlands of central East Africa during the early Holocene(10–7 ky BP), the reconstructed mean annual precipitationis 30 mm yr−1 (−2%) below present-day value with sev-eral positive shifts (Bonnefille and Chalie, 2000). Moreover,pollen records show large variations of vegetation during theHolocene as a consequence of precipitation changes (Bon-nefille et al., 1990; Vincens et al., 1993). Until recently, moststudies estimated the annual precipitation from palaeodata(Bonnefille et al., 1990; Vincens et al., 1993; Peyron et al.,2000). It has been shown (Barboni et al., 2003) that the sea-sonality of the precipitation (as represented by the durationof the dry season) in the tropical region of South West In-dia has a strong impact on the modern pollen taxa distribu-tion. The first attempts to estimate the total duration of therainy season(s) by transfer functions (Chalie, 1992) need tobe improved. Indeed, using pollen data does not allow us tounambiguously reconstruct environmental conditions muchdifferent from the modern ones, particularly when low atmo-spheric CO2 concentration prevail, because the reconstruc-tions are ultimately based on the best analogues availablewithin modern data (Guiot, 1990). One way to slacken thisconstraint is to use mechanistic models to simulate presentand past vegetation distributions. This type of models de-scribes explicitly photosynthetic processes and hydrologicalcycles according to empirical laws and experimental mea-surements. In this paper, we focus on the mean monthly pre-cipitation using different scenario for this parameter to testits impacts on equatorial African ecosystems at the centurytime scale. For such time scales, vegetation and climate canbe considered as being in steady state equilibrium (Webb,1986). Therefore, changes in vegetation composition, in re-sponse to a modification of the precipitation regime (through
the modification of the length of the dry season holding tem-peratures and CO2 level constant), may be evaluated withthe equilibrium biosphere model BIOME3.5 (Haxeltine andPrentice, 1996). This model is applied at three sites along anequatorial transect, in different botanical contexts in order tosimulate a set of diversified ecosystem responses. The threeselected sites show consistent pollen records of past vegeta-tion. They all show a tropical forest established at the be-ginning of the Holocene, and taxonomic changes during themid-Holocene that have been interpreted as a consequence ofhydrologic changes (annual rainfall amount and/or seasonalprecipitation change) (Kendall, 1969; Elenga et al., 1994;Jolly et al., 1994).
2 Methods
2.1 BIOME3.5
BIOME3.5 is a modified version of the BIOME3 terrestrialbiosphere model (Haxeltine and Prentice, 1996) includingimproved descriptions of competition, phenology, photosyn-thesis and respiration (Kaplan et al., 2002). This model de-scribes the potential vegetation present at a site following anessential logic. First, the model selects the plant functionaltypes (PFTs, assemblage of species which have the same re-sponse to environmental factors) likely to be present on thesite according to their physiological, phenological and bio-climatic characteristics and the site specific climatic condi-tions. For each of the selected PFTs, maximum sustainableleaf area index (LAI) and net primary production (NPP), arecalculated using a coupled carbon and water flux model. NPPvalues are then compared independently for trees and grassesto select the dominant PFT. Simulation of competition be-tween trees and grass is based on NPP and LAI values. Vege-tation is described as monthly/annual values of LAI and NPPfor the dominant PFT and secondary PFTs. These outputscan be classified into biome types according to the domi-nance and assemblages of PFTs and a classification scheme(Haxeltine and Prentice, 1996). Model inputs are expressedas latitude, atmospheric CO2 content, soil texture (Zobler andfor Space Studies(1986); map of soil from theFAO-Unesco,1974) and monthly mean values of temperature, precipitationand cloudiness. BIOME3.5 is similar to the latest versionBIOME4 (Kaplan et al., 2002) in its representation of trop-ical vegetation. We used BIOME3.5 for comparison withGuiot et al.(2000).
2.2 Validation of BIOME3.5
A qualitative and quantitative comparison at global scale ofthe BIOME3 simulations of the present-day vegetation witha digitised global map of potential natural vegetation showedthat the model successfully reproduces the broad scale pat-tern (Haxeltine and Prentice, 1996). Another comparison
Clim. Past, 6, 169–178, 2010 www.clim-past.net/6/169/2010/
E. S. Gritti et al.: Seasonal precipitation change and vegetation in tropical Africa 171
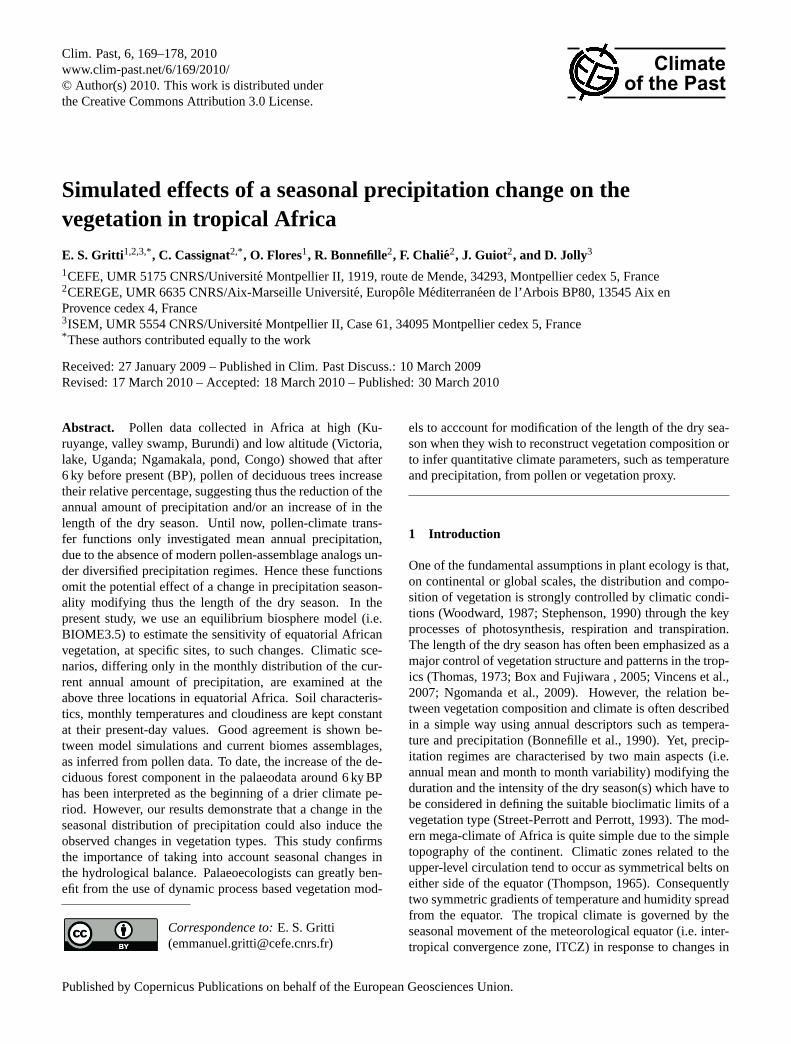
Fig. 1. Sites location and current observed vegetation formations.
made between predicted NPP and a set of NPP data mea-sured byLeith (1975) showed a fair agreement between thepredicted NPP and measured NPP, yielding a correlation co-efficient of 0.74 (Haxeltine and Prentice, 1996). However,even if BIOME3 can be considered robust in the intertropi-cal area (Jolly and Haxeltine, 1997), it tends to underestimatethe absolute NPP values above 1100 gC m−2 yr−1 The samebias has been observed for a large number of other globalNPP models (Moore III et al., 1995). BIOME3.5 was notchanged for the intertropical biomes.
2.3 Sites description
The selected sites are located on an African equatorial tran-sect (Fig.1) characterised by constant temperatures duringthe year (Fig.2). We chose Ngamakala (Congo, 4◦ 4′ S,15◦ 23′ E, 400 m; Elenga et al., 1994), Victoria (Pilkintonbay, Uganda, 0◦ 19′ N, 33◦ 20′ E, 1134 m; Kendall, 1969)and Kuruyange (Burundi, 3◦ 35′ S, 29◦ 41′ E 2000 m;Bon-nefille et al., 1991; Jolly and Bonnefille, 1991; Jolly et al.,1994). The three sites present high values of annual
www.clim-past.net/6/169/2010/ Clim. Past, 6, 169–178, 2010

172 E. S. Gritti et al.: Seasonal precipitation change and vegetation in tropical Africa
Fig. 2. Current mean monthly temperatures (lines) and precipitation (bars) distribution for the three studied sites (Leemans and Cramer,1991).
precipitation and annual mean temperature (Ngamakala:1620 mm, 24.1◦C; Victoria: 1175 mm, 22.3◦C; Kuruyange:1470 mm, 17.4◦C) which are considered as non limiting con-ditions for the current vegetation composition. These sitespresents, respectively mean dry-seasons of 84, 3 and 96 con-secutives dry days according to the climatic database (Lee-mans and Cramer, 1991).
According to White (1983), Ngamakala present-day vege-tation belongs to the Guineo-Congolian domain. Kuruyange,a swamp today anthropised, is located in the afromontane do-main with a mosaic of East African evergreen bushland andsecondary Acacia wooded grassland near the transitional rainforest (White, 1983). The surrounding vegetation of Pilking-ton Bay is a mixed mosaic of semi-deciduous or deciduousforest and savanna.
2.4 Climate data
At each site, relevant climatic data are obtained by interpo-lation from a database of global climatic variables (Leemansand Cramer, 1991) using an artificial neural network (ANN),as performed in Africa by (Peyron et al., 2000).
Temperature, cloudiness and soil texture are maintainedconstant at their current site values in the simulations. Itmay appear unrealistic to change the precipitation distribu-tion when keeping cloudiness constant. However, changes incloudiness are difficult to estimate because co-variations be-tween precipitation and cloudiness are poorly understood inthis context (Gregory and Morris, 1996). Moreover, we aimat deciphering the ecosystem response to one specific param-eter under investigation (rainfall seasonality), hence primar-ily producing sensitivity experiments rather than fully realis-tic experiments. Only the distribution and the magnitude ofthe monthly precipitation during the year are modified, keep-ing constant the annual amount of precipitation.
The construction of the precipitation scenarios can be de-scribed in three steps:
1. Automatic identification of the months with extremeprecipitation (minimum or maximum) is done on themodern mean monthly precipitation distribution curvefor each studied site.
2. The amount of precipitation for one of the extremes isset by increments of 20 mm from−120 mm to 120 mm.This step is a compromise between the number of sce-narios and the calculation time. As the intertropical re-gion is characterised by two wet seasons, the amount ofprecipitation is modified for the four extreme months.
3. The monthly amounts of precipitation for the monthslocated between two extreme months are linearly inter-polated as following:
1P(j) =1Pex(2)−1Pex(1)
mex(2)−mex(1)× [m(j)−mex(1)] +1Pex (1)
where the extreme months encompassing monthm(j) arenotedmex(1) and mex(2), their increments being1Pex(1)
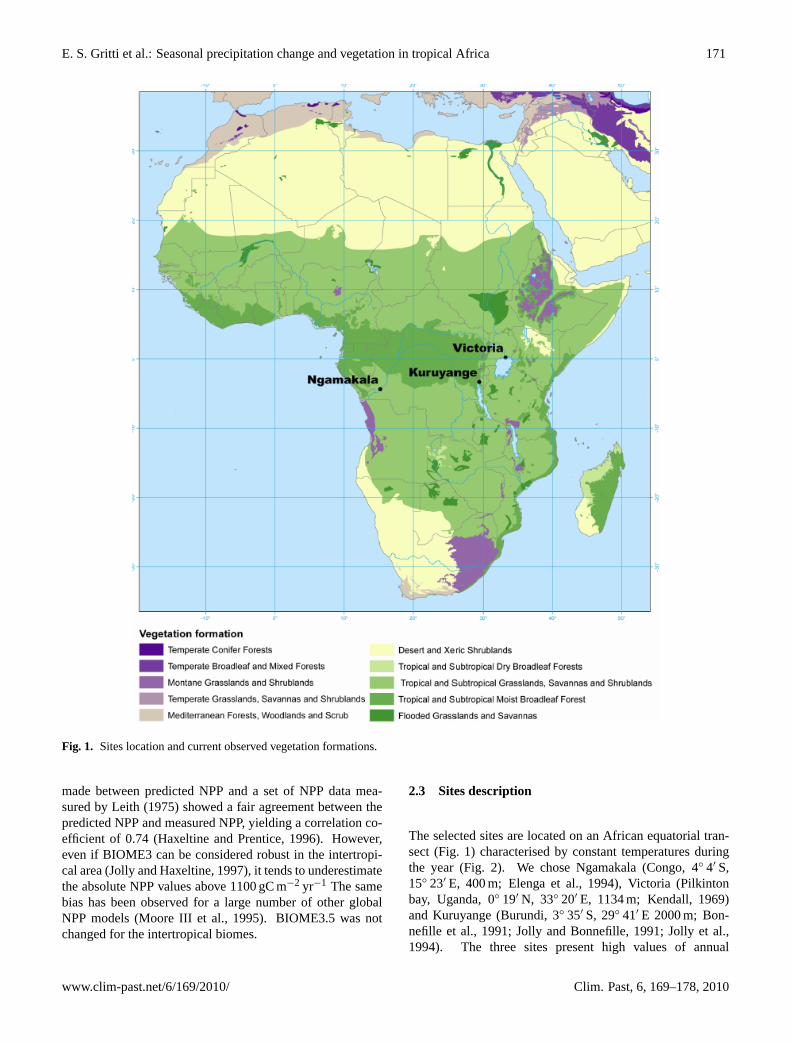
and 1Pex(2). P(j) is the modern precipitation of monthj and1P(j) is its increment. For each of the 4 modifiedmonths, there are 12 possibilities to obtain a new distributionof precipitation. The new distribution must have an annualamount of precipitation more or less equal to those of theactual precipitation Pan on the site. Strictly, the new dis-tribution P ′an is such that|P ′an−Pan| < 100 mm (Fig.3).This strong constraint highly reduces the number of testeddistributions: for example, when it is applied on the Nga-makala site, the number of simulated distributions is 5410.Simulation of the vegetation is performed in each of the newprecipitation scenario, using BIOME3.5.
2.5 Variables selected to describe the vegetation change
The NPP value of each PFT present in the grid cell is used todescribe the vegetation. We express the seasonal precipita-tion signal with simple parameters (number of consecutivesdry days, sum of the daily amount of precipitation). We use
Clim. Past, 6, 169–178, 2010 www.clim-past.net/6/169/2010/
E. S. Gritti et al.: Seasonal precipitation change and vegetation in tropical Africa 173
Fig. 3. Simulated distributions of precipitation at Ngamakala. Solidcircle, current precipitation distribution according to the climaticdatabase (Leemans and Cramer, 1991); Blue line, mean simulateddistribution. Red lines, mean simulated distribution± SD.
the “highest number of consecutive dry days” as a discrimi-nant variable. A month is defined as “dry” when the monthlyamount of precipitation is lower than 30 mm (Koppen, 1884).This variable requires a daily time-step and is calculated bya linear interpolation:
– For a monthi, the amount of precipitationP(mi) is at-tributed to the julian day representing the middle of themonth (mdi) considered (Haxeltine and Prentice, 1996).
– For days between two consecutive mid-month days,precipitation at dayj +1 is obtained from precipitationat dayj as follows:
Pj+1 = Pj +P(mi+1)−P(mi)
(mdi+1−mdi)2(2)
2.6 Relationship between seasonality and biome
The biome types at each of the three sites are simulatedfor each of the precipitation scenarios defined as explainedabove. The length of the dry season is given by the numberof consecutive dry days. We deduce, for each biome type, therange of dry season length and the percentage of appearanceof each biome type related to the total number of simula-tions for this range (frequency of occurence of the biome in%). Simulated biome type can be classified by increasing dryseason length (Fig.4) as follows:
– Tropical Evergreen Forest: TrEF
– Tropical Semi-Deciduous Forest: TrsDF
– Tropical Deciduous Forest/ Woodland: TrDF/W
– Tropical Savanna: TrSa
The biomes TrEF, TrsDF and TrDF/W are all dominated bythe “tropical raingreen trees” PFT. In this specific case, thebiome selection is made according to the number of “green-days”, i.e. the number of days when a foliage cover is presentas a function of the Leaf Area Index of the dominant PFT.
2.7 Altitudinal effect
In addition, we evaluate the impact of the atmospheric pres-sure decrease at higher altitude, on vegetation compositionsimulated by Biome3.5. With a decrease of the atmosphericpressure, CO2 and O2 partial pressure also decrease in pro-portion modifying thus the altitudinal photosynthetic rate.We aim at testing how this lower atmospheric pressure lead-ing in lower CO2 and O2 partitial pressure may change thevegetation response and sensitivity to a same seasonal varia-tion in the precipitation distribution. At Kuruyange (2000 m),in addition to seasonal changes in precipitation, we apply twodistinct atmospheric pressures in our simulations: (1) sea-level atmospheric pressure and (2) 2000 m atmospheric pres-sure. Estimates of the atmospheric pressure are calculatedaccording to an empirical relationship (Triplet and Roche,1977) as following:
P(z) = P(z0)−0.08z (3)
with P representing the atmospheric pressure (in hPa),z,the altitude (in m), andP(z0) ≈ 1000 hPa being the atmo-spheric pressure at the sea level.
3 Results
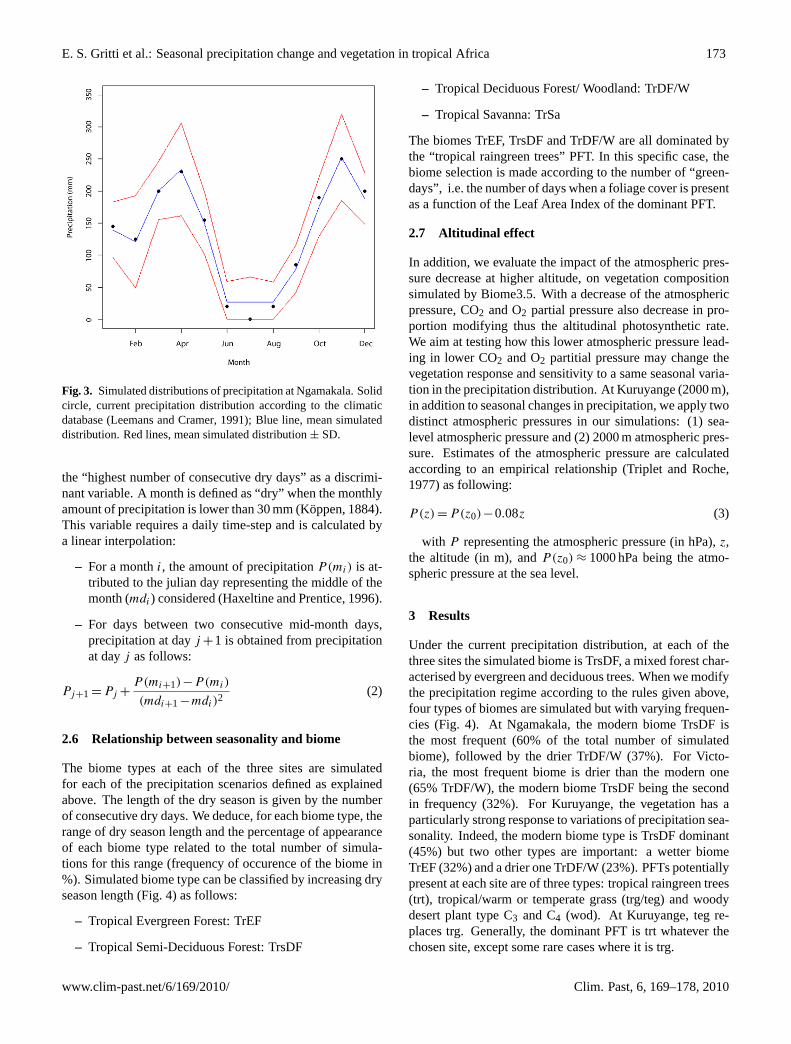
Under the current precipitation distribution, at each of thethree sites the simulated biome is TrsDF, a mixed forest char-acterised by evergreen and deciduous trees. When we modifythe precipitation regime according to the rules given above,four types of biomes are simulated but with varying frequen-cies (Fig.4). At Ngamakala, the modern biome TrsDF isthe most frequent (60% of the total number of simulatedbiome), followed by the drier TrDF/W (37%). For Victo-ria, the most frequent biome is drier than the modern one(65% TrDF/W), the modern biome TrsDF being the secondin frequency (32%). For Kuruyange, the vegetation has aparticularly strong response to variations of precipitation sea-sonality. Indeed, the modern biome type is TrsDF dominant(45%) but two other types are important: a wetter biomeTrEF (32%) and a drier one TrDF/W (23%). PFTs potentiallypresent at each site are of three types: tropical raingreen trees(trt), tropical/warm or temperate grass (trg/teg) and woodydesert plant type C3 and C4 (wod). At Kuruyange, teg re-places trg. Generally, the dominant PFT is trt whatever thechosen site, except some rare cases where it is trg.
www.clim-past.net/6/169/2010/ Clim. Past, 6, 169–178, 2010
174 E. S. Gritti et al.: Seasonal precipitation change and vegetation in tropical Africa
Fig. 4. Frequency of occurence within the total number of simulations of the biome types simulated for each site. In red, Tropical EvergreenForest biome; In dark green, Tropical Semi-Deciduous Forest biome; In light green, Tropical Deciduous Forest/Woodland biome; In yellow,Tropical Savanna.
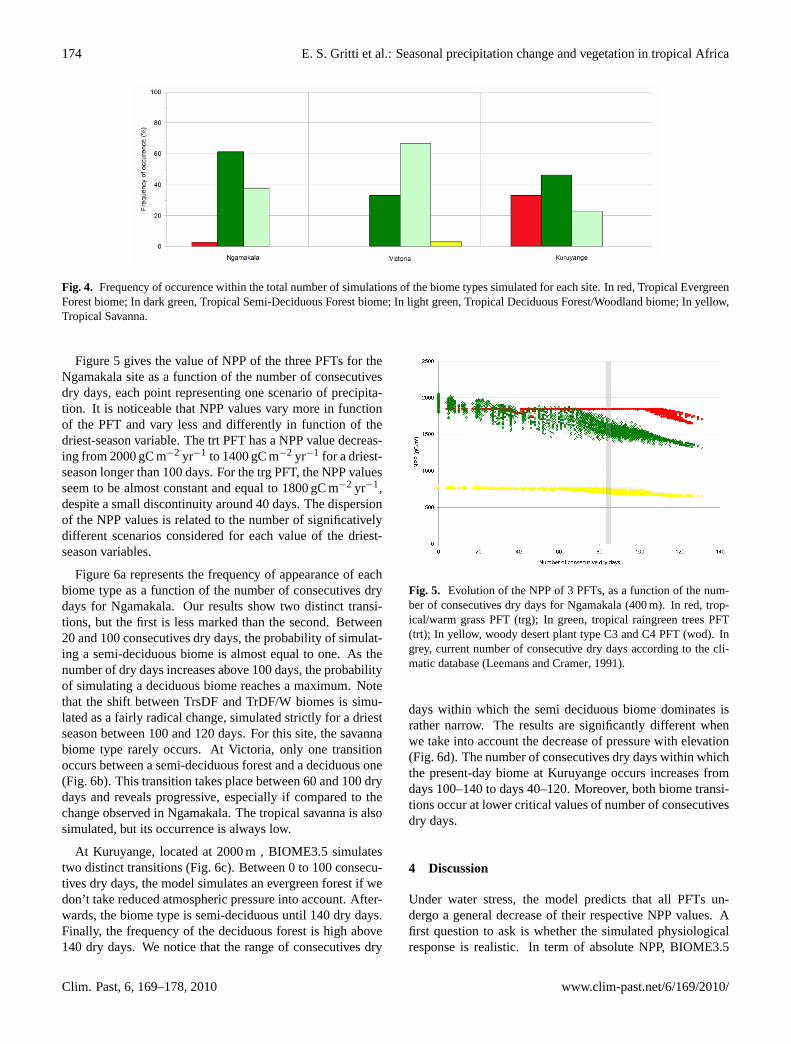
Figure5 gives the value of NPP of the three PFTs for theNgamakala site as a function of the number of consecutivesdry days, each point representing one scenario of precipita-tion. It is noticeable that NPP values vary more in functionof the PFT and vary less and differently in function of thedriest-season variable. The trt PFT has a NPP value decreas-ing from 2000 gC m−2 yr−1 to 1400 gC m−2 yr−1 for a driest-season longer than 100 days. For the trg PFT, the NPP valuesseem to be almost constant and equal to 1800 gC m−2 yr−1,despite a small discontinuity around 40 days. The dispersionof the NPP values is related to the number of significativelydifferent scenarios considered for each value of the driest-season variables.
Figure6a represents the frequency of appearance of eachbiome type as a function of the number of consecutives drydays for Ngamakala. Our results show two distinct transi-tions, but the first is less marked than the second. Between20 and 100 consecutives dry days, the probability of simulat-ing a semi-deciduous biome is almost equal to one. As thenumber of dry days increases above 100 days, the probabilityof simulating a deciduous biome reaches a maximum. Notethat the shift between TrsDF and TrDF/W biomes is simu-lated as a fairly radical change, simulated strictly for a driestseason between 100 and 120 days. For this site, the savannabiome type rarely occurs. At Victoria, only one transitionoccurs between a semi-deciduous forest and a deciduous one(Fig. 6b). This transition takes place between 60 and 100 drydays and reveals progressive, especially if compared to thechange observed in Ngamakala. The tropical savanna is alsosimulated, but its occurrence is always low.
At Kuruyange, located at 2000 m , BIOME3.5 simulatestwo distinct transitions (Fig.6c). Between 0 to 100 consecu-tives dry days, the model simulates an evergreen forest if wedon’t take reduced atmospheric pressure into account. After-wards, the biome type is semi-deciduous until 140 dry days.Finally, the frequency of the deciduous forest is high above140 dry days. We notice that the range of consecutives dry
Fig. 5. Evolution of the NPP of 3 PFTs, as a function of the num-ber of consecutives dry days for Ngamakala (400 m). In red, trop-ical/warm grass PFT (trg); In green, tropical raingreen trees PFT(trt); In yellow, woody desert plant type C3 and C4 PFT (wod). Ingrey, current number of consecutive dry days according to the cli-matic database (Leemans and Cramer, 1991).
days within which the semi deciduous biome dominates israther narrow. The results are significantly different whenwe take into account the decrease of pressure with elevation(Fig.6d). The number of consecutives dry days within whichthe present-day biome at Kuruyange occurs increases fromdays 100–140 to days 40–120. Moreover, both biome transi-tions occur at lower critical values of number of consecutivesdry days.
4 Discussion
Under water stress, the model predicts that all PFTs un-dergo a general decrease of their respective NPP values. Afirst question to ask is whether the simulated physiologicalresponse is realistic. In term of absolute NPP, BIOME3.5
Clim. Past, 6, 169–178, 2010 www.clim-past.net/6/169/2010/

E. S. Gritti et al.: Seasonal precipitation change and vegetation in tropical Africa 175
Fig. 6. Frequency of occurence by class of number of consecutives dry days of the Biome types simulated for each site. In red, TropicalEvergreen Forest biome; in dark green, Tropical Semi-Deciduous Forest biome; in light green, Tropical Deciduous Forest/Woodland biome;in yellow, Tropical Savanna for(A) Ngamakala (Congo),(B) Victoria (Uganda),(C) Kuruyange (Burundi) with atmospheric pressure mea-sured at the sea level and Kuruyange (Burundi),(D) with atmospheric pressure at 2000 m, calculated applying an empirical correction to takeinto account the altitudinal effect. In grey, current number of consecutive dry days according to the climatic database (Leemans and Cramer,1991).
underestimates systematically the ecosystem NPP above1000 gC m−2 yr−1 (Haxeltine and Prentice, 1996). However,due to the process-based characteristics of the model, we be-lieve that the simulated response in terms of trend is realistic.All the PFTs are stressed (marked by a general decrease ofthe mean NPP value above a PFT-specific threshold) by anincrease of the dry season length. The differential responseillustrates that grasses have a better adaptation capacity towater stress than woody plants. These differences could beinterpreted by a different growth scheme for plants corre-sponding to these two PFTs, with a ”short” longevity (i.e.,a better yield for a broad climatic spectrum) for grass type.
Studies on the effect of the atmospheric (CO2) show thatC3 natural and cultural plants decrease their photosyntheticrate when CO2 partial pressure is reduced (Bazzaz, 1990;Sage, 1995; Sage and Coleman, 2001), inducing a decreaseof NPP. When we run BIOME3.5 with decreasing CO2partial pressure (increasing altitude), we observe displace-ment of the transition between biomes mainly due to anoverall decrease in both NPP and Leaf Area Index values(i.e. foliage covers). This result is well in agreement withprevious studies (seeFriend and Woodward, 1990). How-ever, Biome3.5 lacks explicite description of the effect of thelowered partial pressure of O2 on photosynthesis through the
reduction in the rate of photorespiration (Woodward, 1986).Similarly,the modification with elevation of CO2 diffusioncoefficient (Terashima et al., 1995) as well as light inten-sity and greater evaporative demand (Smith and Geller, 1979)may counterbalance these results. In BIOME3.5, until now,the present PFTs are selected using climatic constraints with-out taking into account the altitudinal effect on CO2 par-tial pressure. Therefore, to improve vegetation simulation,it would be better to select potentially present PFT(s) afterNPP and LAI calculations which would take this effect intoaccount. At the biome level, ecosystem transitions are simu-lated as a function of the driest season length. These transi-tions are characterised by vegetation composition modifica-tion from a tropical semi-deciduous forest biome to a tropicaldeciduous forest biome. At present-day, BIOME3.5 simu-lates a semi-deciduous forest at the three studied sites with alength of the driest season of 3, 84 and 96 days at Victoria,Ngamakala and Kuruyange, respectively. This study showsthat even if we keep constant the total annual amount of pre-cipitation, a seasonal change is able to produce major biomechanges. The change toward drier biomes, respectively ap-pears around 110, 80 and 100/150 days, respectively, of dri-est season at Ngamakala, Victoria and Kuruyange withoutaltitude effect. We note that the simulated vegetation change
www.clim-past.net/6/169/2010/ Clim. Past, 6, 169–178, 2010
176 E. S. Gritti et al.: Seasonal precipitation change and vegetation in tropical Africa
due only to the change of the seasonality of precipitation ismore important than the changes observed in the palaeodataduring the Holocene at the three sites (Kendall, 1969; Bon-nefille et al., 1991; Elenga et al., 1994; Jolly et al., 1994).Our simulations demonstrate that we have to take into ac-count the seasonal distribution of precipitation when recon-structing past climates. Reconstruction of mean annual cli-matic variables (Bonnefille et al., 1990; Peyron et al., 2000;Bonnefille and Chalie, 2000; Peyron et al., 2006) in tropi-cal areas must be completed by considering the precipitationseasonal distribution. If BIOME3.5 output correctly matchespalaeodata, the next step will consist in developing an ob-jective and automatic procedure to determine which climaticscenario are the most reliable. Regarding the threshold onthe monthly amount of precipitation to define a dry month,the literature is abundant. The value of 30 mm used here isperhaps the oldest definition of a dry month (Koppen, 1884)and, according toAubreville and Chevalier(1949), 30 mm is“certainly under the true value, but this corresponds to a cer-tainty”. The calculation of the number of dry days could beimproved by using the xerothermic Gaussen index (Gaussenand Bagnouls, 1953) which takes into account the relative airhumidity. Moreover, while the processes considered in bio-spheric models are highly nonlinear, some of them have char-acteristic times substantially shorter than one month. The useof monthly average data as model forcing is thus nota priorijustified and may lead to non-negligible errors on the modeloutput variables (Hubert et al., 1998). The use of processes-based ecosystem models has already been shown to be a pow-erful strategy to perform climate reconstruction from palaeo-data (Prentice and Harrison, 2009). Yet, the model used inthis study is an equilibrium biosphere processes-based modelnot simulating explicitly disturbances such as fire distur-bance or human land management which are largely control-ling the trees/grasses balance in disturbance-prone ecosys-tems (van Langevelde et al., 2003; Gritti et al., 2006).Thus,further studies on past climatic reconstruction from palaeo-records would greatly benefit from the use of new generationof explicit processed-based dynamic vegetation models.
5 Conclusions
The effect of a seasonal change in the seasonality distribu-tion of precipitation on the vegetation has been tested withan equilibrium vegetation model. Our simulations confirmthat at all sites, located near the Equator, a substantial in-crease of the number of consecutives dry days could easilylead to a change in the tropical forest composition and struc-ture such as those observed in the pollen diagrams during theHolocene. The impact on the vegetation depends on the PFTand the location. A smooth seasonal change in the precip-itation as used in this study can induce one or several wellmarked biome transition. The change toward a drier biome,i.e. from a semi-deciduous to a deciduous one for instance,
appears, respectively at 110, 80 and 150 days of driest sea-son at Ngamakala, Victoria and Kuruyange. The NPP valueof each PFT potentially present at the tropical location is af-fected by the seasonality of precipitation.
Finally, our study indicates that in the future, sensitivityanalyses of models will be very useful to test explicit or of-ten implicit hypotheses assumed by palaeoecologists. Here,without a modelling approach it would be impossible to es-timate the potential impact of a change in the seasonality ofthe precipitation at a specified location. In natural condi-tions, it is rare to find exact analogues (same mean annualtemperature, annual precipitation, soil, altitude, latitude,. . . )with only a change in the precipitation distribution. This lackof analogues allows for the common assumption by palaeo-climatologists that a change of vegetation is only due to achange of the annual amount of precipitation. Our studydemonstrates the importance of seasonal distribution of pre-cipitation in pollen-derived climate reconstructions. A wayto integrate such changes is the inverse modelling iterativeprocedure developed byGuiot et al.(1999, 2000) and exten-sively applied to Africa byWu et al.(2007a,b).
Acknowledgements.We are grateful to A. Vincens, L. Dallari,G. Riollet, G. Buchet, and A. Fayolle for helpful discussions and toJ. Kaplan who has provided the BIOME3.5 model. Pollen data havebeen provided by the contributors of the African Pollen Database.This research has been funded by the EC INCO programme[INCO-DC (DG XII ERB3514PL972473)]. This paper is also acontribution to project MOTIF (EVK2-CT-2002-00153) of the EUEnvironment and Sustainable Development Program. E. S. Grittiacknowledges support from the ANR founded project QDiv. Wethank the referees for constructive comments on an earlier versionof this paper.
Edited by: D.-D. Rousseau
The publication of this article is financed by CNRS-INSU.
References
Aubreville, A. and Chevalier, A.: Climats, forets et desertificationde l’Afrique tropicale, Societe d’editions geographiques, mar-itimes et coloniales, 1949.
Barboni, D., Bonnefille, R., Prasad, S., and Ramesh, B.: Variationin modern pollen from tropical evergreen forests and the mon-soon seasonality gradient in SW India, J. Veg. Sci., 14, 551–562,2003.
Bazzaz,F.A.: The response of natural ecosystems to the risingglobal CO2 levels, Annu. Rev. Ecol. Syst., 21, 167–196, 1990.
Clim. Past, 6, 169–178, 2010 www.clim-past.net/6/169/2010/

E. S. Gritti et al.: Seasonal precipitation change and vegetation in tropical Africa 177
Bonnefille, R. and Chalie, F.: Pollen-inferred precipitation time-series from equatorial mountains, Africa, the last 40 kyr BP,Global Planet. Change, 26, 25–50, 2000.
Bonnefille, R., Roeland, J. C., and Guiot, J.: Temperature and rain-fall estimates for the past 40 000 years in equatorial Africa, Na-ture, 346, 347–349, 1990.
Bonnefille, R., Riollet, G., and Buchet, G.: Nouvelle sequencepollinique d’une tourbiere de la crete Zaire-Nil (Burundi), Rev.Palaeobot. Palynol., 67, 315–330, 1991.
Box, E. O. and Fujiwara, K.: vegetation types and their broad-scaledistribution, in: Vegetation Ecology, Wiley-Blackwell, 106–128,2005.
Canadell, J., Jackson, R. B., Ehleringer, J. B., Mooney, H. A., Sala,O. E., and Schulze, E. D.: Maximum rooting depth of vegetationtypes at the global scale, Oecol., 108, 583–595, 1996.
Chalie, F.: Paleoclimatologie quantitative en Afrique orientaledepuis 40 000 ans, Pollen et Statistiques, Ph. D. thesis, Marseille,University of Aix-Marseille III, 160 pp., 1992.
Elenga, H., Schwartz, D., and Vincens, A.: Pollen evidence of lateQuaternary vegetation and inferred climate changes in Congo,Palaeogeogr., Palaeoclimatol., Palaeoecol., 109, 345–356, 1994.
FAO-Unesco: Soil Map of the World (1:5,000,000), 1, Legend, Un-esco, Paris, France, 1974.
Friend, A .D. and Woodward, F. I.: Evolutionary and ecophysiolog-ical responses of mountain plants to the growing season environ-ment, Adv. Ecol. Res., 20, 59–124, 1990.
Gaussen, H. and Bagnouls, F.: Saison seche et indicexerothermique, Bull Soc Sci Nat Toulouse, 61, 193–239, 1953.
Gregory, D. and Morris, D.: The sensitivity of climate simulationsto the specification of mixed phase clouds, Clim. Dynam., 12,641–651, 1996.
Gritti, E. S., Smith, B., and Sykes, M. T.: Vulnerabilty of Mediter-ranean Basin ecosystems to climate change and invasion by ex-otic plant species, J. Biogeogr., 33, 145–157, 2006.
Guiot, J.: Methodology of the last climatic cycle reconstruc-tion in France from pollen data, Palaeogeogr., Palaeoclimatol.,Palaeoecol., 80, 49–69, 1990.
Guiot, J., Torre, F., Cheddadi, R., Peyron, O., Tarasov, P., Jolly, D.,and Kaplan, J.: The climate of the Mediterranean Basin and ofEurasia of the last glacial maximum as reconstructed by inversevegetation modelling and pollen data, Ecol. Mediter., 25, 193–204, 1999.
Guiot, J., Torre, F., Jolly, D., Peyron, O., Boreux, J. J., and Ched-dadi, R.: Inverse vegetation modeling by Monte Carlo samplingto reconstruct palaeoclimates under changed precipitation sea-sonality and CO2 conditions: application to glacial climate inMediterranean region, Ecol. Modell., 127, 119–140, 2000.
HAstenrath, S.: Climate and circulation of the tropics, Reidel, Dor-drecht, Boston, Lancaster, Tokyo, 455 pp., 1988.
Haxeltine, A. and Prentice, I.: BIOME3: An equilibrium terrestrialbiosphere model based on ecophysiological constraints, avail-ability, and competition among plant functional types, GlobalBiogeochem. Cy., 10, 693–709, 1996.
Hubert, B., Francois, L., Warnant, P., and Strivay, D.: Stochas-tic generation of meteorological variables and effects on globalmodels of water and carbon cycles in vegetation and soils, J. Hy-drol., 212, 318–334, 1998.
Jolly, D. and Bonnefille, R.: Diagramme pollinique d’un sondageHolocene de la Kuruyange (Burundi, Afrique Centrale), The
comparative in palynology; pollen morphology of the africanpalms/Ballouche, A.ed; Maley, Jean.ed (Palaeoecology ofAfrica and the surrounding islands, 22), 22, 265–274, 1991.
Jolly, D. and Haxeltine, A.: Effect of Low Glacial AtmosphericCO2 on Tropical African Montane Vegetation, Science, 276,786–788, 1997.
Jolly, D., Bonnefille, R., and Roux, M.: Numerical interpretation ofa high resolution Holocene pollen record from Burundi, Palaeo-geogr., Palaeoclimatol., Palaeoecol., 109, 357–370, 1994.
Kaplan, J. O., Prentice, I. C., and Buchmann, N.: The stable car-bon isotope composition of the terrestrial biosphere: Modelingat scales from the leaf to the globe, Global Biogeochem. Cy., 16,1–11, doi:10.1029/2001GB001403, 2002.
Kendall, R. L.: An ecological history of the lake Victoria basin,Ecol. Monog., 39, 121–176, 1969.
Koppen, W.: Die Warmezonen der Erde, nach der Dauer der Heis-sen, Gemassigten und Kalten Zeit und nach der Wirkung derWarme auf die Organische Welt Betrachtet, Meteorol. Z., 1, 215–226, 1884.
Kutzbach, J. E. and Street-Perrott, F. A.: Milankovitch forcing offluctuations in the level of tropical lakes from 18 to 0 kyr BP,Nature, 317, 130–134, 1985.
Kutzbach, J. E., Guetter, P. J., Behling, P. J., and Selin, R.: Simu-lated climatic changes: results of the COHMAP climate-modelexperiments, Global Climates Since the Last Glacial Maximum,24-93, 1993.
Leemans, R. and Cramer, W.: The IIASA climate database for meanmonthly values of temperature, precipitation and cloudiness on aterrestrial grid, IRR-91-18, IIASA, Laxenburg, 1991.
Leith, H.: Primary productivity in ecosystems: comparative analy-sis of global patterns, in: Unifying Concepts in Ecology: Reportof the Plenary Sessions of the First International Congress ofEcology, The Hague, The Netherlands, 8–14 September, 1974,edited by: van Dobben, W. H. n and Lowe-McConnell, R.H.,1975.
Moore III, B., Cramer, W., Rasool, I., Sahagian, D., and Steffen, W.:Participants in “POTSDAM 95” Global net primary productiv-ity: report of the Potsdam 95 IGBP NPP Model IntercomparisonWorkshop (GAIM-DIS-GCTE) Potsdam, Germany, June 20–22,1995, in: Abstracts, GAIM First Sci. Conf., 1995.
Ngomanda, A., Neumann, K., Schweiser, A. and Maley, J.: Sea-sonality change and the third millenium BP rainforest crissi insouthern Cameroon (Central Africa), Quaternary Res., 71, 37–318, 2009.
Osmaston, H.: Glaciers, glaciations and equilibrium line altitudeson the Ruwenzori, Quaternary and Environmental Research onEast African Mountains, 31–104, 1989.
Peyron, O., Jolly, D., Bonnefille, R., Vincens, A., and Guiot, J.:Climate of East Africa 6000 14C Yr BP as Inferred from PollenData, Quaternary Res., 54, 90–101, 2000.
Peyron, O., Jolly, D., Braconnot, P., Bonnefille, R., Guiot, J.,Wirrmann, D., and Chalie, F.: Quantitative reconstructions of an-nual rainfall in Africa 6000 years ago: Model-data comparison,J. Geophys. Res., 111, D24 110, doi:1029/2006JD007396,http://www.agu.org/pubs/crossref/2006/2006JD007396.shtml, 2006.
Prentice, I. C. and Harrison, S. P.: Ecosystem effects of CO2 con-centration: evidence from past climates, Clim. Past, 5, 297–307,2009,http://www.clim-past.net/5/297/2009/.
www.clim-past.net/6/169/2010/ Clim. Past, 6, 169–178, 2010
178 E. S. Gritti et al.: Seasonal precipitation change and vegetation in tropical Africa
Sage, R. F.: Was low atmospheric CO2 during the Pleistocenea limiting factor for the origin of agriculture?, Global ChangeBiol., 1, 93–106, 1995.
Sage, R. F. and Coleman, J. R.: Effects of low atmospheric CO2 onplants: more than a thing of the past, TRENDS in Plant Science,6, 18–23, 2001.
Smith, W. K. and Geller, G. N.: Plant transpiration at high eleva-tions: Theory, field measurments, and comparisons with desertplants, Oecologia, 41, 109–122, 1979.
Stephenson, N. L.: Climatic Control of Vegetation Distribution:The Role of the Water Balance, Am. Nat., 135, 649–670, 1990.
Street-Perrott, F. A. and Perrott, R. A.: Holocene vegetation, lakelevels and climate of Africa, 318-356, University of MinnesotaPress, Minneapolis, 1993.
Terashima, I., Masuzawa, T., Ohba, H. and Yokoi, Y.: Is photosyn-thetic supressed at higher elevations due to low CO2 pressure?,Ecology, 76, 2663–2668, 1995.
Thomas, M. F.: African environments, Taylor and Francis, 198 pp.,1973.
Thompson, B. W.: The Climate of Africa, Oxford University Press,132 pp., 1965.
Triplet, J. P. and Roche, G.: Meteorologie Generale, Paris: EcoleNationale de la Meteorologie, 1977.
van Langevelde, F., van de Vijver, C. A. D. M., Kumar, L., vande Koppel, J., de Ridder, N., van Andel, J., Skidmore, A. K.,Hearne, J. W., Stroosnijder, L., Bond, W. J., Prins, H. H. T. andRietkerk, M.: Effects of fire and herbivory on the stability ofsavanna ecosystems, Ecology, 84, 337–350, 2003.
Vincens, A., Chalie, F., Bonnefille, R., Guiot, J., and Tiercelin, J. J.:Pollen-derived rainfall and temperature estimates from Lake Tan-ganyika and their implication for Late Pleistocene water levels,Quaternary Res., 40, 343–350, 1993.
Vincens, A., Garcin, Y., and Buchet, G.: Influence of rainfall sea-sonalityon African lowland vegetation during the Late Quater-nary: pollen evidence from Lake masoko, Tanzania, J. Biogeogr.,34, 1274–1288, 2007.
Webb, T.: Is vegetation in equilibrium with climate? How to inter-pret late-Quaternary pollen data, Plant Ecol., 67, 75–91, 1986.
White, F.: The vegetation of Africa: a descriptive memoir to accom-pany the UNESCO/AETFAT/UNSO vegetation map of Africa,Natural Resources Research, 20, 1–356, 1983.
Woodward, F. I.: Ecophysiological studies on the shrubVacciniummyrtillus L. taken from a wide altitudinal range, Oecologia,70,580–586, 1986.
Woodward, F. I.: Climate and Plant Distribution, Cambridge Uni-versity Press, 174 pp., 1987.
Wu, H., Guiot, J., Brewer, S., and Guo, Z.: Climaticchanges in Eurasia and Africa at the last glacial maxi-mum and mid-Holocene: reconstruction from pollen datausing inverse vegetation modelling, Clim. Dynam., 29,211–229, doi:10.1007/s00382-007-0231-3,http://dx.doi.org/10.1007/s00382-007-0231-3, 2007a.
Wu, H., Guiot, J., Brewer, S., Guo, Z., and Peng, C.: Dominantfactors controlling glacial and interglacial variations in the tree-line elevation in tropical Africa, PNAS, 104, 9720–9724, doi:10.1073/pnas.0610109104,http://www.pnas.org/content/104/23/9720.abstract, 2007b.
Zobler, L.: A World Soil File for Global Climate Modelling, NASATechnical Memorandum 87802, NASA Goddard Institute forSpace Studies, New York, USA, 1986.
Clim. Past, 6, 169–178, 2010 www.clim-past.net/6/169/2010/