simone moriconi, giovanni peri, dario pozzoli · 7312 2018 october 2018 the role of institutions...
TRANSCRIPT

7312 2018
October 2018
The Role of Institutions and Immigrant Networks in Firms’ Offshoring Decisions Simone Moriconi, Giovanni Peri, Dario Pozzoli

Impressum:
CESifo Working Papers ISSN 2364‐1428 (electronic version) Publisher and distributor: Munich Society for the Promotion of Economic Research ‐ CESifo GmbH The international platform of Ludwigs‐Maximilians University’s Center for Economic Studies and the ifo Institute Poschingerstr. 5, 81679 Munich, Germany Telephone +49 (0)89 2180‐2740, Telefax +49 (0)89 2180‐17845, email [email protected] Editors: Clemens Fuest, Oliver Falck, Jasmin Gröschl www.cesifo‐group.org/wp An electronic version of the paper may be downloaded ∙ from the SSRN website: www.SSRN.com ∙ from the RePEc website: www.RePEc.org ∙ from the CESifo website: www.CESifo‐group.org/wp

CESifo Working Paper No. 7312 Category 8: Trade Policy
The Role of Institutions and Immigrant Networks in
Firms’ Offshoring Decisions
Abstract The offshoring of production by multinational firms has expanded dramatically in recent decades, increasing these firms’ potential for economic growth and technological transfers across countries. What determines the location of offshore production? How do countries' policies and characteristics affect the firm’s decision about where to offshore? Do firms choose specific countries because of their policies or because they know them better? In this paper, we use a very rich dataset on Danish firms to analyze how decisions to offshore production depend on the institutional characteristics of the country and firm-specific bilateral connections. We find that institutions that enhance investor protection and reduce corruption increase the probability that firms offshore there, while those that increase regulation in the labor market decrease such probability. We also show that a firm’s probability of offshoring increases with the share of its employees who are immigrants from that country of origin.
JEL-Codes: F160, J380, J240.
Keywords: offshoring, product market, labor regulations, networks, fixed start-up costs.
Simone Moriconi
Iéseg School of Management & LEM Paris / France
Giovanni Peri University of California, Davis / USA
Dario Pozzoli
Copenhagen Business School / Denmark [email protected]
October 8, 2018 Funding from the Danish Research Council (grant number: 7024-00007A) is gratefully acknowledged. We would also like to thank participants at the RES 2018 Annual Conference, the CESifo Area Conference on Global Economy and the 2018 Mid-west International Trade Conference for their helpful advice and feedback. We also thank the Tuborg Research Centre for Globalisation and Firms at the Aarhus University School of Business and Social Sciences for granting access to Danish registry data. The registry data build on anonymized micro datasets owned by Statistics Denmark. To enhance the scientific validation of analyses published using DS micro data, the Aarhus University Department of Economics and Business helps researchers obtain access to the data set. The usual disclaimers apply.

1 Introduction
The rapid increase in production offshoring has been a pervasive trend deeply affecting
the structure of the production and labor markets of several developed countries in recent
decades. The driving forces of firm offshoring have been extensively studied (Bernard and
Jensen, 1999). Nevertheless, the factors that shape domestic firm boundaries are debated
(Barba Navaretti et al., 2011). Firms’ decisions regarding offshore production have been
described by heterogeneous firm models of trade, such as the one proposed by Melitz (2003).
In these theoretical models, the probability of engaging in offshore production is a negative
function of the entry cost that the firm must pay in a destination country in order to start
production. The high fixed costs of operating a business (e.g., due to lengthy bureaucratic
procedures, inefficient financial institutions, and sluggish labor markets in the destination
country) may discourage firms from offshoring production activities in those countries.
Many empirical studies based on firm-level data show that firms engage in trade activities
only if their productivity levels are high enough to cover the fixed costs of trade (see Sofronis
K. Clerides, 1998; Bernard and Jensen, 1999; and Greenaway and Kneller, 2004, among many
others). None of these studies, however, has identified the factors determining firms’ fixed
costs for offshoring production or measured the impact of these costs on firms’ propensity to
offshore. Partial exceptions can be identified in the literature on foreign direct investment
(FDI). Olney (2013) uses a cross-country database compiled by the OECD to show that
US firms have a greater FDI presence in countries with more liberal employment protection
legislation. On the other hand, Antras et al. (2009) study how the cross-border activities
of global firms relate to institutions that produce different levels of investor protections and
capital market development. Their model predicts that arm’s length technology transfers
are more common than technology transfer through foreign affiliate activity in host countries
where investor protections are stronger. Moreover, Antras et al. (2009) show that the share
of activity abroad financed by capital flows from multinational parents is decreasing in the
quality of investor protections in the host economies.
Our study is closely related to these studies. More generally, we analyze the role of a broad
set of institutions and policies in the destination countries in affecting the extensive and
the intensive margin of offshoring by Danish firms. In addition to analyzing labor market
and investor protection, we also consider indices of corruption, measures of bureaucracy and
the weak enforcement of standards during the registration process of new companies. Those
institutions affect firms’ fixed and operating costs (Djankov et al., 2002). Similarly, lax
enforcement, such as difficulties in obtaining or recovering credit, or problems in enforcing
contracts may hurt economic activity and reduce returns to investments (Acemoglu et al.,
2

2005).
In our analysis, we also explore the role of individuals in the offshoring firm who are fa-
miliar with the destination country, namely, firm employees who are immigrants from those
countries. We estimate whether the presence of these immigrants and the size of the group
affects the probability and the scale of offshoring in their countries of origin. The presence
of a network of foreign workers from specific countries can help firms gather information and
navigate the local bureaucracy and culture to comply with burdensome regulations or to
obtain better access to credit. More generally, networks can channel information and help
firms reduce asymmetries, uncertainties and set-up costs that arise from venturing abroad
(Peri and Requena-Silvente, 2010).
Therefore, this paper has two main goals. First, for a large set of institutional characteris-
tics, we test which ones influence firms’ offshoring decisions by affecting the costs of setting
up offshore business in the country. In particular, we distinguish institutions and policies
that reduce the propensity to offshore from those that create an ‘offshoring-friendly’ business
environment and increase offshoring. Second, we analyze whether firms’ networks of immi-
grant employees reduce the fixed costs and facilitate offshoring activities in the employees’
countries of origin. We also test whether the network of immigrants is more or less effective
in promoting offshoring in the presence of some of the institutional features analyzed above.
To answer these research questions, we use three main datasets. The first is the Doing
Business database compiled by the World Bank (see Djankov et al., 2002), which is a cross-
country database with information on regulations in over 160 countries for the 2006-2012
period. This dataset covers business regulations in many different areas1. The database
also includes information on labor market regulations about hiring practices, hours worked,
redundancy rules and minimum wage provisions. The second data source is the Worldwide
Governance Indicators (WGI) project for the 2006-2012 period (Kraay, 2010), from which
we take a country-year-specific measure for corruption. The third data source is a Danish
employer-employee matched dataset that covers the universe of individuals and firms in the
manufacturing sector for the same period. This dataset is especially well suited for studying
firms’ offshoring decisions since it allows international trade transactions to be measured
at the firm level (Hummels et al., 2014a) rather than at the country level (Olney, 2013).
This dataset also includes extensive information on the characteristics of firms’ employees,
including their country of birth, so that we can identify the network of immigrant workers
in each firm.
1The areas covered are, specifically, the following: starting a business, registering property rights, ob-taining credit, protecting minority investors, paying taxes, trading across borders, enforcing contracts andresolving insolvency.
3

Our main results suggest that business and labor market regulations have opposing effects
on offshoring activities. Business regulations increase the probability (extensive margin) of
offshoring. A lack of credit coverage and the inadequate protection of creditors’ property
rights result in high fixed costs of offshoring. Accordingly, business regulation that enhances
credit coverage and resolves insolvency issues in destination countries tend to increase firms’
propensity to offshore there. This finding is interesting, as it suggests that regulations en-
suring the protection of creditors and property rights increase the probability of investment
in a country. This finding is partly contrary to existing negative views about business regu-
lations (see, e.g., Djankov et al., 2002). Conversely, labor market regulations have a negative
impact on the propensity to offshore: stringent measures of employment protection increase
firms’ labor costs, which negatively affect firms’ extensive margin of offshoring. This result is
in line with the general view that employment protection regulations increase labor market
frictions and labor costs. We also find that a lack of control of corruption in the destination
country highly decreases firms’ probability of offshoring to that destination. Corruption is
a tax on offshoring (as bribery is costly) and may increase uncertainty and unreliability in
the local environment. Different from the “extensive margin,” the “intensive margin” of off-
shoring, namely, the value of offshore activity conditional on investing, is never significantly
affected by the institutional measures that we analyze. This argument is consistent with
the hypothesis that regulations, corruption and the network of immigrant workers affect the
fixed, rather than the variable, costs of accessing a foreign market. Once the initial cost
of setting up production in a country is paid, there is no additional effect on the size of
operations. We also find that a firm’s network, measured as the share of workers from a
foreign country, has a significant positive effect on the extensive margin of offshoring in that
country, consistent with its role in reducing fixed costs of offshoring.2 Several refinements
to the network variable confirm the role played by foreign workers in promoting offshoring
activities at the bilateral level. We also find that the positive impact of networks is magni-
fied (attenuated) in destination markets with high levels of credit risk (corruption). In this
respect, it appears that a thick network of immigrants can partly compensate for high credit
risk, possibly ensuring a level of trust and knowledge that reduces such risk. On the other
hand, immigrant workers may warn their firms of the high level of corruption in their own
countries so that the negative effect of corruption on offshoring is enhanced for firms with a
larger network from those countries.
2Our findings are different from those in Ottaviano et al. (2018), who find a negative effect of network atthe bilateral level. That paper focuses on service trade and emphasizes that imported service tasks can besubstituted by immigrants working in the firm. We instead explore the offshoring of production activitiesfor a representative sample of firms in the manufacturing industry, where the information channel may bemore important than task substitution.
4

In the next section, we present a conceptual framework for the fixed costs of offshoring.
Our empirical strategy is explained in Section 3. The data and summary statistics are then
discussed in Section 4. We present our results in Section 5 and conclude in Section 6. The
figures and tables are provided in the Appendix.
2 Theoretical Intuition
We consider a multi-country economy, with a continuum of countries i, j ∈ [0, 1]. There
are two sectors in this economy. One sector provides a single homogeneous good. This
good is used as the numeraire, and its price is set at 1. This good is produced under
perfect competition. The second sector supplies a differentiated good under monopolistic
competition: each firm is a monopoly for the variety of good that it produces, and varieties
are imperfect substitutes. All the countries produce both goods, which can be freely traded.
2.1 Demand
We assume the world is populated by a unit measure of consumers with identical preferences.
The utility function of these consumers is increasing in the consumption of the homogeneous
good xo and in the quantity q(x) of each variety x of the differentiated good, where X is the
set of all the available varieties:
U = x1−µo
(∫x∈X
q(x)σ−1σ di
)( µσ−1+σ )
. (1)
σ > 1 is the elasticity of substitution between varieties, µ is the share of income devoted
to consumption of the differentiated good (so 1− µ represents the consumer’s expenditures
devoted to xo). Consumers choose the demand for the differentiated good that maximizes
their utility (1) subject to their budget constraint. In this typical Dixit-Stiglitz framework,
the (inverse) demand function for a single variety is
p(x) = Aq(x)−1σ , where A =
(P 1−σ
µ
)−(1/σ)
. (2)
The inverse demand function (2) features an index A of the market size of the differen-
5

tiated sector, which is increasing in the price index P :
P =
(∫x∈X
p(x)1−σ dx
)1/1−σ
. (3)
2.2 Offshoring and supply
Regarding the supply of the differentiated good, in each country, there is a continuum of firms
z; these firms are heterogeneous in their productivity θz ∈ [0, 1] and produce a single variety
of the differentiated product. The production technology of firms includes both headquarter
tasks, h, and manufacturing tasks, m. Headquarter services are performed locally and thus
identify the home country of the firm. The manufacturing tasks are supplied everywhere
and can be performed in different countries, i.e., offshored abroad.
We assume that labor is the only factor of production in the economy. Labor is supplied
inelastically in all countries and is used both to produce the homogeneous good and to
perform the tasks necessary to produce the differentiated good. Perfect competition in the
homogeneous sector and free trade imply that wage rates are set at their reservation level
and equalized across countries, so they can be set equal to one.
Let us now consider a firm in country i that offshores production to foreign country j.
We use the following Cobb-Douglas production function:
xij(z) = θz(h)1/2 (λjm)1/2 . (4)
The output of firm z from country i depends on its productivity, θz3, the local headquar-
ter’s inputs, h, and the manufacturing inputs, m, which are offshored to country j. λj > 1
is the efficiency of the labor inputs available in country j in terms of the performance of
manufacturing tasks. We assume that λi = 1, so λj > 1 implies that firms can access more
efficient manufacturing inputs by offshoring production. Finally, note that the production
function (4) features technology that is equally intensive for manufacturing and headquarter
services.
All firms incur a positive fixed cost f > 1 when they start production. An additional
positive fixed cost, rj > 0, is paid by firms when they offshore production to country j, e.g.,
due to a different functioning of the institutions there (such as weaker enforcement of judi-
3As the productivity distribution is country-specific, we should also add subscript i. However, for thesake of simplicity, we omit it, and as we focus on country i, this does not reduce clarity.
6

cial institutions, higher regulatory constraints, and higher levels of corruption), information
frictions, and linguistic barriers. However, some of these entry costs are attenuated when a
firm has a specific network in country j (e.g., created by the firm’s workers who originate
from country j), 0 < φzj ≤ 1.4
The profit function of an offshoring firm is
πij(z) = pxij(z)− (h+m)− (f + rj − φzj). (5)
We now substitute demand (2) and the production function (4) into (5). After some
simplifications, we obtain
πij(z) = A(θz(h)1/2 (λjm)1/2
)−1+σσ − (h+m)− (f + rj − φzj). (6)
The firm chooses h and m to maximize (6). From the first-order conditions, we obtain
the input demand for the offshoring firm:
m∗(z) = h∗(z) =
(A
2
)σ (σ − 1
σ
)σλ
σ−12
j θσ−1z , (7)
where m∗ = h∗ follows because headquarters and manufacturing services have the same
intensity in the production function. If we substitute (7) back into (6), then we obtain the
equilibrium profits of the offshoring firm:
π∗ij(z) = 21−σAσ(σ − 1
σ
)σ (1
σ − 1
)λ
12
(σ−1)
j θ(σ−1)z − (f + rj − φzj). (8)
From the condition π∗ij(z) > 0, we derive the productivity threshold faced by firms that
offshore production abroad:
θ > θ̂zj, where θ̂zj =2σ
(σ − 1)Aσ
−1+σ γj1/2(σ (f + rj − φzj))
1−1+σ . (9)
Only firms characterized by a productivity level θ > θ̂zj that is sufficiently high will find
it profitable to offshore production to country j. According to (9), θ̂zj depends on the size
of the differentiated good sector (A); therefore, we define the following lemma.
4The combined assumptions of f > 1, rj > 0 and 0 < φzj ≤ 1 imply that the network benefits do notcompletely offset the fixed costs. These assumptions are necessary to guarantee economies of scale for thefirms.
7

Lemma : More firms will offshore production when the size of the differentiated sector
increases, i.e., dθ̂zj/dA < 0.
When the size of the differentiated sector increases, more firms will be needed to satisfy
the increased demand for consumption. Put differently, as θ̂zj decreases, more firms will find
it profitable to offshore production.
According to equation (9), the number of offshoring firms also depends on the efficiency
of country j in tasks m (λj), the internal economies of scale (f), the institutions of the
destination country (rj) and the networks that are available in the destination country (φzj).
We now express the number of offshoring firms relative to all producing firms in the
monopolistic sector, which can be considered the ”probability” that one firm taken among
the producing firms is offshoring, hence the probability (extensive margin) of offshoring. To
do this, we compare the offshoring condition (9) with the one that domestic firms in country
i have to meet to engage in production locally. If the manufacturing tasks are completed
locally, then firms are not exposed to different institutions (i.e., ri = 0). In addition, they
are able to maximize local network benefits (i.e., φzi = 1). However, these firms can only
access labor inputs that have low efficiency (i.e., λi = 1):
θ > θzi, where θzi =2σ
(σ − 1)Aσ
−1+σ
(σ (f − 1))1
−1+σ . (10)
It easily follows that the number of offshoring firms relative to non-offshoring firms is an
increasing function of the following ratio of thresholds:
Θoff =θzi
θ̂zj=
(f − 1
f + rj − φzj
)1/(σ−1)
λ1/2j . (11)
From (11), we obtain three theoretical predictions that provide the basis for our empirical
strategy:
Proposition 1: The number of offshoring firms in country j (or equivalently the prob-
ability of offshoring in country j) decreases when institutional fixed costs in j increase, i.e.,
dΘoff/drj < 0.
Proposition 2: The number of offshoring firms in country j increases when the size of
the network from that country increases, i.e., dΘoff/dφzj > 0.
8

Proposition 3: The number of offshoring firms in country j increases when the effi-
ciency of performing the m tasks in country j increases, i.e., dΘoff/dλj > 0.
These propositions simply formalize the intuitions of this simple theoretical framework,
and they will guide the empirical analysis on the effects of institutions and networks on firms’
offshoring decisions performed next
3 Empirical Strategy
The propositions above provide the theoretical micro-foundation for our empirical analysis.
We construct an empirical specification in which differences in the fixed costs associated with
institutions in the destination country j and variation of the firm i’s networks in country j
affect firm i’s offshoring decisions in country j. Our baseline specification is the following
bilateral regression equation:
Offijmct = α + r′jt−1β + γφijt−1 +X ′it−1ζ + θi + θj + θmt + θc + εijt (12)
where Offijmct measures either the extensive margin of offshoring (i.e., the presence
of offshore production in country j) or the intensive margin of offshoring (i.e., the value
of offshoring activities in country j conditional on offshoring) of firm i in manufacturing
industry m localized in municipality c at time t. As we clarify later in the data section,
the detailed Danish custom data allow us to measure offshoring as the purchases of inputs
within the same industry classification as that of the firm’s output.
The first set of explanatory variables in equation (12) is the vector rjt−1, which includes
the institutional features of the country that affect fixed costs of offshoring, such as labor,
business, credit regulations and corruption in destination country j and year t − 1 (see the
data section below for a detailed description of these institutional costs). Changes in national
regulations and corruption levels will produce changes in costs of offshoring, which are ex-
ogenous to the firm and vary across destination countries. Inefficient and risky institutional
settings that prevent the enforcement of contracts and jeopardize property rights or limit
competition may increase the cost of doing business in a country. We use changes in these
policies in a country (e.g., Viscusi et al., 2005) and track their effect on the firm’s offshore
investments. These changes can reasonably be considered as exogenous from the perspective
of a single enterprise, as Danish firms have a very limited influence on the outcome of re-
form processes outside of Denmark. A potential threat to this identification strategy is that
shocks originating with Danish firms could affect the markets and the regulatory frameworks
9

of their foreign suppliers or foreign customers. These shocks could be an issue for a large
country, such as the United States, but Denmark is a small country of less than six million
people and represents a small share of trade, both in the aggregate and for individual part-
ners and products (Hummels et al., 2014a). It is important to note that all the variables
included in the vector rjt−1 are lagged one period to account for the fact that companies can-
not immediately adjust offshoring activities in response to changes in destination markets’
institutions.
Equation (12) also includes the explanatory variable φijt−1, which proxies for the strength
of firm i’s immigrant networks in country j. This variable is computed as the firm’s share
of foreign workers that were born in country j and are employed at time t− 1. Unobserved
firm-specific shocks could influence both the hiring of foreign workers and offshoring. Firms
that intend to offshore to a destination country may intentionally hire foreign workers from
that country. It may be argued this is an obvious source of endogeneity, which introduces a
spurious positive bias in our network coefficient. We therefore pursue a (simple) instrumental
variable approach that reduces this endogeneity issue. Specifically, the instrument is the
predicted share of foreign workers from country j in municipality c, where the firm is located
at time t− 1 with its lagged value as of 1996, i.e., ten years before our sample starts.
φIVjct−1 =Fjt−1 ∗ (Fjc96/Fj96)
Pc96
(13)
where Fjt−1 is the national stock of immigrants from country j in period t − 1. These
immigrants are allocated to municipality c based on the share of migrants from the same
country j in year 1996 (i.e., Fjc96/Fj96). This approach assumes that new immigrants migrate
to cities based mainly on family and friend networks rather than changing local economic
conditions, which could be endogenous. By construction, the instrument relies on the pre-
determined distribution of immigrants across municipalities in 1996 and the subsequent
tendency of new migrants to reside in migrant enclaves. This product is then normalized
by total employment in the municipality c in 1996 (Pc96) to generate a predicted network
variable at the municipality-year level.5 Figure 1 plots the bilateral share of foreign workers
in a municipality against its instrument. A significant positive relationship shows that the
instrument is a good predictor of the bilateral share of foreign workers in the firm. This
figure offers a visual inspection of the first-stage IVcoefficients that are discussed later in the
section (5).
[Insert Figure 1 about here]
5See Card (2005) for additional details on the shift-share approach.
10

It is possible that the distribution of migrant workers across local labor markets in the
base year reflects endogenous economic factors that are persistent over time. We test for
this potential violation of our exclusion restriction in Table 1. Specifically, we correlate the
changes of our bilateral (municipality by country of offshoring) instrument with the pre-
sample (2000-2005) trends in the destination-specific offshoring outcomes. The instrument
predicts the change in immigrants by country of origin and municipality from 2006 to 2012,
and the first two columns of the Table show that these are unrelated to the pre-2000 trend of
the extensive margin of offshoring (column 1) or the pre-2000 trend of the intensive margin
of offshoring (column 2). At the same time, column 3 shows that our bilateral instrument is
a strong predictor of the change in immigrants from 2006 to 2012 at the municipality level,
confirming that it is a strong instrument even after controlling for municipality fixed effects.
[Insert Table 1 about here]
Equation (12) allows us to test Propositions 1 and 2. The test of Proposition 1 on the
effect of institutional fixed costs on firms’ offshoring can be summarized by the following
hypothesis:
Hypothesis 1: β < (=)0 for the extensive (intensive) margin of offshoring. The co-
efficient β measures the bilateral impact of an increase in the fixed costs associated with
the institutional feature r on the decision of firm i to offshore in country j. This coefficient
is predicted to be negative (zero), as the extensive (intensive) margin of the offshoring is
assumed to be negatively related to (independent from) an increase in the fixed cost of off-
shoring.
This prediction implies a negative effect of institutionally driven fixed costs on the ex-
tensive margin of offshoring. Proposition 1 is in fact derived from a Melitz-type theoretical
framework, similar to the one presented above, in which the fixed costs affect the firms’
decisions to offshore production tasks and not the firms’ offshoring volumes (conditional on
offshoring).
The empirical test of Proposition 2, on the effects of networks on firms’ offshoring, can
be summarized by the following hypothesis:
Hypothesis 2: γ > (=)0, for the extensive (intensive) margin of offshoring. The coeffi-
cient γ measures the impact of the size of the immigrant network between firm i and country
j. A larger presence of immigrants can help firm i decrease the total fixed costs of offshoring
11

in these immigrants’ country of origin. This coefficient is predicted to be positive (zero), as
the extensive (intensive) margin of offshoring is positively related to (independent from) a
decrease in the fixed cost brought by a larger network.
This prediction states that a strong bilateral network of immigrants working in firm i
and originally from country j is expected to facilitate its cross-border transactions with j by
reducing all the fixed costs of setting up an off-shore relation. This assumption is consistent
with the notion that foreign workers increase the knowledge and the trust that promote
bilateral trade relations by decreasing their fixed costs.
While we focus on the test of Propositions 1 and 2, Proposition 3 regarding the role
of firm productivity offers an additional micro-foundation for our empirical specification.
According to that proposition, the vector of firm-level controls Xit−1 should include proxies
of firm productivity. In fact, we include the following variables as controls: value added per
worker, capital intensity, foreign ownership, the number of offshoring destinations and size.
We also include workforce characteristics among the controls, including employees’ average
education level, age, tenure and work experience. Moreover, the detailed nature of our
dataset allows us to include a comprehensive set of fixed effects, including firm fixed effects,
θi, industry by year fixed effects, θmt, destination fixed effects, θj, and municipality fixed
effects, θc. These effects will absorb unobserved characteristics of each firm, and industry-
specific and country-specific trends that may both be correlated with off-shoring probability
and the size of the firm’s immigrant network. The standard errors are clustered at the
destination-municipality-year level to allow for correlation in the residuals across firms within
each municipality-destination-year group.
4 Data
As mentioned in the introduction, a novelty of our paper is that we combine three different
data sources. The first is Doing Business, a cross-country database that provides information
on approximately 160 countries over the 2006-2012 period. This dataset, developed by the
World Bank, follows the methodology proposed by Djankov et al. (2002) and is constantly
updated and expanded. It covers business and credit regulations for each country in the
following areas: starting a business, registering property rights, paying taxes, trading across
borders, obtaining credit, and protecting minority investors. This database also measures
labor market regulations on hiring practices, hours worked, redundancy rules and minimum
12

wage provisions.6 The second dataset includes information on a country-specific measure of
corruption, which is obtained from the WGI project (Kraay, 2010). This measure is based
on the inverse of the estimated governance component related to the ”control of corruption”,
i.e., a higher indicator in our dataset corresponds to higher levels of perceived corruption.7
The third dataset combines the following three main registers on firms and their employ-
ees, which are collected by the official Danish statistical institute (Danmarks Statistik): the
“Integrated Database for Labor Market Research” (IDA), the “Accounting Statistics Regis-
ter” (FirmStat), and the “Foreign Trade Statistics Register” (Udenrigshandelsstatistikken).
The IDA is a longitudinal employer-employee register that compiles information on the
age, gender, nationality, education, occupation, and wages of individuals aged 15-74 between
1980 and 2012. The information is updated once a year in week 48. Apart from deaths
and permanent migrations, there is no attrition in the data. The individual information
in IDA is used to measure detailed workforce composition characteristics at the firm level,
as explained in the next section. This information includes the share of foreign workers
from each destination country j, the share of male employees, and the workers’ average age,
education level and work experience. Because we can track people over time, we can also
establish the average tenure of all employees since 1980.
FirmStat is a firm register that provides the annual value of capital stock, the produc-
tivity and the industry affiliation of firms over the 1995-2012 period.8 These data capture
some of the salient firm-level characteristics included in all of our regression models, which
are described in the next section.
The “Foreign Trade Statistics Register” includes import purchases (and export sales)
and the number of imported (exported) products at the firm level over the 1995-2012 period.
These data are available both for specific destinations and aggregated over all destinations.
Import (and export) volumes are recorded in the Danish kroner (DKK) according to the
6Recent updates to this dataset include information on business regulations on the provision of electricity,construction permits and labor market regulations on severance payments. However, we do not consider theseregulations in this analysis because they are available for a large group of countries only from 2014 on.
7The original Control of Corruption (CC) indicator captures perceptions of the extent to which publicpower is exercised for private gain, including both petty and grand forms of corruption, as well as the”abduction” of the state by elites and private interests. We use the inverse of this estimated governanceindicator in standard normal units, ranging approximately from -2.5 (low levels of perceived corruption) to2.5 (high levels of perceived corruption).
8Capital stock includes the sum of the value (in the Danish kroner) of land, buildings, machines, equipmentand inventory. Firm productivity, which is the most important predictor of firms’ internationalization inrecent trade theory, is calculated as revenues per employee in logarithmic scale (i.e., labor productivity).We deflate all the monetary values using the World Bank’s GDP deflator, with 2005 as the base year.Approximately 16 percent of the firms in the final sample have imputed accountings. Excluding theseobservations from the main sample provides almost identical results to those reported in the paper. Theseadditional results are available on request from the authors.
13

8-digit combined nomenclature as long as the transaction is worth at least 7, 500 DKK or
involves goods whose weight is at least 1, 000 kg.9
From the population of all firms, we retain only manufacturing firms with at least 10
employees. Thus, we obtain an unbalanced panel of approximately 2, 000 firms over the
2006 − 2012 period. Regardless of its offshoring status, each firm is assigned to all 160
destinations, for which the Doing Business dataset is not missing any information on business
or labor market regulations.
Using data from the Foreign Trade Statistics Register, we construct a firm-level measure
of offshoring. Following Hummels et al. (2014b), we use a “narrow offshoring” measure that
is constructed as the sum of imports for the same product category as firm exports and
domestic sales.10 This narrow measure of offshoring rules out the imports of raw materials
that are inconsistent with standard definitions of offshoring.11 We examine two aspects of
offshoring. First, we analyze whether regulations and networks affect the probability that
a firm offshores production activities in a destination market (i.e., the extensive margin of
offshoring). Second, we also estimate the impact of institutions and networks on firms’ values
of bilateral offshoring, conditional on firms already offshoring in the destination market (i.e.,
the intensive margin of offshoring).
Figure 2 presents the distribution of offshoring across manufacturing industries in Den-
mark. We report the twelve industries with the highest share of offshoring firms. Offshoring
is common in motor vehicles, machinery and equipment, basic metals and textiles, where
more than 30 percent of firms offshore.
[Insert Figure 2 about here]
The most popular offshoring destinations over the 2006-2012 period are reported in Fig-
ure 3. Most of the closest countries are included among the top 12 destinations of Danish
offshoring. About 60 percent of Danish offshoring takes place within the European Union.
Norway, Germany and Sweden represent the top three destinations. These patterns are con-
sistent with the well-known fact that most offshoring takes place among developed countries.
Several Eastern European countries are also included in the top 20 countries where Danish
firms offshore. Poland, Latvia, Lithuania and the Czech Republic are among the largest
recipients of Danish offshoring.
97, 500 DKK are valued at about 1, 000 Euros at the time of writing. Since the introduction of the Eurocurrency, the Danish Central Bank has adopted a fixed exchange rate policy vis-a-vis the Euro.
10The first 6 digits of the Combined Nomenclature in the Foreign Trade Statistics Register are aggregatedto the 4-digit level to considerably improve consistency over time.
11In the sensitivity analysis, we use an alternative ”broad offshoring” measure that includes all the importsof a given firm in a given year, independently of the product code.
14

[Insert Figure 3 about here]
4.1 Descriptive statistics
Table 2 reports the summary statistics of the main variables used in the empirical analysis.
According to our destination-specific definition of offshoring, approximately 3 percent of firms
conduct offshoring in some foreign country. Focusing on the intensive margin of offshoring,
the average value of offshoring to each destination, conditional on offshoring, is approximately
30,000 DKK per firm/year.
[Insert Table 2 about here]
The measure of the immigrants’ network variable for firm i, φijt−1, is the share of foreign
workers from country j at time t−1. We also include in our specification the following firm-
level controls: productivity, size, capital intensity, the number of offshoring destinations,
and multi-establishment and foreign ownership dummies. We also control for measures of
employees’ gender, occupation, average age, education, tenure, and work experience. The
summary statistics for the networks and control variables are reported at the bottom of
Table 1.
Table 3 reports the main descriptive statistics for the measures of institutional/policy
quality in the country of potential offshoring. The measures presented are derived from
the indicators of labor, business and credit regulations collected by the World Bank at the
country level. Specifically, the labor regulations include the following: i) whether fixed-term
contracts are prohibited for permanent tasks; ii) the maximum number of working days per
week, calculated as 7 minus the maximum allowed number of working days; iii) whether
employers must notify or consult a third party before a collective dismissal of employees;
and iv) the minimum wage (measured as the ratio of the minimum wage relative to median
wages). We combine the labor regulations with a principal component analysis (PCA) to
calculate an index that summarizes the intensity of labor market rigidities in a country.
The business regulations include the following: i) the time required to start a business
(in days); ii) the time required to register property (in days); iii) the time required to
prepare and pay taxes (in hours); and iv) the time required to export goods (in days). The
corresponding PCA index is also reported in the same table. Finally, the credit-related costs
in our empirical analysis include the following: i) the lack of private credit bureau coverage
(percent of adults), computed as 100 minus the private credit bureau coverage; ii) the lack
of an investors’ protection index, calculated as 10 minus the business extent of disclosure
15

index (the disclosure index ranges from 0=less disclosure to 10=more disclosure); iii) the
cost of enforcing contracts (percent of claims)12 and viii) the rate of insolvency, calculated
as 100 minus the recovery rate (cents on the dollar). The PCA index of credit risk is
obtained by combining these credit-related items. The last row of Table 2 shows the main
descriptive statistics of our country-specific corruption index, which is based on the inverse
of the estimated control of corruption indicator (Kraay, 2010). Let us emphasize that all the
institutional indexes vary by year for each country, and therefore, the identification in our
panel is given by within-country variation over time.
[Insert Table 3 about here]
Figure 4 shows the measures of regulations and corruption, described in Table 3, across
different countries in 2006 and in 2012. The charts plot the index in a country in 2006 against
the same index in 2012. A few items are worth noting. First, there is non-trivial time-series
variation in each index, as the majority of destination countries show deviations from the 45-
degree line. This variation is the temporal variation we will exploit in our empirical analysis.
Second, whereas most of the destination countries have experienced a reduction in business
regulations and credit risk over the sample period, the trends for the index of labor market
rigidity and our measure of corruption are less clear, as there appear to be equal movements
up and down for that index across countries.
[Insert Figure 4 about here]
Figure 5 shows the destination countries with the highest index along each of the four
dimensions described in Table 3. The chart already suggests a degree of correlation across the
indexes of business regulation, credit risk and corruption. Five of the destinations with the
highest index of business regulations (Angola, Chad, Haiti, Iraq, Ukraine and Venezuela) are
also among the countries with the highest credit risk scores, as reported in the two second and
third panels, respectively. Furthermore, the second and fourth panels of Figure 5 reveal that
the 5 destinations with the highest corruption index are also among the countries featuring
the highest credit risk. We do not observe the same correlation in the country ranking in
terms of labor market rigidity and the other three rankings. This result is confirmed by the
fact that there is a relatively low and negative correlation between the index of labor market
12The cost is recorded as a percentage of the claim, which is assumed to be equivalent to 200 percentof income per capita or 5,000 dollars, whichever is greater. Three types of costs are recorded: court costs,enforcement costs and average attorney fees.
16

rigidity and the other three indexes, whereas the index of business regulation is highly and
positively correlated with the index of credit risk and the corruption index.13
[Insert Figure 5 about here]
Figure 6 shows separate scatter plots of our indexes of labor market rigidity, business
regulations, credit risk, corruption and networks against the extensive margin of offshoring
aggregated at the destination-year level. A statistically significant negative (positive) rela-
tionship is evident between the indexes (the size of network) and the average share of firms
that offshore at the year-destination level. Consistent with our hypothesis, the number of
offshoring firms decreases (increases) when the institutional fixed costs (size of networks)
increase. These significant relationships are consistent with our main propositions and are
already present in the simple data. Next, we examine whether these results hold in a more
rigorous empirical specification. Then, Figure 7 plots the indexes and networks measure
against the average log of offshoring values at the year-destination level. The intensive mar-
gin of offshoring, instead, does not correlate with either the institutional indexes or with the
size of the network.
[Insert Figures 6 and 7 about here]
5 Results
Our main estimates are obtained from equation (12), and we focus on the coefficient of
the institutional and network variables. We then investigate how institutions and networks
interact with each other, and finally, we show extensions, checks and refinements of the main
results.
5.1 Main results
Table 4 presents the baseline results showing the impact of regulations and networks on
the extensive margin of offshoring. In column 1, we report a specification controlling for
industry only by year, firm and municipality fixed effects. In this specification, we observe
that stronger employment protection, weaker credit coverage, a lower resolving-insolvency
13The correlation coefficient between the index of labor market rigidity and the index of business regulation(index of credit risk) is -0.22 (-0.26). The correlation coefficient between the index of business regulationand the index of credit risk (corruption index) is 0.56 (0.70).
17

index and higher corruption at time t − 1 decrease the probability that a firm offshores in
that destination at time t.14 None of the business regulations are significantly associated
with the probability of offshoring.15 In contrast, the immigrant network variable is positively
associated with the firm’s extensive margin. In Columns 2-4, we sequentially add firm-level
controls (such as labor productivity) and destination country fixed effects into the specifica-
tion. Furthermore, the network variable is instrumented by using its shift-share prediction, as
described in equation (13).16 The coefficients for the institutional indexes remain unchanged
after controlling for firm’s characteristics and fixed effects. The coefficient estimated on
the network variable via IV is of smaller size but still statistically significant. This finding
suggests an upward bias of OLS potentially due to the omission of an unobserved variable,
which is correlated with the firm’s tendency to hire foreign workers and the propensity to
offshore in general simultaneously. The same coefficients are never statistically significant
when we consider the intensive margin, conditional on the decision to offshore (see Columns
5-8).17
We interpret these results as being consistent with our two main hypotheses. On one hand,
in line with Hypothesis (1), the presence of restrictive employment protection legislation,
high levels of perceived corruption, and the lack of credit coverage and credit solvency proxy
for the institutional costs of offshoring in a country and increase fixed costs, reducing the
probability of offshoring (i.e., firms’ extensive margin). There is no evidence, however, that
they affect the volume of offshoring, conditional on entering a specific foreign market. On
the other hand, consistent with Hypothesis (2), a firm’s immigrant network with the country
of destination helps the firm reduce the overall fixed costs (Peri and Requena-Silvente, 2010),
which, in turn, positively affects the probability of offshoring but not the offshoring volume.
We also find (see last row) a positive association between labor productivity at the firm level
and offshoring. This finding is consistent with our theory prediction and with the prediction
of any Melitz-type theoretical framework.
[Insert Table 4 about here]
To simplify the interpretation of our main results, we now present the results obtained
14To simplify the comparison across coefficients, all the regression tables show standardized coefficientsestimated on the z-score of each explanatory variable.
15This result may be due to the fact that our credit variables are highly correlated with business regulations.If we estimate a simpler specification in which credit and business regulations are entered separately intothe extensive margin equation, we find that they are all significantly and negatively associated with theprobability of offshoring.
16The first-stage results, which are reported in the bottom panel of Table 4, show that the instrument hasa significant positive impact on our network variable.
17Very similar results are obtained by using an alternative measure of the intensive margin, which iscalculated as the share of destination-specific imports in total imports.
18

by using the PCA indexes calculated for each type of regulation. Column 1 of Table 5
includes the coefficients estimated for the index of labor market rigidity, business regulations
and credit risk in the most complete specification for the extensive margin. These results
are in line with the findings obtained with the disaggregated measures: although business
regulations do not affect the extensive margin, an increase in labor market rigidity and
credit risk in the destination country significantly reduces the firm’s bilateral probability of
offshoring.18 Quantitatively, our regression analysis suggests that a one-standard-deviation
increase in the index of labor market rigidity19 at time t − 1 will lead to a 0.007 decrease
in the probability of offshoring, i.e., a 20 percent decrease in the firm’s extensive margin
of offshoring.20 The impact of credit risk is approximately half this amount: the firm’s
bilateral probability of offshoring is reduced by 10 percent at time t when there is a one-
standard-deviation increase in the related index at time t− 1.21 Consistent with the results
reported in Table 4, our measure of corruption negatively affects the probability of offshoring:
a one-standard-deviation increase in the corruption index decreases the extensive margin
by approximately 3 percent.22 Furthermore, the presence of an immigrant network in the
country of destination within the firm at time t− 1 positively affects the extensive margin.
According to the instrumented coefficient, a one-standard-deviation increase in the firm’s
network leads to a 0.010 increase in the probability of offshoring, which corresponds to
an increase of approximately 32 percent in the extensive margin. Notice that the effects
estimated for institutional quality on the probability of offshoring are comparable to the
impact of productivity: a one-standard-deviation increase in the firm’s productivity is in
fact associated with only a 3 percent increase in the probability of offshoring.
18As mentioned in Section 4.1, destinations with high credit risk also tend to have numerous businessregulations, which may explain the lack of significance observed for the index of business regulations. Infact, when we add these indexes separately in the main specification, the estimated coefficients are all negativeand statistically significant. These additional results are available on request from the authors.
19This approximately corresponds to an increase in labor market rigidity from the level of Austria, whoseaverage index is at the median of the distribution, to that of Portugal, whose average index is at the 95thpercentile of the distribution.
20This figure is calculated by dividing our standardized coefficient by 100 for the average firm’s probabilityof offshoring, as reported at the bottom of Table 5.
21This figure approximately corresponds to an increase in credit risk from the level of Germany, whoseaverage index is at the median of the distribution, to that of Macedonia, whose average index is at the 95thpercentile of the distribution.
22This approximately corresponds to an increase in the corruption index from the level of France, whoseaverage index is at the 25th percentile of the distribution, to that of Azerbaijan, whose average index is atthe 90th percentile of the distribution.
19

5.2 Refinements to the main results: the role of interactions
An interesting question to ask is whether the institutional indexes interact with the immi-
grant network variable. This analysis is performed in Table 5.23 The presence of a network
of immigrants may play a stronger role in encouraging offshoring in countries where local
institutions are bad because the network provides information to reduce investment risk or
to increase local knowledge, which is particularly valuable in places with low institutional
protection of investments. Consistent with this hypothesis, we find a positive and significant
interaction coefficient between the network variable and the credit risk index, which suggests
that the positive effect of a network is magnified in destinations characterized by high credit
risk. Our finding is consistent with the notion that an immigrant’s networks may act as
a substitute for institutions that guarantee creditors (i.e., reduce the costs associated with
credit risk) and increase the firm’s bilateral probability of offshoring to a certain destination.
On the other hand, we do not find significant interaction effects between networks and the
other two indices. Furthermore, the measure of corruption interacts negatively with the net-
work variable: the positive effect of networks is in fact reduced in destinations characterized
by high levels of corruption. Networks are therefore less effective in promoting offshoring
in corrupt environments, which may be due to the fact that immigrants, given their insider
knowledge, allow a firm to better identify the risk of corruption and to avoid corrupt places.
To simplify the interpretation of all these findings, we plot the estimated marginal effect
of our network variable on the extensive margin against the whole distribution of the two
indexes of credit risk and corruption. Specifically, the top (bottom) panels of Figure 8 report
the estimated marginal effects of the immigrant network against the standardized index of
credit risk (corruption) by setting the indexes of business regulations, labor market rigidity
and corruption (credit risk) at the 25th, 50th and 75th percentiles of the distribution of these
indexes, respectively.24 These plots confirm the substitutability (complementarity) between
23The interactions of the regulation indexes with the network variable are instrumented by their interac-tions with the shift share prediction described in equation (13).
24The standard errors of these marginal effects are calculated to account for all the covariance termsinvolved in the fully interacted specification, as in the following interaction specification:
Offijmt = α+ γ1φijt−1 + β1index labrigjt−1 + β2index busregjt−1 +
β3index credriskjt−1 + β4index corrupjt−1 + γ2(φijt−1)(index labrigjt−1) + γ3(φijt−1)
(index busregjt−1) + γ4(φijt−1)(index credriskjt−1) + γ5(φijt−1)(index corrupjt−1) +X ′it−1ζ + θi + λj +
ηm + ρt + εijt
The marginal effects of the immigrant network variable φijt−1 reported in the top panels of Figure 8 arecalculated as follows:
dOffijmt
dφijt−1= γ1 + γ2 ¯index labrigjt−1 + γ3 ¯index busregjt−1 + γ4index credriskjt−1 + γ5 ¯index corrupjt−1
20

the network variable and the index of credit risk (the corruption index), given that the im-
pact of the former increases (decreases) as the credit risk index (corruption index) in the
destination country increases for given levels of the other indexes. The estimated coefficients
for our network variable retain their statistical significance along the whole distribution of
the two indexes, i.e., credit risk and corruption.
[Insert Figure 8 about here]
Similar results regarding the interaction effects are obtained in a simpler specification,
in which we include only the variable for the presence of labor employment protection and a
PCA index of credit risk, which is calculated by combining the variables for credit coverage
and resolving insolvency (see column 3 of Table 5).
[Insert Table 5 about here]
Consistent with our two main hypothesis, none of the coefficients discussed in Table 5 is
precisely estimated in the regression for the intensive margins (columns 4-6).25
5.3 Refinements to the main results: alternate measure of net-
works
Our main analysis used the share of workers in the firm who were born in a foreign country as
a measure of the firm’s immigrant network in that country. This section examines whether
our results hold by using alternative definitions of the immigrant network. Specifically,
columns 3 and 4 of Table 6 use the firm’s share of white-collar workers (rather than total
employment) from each specific country at time t − 1 as the network variable. Columns 5
and 6 focus on the share of blue-collar foreign workers. For these estimations, we construct
where ¯index labrigjt−1, ¯index busregjt−1 and ¯index corrupjt−1 are alternatively set at either the 25th, 50thor 75th percentile of the corresponding index distribution. The variance in the marginal effects is calculatedby considering the covariance across all the different indexes included in the main specification.
25We have also investigated whether there exists a significant interaction between the institution variables.Namely, we have analyzed whether the presence of rigidities/imperfections in one dimension is magnifiedby the presence of rigidities in another dimension. The individual effects estimated in this specification areconsistent with the findings reported in column 1, and none of the interactions is significant at standardlevels. These results, which are available on request from the authors, suggest that the linear specificationis reasonably good for our institutional variables and that each factor affects offshoring independently fromthe other.
21

analogous instruments using the predicted immigration of white- and blue-collar workers in
the municipality in which the firm is located at time t−1. The results obtained by using these
two narrower definitions of networks are qualitatively similar to the main results reported
in columns 1 and 2 for comparison purposes. The size of networks significantly affect the
extensive margin of offshoring but not its intensive margin. In terms of the magnitudes of
these coefficients, the positive effect of the network provided by white-collar workers is larger
than that reported for the blue-collar workers. Specifically, a one-standard-deviation increase
in the share of white-collar foreign workers from a specific country doubles the probability
of offshoring in that country, whereas the same effect estimated for the blue-collar foreign
share is an increase of only 15 percent. These estimates suggest that foreign workers in
white-collar occupations (managers, middle managers and professionals) bring with them
destination-specific knowledge that can promote offshoring activities in their country of origin
more effectively than their blue-collar counterparts. Similarly, in columns 7 and 8 of Table
6, we estimate the impact of hiring managers from domestic companies that offshore to a
specific destination country. Our results show that domestic firms that hire managers with
destination-specific offshoring experience are 14 percent more likely to offshore to the same
destination country at time t. However, conditional on offshoring, they do not offshore
larger values. This “poaching” effect on offshoring is consistent with the findings reported
in Mion et al. (2017), according to which export experience gained by managers in previous
firms improves the export performance of these managers’ current firm. All these results
combined together reveal that workers with destination-specific knowledge acquired either
in their country of origin or in previous companies help domestic firms reduce the fixed
costs of offshoring to a specific destination country, especially if they are in a white-collar
occupation.
Our main results on the network variable are also confirmed when we use the base-year
method to address the endogeneity of the network variable instead of relying on the shift-
share instrumental variable approach. In columns 8 and 9, our network variable is simply
measured as the firm-level share of foreign workers from each country in the base-year. This
value is predetermined with respect to the current offshoring decision. The base year is
generally set at 2005, i.e., one year before the beginning of the estimation sample. If a firm
enters the market and imports at any time during our sample period, we treat its first year
of existence as the pre-sample year and focus our estimation on the subsequent changes in
offshoring. The results obtained from this alternative approach confirm the main results i.e.,
larger immigrant networks increase the probability of offshoring in the immigrants’ countries
of origin, but they do not affect the offshoring volume. The size of the coefficient estimated
on the extensive margin is twice as large as that obtained in the main analysis: a one-
22

standard-deviation increase in the base year share of foreign workers increases the current
bilateral probability of offshoring by 60 percent.
Finally, columns 11 and 12 of Table 6 focus on the bilateral share of foreign workers in
the municipality in which the firm is located at time t− 1 rather than the number of foreign
workers in the firm. The instrument is still the shift-share prediction at the municipality
level. This specification emphasizes the fact that immigrants in the municipality can be a
channel for information, even if they do not work in the firm, by promoting the development
of informal networks with foreign workers employed in other companies in the local labor
market and indirectly with their countries of origin. The results obtained with this broader
measure of networks are almost identical to the baseline results: a one-standard-deviation
increase in the bilateral share of foreign workers within the municipality at year t−1 increases
the extensive margin by 33 percent, and the corresponding effect on the intensive margin is
not statistically different from 0. Ultimately, the results in Table 6 demonstrate that our
findings on the network effects are robust to a variety of alternative definitions.
[Insert Table 6 about here]
5.4 Additional sensitivity analysis
In this section, we evaluate how the coefficients estimated for the institution and network
variables change when we focus on specific sub-samples of firms. We also evaluate how sen-
sitive the results are to alternative specifications of the index measuring institutions. To
simplify the presentation of these sensitivity exercises, we discuss only the results obtained
from the specification used in columns 1 and 5 of Table 5, i.e., the one featuring the PCA
institutional indexes (capturing labor market rigidity, business regulations, credit risk and
corruption) and the network variable.
5.4.1 Non-linear specifications
Our model predicts that lower costs associated with institutional features of credit, business
and labor markets (and stronger networks) in a foreign country are positively associated
with the firms’ extensive margin of offshoring. The exact form of this positive association
is unclear, however. To explore the existence of non-linearities in the effects discussed so
far, we consider an additional specification in which we add the squares of the institutional
indexes and of the network variable. The results are reported in the first two columns
23

Table 7. Our main results are confirmed: in all specifications, higher levels of labor market
rigidity, credit risk and corruption in the destination market negatively influence the firm’s
bilateral probability of offshoring, whereas stronger networks are positively related to this
probability. We estimate a convex (concave) relationship for the labor rigidity and the
credit risk indexes (the immigrant network). We also find suggestive evidence in support of
a concave relationship between the extensive margin of offshoring and the corruption index.
As shown in the main specification, the results for the intensive margin reported in the
second column of the same table confirm that offshoring volumes are not affected by either
networks or institutions, conditional on offshoring.
5.4.2 Export outcomes
Because some, but not all, of the determinants of offshoring costs may also affect the costs
of exporting to a country, we now explore whether our institutional indexes and immigrant
network variable affect firms’ export behavior. Even in this case, we distinguish between
extensive and intensive margins of exporting. The results are reported in the last two columns
of Table 7 and suggest that the firm’s probability of exporting to a specific destination
market and its export volumes are not affected by the level of labor market rigidity in the
destination country; however, they are negatively influenced by the level of credit risk and
corruption. Consistent with our expectations, when shifting the focus from offshoring to
firms’ export decisions, the destination country’s credit risk still matters (as credit risk may
influence the relation between the exporter and buyers), while the destination country’s
labor market institutions do not affect exports (because labor costs and rigidities should
not affect the behavior of buyers of exported goods). Corruption negatively affects both the
extensive and intensive margin of exporting, whereas business regulations are not relevant for
export decisions. Furthermore, our network variable positively affects the extensive margin
of exporting. This last finding is consistent with the previous trade literature that documents
the importance of immigrants’ ability to promote trade (Gould, 1994; Head and Ries, 1998;
Rauch and Trindade, 2002; Briant et al., 2014; Peri and Requena-Silvente, 2010). Overall,
immigrant networks are important for offshoring and exports and therefore serve to reduce
credit risks.Labor market institutions, instead, affect only offshoring decisions, as labor is an
important input of imported offshore goods but does not play a direct role in exports.
[Insert Table 7 about here]
24

5.4.3 Industry-specific results
As the large increase in offshoring has been driven by firms’ goal of cutting labor costs, we
test whether offshoring decisions are more sensitive to the country-specific characteristics
analyzed above in sectors where labor is a larger share of total costs (i.e., labor-intensive
sectors). The first four columns of Table 8 report the response of offshoring to institutional
factors for labor- and capital-intensive industries separately. Here, labor- (capital-) intensive
industries are defined as those with an average capital intensity below (above) the mean in the
midpoint of our sample (i.e., 2009). This definition is used to investigate whether offshoring
firms in labor-intensive industries tend to react more strongly to changes in destination
countries’ institutional costs or networks. As expected, we find that for firms in labor-
intensive industries, the probability of offshore is more responsive to the destination country’s
labor market rigidity than it is for firms in capital-intensive industries. Firms in labor-
intensive industries also seem to be more reactive to changes in credit risk than firms in other
industries. The point estimates imply that a one-standard-deviation increase in labor market
rigidity in a destination country leads to a 48-percent decrease in the probability of offshoring
in that country for labor-intensive firms, whereas a one-standard-deviation increase in credit
risk decreases the same probability by half as much. The effects on the extensive margin
for capital-intensive firms are much smaller, a 2.5 percent decrease and an approximately 3
percent decrease, respectively. The coefficient estimated for the business regulations index
is never statistically significant, and the magnitudes involved in the corruption and network
variables are comparable across the two groups of industries.
The sample we used for the baseline estimates included only pure manufacturing firms
because our measure of offshoring (using imported inputs) may be not entirely relevant if
applied to the service industry (Hummels et al., 2014b). However, former manufacturing
firms may offshore all of their production activities and keep only service-oriented tasks
in Denmark. These “factory-less goods producing” firms (FGPFs) are companies that no
longer directly control the production and assembly of goods in-house but are still involved
in design, R&D, engineering, supervision of third-party production, branding, marketing and
distribution (Bernard and Fort, 2015). The number of firms switching from manufacturing to
service industries is non-negligible and can explain approximately half of the recent decline
in Danish manufacturing employment (Bernard et al., 2017). This type of extreme offshoring
acts as an incentive to check whether the results are similar if estimated for a sample of service
firms. In line with the main analysis performed for the manufacturing sector, for service firms,
we find that the estimated coefficients for our index of labor market rigidity, credit risk and
corruption are negative and statistically significant for the extensive margin of offshoring, as
25

reported in the last two columns of Table 8. In addition, the results for business regulations,
the network variable and its interaction with institutions are consistent with those obtained
for the sample of manufacturing firms. This result suggests that performing the analysis on
firms in the service industry does not change the conclusions of the main analysis.
[Insert Table 8 about here]
5.4.4 Sample-specific results
It may be argued that the imports of non-exporting firms are less likely to feature actual
offshoring activities relative to exporting firms’ imports. To check whether our measure of
offshoring is somehow weakened by the presence of non-exporting firms, in Table 9, we re-
estimate our main regression by excluding these firms from the sample. The results obtained
from this refinement confirm that the estimated coefficient on all of our variables of interest
are qualitatively very similar to the ones estimated in the main analysis.
Another concern is that our sample of destination countries is very heterogeneous, e.g., in
terms of the enforcement capabilities of their political institutions (Acemoglu et al., 2005).
Therefore, the response of offshoring to institutional costs or networks may not not be
homogeneous across macro-geographical groups. To address this concern, we split the sample
into developed and developing destination countries. The results obtained from these sub-
samples are reported in the last four columns of Table 9. It appears that the impact of
labor market rigidity, credit risk, corruption and networks on offshoring is indeed stronger
for developing destination markets than for developed countries. In the first group, the
institutional quality is a more important concern, and variation of this quality may generate
a stronger offshoring response. A one-standard-deviation increase in the index of credit risk,
for example, triggers a 36 (17) percent increase in the extensive margin of offshoring if we
focus on developing (developed) countries as destination markets.
[Insert Table 9 about here]
5.4.5 Offshoring measures
We now test the consistency of our results by using alternative measures of offshoring in
Table 10. First, in columns 1 and 2, we use a broad offshoring measure, which is defined as
the total value of imports by a firm in a given year, regardless of the industry. As discussed in
the data section, this measure is not our preferred measure of offshoring; however, the results
26

using this definition of offshoring are similar to our baseline findings, even if the coefficients
are higher. For example, a one-standard-deviation increase in credit risk in a country leads
to a 20 percent decrease in the probability that a firm will offshore there (using the narrow
definition of offshoring, the effect was 10 percent), but it does not affect the log of offshoring
volumes, conditional on offshoring.
Second, we construct a new measure of offshoring using a completely different dataset
compiled by the National Bank of Denmark (Esperian). This dataset includes firm-level
information on outward FDI activity. Specifically, this variable identifies countries in which
Danish firms have majority-owned foreign affiliates. Using this information, we construct an
extensive margin offshoring variable that measures whether a Danish firm has any foreign
affiliates abroad. The benefit of using this approach is that it specifically measures the
firm’s foreign activities. However, this measure does not measure offshoring to foreign arms’
length suppliers that are outside the boundaries of the firm. Moreover, the Esperian data
do not indicate whether a particular import transaction originates from a controlled affiliate
or an uncontrolled third party. We are therefore able to check the validity of our main
results only in relation to the extensive margin of offshoring. Finally, the Esperian data are
available only for a sub-sample of our data. The third column of Table 10 reports the results
using this alternative FDI-based offshoring measure. Consistent with our baseline results,
we find that credit risk negatively affects firms’ bilateral probability of offshoring, whereas
the immigrant network variable has a positive (although marginally significant) effect on
the extensive margin. The magnitudes involved are, however, much smaller than those of
the baseline results. Furthermore, the coefficients on the index of labor market rigidity
and corruption are only marginally significant. The signs of all these coefficients, however,
confirm the baseline results.
[Insert Table 10 about here]
6 Conclusions
This paper explores how institutions and networks affect firms’ offshoring outcomes by using
a large and representative sample of manufacturing firms in Denmark over the 2006-2012
period. Our empirical analysis shows that at least two regulatory areas attract offshoring
and affect its extensive margin. A lack of credit coverage, poor protection of creditors’
property rights and high levels of corruption are strongly associated with a lower probability
of offshoring for a firm. Accordingly, regulations of the destination market that reduce credit
risks and corruption tend to increase firms’ propensity to offshore. Conversely, regulations
27

that increase labor market rigidity have a negative impact on firms’ offshoring probability
in that country, which may be because stringent employment protection measures increase
firms’ labor costs, and this negatively affects the extensive margin of offshoring. The impact
of these regulations on firms’ intensive margins, conditional on offshoring, is instead never
statistically significant. This result corroborates the hypothesis that institutions affect the
fixed costs (rather than the variable costs) of accessing a foreign market. Our results also
suggest that a firm’s network of foreign workers has an additional fixed-cost-reducing effect
that increases that firm’s probability of offshoring. Interestingly, we also find that the positive
impact of networks on offshoring is magnified (attenuated) in destination markets with high
levels of credit risk (corruption). A network of people knowledgeable about the country
may substitute for some of the credit-protection institution in that country. It may also act
to increase the knowledge of local corruption, further discouraging firms from offshoring in
highly corrupt countries.
28

References
Acemoglu, D., Johnson, S., and Robinson, J. A. (2005). Institutions as a Fundamental
Cause of Long-Run Growth. In Aghion, P. and Durlauf, S., editors, Handbook of Economic
Growth, volume 1 of Handbook of Economic Growth, chapter 6, pages 385–472. Elsevier.
Antras, P., Desai, M. A., and Foley, C. F. (2009). Multinational Firms, FDI Flows, and
Imperfect Capital Markets. The Quarterly Journal of Economics, 124(3):1171–1219.
Barba Navaretti, G., Bugamelli, M., Schivardi, F., Altomonte, C., Horgos, D., and Maggioni,
D. (2011). The Global Operations of European Firms - The Second EFIGE Policy Report.
Number 581 in Blueprints. Bruegel.
Bernard, A. B. and Fort, T. C. (2015). Factoryless Goods Producing Firms. American
Economic Review, 105(5):518–23.
Bernard, A. B. and Jensen, J. B. (1999). Exceptional Exporter Performance: Cause, Effect,
or Both? Journal of International Economics, 47(1):1 – 25.
Bernard, A. B., Smeets, V., and Warzynski, F. (2017). Rethinking Deindustrialization.
Economic Policy, 32(89):5.
Briant, A., Combes, P.-P., and Lafourcade, M. (2014). Product Complexity, Qual-
ity of Institutions and the Pro-Trade Effect of Immigrants. Sciences Po publications
info:hdl:2441/781v6i5nuc9, Sciences Po.
Card, D. (2005). Is the New Immigration Really so Bad? The Economic Journal,
115(507):F300–F323.
Djankov, S., Porta, R. L., de Silanes, F. L., and Shleifer, A. (2002). The Regulation of Entry.
The Quarterly Journal of Economics, 117(1):1–37.
Gould, D. M. (1994). Immigrant Links to the Home Country: Empirical Implications for
U.S. Bilateral Trade Flows. The Review of Economics and Statistics, 76(2):302–16.
Greenaway, D. and Kneller, R. (2004). Exporting and Productivity in the United Kingdom.
Oxford Review of Economic Policy, 20(3):358–371.
Head, K. and Ries, J. (1998). Immigration and Trade Creation: Econometric Evidence from
Canada. Canadian Journal of Economics, 31(1):47–62.
29

Hummels, D., Jorgensen, R., Munch, J., and Xiang, C. (2014a). The Wage Effects of Off-
shoring: Evidence from Danish Matched Worker-Firm Data. American Economic Review,
104(6):1597–1629.
Hummels, D., Jorgensen, R., Munch, J., and Xiang, C. (2014b). The Wage Effects of Off-
shoring: Evidence from Danish Matched Worker-Firm Data. American Economic Review,
104(6):1597–1629.
Kraay, Aart Kaufmann, D. M. M. (2010). The worldwide governance indicators : methodology
and analytical issues. The World Bank.
Melitz, M. J. (2003). The Impact of Trade on Intra-Industry Reallocations and Aggregate
Industry Productivity. Econometrica, 71(6):1695–1725.
Mion, G., Opromolla, L. D., and Sforza, A. (2017). The diffusion of knowledge via managers’
mobility. CESifo Working Paper Series No. 6256.
Olney, W. W. (2013). A Race to the Bottom? Employment Protection and Foreign Direct
Investment. Journal of International Economics, 91(2):191 – 203.
Ottaviano, G. I., Peri, G., and Wright, G. C. (2018). Immigration, Trade and Productivity
in Services: Evidence from U.K. Firms. Journal of International Economics, 112:88 – 108.
Peri, G. and Requena-Silvente, F. (2010). The Trade Creation Effect of Immigrants: Evi-
dence from the Remarkable Case of Spain. Canadian Journal of Economics, 43(4):1433–
1459.
Rauch, J. E. and Trindade, V. (2002). Ethnic Chinese Networks In International Trade. The
Review of Economics and Statistics, 84(1):116–130.
Sofronis K. Clerides, Saul Lach, J. R. T. (1998). Is Learning by Exporting Important?
Micro-Dynamic Evidence from Colombia, Mexico, and Morocco. The Quarterly Journal
of Economics, 113(3):903–947.
Viscusi, W., Harrington, J. E., and Vernon, J. M. (2005). Economics of Regulation and
Antitrust, 4th Edition, volume 1. The MIT Press, 4 edition.
30

Figure 1: Bilateral share of foreign workers and its instrument
0.0
5.1
.15
Sh
are
of
fore
ign
wo
rkw
ers
0 .01 .02 .03 .04 .05 .06 .07 .08 .09 .1Predicted share of foreign workwers
Notes: The bilateral share of foreign workers in a given municipality and yearis reported on the vertical axis. The predicted bilateral share (IV) of foreignworkers in a given municipality and year is reported on the horizontal axis.
31

Figure 2: Sectors with the largest share of offshoring firms on average (2006-2012)
0.1
.2.3
.4Sh
are
of o
ffsho
ring
firm
s wi
thin
indu
stry
Motor Vehicle
s
Machinery
and Equip.
Textiles
Electrica
l Equipment
Plastic a
nd Rubber
Wholesale (M
otor Vehicle
s)Food
Fabricated M
etal
Basic M
etal
Other Manufactu
ring
Furniture
Wholesale (e
xcl. M
otor Vehicle
s)
Notes: Authors’ calculation using data from the Danish Integrated Database for Labor Market Re-search.
32

Figure 3: Destination countries with the largest share of offshoring firms on average (2006-2012)
0.1
.2.3
Shar
e of
offs
horin
g fir
ms
Germany
Sweden
Norway
Great Brita
in
Netherlands
France
Finland
BelgiumIta
ly
Poland
Notes: Authors’ calculation using data from the Danish Integrated Database for Labor Market Re-search.
33

Figure 4: Regulations and corruption by destination country in 2006 and 2012
AE
AG
ALAM
AO
ARAT
AU
AZBE
BF
BGBI
BJ
BN
BO
BTBW
BY
BZ
CA
CG
CHCI
CL
CM
CO
CRCV
CZ
DE
DJ
DM
DO
DZEC
EE
EG
ES
ET
FIFJ
FRGA
GB
GD
GE
GHGM
GN
GQGR
GTGW
HK
HN
HU
IE
IL
IQ
IR
ISITJM
JO
KE
KG
KN
KR
KW
KZ
LA
LB
LC
LK
LS
LT
LV
MA
MD
MGML
MN
MR
MU
MY
NA
NE
NI NLNO
NP
NZOM
PAPE
PH
PL
PTPY
RS
SA
SC
SESG
SK
SN
ST
SV
SY
SZ
TDTG
TH
TJ
TNTR
TT
TZUA
UG
UYUZ
VC
VE
VN
YE
ZA
ZM
-2-1
01
2In
dex
of la
bor m
arke
t rig
idity
, 201
2
-2 -1 0 1 2Index of labor market rigidity, 2006
AE
AGALAMAR
AT
AU
AZBE
BF
BG
BIBJ
BO
BT
BWBZ
CACH
CI
CL
CM
CO
CRCV
CZ
DEDJ
DMDO
DZEC
EE
EG
ES
ET
FI
FJ
FR
GA
GBGDGE
GH
GM
GN
GQ
GRGT
HK
HNHUIE
IL
IR
IS
IT JM
JO
KEKG
KN
KR
KW
KZ
LA
LB
LC
LK
LS
LTLV
MAMD
MG
MLMN
MR
MUMY
NA
NE
NI
NLNO
NP
NZOM
PAPE
PH
PL
PT
PY
RSSA
SC
SESG
SK
SN
ST
SVSYSZTH
TJ
TNTR
TT
TZUG
UY
UZ
VC
VN
YEZA
ZM
-2-1
01
2In
dex
of b
usin
ess
regu
latio
ns, 2
012
-2 -1 0 1 2Index of business regulations, 2006
AEAG
AL
AM
AO
ARAT
AU
AZ
BE
BF
BG
BIBJ
BNBOBT
BW
BY
BZ
CA
CG
CHCI
CL
CM
CO
CR
CV
CZ
DE
DJDM
DODZ
EC
EE
EG
ES
ET
FI
FJFR
GA
GB
GD
GE
GH
GMGNGQ
GR
GTGW
HK
HN
HU
IE
IL
IQ
IR
IS
IT
JM
JOKE
KG
KN
KR
KW
KZ
LA
LB
LC
LK
LS
LT
LVMAMD
MGMLMNMR
MU
MY
NA
NE
NI
NL
NO
NP
NZ
OMPA
PE
PH
PLPT
PY
RS
SASC
SESG
SK
SN
ST
SV
SYSZ
TD
TG
TH
TJTN
TR
TT
TZUA
UG
UY
UZ
VCVE
VNYE
ZA
ZM
-4-2
02
Inde
x of
cre
dit r
isk, 2
012
-4 -2 0 2Index of credit risk, 2006
ALAM
AO
AR
AZ
BF
BG
BI
BJ
BN
BO
BT
BY
BZ
CFCG
CI
CM
CO
CR
CV
CZ
DJ
DM
DO
DZECEGET
FJ
GA
GD GE
GH
GM
GN
GQ
GR
GT
GW
HN
HT
HU
IL
IQ
IR
IT
JM
JO
KE KGKH
KM
KN
KR
KW
KZLA
LB
LK
LS
LTLV
MAMDMG
ML
MN
MR
MU
MW
MY
MZ
NA
NENINP
OM
PAPEPH
PL
PY
RS
RW
SA
SC
SK
SL
SNSRSTSV
SY
SZ
TD
TG
TH
TJ
TNTR
TT
TZ
UAUG
UZ
VC
VE
VN
YE
ZAZM
ZW
-1-.5
0.5
11.
5Co
rrupt
ion
inde
x, 2
012
-1 -.5 0 .5 1 1.5Corruption index, 2006
Notes: The index of labor market rigidity is estimated by combining all the labor regulations (limitson fixed term contracts; limits on working days per week; employment protection measures; and theminimum wage) with principal component analysis. The index of business regulations is estimatedby combining all the business regulations (the time it takes to open a business; the time it takes toregister property; the time it takes to pay taxes; the time it takes to export goods) with a principalcomponent analysis. The index of credit risk is estimated by combining all the credit regulations (100-credit coverage; 10-investor protection; enforcing contracts; 100-resolving insolvency) with principalcomponent analysis. The corruption index is the inverse of the estimated control of the corruptionindicator.
34

Figure 5: Destination countries with the highest regulation and corruption indexes
0.5
11.
52
Inde
x of
labo
r mar
ket r
igid
ity
NP NE LR HN TZ EE ZA UA PY SN ES LV
0.5
11.
52
Inde
x of
bus
ines
s re
gula
tions
VE UA TG TD HT GW BN AO IQ CG BO KZ
0.5
11.
52
Inde
x of
cre
dit r
isk
HT ST RW LA CV AO BF UA VE TD PH IQ
0.5
11.
5Co
rrupt
ion
inde
x
GQ TD ZW IQ AO SD KG KH HT LA CF BI
Notes: The index of labor market rigidity is estimated by combining all the labor regulations (limitson fixed term contracts; limits on working days per week; employment protection measures; and theminimum wage) with a principal component analysis. The index of business regulations is estimatedby combining all the business regulations (the time it takes to open a business; the time it takes toregister property; the time it takes to pay taxes; the time it takes to export goods) with a principalcomponent analysis. The index of credit risk is estimated by combining all the credit regulations (100-credit coverage; 10-investor protection; enforcing contracts; 100-resolving insolvency) with a principalcomponent analysis. The corruption index is the inverse of the estimated control of the corruptionindicator.
35

Figure 6: Extensive margin of offshoring, institutions and network
0.1
.2.3
.4.5
.6E
xte
nsiv
e m
arg
in o
f o
ffsh
orin
g
-3 -2 -1 0 1 2Index of labor market rigidity
0.1
.2.3
.4.5
.6E
xte
nsiv
e
ma
rgin
of
off
sh
orin
g
-2 -1 0 1 2Index of business regulations
0.1
.2.3
.4.5
.6E
xte
nsiv
e
ma
rgin
of
off
sh
orin
g
-4 -2 0 2Index of credit risk
0.1
.2.3
.4E
xte
nsiv
e m
arg
in o
f o
ffsh
orin
g
-3 -2 -1 0 1 2Corruption index
0.1
.2.3
.4E
xte
nsiv
e
ma
rgin
of
off
sh
orin
g
0 .005 .01 .015 .02Network
Notes: The share of firms that offshore at the year-destination level are reported on the vertical axis.The index of regulations or the network variable at the year-destination level are reported on thehorizontal axis. A network is measured as the firm-level bilateral share of foreign workers.
36

Figure 7: Intensive margin of offshoring, institutions and networks
05
10
15
20
Inte
nsiv
e m
arg
in o
f o
ffsh
orin
g
-3 -2 -1 0 1 2Index of labor market rigidity
05
10
15
20
Inte
nsiv
e m
arg
in o
f o
ffsh
orin
g
-2 -1 0 1 2Index of business regulations
05
10
15
20
Inte
nsiv
e m
arg
in o
f o
ffsh
orin
g
-4 -2 0 2Index of credit risk
05
10
15
20
Inte
nsiv
e m
arg
in o
f o
ffsh
orin
g
-3 -2 -1 0 1 2Corruption index
05
10
15
20
Inte
nsiv
e m
arg
in o
f o
ffsh
orin
g
0 .005 .01 .015 .02Network
Notes: The average intensive margin of offshoring at the year-destination level is reported on thevertical axis. The index of regulations or the network variable at the year-destination level are reportedon the horizontal axis. A network is measured as the firm-level bilateral share of foreign workers.
37
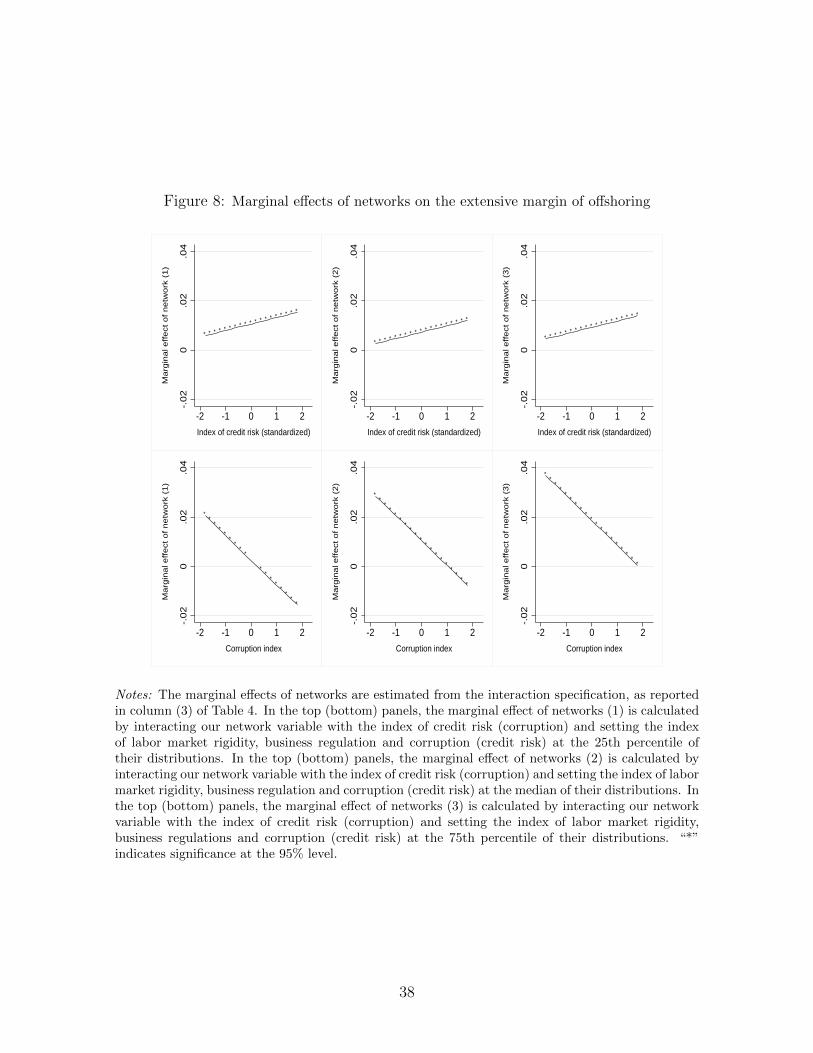
Figure 8: Marginal effects of networks on the extensive margin of offshoring
* * * * * * * * * * * * * * * * * * *
-.0
20
.02
.04
Marg
inal effect of netw
ork
(1)
-2 -1 0 1 2
Index of credit risk (standardized)
* * * * * * * * * * * * * * * * * * *
-.0
20
.02
.04
Marg
inal effect of netw
ork
(2)
-2 -1 0 1 2
Index of credit risk (standardized)
* * * * * * * * * * * * * * * * * * *
-.0
20
.02
.04
Marg
inal effect of netw
ork
(3)
-2 -1 0 1 2
Index of credit risk (standardized)
**
**
**
**
*
**
**
**
**
-.0
20
.02
.04
Marg
inal effect of netw
ork
(1)
-2 -1 0 1 2
Corruption index
**
**
**
**
**
**
**
**
**
*
-.0
20
.02
.04
Marg
inal effect of netw
ork
(2)
-2 -1 0 1 2
Corruption index
**
**
**
**
**
**
**
**
**
*
-.0
20
.02
.04
Marg
inal effect of netw
ork
(3)
-2 -1 0 1 2
Corruption index
Notes: The marginal effects of networks are estimated from the interaction specification, as reportedin column (3) of Table 4. In the top (bottom) panels, the marginal effect of networks (1) is calculatedby interacting our network variable with the index of credit risk (corruption) and setting the indexof labor market rigidity, business regulation and corruption (credit risk) at the 25th percentile oftheir distributions. In the top (bottom) panels, the marginal effect of networks (2) is calculated byinteracting our network variable with the index of credit risk (corruption) and setting the index of labormarket rigidity, business regulation and corruption (credit risk) at the median of their distributions. Inthe top (bottom) panels, the marginal effect of networks (3) is calculated by interacting our networkvariable with the index of credit risk (corruption) and setting the index of labor market rigidity,business regulations and corruption (credit risk) at the 75th percentile of their distributions. “*”indicates significance at the 95% level.
38

Tab
le1:
Pre
-tre
nds
test
s
∆E
xt.
Mar
gin
Off
shor
ing
∆In
t.M
argi
nO
ffsh
orin
g∆
Shar
eof
Non
-EU
Img
(199
5-20
00)
(199
5-20
00)
(200
6-20
12)
(1)
(2)
(3)
∆N
on-E
UIm
gIV
(200
6-20
12)
0.63
822
.722
0.88
5***
(2.6
15)
(41.
863)
(0.2
33)
N15
,425
15,4
2515
,425
R-s
q0.
712
0.71
60.
070
Notes:
Inco
lum
ns
1an
d2
the
dep
end
ent
vari
ab
leis
the
pre
-sam
ple
tren
d(i
.e.
the
chan
ge
from
1995
to2000)
ind
esti
nati
on
-sp
ecifi
coff
shor
ing
outc
omes
atth
em
un
icip
ali
tyle
vel.
Inco
lum
n3
the
dep
enden
tva
riab
leis
the
lon
g-r
un
chan
ge
(2006
to20
12)
inth
eb
ilat
eral
shar
eof
fore
ign
work
ers
at
the
mu
nic
ipali
tyle
vel.
Reg
ress
ion
sals
oin
clu
de
mu
nic
ipali
tyfi
xed
effec
ts.
Sta
nd
ard
erro
rsin
par
enth
eses
are
clu
ster
edat
the
mu
nic
ipali
tyle
vel.
Sig
nifi
cance
leve
ls:
***1%
,**5%
,*10%
.S
ign
ifica
nce
leve
ls:
***1
%,
**5%
,*1
0%.
39

Tab
le2:
Des
crip
tive
stat
isti
cs
Vari
able
sD
efinit
ion
Tota
l
Tra
de
vari
able
sM
ean
Sd
Exte
nsi
vem
argi
nof
offsh
orin
g1,
ifth
efi
rmoff
shor
es0.
033
0.17
8In
ten
sive
mar
gin
ofoff
shor
ing
log
ofd
esti
nat
ion
spec
ific
offsh
orin
gvo
lum
es10
.176
3.12
9E
xte
nsi
vem
argi
nof
exp
orti
ng
1,if
the
firm
exp
orts
0.03
60.
204
Inte
nsi
vem
argi
nof
exp
orti
ng
log
ofd
esti
nat
ion
-sp
ecifi
cex
por
tvo
lum
es10
.133
2.50
9D
esti
nat
ion
sto
tal
nu
mb
erof
offsh
orin
gd
esti
nat
ion
s4.
260
6.55
0N
etw
ork
firm
-lev
elb
ilat
eral
shar
eof
wor
kers
from
the
offsh
orin
gd
esti
nat
ion
0.00
10.
009
Acc
ounti
ng
vari
able
s:M
ean
Sd
Lab
orp
rod
uct
ivit
ylo
gof
sale
sp
erem
plo
yee
14.7
130.
644
Nu
mb
erof
emp
loye
esfi
rmsi
zein
full
-tim
eeq
uiv
alen
ts66
.215
202.
630
Cap
ital
inte
nsi
tylo
gof
cap
ital
stock
per
emp
loye
e13
.205
1.11
5M
ult
i1,
ifth
efi
rmis
am
ult
i-es
tab
lish
men
tco
mp
any
0.28
10.
449
For
eign
1,if
the
firm
isfo
reig
now
ned
0.01
10.
088
IDA
Vari
able
s:M
ean
Sd
For
eign
ers
non
-dan
ish
emp
loye
esas
ap
rop
orti
onof
all
emp
loye
es0.
063
0.07
4M
ale
mal
eem
plo
yees
asa
pro
por
tion
ofal
lem
plo
yees
0.74
20.
176
Age
emp
loye
es’
aver
age
age
44.1
923.
316
Skil
l0em
plo
yees
wit
hco
mp
uls
ory
edu
cati
onas
ap
rop
orti
onof
all
emp
loye
es0.
267
0.13
2S
kil
l1em
plo
yees
wit
ha
seco
nd
ary
edu
cati
onas
ap
rop
orti
onof
all
emp
loye
es0.
619
0.12
6S
kil
l2em
plo
yees
wit
ha
pos
t-se
con
dar
y/
tert
iary
edu
cati
onas
ap
rop
orti
onof
all
emp
loye
es0.
113
0.10
5T
enu
reav
erag
eem
plo
yees
’te
nu
re7.
798
3.40
8W
ork
exp
erie
nce
emp
loye
es’
aver
age
wor
kex
per
ien
ce19
.679
2.80
3M
anag
ers
man
ager
sas
ap
rop
orti
onof
all
emp
loye
es0.
085
0.07
1M
idd
lem
anag
ers
mid
dle
man
ager
sas
ap
rop
orti
onof
all
emp
loye
es0.
213
0.17
6B
lue
coll
ars
blu
e-co
llar
wor
kers
asa
pro
por
tion
ofal
lem
plo
yees
0.70
10.
192
N1,
403,
850
Num
ber
of
firm
s2,
100
Notes:
All
des
crip
tive
stati
stic
sare
calc
ula
ted
as
aver
ages
over
the
2006-2
012
per
iod
.T
rad
ean
dac
cou
nti
ng
vari
able
sar
ein
DK
Kan
dre
al
term
s,w
ith
2005
as
the
base
year.
40

Table 3: Labor, business and credit regulations
Mean Sd Min Max
Labor regulationsLimits on fixed term contracts 0.388 0.487 0 1Limits on working days per week 1.073 0.319 0 2Employment protection measures 0.486 0.499 0 1Minimum wage 0.305 0.251 0 1.779Index of labor market rigidity -0.067 1.086 -2.702 2Business regulationsTime to open a business 33.083 34.976 0.500 260Time to register property 59.878 65.847 1 398Time to pay taxes 293.562 221.891 0 2085Time to export 23.633 16.298 6 102Index of business regulations -0.069 1.072 -1.601 2Credit regulations100-Credit coverage 75.952 33.664 0 10010-Investor protection 4.985 2.463 0 10Enforcing contracts 28.925 12.666 0.100 87.6100-Resolving insolvency 64.546 23.708 8.800 100Index of credit risk -0.128 1.286 -3.552 1.900Corruption index 0.018 1.013 -2.385 2.465
N 1,403,850
Notes: Means and standard deviations are calculated as averages over the 2006-2012 period. Laborregulations are the following: i) Whether fixed contracts for permanent tasks are forbidden or not;ii) Maximum number of working days weekly (calculated as 7-maximum number of working days);iii) Notification/consultation with a third party to dismiss redundant workers; iv) Minimum wages,ratio of average wages. The index of labor market rigidity is estimated with a principal componentanalysis using all labor regulations. Business regulations are the following: i) Time required to starta business (days); ii) Time required to register property (days); iii) Time to prepare and pay taxes(hours); iv) Time to import (days); v) Time to export (days). The index of business regulations isestimated with a principal component analysis by using all business regulations. Credit regulationsare the following: i) Lack of credit coverage=100-Private credit bureau coverage (percent of adults);ii) Lack of investor protection=10-Business extent of disclosure index (0=less disclosure to 10=moredisclosure); iii) Enforcing contracts, cost (percent of claims); iv) Rate of insolvency=100-recoveryrate (cents on the dollar). The index of credit risk is estimated with a principal component analysisusing all credit regulations. The corruption index is the inverse of the estimated control of corruptionindicator.
41

Tab
le4:
Inst
ituti
ons,
net
wor
ks
and
firm
offsh
orin
g
Exte
nsi
ve
Marg
inIn
tensi
ve
Marg
in[1
][2
][3
][4
][5
][6
][7
][8
]
Lab
or
regula
tions
Lim
its
onfi
xed
term
contr
actst−
10.
0030
540.
0019
820.
0021
260.
0025
19–0
.046
591
–0.0
5997
2–0
.057
303
–0.0
5533
1(0
.002
233)
(0.0
0376
8)(0
.003
893)
(0.0
0385
4)(0
.027
879)
(0.0
3788
3)(0
.038
522)
(0.0
3863
9)L
imit
sw
orkin
gd
ays
per
wee
kt−
1–0
.000
009
0.00
0095
0.00
0212
0.00
0384
0.02
1727
0.02
2606
0.02
4306
0.02
5662
(0.0
0026
1)(0
.004
173)
(0.0
0431
8)(0
.004
313)
(0.0
1474
9)(0
.021
384)
(0.0
2204
6)(0
.022
806)
Em
plo
ym
ent
pro
tect
ion
mea
sure
s t−
1–0
.011
524*
**–0
.010
359*
**–0
.010
764*
**–0
.004
517*
**–0
.019
111
–0.0
1272
4–0
.010
615
0.07
9662
(0.0
0026
6)(0
.000
370)
(0.0
0038
6)(0
.001
059)
(0.0
1419
2)(0
.015
033)
(0.0
1514
9)(0
.030
693)
Min
imu
mw
age t−
10.
0026
94–0
.003
026
–0.0
0315
6–0
.002
490
0.03
1214
0.04
2080
0.03
7917
0.04
2466
(0.0
0216
5)(0
.002
754)
(0.0
0285
2)(0
.002
780)
(0.0
3132
8)(0
.041
490)
(0.0
4241
8)(0
.041
427)
Busi
ness
regula
tions
Tim
eto
open
abu
sin
ess t−
1–0
.001
474
–0.0
0148
7–0
.001
962
–0.0
0294
50.
0025
620.
0080
02–0
.001
684
0.00
0050
(0.0
0102
2)(0
.002
761)
(0.0
0291
2)(0
.003
052)
(0.0
3682
1)(0
.080
203)
(0.0
7849
2)(0
.079
155)
Tim
eto
regi
ster
pro
per
tyt−
10.
0025
600.
0030
400.
0029
120.
0030
28–0
.013
361
–0.0
2144
9–0
.023
402
–0.0
2351
0(0
.002
249)
(0.0
0376
4)(0
.003
883)
(0.0
0382
7)(0
.019
884)
(0.0
3602
5)(0
.029
861)
(0.0
2992
1)T
ime
top
ayta
xest−
10.
0012
040.
0014
810.
0017
580.
0018
480.
0169
480.
0046
640.
0050
530.
0046
73(0
.001
191)
(0.0
0263
7)(0
.002
727)
(0.0
0264
3)(0
.022
342)
(0.0
3191
3)(0
.034
325)
(0.0
3354
0)T
ime
toex
por
t t−
1–0
.003
627
–0.0
0414
6–0
.004
347
–0.0
0276
60.
0019
680.
0553
280.
0569
190.
0603
22(0
.002
180)
(0.0
0267
4)(0
.002
768)
(0.0
0270
3)(0
.042
805)
(0.0
5163
5)(0
.050
651)
(0.0
5120
2)C
redit
regula
tions
100-
cred
itco
vera
get−
1–0
.006
327*
**–0
.005
607*
**–0
.005
847*
**–0
.002
301*
**0.
0294
780.
0385
180.
0443
380.
0433
36(0
.000
410)
(0.0
0062
0)(0
.000
632)
(0.0
0071
7)(0
.024
732)
(0.0
2680
4)(0
.023
480)
(0.0
2377
5)10
-inve
stor
pro
tect
iont−
1–0
.005
212
–0.0
0464
3–0
.004
831
–0.0
0466
0–0
.001
756
–0.0
0918
0–0
.008
470
–0.0
0940
4(0
.003
273)
(0.0
0435
4)(0
.004
497)
(0.0
0444
1)(0
.016
453)
(0.0
3303
0)(0
.029
279)
(0.0
2969
9)E
nfo
rcin
gco
ntr
actst−
1–0
.003
542
–0.0
0510
5–0
.005
419
–0.0
0445
6–0
.016
301
–0.0
1896
0–0
.012
949
–0.0
1062
2(0
.002
214)
(0.0
0364
1)(0
.003
812)
(0.0
0383
3)(0
.022
928)
(0.0
3395
7)(0
.027
537)
(0.0
2749
6)10
0-re
solv
ing
inso
lven
cyt−
1–0
.016
670*
**–0
.018
509*
**–0
.019
038*
**–0
.010
226*
**0.
0270
471
0.03
2919
0.03
0986
0.02
3359
(0.0
0033
4)(0
.000
518)
(0.0
0053
9)(0
.000
782)
(0.0
2725
1)(0
.027
743)
(0.0
2863
0)(0
.101
432)
Corr
upti
on
indext−
1–0
.026
812*
**–0
.027
174*
**–0
.028
087*
**–0
.022
014*
**0.
0215
270.
0147
540.
0138
16–0
.027
418
(0.0
0040
0)(0
.000
674)
(0.0
0070
1)(0
.000
640)
(0.0
3321
7)(0
.035
692)
(0.0
3658
7)(0
.113
451)
Netw
ork
t−1
0.09
3466
***
0.05
6507
***
0.05
8366
***
0.00
8551
***
0.02
0248
–0.0
3313
4–0
.048
132
–0.0
5568
9(0
.012
462)
(0.0
0992
8)(0
.010
148)
(0.0
0267
1)(0
.019
871)
(0.0
4679
1)(0
.048
836)
(0.0
9325
8)L
abor
pro
du
ctiv
ityt−
10.
0013
33**
0.00
1503
**0.
0959
390.
0976
05(0
.000
522)
(0.0
0052
6)(0
.069
942)
(0.0
6987
7)
Ind
ust
ryby
Yea
r,F
irm
and
Mu
nic
ipal
ity
Fix
edE
ffec
tsye
sye
sye
sye
sye
sye
sye
sye
sF
irm
Con
trol
sn
on
oye
sye
sn
on
oye
sye
sD
esti
nat
ion
Fix
edE
ffec
tsn
on
ono
yes
no
no
no
yes
Fir
stS
tage
-F-s
tat
onIn
stru
men
t26
.08
26.6
526
.73
31.2
331
.65
32.0
2F
irst
Sta
ge-N
etw
ork
IVC
oeff
.0.
722*
**(0
.252
)0.
753*
**(0
.265
)0.
761*
**(0
.251
)0.
701*
**(0
.221
)0.
704*
**(0
.227
)0.
699*
**(0
.217
)
Mea
nY
0.03
30.
033
0.03
30.
033
10.1
8110
.181
10.1
8110
.181
R-s
q0.
122
0.12
20.
122
0.12
50.
286
0.28
60.
287
0.28
7N
1,40
3,85
01,
403,
850
1,40
3,85
01,
403,
850
46,2
8246
,282
46,2
8246
,282
Notes:
The
dep
endent
vari
able
incolu
mns
1-4
(5-8
)is
the
exte
nsi
ve
(inte
nsi
ve)
marg
inof
off
shori
ng.
Incolu
mns
2-4
and
6-8
,th
enetw
ork
vari
able
isin
stru
mente
dby
its
shif
t-sh
are
pre
dic
tion.
All
regre
ssio
ns
show
coeffi
cie
nts
est
imate
dfo
rth
ez-s
core
sof
each
expla
nato
ryvari
able
.F
irm
contr
ols
inclu
de:
wheth
er
the
firm
isfo
reig
n-o
wned,
am
ult
i-est
ablish
ment
dum
my,
the
log
of
capit
al
stock
per
em
plo
yee,
the
share
of
work
ers
wit
hse
condary
and
tert
iary
educati
on,
the
share
of
male
work
ers
,th
esh
are
of
managers
and
mid
dle
managers
,em
plo
yees’
avera
ge
age,
tenure
and
work
exp
eri
ence
and
firm
size
dum
mie
s.Sta
ndard
err
ors
are
clu
stere
dat
the
munic
ipality
-dest
inati
on-y
ear
level.
Sig
nifi
cance
levels
:***1%
,**5%
,*10%
.
42

Tab
le5:
Inst
ituti
ons,
net
wor
kan
dfirm
offsh
orin
g,P
CA
and
inte
ract
ion
spec
ifica
tion
Exte
nsi
ve
Inte
nsi
ve
[1]
[2]
[3]
[4]
[5]
[6]
Ind
exof
lab
orm
arke
tri
gidit
yt−
1–0
.005
261*
**–0
.006
665*
**0.
0380
240.
0368
14(0
.000
594)
(0.0
0074
1)(0
.065
502)
(0.0
7857
6)E
mp
loym
ent
pro
tect
ion
mea
sure
s t−
1–0
.000
563*
*0.
0799
26(0
.000
237)
(0.2
3290
3)In
dex
ofb
usi
nes
sre
gula
tion
s t−
1–0
.001
804
–0.0
0087
7–0
.112
550
–0.0
8468
3(0
.001
368)
(0.0
0066
0)(0
.069
926)
(0.0
7446
2)In
dex
ofcr
edit
riskt−
1–0
.002
681*
**–0
.003
301*
**0.
1467
490.
0894
41(0
.000
752)
(0.0
0080
6)(0
.098
345)
(0.0
9126
6)In
dex
ofcr
edit
cove
rage
and
reso
lvin
gin
solv
ency
t−1
–0.0
0528
2***
0.01
4989
(0.0
0103
2)(0
.080
317)
Cor
rup
tion
index
t−1
–0.0
0124
8***
–0.0
0114
6***
–0.0
0113
9***
0.05
1795
0.05
6158
0.06
1158
(0.0
0036
9)(0
.000
401)
(0.0
0040
2)(0
.045
554)
(0.0
4478
5)(0
.045
785)
Net
wor
kt−
10.
0092
58**
*0.
0105
04**
*0.
0097
12**
*–0
.069
097
–0.1
5178
3–0
.163
229
(0.0
0247
2)(0
.002
331)
(0.0
0220
4)(0
.091
857)
(0.1
2029
8)(0
.096
387)
Ind
exof
lab
orm
arke
tri
gid
ityt−
1*n
etw
orkt−
10.
0059
230.
1000
75(0
.011
695)
(0.1
9221
5)In
dex
ofb
usi
nes
sre
gula
tion
s t−
1*n
etw
orkt−
10.
0040
200.
0037
56–0
.052
586
–0.0
6749
8(0
.002
978)
(0.0
0234
9)(0
.108
863)
(0.1
1763
4)In
dex
ofcr
edit
riskt−
1*n
etw
orkt−
10.
0026
00**
0.17
8884
(0.0
0127
1)(0
.155
873)
Cor
rupti
onin
dex
t−1*n
etw
orkt−
1–0
.010
095*
*–0
.008
125*
*–0
.259
207
–0.2
7279
0(0
.004
794)
(0.0
0401
4)(0
.171
680)
(0.1
7074
9)E
mp
loym
ent
pro
tect
ion
mea
sure
s t−
1*n
etw
orkt−
10.
0010
870.
0038
51(0
.001
771)
(0.0
0384
8)In
dex
ofcr
edit
cove
rage
and
reso
lvin
gin
solv
ency
t−1*n
etw
orkt−
10.
0033
02**
0.13
8962
(0.0
0159
5)(0
.134
078)
Lab
orpro
du
ctiv
ityt−
10.
0011
83**
*0.
0011
84**
*0.
0011
82**
*0.
0794
600.
0787
570.
0783
76(0
.000
357)
(0.0
0035
7)(0
.000
356)
(0.0
8675
6)(0
.086
875)
(0.0
8652
3)
Mea
nY
0.03
30.
033
0.03
310
.181
10.1
8110
.181
R-s
q0.
121
0.12
20.
121
0.28
70.
287
0.28
7N
1,40
3,85
01,
403,
850
1,40
3,85
046
,282
46,2
8246
,282
Notes:
The
dep
endent
vari
able
incolu
mns
1-3
(4-6
)is
the
exte
nsi
ve
(inte
nsi
ve)
marg
inof
off
shori
ng.
All
regre
ssio
ns
show
coeffi
cie
nts
est
imate
don
the
z-s
core
sof
each
expla
nato
ryvari
able
and
refe
rto
the
most
com
ple
tesp
ecifi
cati
on.
The
index
of
lab
or
mark
et
rigid
ity
isest
imate
dby
com
bin
ing
all
lab
or
regula
tions
wit
ha
pri
ncip
al
com
ponent
analy
sis.
The
index
of
busi
ness
regula
tions
isest
imate
dby
com
bin
ing
all
busi
ness
regula
tions
wit
ha
pri
ncip
al
com
ponent
analy
sis.
The
index
of
cre
dit
risk
isest
imate
dby
com
bin
ing
all
cre
dit
regula
tions
wit
ha
pri
ncip
al
com
ponent
analy
sis.
Sta
ndard
err
ors
are
clu
stere
dat
the
munic
ipality
-dest
inati
on-y
ear
level.
Sig
nifi
cance
levels
:***1%
,**5%
,*10%
.
43

Tab
le6:
Net
wor
ks
and
firm
offsh
orin
g,al
tern
ate
defi
nit
ions
ofa
net
wor
k
Exte
nsi
ve
Inte
nsi
ve
Exte
nsi
ve
Inte
nsi
ve
Exte
nsi
ve
Inte
nsi
ve
[1]
[2]
[3]
[4]
[5]
[6]
Net
wor
k(b
ilat
eral
firm
shar
eof
fore
ign
wor
kers
)0.
0085
51**
*–0
.033
134
(0.0
0267
1)(0
.046
791)
Net
wor
k(b
ilat
eral
firm
shar
eof
fore
ign
whit
e-co
llar
wor
kers
)0.
0345
10**
*–0
.148
078
(0.0
0535
2)(0
.226
586)
Net
wor
k(b
ilat
eral
firm
shar
eof
fore
ign
blu
e-co
llar
wor
kers
)0.
0046
78**
*–0
.019
838
(0.0
0166
9)(0
.026
962)
Fir
stSta
ge-F
-sta
ton
Inst
rum
ent
26.7
332
.02
25.7
931
.11
33.7
841
.01
Fir
stSta
ge-N
etw
ork
IVC
oeff
.0.
761*
**(0
.251
)0.
701*
**(0
.221
)0.
472*
**(0
.042
)0.
383*
**(0
.065
)1.
140*
**(0
.127
)0.
987*
**(0
.239
)
Mea
nY
0.03
310
.135
0.03
310
.135
0.03
310
.135
R-s
q0.
178
0.28
80.
176
0.28
80.
176
0.28
8N
1,40
3,85
046
,282
1,40
3,85
146
,283
1,40
3,85
246
,284
Exte
nsi
ve
Inte
nsi
ve
Exte
nsi
ve
Inte
nsi
ve
Exte
nsi
ve
Inte
nsi
ve
[7]
[8]
[9]
[10]
[11]
[12]
Net
wor
k(1
,if
man
ager
sp
oach
edfr
omfirm
sth
atoff
shor
eto
countr
yj)
0.13
8656
***
–0.2
5054
8(0
.021
312)
(0.2
7066
7)N
etw
ork
(bilat
eral
firm
shar
eof
fore
ign
wor
kers
atth
ebas
eye
ar)
0.02
0347
***
0.00
0425
(0.0
0229
9)(0
.004
410)
Net
wor
k(b
ilat
eral
shar
eof
fore
ign
wor
kers
atth
em
unic
ipal
ity
leve
l)0.
0116
46**
*0.
0641
52(0
.000
551)
(0.0
8134
5)
Fir
stSta
ge-F
-sta
ton
Inst
rum
ent
--
--
27.9
832
.35
Fir
stSta
ge-N
etw
ork
IVC
oeff
.-
--
-1.
537*
**(0
.205
)2.
120*
**(0
.385
)
Mea
nY
0.03
310
.135
0.03
310
.135
0.03
310
.135
R-s
q0.
176
0.28
80.
176
0.28
80.
176
0.28
8N
1,40
3,85
046
,282
1,40
3,85
146
,283
1,40
3,85
246
,284
Notes:
Inco
lum
ns
(1),
(3),
(5),
(7),
(9)
an
d(1
1),
the
dep
end
ent
vari
ab
leis
ad
um
my
vari
ab
leeq
ual
to1
ifa
firm
has
an
on
-zer
ooff
shor
ing
volu
me
(bro
add
efin
itio
n).
Inco
lum
ns
(2),
(4),
(6),
(8),
(10)
an
d(1
2),
the
dep
end
ent
vari
ab
leis
the
log
of
off
shori
ng
volu
mes
,co
nd
itio
nal
onoff
shor
ing.
Inco
lum
ns
(1)
an
d(2
),th
en
etw
ork
vari
ab
leis
mea
sure
dat
tim
et−
1,
as
inth
ebase
line
an
aly
sis,
an
dit
isin
stru
men
ted
by
its
shif
t-sh
are
pre
dic
tion
,as
inth
eb
ase
lin
ean
aly
sis.
Inco
lum
ns
(3)
an
d(4
),th
en
etw
ork
vari
ab
leis
the
firm
’sb
ilat
eral
shar
eof
wh
ite-
coll
arfo
reig
nw
ork
ers
at
tim
et−
1,an
dit
isin
stru
men
ted
by
its
shif
t-sh
are
pre
dic
tion
.In
colu
mn
s(5
)an
d(6
),th
en
etw
ork
vari
able
isth
efi
rm’s
bilat
eral
share
of
blu
e-co
llar
fore
ign
work
ers
at
tim
et−
1,
an
dit
isin
stru
men
ted
by
its
shif
t-sh
are
pre
dic
tion
.In
colu
mn
s(7
)an
d(8
),th
en
etw
ork
vari
ab
leis
the
firm
’sb
ilate
ral
share
of
fore
ign
work
ers
at
the
base
year.
Inco
lum
ns
(9)
and
(10)
,th
en
etw
ork
vari
able
isa
du
mm
yeq
ual
to1
ifth
efi
rmp
oach
esm
an
ager
sfr
om
firm
sth
at
off
shore
tod
esti
nati
onj
at
tim
et−
1.In
colu
mn
s(1
1)an
d(1
2),
the
net
work
vari
ab
leis
the
bil
ate
ral
share
of
fore
ign
work
ers
inm
un
icip
ali
tyc
at
tim
et−
1,
and
itis
inst
rum
ente
dby
its
shif
t-sh
are
pre
dic
tion
.A
llre
gre
ssio
ns
show
coeffi
cien
tses
tim
ate
don
the
z-sc
ore
sof
each
exp
lan
ato
ryva
riab
lean
dre
fer
toth
em
ost
com
ple
tesp
ecifi
cati
on
.S
tan
dard
erro
rsare
clu
ster
edat
the
mu
nic
ipali
tyle
vel.
Sig
nifi
cance
leve
ls:
***1
%,
**5%
,*1
0%.
44

Table 7: Institutions and networks, the role of non-linearities in offshoring decisions and ofexport outcomes
Offshoring Export
Extensive Intensive Extensive Intensive[1] [2] [1] [2]
Index of labor market rigidityt−1 –0.004756*** 0.004385 –0.024258 –0.338879(0.000436) (0.099843) (0.021569) (0.252259)
Index of labor market rigidity2t−1 0.000806*** 0.014632
(0.000260) (0.074298)Index of business regulationst−1 –0.000215 –0.058580 0.006661 0.074535
(0.000552) (0.086191) (0.004868) (0.045147)Index of business regulations2
t−1 0.000749 –0.043573(0.000498) (0.034185)
Index of credit riskt−1 –0.003436*** 0.131934 –0.018241*** –0.031200(0.000636) (0.130959) (0.002045) (0.037783)
Index of credit risk2t−1 0.002544*** 0.002354
(0.000804) (0.062133)Corruption indext−1 –0.000062 –0.024040 –0.002204** –0.111308**
(0.000547) (0.152086) (0.000962) (0.051552)Corruption index2
t−1 –0.002557*** 0.038669(0.000869) (0.062198)
Networkt−1 0.019900*** 0.123127 0.027574*** 0.111999(0.002451) (0.165955) (0.006645) (0.082117)
Network2t−1 –0.002412*** –0.050437
(0.000345) (0.030761)
Mean Y 0.033 10.181 0.036 10.133R-sq 0.179 0.291 0.385 0.391N 1,403,850 46,282 1,403,850 144,701
Notes: The dependent variable in column 1 (2) is the extensive (intensive) margin of offshoring.Dependent variable in column 3 (4) is the extensive (intensive) margin of exporting. All regres-sions show coefficients estimated on the z-scores of each explanatory variable and refer to the mostcomplete specification. Standard errors are clustered at the municipality-destination-year level. Sig-nificance levels: ***1%, **5%, *10%.
45

Tab
le8:
Inst
ituti
ons,
net
wor
ks
and
firm
offsh
orin
g,re
sult
sby
indust
ry
Lab
or-
inte
nsi
ve
ind
ust
ries
Cap
ital-
inte
nsi
ve
ind
ust
ries
Serv
ice
ind
ust
ries
Tra
din
gm
erc
han
dis
e[1
][2
][3
][4
][5
][6
]
Exte
nsi
ve
Inte
nsi
ve
Exte
nsi
ve
Inte
nsi
ve
Exte
nsi
ve
Inte
nsi
ve
Index
ofla
bor
mar
ket
rigi
dit
yt−
1–0
.009
342*
**–0
.124
779
–0.0
0105
5**
–0.2
7929
0–0
.002
664*
**0.
0132
90(0
.000
973)
(0.1
3704
5)(0
.000
407)
(0.2
5318
3)(0
.000
356)
(0.0
3506
8)In
dex
ofbusi
nes
sre
gula
tion
s t−
10.
0008
870.
0980
590.
0011
16–0
.415
847
–0.0
0045
30.
0108
22(0
.000
953)
(0.0
8740
9)(0
.000
788)
(0.2
8298
7)(0
.000
890)
(0.0
3842
7)In
dex
ofcr
edit
riskt−
1–0
.004
611*
**–0
.140
198
–0.0
0120
1**
0.23
5629
–0.0
0439
6***
0.00
8424
(0.0
0120
3)(0
.096
101)
(0.0
0062
6)(0
.169
324)
(0.0
0060
0)(0
.032
060)
Cor
rupti
onin
dex
t−1
–0.0
0075
8**
0.14
7094
–0.0
0120
8**
–0.2
4239
7–0
.008
368*
**0.
1149
04(0
.000
322)
(0.1
0565
5)(0
.000
480)
(0.2
5184
4)(0
.000
814)
(0.0
9745
3)N
etw
orkt−
10.
0113
17**
*–0
.048
889
0.02
1110
***
0.21
4269
0.02
7426
***
0.11
1188
(0.0
0331
5)(0
.134
705)
(0.0
0363
0)(0
.326
278)
(0.0
0419
6)(0
.189
153)
Mea
nY
0.01
910
.378
0.04
110
.126
0.01
210
.626
R-s
q0.
192
0.33
40.
128
0.27
40.
097
0.43
1N
529,
444
10,1
1687
4,40
636
163
2,38
3,59
728
,937
Notes:
Th
ed
epen
den
tva
riab
lein
colu
mn
s1-3
(4-6
)is
the
exte
nsi
ve(i
nte
nsi
ve)
marg
inof
off
shori
ng.
All
regre
ssio
ns
coeffi
cien
tses
tim
ated
onth
ez-
scor
esof
each
exp
lan
ato
ryva
riab
lean
dre
fer
toth
em
ost
com
ple
tesp
ecifi
cati
on
.T
he
ind
exof
lab
or
mark
etri
gid
ity
ises
tim
ated
by
com
bin
ing
allla
bor
regu
lati
on
sw
ith
ap
rin
cip
alco
mp
on
ent
an
aly
sis.
Th
ein
dex
of
bu
sin
ess
regu
lati
on
sis
esti
mate
dby
com
bin
ing
all
bu
sin
ess
regu
lati
ons
wit
ha
pri
nci
pal
com
pon
ent
an
aly
sis.
Th
ein
dex
of
cred
itri
skis
esti
mate
dby
com
bin
ing
all
cred
itre
gula
tion
sw
ith
ap
rin
cip
alco
mp
onen
tan
aly
sis.
We
class
ify
as
“la
bor
inte
nsi
ve”
those
ind
ust
ries
wit
han
aver
age
cap
ital
inte
nsi
tyb
elow
the
sam
ple
mea
nin
the
mid
dle
ofth
esa
mp
lep
erio
d.
Sta
nd
ard
erro
rsare
clu
ster
edat
the
mu
nic
ipali
ty-d
esti
nati
on
-yea
rle
vel.
Sig
nifi
can
cele
vel
s:**
*1%
,**
5%,
*10%
.
46

Tab
le9:
Inst
ituti
ons,
net
wor
ks
and
firm
offsh
orin
g,re
sult
sby
sub-s
ample
Exp
ort
ing
firm
sD
evelo
ped
dest
inati
on
countr
ies
Develo
pin
gdest
inati
on
countr
ies
[1]
[2]
[3]
[4]
[5]
[6]
Exte
nsi
ve
Inte
nsi
ve
Exte
nsi
ve
Inte
nsi
ve
Exte
nsi
ve
Inte
nsi
ve
Ind
exof
lab
orm
arke
tri
gid
ityt−
1–0
.007
597*
**0.
0362
11–0
.052
060*
*–0
.426
927
–0.0
0697
9***
0.02
2112
(0.0
0089
2)(0
.082
354)
(0.0
2313
5)(0
.698
491)
(0.0
0074
9)(0
.100
866)
Ind
exof
bu
sin
ess
regu
lati
ons t−
10.
0007
59–0
.091
759
–0.0
0699
2–0
.238
628
0.00
1003
–0.1
0491
2(0
.000
703)
(0.0
7602
7)(0
.011
348)
(0.2
7480
5)(0
.000
697)
(0.0
9046
5)In
dex
ofcr
edit
riskt−
1–0
.003
755*
**0.
0960
30–0
.025
886*
*0.
3902
00–0
.004
936*
**0.
2043
07(0
.000
934)
(0.0
9083
3)(0
.011
655)
(0.3
0980
9)(0
.000
851)
(0.1
2414
0)C
orru
pti
onin
dex
t−1
–0.0
0199
8**
–0.0
2158
1–0
.027
655*
*0.
2196
05–0
.002
221*
*–0
.184
417
(0.0
0077
4)(0
.128
689)
(0.0
1058
3)(0
.230
004)
(0.0
0059
7)(0
.201
678)
Net
wor
kt−
10.
0123
78**
*–0
.128
508
0.07
8192
**–0
.869
828
0.00
9048
***
–0.1
0302
9(0
.002
497)
(0.1
2221
2)(0
.033
512)
(0.7
2829
2)(0
.002
038)
(0.1
4618
0)
Mea
nY
0.03
710
.176
0.15
210
.144
0.01
410
.244
R-s
q0.
187
0.28
50.
266
0.31
10.
097
0.26
0N
1,26
1,50
746
,070
193,
433
29,2
871,
210,
417
16,7
52
Notes:
Th
ed
epen
den
tva
riab
lein
colu
mn
s1-3
(4-6
)is
the
exte
nsi
ve(i
nte
nsi
ve)
marg
inof
off
shori
ng.
All
regre
ssio
nco
effici
ents
are
esti
mat
edon
the
z-sc
ores
ofea
chex
pla
nato
ryva
riab
lean
dre
fer
toth
em
ost
com
ple
tesp
ecifi
cati
on
.T
he
ind
exof
lab
or
mark
etri
gid
ity
ises
tim
ated
by
com
bin
ing
allla
bor
regu
lati
on
sw
ith
ap
rin
cip
alco
mp
on
ent
an
aly
sis.
Th
ein
dex
of
bu
sin
ess
regu
lati
on
sis
esti
mate
dby
com
bin
ing
all
bu
sin
ess
regu
lati
ons
wit
ha
pri
nci
pal
com
pon
ent
an
aly
sis.
Th
ein
dex
of
cred
itri
skis
esti
mate
dby
com
bin
ing
all
cred
itre
gula
tion
sw
ith
ap
rin
cip
alco
mp
onen
tan
aly
sis.
Sta
nd
ard
erro
rsare
clu
ster
edat
the
mu
nic
ipali
ty-d
esti
nati
on
-yea
rle
vel.
Sig
nifi
can
cele
vels
:**
*1%
,**
5%,
*10%
.
47

Tab
le10
:In
stit
uti
ons,
net
wor
ks
and
firm
offsh
orin
g,al
tern
ate
offsh
orin
gva
riab
les
Bro
ad
off
shori
ng
FD
I-b
ase
dd
efi
nit
ion
[1]
[2]
[3]
Exte
nsi
ve
Inte
nsi
ve
Exte
nsi
ve
Index
ofla
bor
mar
ket
rigi
dit
yt−
1–0
.034
499*
**–0
.270
267
–0.0
0012
5*(0
.002
112)
(0.1
6452
7)(0
.000
068)
Index
ofbusi
nes
sre
gula
tion
s t−
10.
0039
860.
0002
230.
0001
46(0
.003
412)
(0.0
4154
9)(0
.000
123)
Index
ofcr
edit
riskt−
1–0
.014
048*
**0.
0171
32–0
.000
348*
*(0
.002
78)
(0.0
4745
8)(0
.000
141)
Cor
rupti
onin
dex
t−1
–0.0
0193
1**
–0.1
1411
4–0
.000
826*
(0.0
0080
9)(0
.090
234)
(0.0
0049
8)N
etw
orkt−
10.
0324
39**
*0.
1107
310.
0011
25**
(0.0
0540
0)(0
.079
005)
(0.0
0064
1)M
ean
Y0.
101
10.1
760.
010
R-s
q0.
413
0.35
10.
106
N1,
403,
850
156,
761
1,40
3,85
0
Notes:
Inco
lum
n(1
),th
ed
epen
den
tva
riab
leis
ad
um
my
vari
ab
leeq
ual
to1
iffi
rmh
as
an
on
-zer
ooff
shori
ng
volu
me
(bro
ad
defi
nit
ion
).In
colu
mn
(2),
the
dep
end
ent
vari
ab
leis
the
log
of
off
shori
ng
volu
mes
(bro
ad
defi
nit
ion
).In
colu
mn
(3),
the
dep
end
ent
vari
able
isth
eex
ten
sive
mar
gin
bas
edon
info
rmati
on
on
ou
tward
FD
Iact
ivit
y.A
llre
gre
ssio
ns
show
coeffi
cien
tses
tim
ate
don
the
z-sc
ores
ofea
chex
pla
nat
ory
vari
able
and
refe
rto
the
most
com
ple
tesp
ecifi
cati
on.
Th
ein
dex
of
lab
or
mark
etri
gid
ity
ises
tim
ate
dby
com
bin
ing
all
lab
orre
gula
tion
sw
ith
ap
rin
cip
al
com
pon
ent
an
aly
sis.
Th
ein
dex
of
busi
nes
sre
gu
lati
on
sis
esti
mate
dby
com
bin
ing
all
bu
sin
ess
regu
lati
ons
wit
ha
pri
nci
pal
com
pon
ent
an
aly
sis.
Th
ein
dex
of
cred
itri
skis
esti
mate
dby
com
bin
ing
all
cred
itre
gu
lati
on
sw
ith
ap
rin
cip
alco
mp
onen
tan
alysi
s.Sta
nd
ard
erro
rsare
clu
ster
edat
the
mu
nic
ipali
ty-d
esti
nati
on
-yea
rle
vel.
Sig
nifi
can
cele
vels
:**
*1%
,**
5%,
*10%
.
48