silver mine bfs update - sotkamo reports/160322_sotkamo... · 1.5 tmf area 11 1.6 base case 11 ......
TRANSCRIPT

CTS Engtec Oy | KOUVOLA ESPOO OULU ST. PETERSBURG [email protected] www.ctse.fi
Sotkamo Silver Oy Silver Mine Project Silver Mine BFS Update 18.03.2016 Kouvola, Finland
SilverMineBFSUpdate2016
SilverMineBFSUpdatereport Page2of63
TABLEOFCONTENT
1 SUMMARY 91.1 Permittingandschedule 91.2 MiningPlanandOreReserveestimate 91.3 Beneficiationprocess 101.4 XRTOreSorter,TekesprojectandOutotecO&Mserviceconcept 101.5 TMFarea 111.6 Basecase 11
1.6.1 Investmentcost 111.6.2 Operatingcost 121.6.3 Managementcase 12
1.7 Economicanalyses 131.7.1 Basecaseeconomicanalyses 131.7.2 Managementcaseeconomicanalyses 14
2 STUDIESBETWEENBFSREPORT2014ANDBFSUPDATE2016 152.1 SotkamoSilver,2014drillingcampaign 152.2 Sortertests 17
2.2.1 Oresampling 172.2.2 Samplepreparation 182.2.3 OresortingtestsatTomra 18
2.3 Miningplan 202.3.1 OpenpitMiningplan 202.3.2 UndergroundMine 22
2.4 Orereserveaudit 222.5 Sorter,TekesprojectandOutotecO&Mserviceconcept 252.6 TMF,countryrockandmarginaloreareasoilsurvey 252.7 PermittingstatusoftheSilverMineProject 25
3 BFSUPDATE 263.1 Mine 263.2 Crushing 273.3 OreSorter 28
3.3.1 Sorterlayoutandflowdiagram 293.3.2 Sorterintheproduction 29
3.4 Beneficiationprocess 313.4.1 Beneficiationprocessproducts 313.4.2 Processingplantinfrastructure 313.4.3 OutotecO&Mservice 33
3.5 ProjectInfrastructure 33
SilverMineBFSUpdate2016
SilverMineBFSUpdatereport Page3of63
3.5.1 Generallayoutandareaworks 333.5.2 Modificationstobuildings 343.5.3 TailingsManagementFacility 34
4 MANAGEMENTCASE 354.1 Managementcasedisclaimer 354.2 Introduction 354.3 Geologicalstructure 354.4 Geophysicalsurveyandinterpretations 374.5 Modellingandestimates 39
4.5.1 Modelbelowpresentresourcefrom410downto1000meters 394.5.2 Modelfrom410downto1400meters 42
5 COSTUPDATE 445.1 Capitalcostupdate 44
5.1.1 Mine,crusherandsorter 455.1.2 Beneficiationplant 465.1.3 Infraandareaworks 485.1.4 Projectindirectcosts 485.1.5 Mineclosureandrehabilitation 495.1.6 Contingencyandescalation 49
5.2 Operationcostupdate 495.2.1 Mineoperationcosts 515.2.2 Electricityprice 515.2.3 Miscellaneouscost 515.2.4 Cashcost 525.2.5 Manningplan 53
5.3 Managementcase 53
6 ECONOMICANALYSIS 546.1 BaseCase,commoditypriceforecast 556.2 Projectsensitivities 586.3 Managementcase 58
7 BASECASEPROJECTSCHEDULE 62
8 CONCLUSIONSANDRECOMMENDATIONS 63
SilverMineBFSUpdate2016
SilverMineBFSUpdatereport Page4of63
LISTOFTABLESTable1Summaryofinvestmentcost....................................................................................................11Table2Operationcostbreakdown.......................................................................................................12Table3Metalpricescenarios................................................................................................................13Table4Keyfinancialfiguresof6yearbasecase..................................................................................14Table5Keyfinancialfiguresof11yearmanagementcase..................................................................14Table6Sorterfeedcomposition...........................................................................................................18Table7OreSortertestresults(finesincluded).....................................................................................19Table8TotalOreproductionatSilverMine.........................................................................................20Table9Openpitminingplan................................................................................................................21Table10UndergroundMineminingplan.............................................................................................22Table11Mineralresourcesasof20thJan2016;derivedfrompublishedMineralResourceEstimate23Table12SotkamoSilverauditedOreReservesasof20thJan2016.....................................................24Table13Crushingandoresortingmassbalance..................................................................................30Table14AverageMetalinputofmillfeedandmetaloutputascommercialproductsduringthefirstsixproductionyears(drytonnes)..........................................................................................................31Table15MetalgradeestimatesofExplorationPotentialsolidbetweenlevels410and1000meters,derivedfromblockmodelbyconversionfactor(metalsg/t)................................................................40Table16EstimatesofHigh-GradeandsorterfeedmaterialsfromExplorationPotential;undergroundminingdilutingandorelossparametershavebeenapplied(metalsg/t)............................................40Table17HighgradeandsortedmaterialinExplorationpotential(metalsg/t)...................................41Table18Totalinvestmentcostbreakdown(1000€).............................................................................44Table19CostbreakdowntoInitialandSustaining(1000€)..................................................................45Table20Mineinvestmentcost(1000€)................................................................................................45Table21Processplantinvestmentcosts(1000€).................................................................................46Table22OthercommonSiteGeneralinvestmentcost(1000€)...........................................................48Table23Engineeringandprojectmanagement(site)costs(1000€)....................................................48Table24Operationcostcomparison(1000€).......................................................................................49Table25Annualoperatingcostperyear(1000€).................................................................................50Table26LOMoperationcostpercostitem(1000€)............................................................................50Table27SummaryofannualMiningoperatingcosts(1000€).............................................................51Table28Managementcasesustaininginvestments.............................................................................53Table29Grossrevenue,consensuspriceforecastBaseCase..............................................................55Table30CashFlowstatement..............................................................................................................56Table31Financialresultsbasedonforecastcommodityprices...........................................................57Table32ThesensitivityofBasecase....................................................................................................58Table33Theresultsofcashflowmodelling,Managementcase..........................................................59Table34ThesensitivityofManagementcase......................................................................................60Table35Managementcase,Cash-flowstatement...............................................................................61

SilverMineBFSUpdate2016
SilverMineBFSUpdatereport Page5of63
LISTOFFIGURESFigure1Sampoanomalyandsomeofthedrillingintersectionsinthe2014campaign.......................16Figure2Samplingsiteintestminingtunnelat160level(circle)..........................................................17Figure3TomraXRTsorterusedinthesortingtest................................................................................18Figure4Theprincipleoftheoresorter.................................................................................................19Figure5SilverMineopenpitandblockmodeldisplayingAgcontent..................................................21Figure6Principaldrawingofundergroundcrusher..............................................................................26Figure7Crushing&Sortingtestflowflowsheetforproductionyears1&2.........................................27Figure8Undergroundcrushingplant’spreliminarylayout..................................................................28Figure9Preliminarycrushingflowsheetduringproductionyears3-6.................................................28Figure10Indicativeflowsheetoftheoresorting(Outotec)................................................................29Figure11OresortingperformanceasafunctionofAggrade(g/t)......................................................30Figure12Blaikenplantmills.................................................................................................................32Figure13Blaikenprocessingplantlongitudinalsection.......................................................................33Figure14Blaikenprocessplant.............................................................................................................34Figure15StructuralinterpretationofTipasjärviGreenstoneBeltbyTaipale(1983).LocationofSilverMinemarkedwithstar..........................................................................................................................36Figure16StructureofSilverMinearea................................................................................................37Figure17OriginalinterpretationoftheGTKgeophysicalSamposurveysbyNiskanen(2012)...........38Figure18ProjectiontowardsSE,TaivaljärviSAMPOresults1-1500ohm-m.Brownareadisplaysknownresource.....................................................................................................................................38Figure19Locationsofdrill-holescontainingore-gradematerialinExplorationPotentialmodelbelowknownresourcedownfromlevel410...................................................................................................39Figure20Blockmodelderivedfromdrill-holesbelowlevel410;longdrill-holedeviat-ingfromdirectionoflineationhasnotbeenused.Colorsymbols:white=undefined,cyan=0-70g/tAg;green70-135g/tAg;brown135-1000g/tAg..................................................................................................40Figure21Explorationpotentialmodelleddownto1000metersbasedongeophysicalsurvey.Diamond-drillingintersectionswithhighAg-contentsintoexplorationpotentialhavebeendisplayed................................................................................................................................................................42Figure22PossiblecontinuationoftheExplorationPotentialofsilvermineralizationdownto1400meters,basedoninterpretationofSAMPO-survey.Redareadisplaysexplorationpotentialdownto1000metersalongwithplannedtunnelcontinuation..........................................................................43Figure23Sotkamo-Blaikenlayout.........................................................................................................47Figure24Annualoperatingcostperminingtonnage...........................................................................50Figure25AnnualoperationalCashcost(othersalesthanAgusedascredit)......................................52Figure26AnnualOpexandEBITDAwithproductiondata...................................................................53Figure27Consensuspriceforecast.......................................................................................................55Figure28Managementcasepre-taxcashflowdiagram......................................................................60Figure29SIlverMineprejectMainschedule........................................................................................62

SilverMineBFSUpdate2016
SilverMineBFSUpdatereport Page6of63
LISTOFABBREVIATIONS
€ euroa yearAg silverAu goldBFS BankableFeasibilityStudyCAPEX CapitalExpensesCE ConformitéEuropéenne,meaning"EuropeanConformity"EP EnvironmentalPermitJORCcode AustralasianCodeforReportingofExplorationresults,MineralResourcesand
OreReserveskt kilotonne,1000tonnesLOM LifeofMineMt Megaton,1000000tonnesMWh MegawatthourMoz MillionouncesOP OpenPitOPEX OperationalExpensesOz troyounce31,1gPb leadPRXF PortableX-RayFluorescenceanalyserROM RunofMinet metrictonneTMF TailingsManagementFacility(Tailingsandwatertreatmentbondarea)UG UndergroundZn zincallunitsaremetricunits,ifnotstatedotherwise

SilverMineBFSUpdate2016
SilverMineBFSUpdatereport Page7of63
LISTOFREFERENCIS
• CTSEngtec,2014.BankableFeasibilityStudySotkamoSilverMine,137p.Accessibleonlineat:www.silver.fi
• Lindborg,T.,Papunen,H.,Parkkinen,J.,Tuokko,I.,2015.TheTaivaljärvi(SilverMine)• Ag-Au-ZnDepositinArchaeangreenstonebelt,EasternFinland.InMineraldepositsofFin-
land,editedbyW.Maier,R.Lahtinen,HughO`Brien.Elsevier.633-658• Niskanen,M.,2012.ElectromagneticSAMPOsoundingsatTaivaljärvi2011.GeologicalSurvey
ofFinland,ReportM185K2011.• Niskanen,M.,2013.ElectromagneticSAMPOsoundingsatTaivaljärvi2013.GeologicalSurvey
ofFinland,ReportM178K2012.• Parkkinen,J.,2013.SilverMineDepositatSotkamo:GeologicalModelofEMSampoSound-
ings.Accessibleonlineat:www.silver.fi.• Taipale,K.,1983.ThegeologyandgeochemistryoftheArchaeanKuhmogreenstone-granite
terrainintheTipasjärviarea,easternFinland.ActaUniversitatisOuluensis,Ser.A5,98p.• TechnicalreviewofErsmarkbergetplant(BlaikenMine),SotkamoSilverOy2015.• AuditreportoftheSotkamoSilverMineminingplanandOrereserves,OutotecOyj2016.
SilverMineBFSUpdate2016
SilverMineBFSUpdatereport Page8of63
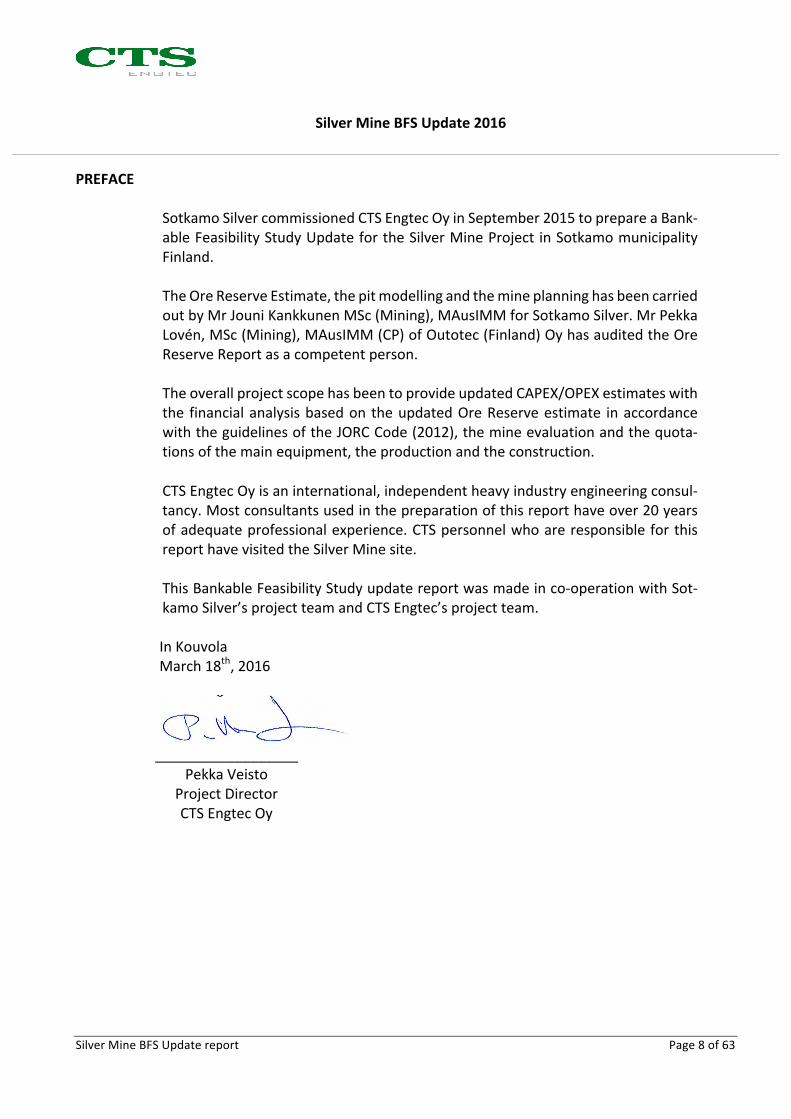
PREFACE
SotkamoSilvercommissionedCTSEngtecOyinSeptember2015toprepareaBank-ableFeasibilityStudyUpdatefortheSilverMineProject inSotkamomunicipalityFinland.TheOreReserveEstimate,thepitmodellingandthemineplanninghasbeencarriedoutbyMrJouniKankkunenMSc(Mining),MAusIMMforSotkamoSilver.MrPekkaLovén,MSc(Mining),MAusIMM(CP)ofOutotec(Finland)OyhasauditedtheOreReserveReportasacompetentperson.TheoverallprojectscopehasbeentoprovideupdatedCAPEX/OPEXestimateswiththe financialanalysisbasedon theupdatedOreReserveestimate inaccordancewiththeguidelinesoftheJORCCode(2012),themineevaluationandthequota-tionsofthemainequipment,theproductionandtheconstruction.CTSEngtecOyisaninternational,independentheavyindustryengineeringconsul-tancy.Mostconsultantsusedinthepreparationofthisreporthaveover20yearsofadequateprofessionalexperience.CTSpersonnelwhoareresponsibleforthisreporthavevisitedtheSilverMinesite.ThisBankableFeasibilityStudyupdatereportwasmadeinco-operationwithSot-kamoSilver’sprojectteamandCTSEngtec’sprojectteam.
InKouvola March18th,2016
__________________ PekkaVeisto ProjectDirector CTSEngtecOy

SilverMineBFSUpdate2016
SilverMineBFSUpdatereport Page9of63
1 SUMMARY
ThisBFSUpdatereportdescribesthechangesintheSilverMineprojectsincetheBFS2014update.Inthischapterispresentedthesummaryofthefeasibilitystudyincludingtheupdatedandothercriticalinformation.
1.1 Permittingandschedule
SilverMineprojecthasallrequiredpermitstostarttheproject.MiningPermit(TheConcession),EnvironmentalPermit,MiningSafetyPermit,ChemicalProcessingandStoringpermitandBuildingpermitsforproductionfacilitiesareallvalid.
1.2 MiningPlanandOreReserveestimate
TheMiningPlanandTheOreReservewereupdatedwiththeimplementationofsensorbasedsortingintheproductionandbasedonthelatestinformationonthedepositstructure.MrJouniKankkunen,M.Sc.(Mining),MAusIMMhaspreparedtheMiningPlanandtheOreReserveEstimate,whichhasbeenauditedbyMrPekkaLovén,MAusIMM(CP),MSc(Mining)ofOutotec(Finland)OywhoisaCompetentPersoninaccord-ancewiththeJORCCode(2012).TheJORC(2012)compliantorereserve isplannedtobemined insixproductionyears.Fourmilliontonnesofmineralizedmaterialwillbeminedforthefurtherpro-cessing.Themillfeedconsistsof672ktofhighgradeoreand1772ktofpre-con-centrated ore. The pre-concentration will be done by sensor base sorting (XRTsorter).Approximately20%ofthemill feed isminedfromtheopenpitand80%fromtheundergroundmine.Theaveragesilvergradeofthemillfeedisestimatedtobe131g/tduringthefirstsixyearsofproduction.Theamountofcountryrockminingtotalsto2,8Mtandamountofrejectfromthesensorbasedsortingisestimatedtobeca1Mtduringthesesixproductionyears.Totalminingtonnesarelimitedto550ktduringthetwofirstproductionduetotheEnvironmentalPermit(EP)limitationandthenincreasedaftertheEPhasbeenup-dated.The audited Ore Reserve is derived fromMeasured and Indicated Mineral Re-sourcesandconsists2,76Mtoforewithaveragegradesof124g/tAg,0,41g/tAu,0,43%Pband0,90%Zn.Incomparisonwiththepreviousorereserveestimate,theaveragesilvercontentinOreReserveincreasedby22%asoretonnagedecreasedby17%.
SilverMineBFSUpdate2016
SilverMineBFSUpdatereport Page10of63
ThehighermetalgradeandlowertonnageofmillfeedcomparedtotheBFS2014feedisduetominingofhighgradeoresduringtwofirstproductionyearsandim-plementationofsensorbasedoresorterintheSilverMineprocess.Installingoresorterundergroundwillalsolowerthehaulingcostsinundergroundminingsincesorterrejectcanbetakenstraighttobackfilling.
1.3 Beneficiationprocess
ThebeneficiationprocessisCrushing-Milling-Flotation-Dewateringduringthefirsttwoyears.Fromthethirdyearonwards,Crusherisintegratedwithsensorbasedoresorterthatisaddedtotheprocess.Integratedcrusher-sorterwillbeinstalledundergroundanditwillreducethehaulingcostsintheundergroundmining.Theprocessremainsotherwiseunchanged.Inadditiontoimplementingoresorter,themillingcircuithasbeenmodifiedsinceBFS2014andinsteadofrodandballmill,onlyballmillwithgreatercapacityisap-pliedintheprocess.Themill feedinthetwofirstproductionyears isplannedtobe350kt/aandit’llincreaseupto450kt/ainthethirdproductionyear.TheaverageAgPb–concentrateoutputduringthefirst6productionyearsisestimatedtobe2500tandaverageZnAg–concentrateoutput6700t(drytonnes).Silverproductionisestimatedtobeca1,5Moz/atotalling9,25Mozinthesixpro-ductionyearsandgoldproductionca5koz/atotalling28,6koz insixproductionyears.Estimatedzincproductionis3,6t/aandleadproduction1,5t/a.Zinctotallingto21,7ktandleadto9,2ktrespectivelyduringthesixproductionyears.Allesti-matesaredrytonnes.
1.4 XRTOreSorter,TekesprojectandOutotecO&Mserviceconcept
Sensorbasedoresortingisimplementedinthenewproductionplanfromthethirdyearonwards.Thesorterincreasesthemetalgradeanddecreasesthemassofthemillfeed.Thisleadstolowerproductioncostsperproducedsilverounce.Thebenefitsoftheoresortingarebasedonthepilotrunmadein2015.Metalgradeincrease of 60% and 40%mass reject is assumed in the production plan. Theamountofunsortablefinefraction(particlessmallerthan10mm)isassumedtobe20%.ThesorterwillbetestedintheTekesprojectduringthefirsttwoproductionyearsonthegroundandfromthethirdproductionyearit’llbeimplementedinthepro-ductionplan.Asthirdyearonwards,thesorterwillbelocatedundergroundwithintegratedcrushingplant.
SilverMineBFSUpdate2016
SilverMineBFSUpdatereport Page11of63
OtherdevelopmenttargetsoftheTekesprojectareindustrialinternetimplemen-tation,remoteprocesscontrolandmodularmachinery.SotkamoSilverOyhasnegotiatedanoperationandmaintenancecontractwithOu-totecOyjtooptimizethestartoftheproduction.Thecontractcoverscommission-ing,rampupphaseandfirstoperatingyearofthebeneficiationplant.
1.5 TMFarea
TheTMF(TailingsManagementFacility)areaconstructionplanshaveprogressedandasaresultofthem,thetailingspondbuildingschedulehasbeenupdated;pre-sentplan istoconstructthewhole28hectarepond inonestagebeforestartofproduction. The costs of the construction have been updatedwith the tendersbasedonthenewgeotechnicaldesign.
1.6 Basecase
1.6.1 Investmentcost
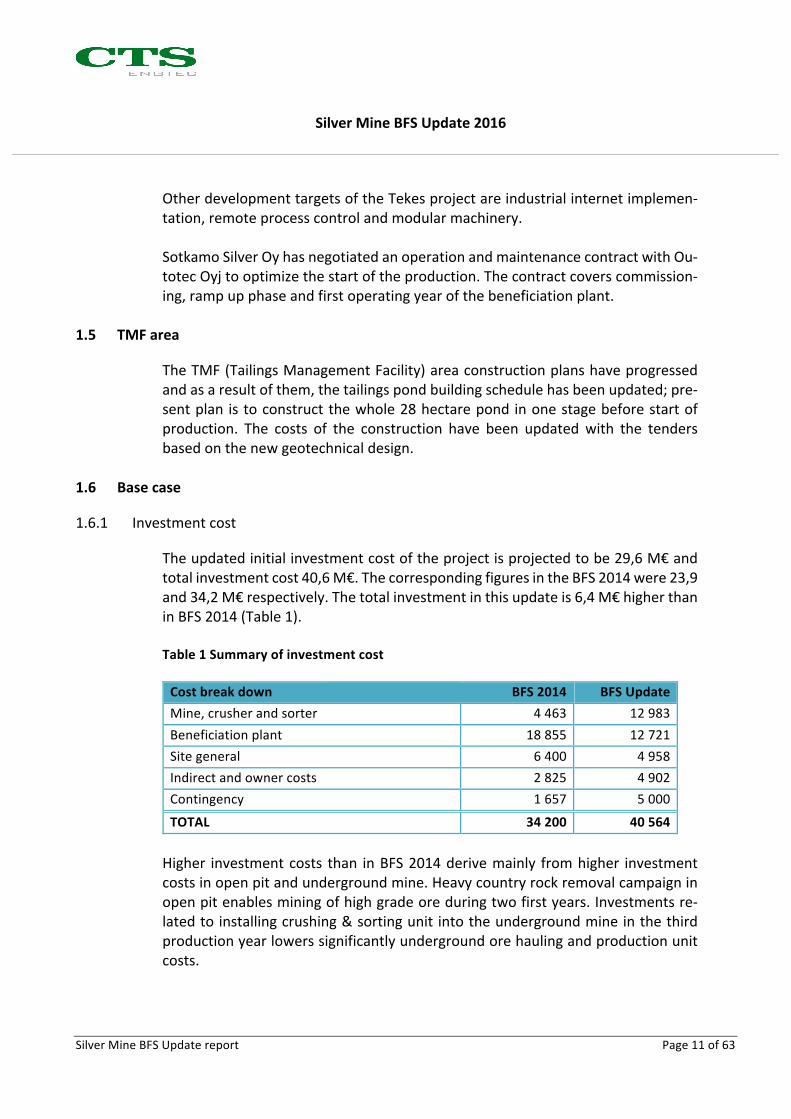
Theupdatedinitialinvestmentcostoftheprojectisprojectedtobe29,6M€andtotalinvestmentcost40,6M€.ThecorrespondingfiguresintheBFS2014were23,9and34,2M€respectively.Thetotalinvestmentinthisupdateis6,4M€higherthaninBFS2014(Table1).Table1Summaryofinvestmentcost
Costbreakdown BFS2014 BFSUpdateMine,crusherandsorter 4463 12983Beneficiationplant 18855 12721Sitegeneral 6400 4958Indirectandownercosts 2825 4902Contingency 1657 5000TOTAL 34200 40564
Higher investmentcosts than inBFS2014derivemainly fromhigher investmentcostsinopenpitandundergroundmine.Heavycountryrockremovalcampaigninopenpitenablesminingofhighgradeoreduringtwofirstyears.Investmentsre-latedtoinstallingcrushing&sortingunit intotheundergroundmineinthethirdproductionyearlowerssignificantlyundergroundorehaulingandproductionunitcosts.
SilverMineBFSUpdate2016
SilverMineBFSUpdatereport Page12of63
Thebeneficiationplantinvestmentis6,1M€lowerthaninBFS2014sincemostofthemachineryisalreadyacquiredwithBlaikenplantpurchase.Implementingse-condhandmachineryofBlaikenplantistakenintoaccountashighercontingency.
1.6.2 Operatingcost
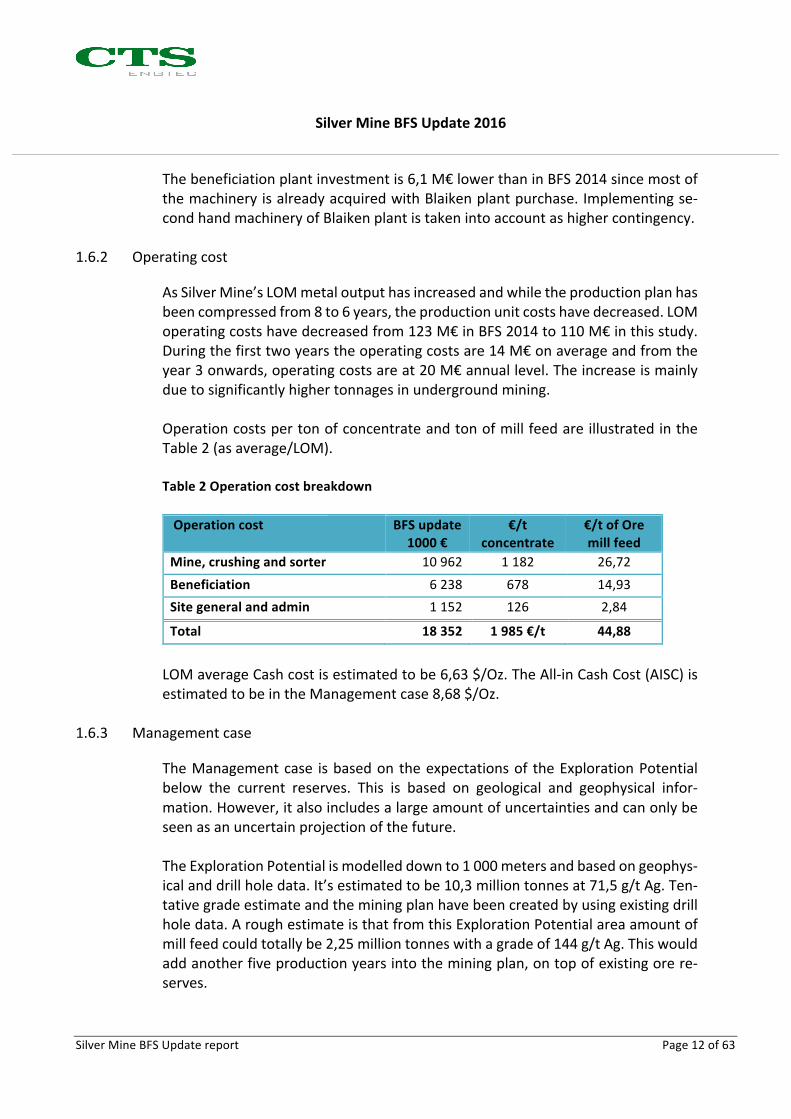
AsSilverMine’sLOMmetaloutputhasincreasedandwhiletheproductionplanhasbeencompressedfrom8to6years,theproductionunitcostshavedecreased.LOMoperatingcostshavedecreasedfrom123M€inBFS2014to110M€inthisstudy.Duringthefirsttwoyearstheoperatingcostsare14M€onaverageandfromtheyear3onwards,operatingcostsareat20M€annuallevel.Theincreaseismainlyduetosignificantlyhighertonnagesinundergroundmining.OperationcostspertonofconcentrateandtonofmillfeedareillustratedintheTable2(asaverage/LOM).Table2OperationcostbreakdownOperationcost BFSupdate
1000€€/t
concentrate€/tofOremillfeed
Mine,crushingandsorter 10962 1182 26,72Beneficiation 6238 678 14,93Sitegeneralandadmin 1152 126 2,84
Total 18352 1985€/t 44,88
LOMaverageCashcostisestimatedtobe6,63$/Oz.TheAll-inCashCost(AISC)isestimatedtobeintheManagementcase8,68$/Oz.
1.6.3 Managementcase
TheManagementcase isbasedontheexpectationsof theExplorationPotentialbelow the current reserves. This is based on geological and geophysical infor-mation.However,italsoincludesalargeamountofuncertaintiesandcanonlybeseenasanuncertainprojectionofthefuture.TheExplorationPotentialismodelleddownto1000metersandbasedongeophys-icalanddrillholedata.It’sestimatedtobe10,3milliontonnesat71,5g/tAg.Ten-tativegradeestimateandtheminingplanhavebeencreatedbyusingexistingdrillholedata.AroughestimateisthatfromthisExplorationPotentialareaamountofmillfeedcouldtotallybe2,25milliontonneswithagradeof144g/tAg.Thiswouldaddanotherfiveproductionyearsintotheminingplan,ontopofexistingorere-serves.

SilverMineBFSUpdate2016
SilverMineBFSUpdatereport Page13of63
During themanagement caseproductionyears (after year5), allore isquarriedfromtheUGmineandcrushed&sortedunderground.Themillfeedisplannedtobe450kt/a.During the fiveproductionyears, it’sapproximated that total silverproductionwillbe9,5Mozandtotalgoldproduction22koz.Totalproductionofzinc isapproximatedtobe18,85ktand leadrespectivelyca8ktduringthe fiveproductionyearsinthemanagementcase.
1.7 Economicanalyses
BothBaseCaseandManagementCaseeconomicanalysesarepresented.Sensitiv-ityanalysesareconductedtodifferentpricescenarios.
1.7.1 Basecaseeconomicanalyses
Intheeconomicanalysesoftheproject,theassumptionsintheTable3aremade.SensitivityoftheSilverMineprojectagainstmetalpricesisanalysedbythreedif-ferentscenarios,“ConsensusPrice”,“LowPrice”and“HighPrice”.Table3Metalpricescenarios
SILVERMINE-AVG(2016-2022)/case-MiningPlan160107 ConsensusPrice LowPrice HighPriceUSD/EUR 0,92 0,92 0,92Ag$/oz 14,9-20 12,7 28,0Au$/oz 1191-1256 1200 1500Zn$/t 1256-2067 1785 2800Pb$/t 1865-2072 1757 2500
Intheconsensuspricescenario,consensusmetalpriceforecastisapplied.Inthelowpricescenario,silverpriceof12,7$/ozandwinter2015-16levelothermetalpricesareassumed.Inthehighpricescenario,highpricesformetalsareassumed.Theresultsofthesensitivityanalysesarepresentedinthetablebelow.Asarefer-ence,correspondingresultsoftheBFS2014arepresentednexttotheresultsofthescenariosdepictedabove.
SilverMineBFSUpdate2016
SilverMineBFSUpdatereport Page14of63
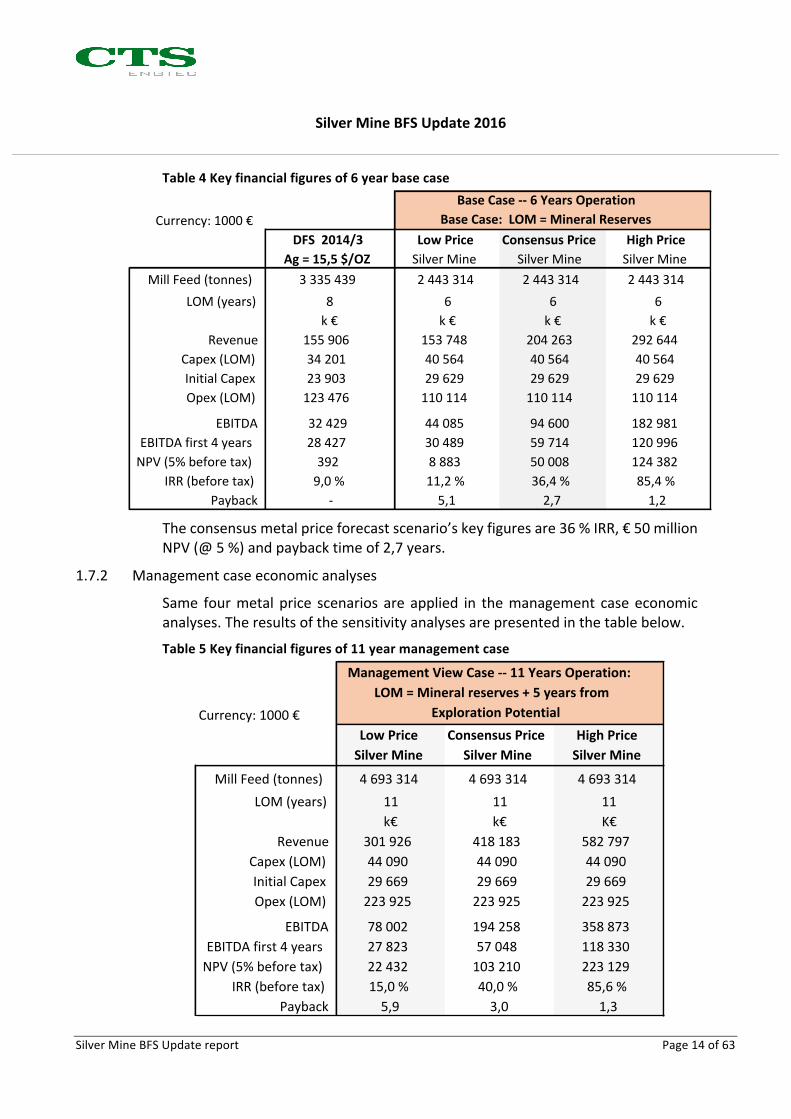
Table4Keyfinancialfiguresof6yearbasecase
Theconsensusmetalpriceforecastscenario’skeyfiguresare36%IRR,€50millionNPV(@5%)andpaybacktimeof2,7years.
1.7.2 Managementcaseeconomicanalyses
Same fourmetal price scenarios are applied in themanagement caseeconomicanalyses.Theresultsofthesensitivityanalysesarepresentedinthetablebelow.
Table5Keyfinancialfiguresof11yearmanagementcase
Currency:1000€DFS2014/3 LowPrice ConsensusPrice HighPrice
Ag=15,5$/OZ SilverMine SilverMine SilverMineMillFeed(tonnes) 3335439 2443314 2443314 2443314
LOM(years) 8 6 6 6k€ k€ k€ k€
Revenue 155906 153748 204263 292644Capex(LOM) 34201 40564 40564 40564InitialCapex 23903 29629 29629 29629Opex(LOM) 123476 110114 110114 110114
EBITDA 32429 44085 94600 182981EBITDAfirst4years 28427 30489 59714 120996NPV(5%beforetax) 392 8883 50008 124382
IRR(beforetax) 9,0% 11,2% 36,4% 85,4%Payback - 5,1 2,7 1,2
BaseCase--6YearsOperationBaseCase:LOM=MineralReserves
Currency:1000€LowPrice ConsensusPrice HighPriceSilverMine SilverMine SilverMine
MillFeed(tonnes) 4693314 4693314 4693314LOM(years) 11 11 11
k€ k€ K€Revenue 301926 418183 582797
Capex(LOM) 44090 44090 44090InitialCapex 29669 29669 29669Opex(LOM) 223925 223925 223925
EBITDA 78002 194258 358873EBITDAfirst4years 27823 57048 118330NPV(5%beforetax) 22432 103210 223129
IRR(beforetax) 15,0% 40,0% 85,6%Payback 5,9 3,0 1,3
ManagementViewCase--11YearsOperation:LOM=Mineralreserves+5yearsfrom
ExplorationPotential

SilverMineBFSUpdate2016
SilverMineBFSUpdatereport Page15of63
2 STUDIESBETWEENBFSREPORT2014ANDBFSUPDATE2016
Significantupdatesbetween2014and2016springhasbeenexecutedtominingandproductionplan,changesarebasedontheresultsfromtheinvestigationsaftertheBFS2014.Changesareduetothedrillingcampaign2014,thesortertestsin2015andtheupdatedmineplanwhichtakesintoaccountthenewdrillingresultsandtheinfluenceofthesorteruseinminingandprocessing.Thedrillingcampaignin2014ispresentedinchapter2.1.Testswiththeoresorterarepresentedinchapter2.2andtheup-datedmineplaninchapter2.3.ThenewMiningPlanandtheOreReserveEstimatehavebeenpreparedinaccordancewiththeguidelinesoftheJORCCode(2012).TheMiningPlanauditbyOutotec(Finland)Oyjhasbeenreviewedinchapter2.4.Fromthethirdproductionyearonwardsundergroundcrushingandoresortingareimplementedintotheproductionplan.Oresortingispresentedinthechapter2.2.TMF,countryrockandmarginaloreareasoilsurveyinchapter2.6andthepermit-tingstatusofSilverMinearepresentedinchapter2.7.Inadditiontothepreviousupdates,theexplorationpotentialinthedeposit’sdepthcontinuationhasbeenstudied.Management’sviewofthispotentialispresentedinthechapter2.5.
2.1 SotkamoSilver,2014drillingcampaign
SotkamoSilverconductedadiamond-drillingcampaignin2014attheSilverMinetofurtherstudytheore-formation,explorethedepth-extensionandtodrillholesfor newelectricity-cablesbetween themine-levels.All drillingwasundergrounddrilling.Altogether13holestotal2502metersweredrilled.DrillingwascarriedoutwithNQequipment,whichgivesa50,7mmcoreindiameter.Themine’selectricitywasimprovedbyinstallingtwonewcablesinseparateholesbetween levels+84,+175,+255and+330.Thisenabledtheconstructionofnewpowerstationsateachlevel.HolesTU6andTU7weredrilledtoconfirmcontinuityofthedeposit.ThefourholesTU11,TU20,TU18andTU76weredrilledtoinvestigatethelowerpartofthede-positandthecontinuitydownwards.Onelonghole,TU1wasdrilledtoresearchthegeophysicalanomalythatextendssouthfromthemaindeposit(figure1).Drill-holeTU1wasdrilledfromthedeepestpartoftheproduction-tunneltoclarifyreasonsofthegeophysicalanomalydefinedbyearlierSampo-surveys.

SilverMineBFSUpdate2016
SilverMineBFSUpdatereport Page16of63
Inthedepthof611-615meterthesemi-massivesulfide-zonewasintersectedcon-taining9%sulfurand1,1%zinc.Inthedepthof808-810metersthereisa2meterintersectioncontaining152g/tsilverand0,6g/tgold.Theseobservationsare200-300meters apart from earlier known ore-depositmodel. This indicates awide-spreadoccurrenceofore-formingprocessesandhighorepotentialofthearea.HolesTU6andTU7weredrilledtoconfirmthecontinuityofthemineralresource.Inbothholes,silver-gradesabovecut-offvalueof50g/tsilverwasfound.HolesTU11,TU18,TU20andTU76weredrilledinthelowerpartoftheknowndepositandbelowit.HolesTU11,TU18andTU20intersectthesilvermineralization,whichexceedthecut-off-valueandconfirmthecontinuityofthedepositandwillincreasethemineral-resources.HoleTU76 isoneofbestholesdrilled in thispartofdeposit,about100metersbelowearlierobservations.Thecorecontainsa17,5meterintersectionwith266g/tsilverand0,73g/tgold.Insidethisintersectionthebestpartcontains411g/tsilverand1,2g/tgoldatalengthof7,65meters.Theactualwidthoftheintersectedlayerisabout5metersastheintersectionisoblique.Drillingresultsconfirmthedeepextensionofthesilverdepositandthatoreformingprocesseshavebeenextensive.Totaldrillingintheareacomprisesmorethan500drill-holes and over 60 km drilling. Silver deposit database consists of 410 drill-holes,totally57km.
Figure1Sampoanomalyandsomeofthedrillingintersectionsinthe2014campaign

SilverMineBFSUpdate2016
SilverMineBFSUpdatereport Page17of63
2.2 Sortertests
Thesorter testswereconductedduring the summer2015.Sorter tests includedsamplingattheSilverMine,samplepreparationattheGTKMinteklabandsortertestsatTomrasiteinGermany.
2.2.1 Oresampling
TheorewasfirstsampledfromtesttunnelminedintoorezoneofSilverMine(fig-ure2).Totally2200kgofsamplesweretakenfromthestope.Samplingwasplannedonhistoricalanalyticsdonefromthequarryandgradecon-trolwas supportedwithaPXRF. The targetwas toproduce samples that corre-spondedwiththegradesinthetestquarrytomimicthereal-lifecircumstancesasorterdevicewouldhavetohandle.Sampleswereclassifiedasfootwalllow-graderock,lowgradeore(30ppmAg)andhighgrade(100ppmAg)ore.
Figure2Samplingsiteintestminingtunnelat160level(circle)
SilverMineBFSUpdate2016
SilverMineBFSUpdatereport Page18of63
2.2.2 Samplepreparation
Aftersampling,thesamplesweretakentoGTKMinteklabinOutokumpu.Allthesampleswereweighedandcrushedtomaximumøof75mm.Aftercrushing,thesampleswereweighedagain.Eachsamplewasthensieved into0-10,10-30,30-70mmfractions.Itwasdecidedtochoosethe30-70mmfractionforthesortertestatTomrasiteinGermany.Twosamples,high(yellow)andaverage(green)silvercontentwerepre-paredforsortertest(Table6).ApressreleaseofDetailedstudyofsamplingandsamplepreparationispresentedinthecompanywww-pageswww.silver.fi. Table6Sorterfeedcomposition
2.2.3 OresortingtestsatTomra
AttheTomrasiteinGermany,thesampleswerefurthermixedtoproduceaho-mogenousfeedforthesorter.ThetestwasexecutedwithaTomrasortershownintheFigure3andtheprincipleofthesorterisshowninfigure4.
Figure3TomraXRTsorterusedinthesortingtest

SilverMineBFSUpdate2016
SilverMineBFSUpdatereport Page19of63
Figure4Theprincipleoftheoresorter
TheXRTsorterseparationisbasedonatomicdensityofthematerial.Silver,silverbearingandotherminerals’atomicdensitiesinthetestedsamplesarehigherthanthegangueandisthusdetectedandseparatedtosorterproduct.Becausethex-rayspassthroughtheparticlesandareameasureoftheattenuationthroughtheentirerock,XRTseparationisalmostindependentofsurfacequalityofthematerialor itsmoisture.Surfacepropertiessuchascolorandtextureand/orcontaminationssuchasdirt,dust,paint,etc.aremainlyirrelevanttothedetection.Theusedsorterinthistestworkhasaworkingwidthof600mmandwasrunatabeltspeedof2,7m/s.Thefeedrateforeachsortingtestiscalculatedforastandardunitof1200mmsortingwidth.Theresultsofthetestsshowsilvercontentincreaseof93%insortedproductoflowgradefeed(60Agg/t)and40%insortedproductofaveragefeed(139Agg/t).It shouldbenoted thatalmost60%of thematerial from the lowgrade feed isejectedtosorterrejectwhichreducesthemillfeedmasssignificantly(Table7).Table7OreSortertestresults(finesincluded)
SilverMineBFSUpdate2016
SilverMineBFSUpdatereport Page20of63
2.3 Miningplan
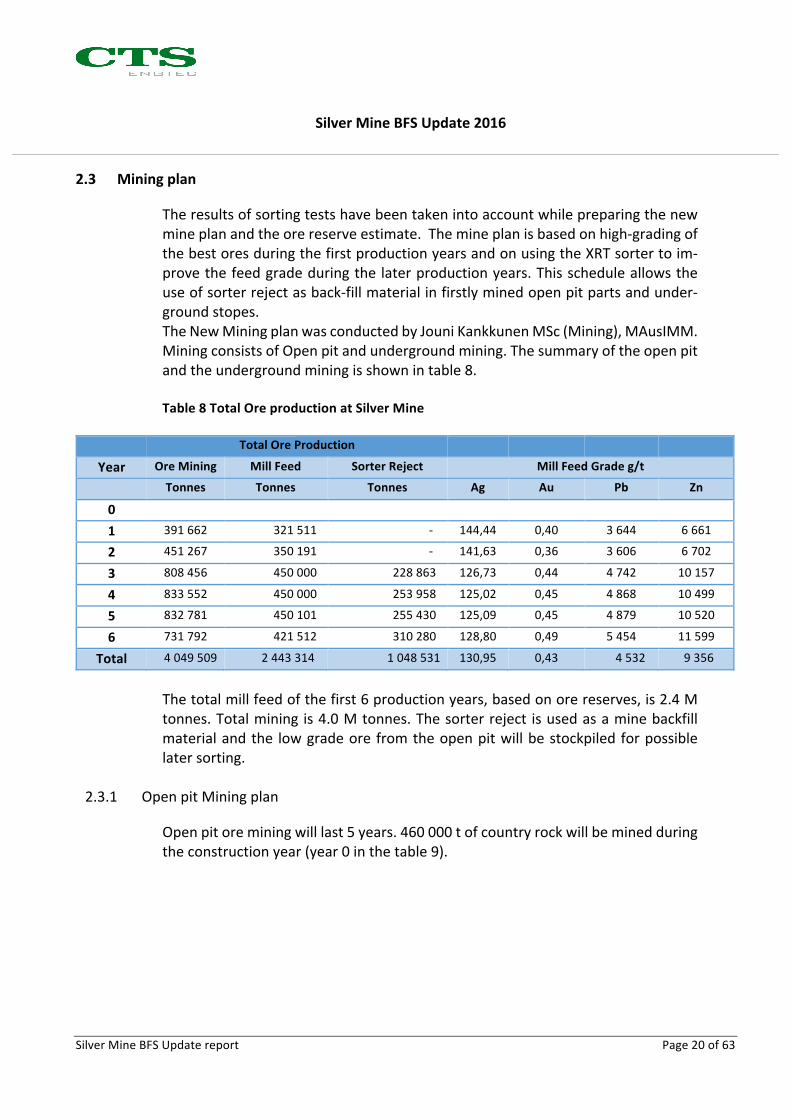
Theresultsofsortingtestshavebeentakenintoaccountwhilepreparingthenewmineplanandtheorereserveestimate.Themineplanisbasedonhigh-gradingofthebestoresduringthefirstproductionyearsandonusingtheXRTsortertoim-provethefeedgradeduringthelaterproductionyears.Thisscheduleallowstheuseofsorterrejectasback-fillmaterialinfirstlyminedopenpitpartsandunder-groundstopes.TheNewMiningplanwasconductedbyJouniKankkunenMSc(Mining),MAusIMM.MiningconsistsofOpenpitandundergroundmining.Thesummaryoftheopenpitandtheundergroundminingisshownintable8.Table8TotalOreproductionatSilverMine
TotalOreProduction
Year OreMining MillFeed SorterReject MillFeedGradeg/t
Tonnes Tonnes Tonnes Ag Au Pb Zn
0
1 391662 321511 - 144,44 0,40 3644 6661
2 451267 350191 - 141,63 0,36 3606 6702
3 808456 450000 228863 126,73 0,44 4742 10157
4 833552 450000 253958 125,02 0,45 4868 10499
5 832781 450101 255430 125,09 0,45 4879 10520
6 731792 421512 310280 128,80 0,49 5454 11599
Total 4049509 2443314 1048531 130,95 0,43 4532 9356
Thetotalmillfeedofthefirst6productionyears,basedonorereserves,is2.4Mtonnes.Totalmining is4.0Mtonnes.Thesorterreject isusedasaminebackfillmaterialandthe lowgradeore fromtheopenpitwillbestockpiled forpossiblelatersorting.
2.3.1 OpenpitMiningplan
Openpitoreminingwilllast5years.460000tofcountryrockwillbeminedduringtheconstructionyear(year0inthetable9).
SilverMineBFSUpdate2016
SilverMineBFSUpdatereport Page21of63
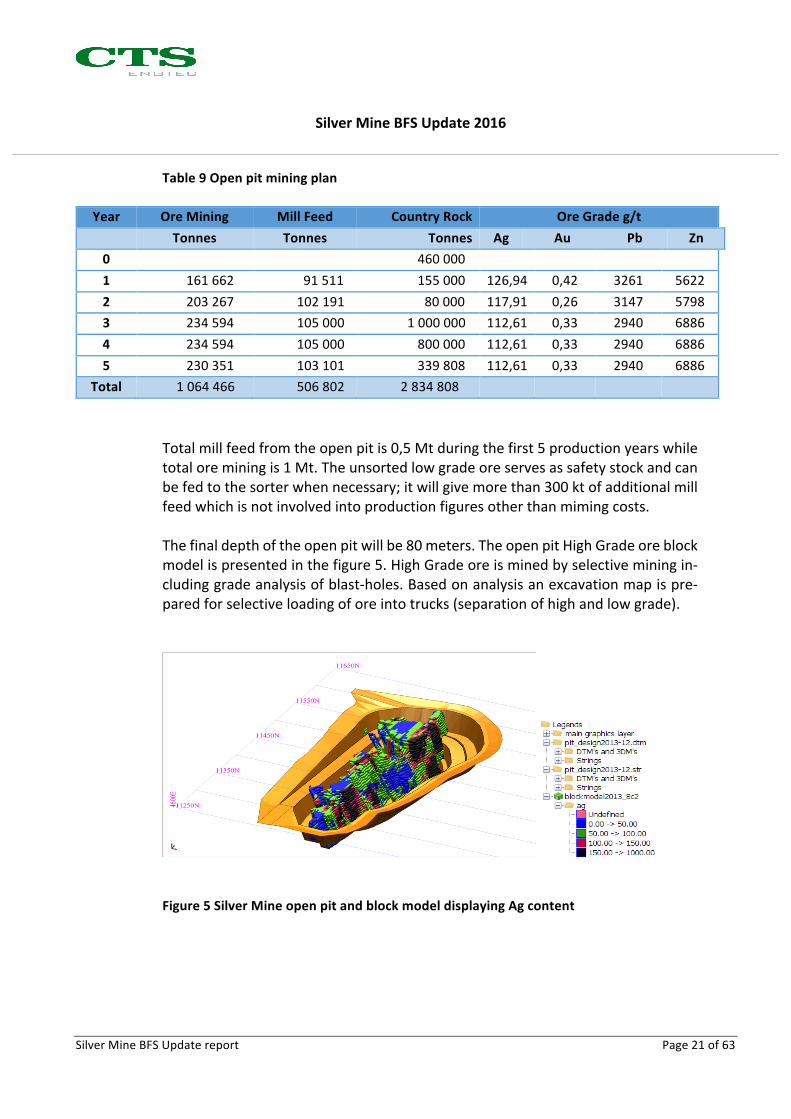
Table9Openpitminingplan
Year OreMining MillFeed CountryRock OreGradeg/t Tonnes Tonnes Tonnes Ag Au Pb Zn0 460000 1 161662 91511 155000 126,94 0,42 3261 56222 203267 102191 80000 117,91 0,26 3147 57983 234594 105000 1000000 112,61 0,33 2940 68864 234594 105000 800000 112,61 0,33 2940 68865 230351 103101 339808 112,61 0,33 2940 6886
Total 1064466 506802 2834808 Totalmillfeedfromtheopenpitis0,5Mtduringthefirst5productionyearswhiletotaloreminingis1Mt.Theunsortedlowgradeoreservesassafetystockandcanbefedtothesorterwhennecessary;itwillgivemorethan300ktofadditionalmillfeedwhichisnotinvolvedintoproductionfiguresotherthanmimingcosts.Thefinaldepthoftheopenpitwillbe80meters.TheopenpitHighGradeoreblockmodelispresentedinthefigure5.HighGradeoreisminedbyselectiveminingin-cludinggradeanalysisofblast-holes.Basedonanalysisanexcavationmapispre-paredforselectiveloadingoforeintotrucks(separationofhighandlowgrade).
Figure5SilverMineopenpitandblockmodeldisplayingAgcontent
SilverMineBFSUpdate2016
SilverMineBFSUpdatereport Page22of63
2.3.2 UndergroundMine
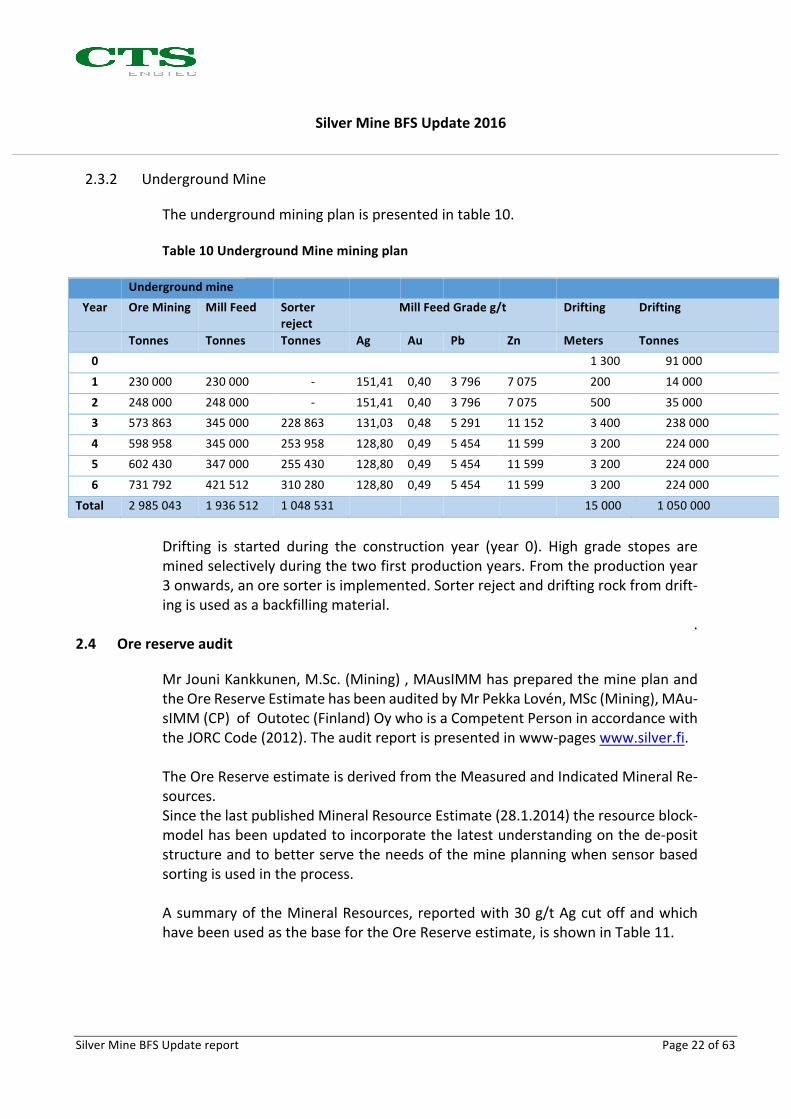
Theundergroundminingplanispresentedintable10.Table10UndergroundMineminingplan
Undergroundmine Year OreMining MillFeed Sorter
rejectMillFeedGradeg/t Drifting Drifting
Tonnes Tonnes Tonnes Ag Au Pb Zn Meters Tonnes0 1300 910001 230000 230000 - 151,41 0,40 3796 7075 200 140002 248000 248000 - 151,41 0,40 3796 7075 500 350003 573863 345000 228863 131,03 0,48 5291 11152 3400 2380004 598958 345000 253958 128,80 0,49 5454 11599 3200 2240005 602430 347000 255430 128,80 0,49 5454 11599 3200 2240006 731792 421512 310280 128,80 0,49 5454 11599 3200 224000
Total 2985043 1936512 1048531 15000 1050000
Drifting is started during the construction year (year 0). High grade stopes areminedselectivelyduringthetwofirstproductionyears.Fromtheproductionyear3onwards,anoresorterisimplemented.Sorterrejectanddriftingrockfromdrift-ingisusedasabackfillingmaterial.
.2.4 Orereserveaudit
MrJouniKankkunen,M.Sc.(Mining),MAusIMMhaspreparedthemineplanandtheOreReserveEstimatehasbeenauditedbyMrPekkaLovén,MSc(Mining),MAu-sIMM(CP)ofOutotec(Finland)OywhoisaCompetentPersoninaccordancewiththeJORCCode(2012).Theauditreportispresentedinwww-pageswww.silver.fi.TheOreReserveestimateisderivedfromtheMeasuredandIndicatedMineralRe-sources.SincethelastpublishedMineralResourceEstimate(28.1.2014)theresourceblock-modelhasbeenupdatedtoincorporatethelatestunderstandingonthede-positstructureandtobetterservetheneedsofthemineplanningwhensensorbasedsortingisusedintheprocess.AsummaryoftheMineralResources,reportedwith30g/tAgcutoffandwhichhavebeenusedasthebasefortheOreReserveestimate,isshowninTable11.
SilverMineBFSUpdate2016
SilverMineBFSUpdatereport Page23of63
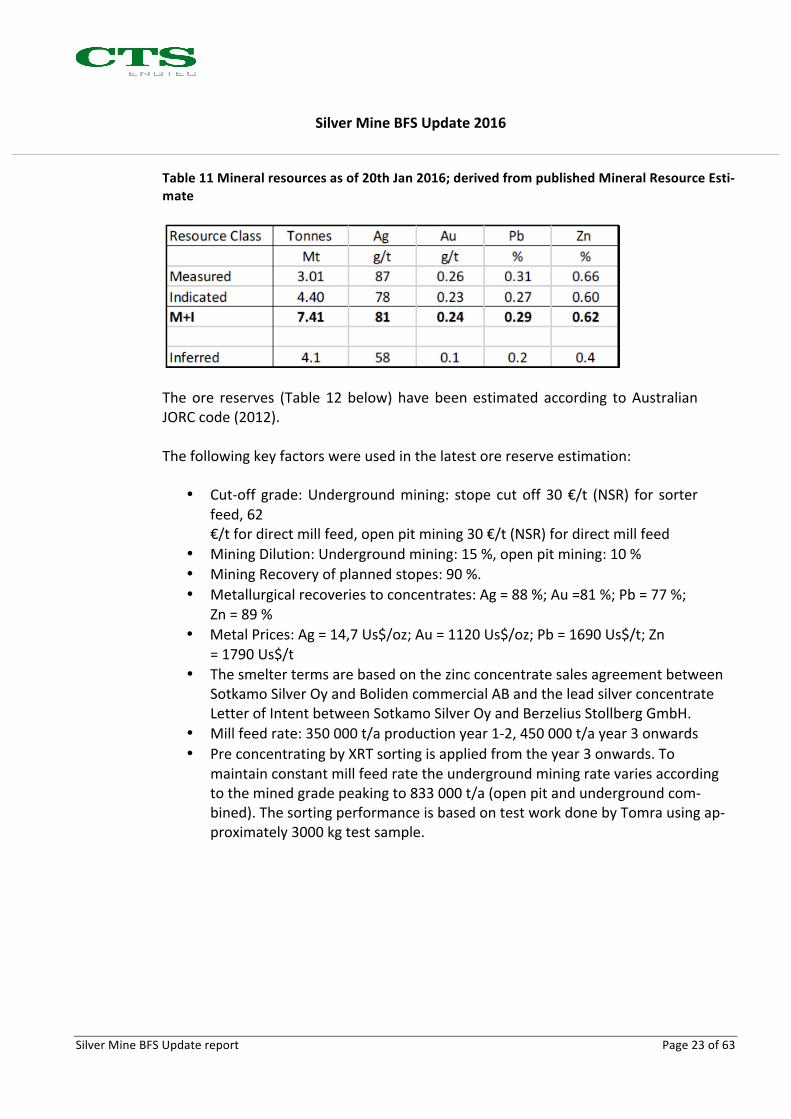
Table11Mineralresourcesasof20thJan2016;derivedfrompublishedMineralResourceEsti-mate
Theore reserves (Table 12below)havebeenestimated according toAustralianJORCcode(2012).Thefollowingkeyfactorswereusedinthelatestorereserveestimation:
• Cut-off grade:Undergroundmining: stope cutoff 30€/t (NSR) for sorterfeed,62€/tfordirectmillfeed,openpitmining30€/t(NSR)fordirectmillfeed
• MiningDilution:Undergroundmining:15%,openpitmining:10%• MiningRecoveryofplannedstopes:90%.• Metallurgicalrecoveriestoconcentrates:Ag=88%;Au=81%;Pb=77%;
Zn=89%• MetalPrices:Ag=14,7Us$/oz;Au=1120Us$/oz;Pb=1690Us$/t;Zn
=1790Us$/t• Thesmeltertermsarebasedonthezincconcentratesalesagreementbetween
SotkamoSilverOyandBolidencommercialABandtheleadsilverconcentrateLetterofIntentbetweenSotkamoSilverOyandBerzeliusStollbergGmbH.
• Millfeedrate:350000t/aproductionyear1-2,450000t/ayear3onwards• PreconcentratingbyXRTsortingisappliedfromtheyear3onwards.To
maintainconstantmillfeedratetheundergroundminingratevariesaccordingtotheminedgradepeakingto833000t/a(openpitandundergroundcom-bined).ThesortingperformanceisbasedontestworkdonebyTomrausingap-proximately3000kgtestsample.
SilverMineBFSUpdate2016
SilverMineBFSUpdatereport Page24of63
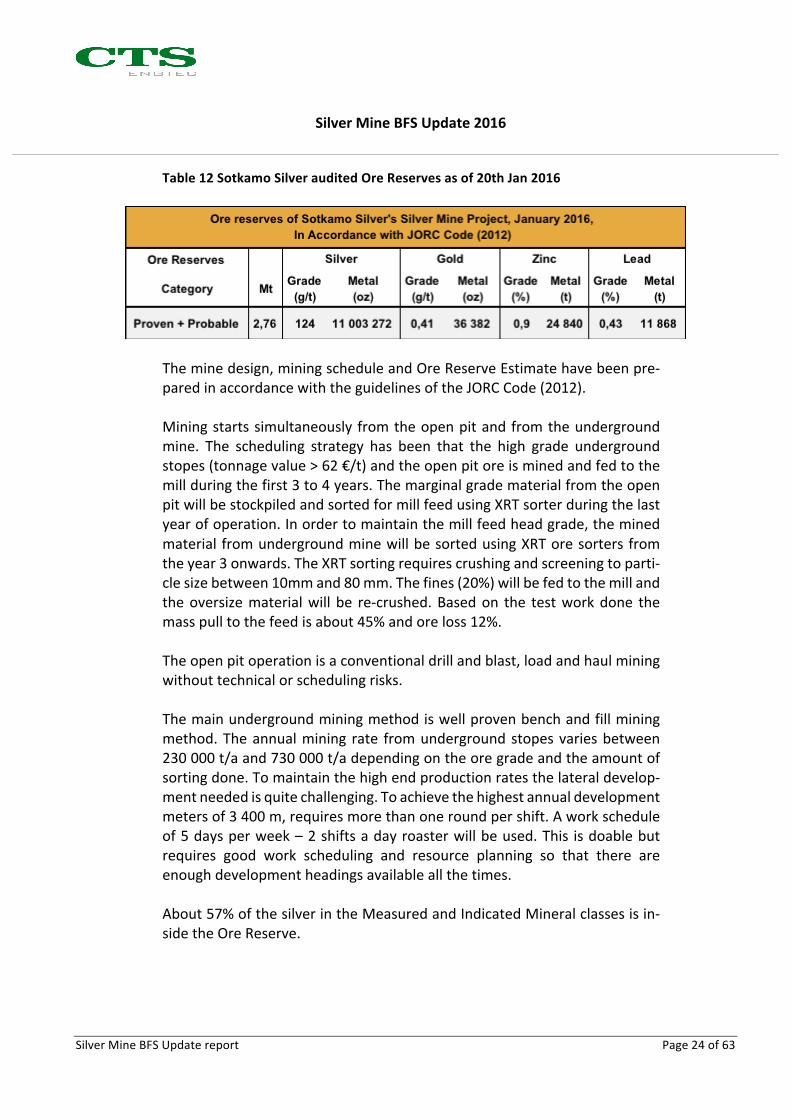
Table12SotkamoSilverauditedOreReservesasof20thJan2016
Theminedesign,miningscheduleandOreReserveEstimatehavebeenpre-paredinaccordancewiththeguidelinesoftheJORCCode(2012).Miningstartssimultaneously fromtheopenpitandfromtheundergroundmine. The scheduling strategy has been that the high grade undergroundstopes(tonnagevalue>62€/t)andtheopenpitoreisminedandfedtothemillduringthefirst3to4years.ThemarginalgradematerialfromtheopenpitwillbestockpiledandsortedformillfeedusingXRTsorterduringthelastyearofoperation.Inordertomaintainthemillfeedheadgrade,theminedmaterial fromundergroundminewillbesortedusingXRToresortersfromtheyear3onwards.TheXRTsortingrequirescrushingandscreeningtoparti-clesizebetween10mmand80mm.Thefines(20%)willbefedtothemillandtheoversizematerialwill be re-crushed.Basedon the testworkdone themasspulltothefeedisabout45%andoreloss12%.Theopenpitoperationisaconventionaldrillandblast,loadandhaulminingwithouttechnicalorschedulingrisks.Themainundergroundminingmethodiswellprovenbenchandfillminingmethod.Theannualmining rate fromundergroundstopesvariesbetween230000t/aand730000t/adependingontheoregradeandtheamountofsortingdone.Tomaintainthehighendproductionratesthelateraldevelop-mentneededisquitechallenging.Toachievethehighestannualdevelopmentmetersof3400m,requiresmorethanoneroundpershift.Aworkscheduleof5daysperweek–2shiftsadayroasterwillbeused.This isdoablebutrequires good work scheduling and resource planning so that there areenoughdevelopmentheadingsavailableallthetimes.About57%ofthesilverintheMeasuredandIndicatedMineralclassesisin-sidetheOreReserve.

SilverMineBFSUpdate2016
SilverMineBFSUpdatereport Page25of63
ComparisontothepreviousOreReserveestimates(January2014)showsthedecreaseofthetonnageby17%andincreaseofAggradeby22%.ThisisduetotherevisedMineralResourceblockmodelandtheapplicationXRTsorting.
2.5 Sorter,TekesprojectandOutotecO&Mserviceconcept
Duringthefirsttwoyearsofproduction,oresortingwillbetestedon-siteatSilverMineaspartoftheTekesproject.Industrialinternetimplementation,remotepro-cesscontrolandmodularmachinerywillbedevelopedduringtheTekesproject.Asthirdyearonwards,thesorterwillbelocatedundergroundwithintegratedcrushingplant.Sensorbasedoresortingisimplementedinthenewproductionplanfromthethirdyearonwards.Thesorterincreasesthemetalcontentandde-creasesthemassofthemillfeed.Thisleadstolowerproductioncostsperproducedsilverounce.Thebenefitsoftheoresortingarebasedonthepilotrunmadein2015.Metalcon-tent increaseof60%and40%massrejectareassumedintheproductionplan.Formationofunsortablefinefraction(particlessmallerthan10mm)isassumedtobe20%.SotkamoSilverOyhasnegotiatedanoperationandmaintenancecontractwithOutotecOyjtooptimizethestartoftheproduction.Thecontractcoverscommis-sioning,rampupphaseandfirstoperatingyearofthebeneficiationplant.
2.6 TMF,countryrockandmarginaloreareasoilsurvey
TailingsManagementFacility(TMF),countryrock&marginaloreareasoilsurveyon-sitesamplingwasexecutedinJuly-August2014.Morethan140samplesweretaken.ThesurveywasexecutedbyPöyryandtheresultswereincludedintheTMF&marginaloreareageotechnicalplanning.
2.7 PermittingstatusoftheSilverMineProject
AfterBFS2014,SilverMineprojectwasgrantedchemicalpermit inMarch2015.ThepermitisgrantedbyTukes(TheFinnishSafetyandChemicalAgency)andit’sconcerningprocessingandstoringofchemicalsusedinthebeneficiationprocess.
SilverMineBFSUpdate2016
SilverMineBFSUpdatereport Page26of63
3 BFSUPDATE
InthischapterthechangesandupdatestooriginalBFS2014conceptisdescribed.
3.1 Mine
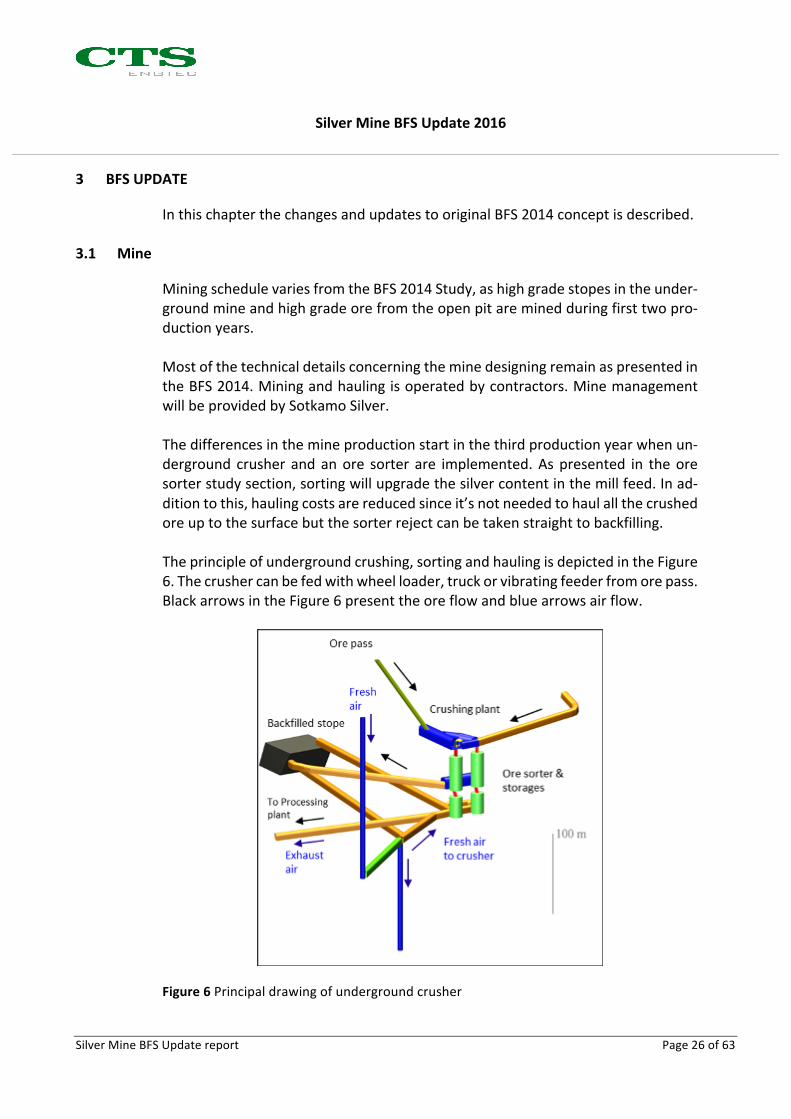
MiningschedulevariesfromtheBFS2014Study,ashighgradestopesintheunder-groundmineandhighgradeorefromtheopenpitareminedduringfirsttwopro-ductionyears.MostofthetechnicaldetailsconcerningtheminedesigningremainaspresentedintheBFS2014.Miningandhaulingisoperatedbycontractors.MinemanagementwillbeprovidedbySotkamoSilver.Thedifferencesinthemineproductionstartinthethirdproductionyearwhenun-derground crusher andanore sorter are implemented.Aspresented in theoresorterstudysection,sortingwillupgradethesilvercontentinthemillfeed.Inad-ditiontothis,haulingcostsarereducedsinceit’snotneededtohaulallthecrushedoreuptothesurfacebutthesorterrejectcanbetakenstraighttobackfilling.Theprincipleofundergroundcrushing,sortingandhaulingisdepictedintheFigure6.Thecrushercanbefedwithwheelloader,truckorvibratingfeederfromorepass.BlackarrowsintheFigure6presenttheoreflowandbluearrowsairflow.
Figure6Principaldrawingofundergroundcrusher

SilverMineBFSUpdate2016
SilverMineBFSUpdatereport Page27of63
3.2 Crushing
Thetechnicaldesigncriteriaofthecrushingplant,beltconveyors,screens,dustandnoisemitigationsystemsisequaltotheoneinBFS2014.Sincethesortingistestedduringthefirsttwoyearsandmovedundergroundduringthethirdproductionyear,thecrushinglayoutismodifiedfromtheBFS2014.Thepreliminarycrushingflow-sheetforproductionyears1and2ofthecrusherispresentedintheFigure7.How-ever,duringthesortertests,thesetupwillbedifferentandduringtheteststheoptimalcrushing&sortinglayoutandflowdiagramwillbedetermined.
AsanadjustmenttothelayoutofBFS2014,thesecondarycrusher(conecrusher)islocatedinsidetheprocessingplant.Thisisdonetosecurethemillfeedduringtheweekendswhenprimarycrusherisnotrunning.Twosilosarelocatedalsoinsidetheprocessingplant.This isduetoavoid the freezingof the finematerialwhenstockpiledoutside.Thecoarsematerial(30-70mm)isstoredintotheoutdoorstor-age.
Figure7Crushing&Sortingtestflowflowsheetforproductionyears1&2
Duringthethirdproductionyear,crushingismovedunderground.Preliminaryde-signoftheundergroundcrushingplantispresentedintheFigure8.

SilverMineBFSUpdate2016
SilverMineBFSUpdatereport Page28of63
Figure8Undergroundcrushingplant’spreliminarylayout
Preliminarycrushing flowsheetof theundergroundmine ispresented intheFigure9.ThecrushingandsortingsolutionswillbetestedintheTekesprojectduring the first twoproductionyearsand the finaldesignof theundergroundcrusherwillbedecidedaccordingtotheresultsintheTekesproject.Alsofinalamountofthesilosandlocationswillbedecidedthen.
Figure9Preliminarycrushingflowsheetduringproductionyears3-6
3.3 OreSorter
Fromthethirdproductionyearonwards,theminedandcrushedoreisfedfirsttotheXRToresorterwheretheoreisupgradedbyseparatingthehighermetalcon-tentmaterialtothemillfeedandthelowermetalcontentmaterialtothesorterreject.
SilverMineBFSUpdate2016
SilverMineBFSUpdatereport Page29of63
Thesorterwillbeplacedundergroundwithacrushingstationwhichtogetherwillformapre-concentratingunit.Thebenefitsoforesortingwillbemetalcontentup-gradeinthemillfeedandlowerhaulingandprocessingcosts.Sincethesorterrejectisseparatedfromthemillfeedundergroundandtakenstraighttobackfilling,lessmaterialisneededtobehauledfromtheundergroundtunnel.
3.3.1 Sorterlayoutandflowdiagram
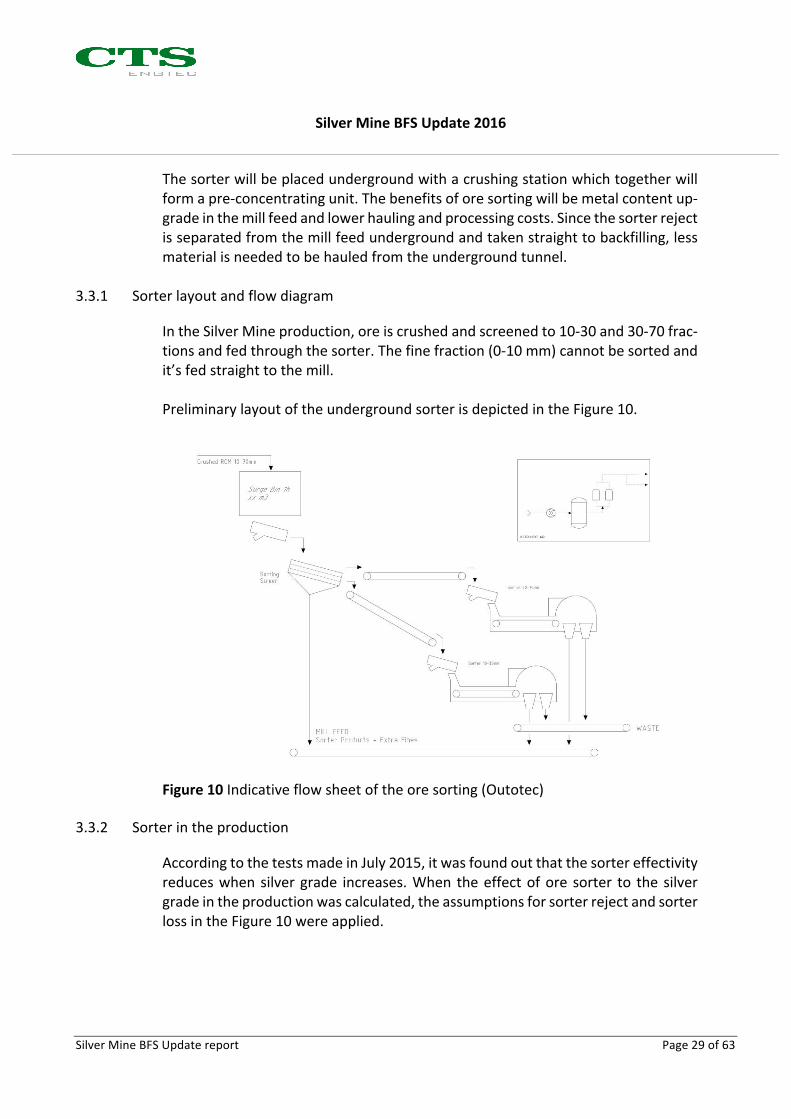
IntheSilverMineproduction,oreiscrushedandscreenedto10-30and30-70frac-tionsandfedthroughthesorter.Thefinefraction(0-10mm)cannotbesortedandit’sfedstraighttothemill.PreliminarylayoutoftheundergroundsorterisdepictedintheFigure10.
Figure10Indicativeflowsheetoftheoresorting(Outotec)
3.3.2 Sorterintheproduction
AccordingtothetestsmadeinJuly2015,itwasfoundoutthatthesortereffectivityreduceswhensilvergrade increases.When theeffectofore sorter to the silvergradeintheproductionwascalculated,theassumptionsforsorterrejectandsorterlossintheFigure10wereapplied.

SilverMineBFSUpdate2016
SilverMineBFSUpdatereport Page30of63
Figure11OresortingperformanceasafunctionofAggrade(g/t)Whentheeffectoforesortingwasimplementedintotheproductionplan,followingfactorswereapplied:finefractionof20%(particlesize<10mm),TheparametersofXRTsortingareonaverageforreject55%andore loss12%.Thismeansthatsortingequipmentcanseparate55%oftheganguerockincludedintheminedorewhileitloses12%ofmetalsintothesortingreject(ie.internalrecoveryofsortingequipmentis88%).ThematerialbalanceofcrushingandsortingispresentedintheTable13Table13Crushingandoresortingmassbalance
SecondaryCrusher MillfeedOPore UGore OPore UGore OPore UGore OPore UGore OPore UGore Process ingplant (0-~15mm)
0 - - - - - - - - -
1 91511 230000 18302 46000 - - - - 257209 321511
2 102191 248000 20438 49600 - - - - 280152 350191
3 105000 573863 21000 114773 - 459090 - 228863 - 230227 314227 450000
4 105000 598958 21000 119792 - 479167 - 253958 - 225208 309208 450000
5 103101 602430 20620 120486 - 481944 - 255430 - 226514 308995 450101
6 - 731792 - 146358 - 585433 - 310280 - 275154 275154 421512
Tota l 506802 2985043 101360 597009 - 2005634 - 1048531 - 957103 1744945 2443314
PrimaryCrusherfeed Fines(0-10mm) Sorterfeed(10-70mm) SorterWaste SorterProduct
Intheproductioncalculationsca60%metalcontentupgradesintheUGmillfeedare achieved by sorting and ca 40m-% of themined undergroundmine ore isejectedfromthemillfeedassorterreject.
SilverMineBFSUpdate2016
SilverMineBFSUpdatereport Page31of63
3.4 Beneficiationprocess
Thebeneficiationprocesshasbeenmodifiedbyremovingtherodmillfromthepro-cessandincreasingthecapacityoftheballmill.Asaresultofthis,thetargetmillfeedparticlesizehasdecreasedfromP8025mmtoP8015mm.It’sbeenstudiedthattheselectedballmill’scapacityissufficienttoprocessthemillfeedof450kt/a.Themillingefficiencywillbecontrolledbymotors’frequencyconvertersandtheballloadinglevel.IntheBFS2014dewateringplan,alltheconcentratesarefilteredwithajointpres-surefilter.ThisisupdatedasaccordingtothenewplanAgPbandZnAg–concen-tratesarefilteredwithajointpressurefilterandpyriteconcentratewithaseparatediscfilter.
3.4.1 Beneficiationprocessproducts
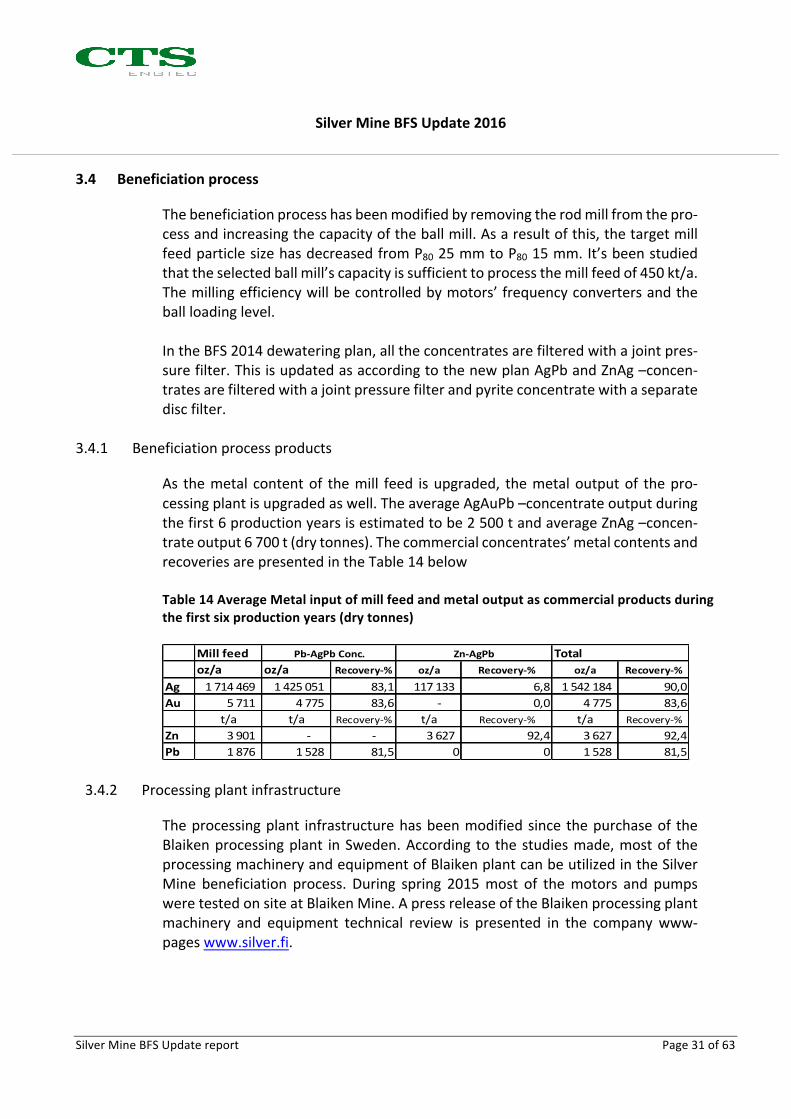
As themetal contentof themill feed isupgraded, themetaloutputof thepro-cessingplantisupgradedaswell.TheaverageAgAuPb–concentrateoutputduringthefirst6productionyearsisestimatedtobe2500tandaverageZnAg–concen-trateoutput6700t(drytonnes).Thecommercialconcentrates’metalcontentsandrecoveriesarepresentedintheTable14belowTable14AverageMetalinputofmillfeedandmetaloutputascommercialproductsduringthefirstsixproductionyears(drytonnes)
Millfeedoz/a oz/a Recovery-% oz/a Recovery-% oz/a Recovery-%
Ag 1714469 1425051 83,1 117133 6,8 1542184 90,0Au 5711 4775 83,6 - 0,0 4775 83,6
t/a t/a Recovery-% t/a Recovery-% t/a Recovery-%Zn 3901 - - 3627 92,4 3627 92,4Pb 1876 1528 81,5 0 0 1528 81,5
Zn-AgPb TotalPb-AgPbConc.
3.4.2 Processingplantinfrastructure
Theprocessingplant infrastructurehasbeenmodifiedsincethepurchaseof theBlaikenprocessingplant inSweden.According to thestudiesmade,mostof theprocessingmachineryandequipmentofBlaikenplantcanbeutilizedintheSilverMine beneficiation process. During spring 2015most of themotors and pumpsweretestedonsiteatBlaikenMine.ApressreleaseoftheBlaikenprocessingplantmachinery and equipment technical review is presented in the companywww-pageswww.silver.fi.
SilverMineBFSUpdate2016
SilverMineBFSUpdatereport Page32of63
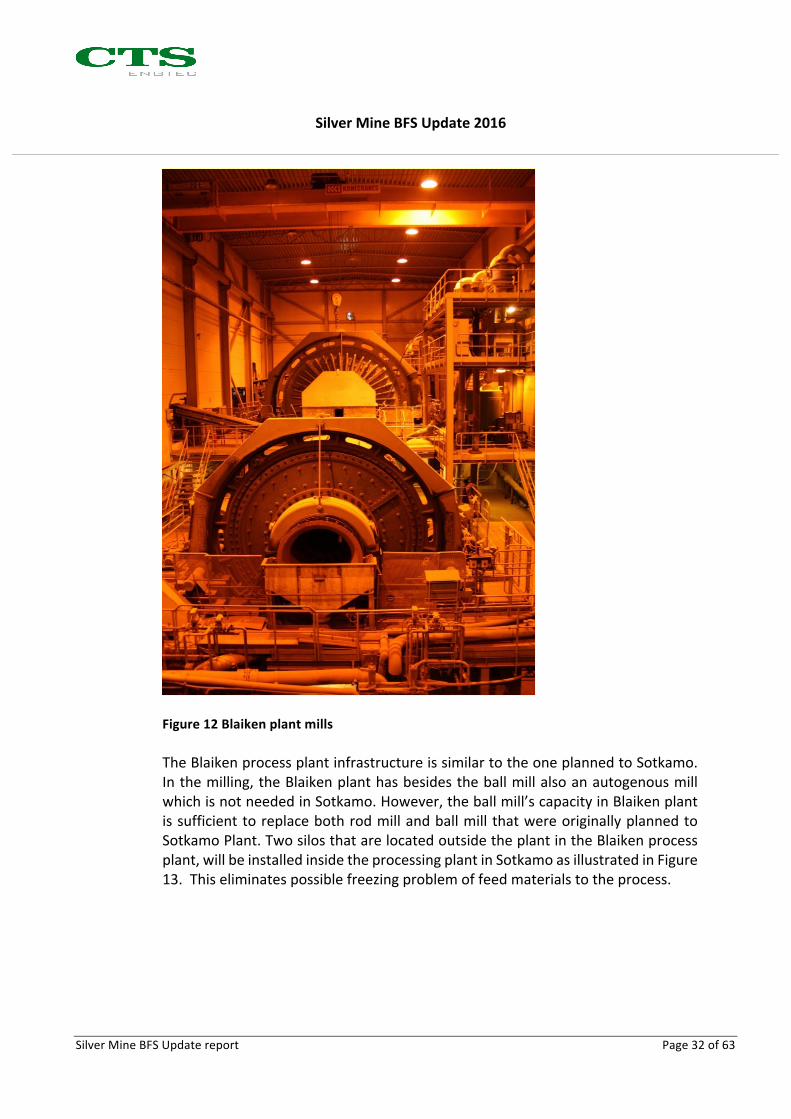
Figure12BlaikenplantmillsTheBlaikenprocessplantinfrastructureissimilartotheoneplannedtoSotkamo.Inthemilling,theBlaikenplanthasbesidestheballmillalsoanautogenousmillwhichisnotneededinSotkamo.However,theballmill’scapacityinBlaikenplantissufficienttoreplacebothrodmillandballmill thatwereoriginallyplannedtoSotkamoPlant.TwosilosthatarelocatedoutsidetheplantintheBlaikenprocessplant,willbeinstalledinsidetheprocessingplantinSotkamoasillustratedinFigure13.Thiseliminatespossiblefreezingproblemoffeedmaterialstotheprocess.
SilverMineBFSUpdate2016
SilverMineBFSUpdatereport Page33of63
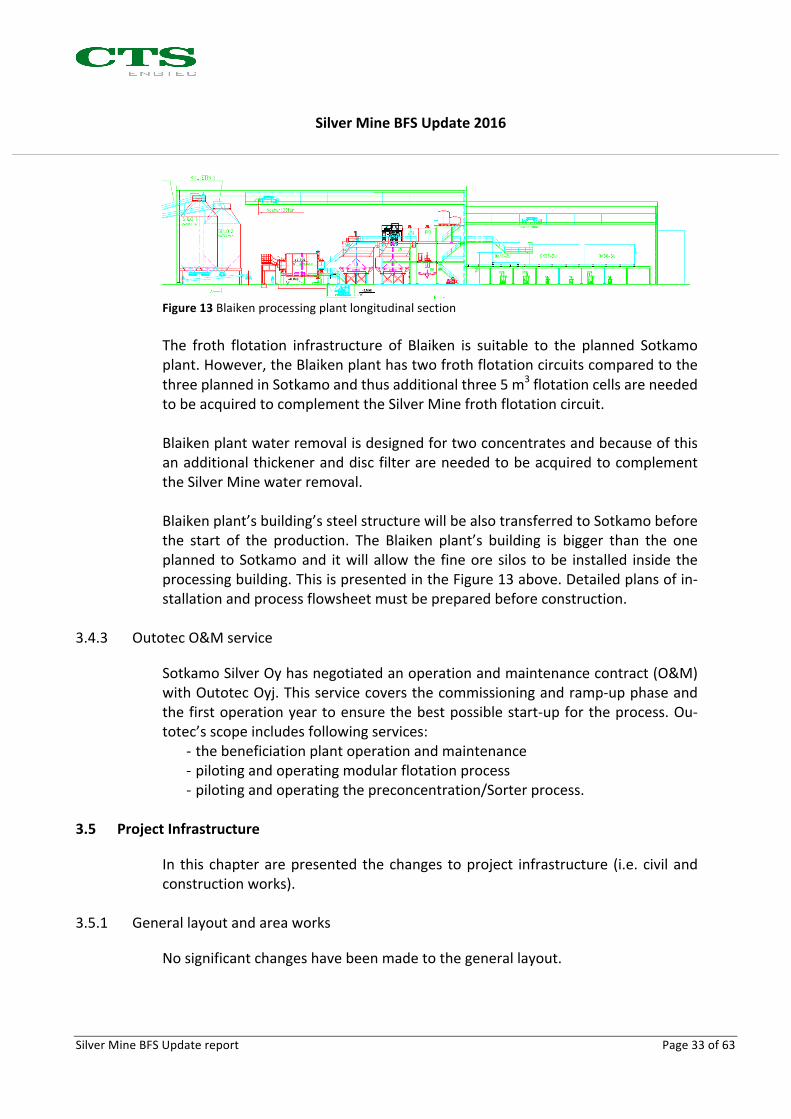
Figure13BlaikenprocessingplantlongitudinalsectionThe froth flotation infrastructure of Blaiken is suitable to the planned Sotkamoplant.However,theBlaikenplanthastwofrothflotationcircuitscomparedtothethreeplannedinSotkamoandthusadditionalthree5m3flotationcellsareneededtobeacquiredtocomplementtheSilverMinefrothflotationcircuit.BlaikenplantwaterremovalisdesignedfortwoconcentratesandbecauseofthisanadditionalthickeneranddiscfilterareneededtobeacquiredtocomplementtheSilverMinewaterremoval. Blaikenplant’sbuilding’ssteelstructurewillbealsotransferredtoSotkamobeforethe start of the production. The Blaiken plant’s building is bigger than the oneplanned toSotkamoand itwillallowthe fineoresilos tobe installed inside theprocessingbuilding.ThisispresentedintheFigure13above.Detailedplansofin-stallationandprocessflowsheetmustbepreparedbeforeconstruction.
3.4.3 OutotecO&Mservice
SotkamoSilverOyhasnegotiatedanoperationandmaintenancecontract(O&M)withOutotecOyj.Thisservicecoversthecommissioningandramp-upphaseandthefirstoperationyeartoensurethebestpossiblestart-upfortheprocess.Ou-totec’sscopeincludesfollowingservices:
- thebeneficiationplantoperationandmaintenance- pilotingandoperatingmodularflotationprocess- pilotingandoperatingthepreconcentration/Sorterprocess.
3.5 ProjectInfrastructure
In this chapterarepresented thechanges toproject infrastructure (i.e. civil andconstructionworks).
3.5.1 Generallayoutandareaworks
Nosignificantchangeshavebeenmadetothegenerallayout.

SilverMineBFSUpdate2016
SilverMineBFSUpdatereport Page34of63
3.5.2 Modificationstobuildings
TheBlaikenprocessplantbuildinghasalsospacesforofficesandsocialpremises,drillcorelaboratoryandworkshop,sothesebuildingshavebeenremovedfromthelayoutandscope.
Figure14Blaikenprocessplant
3.5.3 TailingsManagementFacility
In BFS 2014 it was presented that the tailings pondwill be constructed in twophases.Sincethattailingspondconstructingschedulewasmodifiedas28hectaretailingspondwillbeconstructedinasinglephase.TMFareaanddamstructuredesignhasbeenupdatedandaccordingtothedesignbyPöyryEnvironment,thecompactionlayerinthedamswillbeconstructedofben-tonitematandstructurelayerswhilethebedlayerofthepondwillbeconstructedofin-situnaturalpeat,constructedpeatlayerandbentonitemat.Theupstreamslopeofthedamwillbe1:3,5.TheslopeisgentlerthanexpectedintheBFS2014andit’sduethetechnicalpropertiesofthebentonitematcompactionlayerstructure.ThecostsoftheTMFareaconstructionwereupdatedwithtendersbasedonupdatedTMFdesign.

SilverMineBFSUpdate2016
SilverMineBFSUpdatereport Page35of63
4 MANAGEMENTCASE
4.1 Managementcasedisclaimer
Itshouldbenotedthatforwardlookingstatementsinthemanagementcaseesti-mateinvolveknownandunknownrisksanduncertaintiesthatcouldcauseactualresultsandfutureeventstodiffermateriallyfromthoseanticipated.Suchrisksanduncertainties couldprevent the forward looking statements in themanagementcasefromcomingtofruition.
4.2 Introduction
TheManagementcase isbasedontheexpectationsof theexplorationpotentialbelowthecurrentknownresources.Thisroughestimationispreparedonthebasisofgeologicalandgeophysicalinformation.However,italsoincludesalargeamountofuncertaintiesandcanonlybeseenasanuncertainprojectionofthefuture.Theexplorationpotentialpresentedhasbeenmodelledfromresultsofanelectro-magneticSAMPOgeophysical-surveybyGTKin2011and2012.Existingdiamond-drillingswithhighmetal-contentson500and550meterlevelssupportthisexplo-ration-potentialmodel.ThegeophysicalanomalygivenbySAMPO-surveycoincideswithregionallineation,whichisthedominanttectonicfeatureinthewholeTipas-järviGreenstoneBelt.Theconductivezone,extensionoftheDeposit,canbecalledExplorationTarget(JORC2012)becauseitformsaliableextensiontotheTaivaljärviDepositastotheshapeandpositionandinaccordancetoknowngeologicalstruc-tures(Parkkinen,2013).Moreover,thezonehasbeenpenetratedbyseveraldrillholescontainingTaivaljärvitypesilveroreintersections.Atentativeminingplanandtonnageandgrade-estimatesforthisexplorationpo-tentialhavebeencreatedbySotkamoSilver’smanagement.Plansandestimateshave been made using structural interpretations and existing drill-hole analyzedata.AmanagementestimateisthattheanticipateddepthextensionoftheSilverdeposit couldaddanother fiveproductionyears into themining-plan,on topofexistingmineral-reserves.Thiswillbeverifiedbyresearchworkduringthesixfirstproductionyears.
4.3 Geologicalstructure
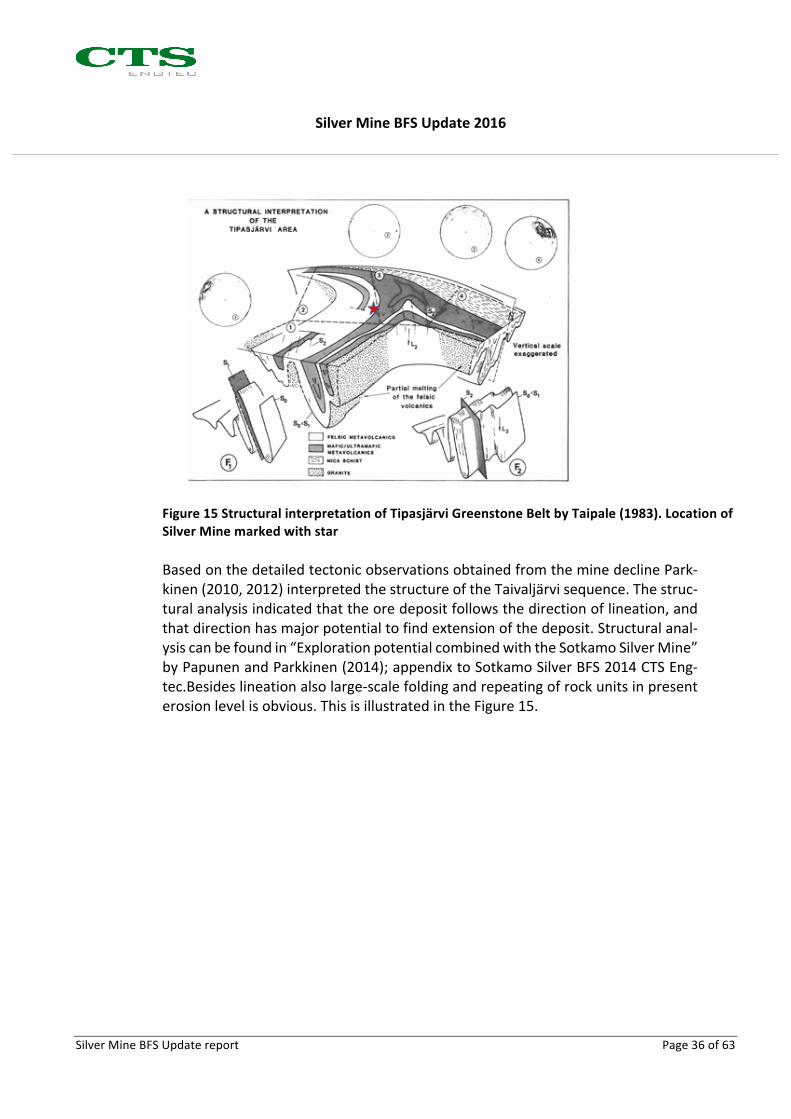
GeologicalandtectonicstructureoftheSilverMineareaandTipasjärviGreenstoneBelt(TGB)hasbeenpreparedbyKalleTaipale(1983)andmorepresentlybyJyrkiParkkinen(2012,2013).Figure15belowmadebyTaipalepresentsoverallstructureoftheBelt,regionallineationisillustratedbyarrowL2.
SilverMineBFSUpdate2016
SilverMineBFSUpdatereport Page36of63
Figure15StructuralinterpretationofTipasjärviGreenstoneBeltbyTaipale(1983).LocationofSilverMinemarkedwithstarBasedonthedetailedtectonicobservationsobtainedfromtheminedeclinePark-kinen(2010,2012)interpretedthestructureoftheTaivaljärvisequence.Thestruc-turalanalysisindicatedthattheoredepositfollowsthedirectionoflineation,andthatdirectionhasmajorpotentialtofindextensionofthedeposit.Structuralanal-ysiscanbefoundin“ExplorationpotentialcombinedwiththeSotkamoSilverMine”byPapunenandParkkinen(2014);appendixtoSotkamoSilverBFS2014CTSEng-tec.Besideslineationalsolarge-scalefoldingandrepeatingofrockunitsinpresenterosionlevelisobvious.ThisisillustratedintheFigure15.

SilverMineBFSUpdate2016
SilverMineBFSUpdatereport Page37of63
Figure16StructureofSilverMineareaRegionallineationisdominantfeaturecontrollingalsosilvermineralization.Yellowzonesrepresentkyanite-bearinglayerswhichareimportantmarkerhorizonsinsideacidvolcanicunits.Greencolorrepresentsmaficandultramaficvolcanicunits(Fig-ure16).FigureispreparedforSotkamoSilverbyJyrkiParkkinen.
4.4 Geophysicalsurveyandinterpretations
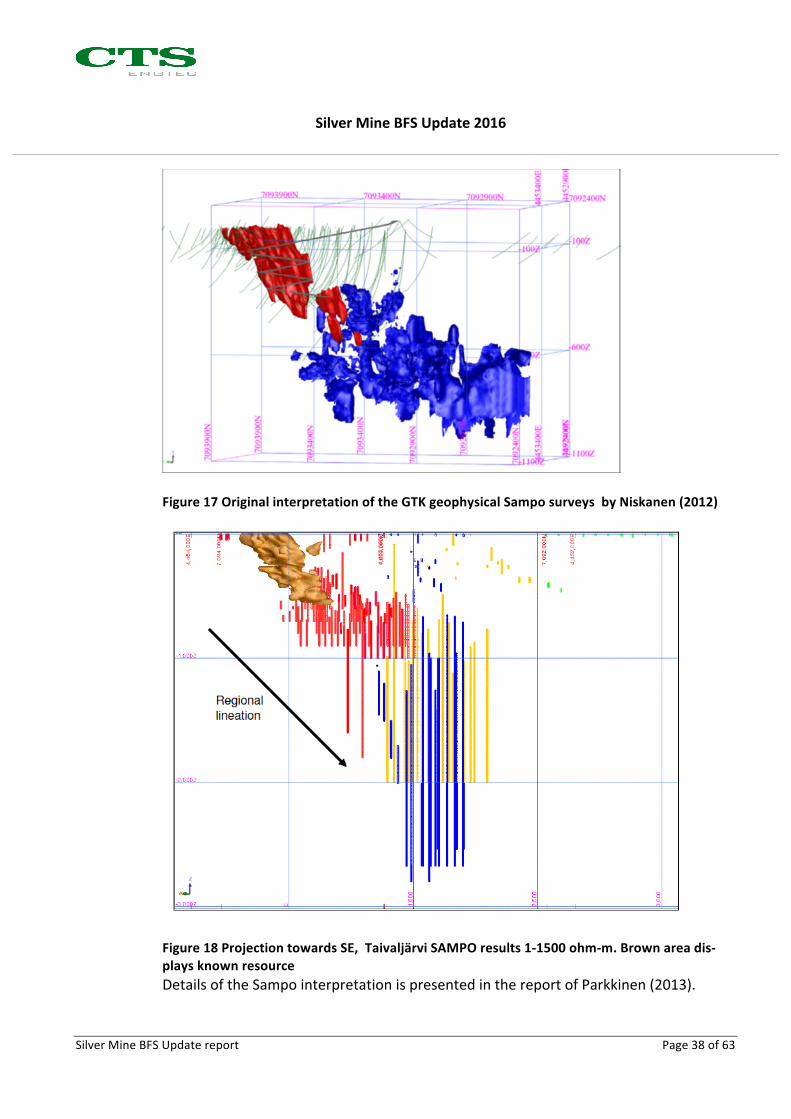
Geophysicaldeep-penetratingSampo-survey indicates that themineralized zonecontinuesdownto1,5oreventwokilometers,asillustratedinFigures17and18.Thesurveywasconductedduring2012and2013byGTK(Niskanen,2013)andin-terpretationofthesurveyresultsandsynthesisofgeophysicsandstructuralobser-vationsofthedepthextensionwaspreparedbyJyrkiParkkinen(2013).
SilverMineBFSUpdate2016
SilverMineBFSUpdatereport Page38of63
Figure17OriginalinterpretationoftheGTKgeophysicalSamposurveysbyNiskanen(2012)
Figure18ProjectiontowardsSE,TaivaljärviSAMPOresults1-1500ohm-m.Brownareadis-playsknownresourceDetailsoftheSampointerpretationispresentedinthereportofParkkinen(2013).
SilverMineBFSUpdate2016
SilverMineBFSUpdatereport Page39of63
TheprocedureandresultshavebeendescribedinmoredetailinoriginalreportsbyNiskanen (2013) and Parkkinen (2012, 2013) and in “Exploration potential com-binedwiththeSotkamoSilverMine”byPapunenandParkkinen(2014);appendixtoSotkamoSilverBFS2014byCTSEngtec.
4.5 Modellingandestimates
4.5.1 Modelbelowpresentresourcefrom410downto1000meters
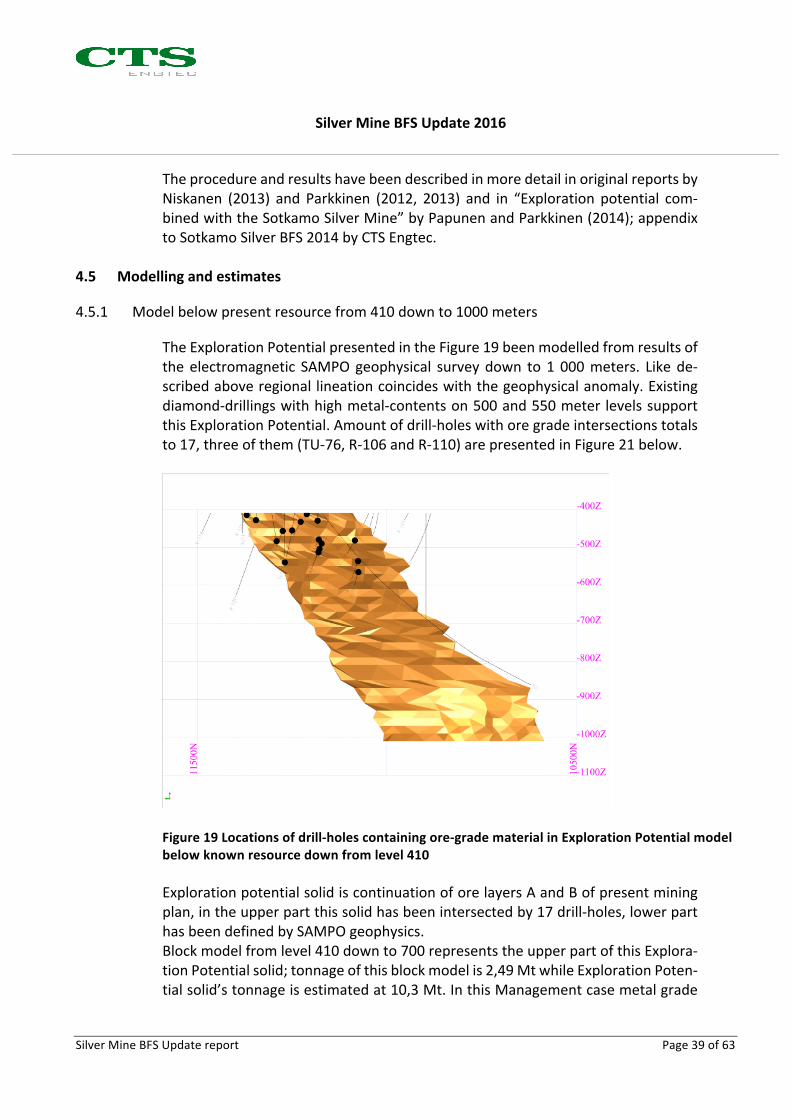
TheExplorationPotentialpresentedintheFigure19beenmodelledfromresultsoftheelectromagnetic SAMPOgeophysical surveydown to1000meters. Likede-scribedaboveregionallineationcoincideswiththegeophysicalanomaly.Existingdiamond-drillingswithhighmetal-contentson500and550meter levelssupportthisExplorationPotential.Amountofdrill-holeswithoregradeintersectionstotalsto17,threeofthem(TU-76,R-106andR-110)arepresentedinFigure21below.
Figure19Locationsofdrill-holescontainingore-gradematerialinExplorationPotentialmodelbelowknownresourcedownfromlevel410
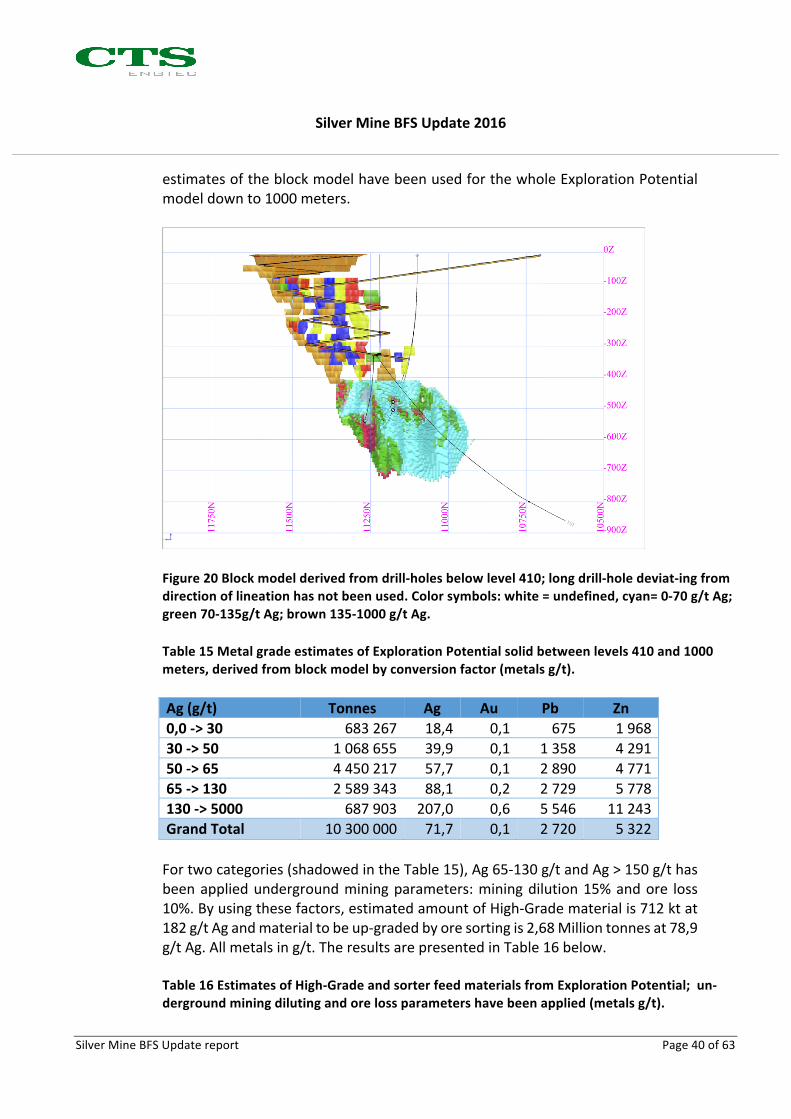
ExplorationpotentialsolidiscontinuationoforelayersAandBofpresentminingplan,intheupperpartthissolidhasbeenintersectedby17drill-holes,lowerparthasbeendefinedbySAMPOgeophysics.Blockmodelfromlevel410downto700representstheupperpartofthisExplora-tionPotentialsolid;tonnageofthisblockmodelis2,49MtwhileExplorationPoten-tialsolid’stonnageisestimatedat10,3Mt.InthisManagementcasemetalgrade
SilverMineBFSUpdate2016
SilverMineBFSUpdatereport Page40of63
estimatesoftheblockmodelhavebeenusedforthewholeExplorationPotentialmodeldownto1000meters.
Figure20Blockmodelderivedfromdrill-holesbelowlevel410;longdrill-holedeviat-ingfromdirectionoflineationhasnotbeenused.Colorsymbols:white=undefined,cyan=0-70g/tAg;green70-135g/tAg;brown135-1000g/tAg.Table15MetalgradeestimatesofExplorationPotentialsolidbetweenlevels410and1000meters,derivedfromblockmodelbyconversionfactor(metalsg/t).Ag(g/t) Tonnes Ag Au Pb Zn0,0->30 683267 18,4 0,1 675 196830->50 1068655 39,9 0,1 1358 429150->65 4450217 57,7 0,1 2890 477165->130 2589343 88,1 0,2 2729 5778130->5000 687903 207,0 0,6 5546 11243GrandTotal 10300000 71,7 0,1 2720 5322Fortwocategories(shadowedintheTable15),Ag65-130g/tandAg>150g/thasbeenappliedundergroundminingparameters:miningdilution15%andore loss10%.Byusingthesefactors,estimatedamountofHigh-Gradematerialis712ktat182g/tAgandmaterialtobeup-gradedbyoresortingis2,68Milliontonnesat78,9g/tAg.Allmetalsing/t.TheresultsarepresentedinTable16below.Table16EstimatesofHigh-GradeandsorterfeedmaterialsfromExplorationPotential;un-dergroundminingdilutingandorelossparametershavebeenapplied(metalsg/t).

SilverMineBFSUpdate2016
SilverMineBFSUpdatereport Page41of63
Diluted Ag Au Pb Zn 2679970t 78,9 0,2 2481 5358 => 1481638t711980t 182,3 0,5 4930 10110 => 768362t3391950t => 2250000t
Accordingtoresultsreceivedfromsortingtests,sorterfeed2,68Milliontonnesisdivided into product and reject; amount of sorting product 55% is 1,48Milliontonnesat127g/tAg.Productincludesfinesderivedinsorting,basedonsortingtestsamountoffinesis20%offeedamount.Sorterrejecttonnageisestimatedtobe1,18Milliontonnes,Ag–content17g/t.Table17showstheHighGradeandsortedmaterialtotalsto2,25Milliontonnesat144,5g/tAg.Goldcontentisestimatedat0,38g/t;zincat0,9%andleadat0,43%.Table17HighgradeandsortedmaterialinExplorationpotential(metalsg/t)
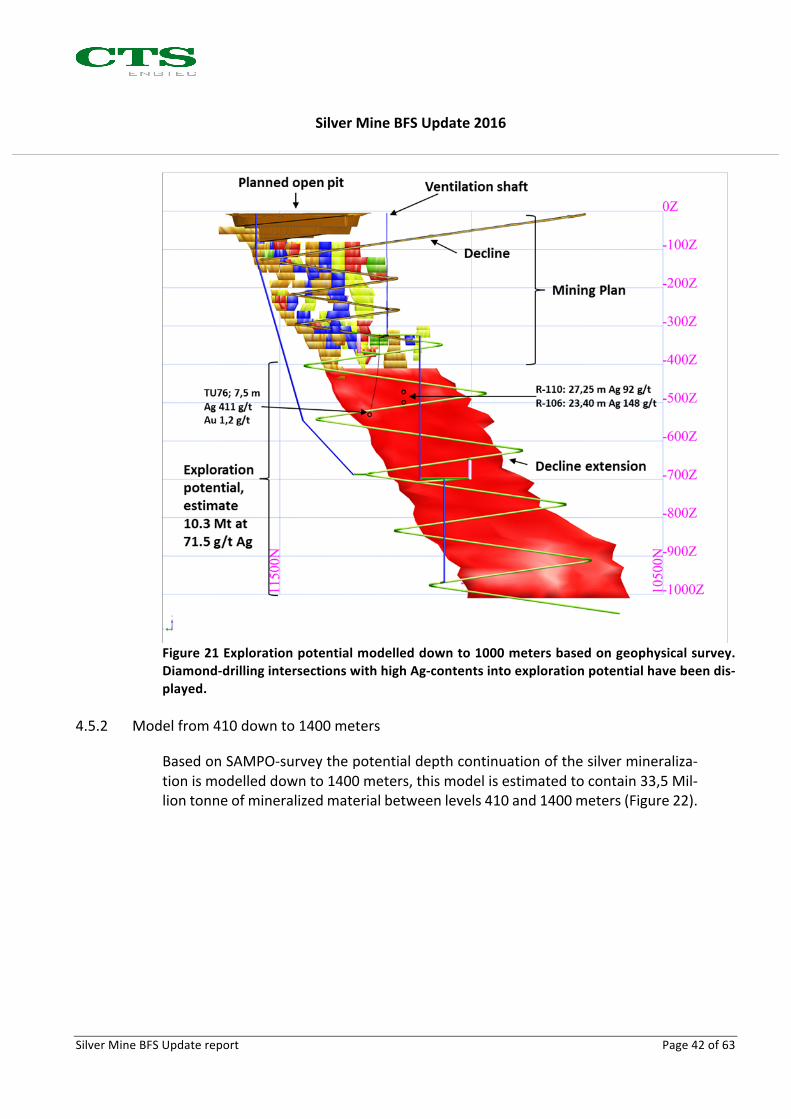
Oretonnes/grade Ag Au Pb Zn1481638t 127,37 0,32 4005 8649768362t 177,55 0,51 4930 98552250000t 144,51 0,38 4321 9061Sorterreject 1179187t /5Years Theestimatedtotalmill-feedtonnagefromExplorationPotentialarea(Figure21)wouldaddadditional fiveproductionyears intothemining-planoncapacity450kt/a,ontopofexistingmineralreserves.
SilverMineBFSUpdate2016
SilverMineBFSUpdatereport Page42of63
Figure21Explorationpotentialmodelleddownto1000metersbasedongeophysicalsurvey.Diamond-drillingintersectionswithhighAg-contentsintoexplorationpotentialhavebeendis-played.
4.5.2 Modelfrom410downto1400meters
BasedonSAMPO-surveythepotentialdepthcontinuationofthesilvermineraliza-tionismodelleddownto1400meters,thismodelisestimatedtocontain33,5Mil-liontonneofmineralizedmaterialbetweenlevels410and1400meters(Figure22).
SilverMineBFSUpdate2016
SilverMineBFSUpdatereport Page43of63
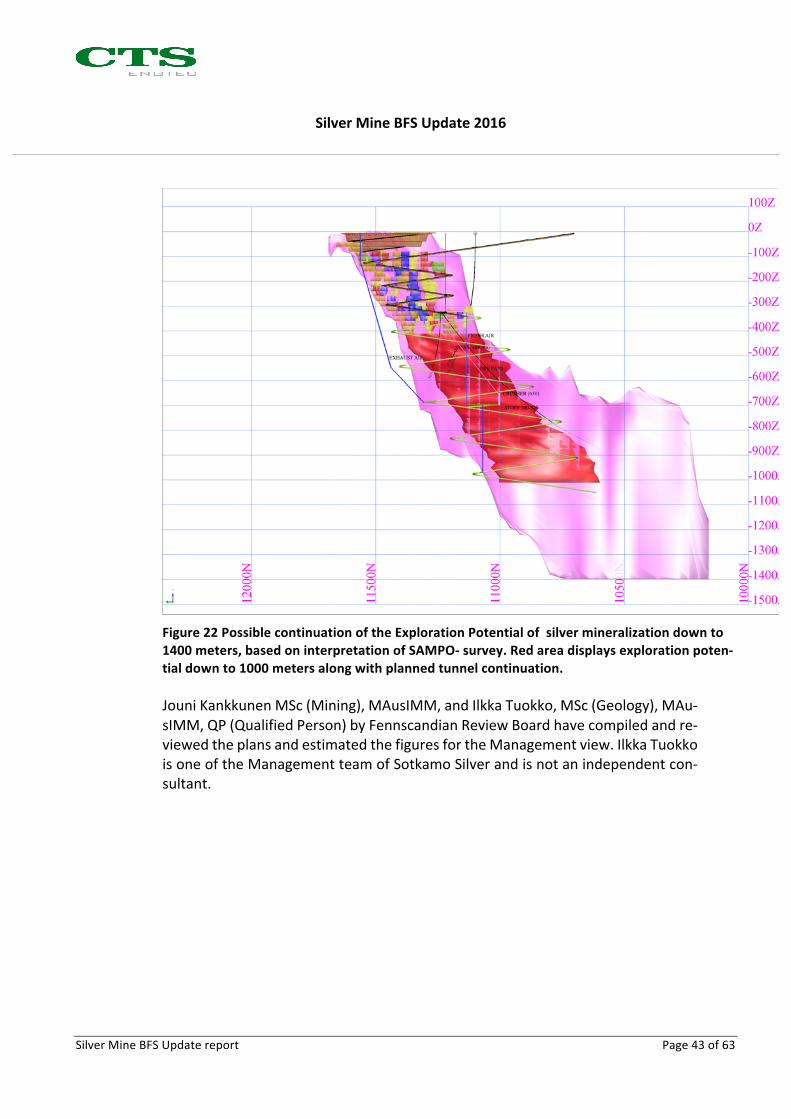
Figure22PossiblecontinuationoftheExplorationPotentialofsilvermineralizationdownto1400meters,basedoninterpretationofSAMPO-survey.Redareadisplaysexplorationpoten-tialdownto1000metersalongwithplannedtunnelcontinuation.
JouniKankkunenMSc(Mining),MAusIMM,andIlkkaTuokko,MSc(Geology),MAu-sIMM,QP(QualifiedPerson)byFennscandianReviewBoardhavecompiledandre-viewedtheplansandestimatedthefiguresfortheManagementview.IlkkaTuokkoisoneoftheManagementteamofSotkamoSilverandisnotanindependentcon-sultant.
SilverMineBFSUpdate2016
SilverMineBFSUpdatereport Page44of63
5 COSTUPDATE
AfterBFS2014,updatedtenderswererequestedformining,civilworks,OutotecO&MservicesandalsoforBlaikenplantrelocation(dismantling,refurbishing,trans-porting,reconstructionatSilverMine).Forother itemscorresponding indexwasusedasacostcalculationfactor.Inthecostupdateprocess,themodificationstolayoutandprocesswastakenintoaccount.
5.1 Capitalcostupdate
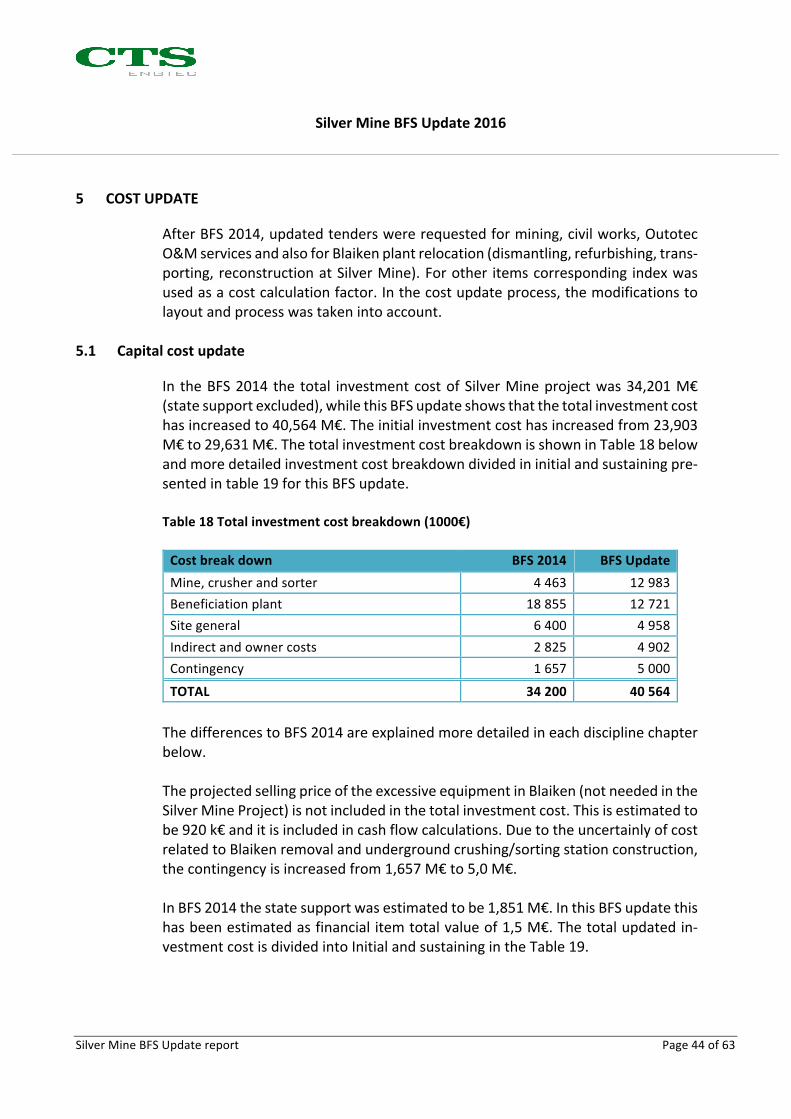
In theBFS2014the total investmentcostofSilverMineprojectwas34,201M€(statesupportexcluded),whilethisBFSupdateshowsthatthetotalinvestmentcosthasincreasedto40,564M€.Theinitialinvestmentcosthasincreasedfrom23,903M€to29,631M€.ThetotalinvestmentcostbreakdownisshowninTable18belowandmoredetailedinvestmentcostbreakdowndividedininitialandsustainingpre-sentedintable19forthisBFSupdate.Table18Totalinvestmentcostbreakdown(1000€)Costbreakdown BFS2014 BFSUpdateMine,crusherandsorter 4463 12983Beneficiationplant 18855 12721Sitegeneral 6400 4958Indirectandownercosts 2825 4902Contingency 1657 5000TOTAL 34200 40564ThedifferencestoBFS2014areexplainedmoredetailedineachdisciplinechapterbelow.TheprojectedsellingpriceoftheexcessiveequipmentinBlaiken(notneededintheSilverMineProject)isnotincludedinthetotalinvestmentcost.Thisisestimatedtobe920k€anditisincludedincashflowcalculations.DuetotheuncertainlyofcostrelatedtoBlaikenremovalandundergroundcrushing/sortingstationconstruction,thecontingencyisincreasedfrom1,657M€to5,0M€.InBFS2014thestatesupportwasestimatedtobe1,851M€.InthisBFSupdatethishasbeenestimatedasfinancialitemtotalvalueof1,5M€.Thetotalupdatedin-vestmentcostisdividedintoInitialandsustainingintheTable19.
SilverMineBFSUpdate2016
SilverMineBFSUpdatereport Page45of63
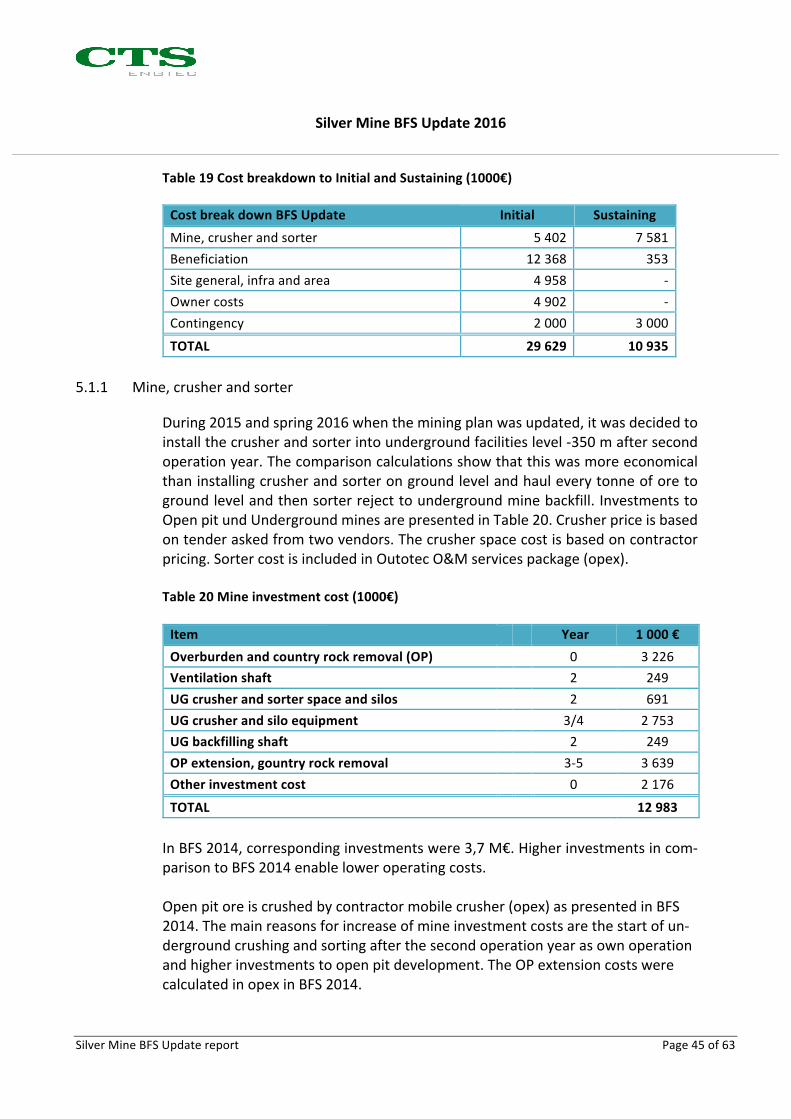
Table19CostbreakdowntoInitialandSustaining(1000€)CostbreakdownBFSUpdate Initial SustainingMine,crusherandsorter 5402 7581Beneficiation 12368 353Sitegeneral,infraandarea 4958 -Ownercosts 4902 -Contingency 2000 3000TOTAL 29629 10935
5.1.1 Mine,crusherandsorter
During2015andspring2016whentheminingplanwasupdated,itwasdecidedtoinstallthecrusherandsorterintoundergroundfacilitieslevel-350maftersecondoperationyear.Thecomparisoncalculationsshowthatthiswasmoreeconomicalthaninstallingcrusherandsorterongroundlevelandhauleverytonneoforetogroundlevelandthensorterrejecttoundergroundminebackfill.InvestmentstoOpenpitundUndergroundminesarepresentedinTable20.Crusherpriceisbasedontenderaskedfromtwovendors.Thecrusherspacecostisbasedoncontractorpricing.SortercostisincludedinOutotecO&Mservicespackage(opex).Table20Mineinvestmentcost(1000€)
Item Year 1000€Overburdenandcountryrockremoval(OP) 0 3226Ventilationshaft 2 249UGcrusherandsorterspaceandsilos 2 691UGcrusherandsiloequipment 3/4 2753UGbackfillingshaft 2 249OPextension,gountryrockremoval 3-5 3639Otherinvestmentcost 0 2176TOTAL 12983InBFS2014,correspondinginvestmentswere3,7M€.Higherinvestmentsincom-parisontoBFS2014enableloweroperatingcosts.Openpitoreiscrushedbycontractormobilecrusher(opex)aspresentedinBFS2014.Themainreasonsforincreaseofmineinvestmentcostsarethestartofun-dergroundcrushingandsortingafterthesecondoperationyearasownoperationandhigherinvestmentstoopenpitdevelopment.TheOPextensioncostswerecalculatedinopexinBFS2014.

SilverMineBFSUpdate2016
SilverMineBFSUpdatereport Page46of63
BlaikenplantorestorageandsilosareinstalledtoSotkamoaswithnecessarycon-veyors.
5.1.2 Beneficiationplant
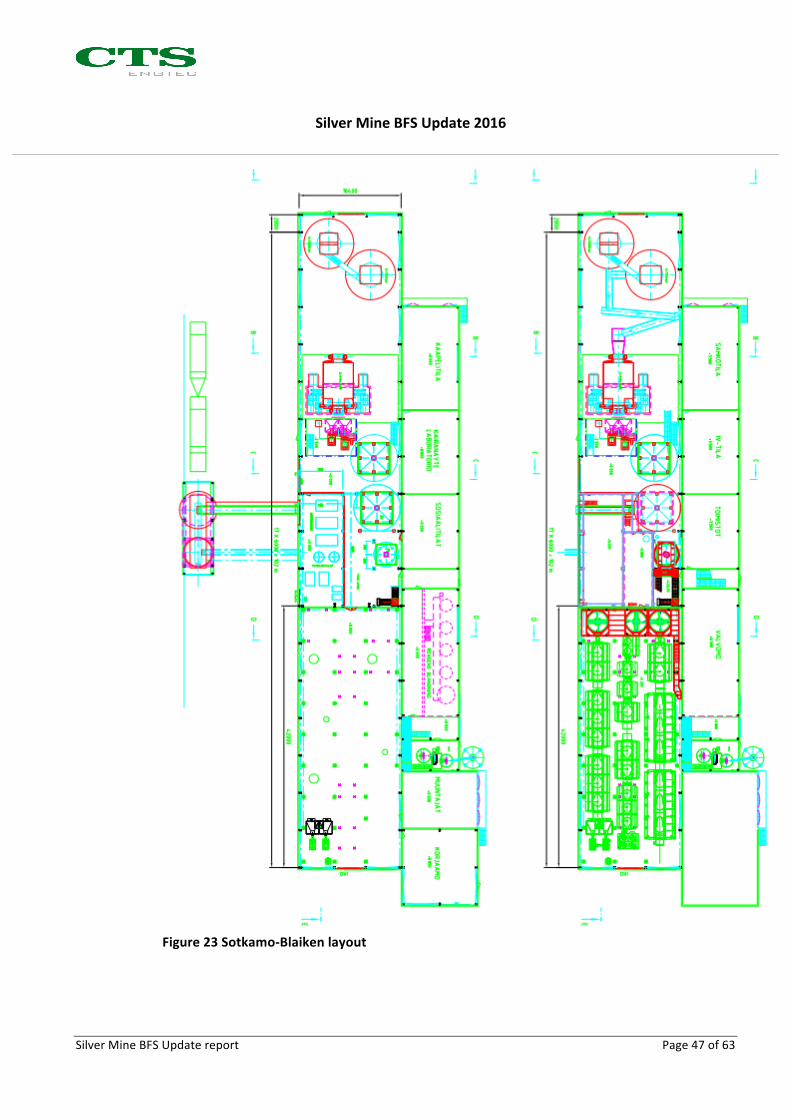
During 2015 tenders to uninstall Blaiken plant and machinery in Sweden andtransport and re-install them to Sotkamowere requested from contractors. TocomplementthedesignedSilverMineprocess,onefilter,onethickenerandthreeflotationcellsareneededtobeacquiredontopoftheBlaikenplantmachineryandequipment.Theprocessplantarea’sinvestmentcostscanbedividedtofollowingsubsectorsasshowninTable21below.Table21Processplantinvestmentcosts(1000€)Position BFS2014 BFSUpdateCivilandconstruction 2253 3884Machineryandequipment 9866 4541Piping 2286 970Electricalandautomation 5385 2846HVAC 440 480Total 18432 12721Itisestimatedthattotal1,0M€mustbeusedtoBlaikenequipmentmaintenanceandrepair.RepairsandmaintenancearecarriedoutinKainuuareaworkshops.TheinvestmentcostofbeneficiationplanthasdecreasedduetotheBlaikenplantpurchase.TwocontractorssubmittedtenderstoexecureBlaikenplantdismantlingandinstallationinSotkamo.Basedonthetenders,contractorcost is7,9M€andtotal10,215M€intheinvestmentcalculationisreservedforBlaikendismantling,refurbishing, transportationandreinstallation (Blaikenrelated investmentcost+contingencyincluded).ThepreliminaryBlaikenplant layoutfittedtoSilverMineprocess ispresentedinFigure23.
SilverMineBFSUpdate2016
SilverMineBFSUpdatereport Page47of63
Figure23Sotkamo-Blaikenlayout
SilverMineBFSUpdate2016
SilverMineBFSUpdatereport Page48of63
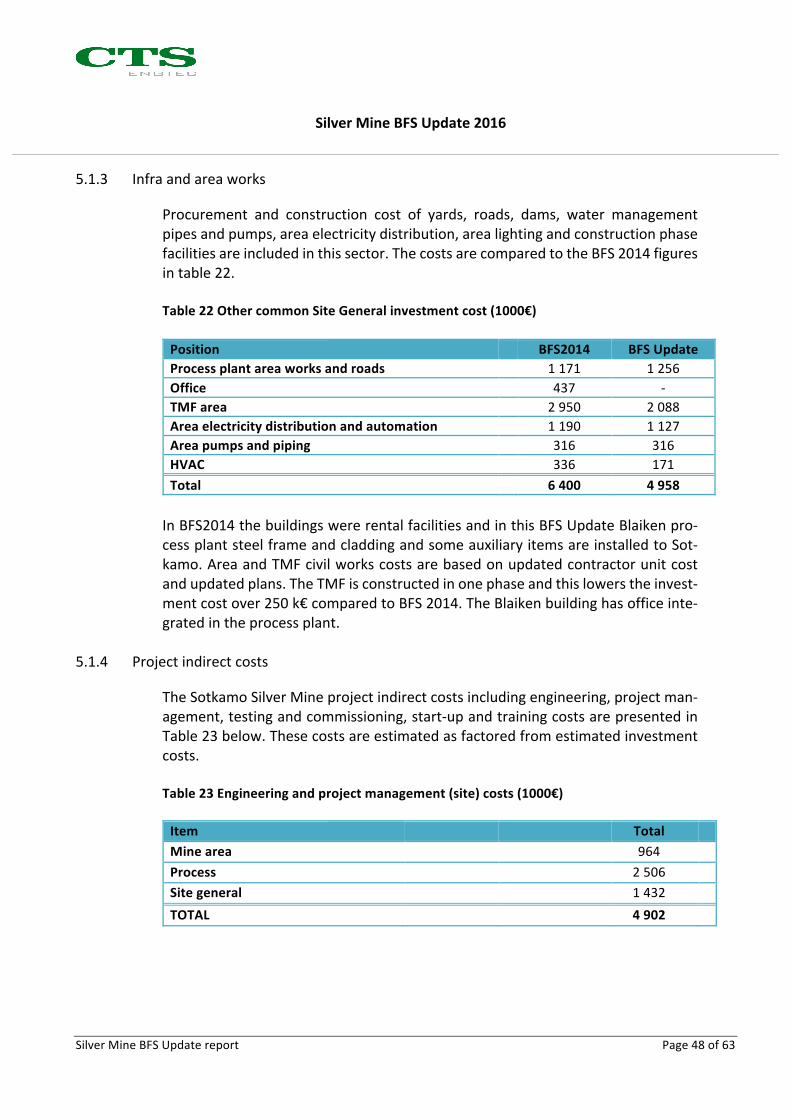
5.1.3 Infraandareaworks
Procurement and construction cost of yards, roads, dams, water managementpipesandpumps,areaelectricitydistribution,arealightingandconstructionphasefacilitiesareincludedinthissector.ThecostsarecomparedtotheBFS2014figuresintable22.Table22OthercommonSiteGeneralinvestmentcost(1000€)Position BFS2014 BFSUpdateProcessplantareaworksandroads 1171 1256Office 437 -TMFarea 2950 2088Areaelectricitydistributionandautomation 1190 1127Areapumpsandpiping 316 316HVAC 336 171Total 6400 4958InBFS2014thebuildingswererentalfacilitiesandinthisBFSUpdateBlaikenpro-cessplantsteelframeandcladdingandsomeauxiliaryitemsareinstalledtoSot-kamo.AreaandTMFcivilworkscostsarebasedonupdatedcontractorunitcostandupdatedplans.TheTMFisconstructedinonephaseandthislowerstheinvest-mentcostover250k€comparedtoBFS2014.TheBlaikenbuildinghasofficeinte-gratedintheprocessplant.
5.1.4 Projectindirectcosts
TheSotkamoSilverMineprojectindirectcostsincludingengineering,projectman-agement,testingandcommissioning,start-upandtrainingcostsarepresentedinTable23below.Thesecostsareestimatedasfactoredfromestimatedinvestmentcosts.Table23Engineeringandprojectmanagement(site)costs(1000€)
Item Total Minearea 964 Process 2506 Sitegeneral 1432 TOTAL 4902
SilverMineBFSUpdate2016
SilverMineBFSUpdatereport Page49of63
IntheBFS2014aboveindirectcostswereestimatedtobeintotal2825k€.TheincreasecomesfromSotkamoSilverOyownpersonnel,whichwerenotcalculatedinBFS2014.SotkamoSilverOy’sownpersonnelisworkingintheprojectduringtheinvestmentperiodincommissioning,start-upandtraining.
5.1.5 Mineclosureandrehabilitation
Allmineclosureandarearehabilitationcostsarecalculatedinopexasclosurebond.
5.1.6 Contingencyandescalation
BecausethisupdateisbasedonusingBlaikenplantequipmentandundergroundcrushing/sorting thecontingency iscalculatedas5,0M€,comparedtoBFS2014valueof1,7M€.Twomillionisestimatedtobeusedintheinvestmentyear(0),twomillioninthefirstoperationyear,andrest1M€isrelatedtobuildingtheunder-groundfacilitiesforcrusherandsorterduringoperationyears2to4.Noescalationiscalculated.
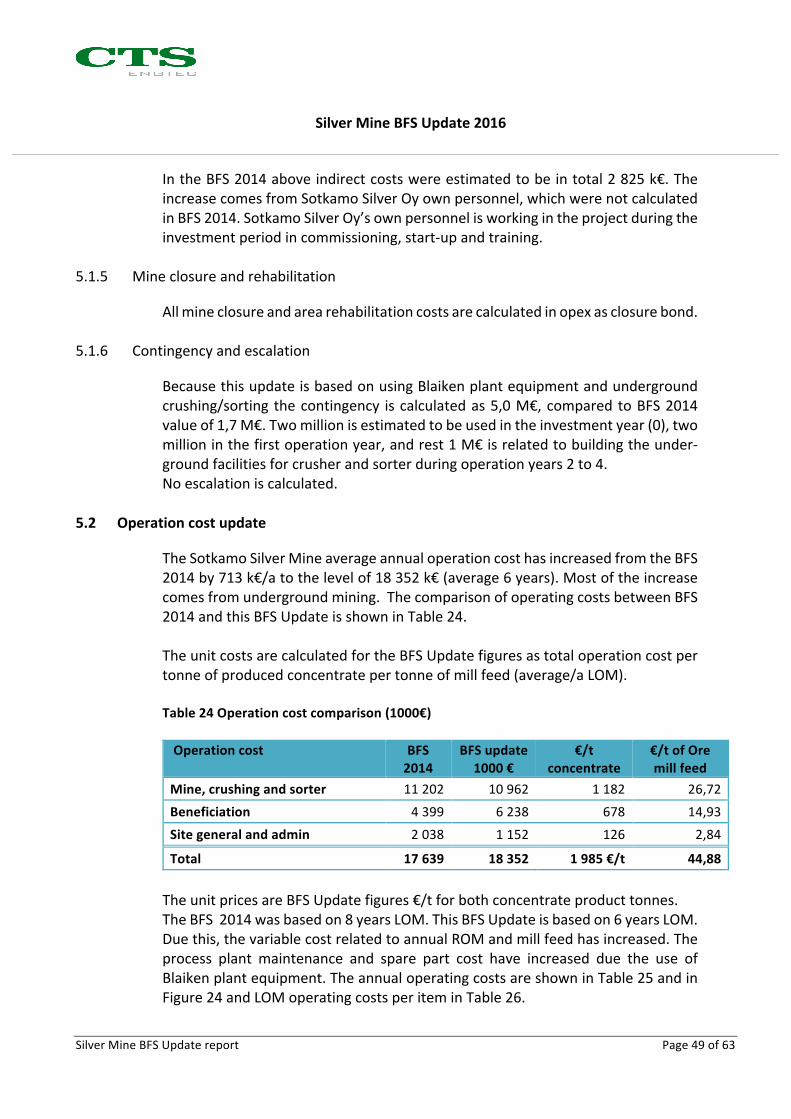
5.2 Operationcostupdate
TheSotkamoSilverMineaverageannualoperationcosthasincreasedfromtheBFS2014by713k€/atothelevelof18352k€(average6years).Mostoftheincreasecomesfromundergroundmining.ThecomparisonofoperatingcostsbetweenBFS2014andthisBFSUpdateisshowninTable24.TheunitcostsarecalculatedfortheBFSUpdatefiguresastotaloperationcostpertonneofproducedconcentratepertonneofmillfeed(average/aLOM).Table24Operationcostcomparison(1000€)
Operationcost BFS
2014BFSupdate1000€
€/tconcentrate
€/tofOremillfeed
Mine,crushingandsorter 11202 10962 1182 26,72Beneficiation 4399 6238 678 14,93Sitegeneralandadmin 2038 1152 126 2,84
Total 17639 18352 1985€/t 44,88TheunitpricesareBFSUpdatefigures€/tforbothconcentrateproducttonnes.TheBFS2014wasbasedon8yearsLOM.ThisBFSUpdateisbasedon6yearsLOM.Duethis,thevariablecostrelatedtoannualROMandmillfeedhasincreased.Theprocess plant maintenance and spare part cost have increased due the use ofBlaikenplantequipment.TheannualoperatingcostsareshowninTable25andinFigure24andLOMoperatingcostsperiteminTable26.
SilverMineBFSUpdate2016
SilverMineBFSUpdatereport Page50of63
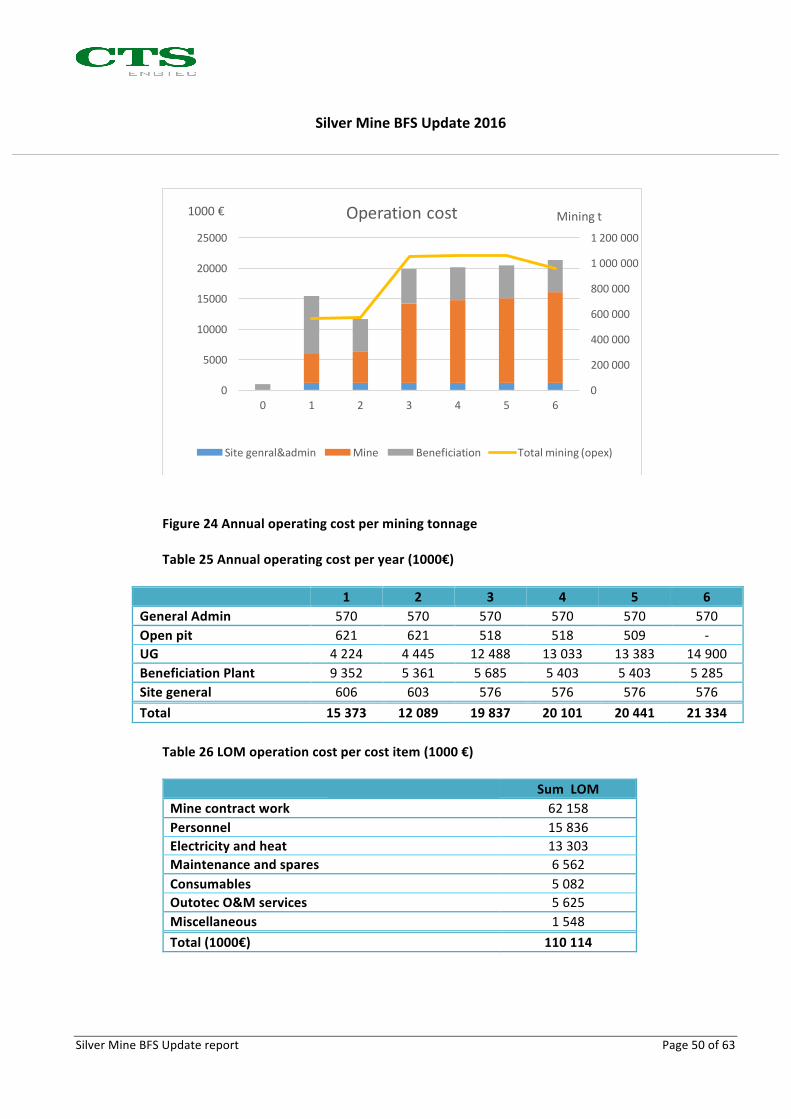
Figure24AnnualoperatingcostperminingtonnageTable25Annualoperatingcostperyear(1000€)
1 2 3 4 5 6GeneralAdmin 570 570 570 570 570 570Openpit 621 621 518 518 509 -UG 4224 4445 12488 13033 13383 14900BeneficiationPlant 9352 5361 5685 5403 5403 5285Sitegeneral 606 603 576 576 576 576Total 15373 12089 19837 20101 20441 21334
Table26LOMoperationcostpercostitem(1000€)
SumLOMMinecontractwork 62158Personnel 15836Electricityandheat 13303Maintenanceandspares 6562Consumables 5082OutotecO&Mservices 5625Miscellaneous 1548Total(1000€) 110114
0
200 000
400 000
600 000
800 000
1 000 000
1 200 000
0
5000
10000
15000
20000
25000
0 1 2 3 4 5 6
Miningt1000€ Operationcost
Sitegenral&admin Mine Beneficiation Totalmining(opex)

SilverMineBFSUpdate2016
SilverMineBFSUpdatereport Page51of63
Outotec’sO&Mservicesareusedonlyontheproductionyear1andduringstart-upandcommissioningphase.Outotec’sO&Mservicesarethekeyreasonforthehighoperationcostinyear1.
5.2.1 Mineoperationcosts
SotkamoSilverMineopenpitandundergroundmineareoperatedasoutsourcedservice.Thecontractorunitpriceswereupdatedinautumn2015.Annualrockpro-cessingcostsarepresentedinTable27below(forOPyear2averageandforUGyear4average).Table27SummaryofannualMiningoperatingcosts(1000€)Item BFSUpdate €/tnOPminingore 449 2,21OPminingcountry 136 1,70UGminingore 4923 8,22UGdrifting 3544 15,82UGsortedorehauling 1244 4,90Crushing 969 1,16UGfilling 938 2,42Sorter 599 1,00
Total(LOMoreandLOM/tofore) 62158 15,35NotethatfromY2halfofdriftingtonnesaredirectlydumpedtoUGfillandfromY4all.UGfillingshaftwillbeoperationalinthebeginningofY2.
5.2.2 Electricityprice
IntheBFS2014anelectricitypriceof43€/MWhplusfixedtransferfeeof40,7k€/awasusedinthecalculations.IntheBFSUpdate,theinformationforprojectedpurchasepriceintheelectricitymarketandupdatedlocaltransferpriceoftheserviceproviderwereusedtoesti-matetheelectricitypriceperMWhduringtheconstructionphaseandproductionofSilverMine.Theupdatedelectricityprice(includingpurchaseandtransferprice)is43,13€/MWhandfixedtransferfee33,0k€/a.
5.2.3 Miscellaneouscost
Nochangeshavebeenmadetoothermiscellaneouscost.
SilverMineBFSUpdate2016
SilverMineBFSUpdatereport Page52of63
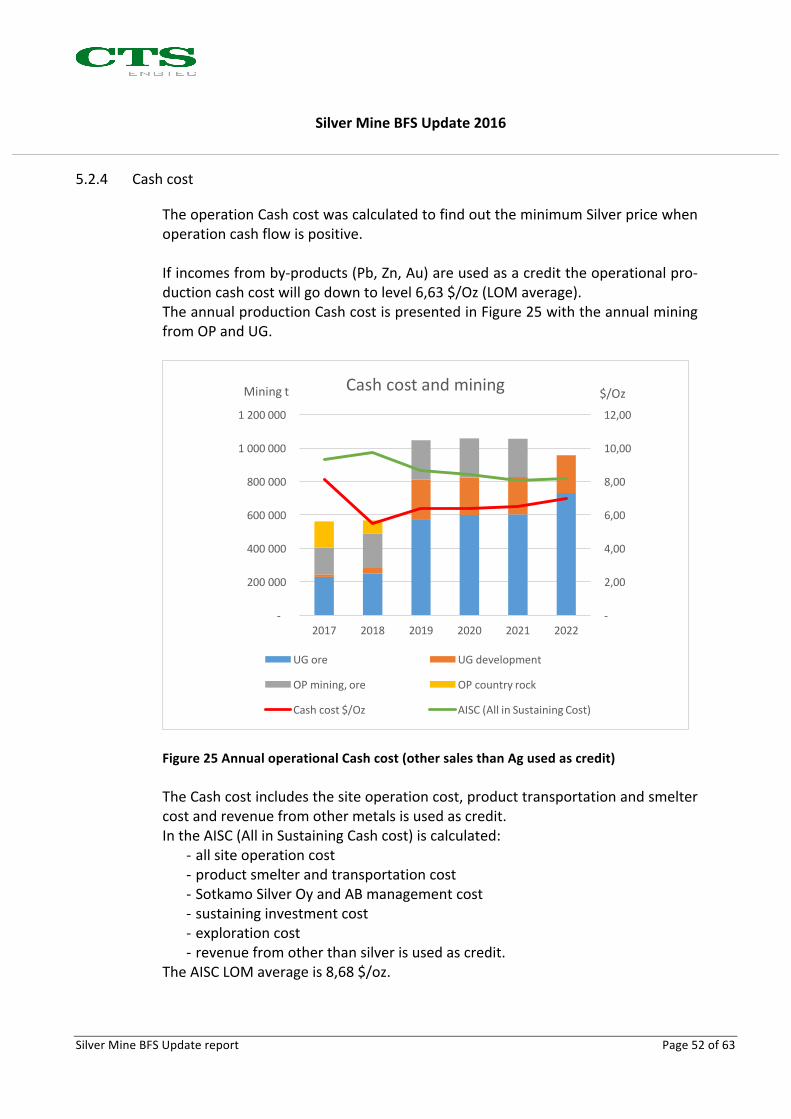
5.2.4 Cashcost
TheoperationCashcostwascalculatedtofindouttheminimumSilverpricewhenoperationcashflowispositive.Ifincomesfromby-products(Pb,Zn,Au)areusedasacredittheoperationalpro-ductioncashcostwillgodowntolevel6,63$/Oz(LOMaverage).TheannualproductionCashcostispresentedinFigure25withtheannualminingfromOPandUG.
Figure25AnnualoperationalCashcost(othersalesthanAgusedascredit)TheCashcostincludesthesiteoperationcost,producttransportationandsmeltercostandrevenuefromothermetalsisusedascredit.IntheAISC(AllinSustainingCashcost)iscalculated:
- allsiteoperationcost- productsmelterandtransportationcost- SotkamoSilverOyandABmanagementcost- sustaininginvestmentcost- explorationcost- revenuefromotherthansilverisusedascredit.
TheAISCLOMaverageis8,68$/oz.
-
2,00
4,00
6,00
8,00
10,00
12,00
-
200 000
400 000
600 000
800 000
1 000 000
1 200 000
2017 2018 2019 2020 2021 2022
$/OzMiningt Cashcostandmining
UGore UGdevelopment
OPmining,ore OPcountryrock
Cashcost$/Oz AISC(AllinSustainingCost)

SilverMineBFSUpdate2016
SilverMineBFSUpdatereport Page53of63
5.2.5 Manningplan
SincemineitselfisoperatedbycontractorthetotalownworkforceofSotkamoSil-verMineis17workers(inbeneficiation),12geo-andothertechnicians,geologistandengineersand3managers.OutotecO&Mserviceincludetotal15to20people.
5.3 Managementcase
InthemanagementcasetheLOMwillincreasefrom6toelevenyears.Basedontheminingplan,followingadditionalsustaininginvestments(Table28)areneededaftertheinvestmenttoBaseCasefacilities.Table28Managementcasesustaininginvestments
Managementcasesustaininginvestment(1000€) Year 1000€Ventilationshaftextensionfrom-350to-700mlevel 7 249Extensionofhaulingtunnel3000m 7…9 3237TOTAL 3486ThetotalinvestmentinManagementcaseisestimatedtobe44,09M€.ThemanagementcaseOpexandEBITDAarepresentedinFigure26withthepro-ductionparameters(summaryofcolumn=annualtotalrevenue).
Figure26AnnualOpexandEBITDAwithproductiondata
0100 000200 000300 000400 000500 000600 000700 000800 000
05 000
10 00015 00020 00025 00030 00035 00040 00045 000
1 2 3 4 5 6 7 8 9 10 11
Production
1000€
Year
Ebitdaandproduction
OpexMine OpexPlant Opecothers EBITDA
OPmining UGmining Millfeed

SilverMineBFSUpdate2016
SilverMineBFSUpdatereport Page54of63
6 ECONOMICANALYSIS
AsapartofthisBFSUpdate,CTShasupdatedtheprojectfinancialmodelinordertoderivepre-financeNetPresentValue(NPV).During2015andspring2016fourdifferentprojectconceptswasevaluatedoneco-nomicalbasis.Thebestcaseincludes:
- Blaikenplant- OutotecO&Mserviceandmodularflotationconceptand- Tekessupportformodularbeneficiationplantandsorting.
CTShasusedMS-Excelbasedinvestmentcalculationsoftware(InvestforExcel)forfinancialcalculations.Themodelisbasedonupdatedminingplanforopenpitandundergroundmine.TheOPorewillgodirectlytomillaftermobilecrusherwhileUGoreiscrushedandsorted inundergroundfacilitiesfromyear3.Becauseof limitationfromEnviron-mentalpermitthemillfeedis320…350ktinthefirsttwooperationyearsandafterupdatedEPisgrantedthemillfeedwillberaisedto450kt.All capitalandoperatingexpenditures isdenominated inEuros.Thevaluation ismadeinEurosandfixed$/€exchangerateof0,92isusedinallscenarios.NPVandotherfinancialfactorspresentedherearebeforetaxandpre-financebasisandassumeadiscountfactorof5%.Also8%calculationwasdoneaswellaspost-taxcalculations.Allfiguresarepresentedinrealterms.Decliningdepreciation7%hasbeenusedforbuildings.Straight-linedepreciationhasbeenusedforcivilworksdependingofthelifetimeofthestructure.Forotheritemdecliningdepreciation25%hasbeenused.BasedonFinnishtaxlawacorpo-ratetaxrate20%isusedincalculations.

SilverMineBFSUpdate2016
SilverMineBFSUpdatereport Page55of63
6.1 BaseCase,commoditypriceforecast
ForBaseCasecommoditypriceforecastfromConsensusEconomicsIncisused(Fig-ure27).
Figure27ConsensuspriceforecastTheBaseCaseGrossRevenueoverLOMispresentedintable29below.Table29Grossrevenue,consensuspriceforecastBaseCase
Forecast 2017 2018 2019 2020 2021 2022 LOMGrossRevenuekEUR 25571 27101 36859 37583 38587 39013 204714
AgAuPb concentrate 22565 23785 31057 31605 32558 32906 174476Ag Payment 19492 21310 25465 25687 26530 26518 145001Au Payment 3493 3310 5664 5823 5881 6007 30178Pb Payment 1418 1596 2971 3127 3183 3408 15703Treatment charge -1297 -1384 -1830 -1835 -1838 -1858 -10043Ref charge Ag -508 -990 -1114 -1096 -1097 -1064 -5869Ref charge Au -26 -44 -74 -76 -76 -78 -374Penalty Sb -7 -12 -24 -25 -25 -27 -120
Zn concentrate 3006 3316 5802 5978 6029 6107 30238Zn Payment 2692 2952 5972 6188 6202 6445 30451Ag Payment 878 982 1252 1275 1315 1240 6941Au Payment 91 100 31 21 21 -10 253Treatment charge -655 -718 -1453 -1505 -1509 -1568 -7408
0,00
5,00
10,00
15,00
20,00
25,00
-
500
1 000
1 500
2 000
2 500
3 000
2016 2017 2018 2019 2020 2021 2022
SIVE
RPR
ICE
METALPRICE
PriceforecastUSD
Ag Au Zn Pb

SilverMineBFSUpdate2016
SilverMineBFSUpdatereport Page56of63
ThecashflowstatementispresentedinTable30.Table30CashFlowstatement
SilverMineprojectsummaryoftheresultsofthecashflowmodellingandvaluationispresentedintable31fortheforecastcommodityprices.
NETSALES(NSR) 204714 0 25571 27101 36859 37583 38587 39013OperatingCosts
Generaladmin -3420 0 -570 -570 -570 -570 -570 -570OpenPit -2752 0 -621 -641 -518 -518 -509 0Mine -60518 0 -4224 -4445 -11914 -12435 -12780 -14168Mine,pumpsandmaintanance -2507 0 0 0 -574 -599 -602 -732Plant -37432 -942 -9352 -9069 -5685 -5403 -5403 -5285Site -3485 0 -606 -603 -576 -576 -576 -576
TOTALOPERATINGCOSTS -110114 -942 -15373 -12089 -19837 -20101 -20441 -21331TotalEBITDA 94600 -942 10198 15011 17022 17483 18147 17682
EBITDA/Year(First4years) 59714CapitalCosts
BasicInvestments -27985 -27629 -356 0 0 0 0 0Development -7579 0 0 -3942 -1700 -1360 -578 0Restvalue 11978 0 0 0 0 0 0 11978
TOTALCAPITALCOST -23586 -27629 -356 -3942 -1700 -1360 -578 11978Contingency -5000 -2000 -2000 -400 -300 -300 0 0
GENERAL+CAPITALCOSTS -27816 -28859 -2356 -4342 -2000 -1660 -578 11978PublicFunding 1500 0 1500 0 0 0 0 0CFAdjustments 0 0 0 0 0 0 0
CASHFLOW -29801 9342 10670 15022 15823 17569 29660

SilverMineBFSUpdate2016
SilverMineBFSUpdatereport Page57of63
Table31Financialresultsbasedonforecastcommodityprices
P R O F I T A B I L I T Y A N A L Y S I S
Project description 1 000 EUR
Nominal value of all investments 40 564 Discounted investments 39 465Required rate of return 0,00 % VariableCalculation term 7,0 years 1/2016 - 12/2022Calculation point 12/2016 (In the end of period)
Present value of business cash flows Notes± PV of operative cash flow 73 484 Ag price 17…20 UDS/oz+ PV of residual value 8 137 Au price 1191…1256 UDS/oz
Present value of business cash flows 81 621
- Present value of reinvestments (maintenance etc.) 0Total Present Value (PV) 81 621
Investment proposal Nominal PV- Proposed investments in assets -40 564 -39 465+ Investment subventions 0 0
Investment proposal -40 564 -39 465
Net Present Value (NPV) 42 156 >= 0NPV as a monthly annuity - # NPV (5%) 50 008 before tax
Internal Rate of Return (IRR) 32,58 %Internal Rate of Return before tax 36,41 %Profitability Index (PI) 2,07 >= 1Calculation point, Payback 1/2017Simple Payback, years 2,7 Based on FCF
Return on net assets (RONA), % 64,8 % Average 6 yearsEconomic Value Added (EVA) 7 595 Average 6 years
Discounted Value Added (DCVA) 32 96311/2018 12/2018 ?
Calculation is made by 1.3.2016Calculation file
Pekka VeistoI:\Sotkamo Silver \DFS update Q4_2015\Final calculations\Tar kastateluajankohta 1_2017\Kanada\Diskonttaus 5 pr os\Blaiken 6Y_Tekes_f or ecast_20160229.xlsm
6 operation years
NSR204 714 €Tekes+Outotec O&MBlaiken plant
Sotkamo Silver, Blaiken + OT+Tekes / Forecast
$/€0,92

SilverMineBFSUpdate2016
SilverMineBFSUpdatereport Page58of63
6.2 Projectsensitivities
For illustrative purposes a Down Side andUp-Side caseswas developed. In thedownsidecasesilverprice12,7$/ozandgold1200$/ozwasused.IntheUp-Sidecasethevalueswere28,0$/ozforsilverand1500$/ozforgold.Thekeyfiguresofhighandlowpricessensitivitiesanalyze(downsidecase/up-sidecase)areshowninTable32.Table32ThesensitivityofBasecase
6.3 Managementcase
IntheManagementcasetheorereservesbelowthebasecasemininglevelarepro-cessed.ThiswillincreasetheLOMfrom6to11years.ThesummaryoftheresultsofManagementcasecashflowmodellingandvaluationforconsensusforecastcaseispresentedinTable33.
Currency:1000€DFS2014/3 LowPrice ConsensusPrice HighPrice
Ag=15,5$/OZ SilverMine SilverMine SilverMineMillFeed(tonnes) 3335439 2443314 2443314 2443314
LOM(years) 8 6 6 6k€ k€ k€ k€
Revenue 155906 153748 204263 292644Capex(LOM) 34201 40564 40564 40564InitialCapex 23903 29629 29629 29629Opex(LOM) 123476 110114 110114 110114
EBITDA 32429 44085 94600 182981EBITDAfirst4years 28427 30489 59714 120996NPV(5%beforetax) 392 8883 50008 124382
IRR(beforetax) 9,0% 11,2% 36,4% 85,4%Payback - 5,1 2,7 1,2
BaseCase--6YearsOperationBaseCase:LOM=MineralReserves

SilverMineBFSUpdate2016
SilverMineBFSUpdatereport Page59of63
Table33Theresultsofcashflowmodelling,Managementcase
TheManagementcasekeyfinancialfiguresofconsensus,highandlowpricessen-sitivitiesanalyze(downsidecase/up-sidecase)areshowninTable34.
P R O F I T A B I L I T Y A N A L Y S I S
Project description 1 000 EUR
Nominal value of all investments 44 090 Discounted investments 41 875Required rate of return 0,00 % VariableCalculation term 12,0 years 1/2016 - 12/2027Calculation point 12/2016 (In the end of period)
Present value of business cash flows Notes± PV of operative cash flow 124 134 Ag price 17...20 UDS/oz+ PV of residual value 4 436 Au price 1191...1256 UDS/oz
Present value of business cash flows 128 570
- Present value of reinvestments (maintenance etc.) 0Total Present Value (PV) 128 570
Investment proposal Nominal PV- Proposed investments in assets -44 090 -41 875+ Investment subventions 0 0
Investment proposal -44 090 -41 875
Net Present Value (NPV) 86 695 >= 0NPV as a monthly annuity - # NPV (5%) 103 210 before tax
Internal Rate of Return (IRR) 35,16 %Internal Rate of Return before tax 40,03 %Profitability Index (PI) 3,07 >= 1Calculation point, Payback 1/2017Simple Payback, years 3,0 Based on FCF
Return on net assets (RONA), % 130,7 % Average 11 yearsEconomic Value Added (EVA) 10 475 Average 11 years
Discounted Value Added (DCVA) 78 80711/2018 12/2018 ?
Calculation is made by 1.3.2016Calculation file
Pekka VeistoI:\Sotkamo Silver \DFS update Q4_2015\Final calculations\Tar kastateluajankohta 1_2017\Kanada\Diskonttaus 5 pr os\Blaiken_11 year s_Tekes_consensus_20160301.xlsm
Consensus forecast
NSR418 184 €
Blaiken + OT+Tekes
Sotkamo Silver, Blaiken 11 years + OT +Tekes / Fore
Management Plan
$/€0,92
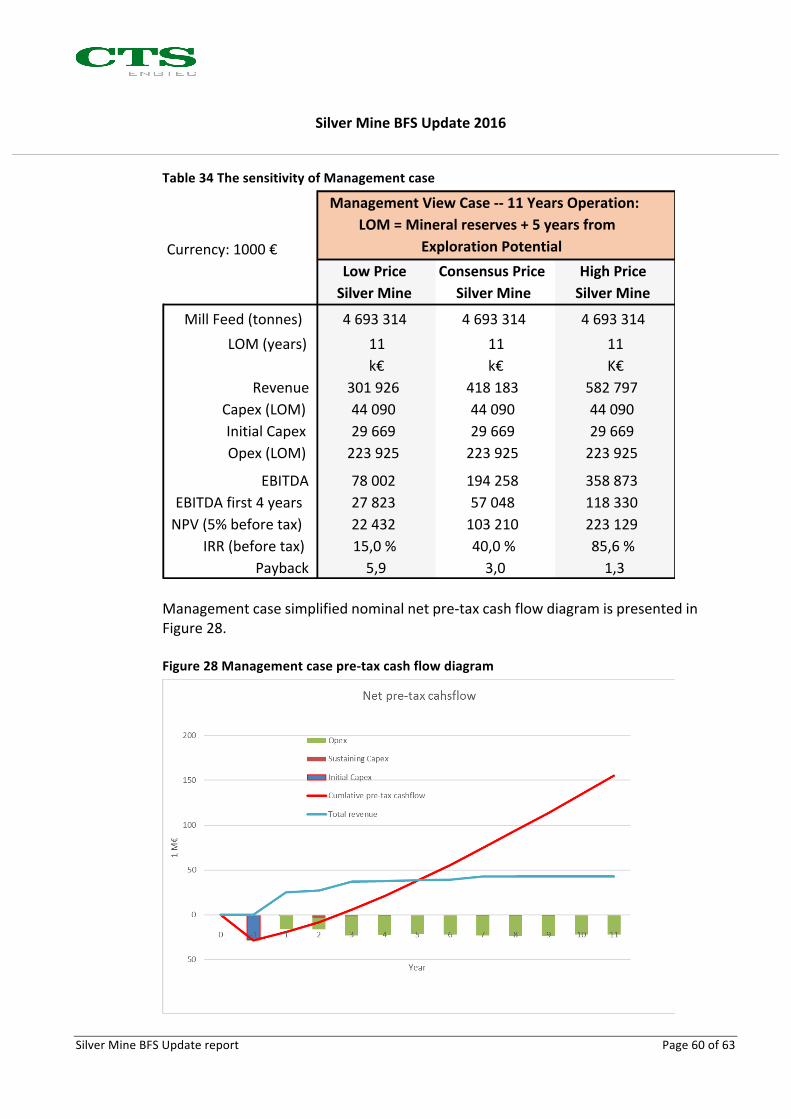
SilverMineBFSUpdate2016
SilverMineBFSUpdatereport Page60of63
Table34ThesensitivityofManagementcase
Managementcasesimplifiednominalnetpre-taxcashflowdiagramispresentedinFigure28.Figure28Managementcasepre-taxcashflowdiagram
Currency:1000€LowPrice ConsensusPrice HighPriceSilverMine SilverMine SilverMine
MillFeed(tonnes) 4693314 4693314 4693314LOM(years) 11 11 11
k€ k€ K€Revenue 301926 418183 582797
Capex(LOM) 44090 44090 44090InitialCapex 29669 29669 29669Opex(LOM) 223925 223925 223925
EBITDA 78002 194258 358873EBITDAfirst4years 27823 57048 118330NPV(5%beforetax) 22432 103210 223129
IRR(beforetax) 15,0% 40,0% 85,6%Payback 5,9 3,0 1,3
ManagementViewCase--11YearsOperation:LOM=Mineralreserves+5yearsfrom
ExplorationPotential
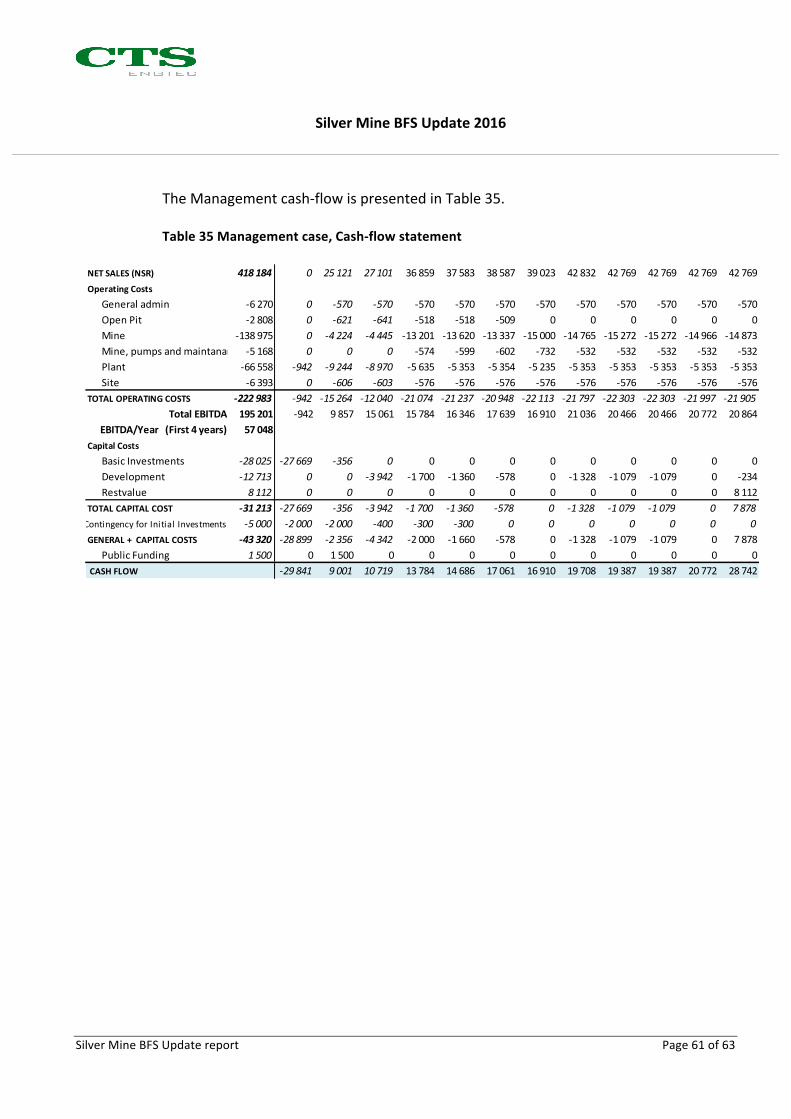
SilverMineBFSUpdate2016
SilverMineBFSUpdatereport Page61of63
TheManagementcash-flowispresentedinTable35.Table35Managementcase,Cash-flowstatement
NETSALES(NSR) 418184 0 25121 27101 36859 37583 38587 39023 42832 42769 42769 42769 42769OperatingCosts
Generaladmin -6270 0 -570 -570 -570 -570 -570 -570 -570 -570 -570 -570 -570OpenPit -2808 0 -621 -641 -518 -518 -509 0 0 0 0 0 0Mine -138975 0 -4224 -4445 -13201 -13620 -13337 -15000 -14765 -15272 -15272 -14966 -14873Mine,pumpsandmaintanance -5168 0 0 0 -574 -599 -602 -732 -532 -532 -532 -532 -532Plant -66558 -942 -9244 -8970 -5635 -5353 -5354 -5235 -5353 -5353 -5353 -5353 -5353Site -6393 0 -606 -603 -576 -576 -576 -576 -576 -576 -576 -576 -576
TOTALOPERATINGCOSTS -222983 -942 -15264 -12040 -21074 -21237 -20948 -22113 -21797 -22303 -22303 -21997 -21905TotalEBITDA 195201 -942 9857 15061 15784 16346 17639 16910 21036 20466 20466 20772 20864
EBITDA/Year(First4years) 57048CapitalCosts
BasicInvestments -28025 -27669 -356 0 0 0 0 0 0 0 0 0 0Development -12713 0 0 -3942 -1700 -1360 -578 0 -1328 -1079 -1079 0 -234Restvalue 8112 0 0 0 0 0 0 0 0 0 0 0 8112
TOTALCAPITALCOST -31213 -27669 -356 -3942 -1700 -1360 -578 0 -1328 -1079 -1079 0 7878ContingencyforInitialInvestments -5000 -2000 -2000 -400 -300 -300 0 0 0 0 0 0 0GENERAL+CAPITALCOSTS -43320 -28899 -2356 -4342 -2000 -1660 -578 0 -1328 -1079 -1079 0 7878
PublicFunding 1500 0 1500 0 0 0 0 0 0 0 0 0 0CASHFLOW -29841 9001 10719 13784 14686 17061 16910 19708 19387 19387 20772 28742

SilverMineBFSUpdate2016
SilverMineBFSUpdatereport Page62of63
7 BASECASEPROJECTSCHEDULE
TheprojectschedulehasbeenupdatedbasedonuseofBlaikenplant.Ittakes12monthsfromthestartofdismantlingBlaikenplanttostart-up.ThemainschedulefortheprojectisshowninFigure29.
Figure29SIlverMineprejectMainschedule
SilverMineBFSUpdate2016
SilverMineBFSUpdatereport Page63of63
8 CONCLUSIONSANDRECOMMENDATIONS
Basedonthedevelopmentoftheprojectconcept:- useofBlaikenplant- newminingplanbasedonupdatedorereserves
thisupdatetotheBankableFeasibilityStudy2014demonstratebothtechnicalandeconomicviabilityoftheSilverMineproject,eventhesilverpricehasfallenfromtheBFS2014levelof21,5$/oztoBFS2014downsidelevelof15,5$/ozandbelow.