silver - 1r928r1493tl74svo34hexe1-wpengine.netdna-ssl.com
TRANSCRIPT
For more information on silver, and how specific gold, silver, palladium and platinum investments may be used to
diversify your portfolio, please contact:
2 0 2 1 M A R K E T O U T L O O K
SILVER
Copyright CPM Group LLC 2021.These reports are produced by CPM Group for distribution by Monex Deposit Company. The rights to distribution, reproduction, and redistribution rights are ceded to Monex Deposit Company by CPM Group for these reports. These reports are not for reproduction or retransmission without written consent of Monex Deposit Company. The intellectual content and property of these reports remain the property of CPM Group, and they are not for reproduction or retrans-mission without written consent of CPM Group. The views expressed within are solely those of CPM Group. Such infor-mation has not been verified, nor does CPM make any representation as to its accuracy or completeness. Any statements nonfactual in nature constitute only current opinions, which are subject to change. While every effort has been made to ensure that the accuracy of the material contained in the reports is correct, CPM Group cannot be held liable for errors or omissions. CPM Group is not soliciting any action based on it. Information contained here should not be relied on as specific investment or market timing advice. At times the principals and associates of CPM Group may have long or short positions in some of the markets mentioned here.
Page 1 2021 Silver Market Outlook
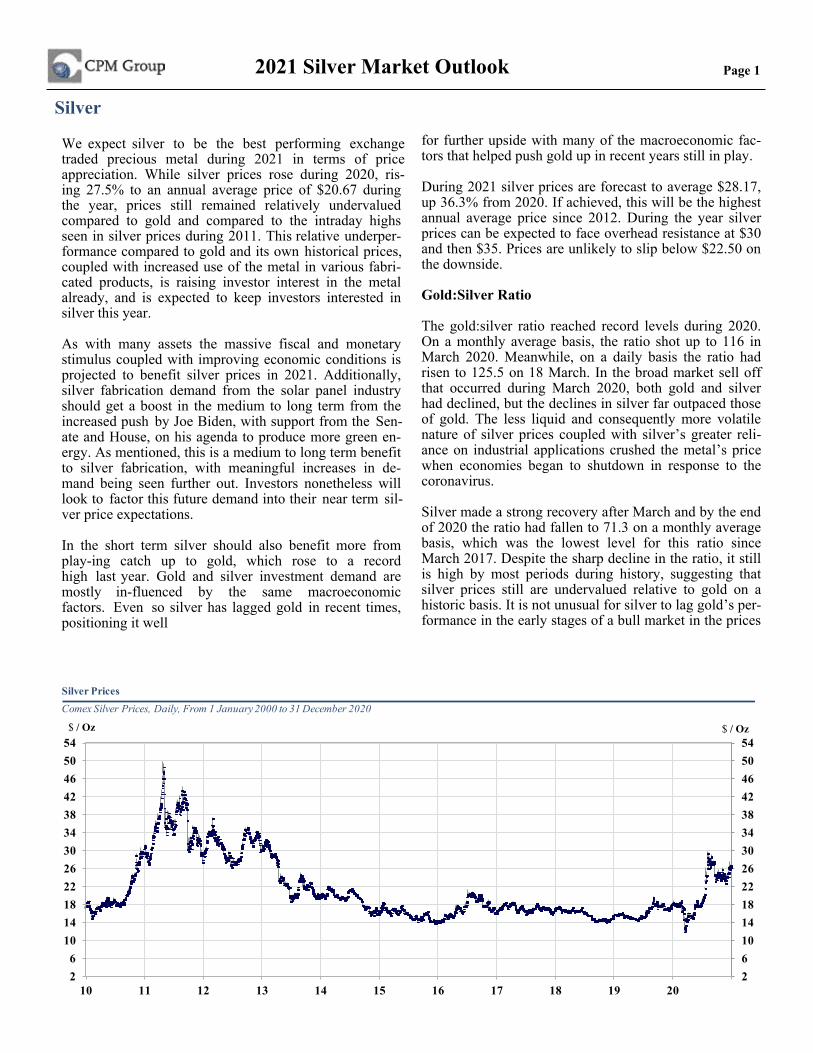
Silver for further upside with many of the macroeconomic fac-tors that helped push gold up in recent years still in play.
During 2021 silver prices are forecast to average $28.17, up 36.3% from 2020. If achieved, this will be the highest annual average price since 2012. During the year silver prices can be expected to face overhead resistance at $30 and then $35. Prices are unlikely to slip below $22.50 on the downside.
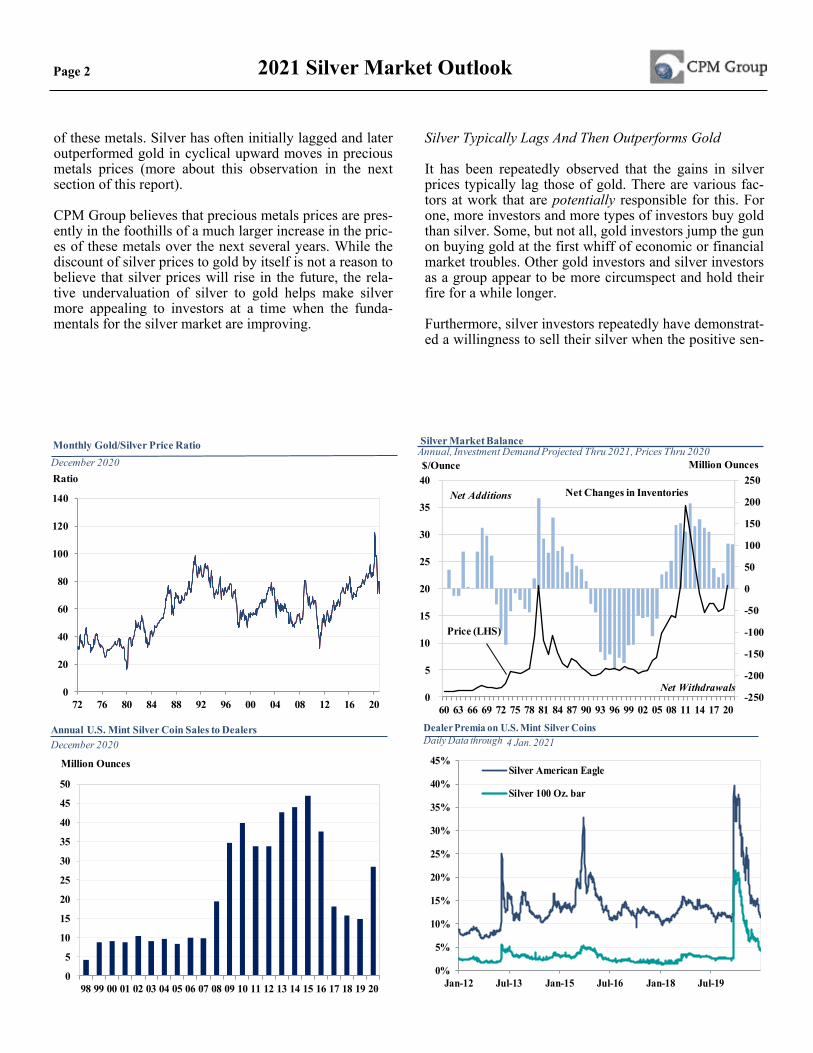
Gold:Silver Ratio
The gold:silver ratio reached record levels during 2020. On a monthly average basis, the ratio shot up to 116 in March 2020. Meanwhile, on a daily basis the ratio had risen to 125.5 on 18 March. In the broad market sell off that occurred during March 2020, both gold and silver had declined, but the declines in silver far outpaced those of gold. The less liquid and consequently more volatile nature of silver prices coupled with silver’s greater reli-ance on industrial applications crushed the metal’s price when economies began to shutdown in response to the coronavirus.
Silver made a strong recovery after March and by the end of 2020 the ratio had fallen to 71.3 on a monthly average basis, which was the lowest level for this ratio since March 2017. Despite the sharp decline in the ratio, it still is high by most periods during history, suggesting that silver prices still are undervalued relative to gold on a historic basis. It is not unusual for silver to lag gold’s per-formance in the early stages of a bull market in the prices
We expect silver to be the best performing exchange traded precious metal during 2021 in terms of price appreciation. While silver prices rose during 2020, ris-ing 27.5% to an annual average price of $20.67 during the year, prices still remained relatively undervalued compared to gold and compared to the intraday highs seen in silver prices during 2011. This relative underper-formance compared to gold and its own historical prices, coupled with increased use of the metal in various fabri-cated products, is raising investor interest in the metal already, and is expected to keep investors interested in silver this year.
As with many assets the massive fiscal and monetary stimulus coupled with improving economic conditions is projected to benefit silver prices in 2021. Additionally, silver fabrication demand from the solar panel industry should get a boost in the medium to long term from the increased push by Joe Biden, with support from the Sen-ate and House, on his agenda to produce more green en-ergy. As mentioned, this is a medium to long term benefit to silver fabrication, with meaningful increases in de-mand being seen further out. Investors nonetheless will look to factor this future demand into their near term sil-ver price expectations.
In the short term silver should also benefit more from play-ing catch up to gold, which rose to a record high last year. Gold and silver investment demand are mostly in-fluenced by the same macroeconomic factors. Even so silver has lagged gold in recent times, positioning it well
26101418222630343842465054
26
101418222630343842465054
10 11 12 13 14 15 16 17 18 19 20
Silver Prices
$ / Oz
Comex Silver Prices, Daily, From 1 January 2000 to 31 December 2020
$ / Oz
Page 2 2021 Silver Market Outlook
of these metals. Silver has often initially lagged and later outperformed gold in cyclical upward moves in precious metals prices (more about this observation in the next section of this report).
CPM Group believes that precious metals prices are pres-ently in the foothills of a much larger increase in the pric-es of these metals over the next several years. While the discount of silver prices to gold by itself is not a reason to believe that silver prices will rise in the future, the rela-tive undervaluation of silver to gold helps make silver more appealing to investors at a time when the funda-mentals for the silver market are improving.
Silver Typically Lags And Then Outperforms Gold
It has been repeatedly observed that the gains in silver prices typically lag those of gold. There are various fac-tors at work that are potentially responsible for this. For one, more investors and more types of investors buy gold than silver. Some, but not all, gold investors jump the gun on buying gold at the first whiff of economic or financial market troubles. Other gold investors and silver investors as a group appear to be more circumspect and hold their fire for a while longer.
Furthermore, silver investors repeatedly have demonstrat-ed a willingness to sell their silver when the positive sen-
0
20
40
60
80
100
120
140
72 76 80 84 88 92 96 00 04 08 12 16 20
Monthly Gold/Silver Price Ratio
RatioDecember 2020
-250
-200
-150
-100
-50
0
50
100
150
200
250
0
5
10
15
20
25
30
35
40
60 63 66 69 72 75 78 81 84 87 90 93 96 99 02 05 08 11 14 17 20
Million Ounces$/Ounce
Price (LHS)
Net Changes in Inventories Net Additions
Net Withdrawals
Silver Market BalanceAnnual, Investment Demand Projected Thru 2021, Prices Thru 2020
0
5
10
15
20
25
30
35
40
45
50
98 99 00 01 02 03 04 05 06 07 08 09 10 11 12 13 14 15 16 17 18 19 20
Million Ounces
Annual U.S. Mint Silver Coin Sales to DealersDecember 2020
0%
5%
10%
15%
20%
25%
30%
35%
40%
45%
Jan-12 Jul-13 Jan-15 Jul-16 Jan-18 Jul-19
Silver American Eagle
Silver 100 Oz. bar
Dealer Premia on U.S. Mint Silver CoinsDaily Data through 4 Jan. 2021
Page 3 2021 Silver Market Outlook
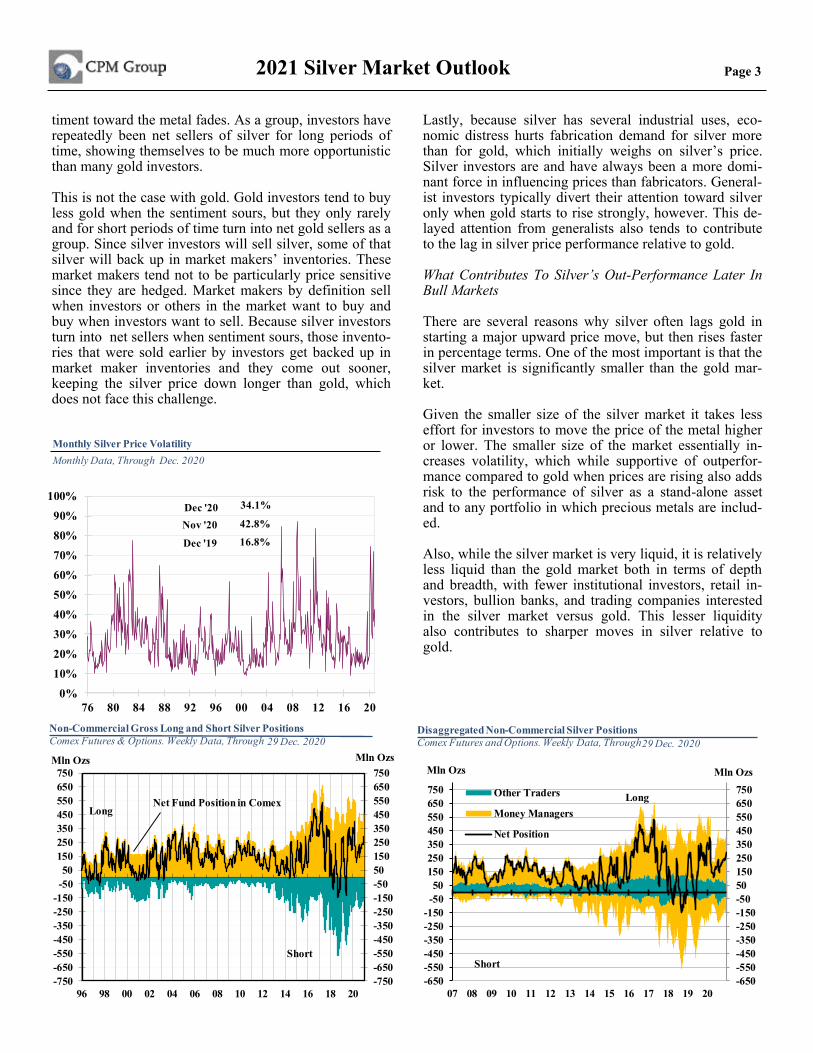
timent toward the metal fades. As a group, investors have repeatedly been net sellers of silver for long periods of time, showing themselves to be much more opportunistic than many gold investors.
This is not the case with gold. Gold investors tend to buy less gold when the sentiment sours, but they only rarely and for short periods of time turn into net gold sellers as a group. Since silver investors will sell silver, some of that silver will back up in market makers’ inventories. These market makers tend not to be particularly price sensitive since they are hedged. Market makers by definition sell when investors or others in the market want to buy and buy when investors want to sell. Because silver investors turn into net sellers when sentiment sours, those invento-ries that were sold earlier by investors get backed up in market maker inventories and they come out sooner, keeping the silver price down longer than gold, which does not face this challenge.
Lastly, because silver has several industrial uses, eco-nomic distress hurts fabrication demand for silver more than for gold, which initially weighs on silver’s price. Silver investors are and have always been a more domi-nant force in influencing prices than fabricators. General-ist investors typically divert their attention toward silver only when gold starts to rise strongly, however. This de-layed attention from generalists also tends to contribute to the lag in silver price performance relative to gold.
What Contributes To Silver’s Out-Performance Later In Bull Markets
There are several reasons why silver often lags gold in starting a major upward price move, but then rises faster in percentage terms. One of the most important is that the silver market is significantly smaller than the gold mar-ket.
Given the smaller size of the silver market it takes less effort for investors to move the price of the metal higher or lower. The smaller size of the market essentially in-creases volatility, which while supportive of outperfor-mance compared to gold when prices are rising also adds risk to the performance of silver as a stand-alone asset and to any portfolio in which precious metals are includ-ed.
Also, while the silver market is very liquid, it is relatively less liquid than the gold market both in terms of depth and breadth, with fewer institutional investors, retail in-vestors, bullion banks, and trading companies interested in the silver market versus gold. This lesser liquidity also contributes to sharper moves in silver relative to gold.
0%10%20%30%40%50%60%70%80%90%
100%
76 80 84 88 92 96 00 04 08 12 16 20
Dec '19 16.8%Nov '20 42.8%Dec '20 34.1%
Dec. 2020Monthly Data, ThroughMonthly Silver Price Volatility
-750-650-550-450-350-250-150-5050150250350450550650750
-750-650-550-450-350-250-150-5050
150250350450550650750
96 98 00 02 04 06 08 10 12 14 16 18 20
Long
Short
Net Fund Position in Comex
Mln Ozs
Non-Commercial Gross Long and Short Silver Positions Comex Futures & Options. Weekly Data, Through
Mln Ozs
29 Dec. 2020
-650-550-450-350-250-150-5050150250350450550650750
-650-550-450-350-250-150-5050
150250350450550650750
07 08 09 10 11 12 13 14 15 16 17 18 19 20
Other Traders
Money Managers
Net Position
Disaggregated Non-Commercial Silver PositionsComex Futures and Options. Weekly Data, Through
Mln Ozs Mln Ozs
Long
Short
29 Dec. 2020
Page 4 2021 Silver Market Outlook
Investment Demand
Investment demand is key to a rise in silver prices. How-ever, these market participants had not been aggressive buyers of the metal for several years until last year, with net silver investment demand declining in the period be-tween 2015 and 2019. During 2018 and 2019 net silver investment demand was at multi-year lows and this was reflected in the price of the metal.
During 2020 silver investment demand rose sharply, driv-ing silver prices higher along with it and offsetting any loss in fabrication demand resulting from the covid-19 related shutdowns. During 2020 investment demand was the primary factor supporting silver prices. The spike higher in monetary and fiscal stimulus was the driving factor for silver investment demand and prices during 2020. The same factors that affect gold affect silver and while silver prices rose strongly last year they still under-
performed gold. This is likely to result in silver playing catch up this year. Additionally, during 2021 economic growth is expected to recover and continue to do so in 2022, driven by the increased availability of vaccines and the flood of monetary and fiscal stimulus. This increase in silver fabrication demand coupled with healthy in-vestment demand, and the relative underperformance of silver to gold forms the bases for why silver prices should perform strongly this year.
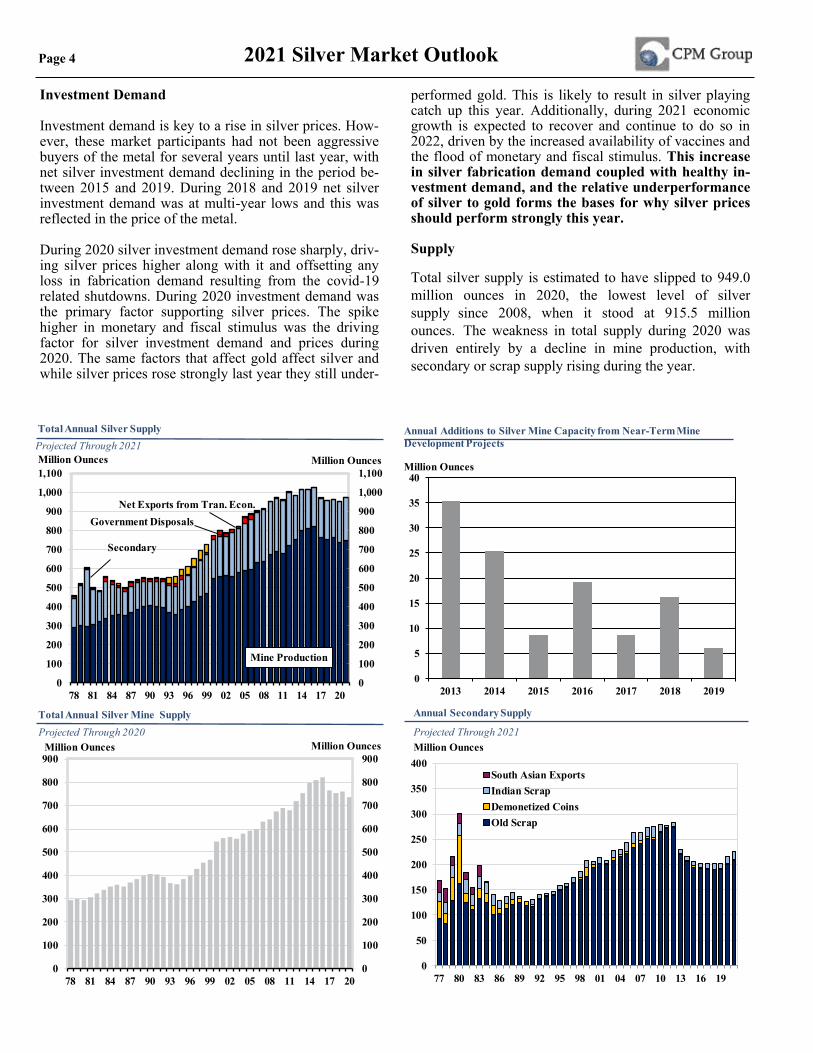
Supply
Total silver supply is estimated to have slipped to 949.0 million ounces in 2020, the lowest level of silver supply since 2008, when it stood at 915.5 million ounces. The weakness in total supply during 2020 was driven entirely by a decline in mine production, with secondary or scrap supply rising during the year.
0
100
200
300
400
500
600
700
800
900
1,000
1,100
0
100
200
300
400
500
600
700
800
900
1,000
1,100
78 81 84 87 90 93 96 99 02 05 08 11 14 17 20
Secondary
Mine Production
Million Ounces
Net Exports from Tran. Econ.Government Disposals
Million OuncesProjected Through 2021Total Annual Silver Supply
0
100
200
300
400
500
600
700
800
900
0
100
200
300
400
500
600
700
800
900
78 81 84 87 90 93 96 99 02 05 08 11 14 17 20
Million OuncesMillion Ounces
Total Annual Silver Mine SupplyProjected Through 2020
0
5
10
15
20
25
30
35
40
2013 2014 2015 2016 2017 2018 2019
Million Ounces
Annual Additions to Silver Mine Capacity from Near-Term Mine Development Projects
0
50
100
150
200
250
300
350
400
77 80 83 86 89 92 95 98 01 04 07 10 13 16 19
South Asian ExportsIndian ScrapDemonetized CoinsOld Scrap
Million OuncesProjected Through 2021
Annual Secondary Supply
Page 5 2021 Silver Market Outlook
Silver mine supply during 2020 declined 3.5% to 734.9 million ounces, which was the lowest level of mine sup-ply since 2012 when it stood at 718.8 million ounces. Silver mine supply has been softening since 2017 and while mine supply is expected to rise slightly in 2021, it is expected to resume its declining trend in the years beyond 2021. Weakness in silver and several other metals prices for an extended period of time has disincentivized producers from developing primary silver projects or pro-jects that produce silver as a byproduct. Additionally, the shuttering of certain large mines like the Escobal mine, which have not been bought back online for years, are all factors weighing on global silver mine supply.
Total silver supply is forecast to reach 979.2 million ounces in 2021, the highest level of total supply since 2017, but still lower than the over one billion ounces in supply between 2014 and 2016. The gains in total supply during 2021 are forecast to be driven by both a recovery in mine supply as well as healthy gains in scrap supply.
Secondary or scrap supply is expected to be the primary driver of the gains in total supply during 2021. The rela-tively high silver prices coupled with expectations of higher prices is projected to push up scrap recovery of the metal during 2021. Total scrap supply during 2021 is ex-pected to reach 232 million ounces, the highest level of such supply since 2012. Mine supply also is expected to rise, reaching 747.2 million ounces in 2021, up 1.8% from 2020 but still below levels seen in 2019.
0
50
100
150
200
250
300
350
80 83 86 89 92 95 98 01 04 07 10 13 16 19
South AmericaOceaniaNorth & Central AmericaEuropeAsia & Middle East
Mln Oz
Projected Through 2021Annual Silver Jewelry and Silverware
0
50
100
150
200
250
0
50
100
150
200
250
89 91 93 95 97 99 01 03 05 07 09 11 13 15 17 19 21p
Million Ounces
Silver Demand for Electronics and Batteries
Million Ounces
0
5
10
15
20
25
30
35
40
45
2000
2001
2002
2003
2004
2005
2006
2007
2008
2009
2010
2011
2012
2013
2014
2015
2016
2017
2018
2019
2020
2021
pSilver Use In The Auto Sector
Million Ounces
0
100
200
300
400
500
600
700
800
900
1,000
0
100
200
300
400
500
600
700
800
900
1,000
77 80 83 86 89 92 95 98 01 04 07 10 13 16 19
PhotovoltaicImports into Trans EconomiesOther CountriesOther UsesBiocidesSuperconductorsElectronics
Million OuncesMillion Ounces
Photography
Jewelry and Silverware
Annual Fabrication DemandProjected Through 2021
Page 6 2021 Silver Market Outlook
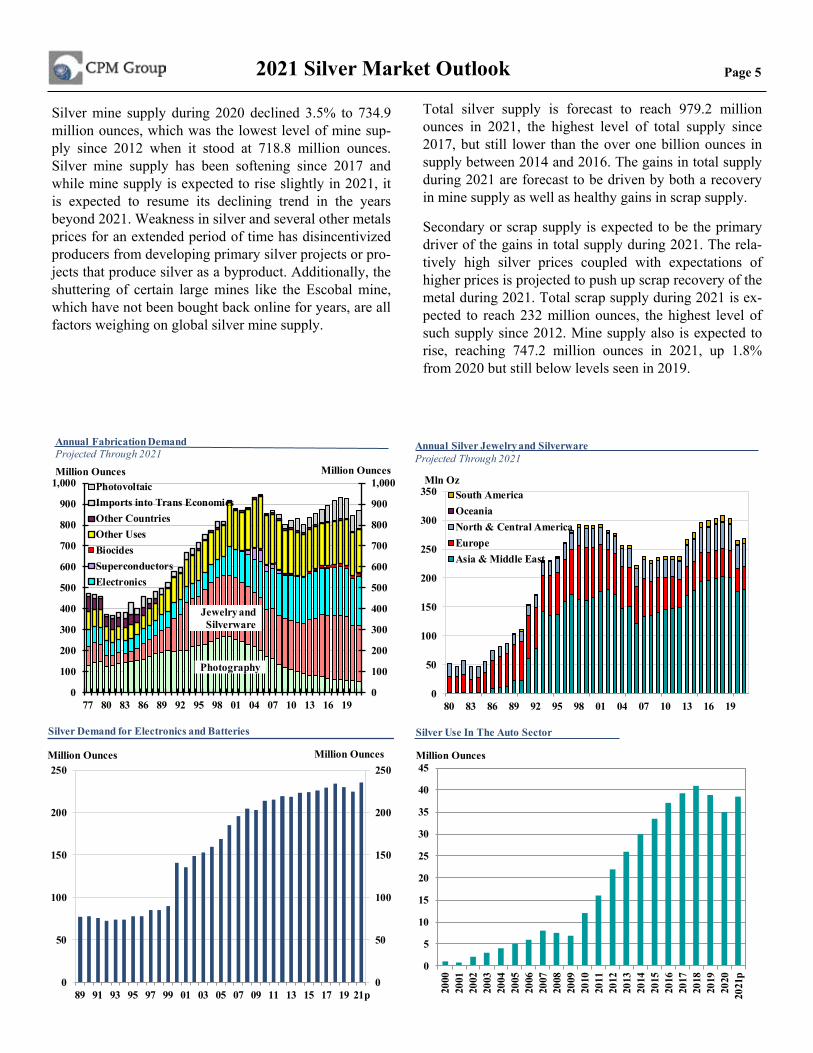
Fabrication Demand
Unsurprisingly, silver fabrication demand declined dur-ing 2020. Demand for the metal from industrial users slipped to 845.4 million ounces, down 8.75% from 2019. This was the lowest level of silver fabrication demand since 2013. A combination of many industries shutting shop for several weeks during the early days of the pan-demic coupled with recessionary conditions in many parts of the world weighed on fabrication demand.
Fabrication demand is forecast to recover during 2021 as economic growth recovers. Silver fabrication demand is
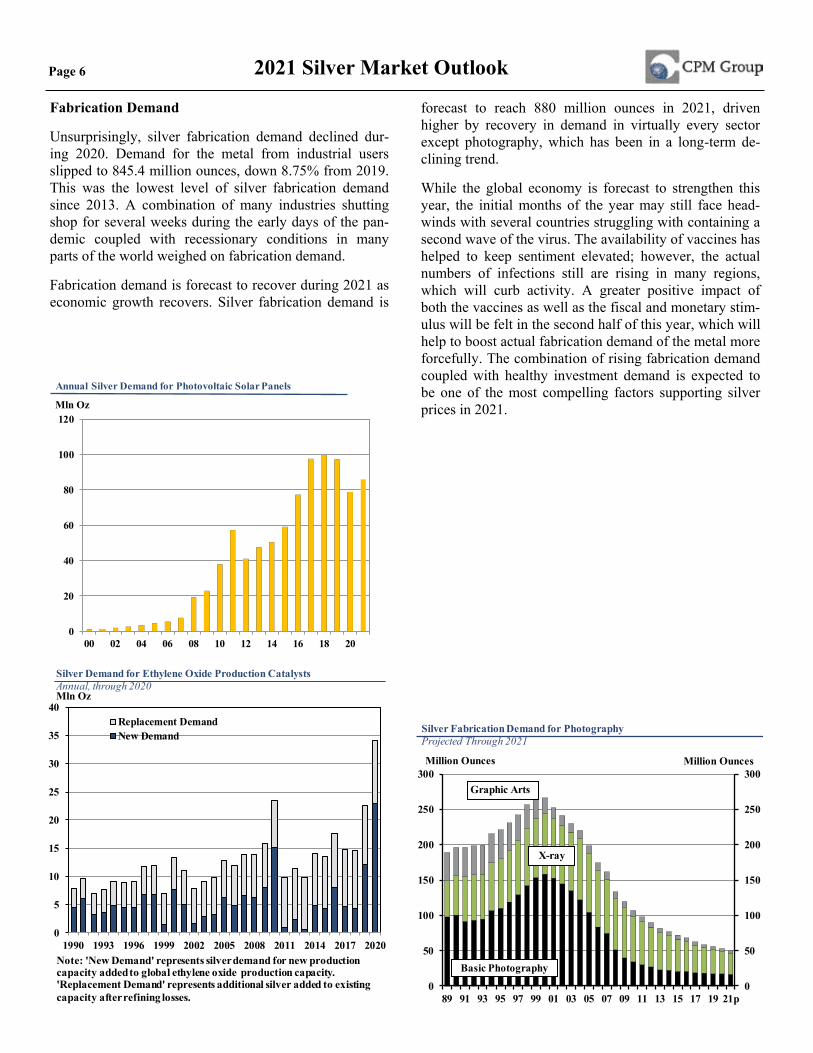
forecast to reach 880 million ounces in 2021, driven higher by recovery in demand in virtually every sector except photography, which has been in a long-term de-clining trend.
While the global economy is forecast to strengthen this year, the initial months of the year may still face head-winds with several countries struggling with containing a second wave of the virus. The availability of vaccines has helped to keep sentiment elevated; however, the actual numbers of infections still are rising in many regions, which will curb activity. A greater positive impact of both the vaccines as well as the fiscal and monetary stim-ulus will be felt in the second half of this year, which will help to boost actual fabrication demand of the metal more forcefully. The combination of rising fabrication demand coupled with healthy investment demand is expected to be one of the most compelling factors supporting silver prices in 2021.
Note: 'New Demand' represents silver demand for new production capacity addedto global ethylene oxide production capacity. 'Replacement Demand' represents additional silver added to existing capacity after refining losses.
0
20
40
60
80
100
120
00 02 04 06 08 10 12 14 16 18 20
Mln Oz
Annual Silver Demand for Photovoltaic Solar Panels
0
50
100
150
200
250
300
0
50
100
150
200
250
300
89 91 93 95 97 99 01 03 05 07 09 11 13 15 17 19 21p
Million Ounces Million Ounces
Basic Photography
X-ray
Graphic Arts
Silver Fabrication Demand for PhotographyProjected Through 2021
0
5
10
15
20
25
30
35
40
1990 1993 1996 1999 2002 2005 2008 2011 2014 2017 2020
Replacement DemandNew Demand
Silver Demand for Ethylene Oxide Production CatalystsAnnual, through 2020Mln Oz
Page 7 2021 Silver Market Outlook
200
300
400
500
600
700
800
900
1,000
1,100
200
300
400
500
600
700
800
900
1,000
1,100
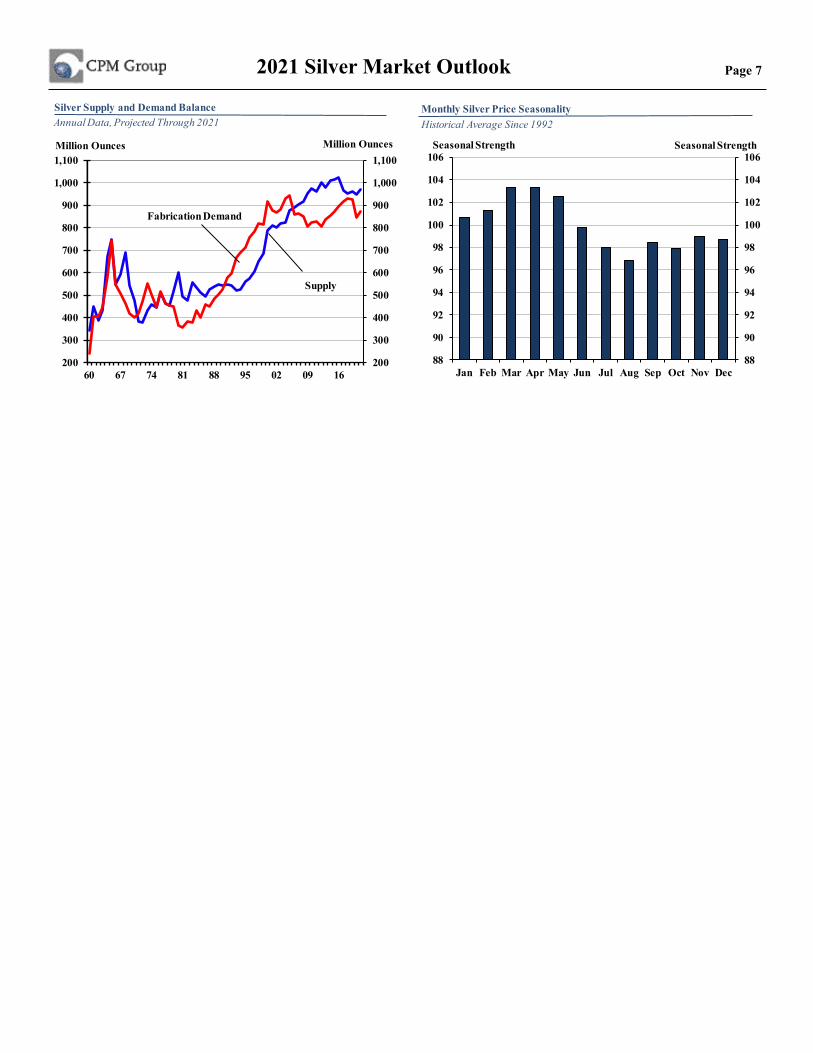
60 67 74 81 88 95 02 09 16
Supply
Fabrication Demand
Silver Supply and Demand Balance
Million OuncesMillion Ounces
Annual Data, Projected Through 2021
88
90
92
94
96
98
100
102
104
106
88
90
92
94
96
98
100
102
104
106
Jan Feb Mar Apr May Jun Jul Aug Sep Oct Nov Dec
Seasonal Strength
Monthly Silver Price Seasonality
Seasonal Strength
Historical Average Since 1992
Page 8 2021 Silver Market Outlook
Million Ounces
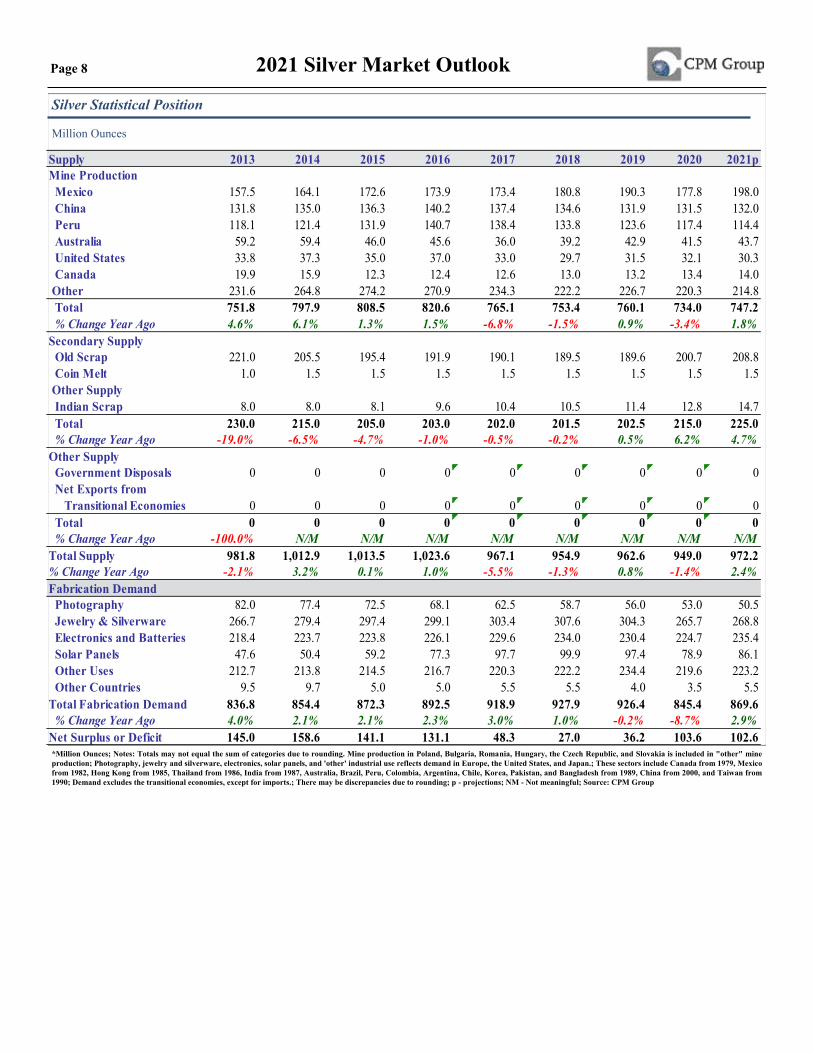
Silver Statistical Position
*Million Ounces; Notes: Totals may not equal the sum of categories due to rounding. Mine production in Poland, Bulgaria, Romania, Hungary, the Czech Republic, and Slovakia is included in "other" mine production; Photography, jewelry and silverware, electronics, solar panels, and 'other' industrial use reflects demand in Europe, the United States, and Japan.; These sectors include Canada from 1979, Mexico from 1982, Hong Kong from 1985, Thailand from 1986, India from 1987, Australia, Brazil, Peru, Colombia, Argentina, Chile, Korea, Pakistan, and Bangladesh from 1989, China from 2000, and Taiwan from 1990; Demand excludes the transitional economies, except for imports.; There may be discrepancies due to rounding; p - projections; NM - Not meaningful; Source: CPM Group
Supply 2013 2014 2015 2016 2017 2018 2019 2020 2021pMine Production Mexico 157.5 164.1 172.6 173.9 173.4 180.8 190.3 177.8 198.0 China 131.8 135.0 136.3 140.2 137.4 134.6 131.9 131.5 132.0 Peru 118.1 121.4 131.9 140.7 138.4 133.8 123.6 117.4 114.4 Australia 59.2 59.4 46.0 45.6 36.0 39.2 42.9 41.5 43.7 United States 33.8 37.3 35.0 37.0 33.0 29.7 31.5 32.1 30.3 Canada 19.9 15.9 12.3 12.4 12.6 13.0 13.2 13.4 14.0
Other 231.6 264.8 274.2 270.9 234.3 222.2 226.7 220.3 214.8 Total 751.8 797.9 808.5 820.6 765.1 753.4 760.1 734.0 747.2 % Change Year Ago 4.6% 6.1% 1.3% 1.5% -6.8% -1.5% 0.9% -3.4% 1.8%
Secondary Supply Old Scrap 221.0 205.5 195.4 191.9 190.1 189.5 189.6 200.7 208.8
Coin Melt 1.0 1.5 1.5 1.5 1.5 1.5 1.5 1.5 1.5 Other Supply Indian Scrap 8.0 8.0 8.1 9.6 10.4 10.5 11.4 12.8 14.7 Total 230.0 215.0 205.0 203.0 202.0 201.5 202.5 215.0 225.0 % Change Year Ago -19.0% -6.5% -4.7% -1.0% -0.5% -0.2% 0.5% 6.2% 4.7%
Other Supply Government Disposals 0 0 0 0 0 0 0 0 0 Net Exports from
Transitional Economies 0 0 0 0 0 0 0 0 0 Total 0 0 0 0 0 0 0 0 0 % Change Year Ago -100.0% N/M N/M N/M N/M N/M N/M N/M N/M
Total Supply 981.8 1,012.9 1,013.5 1,023.6 967.1 954.9 962.6 949.0 972.2% Change Year Ago -2.1% 3.2% 0.1% 1.0% -5.5% -1.3% 0.8% -1.4% 2.4%Fabrication Demand Photography 82.0 77.4 72.5 68.1 62.5 58.7 56.0 53.0 50.5 Jewelry & Silverware 266.7 279.4 297.4 299.1 303.4 307.6 304.3 265.7 268.8 Electronics and Batteries 218.4 223.7 223.8 226.1 229.6 234.0 230.4 224.7 235.4 Solar Panels 47.6 50.4 59.2 77.3 97.7 99.9 97.4 78.9 86.1 Other Uses 212.7 213.8 214.5 216.7 220.3 222.2 234.4 219.6 223.2 Other Countries 9.5 9.7 5.0 5.0 5.5 5.5 4.0 3.5 5.5
Total Fabrication Demand 836.8 854.4 872.3 892.5 918.9 927.9 926.4 845.4 869.6 % Change Year Ago 4.0% 2.1% 2.1% 2.3% 3.0% 1.0% -0.2% -8.7% 2.9%
Net Surplus or Deficit 145.0 158.6 141.1 131.1 48.3 27.0 36.2 103.6 102.6
CPM Group LLC
CPM Group is a fundamentally based commodities research shop. We develop our own proprietary estimates of gold, silver, platinum, and palladium supply and demand on a global basis, drawing on every resource we can find, including our own extensive list of contacts involved in precious metals around the world. We have been doing this sort of research and analysis since the 1970s, far longer than anyone else in the business. We also undertake research in specialty metals, base metals, energy and agricultural commodities. We are known for our basic fundamental research, a wide range of finan-cially oriented consulting services, and our expertise in using financial derivatives to structure financing for producers,refiners, industrial users, and investors interested in either hedging or investing in commodities. Our investment phi-losophy is simple: We are value investors who base our decisions on what to buy, sell, hold, or avoid on the fundamentals of each asset, and the macro-economic, financial and political environmental factors that we expect will affect that as-set’s value. We have concerns, expressed in this report and elsewhere, about long-term imbalances in government deficit spending, public and private debt, and a wide range of other economic and political factors. We don’t expect the world’s financial system to collapse, however. That is not the way the world tends to work. More likely economic outcomes in the real world lie between the extremes of cataclysmic collapses and nirvana. We advise our clients – and practice what we preach – to have some of their wealth in gold and silver as an insurance policy against a catastrophic failure, but we also advise them to invest other portions of their money in precious metals and other assets based on the assumption that that sort of failure does not occur. We focus on investing based on likely scenarios, but with an eye always open to outlying events that take the world’s markets by surprise. We have watched investors who were so worried about a collapse that they missed some of the largest stock and bond market rallies of all times over the past 30 years, while watching their safe haven assets fluctuate eight-fold in value up and down, and then up and down again. We prefer our clients to buy and sell precious metals and other assets based on cyclical and other developments, while also maintaining that long-term insur-ance policy in case the levee breaks.
CPM Group LLC168 7th St.Suite 310Brooklyn, NY11215USA
Published 2/1/2021
For more information on silver, and how specific gold, silver, palladium and platinum investments may be used to
diversify your portfolio, please contact:
MONEX DEPOSIT COMPANY 4910 BIRCH STREET
NEWPORT BEACH, CA 92660(800) 949-4653(949) 752-1400
2 0 2 1 M A R K E T O U T L O O K
SILVER