significant industries - new york · pdf fileindustry are in new york city and most of the...
TRANSCRIPT

Significant Industries A Report to the Workforce Development System
The New York State Department of Labor is an Equal Opportunity Employer/Program. Auxiliary aids and services are available upon request to individuals with disabilities.
New York City | 2015
9/15

1
Preface One of the major objectives of the workforce development system is to encourage local workforce investment boards (LWIBs) to plan strategically and focus their resources on priority industries (and eventually on priority occupations within those industries). To assist in this effort, the New York State Department of Labor’s Division of Research and Statistics decided to concentrate this report on industries identified as “significant industries.” Industries presented here are classified according to their North American Industry Classification System (NAICS) code. This report lists significant industries based on various criteria. We hope the Workforce Investment Board, as well as others involved in the workforce system, may find it helpful in allocating their limited resources. Significant industries were identified on the basis of job counts, wage levels, job growth (both net and percent) over the 2009-2014 time frame, and job growth based on industry employment projections through 2022. Priority industries that may have been designated as such by economic development or workforce development officials were also considered. New York City Industries Thirteen industries are designated as significant in this report. Every industry chosen increased its employment level between 2009 and 2014, the period that encompassed a year of recession as well as four years of economic recovery. In addition, 9 of the 13 industries are expected to grow faster than the overall economy through 2022. Collectively, these 13 industries account for about half the jobs in New York City. All significant industries shared one or more of the following characteristics: rapid growth (percentage basis); large growth (absolute basis); high wages (average annual wage above the City average of $84,752 in 2014); or strong expected growth through 2022. The specific reason(s) why each industry was designated as significant are presented in the last column of the first table. A broad-based set of industries were identified for this report. They cover nine major industry groups: construction; trade, transportation and utilities; information; financial activities; professional and business services; educational services; health care and social assistance; leisure and hospitality; and other services. Industry Analysis In the following analysis, industries are presented in ascending NAICS industry code order. For additional information regarding the NAICS industry classification system, visit http://www.census.gov/cgi-bin/sssd/naics/naicsrch?chart=2012.

2
Construction Construction-related skilled trades occupations comprise much of the employment within the specialty trade contractors (NAICS Industry 238) industry. Although construction is a highly cyclical industry, both the short- and the long-term prospects for specialty trade contractors are favorable. In the past three years, growth in this industry has been driven by a surge in high-end residential construction, as well as by continued strength in the commercial and government sectors. Recently announced plans for a number of new hotels, as well as expansion plans proposed by several large universities, should help this sector grow. Trade, Transportation and Utilities Nonstore retailers (NAICS Industry 454), an industry that includes online and catalog shopping, is slowly taking a bigger share of overall retailing. An electronic shopping company can handle much greater customer traffic and prospective customers are not limited to a specific geographic area, resulting in higher sales potential. Although yet small by the City standards, this industry is surging and is likely to continue expanding, as online marketplaces grow and absorb an increasing share of total retail sales. Information Over the past decade, the combination of tax incentives and efficient facilitation of media production in New York City has sparked a resurgence in the local motion picture and sound recording industries (NAICS Industry 512). This in turn has led to growth in both traditional and emerging industry sub-sectors and to new efforts in training and education. Although traditionally the motion picture industry is closely tied to local government incentives, recent openings of new post-production facilities and continuing growth in editing jobs, bodes well for the future of this industry. The main elements that comprise the other information services industry (NAICS Industry 519) are news syndicates, libraries, archives, internet publishing, and web search portals. The ongoing technology boom in New York City brought with it an increase in internet publishing, web broadcasting, and search portal companies. Venture capital financing and angel funding are increasing, large internet companies are growing their New York offices, and Cornell and Technion Universities are collaborating to build a large engineering campus on Roosevelt Island in Midtown Manhattan. These trends suggest strong continued momentum for New York City’s technology and internet companies. Financial Activities The securities, commodity contracts, and other financial investments and related activities industry (NAICS Industry 523) is a part of the broader financial activities supersector. Jobs in this industry are heavily concentrated geographically; ninety percent of the state’s jobs in this industry are in New York City and most of the rest are located in the Long Island and Hudson Valley regions. Although this industry is highly cyclical—going through repeated boom and bust cycles—it has grown over time. Currently, employment appears to be expanding again after severe losses in

3
2008-2009 and the slow recovery thereafter. However, the real importance of this industry to the New York City economy is in its high wages. The average annual wage ($404,800) paid in the securities and commodity contracts industry is nearly five times the all-industry average annual wage ($84,752) for 2014. Professional and Business Services Two industries from the professional and business services sector are on the significant industries list. They are: professional, scientific, and technical services (NAICS Industry 541) and administrative and support services (NAICS Industry 561). Although there are marked differences among these industries, they share one common trait: they tend to sell to other businesses rather than consumers. As a result, employment in these industries reacts very quickly to changing economic trends and often leads shifts in the overall job market. This sector’s performance has been outstanding over the 2009-2014 period, with both of the industries growing by more than 16 percent for the relevant period—faster than the City’s total job growth. Professional, scientific, and technical services is the only significant industry that qualified based on all four measures considered for this report. It is the City’s largest industry, with an annual wage that was almost 44 percent above the New York City average for 2014 and projected growth of 28 percent through 2022. Because the temporary help agencies are a large part of the administrative and support services, this industry is closely tied to the health of the City’s corporate sector. Between 2009 and 2014, the industry grew rapidly, gaining more than 28,000 jobs. As the City’s economy continues to expand, this category is expected to grow 21 percent by 2022. A potential worrying trend is that through the use of cloud computing and sophisticated virtual customer service tools, businesses could contract administrative support services outside of the local job market, thereby bringing down both the average wage and the number of those employed. Educational Services With more than 352,000 jobs between the public and private sectors, educational services (NAICS Industry 611) is the City’s second largest industry. This sector added jobs (+8.4%) between 2009 and 2014, but is expected to grow slower than the City’s economy going forward. Long-term growth in educational services is driven more by demographics than by economic conditions. Trends such as a growing school-age population and an increasing portion of the population attending college drive employment demand. Health Care and Social Assistance Growth in health care industry employment is, like educational services, also driven more by demographics than by overall economic conditions. Many health care occupations are expected to see strong demand over the next decade as the population continues to expand and age. Growth in health care also benefits from continued technological innovation, which both creates more demand for health care services and requires new types of technical skills. Laser eye surgery and joint replacement surgery are good examples of this trend.

4
The largest of the industries in the sector, ambulatory health care services (NAICS Industry 621), experienced a rate of growth in excess of 30 percent for the 2009-2014 period and is projected to grow by 42 percent between 2012 and 2022. This industry offers a wide range of occupational opportunities. There are health care occupations with large numbers of jobs that are rapidly growing while requiring few skills, but offer low wages, such as home health aides (average annual wage of $20,490 in 2014). There are also technical jobs that require some training and offer average pay, such as physical therapy assistants (average annual wage $59,594 in 2014), as well as high wage jobs that require considerable training and educational credentials, such as registered nurses (average annual wage of $89,929 in 2014). Ambulatory health services is also a major employer of clerical and administrative workers and management staff. Social assistance (NAICS Industry 624) is a large industry that has enjoyed steady growth for many years and is expected to continue to perform well in the future. Similar to health care and education, many of the services this industry provides are not directly tied to the business cycle, but tend to be in demand even during economic downturns. For the same reason, it should be expected to perform relatively well during recovery and expansion phases. However, because a large portion of this industry’s jobs is supported by government spending, it often performs relatively poorly when local governments experience budget difficulties. Leisure & Hospitality Two industries from this sector, accommodation (NAICS Industry 721) and food services and drinking places (NAICS Industry 722), are on the significant industries list. The accommodation industry experienced above-average job growth over the 2009-2014 period and is expected to grow faster than the overall economy through 2022, as more tourists and business travelers continue to visit the City every year. Food services and drinking places added the most jobs of any significant industry and is expected to grow over 30 percent between 2012 and 2022, more than twice as fast as the overall City economy. Because many of the industry’s largest occupations require only short-term training, food services & drinking places has the lowest average annual wage of any of the industries in this report ($26,200 for 2014). However, the industry also offers considerable opportunities for advancement to higher-paying supervisory positions – slightly more than 8 percent of the occupations here are supervisory and managerial positions. The leisure and hospitality sector, which is usually hurt by national recessions, performed well during the last downturn and went on to reach record-high employment in 2014, over 412,000. Job gains in this sector were helped by New York City’s growing popularity as a tourist destination, aggressive price cuts by hotels and restaurants during the downturn, and a steady stream of new hotel openings. Going forward, rising corporate profits locally and improving economies abroad should lead to further improvements in this industry. Other Services Other services is a mix of personal and laundry services, auto repair, religious and charitable organizations, and business and civic associations. The largest industry in this sector, religious, grantmaking, civic, professional and similar organizations (NAICS 813), is on the significant

5
industries list. In recent years, this sector has been a slow but steady source of new jobs. It is also expected to grow at an above-average rate through 2022. While this industry employs a wide variety of occupations, everything from clergy to public relations specialists, it is also a large employer of clerical and administrative workers and offers good promotional opportunities from within. Slightly more than 10 percent of this industry is managerial staff, more than any other industry on the list. For Further Information It is hoped that the members of the workforce system find the information in this report useful. The New York State Department of Labor’s New York City labor market analysts, James Brown and Elena Volovelsky, are available for consultation. They can be reached via email at [email protected] or [email protected] and by phone at (212) 775-3330. The statewide report entitled “Significant Industries in New York State: A Report to the Workforce Development System” may be found at http://www.labor.ny.gov/stats/PDFs/Significant-Industries-New-York-State.pdf.

6
Significant Industries, New York City, 2015
NAICS Industry
Code Industry Name
Job Count Net Change in Jobs,
2009-2014
% Change in Jobs,
2009-2014
Average Annual Wage,
2014
Projected % Change in
Jobs, 2012-2022
Why Industry is
Significant** 2009* 2014*
Total, all industries (all ownerships) 3,563,800 3,965,600 401,800 11.3% $84,800 13.2% NA
238 Specialty Trade Contractors 76,400 81,300 4,900 6.4% $71,700 22.9% G, J, P
454 Nonstore retailers 8,000 14,000 6,000 75.0% $81,700 3.1% G
512 Motion picture and sound recording industries 29,000 42,000 13,000 44.8% $113,300 7.5% G, W
519 Other information services 16,000 29,600 13,600 85.0% $142,000 61.9% G, P, W
523 Securities, commodity contracts, investments 165,000 165,300 300 0.2% $404,800 2.3% J, W
541 Professional and technical services 314,600 365,500 50,900 16.2% $122,000 28.0% G, J, P, W
561 Administrative and support services 170,400 198,500 28,100 16.5% $52,500 21.2% G, J, P
611 Educational services 325,600 352,800 27,200 8.4% $54,800 10.6% G, J
621 Ambulatory health care services 168,700 224,100 55,400 32.8% $46,200 41.7% G, J, P
624 Social assistance 161,500 173,200 11,700 7.2% $28,800 22.0% G, J, P
721 Accommodation 40,500 49,900 9,400 23.2% $60,100 29.9% G, J, P
722 Food services and drinking places 197,500 273,900 76,400 38.7% $26,200 30.1% G, J, P
813 Membership associations and organizations 68,700 76,900 8,200 11.9% $60,800 24.6% G, J, P NA – Not Applicable *Represents both private and public sector jobs
**Key: G: Industry experienced above-average job growth; can be net or percentage growth.
J: Industry employs a significant number of jobs (>35,500).
P: Growth projected for 2012-2022 is at least twice the all industries rate.
W: Industry pays above-average wages

7
Specialty Trade Contractors (NAICS Industry 238)
Industry Description: The work performed may include new work, additions, alterations, maintenance, and repairs. The production work performed by establishments in this subsector is usually subcontracted from establishments of the general contractor type or for-sale builders, but may be done directly for the owner of the property. Specialty trade contractors usually perform most of their work at the construction site, although they may have shops where they perform prefabrication and other work.
Ten Most Common Occupations
Rank SOC Code Occupational Title
% Share of Industry
Workforce
Median Occupational
Wage
Projected Employment Change (%), 2012-2022
1
47-2111
Electricians
18.1%
$79,078
18.4%
2
47-2152
Plumbers, Pipefitters, and Steamfitters
8.8%
$68,375
17.9%
3
47-2031 Carpenters
6.1%
$58,945
14.3%
4
47-2061
Construction Laborers
6.0%
$46,885
14.8%
5
11-1021
General and Operations Managers
3.5%
$115,271
16.1%
6
47-3013 Helpers - Electricians
3.5%
$29,513
27.6%
7
47-1011 First-Line Supervisors of Construction Trades and Extraction Work
3.3%
$104,290
14.7%
8
47-4021 Elevator Installers and Repairers
3.2%
$83,474
20.4%
9
47-2141 Painters, Construction and Maintenance
3.0%
$48,193
15.4%
10
43-9061 Office Clerks, General
2.9%
$21,953
5.8%

8
Nonstore Retailers (NAICS Industry 454)
Industry Description: Industries in the Nonstore Retailers subsector retail merchandise using methods, such as the broadcasting of infomercials, the broadcasting and publishing of direct-response advertising, the publishing of paper and electronic catalogs, door-to-door solicitation, in-home demonstration, selling from portable stalls and distribution through vending machines. Establishments in this subsector include mail-order houses, vending machine operators, home delivery sales, door-to-door sales, party plan sales, electronic shopping, and sales through portable stalls.
Ten Most Common Occupations
Rank SOC Code Occupational Title
% Share of Industry
Workforce
Median Occupational
Wage
Projected Employment Change (%), 2012-2022
1
41-2031
Retail Salespersons
10.1%
$28,468
14.3%
2
43-4051
Customer Service Representatives
9.9 %
$37,258
10.3%
3
43-9061
Office Clerks, General
4.5%
$20,431
5.8%
4
11-1021
General and Operations Managers
3.7%
$161,477
16.1%
5
43-4151
Order Clerks
3.7%
$31,712
-3.7%
6
13-1022 Wholesale and Retail Buyers, Except Farm Products
3.7%
$60,214
9.7%
7
13-1161 Market Research Analysts and Marketing Specialists
3.3%
$71,888
38.2%
8
43-5071
Shipping, Receiving, and Traffic Clerks
3.2%
$28,350
3.5%
9
53-7064
Packers and Packagers, Hand
2.8%
$24,053
8.9%
10
43-6014 Secretaries and Administrative Assistants, Except Legal, Medical, and Executive
2.6%
$26,545
14.8%
9
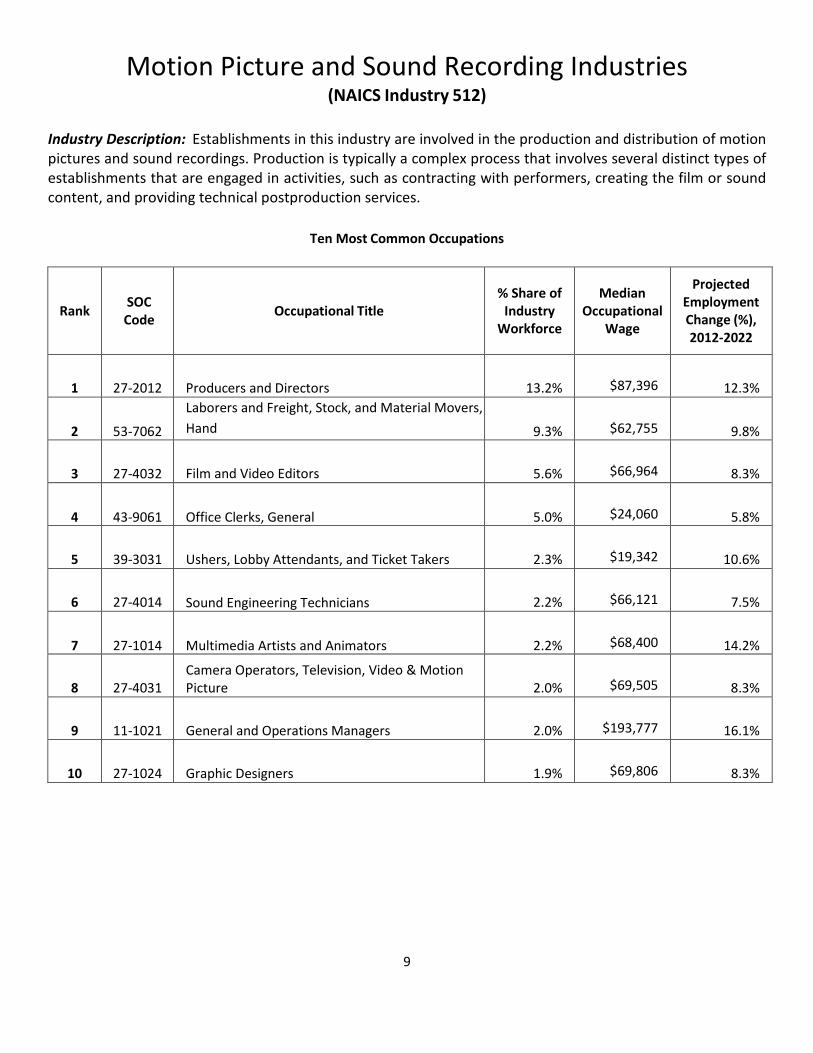
Motion Picture and Sound Recording Industries (NAICS Industry 512)
Industry Description: Establishments in this industry are involved in the production and distribution of motion pictures and sound recordings. Production is typically a complex process that involves several distinct types of establishments that are engaged in activities, such as contracting with performers, creating the film or sound content, and providing technical postproduction services.
Ten Most Common Occupations
Rank SOC Code Occupational Title
% Share of Industry
Workforce
Median Occupational
Wage
Projected Employment Change (%), 2012-2022
1
27-2012
Producers and Directors
13.2%
$87,396
12.3%
2
53-7062
Laborers and Freight, Stock, and Material Movers, Hand
9.3%
$62,755
9.8%
3
27-4032 Film and Video Editors
5.6%
$66,964
8.3%
4
43-9061
Office Clerks, General
5.0%
$24,060
5.8%
5
39-3031
Ushers, Lobby Attendants, and Ticket Takers
2.3%
$19,342
10.6%
6
27-4014 Sound Engineering Technicians
2.2%
$66,121
7.5%
7
27-1014 Multimedia Artists and Animators
2.2%
$68,400
14.2%
8
27-4031 Camera Operators, Television, Video & Motion Picture
2.0%
$69,505
8.3%
9
11-1021 General and Operations Managers
2.0%
$193,777
16.1%
10
27-1024 Graphic Designers
1.9%
$69,806
8.3%

10
Other Information Services (NAICS Industry 519)
Industry Description: Establishments engaged in business in this subsector supply information, store and provide access to information, searching and retrieving information, operate Web sites that use search engines to allow for searching information on the Internet, or publish and/or broadcast content exclusively on the Internet.
Ten Most Common Occupations
Rank SOC Code Occupational Title
% Share of Industry
Workforce
Median Occupational
Wage
Projected Employment Change (%), 2012-2022
1
15-1132
Software Developers, Applications
11.1%
$126,941
30.4%
2
41-3011 Advertising Sales Agents
6.9%
$65,390
13.9%
3
25-4031 Library Technicians
6.0%
$35,644
-23.4%
4
27-3041
Editors
5.8%
$65,569
-4.7%
5
41-3099
Sales Representatives, Services, All Other
5.3%
$83,563
17.0%
6
25-4021 Librarians
5.2%
$64,717
-15.3%
7
43-9061 Office Clerks, General
4.2%
$36,615
5.8%
8
43-4121 Library Assistants, Clerical
3.9%
$19,773
-15.2%
9
15-1134 Web Developers
2.8%
$77,027
34.2%
10
43-4051 Customer Service Representatives
2.6%
$51,163
10.3%

11
Securities and Commodity Contracts, and Other Financial Investments and Related Activities
(NAICS Industry 523)
Industry Description: Firms in this industry are primarily engaged in one of the following activities: (1) underwriting securities issues and/or making markets for securities and commodities; (2) acting as agents (i.e., brokers) between buyers and sellers of securities and commodities; (3) providing securities and commodity exchange services; and (4) providing other services, such as managing portfolios of assets; providing investment advice; and trust, fiduciary, and custody services.
Ten Most Common Occupations
Rank SOC Code Occupational Title
% Share of Industry
Workforce
Median Occupational
Wage
Projected Employment Change (%), 2012-2022
1
41-3031 Securities, Commodities, and Financial Services Sales Agents
22.4%
$179,122
-2.1%
2
13-2051
Financial Analysts
12.1%
$118,113
11.6%
3
13-2052
Personal Financial Advisors
9.9%
$136,395
15.5%
4
11-3031
Financial Managers
4.1%
$197,611
7.8%
5
43-6011 Executive Secretaries and Administrative Assistants
4.0%
$78,237
-3.6%
6
13-2011
Accountants and Auditors
4.0%
$119,512
17.3%
7
43-4011
Brokerage Clerks
4.0%
$59,854
-12.7%
8
15-1132
Software Developers, Applications
2.8%
$133,871
30.4%
9
11-1021 General and Operations Managers
2.8%
$193,974
16.1%
10
43-1011 First-Line Supervisors-Managers of Office and Administrative Support Workers
1.4%
$104,009
12.9%

12
Professional and Technical Services (NAICS Industry 541)
Industry Description: Establishments in this industry group are engaged in processes where “human capital” is the major input. Firms make available the knowledge and skills of their employees, often on an assignment basis, where an individual or team is responsible for the delivery of services to the client. The distinguishing feature of this industry group is firms within it are almost wholly dependent on worker skills. Thus, firms here are selling expertise. Examples include legal, accounting, architectural, advertising, scientific R&D, and other professional services.
Ten Most Common Occupations
Rank SOC Code Occupational Title
% Share of Industry
Workforce
Median Occupational
Wage
Projected Employment Change (%), 2012-2022
1
23-1011
Lawyers
8.8%
$178,844
7.7%
2
13-2011
Accountants and Auditors
6.0%
$84,856
17.3%
3
13-1161 Market Research Analysts and Marketing Specialists
3.3%
$70,811
38.2%
4
15-1132
Software Developers, Applications
3.2%
$104,264
30.4%
5
43-9061 Office Clerks, General
3.1%
$30,268
5.8%
6
13-1111 Management Analysts
3.0%
$100,952
20.1%
7
43-6014 Secretaries, Except Legal, Medical, and Executive
2.9%
$40,188
14.8%
8
41-3011 Advertising Sales Agents
2.9%
$81,735
13.9%
9
23-2011
Paralegals and Legal Assistants
2.8%
$54,194
14.9%
10
27-3031
Public Relations Specialists
2.8%
$61,411
19.5%

13
Administrative and Support Services (NAICS Industry 561)
Industry Description: Establishments in this industry support the day-to-day operations of other organizations. The processes employed in this sector (e.g., general management, personnel administration, clerical activities, cleaning activities) are often used by businesses found throughout the economy. Many of the activities performed in this group were once done by businesses themselves. Recently, however, many businesses have “outsourced” these activities to third-party contractors. Activities in this sector are typically on a contract or fee basis.
Ten Most Common Occupations
Rank SOC Code Occupational Title
% Share of Industry
Workforce
Median Occupational
Wage
Projected Employment Change (%), 2012-2022
1
33-9032
Security Guards
21.8%
$27,368
15.7%
2
37-2011 Janitors and Cleaners, Except Maids and Housekeeping Cleaners
12.9%
$39,541
15.2%
3
43-9061
Office Clerks, General
4.6%
$26,946
5.8%
4
31-1014
Nursing Assistants
3.2%
$29,802
13.5%
5
43-6014 Secretaries, Except Legal, Medical, and Executive
3.2%
$35,938
14.8%
6
43-4051
Customer Service Representatives
2.1%
$34,992
10.3%
7
37-2012
Maids and Housekeeping Cleaners
1.8%
$19,539
16.7%
8
11-1021
General and Operations Managers
1.7%
$154,716
16.1%
9
53-7062 Laborers and Freight, Stock, and Material Movers, Hand
1.7%
$20,111
9.8%
10
41-3041
Travel Agents
1.6%
$31,645
- 11.4%

14
Educational Services (NAICS Industry 611)
Industry Description: Industries in this group provide instruction and training in a wide variety of subjects. The instruction and training is provided by specialized establishments, such as schools, colleges, universities, and training centers.
Ten Most Common Occupations
Rank SOC Code Occupational Title
% Share of Industry
Workforce
Median Occupational
Wage
Projected Employment Change (%), 2012-2022
1
25-9041 Teacher Assistants
8.0%
$33,123
8.0%
2
25-2021 Elementary School Teachers, Except Special Education
7.6%
$77,644
3.1%
3
25-2031 Secondary School Teachers, Except Special and Vocational Education
5.8%
$76,846
NA
4
25-2022 Middle School Teachers, Except Special and Vocational Education
4.2%
$72,289
2.8%
5
43-9061
Office Clerks, General
3.3%
$28,147
5.8%
6
43-6014 Secretaries, Except Legal, Medical, and Executive
3.2%
$50,390
14.8%
7
39-9011
Child Care Workers
3.0%
$29,932
11.2%
8
25-1071 Health Specialties Teachers, Postsecondary
2.8%
$107,958
40.4%
9
25-3098
Substitute Teachers
2.6%
$46,235
NA
10
11-9032 Education Administrators, Elementary and Secondary School
2.5%
$114,745
5.3% NA – Not Available

15
Ambulatory Health Care Services (NAICS Industry 621)
Industry Description: Ambulatory Health Care Services establishments provide health care services directly or indirectly to ambulatory patients and do not usually provide inpatient services. Health practitioners in this group provide outpatient services, with the facilities and equipment not usually being the most significant part of the production process.
Ten Most Common Occupations
Rank SOC Code Occupational Title
% Share of Industry
Workforce
Median Occupational
Wage
Projected Employment Change (%), 2012-2022
1
31-1011
Home Health Aides
29.5%
$20,490
50.9%
2
43-4171
Receptionists and Information Clerks
8.0%
$29,899
16.8%
3
39-9021 Personal Care Aides
7.2%
$22,063
39.7%
4
29-1141
Registered Nurses
5.9%
$89,929
14.1%
5
31-9092
Medical Assistants
4.0%
$32,002
28.8%
6
43-6014 Secretaries, Except Legal, Medical, and Executive
3.4%
$37,610
14.8%
7
31-9091
Dental Assistants
2.8%
$33,293
19.2%
8
29-1069
Physicians and Surgeons, All Other
2.2%
$193,434
13.2%
9
43-1011 First-Line Supervisors-Managers of Office and Administrative Support Workers
2.1%
$62,714
12.9%
10
29-1021 Dentists, General
1.5%
$145,205
15.3%
16
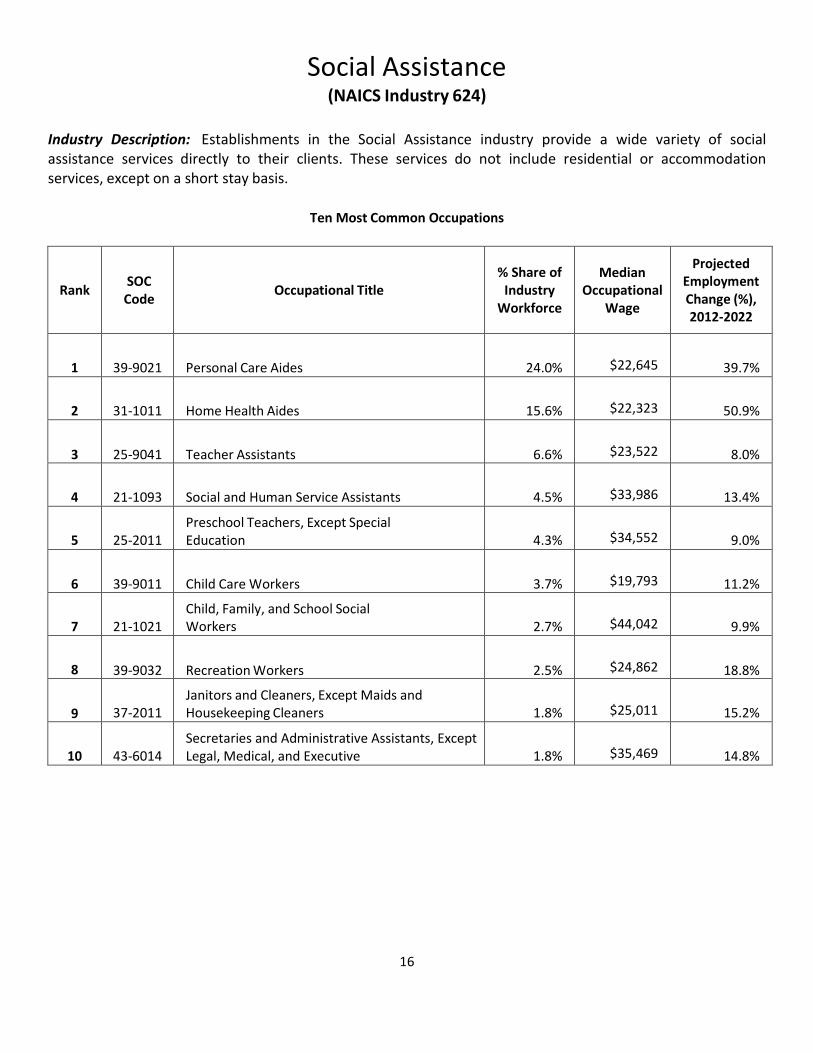
Social Assistance (NAICS Industry 624)
Industry Description: Establishments in the Social Assistance industry provide a wide variety of social assistance services directly to their clients. These services do not include residential or accommodation services, except on a short stay basis.
Ten Most Common Occupations
Rank SOC Code Occupational Title
% Share of Industry
Workforce
Median Occupational
Wage
Projected Employment Change (%), 2012-2022
1
39-9021
Personal Care Aides
24.0%
$22,645
39.7%
2
31-1011
Home Health Aides
15.6%
$22,323
50.9%
3
25-9041
Teacher Assistants
6.6%
$23,522
8.0%
4
21-1093 Social and Human Service Assistants
4.5%
$33,986
13.4%
5
25-2011 Preschool Teachers, Except Special Education
4.3%
$34,552
9.0%
6
39-9011
Child Care Workers
3.7%
$19,793
11.2%
7
21-1021 Child, Family, and School Social Workers
2.7%
$44,042
9.9%
8
39-9032
Recreation Workers
2.5%
$24,862
18.8%
9
37-2011 Janitors and Cleaners, Except Maids and Housekeeping Cleaners
1.8%
$25,011
15.2%
10
43-6014 Secretaries and Administrative Assistants, Except Legal, Medical, and Executive
1.8%
$35,469
14.8%

17
Accommodation (NAICS Industry 721)
Industry Description: Establishments in the Accommodation industry provide lodging or short-term accommodations for travelers, vacationers, and others. There is a wide range of establishments in the industry. Some provide lodging only; while others provide meals, laundry services, and recreational facilities as well as lodging. Lodging establishments may even generate more revenue from the provision of complementary services.
Ten Most Common Occupations
Rank SOC Code Occupational Title
% Share of Industry
Workforce
Median Occupational
Wage
Projected Employment Change (%), 2012-2022
1
37-2012
Maids and Housekeeping Cleaners
29.3%
$53,187
16.7%
2
43-4081
Hotel, Motel, and Resort Desk Clerks
8.1%
$36,122
34.9%
3
35-3031
Waiters and Waitresses
5.6%
$34,034
25.1%
4
49-9071
Maintenance and Repair Workers, General
4.4%
$54,544
11.8%
5
37-2011
Janitors and Cleaners, Except Maids and Housekeeping Cleaners
4.2%
$43,314
15.2%
6
39-6011
Baggage Porters and Bellhops
4.1%
$33,730
20.9%
7
35-2014
Cooks, Restaurant
3.5%
$50,780
37.2%
8
35-9011
Dining Room and Cafeteria Attendants and Bartender Helpers
2.9%
$41,363
27.0%
9
37-1011
First-Line Supervisors of Housekeeping and Janitorial Workers
2.7%
$54,439
17.5%
10
35-3041
Food Servers, Nonrestaurant
2.5%
$44,697
21.0%

18
Food Services and Drinking Places (NAICS Industry 722)
Industry Description: Businesses in the Food Services and Drinking Places industry prepare meals, snacks, and beverages to customer order for immediate on-premises and off-premises consumption. There is a wide range of establishments in this industry. Some provide food and drink only; while others provide various combinations of seating space, waiter/waitress services and incidental amenities, such as limited entertainment. The industry includes full-service restaurants; limited-service eating places; special food services, such as food service contractors, caterers, and mobile food services; and drinking places.
Ten Most Common Occupations
Rank SOC Code Occupational Title
% Share of Industry
Workforce
Median Occupational
Wage
Projected Employment Change (%), 2012-2022
1
35-3031
Waiters and Waitresses
21.0%
$20,444
25.1%
2
35-3021 Combined Food Preparation and Serving Workers, Including Fast Food
18.1%
$18,788
35.4%
3
35-2014
Cooks, Restaurant
10.1%
$24,936
37.2%
4
35-1012
First-Line Supervisors-Managers of Food Preparation and Serving Workers
6.3%
$38,120
32.0%
5
35-9011 Dining Room and Cafeteria Attendants and Bartender Helpers
6.0%
$19,176
27.0%
6
35-3011
Bartenders
5.6%
$20,467
33.0%
7
35-2021
Food Preparation Workers
5.1%
$20,732
10.2%
8
35-9021
Dishwashers
4.3%
$19,482
25.0%
9
35-3022 Counter Attendants, Cafeteria, Food Concession, and Coffee Shop
3.1%
$20,548
13.4%
10
41-2011 Cashiers
3.0%
$20,186
10.6%

19
Religious, Grantmaking, Civic, Professional, and Similar Organizations
(NAICS Industry 813)
Industry Description: Organizations in the Religious, Grantmaking, Civic, Professional, and Similar Organizations industry includes these that organize and promote religious activities; support various causes through grantmaking; advocate various social and political causes; and promote and defend the interests of their members.
Ten Most Common Occupations
Rank SOC Code Occupational Title
% Share of Industry
Workforce
Median Occupational
Wage
Projected Employment Change (%), 2012-2022
1
43-6014 Secretaries, Except Legal, Medical, and Executive
6.4%
$36,663
14.8%
2
13-1075 Labor Relations Specialists
4.6%
$68,020
4.8%
3
37-2011 Janitors and Cleaners, Except Maids and Housekeeping Cleaners
4.5%
$26,884
15.2%
4
11-1021 General and Operations Managers
4.2%
$163,053
16.1%
5
21-2011 Clergy
4.2%
$40,728
21.8%
6
43-9061
Office Clerks, General
3.5%
$21,631
5.8%
7
25-3021
Self-Enrichment Education Teachers
3.0%
$49,624
20.1%
8
13-1199
Business Operations Specialists, All Other
2.8%
$63,636
14.2%
9
49-9071 Maintenance and Repair Workers, General
2.7%
$37,288
11.8%
10
39-9032
Recreation Workers
2.7%
$23,452
18.8%
This workforce product was funded by a grant awarded by the U.S. Department of Labor's Employment and Training Administration. The product was created by the recipient and does not necessarily reflect the official position of the U.S. Department of Labor. The Department of Labor makes no guarantees, warranties, or assurances of any kind, express or implied, with respect to such information, including any information on linked sites and including, but not limited to, accuracy of the information or its completeness, timeliness, usefulness, adequacy, continued availability, or ownership. This product is copyrighted by the institution that created it. Internal use by an organization and/or personal use by an individual for non-commercial purposes is permissible. All other uses require the prior authorization of the copyright owner.