signals(of(opportunity(airborne( demonstrator (soop7ad)(
TRANSCRIPT

Signals of Opportunity Airborne Demonstrator (SoOp-‐AD) Joseph Knuble
Earth Science Technology Forum 2013 ESTO Instrument Incubator Program (IIP)
June 24th, 2015
SoOP-‐AD 1

Outline
SoOP-‐AD 2
• Overview • Project Team • Science Background and MoMvaMons • P-‐Band Signal Details • Instrument Architecture • Measurement SimulaMon • Next Steps
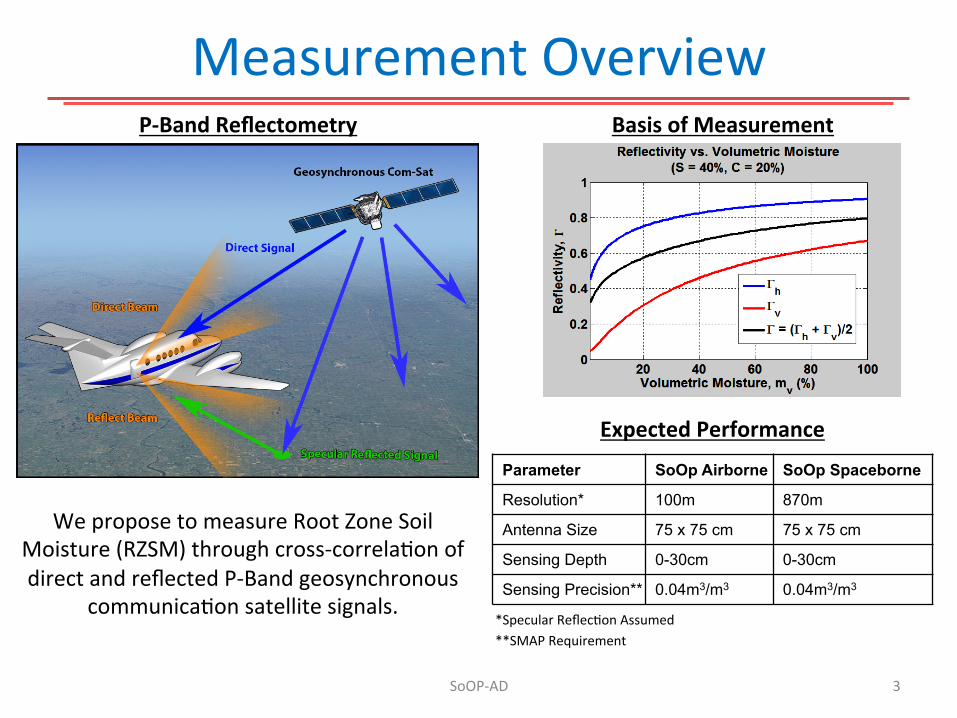
Measurement Overview
We propose to measure Root Zone Soil Moisture (RZSM) through cross-‐correlaMon of direct and reflected P-‐Band geosynchronous
communicaMon satellite signals.
SoOP-‐AD 3
Expected Performance
Parameter SoOp Airborne SoOp Spaceborne
Resolution* 100m 870m
Antenna Size 75 x 75 cm 75 x 75 cm
Sensing Depth 0-30cm 0-30cm
Sensing Precision** 0.04m3/m3 0.04m3/m3
P-‐Band Reflectometry
*Specular ReflecMon Assumed **SMAP Requirement
Basis of Measurement

Project Team
• Purdue University Simula'on, Retrieval Algorithms, Requirements Def.
– PI: Jim Garrison (Assoc. Prof) – Georges SMenne (Post-‐doc) – Yao-‐Cheng “Zenki” Lin (PhD candidate)
• NASA GSFC Systems Engineering, RF Design, Aircra= Integra'on
– Co-‐I: Jeff Piepmeier (555) – Co-‐I: Joe Knuble (555) – Ken Hersey (AS&D) – Cornelus Du Toit (AS&D) – Co-‐I: Alicia Joseph (617)
SoOP-‐AD 4
• Harris (Formerly Exelis, Inc) Digital Receiver Design
– George Alikakos – Co-‐I: Steve O’Brien
• Langley Research Center Aircra= Opera'ons
– Bruce Fisher
• Dr. Stephen Katzberg – Consultant ScaAering Model, Signal Processing

ScienMfic MoMvaMon
SoOP-‐AD 5
• Root Zone Soil Moisture (RZSM): – Water in top ~meter of soil – CriMcal link between surface hydrology and deeper process – Drainage and absorpMon by plant roots – ConnecMon between near-‐term precipitaMon and long-‐term availability of fresh water
• Biomass: a related measurement – Carbon storage in vegetaMon – key part of CO2 balance – Raw material and source of 9-‐13% of World’s energy

Current Sensing LimitaMons
SoOP-‐AD 6
• L-‐Band – L-‐band (SMAP) penetrates only few cm of soil – SaturaMon at L-‐band limits the ability to sense soil moisture through vegetaMon
– RZSM from SMAP Level 4 model
• P-‐Band Radar – Difficult to find allocaMon in heavily uMlized spectrum – ESA-‐BIOMASS cannot operate in North America or Europe due to interference with Space Object Tracking Radar
– RFI – Expensive from space
SoOp-‐AD SoluMon
SoOP-‐AD 7
• We propose to use the principles of reflectometry and reflected SATCOM signals to measure RZSM. – ReuMlizing acMve transmioers with forward scaoering presents strong
signals even at orbital alMtudes. – Specular reflecMon provides good resoluMon with small antennas. – Not limited to protected frequency bands and potenMally more resilient to
RFI. – SoOp-‐AD will first measure RZSM from an aircrap. – P-‐Band and S-‐Band (XM Radio) will be invesMgated.
• SoOp-‐AD will use geostaMonary P-‐Band SATCOM systems – 225-‐420MHz allocaMon for government use, SoOp-‐AD will focus on
240-‐270MHz band: 18 25KHz channels, 20 5KHz channels. – ConMnuous use by US since 1978, follow-‐on systems planning legacy
support – SoOp-‐AD method measures correlaMon of direct and reflected signals -‐
does not require demod / decode of the transmission. Can work with any noise-‐like signal source!

SoOp-‐AD Project Highlights • IIP Timeline
– Awarded in April ’14. – Subsystem I&T at GSFC this summer. – Science flights in Fall of ‘16.
• Instrument – Antennas: Patch, Dual Linear Pol, Null Steering – Receivers: Standard P-‐Band Receivers w/ internal
calibraMon. S-‐Band receiver for XM Radio included. Brassboard and compact card.
– Digital System: FPGA based. 7TB Storage: 1 hour of raw data or many days of processed data.
– Two aircrap racks: 12U Total
• Aircrap Campaign – Flying on NASA Langley B200. – Co-‐Flying with SLAP instrument (GSFC’s AcMve /
Passive L-‐Band). – Science flights over the St. Joseph’s Watershed.
SoOP-‐AD 8

Signal Bands and Coverage
SoOP-‐AD 9
240 245 250 255 260 265 2700
0.5
1
Frequency (MHz)
November Oscar Papa Quebec
5 kHz channels 25 kHz channels
(Satellite Names) Incidence Angle for GeostaMonary Sources used by SoOp-‐AD.

Measured Signal Details & RFI
SoOP-‐AD 10
Waterfall spectrum measured at GSFC over 11 days. Note persistence of SATCOM signals and broad-‐band RFI.
SoOp-‐AD RFI & Source Survey From 12/24/14 11:40EST to 1/3/15 16:40EST
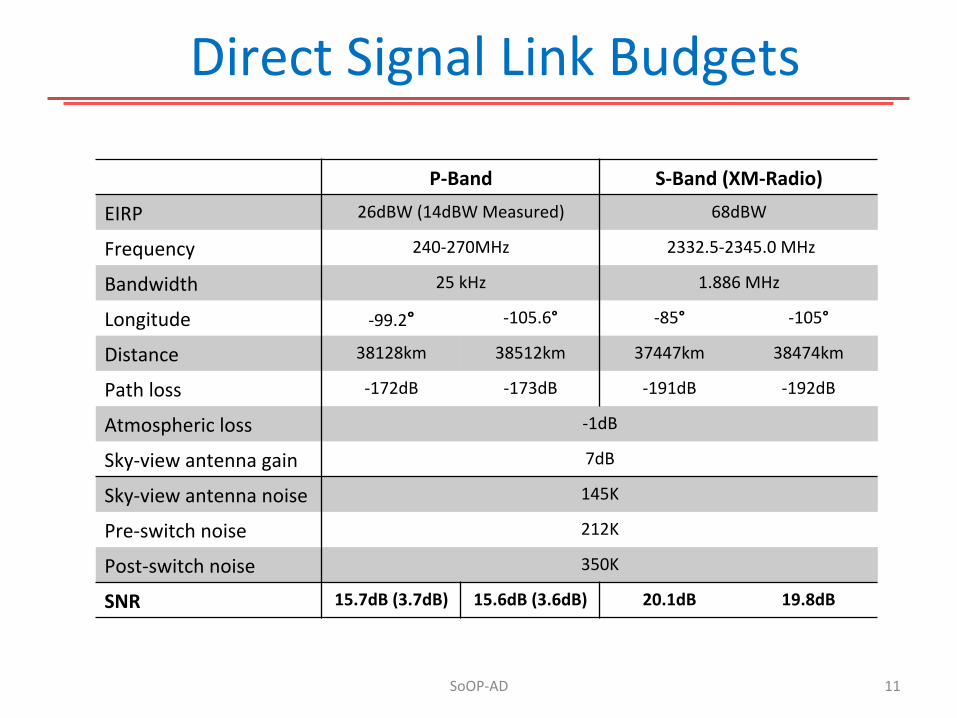
Direct Signal Link Budgets
SoOP-‐AD 11
P-‐Band S-‐Band (XM-‐Radio)
EIRP 26dBW (14dBW Measured) 68dBW
Frequency 240-‐270MHz 2332.5-‐2345.0 MHz
Bandwidth 25 kHz 1.886 MHz
Longitude -‐99.2° -‐105.6° -‐85° -‐105°
Distance 38128km 38512km 37447km 38474km
Path loss -‐172dB -‐173dB -‐191dB -‐192dB
Atmospheric loss -‐1dB
Sky-‐view antenna gain 7dB
Sky-‐view antenna noise 145K
Pre-‐switch noise 212K
Post-‐switch noise 350K
SNR 15.7dB (3.7dB) 15.6dB (3.6dB) 20.1dB 19.8dB

SoOP-‐AD 12
SoOp-‐AD System Architecture
Correlator: < Reflect-‐V*Reflect-‐V >*8 Channels
Correlator: < Direct-‐H*Reflect-‐V >*8 Channels
CH1CH2
CH8CH..
CH1CH2
CH8CH..
TC
Direct-‐H
Direct-‐V
Reflect-‐H
Reflect-‐V
TC
TC
TC TWPTC
tE tS tLZ(0)
Z(tS)
Z(tE)
Z(tL)
CH1CH2
CH8CH..
RF Receiver ChannelizerCorrelator: < Direct-‐H*Reflect-‐H >*8 Channels
tN
Z(tN)
CH1CH2
CH8CH..
Complete 4x4 Matrix Inc. Cross-‐Pol & Auto-‐Corr.
400 Co
mplex Terms
To Correlator
RF SYSTEM DIGITAL RECEIVER
Raw Data Mode

Antenna System ConsideraMons
SoOP-‐AD 13
• Direct-‐to-‐Reflect isolaMon is driving requirement – But not in orbit!
• Using “Smart Antenna” to steer a null as necessary in post-‐processing.
• SimulaMon: Earth View Beam – Co-‐pol (blue): LHCP – X-‐pol (red): RHCP
• Results simulate a post-‐processed paoern with a null steered to +40°
horizon
nadir
zenith

Measurement SimulaMon
SoOP-‐AD 14
• Purpose: – Science requirement flow-‐down to technology requirements – Error budget – First generaMon retrieval algorithms
• Two Methods: SyntheMc (IF) Signal Generator (forward model) and Extended Kalman Filter (inverse esMmator)
• Evaluate Error Sources against 0.04m3/m3 Precision Req. – SNR – RFI – Direct signal leakage into reflect antenna (easier in orbit!) – MulMple Satellite Interference – Antenna Paoern Knowledge – Aircrap PosiMon & Aytude Knowledge – Number of correlaMon delays – Terrain Height FluctuaMon – Uncertainty in Receiver Gain and Offset
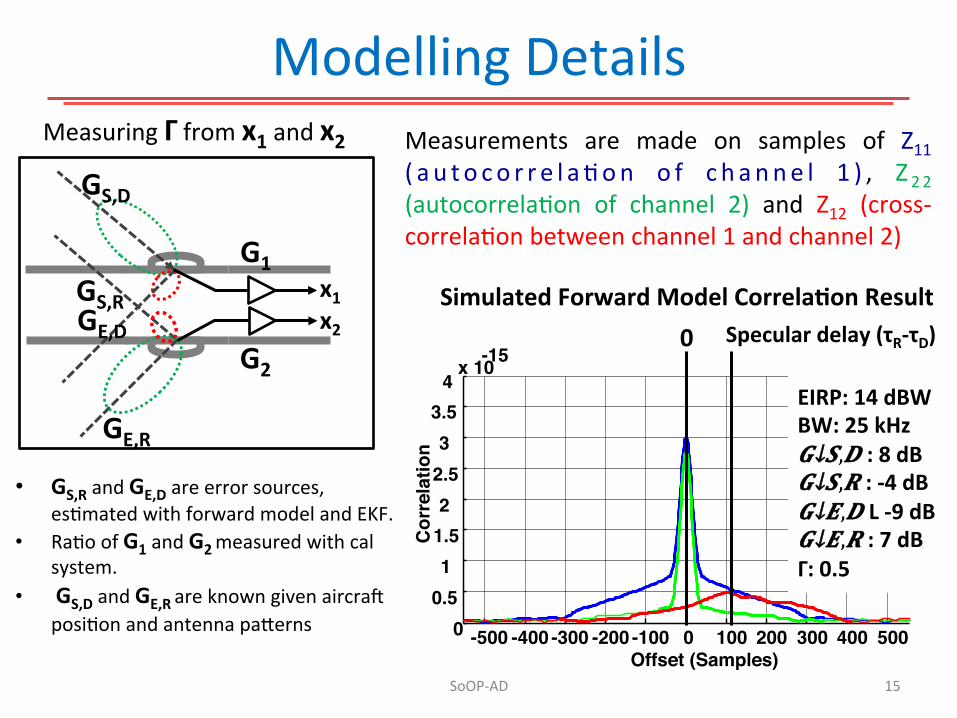
Modelling Details
SoOP-‐AD 15
-500 -400 -300 -200 -100 0 100 200 300 400 500 0
0.5
1 1.5 2
2.5
3
3.5 4
x 10 -15
Offset (Samples)
Cor
rela
tion
0
EIRP: 14 dBW BW: 25 kHz 𝑮↓𝑺,𝑫 : 8 dB 𝑮↓𝑺,𝑹 : -‐4 dB 𝑮↓𝑬,𝑫 L -‐9 dB 𝑮↓𝑬,𝑹 : 7 dB Γ: 0.5
Measurements are made on samples of Z11 ( a u t o co r r e l aMon o f c h anne l 1 ) , Z 22 (autocorrelaMon of channel 2) and Z12 (cross-‐correlaMon between channel 1 and channel 2)
GS,D
GS,R
GE,R
GE,D
x1 x2
G1
G2
Specular delay (τR-‐τD)
Measuring Γ from x1 and x2
• GS,R and GE,D are error sources,
esMmated with forward model and EKF. • RaMo of G1 and G2 measured with cal
system. • GS,D and GE,R are known given aircrap
posiMon and antenna paoerns
Simulated Forward Model Correlacon Result

Current Modelling Results
SoOP-‐AD 16
We believe we will meet requirements with margin.
Next Steps
• ConMnue Model Refinement • Perform I&T at GSFC this Summer • Field campaign using a tower • Aircrap Campaign in Fall of 2016
SoOP-‐AD 17