series v, no. 40 department of economic statistics...
TRANSCRIPT

Series V, No. 40
Department of Economic
and Social Affairs
Statistics Division
World Statistics Pocketbook 2016 edition
United Nations, New York, 2016

The Department of Economic and Soc ia l Af fa i rs of the United Nations Secretariat is a vital interface between global policies in the economic, social and environmental spheres and national action. The Department works in three main interlinked areas: ( i ) it compiles, generates and analyses a wide range of economic, social and environmental data and information on which States Members of the United Nations draw to review common problems and to take stock of policy options; ( i i ) it facilitates the negotiations of Member States in many intergovernmental bodies on joint courses of action to address ongoing or emerging global challenges; and (ii i ) it advises interested Governments on the ways and means of translating policy frameworks developed in United Nations conferences and summits into programmes at the country level and, through technical assistance, helps build national capacities.
Note The designations employed and the presentation of material in this publication do not imply the expression of any opinion whatsoever on the part of the Secretariat of the United Nations concerning the legal status of any country, territory, city or area or of its authorities, or concerning the delimitation of its frontiers or boundaries. The term “country” as used in this publication also refers, as appropriate, to territories or areas.
Visit the United Nations World Wide Web site on the Internet: For the Department of Economic and Social Affairs, http://www.un.org/esa/desa/ For statistics and statistical publications, http://unstats.un.org/unsd/ For UN publications, https://unp.un.org/
ST/ESA/STAT/SER.V/40 United Nations Publication Sales No. E.16.XVII.13 ISBN-13: 978-92-1-161612-5 eISBN: 978-92-1-058230-8 All queries on rights and licenses, including subsidiary rights, should be addressed to United Nations Publications, 300 East 42n d Street, New York, NY 10017, USA, e-mail: [email protected], web: http://un.org/publications World Statistics Pocketbook, 2016 edition © 2016 United Nations New York, NY 10017, United States of America
All rights reserved
Printed in the United States of America

Contents
World Statistics Pocketbook iii
Introduction ........................................................................................................................................... vii Symbols, abbreviations and conversion factors ..................................................................................... ix Country profile information and indicator list ........................................................................................ xi Country profiles ....................................................................................................................................... 1
Technical notes ................................................................................................................................... 235 Statistical sources and references ...................................................................................................... 247 Related statistical products ................................................................................................................. 251 Country profiles Afghanistan ........................................................................... 3
Albania .................................................................................. 4
Algeria.......................................... ......................................... 5
American Samoa .................................................................. 6
Andorra .................................................................................. 7
Angola ................................................................................... 8
Anguilla ................................................................................. 9
Antigua and Barbuda ......................................................... 10
Argentina ............................................................................ 11
Armenia .............................................................................. 12
Aruba .................................................................................. 13
Australia ............................................................................. 14
Austria ................................................................................ 15
Azerbaijan .......................................................................... 16
Bahamas ............................................................................. 17
Bahrain ............................................................................... 18
Bangladesh ........................................................................ 19
Barbados ............................................................................ 20
Belarus ................................................................................ 21
Belgium .............................................................................. 22
Belize .................................................................................. 23
Benin ................................................................................... 24
Bermuda ............................................................................. 25
Bhutan ................................................................................ 26
Bolivia (Plurinational State of) .......................................... 27
Bosnia and Herzegovina............ ........................................ 28
Botswana ........................................................................... 29
Brazil ................................................................................... 30
British Virgin Islands .......................................................... 31
Brunei Darussalam ............................................................ 32
Bulgaria .............................................................................. 33
Burkina Faso ....................................................................... 34
Burundi ............................................................................... 35
Cabo Verde ......................................................................... 36
Cambodia ........................................................................... 37
Cameroon ........................................................................... 38
Canada................................................................................ 39
Cayman Islands .................................................................. 40
Central African Republic ................................................... 41
Chad .................................................................................... 42
Channel Islands .................................................................. 43
Chile .................................................................................... 44
China ................................................................................... 45
China, Hong Kong SAR ...................................................... 46
China, Macao SAR ............................................................. 47
Colombia ............................................................................. 48
Comoros .............................................................................. 49
Congo .................................................................................. 50
Cook Islands ....................................................................... 51
Costa Rica ........................................................................... 52
Côte d'Ivoire ....................................................................... 53
Croatia ................................................................................ 54
Cuba .................................................................................... 55
Curaçao ............................................................................... 56
Cyprus ................................................................................. 57
Czech Republic ................................................................... 58
Democratic People's Republic of Korea ........................... 59
Democratic Republic of the Congo ................................... 60
Denmark ............................................................................. 61
Djibouti ............................................................................... 62
Dominica ............................................................................. 63
Dominican Republic ........................................................... 64
Ecuador ............................................................................... 65
Egypt ................................................................................... 66
El Salvador .......................................................................... 67
Equatorial Guinea .............................................................. 68
Eritrea ................................................................................. 69
Estonia ................................................................................ 70
Ethiopia ............................................................................... 71
Faeroe Islands .................................................................... 72
Falkland Islands (Malvinas) .............................................. 73
Fiji ........................................................................................ 74
Finland ................................................................................ 75
France ................................................................................. 76
French Guiana .................................................................... 77
French Polynesia ................................................................ 78
Gabon.................................................................................. 79
Gambia ............................................................................... 80

Contents (continued)
iv World Statistics Pocketbook
Georgia ............................................................................... 81
Germany ............................................................................. 82
Ghana ................................................................................. 83
Gibraltar .............................................................................. 84
Greece ................................................................................ 85
Greenland ........................................................................... 86
Grenada .............................................................................. 87
Guadeloupe ........................................................................ 88
Guam .................................................................................. 89
Guatemala .......................................................................... 90
Guinea ................................................................................ 91
Guinea-Bissau .................................................................... 92
Guyana................................................................................ 93
Haiti .................................................................................... 94
Honduras ............................................................................ 95
Hungary .............................................................................. 96
Iceland ................................................................................ 97
India .................................................................................... 98
Indonesia ............................................................................ 99
Iran (Islamic Republic of) ................................................. 100
Iraq .................................................................................... 101
Ireland ............................................................................... 102
Isle of Man ....................................................................... 103
Israel ................................................................................. 104
Italy ................................................................................... 105
Jamaica ............................................................................ 106
Japan ................................................................................ 107
Jordan ............................................................................... 108
Kazakhstan ....................................................................... 109
Kenya ................................................................................ 110
Kiribati .............................................................................. 111
Kuwait .............................................................................. 112
Kyrgyzstan ........................................................................ 113
Lao People's Democratic Republic ................................. 114
Latvia ................................................................................ 115
Lebanon ............................................................................ 116
Lesotho ............................................................................. 117
Liberia ............................................................................... 118
Libya ................................................................................. 119
Liechtenstein .................................................................... 120
Lithuania ........................................................................... 121
Luxembourg ...................................................................... 122
Madagascar ..................................................................... 123
Malawi ............................................................................. 124
Malaysia ........................................................................... 125
Maldives ........................................................................... 126
Mali .................................................................................. 127
Malta ................................................................................ 128
Marshall Islands .............................................................. 129
Martinique ........................................................................ 130
Mauritania ........................................................................ 131
Mauritius .......................................................................... 132
Mexico .............................................................................. 133
Micronesia (Federated States of) ................................... 134
Monaco ............................................................................. 135
Mongolia .......................................................................... 136
Montenegro ...................................................................... 137
Montserrat........................................................................ 138
Morocco ............................................................................ 139
Mozambique ..................................................................... 140
Myanmar .......................................................................... 141
Namibia ............................................................................ 142
Nauru ................................................................................ 143
Nepal ................................................................................ 144
Netherlands ...................................................................... 145
New Caledonia ................................................................ 146
New Zealand .................................................................... 147
Nicaragua ......................................................................... 148
Niger ................................................................................. 149
Nigeria .............................................................................. 150
Niue .................................................................................. 151
Northern Mariana Islands ............................................... 152
Norway ............................................................................. 153
Oman................................................................................. 154
Pakistan ............................................................................ 155
Palau ................................................................................. 156
Panama ............................................................................. 157
Papua New Guinea .......................................................... 158
Paraguay ........................................................................... 159
Peru ................................................................................... 160
Philippines ........................................................................ 161
Poland ............................................................................... 162
Portugal............................................................................. 163
Puerto Rico ....................................................................... 164
Qatar ................................................................................. 165
Republic of Korea ............................................................. 166
Republic of Moldova ........................................................ 167
Réunion ............................................................................. 168
Romania ............................................................................ 169
Russian Federation .......................................................... 170
Rwanda ............................................................................. 171
Saint Helena ..................................................................... 172
Saint Kitts and Nevis ....................................................... 173
Saint Lucia ........................................................................ 174
Saint Pierre and Miquelon .............................................. 175
Saint Vincent and the Grenadines .................................. 176

Contents (continued)
World Statistics Pocketbook v
Samoa............................................................................... 177
San Marino ...................................................................... 178
Sao Tome and Principe .................................................... 179
Saudi Arabia .................................................................... 180
Senegal ............................................................................ 181
Serbia ............................................................................... 182
Seychelles ........................................................................ 183
Sierra Leone ..................................................................... 184
Singapore ......................................................................... 185
Sint Maarten (Dutch part) .............................................. 186
Slovakia ............................................................................ 187
Slovenia ............................................................................ 188
Solomon Islands .............................................................. 189
Somalia ............................................................................ 190
South Africa ..................................................................... 191
South Sudan ..................................................................... 192
Spain ................................................................................. 193
Sri Lanka ........................................................................... 194
State of Palestine ............................................................ 195
Sudan ................................................................................ 196
Suriname.................................. ........................................ 197
Swaziland ......................................................................... 198
Sweden ............................................................................ 199
Switzerland ...................................................................... 200
Syrian Arab Republic ....................................................... 201
Tajikistan .......................................................................... 202
Thailand ............................................................................ 203
The former Yugoslav Rep. of Macedonia ...................... 204
Timor-Leste ...................................................................... 205
Togo .................................................................................. 206
Tokelau ............................................................................. 207
Tonga ................................................................................ 208
Trinidad and Tobago ........................................................ 209
Tunisia .............................................................................. 210
Turkey ............................................................................... 211
Turkmenistan .................................................................... 212
Turks and Caicos Islands ................................................. 213
Tuvalu ............................................................................... 214
Uganda ............................................................................. 215
Ukraine.............................................................................. 216
United Arab Emirates ...................................................... 217
United Kingdom ............................................................... 218
United Republic of Tanzania ........................................... 219
United States of America ................................................ 220
United States Virgin Islands ............................................ 221
Uruguay ............................................................................ 222
Uzbekistan ........................................................................ 223
Vanuatu ............................................................................ 224
Venezuela (Bolivarian Republic of) ................................. 225
Viet Nam ........................................................................... 226
Wallis and Futuna Islands ............................................... 227
Western Sahara ............................................................... 228
Yemen ............................................................................... 229
Zambia .............................................................................. 230
Zimbabwe ......................................................................... 231


Introduction
World Statistics Pocketbook vii
The World Statistics Pocketbook is an annual compilation of key economic, social
and environmental indicators, presented in one-page profiles. This edition includes
country profiles for 229 countries or areas of the world. Prepared by the United
Nations Statistics Division of the Department of Economic and Social Affairs, it
responds to General Assembly resolution 2626 (XXV), in which the Secretary-General
is requested to supply basic national data that will increase international public awareness of countries' development efforts.
The indicators shown are selected from the wealth of international statistical
information compiled regularly by the Statistics Division and the Population Division
of the United Nations, the statistical services of the United Nations specialized
agencies and other international organizations and institutions. Special recognition is gratefully given for their assistance in continually providing data.
Time period
This issue of the World Statistics Pocketbook covers various years from 2005 to
2016. For the economic indicators, in general, three years - 2005, 2010 and 2014 -
are shown, unless otherwise indicated. Due to space limitations, data for one year
only are shown for the indicators in the social and in the environment and infrastructure categories. For 5 social indicators, a year range (2010-2015) is shown.
Organization of the Pocketbook
The country tables or profiles are presented alphabetically according to countries’ names in English and contain the available data for the following broad categories:
General information: includes each country’s location by geographical
region, currency, surface area, population and population density, capital city and its population and United Nations membership date.
Economic indicators: includes data on each country’s national accounts (Gross
domestic product (GDP), GDP growth rate, Gross Value Added (GVA) by
industry etc.), employment by industry sector, unemployment, labour force
participation, consumer price index, production indices (industry, agriculture and food) and balance of payments.
Trade: contains the value of total exports, imports and the trade balance as well as the countries’ main trading partners.
Social indicators: includes population (growth rates, including for the urban
population), total fertility rate, life expectancy, total dependency ratio,
international migrant stock, tourist arrivals, refugees, infant mortality,
health (expenditure and physicians), education (expenditure and gross
enrolment ratios), intentional homicide rate and seats held by women in national parliaments.
Environmental and infrastructure indicators: includes mobile-cellular
telephone subscriptions, internet users, patents, threatened species,
forested area, CO2 emission estimates, energy production and energy supply
per capita, proportion of terrestrial and marine areas protected, population

Introduction (continued)
viii World Statistics Pocketbook
using improved drinking water sources and improved sanitation facilities and Official Development assistance received or disbursed.
The complete set of indicators, listed by category and in the order in which they
appear in the profiles, is shown before the country profile section (see page xi). Not
all indicators are shown for each country or area due to different degrees of data availability.
The technical notes section, which follows the country profile pages, contains
brief descriptions of the concepts and methodologies used in the compilation of the
indicators as well as information on the statistical sources for the indicators.
Readers interested in longer time-series data or more detailed descriptions of the
concepts or methodologies should consult the primary sources of the data and the references listed in the section following the technical notes.
For brevity the Pocketbook omits specific information on the source or
methodology for individual data points, and when a data point is estimated no
distinction is made between whether the estimation was done by the international or
national organization. See the technical notes section for the primary source which may provide this information.
Note
The present World Statistics Pocketbook, 2016 edition (Series V, No. 40) is an
update of the previous edition, released in 2015, entitled World Statistics Pocketbook 2015 edition (Series V, No. 39).
* * *
The World Statistics Pocketbook is prepared annually by the Statistical Services
Branch of the Statistics Division, Department of Economic and Social Affairs of the
United Nations Secretariat. The programme manager is Matthias Reister, the editor
is Ian Rutherford, David Carter, Anuradha Chimata, and Aida Diawara provided
production assistance and Salomon Cameo provided IT support. Comments on this publication are welcome and may be sent by e-mail to [email protected].

Symbols, abbreviations and conversion factors
World Statistics Pocketbook ix
The following symbols and abbreviations have been used in the World Statistics Pocketbook:
. Decimal figures are always preceded by a period (.)
... Data not available – Magnitude zero < Magnitude not zero, but less than half of the unit employed
–< Magnitude not zero, but negative and less than half of the unit employed% Percentage 000 Thousands
65+ Aged sixty-five years and overCFA Coopération financière en Afrique centraleCFP Change Franc PacifiqueCIF Cost, Insurance and FreightCO2 Carbon dioxide
const. Constant CPI Consumer price indexest. Estimate
f Females FOB Free on board GDP Gross domestic productGNI Gross national income
GVA Gross value added ISIC International Standard Industrial ClassificationISO International Organization for Standardizationkm Kilometres m Males
mt Metric tons Nes Not elsewhere specifiedpop. Population proj. Projection SAR Special Administrative Region
sq km Square kilometre UN United Nations
UNHCR Office of the UN High Commissioner for RefugeesUNSD United Nations Statistics Division
US$/USD United States dollars
The metric system of weights and measures has been employed in the World
Statistics Pocketbook. The equivalents of the basic British Imperial and United States
weights and measures are as follows:
Area 1 square kilometre = 0.386102 square mile Weight or mass 1 ton = 1.102311 short tons or = 0.987207 long ton 1 kilogram = 35.273962 avoirdupois ounces = 2.204623 avoirdupois poundsDistance 1 kilometre = 0.621371 mile 1 millimetre = 0.039 inchTemperature °C = (°F - 32) × 5/9


Country profile information and indicator list*
World Statistics Pocketbook xi
General information Region Population (proj., 000) Capital city Currency
Surface area (sq km) Pop. density (per sq km) Capital city pop. (000) UN membership date
Economic indicators GDP: Gross domestic product (million current US$) GDP growth rate (annual %, const. 2005 prices) GDP per capita (current US$) Economy: Agriculture (% of GVA) Economy: Industry (% of GVA) Economy: Services and other activity (% of GVA) Employment: Agriculture (% of employed) Employment: Industry (% of employed) Employment: Services and other activity (% of employed) Unemployment (% of labour force) Labour force participation (female/male pop., %) CPI: Consumer price index (2000=100) Agricultural production index (2004-2006=100) Food production index (2004-2006=100) Index of industrial production (2005=100) Balance of payments, current account (million US$)
Trade Total trade (exports, imports and balance, million US$) Major trading partners (exports and imports, %)
Social indicators Population growth rate (average annual %) Urban population (%) Urban population growth rate (average annual %) Fertility rate, total (live births per woman) Life expectancy at birth (females/males, years) Total dependency ratio (Pop. aged 0 – 14 and 65+ per 100 pop. 15-64) International migrant stock (000/% of total pop.) Tourist arrivals at national borders (000) Refugees and others of concern to UNHCR Infant mortality rate (per 1 000 live births) Health: Total expenditure (% of GDP) Health: Physicians (per 1 000 pop.) Education: Government expenditure (% of GDP) Education: Primary gross enrolment ratio (f/m per 100 pop.) Education: Secondary gross enrolment ratio (f/m per 100 pop.) Education: Tertiary gross enrolment ratio (f/m per 100 pop.) Intentional homicide rate (per 100 000 pop.) Seats held by women in national parliaments (%)
Environmental and infrastructure indicators Mobile-cellular subscriptions (per 100 inhabitants) Individuals using the Internet (%) Patents: Resident filings (per million pop.) Threatened species Forested area (% of land area) CO2 emission estimates (000 tons/tons per capita) Energy production, primary (Petajoules) Energy supply per capita (Gigajoules) Terrestrial and marine areas protected (% of total area) Population using improved drinking water sources (urban/rural, %) Population using improved sanitation facilities (urban/rural, %) Net Official Development Assistance disbursed (% of GNI) Net Official Development Assistance received (% of GNI)
* The complete set of information and indicators listed here may not be shown for each country or area depending upon data availability.


Country profiles


AfghanistanRegion Southern Asia Surface area (sq km) 652 864Population (proj., 000) 33 370 Pop. density (per sq km) 51.1Capital city Kabul Capital city pop. (000) 4 635Currency Afghani (AFN) UN membership date 19 November 1946Economic indicators 2005 2010 2014GDP: Gross domestic product (million current US$) 6 622 16 078 21 122GDP growth rate (annual %, const. 2005 prices) 9.9 3.2 2.2GDP per capita (current US$) 271.4 575.0 667.8Economy: Agriculture (% of GVA) 36.6 29.6 25.7Economy: Industry (% of GVA) 26.9 21.9 22.1Economy: Services and other activity (% of GVA) 36.5 48.5 52.2Unemployment (% of labour force) a 10.3 10.1 9.1Labour force participation (female/male pop. %) a 16.4/84.3 16.5/84.0 18.9/83.7Agricultural production index (2004-2006=100) 106 116 120b
Food production index (2004-2006=100) 106 116 120b
Balance of payments, current account (million US$) ... –3 711 –6 855Total trade Major trading partners 2015
(million US$)c (% of exports)c (% of imports)c
Exports 570.5 Pakistan 33.0 Areas nes 44.3d
Imports 7 697.2 India 28.0 Iran 19.5Balance –7 126.7 Areas nes 27.3d Pakistan 17.3Social indicatorsPopulation growth rate (average annual %) 2010-2015 3.0Urban population (%) 2015 26.7Urban population growth rate (average annual %) 2010-2015 4.0Fertility rate, total (live births per woman) 2010-2015 5.1Life expectancy at birth (females/males, years) 2010-2015 61.1/58.7Total dependency ratio (Pop. aged 0-14 & 65+ per 100 pop. 15-64) 2015 87International migrant stock (000/% of total pop.) mid-2015 382.4/1.2Refugees and others of concern to UNHCR mid-2015 1 421 419Infant mortality rate (per 1 000 live births) 2010-2015 71Health: Total expenditure (% of GDP) 2014 8.2efg
Health: Physicians (per 1 000 pop.) 2013 0.3Education: Government expenditure (% of GDP) 2014 4.8a
Education: Primary gross enrolment ratio (f/m per 100 pop.) 2014 91.8/130.7Education: Secondary gross enrolment ratio (f/m per 100 pop.) 2014 39.7/70.8Education: Tertiary gross enrolment ratio (f/m per 100 pop.) 2014 3.7/13.3Intentional homicide rate (per 100 000 pop.) 2014 6.6h
Seats held by women in national parliaments (%) 2016 27.7Environment and infrastructureMobile-cellular subscriptions (per 100 inhabitants) 2014 74.9i
Individuals using the Internet (%) 2014 6.4a
Threatened species 2015 38Forested area (% of land area) 2013 2.1a
CO2 emission estimates (000 tons/tons per capita) 2013 21 269/0.7Energy production, primary (Petajoules) 2013 59Energy supply per capita (Gigajoules) 2013 10.0a
Terrestrial and marine areas protected (% of total area) 2014 0.5Population using improved drinking water sources (urban/rural, %) 2015 78.2/47.0Population using improved sanitation facilities (urban/rural, %) 2015 45.1/27.0Net Official Development Assistance received (% of GNI) 2014 23.0a Estimate. b 2013. c 2014. d See technical notes. e Data revision. f Non-profit institutions (such as NGOs)serving households are accounted for in “external assistance” and recorded under government expen-diture. GDP includes both licit and illicit GDPs (for example, opium). g Government expenditures includeexternal assistance (external budget). h 2012. i Data as at the end of December.
World Statistics Pocketbook 3

AlbaniaRegion Southern Europe Surface area (sq km) 28 748Population (proj., 000) 2 904 Pop. density (per sq km) 106.0Capital city Tirana Capital city pop. (000) 454Currency Lek (ALL) UN membership date 14 December 1955Economic indicators 2005 2010 2014GDP: Gross domestic product (million current US$) 8 094 11 927 13 413GDP growth rate (annual %, const. 2005 prices) 5.8 3.7 2.1GDP per capita (current US$) 2 626.1 4 110.1 4 641.7Economy: Agriculture (% of GVA) 20.1 20.7 22.7Economy: Industry (% of GVA) 33.5 28.9 26.5Economy: Services and other activity (% of GVA) 46.4 50.4 50.8Employment: Agriculture (% of employed) a 58.5 44.1bcd ...Employment: Industry (% of employed) a 13.5 19.9bcd ...Employment: Services and other (% of employed) a 27.8 36.0bcd ...Unemployment (% of labour force) e 13.0 14.2 17.5Labour force participation (female/male pop. %) e 47.6/68.5 44.1/63.6 40.4/60.6CPI: Consumer price index (2000=100) 117 135 147Agricultural production index (2004-2006=100) 98 119 127f
Food production index (2004-2006=100) 98 119 128f
Index of industrial production (2005=100) 100 200 355Balance of payments, current account (million US$) –571 –1 353 –1 703Total trade Major trading partners 2015
(million US$) (% of exports) (% of imports)Exports 1 929.7 Italy 50.9 Italy 30.3Imports 4 320.2 Serbia 9.9 China 8.6Balance –2 390.5 Spain 5.2 Turkey 8.0Social indicatorsPopulation growth rate (average annual %) 2010-2015 –<Urban population (%) 2015 57.4Urban population growth rate (average annual %) 2010-2015 2.2Fertility rate, total (live births per woman) 2010-2015 1.8Life expectancy at birth (females/males, years) 2010-2015 80.2/75.0Total dependency ratio (Pop. aged 0-14 & 65+ per 100 pop. 15-64) 2015 45International migrant stock (000/% of total pop.) mid-2015 57.6/2.0Tourist arrivals at national borders (000) 2014 3 341g
Refugees and others of concern to UNHCR mid-2015 8 098Infant mortality rate (per 1 000 live births) 2010-2015 14Health: Total expenditure (% of GDP) 2014 5.9Health: Physicians (per 1 000 pop.) 2013 1.1Education: Government expenditure (% of GDP) 2014 3.5f
Education: Primary gross enrolment ratio (f/m per 100 pop.) 2014 111.2/113.7Education: Secondary gross enrolment ratio (f/m per 100 pop.) 2014 92.6/100.0Education: Tertiary gross enrolment ratio (f/m per 100 pop.) 2014 73.8/52.4Intentional homicide rate (per 100 000 pop.) 2014 4.0Seats held by women in national parliaments (%) 2016 20.7Environment and infrastructureMobile-cellular subscriptions (per 100 inhabitants) 2014 105.5Individuals using the Internet (%) 2014 60.1e
Patents: Resident filings (per million pop.) 2014 4.0Threatened species 2015 112Forested area (% of land area) 2013 28.2e
CO2 emission estimates (000 tons/tons per capita) 2013 4 815/1.7Energy production, primary (Petajoules) 2013 85Energy supply per capita (Gigajoules) 2013 35.0Terrestrial and marine areas protected (% of total area) 2014 1.9Population using improved drinking water sources (urban/rural, %) 2015 95.0/95.2Population using improved sanitation facilities (urban/rural, %) 2015 95.5/90.2Net Official Development Assistance received (% of GNI) 2014 2.1a Data classified according to ISIC Rev. 3. b Break in the time series. c Excluding the institutional popu-lation. d 2009. e Estimate. f 2013. g Excluding nationals residing abroad.
4 World Statistics Pocketbook

AlgeriaRegion Northern Africa Surface area (sq km) 2 381 741Population (proj., 000) 40 376 Pop. density (per sq km) 17.0Capital city Algiers Capital city pop. (000) 2 594 a
Currency Algerian Dinar (DZD) UN membership date 8 October 1962Economic indicators 2005 2010 2014GDP: Gross domestic product (million current US$) 103 198 161 207 213 518GDP growth rate (annual %, const. 2005 prices) 5.9 3.6 3.8GDP per capita (current US$) 3 102.0 4 473.5 5 484.1Economy: Agriculture (% of GVA) 8.0 8.6 10.7Economy: Industry (% of GVA) 59.7 51.4 44.0Economy: Services and other activity (% of GVA) 32.3 40.0 45.4Employment: Agriculture (% of employed) 20.7bc ... 10.8de
Employment: Industry (% of employed) 26.0bc ... 30.9de
Employment: Services and other (% of employed) 53.1bc ... 58.4de
Unemployment (% of labour force) f 15.3 10.0 10.6Labour force participation (female/male pop. %) f 12.8/71.8 14.4/70.0 16.7/70.3CPI: Consumer price index (2000=100) 117 146 183Agricultural production index (2004-2006=100) 99 125 158g
Food production index (2004-2006=100) 99 125 159g
Index of industrial production (2005=100) b 100 97 104Balance of payments, current account (million US$) 21 180 12 220 –9 682Total trade Major trading partners 2015
(million US$)h (% of exports)h (% of imports)h
Exports 63 227.8 Spain 15.2 China 14.1Imports 58 618.1 Italy 13.2 France 10.8Balance 4 609.7 France 11.0 Italy 8.6Social indicatorsPopulation growth rate (average annual %) 2010-2015 1.9Urban population (%) 2015 70.7Urban population growth rate (average annual %) 2010-2015 2.8Fertility rate, total (live births per woman) 2010-2015 2.9Life expectancy at birth (females/males, years) 2010-2015 76.8/72.1Total dependency ratio (Pop. aged 0-14 & 65+ per 100 pop. 15-64) 2015 53International migrant stock (000/% of total pop.) mid-2015 242.4/0.6ij
Tourist arrivals at national borders (000) k 2014 2 301l
Refugees and others of concern to UNHCR mid-2015 100 036m
Infant mortality rate (per 1 000 live births) 2010-2015 30Health: Total expenditure (% of GDP) 2014 7.2Education: Primary gross enrolment ratio (f/m per 100 pop.) 2014 115.1/122.3Education: Secondary gross enrolment ratio (f/m per 100 pop.) 2014 101.7/98.1e
Education: Tertiary gross enrolment ratio (f/m per 100 pop.) 2014 41.9/27.5Intentional homicide rate (per 100 000 pop.) 2014 1.5Seats held by women in national parliaments (%) 2016 31.6Environment and infrastructureMobile-cellular subscriptions (per 100 inhabitants) 2014 93.3Individuals using the Internet (%) 2014 18.1f
Patents: Resident filings (per million pop.) 2014 2.0Threatened species 2015 114Forested area (% of land area) 2013 0.8f
CO2 emission estimates (000 tons/tons per capita) 2013 134 216/3.5Energy production, primary (Petajoules) 2013 5 676Energy supply per capita (Gigajoules) 2013 51.0Terrestrial and marine areas protected (% of total area) 2014 7.5Population using improved drinking water sources (urban/rural, %) 2015 84.3/81.8Population using improved sanitation facilities (urban/rural, %) 2015 89.8/82.2Net Official Development Assistance received (% of GNI) 2014 0.1a Refers to the Governorate of Grand Algiers. b Data classified according to ISIC Rev. 3. c 2004. d Breakin the time series. e 2011. f Estimate. g 2013. h 2014. i Including refugees. j Refers to foreign citizens.k Arrivals of non-resident visitors at national borders. l Including nationals residing abroad. m Accordingto the Government of Algeria, there are an estimated 165,000 Sahrawi refugees in the Tindouf camps.
World Statistics Pocketbook 5

American SamoaRegion Oceania-Polynesia Surface area (sq km) 199Population (proj., 000) 56 Pop. density (per sq km) 278.0Capital city Pago Pago Capital city pop. (000) 48 a
Currency US Dollar (USD)Economic indicators 2005 2010 2014Employment: Agriculture (% of employed) bc ... 3.0 ...Employment: Industry (% of employed) bc ... 23.2 ...Employment: Services and other (% of employed) bc ... 73.8 ...Unemployment (% of labour force) c ... 9.2 ...CPI: Consumer price index (2000=100) 122d 156d ...Agricultural production index (2004-2006=100) 107 106 106e
Food production index (2004-2006=100) 107 106 106e
Social indicatorsPopulation growth rate (average annual %) 2010-2015 –<Urban population (%) 2015 87.2Urban population growth rate (average annual %) 2010-2015 –0.1Fertility rate, total (live births per woman) 2010-2015 3.1f
Life expectancy at birth (females/males, years) 2010-2015 76.2/68.5g
Total dependency ratio (Pop. aged 0-14 & 65+ per 100 pop. 15-64) 2015 64fh
International migrant stock (000/% of total pop.) mid-2015 23.2/41.8Tourist arrivals at national borders (000) 2014 22Infant mortality rate (per 1 000 live births) 2010-2015 15f
Environment and infrastructureThreatened species 2015 90Forested area (% of land area) 2013 88.1i
Terrestrial and marine areas protected (% of total area) 2014 8.6Population using improved drinking water sources (urban/rural, %) 2015 100.0/100.0Population using improved sanitation facilities (urban/rural, %) 2015 62.5/62.5a 2014. b Data classified according to ISIC Rev. 3. c Persons aged 16 years and over. d Excluding `Rent´.e 2013. f 2010. g 2006. h Including armed forces stationed in the area. i Estimate.
6 World Statistics Pocketbook

AndorraRegion Southern Europe Surface area (sq km) 468Population (proj., 000) 69 Pop. density (per sq km) 147.2Capital city Andorra la Vella Capital city pop. (000) 23 a
Currency Euro (EUR) UN membership date 28 July 1993Economic indicators 2005 2010 2014GDP: Gross domestic product (million current US$) 3 248 3 346 3 278GDP growth rate (annual %, const. 2005 prices) 7.5 –7.4 1.4GDP per capita (current US$) 39 990.3 39 639.3 45 033.0Economy: Agriculture (% of GVA) b 0.4 0.5 0.6Economy: Industry (% of GVA) c 17.7 15.0 12.6Economy: Services and other activity (% of GVA) de 81.9 84.5 86.8CPI: Consumer price index (2000=100) f 113 126 132Total trade Major trading partners 2015
(million US$)a (% of exports)a (% of imports)a
Exports 94.8 Spain 59.0 Spain 61.7Imports 1 556.0 France 17.8 France 15.5Balance –1 461.2 Norway 5.5 China 4.1Social indicatorsPopulation growth rate (average annual %) 2010-2015 –3.6Urban population (%) 2015 85.1Urban population growth rate (average annual %) 2010-2015 0.1Fertility rate, total (live births per woman) 2010-2015 1.2g
Total dependency ratio (Pop. aged 0-14 & 65+ per 100 pop. 15-64) 2015 39g
International migrant stock (000/% of total pop.) mid-2015 42.1/59.7h
Tourist arrivals at national borders (000) 2014 2 363Health: Total expenditure (% of GDP) 2014 8.1Education: Government expenditure (% of GDP) 2014 3.1Intentional homicide rate (per 100 000 pop.) 2014 0.0Seats held by women in national parliaments (%) 2016 39.3Environment and infrastructureMobile-cellular subscriptions (per 100 inhabitants) 2014 82.6Individuals using the Internet (%) 2014 95.9i
Threatened species 2015 11Forested area (% of land area) 2013 34.0i
CO2 emission estimates (000 tons/tons per capita) 2013 491/6.5Energy production, primary (Petajoules) 2013 1Energy supply per capita (Gigajoules) 2013 121.0i
Terrestrial and marine areas protected (% of total area) 2014 19.5Population using improved drinking water sources (urban/rural, %) 2015 100.0/100.0Population using improved sanitation facilities (urban/rural, %) 2015 100.0/100.0a 2014. b Excludes irrigation canals and landscaping care. c Excludes publishing activities, includesirrigation canals. d Excludes repair of personal and household goods. e Includes publishing activities andlandscaping care. f Index base: 2001=100. g 2012. h Refers to foreign citizens. i Estimate.
World Statistics Pocketbook 7

AngolaRegion Middle Africa Surface area (sq km) 1 246 700Population (proj., 000) 25 831 Pop. density (per sq km) 20.7Capital city Luanda Capital city pop. (000) 5 506Currency Kwanza (AOA) UN membership date 1 December 1976Economic indicators 2005 2010 2014GDP: Gross domestic product (million current US$) 36 971 83 369 146 676GDP growth rate (annual %, const. 2005 prices) 15.0 3.6 4.8GDP per capita (current US$) 2 063.9 3 928.8 6 054.1Economy: Agriculture (% of GVA) 5.0 6.0 5.0Economy: Industry (% of GVA) 59.8 57.2 56.1Economy: Services and other activity (% of GVA) 35.2 36.9 39.0Unemployment (% of labour force) a 7.4 7.7 7.6Labour force participation (female/male pop. %) a 61.4/76.9 59.3/77.4 59.9/77.2CPI: Consumer price index (2000=100) b 1 846 3 438c 4 680d
Agricultural production index (2004-2006=100) 102 172 212d
Food production index (2004-2006=100) 102 173 213d
Balance of payments, current account (million US$) 5 138 7 506 –3 722Social indicatorsPopulation growth rate (average annual %) 2010-2015 3.3Urban population (%) 2015 44.1Urban population growth rate (average annual %) 2010-2015 5.0Fertility rate, total (live births per woman) 2010-2015 6.2Life expectancy at birth (females/males, years) 2010-2015 53.2/50.2Total dependency ratio (Pop. aged 0-14 & 65+ per 100 pop. 15-64) 2015 100International migrant stock (000/% of total pop.) mid-2015 106.8/0.4e
Tourist arrivals at national borders (000) 2014 595Refugees and others of concern to UNHCR mid-2015 48 545Infant mortality rate (per 1 000 live births) 2010-2015 96Health: Total expenditure (% of GDP) 2014 3.3Education: Primary gross enrolment ratio (f/m per 100 pop.) 2014 100.4/156.9f
Education: Secondary gross enrolment ratio (f/m per 100 pop.) 2014 22.7/35.1f
Education: Tertiary gross enrolment ratio (f/m per 100 pop.) 2014 8.8/11.0d
Intentional homicide rate (per 100 000 pop.) 2014 9.8g
Seats held by women in national parliaments (%) 2016 36.8Environment and infrastructureMobile-cellular subscriptions (per 100 inhabitants) 2014 63.5Individuals using the Internet (%) 2014 21.3a
Threatened species 2015 130Forested area (% of land area) 2013 46.6a
CO2 emission estimates (000 tons/tons per capita) 2013 32 464/1.4Energy production, primary (Petajoules) 2013 4 067Energy supply per capita (Gigajoules) 2013 27.0Terrestrial and marine areas protected (% of total area) 2014 5.0Population using improved drinking water sources (urban/rural, %) 2015 75.4/28.2Population using improved sanitation facilities (urban/rural, %) 2015 88.6/22.5Net Official Development Assistance received (% of GNI) 2014 0.2a Estimate. b Luanda. c Series linked to former series. d 2013. e Including refugees. f 2011. g 2012.
8 World Statistics Pocketbook

AnguillaRegion Caribbean Surface area (sq km) 91Population (proj., 000) 15 Pop. density (per sq km) 164.0Capital city The Valley Capital city pop. (000) 1 a
Currency East Caribbean Dollar (XCD)Economic indicators 2005 2010 2014GDP: Gross domestic product (million current US$) 229 268 311GDP growth rate (annual %, const. 2005 prices) 13.1 –4.5 6.2GDP per capita (current US$) 18 130.5 19 469.4 21 493.3Economy: Agriculture (% of GVA) 2.7 2.0 2.2Economy: Industry (% of GVA) 19.3 15.8 16.5Economy: Services and other activity (% of GVA) 78.0 82.2 81.3Employment: Agriculture (% of employed) b 2.9c ... ...Employment: Industry (% of employed) b 18.9c ... ...Employment: Services and other (% of employed) b 76.7c ... ...Unemployment (% of labour force) 7.8d ... ...Labour force participation (female/male pop. %) 67.2/77.2d ... ...CPI: Consumer price index (2000=100) e 114 138 148Balance of payments, current account (million US$) –52 –51 –48f
Social indicatorsPopulation growth rate (average annual %) 2010-2015 1.2Urban population (%) 2015 100.0Urban population growth rate (average annual %) 2010-2015 1.2Life expectancy at birth (females/males, years) 2010-2015 81.1/76.5g
International migrant stock (000/% of total pop.) mid-2015 5.5/37.4Tourist arrivals at national borders (000) 2014 71h
Environment and infrastructureMobile-cellular subscriptions (per 100 inhabitants) 2014 179.8i
Individuals using the Internet (%) 2014 70.4i
Threatened species 2015 51Forested area (% of land area) 2013 61.1i
CO2 emission estimates (000 tons/tons per capita) 2013 136/9.5Energy production, primary (Petajoules) 2013 0i
Energy supply per capita (Gigajoules) 2013 136.0i
Population using improved drinking water sources (urban/rural, %) 2015 94.6/...Population using improved sanitation facilities (urban/rural, %) 2015 97.9/...a 2014. b Data classified according to ISIC Rev. 3. c 2001. d 2002. e Index base: 2001=100. f 2013. g 2000- 2002. h Excluding nationals residing abroad. i Estimate.
World Statistics Pocketbook 9

Antigua and BarbudaRegion Caribbean Surface area (sq km) 442Population (proj., 000) 93 Pop. density (per sq km) 210.8Capital city Saint John's Capital city pop. (000) 22 a
Currency East Caribbean Dollar (XCD) UN membership date 11 November 1981Economic indicators 2005 2010 2014GDP: Gross domestic product (million current US$) 997 1 136 1 248GDP growth rate (annual %, const. 2005 prices) 6.1 –7.2 4.3GDP per capita (current US$) 12 079.9 13 017.3 13 731.1Economy: Agriculture (% of GVA) 2.0 1.9 2.2Economy: Industry (% of GVA) 16.8 18.5 18.1Economy: Services and other activity (% of GVA) 81.2 79.7 79.8Employment: Agriculture (% of employed) b 2.8 2.8c ...Employment: Industry (% of employed) b 15.6 15.6c ...Employment: Services and other (% of employed) b 81.6 81.6c ...Unemployment (% of labour force) 8.4d ... ...Labour force participation (female/male pop. %) 65.9/78.4d ... ...CPI: Consumer price index (2000=100) 110 123 133e
Agricultural production index (2004-2006=100) 95 89 89e
Food production index (2004-2006=100) 95 89 89e
Balance of payments, current account (million US$) –171 –167 –204e
Total trade Major trading partners 2015(million US$) (% of exports) (% of imports)
Exports 26.0 United States 30.0 United States 41.9Imports 465.1 United Kingdom 26.2 Areas nes 16.9f
Balance –439.1 Areas nes 7.7f China 4.4Social indicatorsPopulation growth rate (average annual %) 2010-2015 1.0Urban population (%) 2015 23.8Urban population growth rate (average annual %) 2010-2015 –1.0Fertility rate, total (live births per woman) 2010-2015 2.1Life expectancy at birth (females/males, years) 2010-2015 78.2/73.3Total dependency ratio (Pop. aged 0-14 & 65+ per 100 pop. 15-64) 2015 46International migrant stock (000/% of total pop.) mid-2015 28.1/30.6Tourist arrivals at national borders (000) 2014 249gh
Refugees and others of concern to UNHCR mid-2015 10Infant mortality rate (per 1 000 live births) 2010-2015 9Health: Total expenditure (% of GDP) 2014 5.5i
Education: Primary gross enrolment ratio (f/m per 100 pop.) 2014 93.3/100.9Education: Secondary gross enrolment ratio (f/m per 100 pop.) 2014 102.8/101.8Education: Tertiary gross enrolment ratio (f/m per 100 pop.) 2014 31.2/15.1j
Intentional homicide rate (per 100 000 pop.) 2014 11.2j
Seats held by women in national parliaments (%) 2016 11.1Environment and infrastructureMobile-cellular subscriptions (per 100 inhabitants) 2014 120.0k
Individuals using the Internet (%) 2014 64.0k
Threatened species 2015 53Forested area (% of land area) 2013 22.3k
CO2 emission estimates (000 tons/tons per capita) 2013 524/5.8Energy supply per capita (Gigajoules) 2013 84.0k
Terrestrial and marine areas protected (% of total area) 2014 0.2Population using improved drinking water sources (urban/rural, %) 2015 97.9/97.9Net Official Development Assistance received (% of GNI) 2014 0.2a 2014. b Data classified according to ISIC Rev. 3. c 2008. d 2001. e 2013. f See technical notes. g Arrivalsby air. h Excluding nationals residing abroad. i Data revision. j 2012. k Estimate.
10 World Statistics Pocketbook

ArgentinaRegion South America Surface area (sq km) 2 780 400Population (proj., 000) 43 847 Pop. density (per sq km) 16.0Capital city Buenos Aires Capital city pop. (000) 15 180 a
Currency Argentine Peso (ARS) UN membership date 24 October 1945Economic indicators 2005 2010 2014GDP: Gross domestic product (million current US$) 222 911 464 757 543 490GDP growth rate (annual %, const. 2005 prices) 9.2 9.5 0.5GDP per capita (current US$) 5 694.4 11 274.3 12 645.2Economy: Agriculture (% of GVA) 8.4 8.2 8.2Economy: Industry (% of GVA) 34.7 30.9 28.8Economy: Services and other activity (% of GVA) 56.9 60.9 63.0Employment: Agriculture (% of employed) 1.1bcd 3.0cefg 0.5h
Employment: Industry (% of employed) 23.5bcd 24.1cefg 24.0h
Employment: Services and other (% of employed) 75.1bcd 72.5cefg 74.7h
Unemployment (% of labour force) i 10.6 7.4 7.3Labour force participation (female/male pop. %) i 48.8/76.6 47.0/74.9 48.3/74.4CPI: Consumer price index (2000=100) jk 162 249 332l
Agricultural production index (2004-2006=100) 103 115 120l
Food production index (2004-2006=100) 103 115 120l
Balance of payments, current account (million US$) 5 274 1 360 –5 877Total trade Major trading partners 2015
(million US$) (% of exports) (% of imports)Exports 56 752.4 Brazil 17.8 Brazil 21.8Imports 59 786.8 China 9.1 China 19.7Balance –3 034.4 United States 6.0 United States 12.9Social indicatorsPopulation growth rate (average annual %) 2010-2015 1.0Urban population (%) 2015 91.8Urban population growth rate (average annual %) 2010-2015 1.0Fertility rate, total (live births per woman) 2010-2015 2.4Life expectancy at birth (females/males, years) 2010-2015 79.8/72.2Total dependency ratio (Pop. aged 0-14 & 65+ per 100 pop. 15-64) 2015 57International migrant stock (000/% of total pop.) mid-2015 2 086.3/4.8Tourist arrivals at national borders (000) 2014 5 931Refugees and others of concern to UNHCR mid-2015 4 420Infant mortality rate (per 1 000 live births) 2010-2015 14Health: Total expenditure (% of GDP) 2014 4.8m
Health: Physicians (per 1 000 pop.) 2013 3.9Education: Government expenditure (% of GDP) 2014 5.3l
Education: Primary gross enrolment ratio (f/m per 100 pop.) 2014 110.0/111.1l
Education: Secondary gross enrolment ratio (f/m per 100 pop.) 2014 110.3/102.5l
Education: Tertiary gross enrolment ratio (f/m per 100 pop.) 2014 99.0/61.5l
Intentional homicide rate (per 100 000 pop.) 2014 7.6Seats held by women in national parliaments (%) 2016 35.8Environment and infrastructureMobile-cellular subscriptions (per 100 inhabitants) 2014 158.7i
Individuals using the Internet (%) 2014 64.7i
Patents: Resident filings (per million pop.) 2014 12.0Threatened species 2015 243Forested area (% of land area) 2013 10.1i
CO2 emission estimates (000 tons/tons per capita) 2013 189 819/4.5Energy production, primary (Petajoules) 2013 2 981Energy supply per capita (Gigajoules) 2013 79.0Terrestrial and marine areas protected (% of total area) 2014 5.4Population using improved drinking water sources (urban/rural, %) 2015 99.0/100.0Population using improved sanitation facilities (urban/rural, %) 2015 96.2/98.3Net Official Development Assistance received (% of GNI) 2014 <a Refers to Gran Buenos Aires. b Data classified according to ISIC Rev. 3. c Persons aged 10 years andover. d 28 urban agglomerations. e Break in the time series. f Excluding the institutional population. gUrban areas. h Main cities or metropolitan areas. i Estimate. j Buenos Aires. k Metropolitan areas. l 2013.m Data revision.
World Statistics Pocketbook 11
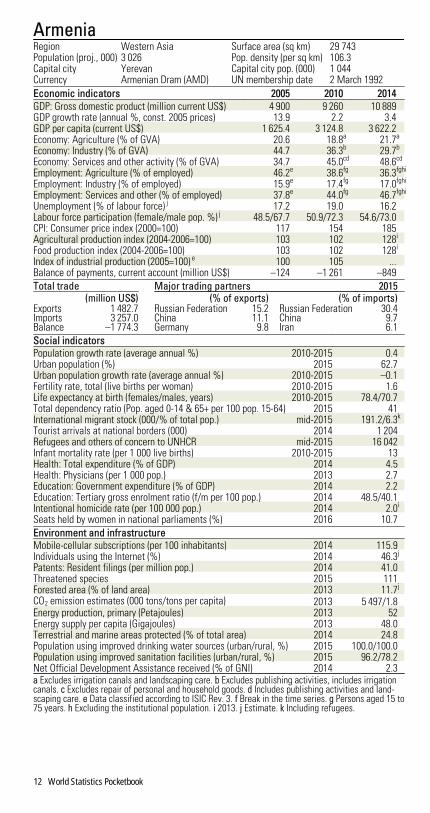
ArmeniaRegion Western Asia Surface area (sq km) 29 743Population (proj., 000) 3 026 Pop. density (per sq km) 106.3Capital city Yerevan Capital city pop. (000) 1 044Currency Armenian Dram (AMD) UN membership date 2 March 1992Economic indicators 2005 2010 2014GDP: Gross domestic product (million current US$) 4 900 9 260 10 889GDP growth rate (annual %, const. 2005 prices) 13.9 2.2 3.4GDP per capita (current US$) 1 625.4 3 124.8 3 622.2Economy: Agriculture (% of GVA) 20.6 18.8a 21.7a
Economy: Industry (% of GVA) 44.7 36.3b 29.7b
Economy: Services and other activity (% of GVA) 34.7 45.0cd 48.6cd
Employment: Agriculture (% of employed) 46.2e 38.6fg 36.3fghi
Employment: Industry (% of employed) 15.9e 17.4fg 17.0fghi
Employment: Services and other (% of employed) 37.8e 44.0fg 46.7fghi
Unemployment (% of labour force) j 17.2 19.0 16.2Labour force participation (female/male pop. %) j 48.5/67.7 50.9/72.3 54.6/73.0CPI: Consumer price index (2000=100) 117 154 185Agricultural production index (2004-2006=100) 103 102 128i
Food production index (2004-2006=100) 103 102 128i
Index of industrial production (2005=100) e 100 105 ...Balance of payments, current account (million US$) –124 –1 261 –849Total trade Major trading partners 2015
(million US$) (% of exports) (% of imports)Exports 1 482.7 Russian Federation 15.2 Russian Federation 30.4Imports 3 257.0 China 11.1 China 9.7Balance –1 774.3 Germany 9.8 Iran 6.1Social indicatorsPopulation growth rate (average annual %) 2010-2015 0.4Urban population (%) 2015 62.7Urban population growth rate (average annual %) 2010-2015 –0.1Fertility rate, total (live births per woman) 2010-2015 1.6Life expectancy at birth (females/males, years) 2010-2015 78.4/70.7Total dependency ratio (Pop. aged 0-14 & 65+ per 100 pop. 15-64) 2015 41International migrant stock (000/% of total pop.) mid-2015 191.2/6.3k
Tourist arrivals at national borders (000) 2014 1 204Refugees and others of concern to UNHCR mid-2015 16 042Infant mortality rate (per 1 000 live births) 2010-2015 13Health: Total expenditure (% of GDP) 2014 4.5Health: Physicians (per 1 000 pop.) 2013 2.7Education: Government expenditure (% of GDP) 2014 2.2Education: Tertiary gross enrolment ratio (f/m per 100 pop.) 2014 48.5/40.1Intentional homicide rate (per 100 000 pop.) 2014 2.0i
Seats held by women in national parliaments (%) 2016 10.7Environment and infrastructureMobile-cellular subscriptions (per 100 inhabitants) 2014 115.9Individuals using the Internet (%) 2014 46.3j
Patents: Resident filings (per million pop.) 2014 41.0Threatened species 2015 111Forested area (% of land area) 2013 11.7j
CO2 emission estimates (000 tons/tons per capita) 2013 5 497/1.8Energy production, primary (Petajoules) 2013 52Energy supply per capita (Gigajoules) 2013 48.0Terrestrial and marine areas protected (% of total area) 2014 24.8Population using improved drinking water sources (urban/rural, %) 2015 100.0/100.0Population using improved sanitation facilities (urban/rural, %) 2015 96.2/78.2Net Official Development Assistance received (% of GNI) 2014 2.3a Excludes irrigation canals and landscaping care. b Excludes publishing activities, includes irrigationcanals. c Excludes repair of personal and household goods. d Includes publishing activities and land-scaping care. e Data classified according to ISIC Rev. 3. f Break in the time series. g Persons aged 15 to75 years. h Excluding the institutional population. i 2013. j Estimate. k Including refugees.
12 World Statistics Pocketbook

ArubaRegion Caribbean Surface area (sq km) 180Population (proj., 000) 104 Pop. density (per sq km) 579.2Capital city Oranjestad Capital city pop. (000) 29 a
Currency Aruban Florin (AWG)Economic indicators 2005 2010 2014GDP: Gross domestic product (million current US$) 2 331 2 391 2 664GDP growth rate (annual %, const. 2005 prices) 1.2 –3.4 1.2GDP per capita (current US$) 23 302.8 23 529.3 25 750.8Economy: Agriculture (% of GVA) b 0.4 0.5 0.5Economy: Industry (% of GVA) c 19.6 15.4 15.4Economy: Services and other activity (% of GVA) 80.0 84.2 84.2Employment: Agriculture (% of employed) d ... 0.6e 0.6fg
Employment: Industry (% of employed) d ... 14.5e 14.0fg
Employment: Services and other (% of employed) d ... 84.4e 85.1fg
Unemployment (% of labour force) 6.9h 10.6eg ...Labour force participation (female/male pop. %) ... 59.5/68.9egij 58.8/69.6fg
CPI: Consumer price index (2000=100) 117 139 143Balance of payments, current account (million US$) 105 –460 –142Total trade Major trading partners 2015
(million US$)a (% of exports)a (% of imports)a
Exports 116.2 Colombia 31.0 United States 55.9Imports 1 284.1 Curaçao 21.6 Netherlands 11.2Balance –1 167.9 United States 15.7 Areas nes 7.9k
Social indicatorsPopulation growth rate (average annual %) 2010-2015 0.5Urban population (%) 2015 41.5Urban population growth rate (average annual %) 2010-2015 –0.3Fertility rate, total (live births per woman) 2010-2015 1.7Life expectancy at birth (females/males, years) 2010-2015 77.8/72.9Total dependency ratio (Pop. aged 0-14 & 65+ per 100 pop. 15-64) 2015 44International migrant stock (000/% of total pop.) mid-2015 36.1/34.8Tourist arrivals at national borders (000) 2014 1 072Refugees and others of concern to UNHCR mid-2015 2Infant mortality rate (per 1 000 live births) 2010-2015 15Education: Government expenditure (% of GDP) 2014 6.0f
Education: Primary gross enrolment ratio (f/m per 100 pop.) 2014 115.4/119.1Education: Secondary gross enrolment ratio (f/m per 100 pop.) 2014 112.1/110.3l
Education: Tertiary gross enrolment ratio (f/m per 100 pop.) 2014 23.8/10.4Environment and infrastructureMobile-cellular subscriptions (per 100 inhabitants) 2014 135.1m
Individuals using the Internet (%) 2014 83.8m
Threatened species 2015 29Forested area (% of land area) 2013 2.3m
CO2 emission estimates (000 tons/tons per capita) 2013 876/8.5Energy production, primary (Petajoules) 2013 1m
Energy supply per capita (Gigajoules) 2013 120.0m
Terrestrial and marine areas protected (% of total area) 2014 0.5Population using improved drinking water sources (urban/rural, %) 2015 98.1/98.1Population using improved sanitation facilities (urban/rural, %) 2015 97.7/97.7a 2014. b Includes mining and quarrying. c Excludes mining and quarrying. d Data classified according toISIC Rev. 3. e Persons aged 14 years and over. f 2011. g Break in the time series. h 2001. i Excluding theinstitutional population. j Resident population (de jure). k See technical notes. l 2012. m Estimate.
World Statistics Pocketbook 13

AustraliaRegion Oceania Surface area (sq km) 7 692 060 a
Population (proj., 000) 24 309 a Pop. density (per sq km) 3.2 a
Capital city Canberra Capital city pop. (000) 423Currency Australian Dollar (AUD) UN membership date 1 November 1945Economic indicators 2005 2010 2014GDP: Gross domestic product (million current US$) 762 114 1 291 430 1 471 439GDP growth rate (annual %, const. 2005 prices) 3.0 2.3 2.7GDP per capita (current US$) 37 590.2 58 270.0 62 290.1Economy: Agriculture (% of GVA) b 3.0 2.5 2.5Economy: Industry (% of GVA) c 27.9 28.5 27.4Economy: Services and other activity (% of GVA) de 69.2 69.1 70.1Employment: Agriculture (% of employed) 3.6 3.2 2.6f
Employment: Industry (% of employed) 21.5 21.4 20.8f
Employment: Services and other (% of employed) 68.1 68.4 69.5f
Unemployment (% of labour force) g 5.0 5.2 6.1Labour force participation (female/male pop. %) g 57.0/72.2 58.7/72.5 58.7/71.0CPI: Consumer price index (2000=100) 116 134 148Agricultural production index (2004-2006=100) 108 100 116f
Food production index (2004-2006=100) 108 102 115f
Index of industrial production (2005=100) h 100 111 123Balance of payments, current account (million US$) –43 342 –44 714 –44 138Total trade Major trading partners 2015
(million US$) (% of exports) (% of imports)Exports 187 792.2 China 32.5 China 23.1Imports 200 113.8 Japan 15.9 United States 11.3Balance –12 321.6 Republic of Korea 7.1 Japan 7.4Social indicatorsPopulation growth rate (average annual %) 2010-2015 1.6a
Urban population (%) 2015 89.4a
Urban population growth rate (average annual %) 2010-2015 1.5a
Fertility rate, total (live births per woman) 2010-2015 1.9a
Life expectancy at birth (females/males, years) 2010-2015 84.3/79.9a
Total dependency ratio (Pop. aged 0-14 & 65+ per 100 pop. 15-64) 2015 51a
International migrant stock (000/% of total pop.) mid-2015 6 763.7/28.2a
Tourist arrivals at national borders (000) i 2014 6 868j
Refugees and others of concern to UNHCR mid-2015 58 419k
Infant mortality rate (per 1 000 live births) 2010-2015 4a
Health: Total expenditure (% of GDP) 2014 9.4Health: Physicians (per 1 000 pop.) 2013 3.3l
Education: Government expenditure (% of GDP) 2014 5.3f
Education: Primary gross enrolment ratio (f/m per 100 pop.) 2014 106.2/106.9f
Education: Secondary gross enrolment ratio (f/m per 100 pop.) 2014 133.7/141.2f
Education: Tertiary gross enrolment ratio (f/m per 100 pop.) 2014 101.7/72.5f
Intentional homicide rate (per 100 000 pop.) 2014 1.0Seats held by women in national parliaments (%) 2016 26.7Environment and infrastructureMobile-cellular subscriptions (per 100 inhabitants) 2014 131.2Individuals using the Internet (%) 2014 84.6g
Patents: Resident filings (per million pop.) 2014 85.0Threatened species 2015 909m
Forested area (% of land area) 2013 16.2g
CO2 emission estimates (000 tons/tons per capita) 2013 377 906/16.2Energy production, primary (Petajoules) 2013 14 368m
Energy supply per capita (Gigajoules) 2013 231.0m
Terrestrial and marine areas protected (% of total area) 2014 29.0Population using improved drinking water sources (urban/rural, %) 2015 100.0/100.0Population using improved sanitation facilities (urban/rural, %) 2015 100.0/100.0Net Official Development Assistance disbursed (% of GNI) n 2014 0.3a Including Christmas Island, Cocos (Keeling) Islands and Norfolk Island. b Excludes irrigation canals andlandscaping care. c Excludes publishing activities, includes irrigation canals. d Excludes repair of personaland household goods. e Includes publishing activities and landscaping care. f 2013. g Estimate. h Twelvemonths ending 30 June of the year stated. i Arrivals of non-resident visitors at national borders. j Excludingnationals residing abroad and crew members. k Asylum-seekers are based on the number of applicationslodged for protection visas. Refugee figure refers to the end of 2014. l 2011. m Excluding overseasterritories. n Development Assistance Committee member (OECD).
14 World Statistics Pocketbook
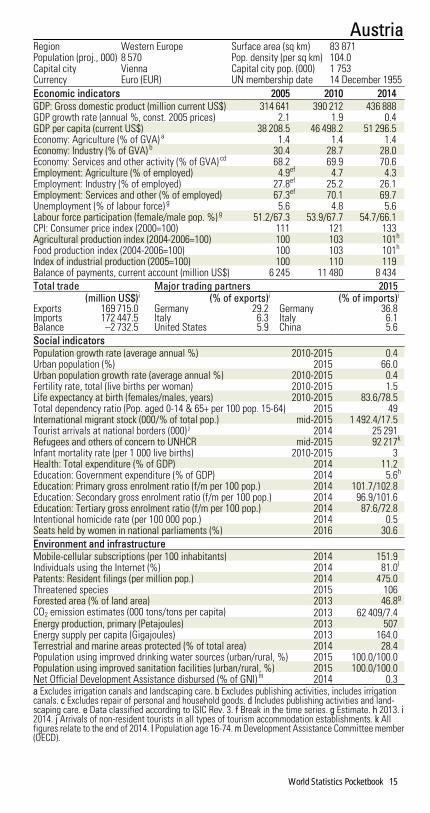
AustriaRegion Western Europe Surface area (sq km) 83 871Population (proj., 000) 8 570 Pop. density (per sq km) 104.0Capital city Vienna Capital city pop. (000) 1 753Currency Euro (EUR) UN membership date 14 December 1955Economic indicators 2005 2010 2014GDP: Gross domestic product (million current US$) 314 641 390 212 436 888GDP growth rate (annual %, const. 2005 prices) 2.1 1.9 0.4GDP per capita (current US$) 38 208.5 46 498.2 51 296.5Economy: Agriculture (% of GVA) a 1.4 1.4 1.4Economy: Industry (% of GVA) b 30.4 28.7 28.0Economy: Services and other activity (% of GVA) cd 68.2 69.9 70.6Employment: Agriculture (% of employed) 4.9ef 4.7 4.3Employment: Industry (% of employed) 27.8ef 25.2 26.1Employment: Services and other (% of employed) 67.3ef 70.1 69.7Unemployment (% of labour force) g 5.6 4.8 5.6Labour force participation (female/male pop. %) g 51.2/67.3 53.9/67.7 54.7/66.1CPI: Consumer price index (2000=100) 111 121 133Agricultural production index (2004-2006=100) 100 103 101h
Food production index (2004-2006=100) 100 103 101h
Index of industrial production (2005=100) 100 110 119Balance of payments, current account (million US$) 6 245 11 480 8 434Total trade Major trading partners 2015
(million US$)i (% of exports)i (% of imports)i
Exports 169 715.0 Germany 29.2 Germany 36.8Imports 172 447.5 Italy 6.3 Italy 6.1Balance –2 732.5 United States 5.9 China 5.6Social indicatorsPopulation growth rate (average annual %) 2010-2015 0.4Urban population (%) 2015 66.0Urban population growth rate (average annual %) 2010-2015 0.4Fertility rate, total (live births per woman) 2010-2015 1.5Life expectancy at birth (females/males, years) 2010-2015 83.6/78.5Total dependency ratio (Pop. aged 0-14 & 65+ per 100 pop. 15-64) 2015 49International migrant stock (000/% of total pop.) mid-2015 1 492.4/17.5Tourist arrivals at national borders (000) j 2014 25 291Refugees and others of concern to UNHCR mid-2015 92 217k
Infant mortality rate (per 1 000 live births) 2010-2015 3Health: Total expenditure (% of GDP) 2014 11.2Education: Government expenditure (% of GDP) 2014 5.6h
Education: Primary gross enrolment ratio (f/m per 100 pop.) 2014 101.7/102.8Education: Secondary gross enrolment ratio (f/m per 100 pop.) 2014 96.9/101.6Education: Tertiary gross enrolment ratio (f/m per 100 pop.) 2014 87.6/72.8Intentional homicide rate (per 100 000 pop.) 2014 0.5Seats held by women in national parliaments (%) 2016 30.6Environment and infrastructureMobile-cellular subscriptions (per 100 inhabitants) 2014 151.9Individuals using the Internet (%) 2014 81.0l
Patents: Resident filings (per million pop.) 2014 475.0Threatened species 2015 106Forested area (% of land area) 2013 46.8g
CO2 emission estimates (000 tons/tons per capita) 2013 62 409/7.4Energy production, primary (Petajoules) 2013 507Energy supply per capita (Gigajoules) 2013 164.0Terrestrial and marine areas protected (% of total area) 2014 28.4Population using improved drinking water sources (urban/rural, %) 2015 100.0/100.0Population using improved sanitation facilities (urban/rural, %) 2015 100.0/100.0Net Official Development Assistance disbursed (% of GNI) m 2014 0.3a Excludes irrigation canals and landscaping care. b Excludes publishing activities, includes irrigationcanals. c Excludes repair of personal and household goods. d Includes publishing activities and land-scaping care. e Data classified according to ISIC Rev. 3. f Break in the time series. g Estimate. h 2013. i2014. j Arrivals of non-resident tourists in all types of tourism accommodation establishments. k Allfigures relate to the end of 2014. l Population age 16-74. m Development Assistance Committee member(OECD).
World Statistics Pocketbook 15

AzerbaijanRegion Western Asia Surface area (sq km) 86 600Population (proj., 000) 9 868 a Pop. density (per sq km) 119.4 a
Capital city Baku Capital city pop. (000) 2 374 b
Currency Azerbaijan manat (AZN) UN membership date 2 March 1992Economic indicators 2005 2010 2014GDP: Gross domestic product (million current US$) 13 245 52 906 75 193GDP growth rate (annual %, const. 2005 prices) 28.0 4.6 2.6GDP per capita (current US$) 1 546.8 5 813.9 7 808.4Economy: Agriculture (% of GVA) c 9.8 5.9 5.7Economy: Industry (% of GVA) d 63.2 64.0 57.9Economy: Services and other activity (% of GVA) ef 27.0 30.1 36.4Employment: Agriculture (% of employed) 39.3g 38.2hi 36.8i
Employment: Industry (% of employed) 12.1g 13.7hi 14.3i
Employment: Services and other (% of employed) 48.6g 48.1hi 48.9i
Unemployment (% of labour force) j 7.3 5.6 4.9Labour force participation (female/male pop. %) j 60.5/66.3 61.8/67.4 61.6/68.0CPI: Consumer price index (2000=100) 125 204 ...Agricultural production index (2004-2006=100) 104 118 137k
Food production index (2004-2006=100) 103 122 142k
Index of industrial production (2005=100) 100 200 188Balance of payments, current account (million US$) 167 15 040 10 209Total trade Major trading partners 2015
(million US$)l (% of exports)l (% of imports)l
Exports 21 751.7 Italy 22.1 Russian Federation 14.3Imports 9 178.6 Indonesia 9.3 Turkey 14.0Balance 12 573.1 Germany 8.9 United Kingdom 10.7Social indicatorsPopulation growth rate (average annual %) 2010-2015 1.4a
Urban population (%) 2015 54.6a
Urban population growth rate (average annual %) 2010-2015 1.6a
Fertility rate, total (live births per woman) 2010-2015 2.3a
Life expectancy at birth (females/males, years) 2010-2015 73.8/67.5a
Total dependency ratio (Pop. aged 0-14 & 65+ per 100 pop. 15-64) 2015 38a
International migrant stock (000/% of total pop.) mid-2015 264.2/2.7am
Tourist arrivals at national borders (000) 2014 2 160Refugees and others of concern to UNHCR mid-2015 628 096Infant mortality rate (per 1 000 live births) 2010-2015 40a
Health: Total expenditure (% of GDP) 2014 6.0n
Health: Physicians (per 1 000 pop.) 2013 3.4Education: Government expenditure (% of GDP) 2014 2.5k
Education: Primary gross enrolment ratio (f/m per 100 pop.) 2014 105.5/106.6j
Education: Secondary gross enrolment ratio (f/m per 100 pop.) 2014 102.4/103.1j
Education: Tertiary gross enrolment ratio (f/m per 100 pop.) 2014 24.8/21.7j
Intentional homicide rate (per 100 000 pop.) 2014 2.5Seats held by women in national parliaments (%) 2016 16.9Environment and infrastructureMobile-cellular subscriptions (per 100 inhabitants) 2014 110.9Individuals using the Internet (%) 2014 61.0j
Patents: Resident filings (per million pop.) 2014 21.0Threatened species 2015 92Forested area (% of land area) 2013 13.2j
CO2 emission estimates (000 tons/tons per capita) 2013 35 643/3.7Energy production, primary (Petajoules) 2013 2 486Energy supply per capita (Gigajoules) 2013 60.0Terrestrial and marine areas protected (% of total area) 2014 14.0Population using improved drinking water sources (urban/rural, %) 2015 94.7/77.8Population using improved sanitation facilities (urban/rural, %) 2015 91.6/86.7Net Official Development Assistance received (% of GNI) 2014 0.3a Including Nagorno-Karabakh. b Including communities under the authority of the Town Council. c Ex-cludes irrigation canals and landscaping care. d Excludes publishing activities, includes irrigation canals.e Excludes repair of personal and household goods. f Includes publishing activities and landscaping care.g Data classified according to ISIC Rev. 3. h Break in the time series. i Excluding the institutional popu-lation. j Estimate. k 2013. l 2014. m Including refugees. n Adjustments for currency change (from old tonew manat) were made for the entire Azerbaijan series starting from World Health Statistics 2008.
16 World Statistics Pocketbook

BahamasRegion Caribbean Surface area (sq km) 13 940Population (proj., 000) 393 Pop. density (per sq km) 39.2Capital city Nassau Capital city pop. (000) 267 a
Currency Bahamian Dollar (BSD) UN membership date 18 September 1973Economic indicators 2005 2010 2014GDP: Gross domestic product (million current US$) 7 706 7 910 8 511GDP growth rate (annual %, const. 2005 prices) 3.4 1.5 1.0GDP per capita (current US$) 23 405.9 21 920.5 22 217.5Economy: Agriculture (% of GVA) 2.1 2.2 1.6Economy: Industry (% of GVA) 14.6 15.2 19.9Economy: Services and other activity (% of GVA) 83.4 82.6 78.5Employment: Agriculture (% of employed) b 3.5 2.9cd 3.7ce
Employment: Industry (% of employed) b 17.8 16.0cd 12.9ce
Employment: Services and other (% of employed) b 78.4 80.8cd 83.0ce
Unemployment (% of labour force) f 10.2 14.7 15.1Labour force participation (female/male pop. %) f 67.7/77.8 69.5/79.2 69.5/79.1CPI: Consumer price index (2000=100) 110 125 133Agricultural production index (2004-2006=100) 99 126 134g
Food production index (2004-2006=100) 99 126 134g
Balance of payments, current account (million US$) –701 –814 –1 897Total trade Major trading partners 2015
(million US$)a (% of exports)a (% of imports)a
Exports 689.2 United States 82.7 United States 85.8Imports 3 790.4 France 3.8 Barbados 2.6Balance –3 101.2 Ireland 3.6 Trinidad and Tobago 1.5Social indicatorsPopulation growth rate (average annual %) 2010-2015 1.5Urban population (%) 2015 82.9Urban population growth rate (average annual %) 2010-2015 1.5Fertility rate, total (live births per woman) 2010-2015 1.9Life expectancy at birth (females/males, years) 2010-2015 78.1/72.0Total dependency ratio (Pop. aged 0-14 & 65+ per 100 pop. 15-64) 2015 41International migrant stock (000/% of total pop.) mid-2015 59.3/15.3Tourist arrivals at national borders (000) 2014 1 427Refugees and others of concern to UNHCR mid-2015 56Infant mortality rate (per 1 000 live births) 2010-2015 9Health: Total expenditure (% of GDP) 2014 7.7Intentional homicide rate (per 100 000 pop.) 2014 29.8h
Seats held by women in national parliaments (%) 2016 13.2Environment and infrastructureMobile-cellular subscriptions (per 100 inhabitants) 2014 71.4f
Individuals using the Internet (%) 2014 76.9f
Patents: Resident filings (per million pop.) 2014 5.0Threatened species 2015 81Forested area (% of land area) 2013 51.5f
CO2 emission estimates (000 tons/tons per capita) 2013 3 110/8.2Energy production, primary (Petajoules) 2013 0Energy supply per capita (Gigajoules) 2013 118.0Terrestrial and marine areas protected (% of total area) 2014 0.5Population using improved drinking water sources (urban/rural, %) 2015 98.4/98.4Population using improved sanitation facilities (urban/rural, %) 2015 92.0/92.0a 2014. b Data classified according to ISIC Rev. 3. c Break in the time series. d 2009. e 2011. f Estimate.g 2013. h 2012.
World Statistics Pocketbook 17

BahrainRegion Western Asia Surface area (sq km) 771Population (proj., 000) 1 397 Pop. density (per sq km) 1 837.9Capital city Manama Capital city pop. (000) 411 a
Currency Bahraini Dinar (BHD) UN membership date 21 September 1971Economic indicators 2005 2010 2014GDP: Gross domestic product (million current US$) 15 969 25 713 33 850GDP growth rate (annual %, const. 2005 prices) 6.8 4.3 4.5GDP per capita (current US$) 18 418.1 20 386.0 24 854.4Economy: Agriculture (% of GVA) b 0.3 0.3 0.3Economy: Industry (% of GVA) b 42.8 45.5 47.4Economy: Services and other activity (% of GVA) b 56.9 54.3 52.3Employment: Agriculture (% of employed) 0.8cde 1.1 ...Employment: Industry (% of employed) 15.0cde 35.3 ...Employment: Services and other (% of employed) 84.2cde 62.4 ...Unemployment (% of labour force) f 1.3 1.1 1.2Labour force participation (female/male pop. %) f 36.2/84.5 41.3/87.0 39.4/85.2CPI: Consumer price index (2000=100) 105 120 130Agricultural production index (2004-2006=100) 92 115 207g
Food production index (2004-2006=100) 92 115 207g
Index of industrial production (2005=100) c 100 117 134Balance of payments, current account (million US$) 1 474 770 1 124Total trade Major trading partners 2015
(million US$)h (% of exports)h (% of imports)h
Exports 18 030.7 ... Saudi Arabia 41.7Imports 20 073.7 ... China 8.1Balance –2 043.0 ... United Arab Emirates 5.3Social indicatorsPopulation growth rate (average annual %) 2010-2015 1.8Urban population (%) 2015 88.8Urban population growth rate (average annual %) 2010-2015 1.7Fertility rate, total (live births per woman) 2010-2015 2.1Life expectancy at birth (females/males, years) 2010-2015 77.4/75.6Total dependency ratio (Pop. aged 0-14 & 65+ per 100 pop. 15-64) 2015 31International migrant stock (000/% of total pop.) mid-2015 704.1/51.1i
Tourist arrivals at national borders (000) j 2014 10 452Refugees and others of concern to UNHCR mid-2015 355Infant mortality rate (per 1 000 live births) 2010-2015 7Health: Total expenditure (% of GDP) 2014 5.0k
Health: Physicians (per 1 000 pop.) 2013 0.9l
Education: Government expenditure (% of GDP) 2014 2.6l
Education: Tertiary gross enrolment ratio (f/m per 100 pop.) 2014 56.5/24.2Intentional homicide rate (per 100 000 pop.) 2014 0.5m
Seats held by women in national parliaments (%) 2016 7.5Environment and infrastructureMobile-cellular subscriptions (per 100 inhabitants) 2014 173.3Individuals using the Internet (%) 2014 91.0n
Patents: Resident filings (per million pop.) 2014 5.0Threatened species 2015 32Forested area (% of land area) 2013 0.7f
CO2 emission estimates (000 tons/tons per capita) 2013 31 958/23.7Energy production, primary (Petajoules) 2013 920Energy supply per capita (Gigajoules) 2013 425.0Terrestrial and marine areas protected (% of total area) 2014 4.4Population using improved drinking water sources (urban/rural, %) 2015 100.0/100.0Population using improved sanitation facilities (urban/rural, %) 2015 99.2/99.2a Refers to the urban area of the municipality of Al-Manamah. b At producers' prices. c Data classifiedaccording to ISIC Rev. 3. d Break in the time series. e 2004. f Estimate. g 2013. h 2014. i Refers to foreigncitizens. j Arrivals of non-resident visitors at national borders. k Data revision. l 2012. m 2011. n Populationage 15+.
18 World Statistics Pocketbook

BangladeshRegion Southern Asia Surface area (sq km) 147 570Population (proj., 000) 162 911 Pop. density (per sq km) 1 251.5Capital city Dhaka Capital city pop. (000) 17 598 a
Currency Taka (BDT) UN membership date 17 September 1974Economic indicators 2005 2010 2014GDP: Gross domestic product (million current US$) 57 628 114 508 173 062GDP growth rate (annual %, const. 2005 prices) 6.0 5.6 6.1GDP per capita (current US$) 403.2 755.2 1 087.9Economy: Agriculture (% of GVA) 20.1 17.8 16.1Economy: Industry (% of GVA) 27.2 26.1 27.6Economy: Services and other activity (% of GVA) 52.6 56.0 56.3Employment: Agriculture (% of employed) 48.1b 47.5cd ...Employment: Industry (% of employed) 14.5b 17.7cd ...Employment: Services and other (% of employed) 37.4b 35.3cd ...Unemployment (% of labour force) e 4.3 4.5 4.5Labour force participation (female/male pop. %) e 48.1/84.1 42.0/82.3 43.1/80.9CPI: Consumer price index (2000=100) f 127 183 264Agricultural production index (2004-2006=100) 103 129 136g
Food production index (2004-2006=100) 103 130 136g
Index of industrial production (2005=100) bh 100 148 206g
Balance of payments, current account (million US$) 508c 2 109 –1 677Total trade Major trading partners 2015
(million US$)i (% of exports)i (% of imports)i
Exports 24 313.7 United States 21.0 Thailand 22.8Imports 41 221.7 Germany 15.6 India 11.2Balance –16 908.0 United Kingdom 9.5 China 8.8Social indicatorsPopulation growth rate (average annual %) 2010-2015 1.2Urban population (%) 2015 34.3Urban population growth rate (average annual %) 2010-2015 3.6Fertility rate, total (live births per woman) 2010-2015 2.2Life expectancy at birth (females/males, years) 2010-2015 72.3/69.9Total dependency ratio (Pop. aged 0-14 & 65+ per 100 pop. 15-64) 2015 53International migrant stock (000/% of total pop.) mid-2015 1 422.8/0.9j
Tourist arrivals at national borders (000) 2014 125Refugees and others of concern to UNHCR mid-2015 232 986k
Infant mortality rate (per 1 000 live births) 2010-2015 33Health: Total expenditure (% of GDP) 2014 2.8Health: Physicians (per 1 000 pop.) 2013 0.4i
Education: Government expenditure (% of GDP) 2014 2.0eg
Education: Primary gross enrolment ratio (f/m per 100 pop.) 2014 115.1/108.7ei
Education: Secondary gross enrolment ratio (f/m per 100 pop.) 2014 60.7/56.1g
Education: Tertiary gross enrolment ratio (f/m per 100 pop.) 2014 11.4/15.4Intentional homicide rate (per 100 000 pop.) 2014 2.8Seats held by women in national parliaments (%) 2016 20.0Environment and infrastructureMobile-cellular subscriptions (per 100 inhabitants) 2014 75.9l
Individuals using the Internet (%) 2014 9.6e
Threatened species 2015 137Forested area (% of land area) 2013 11.0e
CO2 emission estimates (000 tons/tons per capita) 2013 68 951/0.4Energy production, primary (Petajoules) 2013 1 410Energy supply per capita (Gigajoules) 2013 10.0Terrestrial and marine areas protected (% of total area) 2014 3.4Population using improved drinking water sources (urban/rural, %) 2015 86.5/87.0Population using improved sanitation facilities (urban/rural, %) 2015 57.7/62.1Net Official Development Assistance received (% of GNI) 2014 1.3a Mega city. b Data classified according to ISIC Rev. 3. c Break in the time series. d Economic activityrefers to jobs. As a result, the sum of the categories may not add up to the total. e Estimate. f Governmentofficials. g 2013. h Twelve months ending 30 June of the year stated. i 2011. j Including refugees. k Therefugee population includes 200,000 persons originating from Myanmar in a refugee-like situation. TheGovernment of Bangladesh estimates the population to be between 300,000 and 500,000. l Data as atthe end of December.
World Statistics Pocketbook 19

BarbadosRegion Caribbean Surface area (sq km) 430Population (proj., 000) 285 Pop. density (per sq km) 662.8Capital city Bridgetown Capital city pop. (000) 90 a
Currency Barbados Dollar (BBD) UN membership date 9 December 1966Economic indicators 2005 2010 2014GDP: Gross domestic product (million current US$) 3 897 4 447 4 353GDP growth rate (annual %, const. 2005 prices) 4.0 0.3 0.2GDP per capita (current US$) 14 223.1 15 905.7 15 360.1Economy: Agriculture (% of GVA) 1.8 1.6 1.7Economy: Industry (% of GVA) 16.9 14.4 11.2Economy: Services and other activity (% of GVA) 81.3 84.0 87.1Employment: Agriculture (% of employed) 3.3bc 2.8d 2.7def
Employment: Industry (% of employed) 17.3bc 19.6d 18.9def
Employment: Services and other (% of employed) 69.7bc 77.5d 78.4def
Unemployment (% of labour force) g 9.1 10.8 12.3Labour force participation (female/male pop. %) g 64.2/75.4 63.5/73.1 62.6/71.1CPI: Consumer price index (2000=100) 113 149 177Agricultural production index (2004-2006=100) 106 92 97f
Food production index (2004-2006=100) 106 92 97f
Index of industrial production (2005=100) h 100 88 80Balance of payments, current account (million US$) –467 –236 –248f
Total trade Major trading partners 2015(million US$) (% of exports) (% of imports)
Exports 482.8 United States 32.6 United States 39.2Imports 1 617.9 Areas nes 15.7i Trinidad and Tobago 15.8Balance –1 135.1 Trinidad and Tobago 8.2 China 5.6Social indicatorsPopulation growth rate (average annual %) 2010-2015 0.3Urban population (%) 2015 31.5Urban population growth rate (average annual %) 2010-2015 0.1Fertility rate, total (live births per woman) 2010-2015 1.8Life expectancy at birth (females/males, years) 2010-2015 77.7/72.9Total dependency ratio (Pop. aged 0-14 & 65+ per 100 pop. 15-64) 2015 50International migrant stock (000/% of total pop.) mid-2015 34.5/12.1Tourist arrivals at national borders (000) 2014 521Refugees and others of concern to UNHCR mid-2015 1Infant mortality rate (per 1 000 live births) 2010-2015 10Health: Total expenditure (% of GDP) 2014 7.5Education: Government expenditure (% of GDP) 2014 6.7Education: Primary gross enrolment ratio (f/m per 100 pop.) 2014 94.2/93.1Education: Secondary gross enrolment ratio (f/m per 100 pop.) 2014 110.7/107.9Education: Tertiary gross enrolment ratio (f/m per 100 pop.) 2014 90.6/40.3j
Intentional homicide rate (per 100 000 pop.) 2014 8.8Seats held by women in national parliaments (%) 2016 16.7Environment and infrastructureMobile-cellular subscriptions (per 100 inhabitants) 2014 106.8Individuals using the Internet (%) 2014 76.7g
Patents: Resident filings (per million pop.) 2014 3.0Threatened species 2015 51Forested area (% of land area) 2013 14.7g
CO2 emission estimates (000 tons/tons per capita) 2013 1 448/5.1Energy production, primary (Petajoules) 2013 3Energy supply per capita (Gigajoules) 2013 69.0Population using improved drinking water sources (urban/rural, %) 2015 99.7/99.7Population using improved sanitation facilities (urban/rural, %) 2015 96.2/96.2a 2014. b Data classified according to ISIC Rev. 2. c 2004. d Break in the time series. e Excluding theinstitutional population. f 2013. g Estimate. h Data classified according to ISIC Rev. 3. i See technicalnotes. j 2011.
20 World Statistics Pocketbook

BelarusRegion Eastern Europe Surface area (sq km) 207 600Population (proj., 000) 9 482 Pop. density (per sq km) 46.7Capital city Minsk Capital city pop. (000) 1 915 a
Currency Belarusian Ruble (BYR) UN membership date 24 October 1945Economic indicators 2005 2010 2014GDP: Gross domestic product (million current US$) 30 210 55 221 76 139GDP growth rate (annual %, const. 2005 prices) 9.4 7.7 1.6GDP per capita (current US$) 3 133.6 5 817.6 8 014.3Economy: Agriculture (% of GVA) 9.8 10.2 8.6Economy: Industry (% of GVA) 43.4 40.8 41.3Economy: Services and other activity (% of GVA) 46.8 49.0 50.1Employment: Agriculture (% of employed) ... 10.5b 9.6bcde
Employment: Industry (% of employed) ... 34.1b 33.2bcde
Employment: Services and other (% of employed) ... 55.3b 57.2bcde
Unemployment (% of labour force) f 6.1 6.0 5.9Labour force participation (female/male pop. %) f 53.8/66.6 54.5/67.7 54.6/68.1CPI: Consumer price index (2000=100) 384g 623h ...Agricultural production index (2004-2006=100) 98 117 116e
Food production index (2004-2006=100) 98 117 116e
Index of industrial production (2005=100) c 100 146 163Balance of payments, current account (million US$) 459 –8 280 –5 197Total trade Major trading partners 2015
(million US$) (% of exports) (% of imports)Exports 26 757.9 Russian Federation 38.3 Russian Federation 56.3Imports 29 940.9 United Kingdom 11.3 China 6.9Balance –3 183.0 Ukraine 9.5 Germany 4.6Social indicatorsPopulation growth rate (average annual %) 2010-2015 <Urban population (%) 2015 76.7Urban population growth rate (average annual %) 2010-2015 0.1Fertility rate, total (live births per woman) 2010-2015 1.6Life expectancy at birth (females/males, years) 2010-2015 77.0/65.3Total dependency ratio (Pop. aged 0-14 & 65+ per 100 pop. 15-64) 2015 43International migrant stock (000/% of total pop.) mid-2015 1 082.9/11.4Tourist arrivals at national borders (000) 2014 137i
Refugees and others of concern to UNHCR mid-2015 7 928Infant mortality rate (per 1 000 live births) 2010-2015 4Health: Total expenditure (% of GDP) 2014 5.7Health: Physicians (per 1 000 pop.) 2013 3.9Education: Government expenditure (% of GDP) 2014 5.0Education: Primary gross enrolment ratio (f/m per 100 pop.) 2014 99.1/98.9Education: Secondary gross enrolment ratio (f/m per 100 pop.) 2014 106.1/107.9Education: Tertiary gross enrolment ratio (f/m per 100 pop.) 2014 102.0/76.5Intentional homicide rate (per 100 000 pop.) 2014 3.6Seats held by women in national parliaments (%) 2016 27.3Environment and infrastructureMobile-cellular subscriptions (per 100 inhabitants) 2014 122.5Individuals using the Internet (%) 2014 59.0j
Patents: Resident filings (per million pop.) 2014 82.0Threatened species 2015 21Forested area (% of land area) 2013 42.4f
CO2 emission estimates (000 tons/tons per capita) 2013 63 769/6.7Energy production, primary (Petajoules) 2013 167Energy supply per capita (Gigajoules) 2013 120.0Terrestrial and marine areas protected (% of total area) 2014 8.6Population using improved drinking water sources (urban/rural, %) 2015 99.9/99.1Population using improved sanitation facilities (urban/rural, %) 2015 94.1/95.2Net Official Development Assistance received (% of GNI) 2014 0.2a Including communities under the authority of the Town Council. b Break in the time series. c Dataclassified according to ISIC Rev. 3. d Persons aged 16 years and over. e 2013. f Estimate. g Annual averageis weighted mean of monthly data. h Series linked to former series. i Package tour only. j Population age6+.
World Statistics Pocketbook 21

BelgiumRegion Western Europe Surface area (sq km) 30 528Population (proj., 000) 11 372 Pop. density (per sq km) 375.6Capital city Brussels Capital city pop. (000) 2 045 a
Currency Euro (EUR) UN membership date 27 December 1945Economic indicators 2005 2010 2014GDP: Gross domestic product (million current US$) 387 356 483 549 531 547GDP growth rate (annual %, const. 2005 prices) 2.1 2.7 1.4GDP per capita (current US$) 36 676.5 44 240.6 47 348.2Economy: Agriculture (% of GVA) b 0.9 0.9 0.7Economy: Industry (% of GVA) c 25.1 23.2 22.2Economy: Services and other activity (% of GVA) de 74.0 76.0 77.2Employment: Agriculture (% of employed) 2.0fg 1.3 1.1Employment: Industry (% of employed) 24.8fg 23.5 21.5Employment: Services and other (% of employed) 73.2fg 75.2 77.4Unemployment (% of labour force) h 8.4 8.3 8.5Labour force participation (female/male pop. %) h 45.8/61.4 47.8/60.8 48.2/59.3CPI: Consumer price index (2000=100) 111 123 133i
Agricultural production index (2004-2006=100) 100 100 101j
Food production index (2004-2006=100) 100 100 101j
Index of industrial production (2005=100) 100 117 121Balance of payments, current account (million US$) 7 703 7 973 –1 187Total trade Major trading partners 2015
(million US$) (% of exports) (% of imports)Exports 397 739.2 Germany 16.8 Netherlands 16.7Imports 371 025.0 France 15.4 Germany 12.7Balance 26 714.2 Netherlands 11.4 France 9.5Social indicatorsPopulation growth rate (average annual %) 2010-2015 0.7Urban population (%) 2015 97.9Urban population growth rate (average annual %) 2010-2015 0.5Fertility rate, total (live births per woman) 2010-2015 1.8Life expectancy at birth (females/males, years) 2010-2015 83.0/78.0Total dependency ratio (Pop. aged 0-14 & 65+ per 100 pop. 15-64) 2015 54International migrant stock (000/% of total pop.) mid-2015 1 387.9/12.3k
Tourist arrivals at national borders (000) l 2014 7 887Refugees and others of concern to UNHCR mid-2015 45 778Infant mortality rate (per 1 000 live births) 2010-2015 3Health: Total expenditure (% of GDP) 2014 10.6Education: Government expenditure (% of GDP) 2014 6.4m
Education: Primary gross enrolment ratio (f/m per 100 pop.) 2014 104.9/104.8Education: Secondary gross enrolment ratio (f/m per 100 pop.) 2014 175.4/154.7Education: Tertiary gross enrolment ratio (f/m per 100 pop.) 2014 83.4/63.6Intentional homicide rate (per 100 000 pop.) 2014 1.8Seats held by women in national parliaments (%) 2016 39.3Environment and infrastructureMobile-cellular subscriptions (per 100 inhabitants) 2014 114.3Individuals using the Internet (%) 2014 85.0n
Patents: Resident filings (per million pop.) 2014 250.0Threatened species 2015 30Forested area (% of land area) 2013 22.5h
CO2 emission estimates (000 tons/tons per capita) 2013 93 619/8.4Energy production, primary (Petajoules) 2013 619Energy supply per capita (Gigajoules) 2013 210.0Terrestrial and marine areas protected (% of total area) 2014 24.3Population using improved drinking water sources (urban/rural, %) 2015 100.0/100.0Population using improved sanitation facilities (urban/rural, %) 2015 99.5/99.4Net Official Development Assistance disbursed (% of GNI) o 2014 0.5a Refers to the population of Brussels-Capital Region and 'communes' of the agglomeration and suburbs.b Excludes irrigation canals and landscaping care. c Excludes publishing activities, includes irrigationcanals. d Excludes repair of personal and household goods. e Includes publishing activities and land-scaping care. f Data classified according to ISIC Rev. 3. g Break in the time series. h Estimate. i Serieslinked to former series. j 2013. k Refers to foreign citizens. l Arrivals of non-resident tourists in all typesof tourism accommodation establishments. m 2011. n Population age 16-74. o Development AssistanceCommittee member (OECD).
22 World Statistics Pocketbook

BelizeRegion Central America Surface area (sq km) 22 966Population (proj., 000) 367 Pop. density (per sq km) 16.1Capital city Belmopan Capital city pop. (000) 17 a
Currency Belize Dollar (BZD) UN membership date 25 September 1981Economic indicators 2005 2010 2014GDP: Gross domestic product (million current US$) 1 114 1 397 1 699GDP growth rate (annual %, const. 2005 prices) 3.0 3.3 3.6GDP per capita (current US$) 3 933.3 4 344.1 4 831.2Economy: Agriculture (% of GVA) 14.7 12.6 13.9Economy: Industry (% of GVA) 16.5 20.7 19.8Economy: Services and other activity (% of GVA) 68.8 66.7 66.4Employment: Agriculture (% of employed) b 19.5c ... ...Employment: Industry (% of employed) b 17.9c ... ...Employment: Services and other (% of employed) b 62.5c ... ...Unemployment (% of labour force) d 11.0 13.3 11.6Labour force participation (female/male pop. %) d 45.7/81.8 51.9/82.6 56.1/83.5CPI: Consumer price index (2000=100) 113 128 134Agricultural production index (2004-2006=100) 97 93 105e
Food production index (2004-2006=100) 97 93 105e
Balance of payments, current account (million US$) –151 –46 –136Total trade Major trading partners 2015
(million US$) (% of exports) (% of imports)Exports 328.9 United States 40.2 United States 33.8Imports 1 028.7 United Kingdom 24.9 Mexico 10.6Balance –699.8 Mexico 4.6 China 10.1Social indicatorsPopulation growth rate (average annual %) 2010-2015 2.2Urban population (%) 2015 44.0Urban population growth rate (average annual %) 2010-2015 1.9Fertility rate, total (live births per woman) 2010-2015 2.6Life expectancy at birth (females/males, years) 2010-2015 72.7/67.2Total dependency ratio (Pop. aged 0-14 & 65+ per 100 pop. 15-64) 2015 57International migrant stock (000/% of total pop.) mid-2015 53.9/15.0f
Tourist arrivals at national borders (000) 2014 321Refugees and others of concern to UNHCR mid-2015 146Infant mortality rate (per 1 000 live births) 2010-2015 14Health: Total expenditure (% of GDP) 2014 5.8g
Education: Government expenditure (% of GDP) 2014 6.2e
Education: Primary gross enrolment ratio (f/m per 100 pop.) 2014 109.0/114.4Education: Secondary gross enrolment ratio (f/m per 100 pop.) 2014 81.7/78.1Education: Tertiary gross enrolment ratio (f/m per 100 pop.) 2014 30.1/18.3e
Intentional homicide rate (per 100 000 pop.) 2014 34.4Seats held by women in national parliaments (%) 2016 3.1Environment and infrastructureMobile-cellular subscriptions (per 100 inhabitants) 2014 50.7d
Individuals using the Internet (%) 2014 38.7d
Threatened species 2015 117Forested area (% of land area) 2013 60.3d
CO2 emission estimates (000 tons/tons per capita) 2013 517/1.5Energy production, primary (Petajoules) 2013 10d
Energy supply per capita (Gigajoules) 2013 39.0Terrestrial and marine areas protected (% of total area) 2014 18.6Population using improved drinking water sources (urban/rural, %) 2015 98.9/100.0Population using improved sanitation facilities (urban/rural, %) 2015 93.5/88.2a 2014. b Data classified according to ISIC Rev. 3. c Persons aged 14 years and over. d Estimate. e 2013.f Including refugees. g Data revision.
World Statistics Pocketbook 23

BeninRegion Western Africa Surface area (sq km) 114 763Population (proj., 000) 11 167 Pop. density (per sq km) 99.0Capital city Porto-Novo a Capital city pop. (000) 268 b
Currency CFA Franc (XOF) UN membership date 20 September 1960Economic indicators 2005 2010 2014GDP: Gross domestic product (million current US$) 4 804 6 970 9 575GDP growth rate (annual %, const. 2005 prices) 1.7 2.1 6.5GDP per capita (current US$) 587.1 733.0 903.5Economy: Agriculture (% of GVA) 27.1 25.4 23.0Economy: Industry (% of GVA) 30.3 24.7 22.7Economy: Services and other activity (% of GVA) 42.5 49.9 54.3Employment: Agriculture (% of employed) 42.7cd 45.1ef ...Employment: Industry (% of employed) 9.5cd 10.4ef ...Employment: Services and other (% of employed) 46.2cd 44.0ef ...Unemployment (% of labour force) g 1.1 1.0 1.1Labour force participation (female/male pop. %) g 67.4/77.0 69.3/73.7 70.0/73.4CPI: Consumer price index (2000=100) h 115 134i 146Agricultural production index (2004-2006=100) 102 115 145j
Food production index (2004-2006=100) 102 122 150j
Index of industrial production (2005=100) kl 100 129 148j
Balance of payments, current account (million US$) –270 –618 –885Total trade Major trading partners 2015
(million US$)b (% of exports)b (% of imports)b
Exports 951.0 Gabon 14.9 India 13.3Imports 3 596.1 China 9.9 Thailand 12.6Balance –2 645.1 India 8.6 France 8.3Social indicatorsPopulation growth rate (average annual %) 2010-2015 2.7Urban population (%) 2015 44.0Urban population growth rate (average annual %) 2010-2015 3.7Fertility rate, total (live births per woman) 2010-2015 4.9Life expectancy at birth (females/males, years) 2010-2015 60.6/57.8Total dependency ratio (Pop. aged 0-14 & 65+ per 100 pop. 15-64) 2015 82International migrant stock (000/% of total pop.) mid-2015 245.4/2.3mn
Tourist arrivals at national borders (000) 2014 242Refugees and others of concern to UNHCR mid-2015 572Infant mortality rate (per 1 000 live births) 2010-2015 69Health: Total expenditure (% of GDP) 2014 4.6Education: Government expenditure (% of GDP) 2014 4.4Education: Primary gross enrolment ratio (f/m per 100 pop.) 2014 119.9/131.1Education: Secondary gross enrolment ratio (f/m per 100 pop.) 2014 43.9/64.8Education: Tertiary gross enrolment ratio (f/m per 100 pop.) 2014 8.4/22.4j
Intentional homicide rate (per 100 000 pop.) 2014 6.3o
Seats held by women in national parliaments (%) 2016 7.2Environment and infrastructureMobile-cellular subscriptions (per 100 inhabitants) 2014 101.7Individuals using the Internet (%) 2014 5.3g
Threatened species 2015 74Forested area (% of land area) 2013 39.1g
CO2 emission estimates (000 tons/tons per capita) 2013 5 798/0.6Energy production, primary (Petajoules) 2013 94Energy supply per capita (Gigajoules) 2013 16.0Terrestrial and marine areas protected (% of total area) 2014 22.3Population using improved drinking water sources (urban/rural, %) 2015 85.3/72.2Population using improved sanitation facilities (urban/rural, %) 2015 35.6/7.3Net Official Development Assistance received (% of GNI) 2014 6.9a Porto-Novo is the constitutional capital and Cotonou is the economic capital. b 2014. c Data classifiedaccording to ISIC Rev. 2. d 2003. e Break in the time series. f Persons aged 15 to 64 years. g Estimate.h Cotonou. i Series linked to former series. j 2013. k Data classified according to ISIC Rev. 3. l Countrydata supplemented with data from the Observatoire Economique et Statistique d’Afrique Subsaharienne(Afristat). m Including refugees. n Refers to foreign citizens. o 2012.
24 World Statistics Pocketbook

BermudaRegion Northern America Surface area (sq km) 53Population (proj., 000) 62 Pop. density (per sq km) 1 233.2Capital city Hamilton Capital city pop. (000) 10 a
Currency Bermudian Dollar (BMD)Economic indicators 2005 2010 2014GDP: Gross domestic product (million current US$) 4 868 5 855 5 601GDP growth rate (annual %, const. 2005 prices) 1.7 –2.5 –0.4GDP per capita (current US$) 74 751.8 91 555.4 89 795.3Economy: Agriculture (% of GVA) 0.8 0.7 0.6Economy: Industry (% of GVA) 9.7 7.1 5.3Economy: Services and other activity (% of GVA) 89.5 92.2 94.1Employment: Agriculture (% of employed) 1.7bc 1.4def 1.6dfgh
Employment: Industry (% of employed) 12.1bc 12.9def 10.3dfgh
Employment: Services and other (% of employed) 86.2bc 85.7def 87.6dfgh
Unemployment (% of labour force) f ... 4.5ei 6.7gh
Labour force participation (female/male pop. %) ... 81.0/87.0f 72.6/80.0fgj
CPI: Consumer price index (2000=100) 116 136 148Agricultural production index (2004-2006=100) 98 116 120h
Food production index (2004-2006=100) 98 116 120h
Balance of payments, current account (million US$) ... 696 827Total trade Major trading partners 2015
(million US$) (% of exports) (% of imports)Exports 8.6 United States 81.4 United States 65.6Imports 928.9 United Kingdom 11.6 Canada 14.7Balance –920.3 Switzerland 3.5 United Kingdom 3.9Social indicatorsPopulation growth rate (average annual %) 2010-2015 –0.6Urban population (%) 2015 100.0Urban population growth rate (average annual %) 2010-2015 0.2Fertility rate, total (live births per woman) 2010-2015 1.6h
Life expectancy at birth (females/males, years) 2010-2015 84.5/76.9h
Total dependency ratio (Pop. aged 0-14 & 65+ per 100 pop. 15-64) 2015 46h
International migrant stock (000/% of total pop.) mid-2015 19.1/30.9Tourist arrivals at national borders (000) 2014 224k
Education: Government expenditure (% of GDP) 2014 1.8Education: Primary gross enrolment ratio (f/m per 100 pop.) 2014 86.1/88.8Education: Secondary gross enrolment ratio (f/m per 100 pop.) 2014 77.4/68.0Education: Tertiary gross enrolment ratio (f/m per 100 pop.) 2014 36.1/19.1Intentional homicide rate (per 100 000 pop.) 2014 4.8h
Environment and infrastructureMobile-cellular subscriptions (per 100 inhabitants) 2014 90.9Individuals using the Internet (%) 2014 96.8l
Threatened species 2015 64Forested area (% of land area) 2013 20.0l
CO2 emission estimates (000 tons/tons per capita) 2013 363/5.8Energy production, primary (Petajoules) 2013 1l
Energy supply per capita (Gigajoules) 2013 88.0Terrestrial and marine areas protected (% of total area) 2014 5.1a 2014. b Data classified according to ISIC Rev. 2. c 2004. d Data classified according to ISIC Rev. 3. eBreak in the time series. f Persons aged 16 years and over. g Excluding the institutional population. h2013. i 2009. j 2012. k Arrivals by air. l Estimate.
World Statistics Pocketbook 25

BhutanRegion Southern Asia Surface area (sq km) 38 394Population (proj., 000) 784 Pop. density (per sq km) 20.6Capital city Thimphu Capital city pop. (000) 152 a
Currency Ngultrum (BTN) UN membership date 21 September 1971Economic indicators 2005 2010 2014GDP: Gross domestic product (million current US$) 819 1 585 1 965GDP growth rate (annual %, const. 2005 prices) 7.1 11.7 6.4GDP per capita (current US$) 1 257.6 2 201.3 2 568.7Economy: Agriculture (% of GVA) 23.2 17.5 17.1Economy: Industry (% of GVA) 37.3 44.6 44.0Economy: Services and other activity (% of GVA) 39.5 37.9 39.0Employment: Agriculture (% of employed) b 43.6cd 59.5 56.3cef
Employment: Industry (% of employed) b 17.2cd 6.7 11.0cef
Employment: Services and other (% of employed) b 39.2cd 33.8 32.7cef
Unemployment (% of labour force) g 3.1 3.3 2.6Labour force participation (female/male pop. %) g 65.2/77.7 63.8/74.5 58.3/72.3CPI: Consumer price index (2000=100) 117 156 222Agricultural production index (2004-2006=100) 106 95 97f
Food production index (2004-2006=100) 106 94 97f
Balance of payments, current account (million US$) ... –323 –484Total trade Major trading partners 2015
(million US$)h (% of exports)h (% of imports)h
Exports 531.2 India 93.7 India 78.8Imports 991.7 Bangladesh 4.1 Republic of Korea 3.1Balance –460.5 Italy 0.4 China 2.5Social indicatorsPopulation growth rate (average annual %) 2010-2015 1.5Urban population (%) 2015 38.6Urban population growth rate (average annual %) 2010-2015 3.7Fertility rate, total (live births per woman) 2010-2015 2.1Life expectancy at birth (females/males, years) 2010-2015 69.1/68.6Total dependency ratio (Pop. aged 0-14 & 65+ per 100 pop. 15-64) 2015 47International migrant stock (000/% of total pop.) mid-2015 51.1/6.6Tourist arrivals at national borders (000) 2014 134Infant mortality rate (per 1 000 live births) 2010-2015 30Health: Total expenditure (% of GDP) 2014 3.6Health: Physicians (per 1 000 pop.) 2013 0.3h
Education: Government expenditure (% of GDP) 2014 5.9Education: Primary gross enrolment ratio (f/m per 100 pop.) 2014 102.9/101.4Education: Secondary gross enrolment ratio (f/m per 100 pop.) 2014 87.1/81.4Education: Tertiary gross enrolment ratio (f/m per 100 pop.) 2014 9.2/12.6f
Intentional homicide rate (per 100 000 pop.) 2014 2.7Seats held by women in national parliaments (%) 2016 8.5Environment and infrastructureMobile-cellular subscriptions (per 100 inhabitants) 2014 82.1Individuals using the Internet (%) 2014 34.4g
Patents: Resident filings (per million pop.) 2014 4.0f
Threatened species 2015 71Forested area (% of land area) 2013 71.8g
CO2 emission estimates (000 tons/tons per capita) 2013 884/1.2Energy production, primary (Petajoules) 2013 75Energy supply per capita (Gigajoules) 2013 83.0Terrestrial and marine areas protected (% of total area) 2014 47.3Population using improved drinking water sources (urban/rural, %) 2015 100.0/100.0Population using improved sanitation facilities (urban/rural, %) 2015 77.9/33.1Net Official Development Assistance received (% of GNI) 2014 7.4a 2014. b Data classified according to ISIC Rev. 3. c Break in the time series. d Services include activitiesnot adequately defined. e Excluding overseas territories. f 2013. g Estimate. h 2012.
26 World Statistics Pocketbook

Bolivia (Plurinational State of)Region South America Surface area (sq km) 1 098 581 a
Population (proj., 000) 10 888 Pop. density (per sq km) 10.1Capital city Sucre b Capital city pop. (000) 372Currency Boliviano (BOB) UN membership date 14 November 1945Economic indicators 2005 2010 2014GDP: Gross domestic product (million current US$) 9 549 19 650 32 996GDP growth rate (annual %, const. 2005 prices) 4.4 4.1 5.5GDP per capita (current US$) 1 046.4 1 981.2 3 124.1Economy: Agriculture (% of GVA) 13.9 12.4 12.4Economy: Industry (% of GVA) 31.0 35.9 35.0Economy: Services and other activity (% of GVA) 55.2 51.8 52.6Employment: Agriculture (% of employed) 38.6cd 32.1cdef ...Employment: Industry (% of employed) 19.4cd 20.0cdef ...Employment: Services and other (% of employed) 42.0cd 47.9cdef ...Unemployment (% of labour force) g 5.4 2.6 3.2Labour force participation (female/male pop. %) g 60.7/81.4 62.5/82.3 63.8/82.5CPI: Consumer price index (2000=100) h 117 160 205Agricultural production index (2004-2006=100) 100 120 134i
Food production index (2004-2006=100) 100 120 134i
Balance of payments, current account (million US$) 622 874 –16Total trade Major trading partners 2015
(million US$) (% of exports) (% of imports)Exports 8 908.7 Brazil 27.5 China 18.0Imports 9 682.4 Argentina 16.8 Brazil 16.5Balance –773.7 United States 12.4 Argentina 11.7Social indicatorsPopulation growth rate (average annual %) 2010-2015 1.6Urban population (%) 2015 68.5Urban population growth rate (average annual %) 2010-2015 2.3Fertility rate, total (live births per woman) 2010-2015 3.0Life expectancy at birth (females/males, years) 2010-2015 70.2/65.3Total dependency ratio (Pop. aged 0-14 & 65+ per 100 pop. 15-64) 2015 64International migrant stock (000/% of total pop.) mid-2015 143.0/1.3Tourist arrivals at national borders (000) 2014 871Refugees and others of concern to UNHCR mid-2015 775Infant mortality rate (per 1 000 live births) 2010-2015 43Health: Total expenditure (% of GDP) 2014 6.3jk
Health: Physicians (per 1 000 pop.) 2013 0.5l
Education: Government expenditure (% of GDP) 2014 7.3Education: Secondary gross enrolment ratio (f/m per 100 pop.) 2014 84.4/85.0i
Intentional homicide rate (per 100 000 pop.) 2014 12.4m
Seats held by women in national parliaments (%) 2016 53.1Environment and infrastructureMobile-cellular subscriptions (per 100 inhabitants) 2014 96.3Individuals using the Internet (%) 2014 39.0g
Patents: Resident filings (per million pop.) 2014 1.0Threatened species 2015 216Forested area (% of land area) 2013 51.1g
CO2 emission estimates (000 tons/tons per capita) 2013 19 703/1.9Energy production, primary (Petajoules) 2013 912Energy supply per capita (Gigajoules) 2013 32.0Terrestrial and marine areas protected (% of total area) 2014 24.8Population using improved drinking water sources (urban/rural, %) 2015 96.7/75.6Population using improved sanitation facilities (urban/rural, %) 2015 60.8/27.6Net Official Development Assistance received (% of GNI) 2014 2.1a Data updated according to 'Superintendencia Agraria'. Interior waters correspond to natural or artificialbodies of water or snow. b La Paz is the seat of government and Sucre is the constitutional capital. cData classified according to ISIC Rev. 3. d Persons aged 10 years and over. e Break in the time series. f2009. g Estimate. h Urban areas. i 2013. j Data revision. k Funds previously included in social securitywere reclassified. l 2011. m 2012.
World Statistics Pocketbook 27

Bosnia and HerzegovinaRegion Southern Europe Surface area (sq km) 51 209Population (proj., 000) 3 802 Pop. density (per sq km) 74.6Capital city Sarajevo Capital city pop. (000) 318Currency Convertible Mark (BAM) UN membership date 22 May 1992Economic indicators 2005 2010 2014GDP: Gross domestic product (million current US$) 11 225 17 164 18 491GDP growth rate (annual %, const. 2005 prices) 3.9 0.8 1.3GDP per capita (current US$) 2 928.2 4 475.3 4 843.7Economy: Agriculture (% of GVA) a 9.8 8.0 7.1Economy: Industry (% of GVA) b 25.3 26.4 26.0Economy: Services and other activity (% of GVA) cd 64.9 65.6 66.9Unemployment (% of labour force) e 25.9 27.2 31.2Labour force participation (female/male pop. %) e 31.8/58.3 34.6/59.6 34.5/58.2CPI: Consumer price index (2000=100) f 100 118 123Agricultural production index (2004-2006=100) 98 107 113g
Food production index (2004-2006=100) 98 108 114g
Index of industrial production (2005=100) h 100 135 ...Balance of payments, current account (million US$) –1 844 –1 031 –1 451Total trade Major trading partners 2015
(million US$) (% of exports) (% of imports)Exports 5 099.1 Germany 15.7 Germany 12.1Imports 8 993.9 Italy 13.5 Italy 11.1Balance –3 894.8 Croatia 10.3 Serbia 10.9Social indicatorsPopulation growth rate (average annual %) 2010-2015 –0.1Urban population (%) 2015 39.8Urban population growth rate (average annual %) 2010-2015 0.1Fertility rate, total (live births per woman) 2010-2015 1.3Life expectancy at birth (females/males, years) 2010-2015 78.8/73.7Total dependency ratio (Pop. aged 0-14 & 65+ per 100 pop. 15-64) 2015 41International migrant stock (000/% of total pop.) mid-2015 34.8/0.9ei
Tourist arrivals at national borders (000) j 2014 536Refugees and others of concern to UNHCR mid-2015 143 851Infant mortality rate (per 1 000 live births) 2010-2015 8Health: Total expenditure (% of GDP) 2014 9.6Health: Physicians (per 1 000 pop.) 2013 1.9Education: Primary gross enrolment ratio (f/m per 100 pop.) 2014 100.4/100.0Education: Secondary gross enrolment ratio (f/m per 100 pop.) 2014 90.1/87.4Education: Tertiary gross enrolment ratio (f/m per 100 pop.) 2014 54.7/40.9Intentional homicide rate (per 100 000 pop.) 2014 1.3Seats held by women in national parliaments (%) 2016 21.4Environment and infrastructureMobile-cellular subscriptions (per 100 inhabitants) 2014 91.3Individuals using the Internet (%) 2014 60.8e
Patents: Resident filings (per million pop.) 2014 11.0Threatened species 2015 85Forested area (% of land area) 2013 42.7e
CO2 emission estimates (000 tons/tons per capita) 2013 21 907/5.7Energy production, primary (Petajoules) 2013 192Energy supply per capita (Gigajoules) 2013 70.0Terrestrial and marine areas protected (% of total area) 2014 1.3Population using improved drinking water sources (urban/rural, %) 2015 99.7/100.0Population using improved sanitation facilities (urban/rural, %) 2015 98.9/92.0Net Official Development Assistance received (% of GNI) 2014 3.4a Excludes irrigation canals and landscaping care. b Excludes publishing activities, includes irrigationcanals. c Excludes repair of personal and household goods. d Includes publishing activities and land-scaping care. e Estimate. f Index base: 2005=100. g 2013. h Data classified according to ISIC Rev. 3. iIncluding refugees. j Arrivals of non-resident tourists in all types of tourism accommodation establish-ments.
28 World Statistics Pocketbook

BotswanaRegion Southern Africa Surface area (sq km) 582 000Population (proj., 000) 2 304 Pop. density (per sq km) 4.1Capital city Gaborone Capital city pop. (000) 247 a
Currency Pula (BWP) UN membership date 17 October 1966Economic indicators 2005 2010 2014GDP: Gross domestic product (million current US$) 9 931 12 787 15 813GDP growth rate (annual %, const. 2005 prices) 4.6 8.6 4.4GDP per capita (current US$) 5 327.9 6 244.0 7 123.4Economy: Agriculture (% of GVA) 2.0 2.8 2.4Economy: Industry (% of GVA) 47.6 35.7 37.9Economy: Services and other activity (% of GVA) 50.3 61.6 59.7Employment: Agriculture (% of employed) 21.2bcdef 26.4 ...Employment: Industry (% of employed) 22.6bcdef 17.5 ...Employment: Services and other (% of employed) 56.1bcdef 56.1 ...Unemployment (% of labour force) g 20.5 17.9 17.9Labour force participation (female/male pop. %) g 71.4/80.9 72.7/81.0 73.3/81.1CPI: Consumer price index (2000=100) 146 227 293Agricultural production index (2004-2006=100) 101 124 130h
Food production index (2004-2006=100) 101 124 130h
Balance of payments, current account (million US$) 1 634 –356 2 496Total trade Major trading partners 2015
(million US$)i (% of exports)i (% of imports)i
Exports 5 881.9 United Kingdom 62.4 South Africa 65.7Imports 7 272.0 South Africa 13.5 China 10.9Balance –1 390.1 Israel 5.2 United Kingdom 9.9Social indicatorsPopulation growth rate (average annual %) 2010-2015 2.0Urban population (%) 2015 57.4Urban population growth rate (average annual %) 2010-2015 1.3Fertility rate, total (live births per woman) 2010-2015 2.9Life expectancy at birth (females/males, years) 2010-2015 66.5/61.8Total dependency ratio (Pop. aged 0-14 & 65+ per 100 pop. 15-64) 2015 55International migrant stock (000/% of total pop.) mid-2015 160.6/7.1j
Tourist arrivals at national borders (000) 2014 1 544h
Refugees and others of concern to UNHCR mid-2015 2 412Infant mortality rate (per 1 000 live births) 2010-2015 32Health: Total expenditure (% of GDP) 2014 5.4Education: Primary gross enrolment ratio (f/m per 100 pop.) 2014 107.0/110.1h
Education: Secondary gross enrolment ratio (f/m per 100 pop.) 2014 86.2/81.6h
Education: Tertiary gross enrolment ratio (f/m per 100 pop.) 2014 31.8/23.3Seats held by women in national parliaments (%) 2016 9.5Environment and infrastructureMobile-cellular subscriptions (per 100 inhabitants) 2014 167.3Individuals using the Internet (%) 2014 18.5g
Patents: Resident filings (per million pop.) 2014 2.0Threatened species 2015 24Forested area (% of land area) 2013 19.5g
CO2 emission estimates (000 tons/tons per capita) 2013 5 423/2.5Energy production, primary (Petajoules) 2013 42Energy supply per capita (Gigajoules) 2013 39.0Terrestrial and marine areas protected (% of total area) 2014 29.2Population using improved drinking water sources (urban/rural, %) 2015 99.2/92.3Population using improved sanitation facilities (urban/rural, %) 2015 78.5/43.1Net Official Development Assistance received (% of GNI) 2014 0.6a 2014. b Data classified according to ISIC Rev. 3. c Break in the time series. d Excluding conscripts. ePersons aged 12 years and over. f 2003. g Estimate. h 2013. i 2011. j Refers to foreign citizens.
World Statistics Pocketbook 29

BrazilRegion South America Surface area (sq km) 8 514 877Population (proj., 000) 209 568 Pop. density (per sq km) 25.1Capital city Brasilia Capital city pop. (000) 4 155 a
Currency Brazilian Real (BRL) UN membership date 24 October 1945Economic indicators 2005 2010 2014GDP: Gross domestic product (million current US$) 892 107 2 209 400 2 346 523GDP growth rate (annual %, const. 2005 prices) 3.2 7.6 0.2GDP per capita (current US$) 4 733.2 11 124.1 11 386.6Economy: Agriculture (% of GVA) b 5.5 4.9 5.6Economy: Industry (% of GVA) c 28.6 27.4 23.4Economy: Services and other activity (% of GVA) de 65.9 67.8 71.0Employment: Agriculture (% of employed) fg 20.5 17.0hi 14.5hjk
Employment: Industry (% of employed) fg 21.4 22.1hi 22.6jk
Employment: Services and other (% of employed) fg 57.9 60.7hi 62.9jk
Unemployment (% of labour force) l 9.3 7.9 6.8Labour force participation (female/male pop. %) l 59.1/82.4 57.6/80.7 56.5/78.7CPI: Consumer price index (2000=100) 151 190 242Agricultural production index (2004-2006=100) 99 122 135k
Food production index (2004-2006=100) 99 123 136k
Index of industrial production (2005=100) 100 115 111Balance of payments, current account (million US$) 13 984 –75 760h –104 181Total trade Major trading partners 2015
(million US$) (% of exports) (% of imports)Exports 191 126.9 China 18.6 China 17.9Imports 171 446.2 United States 12.7 United States 15.6Balance 19 680.7 Argentina 6.7 Germany 6.1Social indicatorsPopulation growth rate (average annual %) 2010-2015 0.9Urban population (%) 2015 85.7Urban population growth rate (average annual %) 2010-2015 1.2Fertility rate, total (live births per woman) 2010-2015 1.8Life expectancy at birth (females/males, years) 2010-2015 77.9/70.3Total dependency ratio (Pop. aged 0-14 & 65+ per 100 pop. 15-64) 2015 45International migrant stock (000/% of total pop.) mid-2015 713.6/0.3Tourist arrivals at national borders (000) 2014 6 430Refugees and others of concern to UNHCR mid-2015 66 002Infant mortality rate (per 1 000 live births) 2010-2015 20Health: Total expenditure (% of GDP) 2014 8.3Health: Physicians (per 1 000 pop.) 2013 1.9Education: Government expenditure (% of GDP) 2014 5.9m
Education: Primary gross enrolment ratio (f/m per 100 pop.) 2014 107.0/112.4kl
Education: Secondary gross enrolment ratio (f/m per 100 pop.) 2014 106.2/97.8kl
Education: Tertiary gross enrolment ratio (f/m per 100 pop.) 2014 53.4/39.6kl
Intentional homicide rate (per 100 000 pop.) 2014 24.6Seats held by women in national parliaments (%) 2016 9.9Environment and infrastructureMobile-cellular subscriptions (per 100 inhabitants) 2014 139.0Individuals using the Internet (%) 2014 57.6l
Patents: Resident filings (per million pop.) 2014 23.0Threatened species 2015 966Forested area (% of land area) 2013 59.3l
CO2 emission estimates (000 tons/tons per capita) 2013 503 677/2.5Energy production, primary (Petajoules) 2013 10 360Energy supply per capita (Gigajoules) 2013 59.0Terrestrial and marine areas protected (% of total area) 2014 20.4Population using improved drinking water sources (urban/rural, %) 2015 100.0/87.0Population using improved sanitation facilities (urban/rural, %) 2015 88.0/51.5Net Official Development Assistance received (% of GNI) 2014 <a Refers to the Região Integrada de Desenvolvimento do Distrito Federal e Entorno. b Excludes irrigationcanals and landscaping care. c Excludes publishing activities, includes irrigation canals. d Includes pub-lishing activities and landscaping care. e Excludes repair of personal and household goods. f Dataclassified according to ISIC Rev. 3. g Persons aged 10 years and over. h Break in the time series. i 2009.j Excluding the institutional population. k 2013. l Estimate. m 2012.
30 World Statistics Pocketbook

British Virgin IslandsRegion Caribbean Surface area (sq km) 151Population (proj., 000) 31 Pop. density (per sq km) 204.4Capital city Road Town Capital city pop. (000) 13 a
Currency US Dollar (USD)Economic indicators 2005 2010 2014GDP: Gross domestic product (million current US$) 870 894 902GDP growth rate (annual %, const. 2005 prices) 14.3 1.3 –0.3GDP per capita (current US$) 37 550.2 32 839.9 30 501.5Economy: Agriculture (% of GVA) 1.1 1.0 1.0Economy: Industry (% of GVA) 11.9 10.0 11.1Economy: Services and other activity (% of GVA) 87.1 89.0 87.9Employment: Agriculture (% of employed) b ... 0.5 ...Employment: Industry (% of employed) b ... 11.1 ...Employment: Services and other (% of employed) b ... 87.4 ...CPI: Consumer price index (2000=100) 110 ... ...Agricultural production index (2004-2006=100) 100 102 104c
Food production index (2004-2006=100) 100 102 104c
Social indicatorsPopulation growth rate (average annual %) 2010-2015 2.0Urban population (%) 2015 46.2Urban population growth rate (average annual %) 2010-2015 1.8Life expectancy at birth (females/males, years) 2010-2015 78.5/69.9d
International migrant stock (000/% of total pop.) mid-2015 17.3/57.5Tourist arrivals at national borders (000) 2014 386Environment and infrastructureMobile-cellular subscriptions (per 100 inhabitants) 2014 169.6Individuals using the Internet (%) 2014 38.5e
Threatened species 2015 61Forested area (% of land area) 2013 24.2e
CO2 emission estimates (000 tons/tons per capita) 2013 176/6.0Energy production, primary (Petajoules) 2013 0Energy supply per capita (Gigajoules) 2013 85.0e
Terrestrial and marine areas protected (% of total area) 2014 0.1Population using improved sanitation facilities (urban/rural, %) 2015 97.5/97.5a 2014. b Data classified according to ISIC Rev. 3. c 2013. d 2004. e Estimate.
World Statistics Pocketbook 31

Brunei DarussalamRegion South-Eastern Asia Surface area (sq km) 5 765Population (proj., 000) 429 Pop. density (per sq km) 81.4Capital city Bandar Seri Begawan Capital city pop. (000) 14 a
Currency Brunei Dollar (BND) UN membership date 21 September 1984Economic indicators 2005 2010 2014GDP: Gross domestic product (million current US$) 10 561 13 707 17 104GDP growth rate (annual %, const. 2005 prices) 0.4 2.6 –2.3GDP per capita (current US$) 29 183.8 34 851.4 40 978.5Economy: Agriculture (% of GVA) b 0.9 0.7 0.9Economy: Industry (% of GVA) c 72.1 67.4 66.8Economy: Services and other activity (% of GVA) de 27.0 31.9 32.4Employment: Agriculture (% of employed) 1.4fg ... 0.6h
Employment: Industry (% of employed) 21.4fg ... 18.7h
Employment: Services and other (% of employed) 77.2fg ... 80.8h
Unemployment (% of labour force) i 2.4 1.7 1.6Labour force participation (female/male pop. %) i 55.2/78.1 54.1/76.9 51.1/75.5CPI: Consumer price index (2000=100) 101 105j 105Agricultural production index (2004-2006=100) 75 139 167k
Food production index (2004-2006=100) 75 140 167k
Index of industrial production (2005=100) f 100 88 79Balance of payments, current account (million US$) 4 033 5 016h 4 750Total trade Major trading partners 2015
(million US$)a (% of exports)a (% of imports)a
Exports 10 508.8 Japan 37.2 Malaysia 20.6Imports 3 598.7 Republic of Korea 11.0 Singapore 20.4Balance 6 910.1 India 9.1 China 9.9Social indicatorsPopulation growth rate (average annual %) 2010-2015 1.5Urban population (%) 2015 77.2Urban population growth rate (average annual %) 2010-2015 1.8Fertility rate, total (live births per woman) 2010-2015 1.9Life expectancy at birth (females/males, years) 2010-2015 80.4/76.6Total dependency ratio (Pop. aged 0-14 & 65+ per 100 pop. 15-64) 2015 38International migrant stock (000/% of total pop.) mid-2015 102.7/24.3Tourist arrivals at national borders (000) 2014 201l
Refugees and others of concern to UNHCR mid-2015 20 524Infant mortality rate (per 1 000 live births) 2010-2015 4Health: Total expenditure (% of GDP) 2014 2.7Health: Physicians (per 1 000 pop.) 2013 1.4m
Education: Government expenditure (% of GDP) 2014 3.8Education: Primary gross enrolment ratio (f/m per 100 pop.) 2014 107.6/107.3Education: Secondary gross enrolment ratio (f/m per 100 pop.) 2014 99.1/99.1Education: Tertiary gross enrolment ratio (f/m per 100 pop.) 2014 40.1/23.8Intentional homicide rate (per 100 000 pop.) 2014 0.5k
Environment and infrastructureMobile-cellular subscriptions (per 100 inhabitants) 2014 110.1Individuals using the Internet (%) 2014 68.8i
Patents: Resident filings (per million pop.) 2014 61.0Threatened species 2015 189Forested area (% of land area) 2013 72.1i
CO2 emission estimates (000 tons/tons per capita) 2013 7 785/18.9Energy production, primary (Petajoules) 2013 710Energy supply per capita (Gigajoules) 2013 310.0Terrestrial and marine areas protected (% of total area) 2014 29.7a 2014. b Excludes irrigation canals and landscaping care. c Excludes publishing activities, includesirrigation canals. d Excludes repair of personal and household goods. e Includes publishing activities andlandscaping care. f Data classified according to ISIC Rev. 3. g 2001. h Break in the time series. i Estimate.j Series linked to former series. k 2013. l Arrivals by air. m 2012.
32 World Statistics Pocketbook

BulgariaRegion Eastern Europe Surface area (sq km) 111 002Population (proj., 000) 7 098 Pop. density (per sq km) 65.4Capital city Sofia Capital city pop. (000) 1 226Currency Bulgarian Lev (BGN) UN membership date 14 December 1955Economic indicators 2005 2010 2014GDP: Gross domestic product (million current US$) 29 821 49 939 56 718GDP growth rate (annual %, const. 2005 prices) 7.2 0.1 1.6GDP per capita (current US$) 3 881.6 6 741.9 7 876.1Economy: Agriculture (% of GVA) a 8.7 5.1 5.3Economy: Industry (% of GVA) b 28.8 27.8 28.4Economy: Services and other activity (% of GVA) cd 62.5 67.1 66.4Employment: Agriculture (% of employed) 8.4e 6.7 6.9Employment: Industry (% of employed) 34.5e 33.4 30.3Employment: Services and other (% of employed) 57.0e 59.9 62.8Unemployment (% of labour force) f 10.1 10.2 11.4Labour force participation (female/male pop. %) f 44.6/56.3 47.5/59.5 48.6/60.1CPI: Consumer price index (2000=100) 130 178 190Agricultural production index (2004-2006=100) 91 106 116g
Food production index (2004-2006=100) 91 107 118g
Index of industrial production (2005=100) h 100 98 105Balance of payments, current account (million US$) –3 347 504i 693Total trade Major trading partners 2015
(million US$) (% of exports) (% of imports)Exports 25 778.7 Germany 12.4 Germany 12.9Imports 29 265.1 Italy 9.2 Russian Federation 12.0Balance –3 486.4 Turkey 8.6 Italy 7.6Social indicatorsPopulation growth rate (average annual %) 2010-2015 –0.7Urban population (%) 2015 73.9Urban population growth rate (average annual %) 2010-2015 –0.3Fertility rate, total (live births per woman) 2010-2015 1.5Life expectancy at birth (females/males, years) 2010-2015 77.6/70.6Total dependency ratio (Pop. aged 0-14 & 65+ per 100 pop. 15-64) 2015 52International migrant stock (000/% of total pop.) mid-2015 102.1/1.4Tourist arrivals at national borders (000) 2014 7 311Refugees and others of concern to UNHCR mid-2015 18 953j
Infant mortality rate (per 1 000 live births) 2010-2015 9Health: Total expenditure (% of GDP) 2014 8.4Health: Physicians (per 1 000 pop.) 2013 3.9k
Education: Government expenditure (% of GDP) 2014 3.5k
Education: Primary gross enrolment ratio (f/m per 100 pop.) 2014 98.8/99.4Education: Secondary gross enrolment ratio (f/m per 100 pop.) 2014 99.0/102.6Education: Tertiary gross enrolment ratio (f/m per 100 pop.) 2014 79.0/63.0Intentional homicide rate (per 100 000 pop.) 2014 1.6Seats held by women in national parliaments (%) 2016 20.4Environment and infrastructureMobile-cellular subscriptions (per 100 inhabitants) 2014 137.7fl
Individuals using the Internet (%) 2014 55.5m
Patents: Resident filings (per million pop.) 2014 35.0Threatened species 2015 85Forested area (% of land area) 2013 34.9f
CO2 emission estimates (000 tons/tons per capita) 2013 39 563/5.5Energy production, primary (Petajoules) 2013 443Energy supply per capita (Gigajoules) 2013 97.0Terrestrial and marine areas protected (% of total area) 2014 31.5Population using improved drinking water sources (urban/rural, %) 2015 99.6/99.0Population using improved sanitation facilities (urban/rural, %) 2015 86.8/83.7Net Official Development Assistance disbursed (% of GNI) 2014 0.1a Excludes irrigation canals and landscaping care. b Excludes publishing activities, includes irrigationcanals. c Excludes repair of personal and household goods. d Includes publishing activities and land-scaping care. e Data classified according to ISIC Rev. 3. f Estimate. g 2013. h Excluding water and wastemanagement. i Break in the time series. j Refugee population relates to the end of 2014. k 2012. l Excludesdata-only subscriptions. m Population age 16-74.
World Statistics Pocketbook 33

Burkina FasoRegion Western Africa Surface area (sq km) 272 967Population (proj., 000) 18 634 Pop. density (per sq km) 68.1Capital city Ouagadougou Capital city pop. (000) 2 741Currency CFA Franc (XOF) UN membership date 20 September 1960Economic indicators 2005 2010 2014GDP: Gross domestic product (million current US$) 5 463 8 980 12 756GDP growth rate (annual %, const. 2005 prices) 8.7 8.5 5.0GDP per capita (current US$) 407.0 574.5 725.2Economy: Agriculture (% of GVA) 38.9 35.6 35.4Economy: Industry (% of GVA) 17.9 23.0 24.2Economy: Services and other activity (% of GVA) 43.1 41.4 40.3Employment: Agriculture (% of employed) a 84.8b 67.4cd ...Employment: Industry (% of employed) a 3.1b 10.1cd ...Employment: Services and other (% of employed) a 12.2b 22.3cd ...Unemployment (% of labour force) e 2.7 3.2 3.0Labour force participation (female/male pop. %) e 76.5/91.0 76.6/91.0 76.7/90.8CPI: Consumer price index (2000=100) f 116 131g 141Agricultural production index (2004-2006=100) 103 116 123h
Food production index (2004-2006=100) 103 123 124h
Balance of payments, current account (million US$) –819 –549 –998Total trade Major trading partners 2015
(million US$)i (% of exports)i (% of imports)i
Exports 2 845.6 Switzerland 50.0 Côte d'Ivoire 16.9Imports 3 575.1 Mali 8.8 Togo 12.1Balance –729.5 Singapore 6.8 France 11.1Social indicatorsPopulation growth rate (average annual %) 2010-2015 2.9Urban population (%) 2015 29.9Urban population growth rate (average annual %) 2010-2015 5.9Fertility rate, total (live births per woman) 2010-2015 5.7Life expectancy at birth (females/males, years) 2010-2015 59.3/56.7Total dependency ratio (Pop. aged 0-14 & 65+ per 100 pop. 15-64) 2015 92International migrant stock (000/% of total pop.) mid-2015 704.7/3.9j
Tourist arrivals at national borders (000) k 2014 191Refugees and others of concern to UNHCR mid-2015 34 207Infant mortality rate (per 1 000 live births) 2010-2015 67Health: Total expenditure (% of GDP) 2014 5.0Education: Government expenditure (% of GDP) 2014 4.5Education: Primary gross enrolment ratio (f/m per 100 pop.) 2014 85.1/88.7Education: Secondary gross enrolment ratio (f/m per 100 pop.) 2014 28.2/32.4Education: Tertiary gross enrolment ratio (f/m per 100 pop.) 2014 3.1/6.4h
Intentional homicide rate (per 100 000 pop.) 2014 0.7l
Seats held by women in national parliaments (%) 2016 9.4Environment and infrastructureMobile-cellular subscriptions (per 100 inhabitants) 2014 71.7Individuals using the Internet (%) 2014 9.4e
Threatened species 2015 29Forested area (% of land area) 2013 20.0e
CO2 emission estimates (000 tons/tons per capita) 2013 3 058/0.2Energy production, primary (Petajoules) 2013 123Energy supply per capita (Gigajoules) 2013 10.0Terrestrial and marine areas protected (% of total area) 2014 15.5Population using improved drinking water sources (urban/rural, %) 2015 97.5/75.8Population using improved sanitation facilities (urban/rural, %) 2015 50.4/6.7Net Official Development Assistance received (% of GNI) 2014 9.0a Data classified according to ISIC Rev. 3. b Break in the time series. c Persons aged 15 to 64 years. d2007. e Estimate. f Ouagadougou. g Series linked to former series. h 2013. i 2014. j Including refugees.k Arrivals of non-resident tourists in hotels and similar establishments. l 2012.
34 World Statistics Pocketbook

BurundiRegion Eastern Africa Surface area (sq km) 27 834Population (proj., 000) 11 553 Pop. density (per sq km) 449.9Capital city Bujumbura Capital city pop. (000) 751Currency Burundi Franc (BIF) UN membership date 18 September 1962Economic indicators 2005 2010 2014GDP: Gross domestic product (million current US$) 1 117 2 032 2 869GDP growth rate (annual %, const. 2005 prices) –0.9 15.7 4.7GDP per capita (current US$) 140.8 214.8 265.2Economy: Agriculture (% of GVA) 43.0 40.7 41.2Economy: Industry (% of GVA) 17.8 16.3 17.9Economy: Services and other activity (% of GVA) 39.2 43.0 40.9Unemployment (% of labour force) a 1.7 1.6 1.6Labour force participation (female/male pop. %) a 84.0/81.8 84.0/81.6 84.6/82.6CPI: Consumer price index (2000=100) b 145 236 344c
Agricultural production index (2004-2006=100) 92 108 129d
Food production index (2004-2006=100) 100 114 145d
Balance of payments, current account (million US$) –222e –301 –253d
Total trade Major trading partners 2015(million US$) (% of exports) (% of imports)
Exports 113.8 Dem. Rep. of Congo 24.9 China 12.6Imports 560.6 Switzerland 19.8 India 12.0Balance –446.8 United Arab Emirates 12.7 United Rep. Tanzania 7.8Social indicatorsPopulation growth rate (average annual %) 2010-2015 3.3Urban population (%) 2015 12.1Urban population growth rate (average annual %) 2010-2015 5.7Fertility rate, total (live births per woman) 2010-2015 6.1Life expectancy at birth (females/males, years) 2010-2015 58.0/54.2Total dependency ratio (Pop. aged 0-14 & 65+ per 100 pop. 15-64) 2015 90International migrant stock (000/% of total pop.) mid-2015 286.8/2.6f
Refugees and others of concern to UNHCR mid-2015 137 710Infant mortality rate (per 1 000 live births) 2010-2015 78Health: Total expenditure (% of GDP) 2014 7.5gh
Education: Government expenditure (% of GDP) 2014 5.4d
Education: Primary gross enrolment ratio (f/m per 100 pop.) 2014 128.4/126.8Education: Secondary gross enrolment ratio (f/m per 100 pop.) 2014 34.8/41.1Education: Tertiary gross enrolment ratio (f/m per 100 pop.) 2014 2.7/6.3d
Intentional homicide rate (per 100 000 pop.) 2014 4.0Seats held by women in national parliaments (%) 2016 36.4Environment and infrastructureMobile-cellular subscriptions (per 100 inhabitants) 2014 30.5Individuals using the Internet (%) 2014 1.4a
Threatened species 2015 60Forested area (% of land area) 2013 10.4a
CO2 emission estimates (000 tons/tons per capita) 2013 293/<Energy production, primary (Petajoules) 2013 54Energy supply per capita (Gigajoules) 2013 6.0Terrestrial and marine areas protected (% of total area) 2014 6.9Population using improved drinking water sources (urban/rural, %) 2015 91.2/73.8Population using improved sanitation facilities (urban/rural, %) 2015 43.8/48.6Net Official Development Assistance received (% of GNI) 2014 16.2a Estimate. b Bujumbura. c Series linked to former series. d 2013. e Break in the time series. f Includingrefugees. g Data revision. h Estimates should be viewed with caution as these are derived from scarcedata.
World Statistics Pocketbook 35

Cabo VerdeRegion Western Africa Surface area (sq km) 4 033Population (proj., 000) 527 Pop. density (per sq km) 130.8Capital city Praia Capital city pop. (000) 145 a
Currency Cabo Verde Escudo (CVE) UN membership date 16 September 1975Economic indicators 2005 2010 2014GDP: Gross domestic product (million current US$) 1 105 1 664 1 855GDP growth rate (annual %, const. 2005 prices) 6.5 1.5 1.8GDP per capita (current US$) 2 331.0 3 393.9 3 609.2Economy: Agriculture (% of GVA) 11.7 9.2 9.4Economy: Industry (% of GVA) 22.8 20.8 20.2Economy: Services and other activity (% of GVA) 65.5 70.1 70.4Unemployment (% of labour force) b 10.9 10.7 10.7Labour force participation (female/male pop. %) b 48.0/82.2 50.9/82.8 52.9/83.9CPI: Consumer price index (2000=100) 105 127 138Agricultural production index (2004-2006=100) 98 113 90c
Food production index (2004-2006=100) 98 113 90c
Balance of payments, current account (million US$) –41 –223 –168Total trade Major trading partners 2015
(million US$) (% of exports) (% of imports)Exports 215.2 Areas nes 28.1d Portugal 43.5Imports 606.3 Portugal 25.3 Netherlands 11.6Balance –391.1 Spain 24.6 Spain 7.3Social indicatorsPopulation growth rate (average annual %) 2010-2015 1.2Urban population (%) 2015 65.5Urban population growth rate (average annual %) 2010-2015 2.0Fertility rate, total (live births per woman) 2010-2015 2.4Life expectancy at birth (females/males, years) 2010-2015 74.7/71.1Total dependency ratio (Pop. aged 0-14 & 65+ per 100 pop. 15-64) 2015 52International migrant stock (000/% of total pop.) mid-2015 14.9/2.9Tourist arrivals at national borders (000) e 2014 494Refugees and others of concern to UNHCR mid-2015 115Infant mortality rate (per 1 000 live births) 2010-2015 20Health: Total expenditure (% of GDP) 2014 4.8Health: Physicians (per 1 000 pop.) 2013 0.3f
Education: Government expenditure (% of GDP) 2014 5.0c
Education: Primary gross enrolment ratio (f/m per 100 pop.) 2014 109.9/116.3Education: Secondary gross enrolment ratio (f/m per 100 pop.) 2014 98.5/86.8Education: Tertiary gross enrolment ratio (f/m per 100 pop.) 2014 26.8/19.1Intentional homicide rate (per 100 000 pop.) 2014 10.6c
Seats held by women in national parliaments (%) 2016 20.8Environment and infrastructureMobile-cellular subscriptions (per 100 inhabitants) 2014 121.8Individuals using the Internet (%) 2014 40.3b
Threatened species 2015 51Forested area (% of land area) 2013 21.8b
CO2 emission estimates (000 tons/tons per capita) 2013 444/0.9Energy production, primary (Petajoules) 2013 1Energy supply per capita (Gigajoules) 2013 15.0Terrestrial and marine areas protected (% of total area) 2014 <Population using improved drinking water sources (urban/rural, %) 2015 94.0/87.3Population using improved sanitation facilities (urban/rural, %) 2015 81.7/54.3Net Official Development Assistance received (% of GNI) 2014 12.9a 2014. b Estimate. c 2013. d See technical notes. e Arrivals of non-resident tourists in hotels and similarestablishments. f 2011.
36 World Statistics Pocketbook

CambodiaRegion South-Eastern Asia Surface area (sq km) 181 035Population (proj., 000) 15 827 Pop. density (per sq km) 89.7Capital city Phnom Penh Capital city pop. (000) 1 731 a
Currency Riel (KHR) UN membership date 14 December 1955Economic indicators 2005 2010 2014GDP: Gross domestic product (million current US$) 6 293 11 242 16 778GDP growth rate (annual %, const. 2005 prices) 13.3 6.0 7.1GDP per capita (current US$) 472.5 782.7 1 094.6Economy: Agriculture (% of GVA) 32.4 36.0 30.5Economy: Industry (% of GVA) 26.4 23.3 27.1Economy: Services and other activity (% of GVA) 41.2 40.7 42.4Employment: Agriculture (% of employed) 53.7bc 54.1de ...Employment: Industry (% of employed) 13.2bc 16.2de ...Employment: Services and other (% of employed) 33.1bc 29.6de ...Unemployment (% of labour force) f 1.1 0.3 0.4Labour force participation (female/male pop. %) f 75.9/86.6 81.6/88.6 75.5/86.6CPI: Consumer price index (2000=100) g 114 165 185h
Agricultural production index (2004-2006=100) 105 148 177h
Food production index (2004-2006=100) 105 148 177h
Balance of payments, current account (million US$) –321d –410 –1 657Total trade Major trading partners 2015
(million US$)i (% of exports)i (% of imports)i
Exports 10 681.4 China, Hong Kong SAR 21.8 China 39.3Imports 18 973.2 United States 18.7 Thailand 10.7Balance –8 291.8 Singapore 16.4 Viet Nam 8.9Social indicatorsPopulation growth rate (average annual %) 2010-2015 1.6Urban population (%) 2015 20.7Urban population growth rate (average annual %) 2010-2015 2.7Fertility rate, total (live births per woman) 2010-2015 2.7Life expectancy at birth (females/males, years) 2010-2015 69.6/65.5Total dependency ratio (Pop. aged 0-14 & 65+ per 100 pop. 15-64) 2015 56International migrant stock (000/% of total pop.) mid-2015 74.0/0.5Tourist arrivals at national borders (000) 2014 4 503j
Refugees and others of concern to UNHCR mid-2015 244Infant mortality rate (per 1 000 live births) 2010-2015 30Health: Total expenditure (% of GDP) 2014 5.7Health: Physicians (per 1 000 pop.) 2013 0.2k
Education: Government expenditure (% of GDP) 2014 2.0h
Education: Primary gross enrolment ratio (f/m per 100 pop.) 2014 113.1/119.6Education: Tertiary gross enrolment ratio (f/m per 100 pop.) 2014 12.1/19.6l
Intentional homicide rate (per 100 000 pop.) 2014 1.8l
Seats held by women in national parliaments (%) 2016 20.3Environment and infrastructureMobile-cellular subscriptions (per 100 inhabitants) 2014 155.1f
Individuals using the Internet (%) 2014 9.0f
Threatened species 2015 243Forested area (% of land area) 2013 55.0f
CO2 emission estimates (000 tons/tons per capita) 2013 5 574/0.4Energy production, primary (Petajoules) 2013 171Energy supply per capita (Gigajoules) 2013 17.0Terrestrial and marine areas protected (% of total area) 2014 20.6Population using improved drinking water sources (urban/rural, %) 2015 100.0/69.1Population using improved sanitation facilities (urban/rural, %) 2015 88.1/30.5Net Official Development Assistance received (% of GNI) 2014 5.0a Refers to the municipality of Phnom Penh including suburban areas. b Data classified according to ISICRev. 2. c 2004. d Break in the time series. e Persons aged 15 to 64 years. f Estimate. g Phnom Penh. h2013. i 2014. j Arrivals by all means of transport. k 2012. l 2011.
World Statistics Pocketbook 37

CameroonRegion Middle Africa Surface area (sq km) 475 650Population (proj., 000) 23 924 Pop. density (per sq km) 50.6Capital city Yaoundé Capital city pop. (000) 3 066Currency CFA Franc (XAF) UN membership date 20 September 1960Economic indicators 2005 2010 2014GDP: Gross domestic product (million current US$) 16 588 23 622 32 051GDP growth rate (annual %, const. 2005 prices) 2.3 3.3 5.9GDP per capita (current US$) 915.1 1 147.2 1 407.4Economy: Agriculture (% of GVA) 20.5 23.3 22.0Economy: Industry (% of GVA) 31.8 29.7 29.9Economy: Services and other activity (% of GVA) 47.8 47.0 48.1Employment: Agriculture (% of employed) a 61.3b ... ...Employment: Industry (% of employed) a 9.1b ... ...Employment: Services and other (% of employed) a 22.6b ... ...Unemployment (% of labour force) c 4.4 4.1 4.4Labour force participation (female/male pop. %) c 67.1/79.5 70.5/81.2 70.9/81.0CPI: Consumer price index (2000=100) 111 129 141Agricultural production index (2004-2006=100) 103 139 154d
Food production index (2004-2006=100) 102 143 159d
Index of industrial production (2005=100) ef 100 102 112g
Balance of payments, current account (million US$) –495 –856 –1 128d
Total trade Major trading partners 2015(million US$)h (% of exports)h (% of imports)h
Exports 5 159.5 Spain 16.7 China 18.0Imports 7 561.1 China 14.7 Nigeria 17.9Balance –2 401.6 Netherlands 10.4 France 10.2Social indicatorsPopulation growth rate (average annual %) 2010-2015 2.5Urban population (%) 2015 54.4Urban population growth rate (average annual %) 2010-2015 3.6Fertility rate, total (live births per woman) 2010-2015 4.8Life expectancy at birth (females/males, years) 2010-2015 56.0/53.7Total dependency ratio (Pop. aged 0-14 & 65+ per 100 pop. 15-64) 2015 84International migrant stock (000/% of total pop.) mid-2015 382.0/1.6Tourist arrivals at national borders (000) 2014 912d
Refugees and others of concern to UNHCR mid-2015 391 821Infant mortality rate (per 1 000 live births) 2010-2015 74Health: Total expenditure (% of GDP) 2014 4.1i
Education: Government expenditure (% of GDP) 2014 3.0d
Education: Primary gross enrolment ratio (f/m per 100 pop.) 2014 106.9/120.1Education: Secondary gross enrolment ratio (f/m per 100 pop.) 2014 51.9/61.0Education: Tertiary gross enrolment ratio (f/m per 100 pop.) 2014 10.1/13.8j
Intentional homicide rate (per 100 000 pop.) 2014 2.7g
Seats held by women in national parliaments (%) 2016 31.1Environment and infrastructureMobile-cellular subscriptions (per 100 inhabitants) 2014 75.7Individuals using the Internet (%) 2014 11.0c
Threatened species 2015 697Forested area (% of land area) 2013 40.7c
CO2 emission estimates (000 tons/tons per capita) 2013 6 813/0.3Energy production, primary (Petajoules) 2013 376Energy supply per capita (Gigajoules) 2013 14.0Terrestrial and marine areas protected (% of total area) 2014 10.7Population using improved drinking water sources (urban/rural, %) 2015 94.8/52.7Population using improved sanitation facilities (urban/rural, %) 2015 61.8/26.8Net Official Development Assistance received (% of GNI) 2014 2.6a Data classified according to ISIC Rev. 2. b 2001. c Estimate. d 2013. e Data classified according to ISICRev. 3. f Data refers to manufacturing and utilities only. g 2012. h 2014. i Data revision. j 2011.
38 World Statistics Pocketbook

CanadaRegion Northern America Surface area (sq km) 9 984 670Population (proj., 000) 36 286 Pop. density (per sq km) 4.0Capital city Ottawa Capital city pop. (000) 1 326 a
Currency Canadian Dollar (CAD) UN membership date 9 November 1945Economic indicators 2005 2010 2014GDP: Gross domestic product (million current US$) 1 164 179 1 614 072 1 785 387GDP growth rate (annual %, const. 2005 prices) 3.2 3.4 2.4GDP per capita (current US$) 36 091.5 47 297.2 50 168.5Economy: Agriculture (% of GVA) 1.8 1.5b 1.7b
Economy: Industry (% of GVA) 32.4 27.7c 28.4c
Economy: Services and other activity (% of GVA) 65.8 70.8de 69.9de
Employment: Agriculture (% of employed) f 2.7 2.2 2.1Employment: Industry (% of employed) f 22.0 19.7 19.8Employment: Services and other (% of employed) f 75.2 78.1 78.2Unemployment (% of labour force) g 6.8 8.1 6.9Labour force participation (female/male pop. %) g 60.9/72.6 61.8/71.5 61.1/70.5CPI: Consumer price index (2000=100) 112 122 131Agricultural production index (2004-2006=100) 102 102 115h
Food production index (2004-2006=100) 102 103 115h
Index of industrial production (2005=100) f 100 88 ...Balance of payments, current account (million US$) 21 910 –56 626 –37 475Total trade Major trading partners 2015
(million US$) (% of exports) (% of imports)Exports 407 140.0 United States 76.7 United States 53.2Imports 418 801.1 China 3.9 China 12.3Balance –11 661.1 United Kingdom 3.1 Mexico 5.8Social indicatorsPopulation growth rate (average annual %) 2010-2015 1.0Urban population (%) 2015 81.8Urban population growth rate (average annual %) 2010-2015 1.2Fertility rate, total (live births per woman) 2010-2015 1.6Life expectancy at birth (females/males, years) 2010-2015 83.8/79.7Total dependency ratio (Pop. aged 0-14 & 65+ per 100 pop. 15-64) 2015 47International migrant stock (000/% of total pop.) mid-2015 7 835.5/21.8Tourist arrivals at national borders (000) 2014 16 537Refugees and others of concern to UNHCR mid-2015 163 644i
Infant mortality rate (per 1 000 live births) 2010-2015 5Health: Total expenditure (% of GDP) 2014 10.5Education: Government expenditure (% of GDP) 2014 5.3j
Education: Primary gross enrolment ratio (f/m per 100 pop.) 2014 101.1/100.1h
Education: Secondary gross enrolment ratio (f/m per 100 pop.) 2014 110.0/109.8h
Intentional homicide rate (per 100 000 pop.) 2014 1.4h
Seats held by women in national parliaments (%) 2016 26.0Environment and infrastructureMobile-cellular subscriptions (per 100 inhabitants) 2014 83.0g
Individuals using the Internet (%) 2014 87.1g
Patents: Resident filings (per million pop.) 2014 118.0Threatened species 2015 97Forested area (% of land area) 2013 38.2g
CO2 emission estimates (000 tons/tons per capita) 2013 475 735/13.5Energy production, primary (Petajoules) 2013 17 868Energy supply per capita (Gigajoules) 2013 296.0Terrestrial and marine areas protected (% of total area) 2014 6.2Population using improved drinking water sources (urban/rural, %) 2015 100.0/99.0Population using improved sanitation facilities (urban/rural, %) 2015 100.0/99.0Net Official Development Assistance disbursed (% of GNI) k 2014 0.2a Refers to Ottawa-Gatineau, the Census Metropolitan Area. b Excludes irrigation canals and landscapingcare. c Excludes publishing activities, includes irrigation canals. d Excludes repair of personal and house-hold goods. e Includes publishing activities and landscaping care. f Data classified according to ISIC Rev.3. g Estimate. h 2013. i Refugee population relates to the end of 2014. j 2011. k Development AssistanceCommittee member (OECD).
World Statistics Pocketbook 39

Cayman IslandsRegion Caribbean Surface area (sq km) 264Population (proj., 000) 61 Pop. density (per sq km) 253.2Capital city George Town Capital city pop. (000) 31 a
Currency Cayman Islands Dollar (KYD)Economic indicators 2005 2010 2014GDP: Gross domestic product (million current US$) 3 042 3 267 3 480GDP growth rate (annual %, const. 2005 prices) 6.5 –2.7 –1.3GDP per capita (current US$) 62 558.1 58 856.7 58 808.2Economy: Agriculture (% of GVA) b 0.2 0.3 0.3Economy: Industry (% of GVA) c 9.1 7.7 7.5Economy: Services and other activity (% of GVA) de 90.7 92.0 92.2Employment: Agriculture (% of employed) 1.7f 0.6g 0.8gh
Employment: Industry (% of employed) 22.2f 14.9g 15.5gh
Employment: Services and other (% of employed) 75.5f 84.2g 83.6gh
Unemployment (% of labour force) 3.5 6.7 6.3h
Labour force participation (female/male pop. %) ... 80.6/88.0gij 80.6/85.6h
CPI: Consumer price index (2000=100) 117 125 132Agricultural production index (2004-2006=100) 94 105 113h
Food production index (2004-2006=100) 94 105 113h
Total trade Major trading partners 2015(million US$)h (% of exports) (% of imports)h
Imports 929.3 ... United States 41.7... Jamaica 9.0... Panama 5.2
Social indicatorsPopulation growth rate (average annual %) 2010-2015 1.6Urban population (%) 2015 100.0Urban population growth rate (average annual %) 2010-2015 1.5Life expectancy at birth (females/males, years) 2010-2015 83.8/76.3k
Total dependency ratio (Pop. aged 0-14 & 65+ per 100 pop. 15-64) 2015 31h
International migrant stock (000/% of total pop.) mid-2015 23.7/39.6l
Tourist arrivals at national borders (000) 2014 383m
Refugees and others of concern to UNHCR mid-2015 107Environment and infrastructureMobile-cellular subscriptions (per 100 inhabitants) 2014 153.8n
Individuals using the Internet (%) 2014 74.1o
Threatened species 2015 71Forested area (% of land area) 2013 52.9o
CO2 emission estimates (000 tons/tons per capita) 2013 539/9.2Energy supply per capita (Gigajoules) 2013 131.0Terrestrial and marine areas protected (% of total area) 2014 1.5Population using improved drinking water sources (urban/rural, %) 2015 97.4/...Population using improved sanitation facilities (urban/rural, %) 2015 95.6/...a 2014. b Excludes irrigation canals and landscaping care. c Excludes publishing activities, includesirrigation canals. d Excludes repair of personal and household goods. e Includes publishing activities andlandscaping care. f Data classified according to ISIC Rev. 3. g Break in the time series. h 2013. i Residentpopulation (de jure). j 2009. k 2006 and are based on a small number of deaths. l Refers to foreign citizens.m Arrivals by air. n Data refers to number of mobile handsets in operation. o Estimate.
40 World Statistics Pocketbook

Central African RepublicRegion Middle Africa Surface area (sq km) 622 984Population (proj., 000) 4 999 Pop. density (per sq km) 8.0Capital city Bangui Capital city pop. (000) 794Currency CFA Franc (XAF) UN membership date 20 September 1960Economic indicators 2005 2010 2014GDP: Gross domestic product (million current US$) 1 413 2 034 1 838GDP growth rate (annual %, const. 2005 prices) 2.4 3.6 1.0GDP per capita (current US$) 348.4 457.6 382.6Economy: Agriculture (% of GVA) 45.0 41.2 41.9Economy: Industry (% of GVA) 18.6 24.0 23.9Economy: Services and other activity (% of GVA) 36.5 34.8 34.3Unemployment (% of labour force) a 7.7 7.7 7.6Labour force participation (female/male pop. %) a 69.9/85.7 69.8/85.2 71.6/84.6CPI: Consumer price index (2000=100) bc 112 138 150d
Agricultural production index (2004-2006=100) 99 114 123d
Food production index (2004-2006=100) 99 113 121d
Index of industrial production (2005=100) ef 100 126 86d
Total trade Major trading partners 2015(million US$)g (% of exports)g (% of imports)g
Exports 20.7 China 37.7 France 21.5Imports 308.0 Germany 33.3 United States 9.4Balance –287.3 France 20.8 Belgium 9.4Social indicatorsPopulation growth rate (average annual %) 2010-2015 2.0Urban population (%) 2015 40.0Urban population growth rate (average annual %) 2010-2015 2.6Fertility rate, total (live births per woman) 2010-2015 4.4Life expectancy at birth (females/males, years) 2010-2015 51.3/47.8Total dependency ratio (Pop. aged 0-14 & 65+ per 100 pop. 15-64) 2015 75International migrant stock (000/% of total pop.) mid-2015 81.6/1.7h
Tourist arrivals at national borders (000) 2014 71ij
Refugees and others of concern to UNHCR mid-2015 517 204Infant mortality rate (per 1 000 live births) 2010-2015 93Health: Total expenditure (% of GDP) 2014 4.2k
Education: Government expenditure (% of GDP) 2014 1.2l
Education: Primary gross enrolment ratio (f/m per 100 pop.) 2014 79.8/107.3i
Education: Secondary gross enrolment ratio (f/m per 100 pop.) 2014 11.8/23.0i
Education: Tertiary gross enrolment ratio (f/m per 100 pop.) 2014 1.5/4.1i
Intentional homicide rate (per 100 000 pop.) 2014 13.2i
Environment and infrastructureMobile-cellular subscriptions (per 100 inhabitants) 2014 31.4a
Individuals using the Internet (%) 2014 4.0a
Threatened species 2015 54Forested area (% of land area) 2013 35.6a
CO2 emission estimates (000 tons/tons per capita) 2013 297/0.1Energy production, primary (Petajoules) 2013 19Energy supply per capita (Gigajoules) 2013 5.0Terrestrial and marine areas protected (% of total area) 2014 18.1Population using improved drinking water sources (urban/rural, %) 2015 89.6/54.4Population using improved sanitation facilities (urban/rural, %) 2015 43.6/7.2Net Official Development Assistance received (% of GNI) 2014 34.1a Estimate. b Excluding ̀ Rent´. c Bangui. d 2013. e Data classified according to ISIC Rev. 3. f Country datasupplemented with data from the Observatoire Economique et Statistique d’Afrique Subsaharienne (Af-ristat). g 2014. h Refers to foreign citizens. i 2012. j Arrivals by air to Bangui only. k Estimates should beviewed with caution as these are derived from scarce data. l 2011.
World Statistics Pocketbook 41

ChadRegion Middle Africa Surface area (sq km) 1 284 000Population (proj., 000) 14 497 Pop. density (per sq km) 11.5Capital city N'Djamena Capital city pop. (000) 1 260Currency CFA Franc (XAF) UN membership date 20 September 1960Economic indicators 2005 2010 2014GDP: Gross domestic product (million current US$) 6 681 9 791 12 791GDP growth rate (annual %, const. 2005 prices) 7.9 13.4 10.4GDP per capita (current US$) 663.6 823.0 941.4Economy: Agriculture (% of GVA) 26.1 35.9 24.4Economy: Industry (% of GVA) 34.9 36.7 40.0Economy: Services and other activity (% of GVA) 39.0 27.4 35.5Unemployment (% of labour force) a 5.6 5.5 5.6Labour force participation (female/male pop. %) a 64.2/79.5 64.1/79.3 64.0/79.3CPI: Consumer price index (2000=100) b 126 147 161c
Agricultural production index (2004-2006=100) 104 104 115c
Food production index (2004-2006=100) 104 110 120c
Index of industrial production (2005=100) de 100 79 65c
Social indicatorsPopulation growth rate (average annual %) 2010-2015 3.3Urban population (%) 2015 22.5Urban population growth rate (average annual %) 2010-2015 3.4Fertility rate, total (live births per woman) 2010-2015 6.3Life expectancy at birth (females/males, years) 2010-2015 52.2/50.1Total dependency ratio (Pop. aged 0-14 & 65+ per 100 pop. 15-64) 2015 101International migrant stock (000/% of total pop.) mid-2015 517.0/3.7f
Tourist arrivals at national borders (000) 2014 122Refugees and others of concern to UNHCR mid-2015 473 523Infant mortality rate (per 1 000 live births) 2010-2015 96Health: Total expenditure (% of GDP) 2014 3.6gh
Education: Government expenditure (% of GDP) 2014 2.9c
Education: Primary gross enrolment ratio (f/m per 100 pop.) 2014 88.0/114.6c
Education: Secondary gross enrolment ratio (f/m per 100 pop.) 2014 14.0/30.7i
Education: Tertiary gross enrolment ratio (f/m per 100 pop.) 2014 1.1/5.7a
Intentional homicide rate (per 100 000 pop.) 2014 9.2i
Seats held by women in national parliaments (%) 2016 14.9Environment and infrastructureMobile-cellular subscriptions (per 100 inhabitants) 2014 39.8Individuals using the Internet (%) 2014 2.5a
Threatened species 2015 38Forested area (% of land area) 2013 4.1a
CO2 emission estimates (000 tons/tons per capita) 2013 609/<Energy production, primary (Petajoules) 2013 275Energy supply per capita (Gigajoules) 2013 6.0Terrestrial and marine areas protected (% of total area) 2014 17.8Population using improved drinking water sources (urban/rural, %) 2015 71.8/44.8Population using improved sanitation facilities (urban/rural, %) 2015 31.4/6.5Net Official Development Assistance received (% of GNI) 2014 2.9a Estimate. b N'Djamena. c 2013. d Data classified according to ISIC Rev. 3. e Country data supplementedwith data from the Observatoire Economique et Statistique d’Afrique Subsaharienne (Afristat). f Includingrefugees. g Estimates should be viewed with caution as these are derived from scarce data. h NationalAccounts: The authorities have revised national accounts estimates, moving from the 1968 to the 1993SNA. IMF country report 11/302. i 2012.
42 World Statistics Pocketbook

Channel IslandsRegion Northern Europe Surface area (sq km) 180 a
Population (proj., 000) 165 a Pop. density (per sq km) 865.6 a
Capital city Saint Helier b Capital city pop. (000) 35 cd
Currency Pound Sterling (GBP)Economic indicators 2005 2010 2014Unemployment (% of labour force) e 4.2 4.3 4.6Labour force participation (female/male pop. %) e 51.1/68.8 52.2/67.0 50.6/66.2Social indicatorsPopulation growth rate (average annual %) 2010-2015 0.5a
Urban population (%) 2015 31.5a
Urban population growth rate (average annual %) 2010-2015 0.8a
Fertility rate, total (live births per woman) 2010-2015 1.5a
Life expectancy at birth (females/males, years) 2010-2015 82.4/78.5a
Total dependency ratio (Pop. aged 0-14 & 65+ per 100 pop. 15-64) 2015 47a
International migrant stock (000/% of total pop.) mid-2015 82.3/50.3a
Infant mortality rate (per 1 000 live births) 2010-2015 8a
Environment and infrastructureForested area (% of land area) 2013 4.2e
a Refers to Guernsey and Jersey. b St.Helier is the capital of the Bailiwick of Jersey. c 2014. d Data referto the parish of St. Helier, the capital of the Bailiwick of Jersey. e Estimate.
World Statistics Pocketbook 43

ChileRegion South America Surface area (sq km) 756 102Population (proj., 000) 18 132 Pop. density (per sq km) 24.4Capital city Santiago Capital city pop. (000) 6 507Currency Chilean Peso (CLP) UN membership date 24 October 1945Economic indicators 2005 2010 2014GDP: Gross domestic product (million current US$) 123 056 217 538 258 062GDP growth rate (annual %, const. 2005 prices) 6.2 5.8 1.9GDP per capita (current US$) 7 644.9 12 785.1 14 528.3Economy: Agriculture (% of GVA) a 4.1 3.5 3.3Economy: Industry (% of GVA) a 40.3 39.6 35.1Economy: Services and other activity (% of GVA) a 55.6 57.0 61.5Employment: Agriculture (% of employed) bc 14.8 11.1 9.2d
Employment: Industry (% of employed) bc 41.8 23.6 23.7d
Employment: Services and other (% of employed) bc 43.5 65.3 67.1d
Unemployment (% of labour force) e 8.0 8.1 6.4Labour force participation (female/male pop. %) e 38.2/73.1 46.8/74.7 50.6/74.5CPI: Consumer price index (2000=100) 114f 101bg 115gh
Agricultural production index (2004-2006=100) 100 109 117d
Food production index (2004-2006=100) 100 109 117d
Balance of payments, current account (million US$) 1 449 3 581 –2 995Total trade Major trading partners 2015
(million US$) (% of exports) (% of imports)Exports 63 360.1 China 26.3 China 23.5Imports 63 037.6 United States 13.0 United States 18.7Balance 322.5 Japan 8.6 Brazil 7.7Social indicatorsPopulation growth rate (average annual %) 2010-2015 1.1Urban population (%) 2015 89.5Urban population growth rate (average annual %) 2010-2015 1.1Fertility rate, total (live births per woman) 2010-2015 1.8Life expectancy at birth (females/males, years) 2010-2015 84.1/78.1Total dependency ratio (Pop. aged 0-14 & 65+ per 100 pop. 15-64) 2015 45International migrant stock (000/% of total pop.) mid-2015 469.4/2.6Tourist arrivals at national borders (000) 2014 3 674i
Refugees and others of concern to UNHCR mid-2015 2 517Infant mortality rate (per 1 000 live births) 2010-2015 7Health: Total expenditure (% of GDP) 2014 7.8Education: Government expenditure (% of GDP) 2014 4.6d
Education: Primary gross enrolment ratio (f/m per 100 pop.) 2014 98.9/102.1Education: Secondary gross enrolment ratio (f/m per 100 pop.) 2014 101.2/99.6Education: Tertiary gross enrolment ratio (f/m per 100 pop.) 2014 92.3/81.3Intentional homicide rate (per 100 000 pop.) 2014 3.6Seats held by women in national parliaments (%) 2016 15.8Environment and infrastructureMobile-cellular subscriptions (per 100 inhabitants) 2014 133.3Individuals using the Internet (%) 2014 72.4e
Patents: Resident filings (per million pop.) 2014 25.0Threatened species 2015 182Forested area (% of land area) 2013 23.0e
CO2 emission estimates (000 tons/tons per capita) 2013 83 171/4.7Energy production, primary (Petajoules) 2013 626Energy supply per capita (Gigajoules) 2013 92.0Terrestrial and marine areas protected (% of total area) 2014 6.9Population using improved drinking water sources (urban/rural, %) 2015 99.7/93.3Population using improved sanitation facilities (urban/rural, %) 2015 100.0/90.9Net Official Development Assistance received (% of GNI) 2014 0.1a At producers' prices. b Break in the time series. c Data classified according to ISIC Rev. 3. d 2013. eEstimate. f Santiago. g Index base: 2009=100. h Series linked to former series. i Including nationalsresiding abroad.
44 World Statistics Pocketbook

ChinaaRegion Eastern Asia Surface area (sq km) 9 596 961Population (proj., 000) 1 382 323 Pop. density (per sq km) 147.2Capital city Beijing Capital city pop. (000) 20 384Currency Yuan Renminbi (CNY) UN membership date 24 October 1945Economic indicators 2005 2010 2014GDP: Gross domestic product (million current US$) 2 291 432 6 005 388 10 430 590GDP growth rate (annual %, const. 2005 prices) 11.3 10.6 7.3GDP per capita (current US$) 1 755.1 4 478.4 7 616.7Economy: Agriculture (% of GVA) b 12.1 9.9 9.5Economy: Industry (% of GVA) b 47.0 46.4 42.9Economy: Services and other activity (% of GVA) b 40.9 43.7 47.7Employment: Agriculture (% of employed) c 3.9de 2.9f 2.5g
Employment: Industry (% of employed) c 43.4de 44.3f 46.9g
Employment: Services and other (% of employed) c 49.5de 48.8f 47.0g
Unemployment (% of labour force) h 4.1 4.2 4.6Labour force participation (female/male pop. %) h 66.9/79.8 63.7/77.8 63.7/77.9CPI: Consumer price index (2000=100) i 107 124 140Agricultural production index (2004-2006=100) 100 120 131j
Food production index (2004-2006=100) 100 120 132j
Balance of payments, current account (million US$) 132 378f 237 810 219 678Total trade Major trading partners 2015
(million US$) (% of exports) (% of imports)Exports 2 281 856.0 United States 18.0 Republic of Korea 10.4Imports 1 681 670.8 China, Hong Kong SAR 14.7 United States 9.0Balance 600 185.3 Japan 6.0 Asia nes 8.6k
Social indicatorsPopulation growth rate (average annual %) 2010-2015 0.5Urban population (%) 2015 55.6Urban population growth rate (average annual %) 2010-2015 3.1Fertility rate, total (live births per woman) 2010-2015 1.6Life expectancy at birth (females/males, years) 2010-2015 77.0/74.0Total dependency ratio (Pop. aged 0-14 & 65+ per 100 pop. 15-64) 2015 37International migrant stock (000/% of total pop.) mid-2015 978.1/0.1lm
Tourist arrivals at national borders (000) 2014 55 622m
Refugees and others of concern to UNHCR mid-2015 301 621n
Infant mortality rate (per 1 000 live births) 2010-2015 12Health: Total expenditure (% of GDP) 2014 5.6Health: Physicians (per 1 000 pop.) 2013 1.5g
Education: Primary gross enrolment ratio (f/m per 100 pop.) 2014 104.0/103.8Education: Secondary gross enrolment ratio (f/m per 100 pop.) 2014 95.4/93.4Education: Tertiary gross enrolment ratio (f/m per 100 pop.) 2014 42.5/36.6Intentional homicide rate (per 100 000 pop.) 2014 0.8o
Seats held by women in national parliaments (%) 2016 23.6Environment and infrastructureMobile-cellular subscriptions (per 100 inhabitants) 2014 92.3Individuals using the Internet (%) 2014 49.3h
Patents: Resident filings (per million pop.) 2014 587.0Threatened species 2015 1 040Forested area (% of land area) 2013 21.9h
CO2 emission estimates (000 tons/tons per capita) 2013 10 249 463/7.5Energy production, primary (Petajoules) 2013 108 185Energy supply per capita (Gigajoules) 2013 93.0Terrestrial and marine areas protected (% of total area) 2014 15.6Population using improved drinking water sources (urban/rural, %) 2015 97.5/93.0Population using improved sanitation facilities (urban/rural, %) 2015 86.6/63.7Net Official Development Assistance received (% of GNI) 2014 –<a For statistical purposes, the data for China do not include Hong Kong SAR, Macao SAR or TaiwanProvince of China, unless otherwise indicated. b At producers' prices. c Persons aged 16 years and over.d Data classified according to ISIC Rev. 3. e Urban areas. f Break in the time series. g 2011. h Estimate.i Index base period: the same month of 2000=100. j 2013. k See technical notes. l Refers to foreign citizens.m For statistical purposes, the data for China do not include those for the Hong Kong Special Adminis-trative Region (Hong Kong SAR), Macao Special Administrative Region (Macao SAR) and Taiwan Provinceof China. n The 300,000 Vietnamese refugees are well integrated and in practice receive protection fromthe Government of China. o 2012.
World Statistics Pocketbook 45

China, Hong Kong SARRegion Eastern Asia Surface area (sq km) 1 106Population (proj., 000) 7 346 Pop. density (per sq km) 6 996.4Capital city Hong Kong Capital city pop. (000) 7 314 a
Currency Hong Kong Dollar (HKD)Economic indicators 2005 2010 2014GDP: Gross domestic product (million current US$) 181 569 228 639 290 896GDP growth rate (annual %, const. 2005 prices) 7.4 6.8 2.5GDP per capita (current US$) 26 535.7 32 692.7 40 252.1Economy: Agriculture (% of GVA) b 0.1 0.1 0.1Economy: Industry (% of GVA) 8.7 7.0 7.3Economy: Services and other activity (% of GVA) c 91.3 93.0 92.7Employment: Agriculture (% of employed) 0.3de ... ...Employment: Industry (% of employed) 15.1de 11.4fg 11.7g
Employment: Services and other (% of employed) 84.7de 80.1fg 79.9g
Unemployment (% of labour force) h 5.6 4.3 3.3Labour force participation (female/male pop. %) h 51.7/71.3 51.8/68.5 53.7/68.8CPI: Consumer price index (2000=100) 94 104 119i
Agricultural production index (2004-2006=100) 99 56 60i
Food production index (2004-2006=100) 99 56 60i
Balance of payments, current account (million US$) 21 575 16 012 3 788Total trade Major trading partners 2015
(million US$) (% of exports) (% of imports)Exports 498 557.6 China 56.8 China 47.1Imports 547 568.5 United States 8.6 Asia nes 6.5j
Balance –49 010.9 Japan 3.0 Japan 6.2Social indicatorsPopulation growth rate (average annual %) 2010-2015 0.8Urban population (%) 2015 100.0Urban population growth rate (average annual %) 2010-2015 0.7Fertility rate, total (live births per woman) 2010-2015 1.2Life expectancy at birth (females/males, years) 2010-2015 86.6/80.9Total dependency ratio (Pop. aged 0-14 & 65+ per 100 pop. 15-64) 2015 37International migrant stock (000/% of total pop.) mid-2015 2 838.7/39.0Tourist arrivals at national borders (000) 2014 27 770Refugees and others of concern to UNHCR mid-2015 10 092Infant mortality rate (per 1 000 live births) 2010-2015 2Education: Government expenditure (% of GDP) 2014 3.6Education: Primary gross enrolment ratio (f/m per 100 pop.) 2014 110.4/111.7Education: Secondary gross enrolment ratio (f/m per 100 pop.) 2014 98.6/102.5Education: Tertiary gross enrolment ratio (f/m per 100 pop.) 2014 73.8/64.0Intentional homicide rate (per 100 000 pop.) 2014 0.9i
Environment and infrastructureMobile-cellular subscriptions (per 100 inhabitants) 2014 239.3Individuals using the Internet (%) 2014 74.6h
Patents: Resident filings (per million pop.) 2014 27.0Threatened species 2015 60CO2 emission estimates (000 tons/tons per capita) 2013 44 994/6.3Energy supply per capita (Gigajoules) 2013 82.0Terrestrial and marine areas protected (% of total area) 2014 41.8a Consists of the population of Hong Kong Island, New Kowloon the new towns in New Territories andthe marine areas. b Excludes hunting and forestry. c Excludes waste management. d Data classifiedaccording to ISIC Rev. 2. e Excluding marine and institutional populations. f Break in the time series. gExcluding the institutional population. h Estimate. i 2013. j See technical notes.
46 World Statistics Pocketbook

China, Macao SARRegion Eastern Asia Surface area (sq km) 30Population (proj., 000) 597 Pop. density (per sq km) 19 970.8Capital city Macao Capital city pop. (000) 584Currency Pataca (MOP)Economic indicators 2005 2010 2014GDP: Gross domestic product (million current US$) 11 793 28 360 55 502GDP growth rate (annual %, const. 2005 prices) 8.6 27.5 –0.4GDP per capita (current US$) 25 189.8 53 046.0 96 037.7Economy: Industry (% of GVA) 15.2 7.3 6.1Economy: Services and other activity (% of GVA) 84.8 92.7 93.9Employment: Agriculture (% of employed) a 0.1b 0.2cde 0.0cd
Employment: Industry (% of employed) a 25.0b 13.7cde 15.7cd
Employment: Services and other (% of employed) a 74.7b 86.1cde 84.3cd
Unemployment (% of labour force) f 4.2 2.8 1.7Labour force participation (female/male pop. %) f 59.0/74.3 65.5/77.1 66.3/76.4CPI: Consumer price index (2000=100) 99 124 156g
Agricultural production index (2004-2006=100) 100 95 88h
Food production index (2004-2006=100) 100 95 88h
Index of industrial production (2005=100) ai 100 45 42j
Balance of payments, current account (million US$) 2 965 12 092 21 082Total trade Major trading partners 2015
(million US$) (% of exports) (% of imports)Exports 1 339.0 China, Hong Kong SAR 47.9 China, Hong Kong SAR 80.3Imports 10 602.6 Areas nes 36.3k China 15.0Balance –9 263.6 China 12.6 United States 1.0Social indicatorsPopulation growth rate (average annual %) 2010-2015 1.9Urban population (%) 2015 100.0Urban population growth rate (average annual %) 2010-2015 1.8Fertility rate, total (live births per woman) 2010-2015 1.2Life expectancy at birth (females/males, years) 2010-2015 82.5/78.1Total dependency ratio (Pop. aged 0-14 & 65+ per 100 pop. 15-64) 2015 28International migrant stock (000/% of total pop.) mid-2015 342.7/58.3Tourist arrivals at national borders (000) 2014 14 566fl
Refugees and others of concern to UNHCR mid-2015 6Infant mortality rate (per 1 000 live births) 2010-2015 4Education: Government expenditure (% of GDP) 2014 2.1h
Education: Secondary gross enrolment ratio (f/m per 100 pop.) 2014 95.0/97.0Education: Tertiary gross enrolment ratio (f/m per 100 pop.) 2014 78.7/60.2Intentional homicide rate (per 100 000 pop.) 2014 1.0Environment and infrastructureMobile-cellular subscriptions (per 100 inhabitants) 2014 322.6Individuals using the Internet (%) 2014 69.8m
Patents: Resident filings (per million pop.) 2014 3.0Threatened species 2015 11CO2 emission estimates (000 tons/tons per capita) 2013 2 167/3.8Energy production, primary (Petajoules) 2013 2f
Energy supply per capita (Gigajoules) 2013 83.0a Data classified according to ISIC Rev. 3. b Persons aged 14 years and over. c Break in the time series.d Persons aged 16 years and over. e Agriculture includes mining and quarrying. f Estimate. g Series linkedto former series. h 2013. i Data refers to manufacturing and utilities only. j 2012. k See technical notes.l Does not include other non-residents namely workers, students, etc. m Population age 3+.
World Statistics Pocketbook 47

ColombiaRegion South America Surface area (sq km) 1 141 748Population (proj., 000) 48 654 Pop. density (per sq km) 43.9Capital city Bogota Capital city pop. (000) 9 765 a
Currency Colombian Peso (COP) UN membership date 5 November 1945Economic indicators 2005 2010 2014GDP: Gross domestic product (million current US$) 146 566 287 018 377 740GDP growth rate (annual %, const. 2005 prices) 4.7 4.0 4.6GDP per capita (current US$) 3 386.0 6 250.7 7 903.9Economy: Agriculture (% of GVA) 8.4 7.1 6.4Economy: Industry (% of GVA) 32.8 35.0 36.6Economy: Services and other activity (% of GVA) 58.8 57.9 57.1Employment: Agriculture (% of employed) b 21.8c 18.5defg 16.3d
Employment: Industry (% of employed) b 19.3c 19.8defg 19.6d
Employment: Services and other (% of employed) b 58.9c 61.7defg 64.1d
Unemployment (% of labour force) h 12.0 12.0 9.1Labour force participation (female/male pop. %) h 53.0/81.2 55.5/80.3 57.9/79.8CPI: Consumer price index (2000=100) i 140 177 200Agricultural production index (2004-2006=100) 99 101 114j
Food production index (2004-2006=100) 99 103 115j
Balance of payments, current account (million US$) –1 892 –8 663 –19 567Total trade Major trading partners 2015
(million US$) (% of exports) (% of imports)Exports 35 690.8 United States 28.2 United States 28.8Imports 54 035.5 Panama 6.7 China 18.6Balance –18 344.7 China 6.3 Mexico 7.1Social indicatorsPopulation growth rate (average annual %) 2010-2015 1.0Urban population (%) 2015 76.4Urban population growth rate (average annual %) 2010-2015 1.7Fertility rate, total (live births per woman) 2010-2015 1.9Life expectancy at birth (females/males, years) 2010-2015 77.4/70.2Total dependency ratio (Pop. aged 0-14 & 65+ per 100 pop. 15-64) 2015 46International migrant stock (000/% of total pop.) mid-2015 133.1/0.3Tourist arrivals at national borders (000) 2014 2 565Refugees and others of concern to UNHCR mid-2015 6 520 579Infant mortality rate (per 1 000 live births) 2010-2015 18Health: Total expenditure (% of GDP) 2014 7.2k
Education: Government expenditure (% of GDP) 2014 4.7Education: Primary gross enrolment ratio (f/m per 100 pop.) 2014 111.7/115.7Education: Secondary gross enrolment ratio (f/m per 100 pop.) 2014 102.6/95.1Education: Tertiary gross enrolment ratio (f/m per 100 pop.) 2014 54.8/47.9Intentional homicide rate (per 100 000 pop.) 2014 27.9Seats held by women in national parliaments (%) 2016 19.9Environment and infrastructureMobile-cellular subscriptions (per 100 inhabitants) 2014 113.1Individuals using the Internet (%) 2014 52.6l
Patents: Resident filings (per million pop.) 2014 5.0Threatened species 2015 751Forested area (% of land area) 2013 52.8h
CO2 emission estimates (000 tons/tons per capita) 2013 89 625/1.9Energy production, primary (Petajoules) 2013 5 700Energy supply per capita (Gigajoules) 2013 32.0Terrestrial and marine areas protected (% of total area) 2014 17.4Population using improved drinking water sources (urban/rural, %) 2015 96.8/73.8Population using improved sanitation facilities (urban/rural, %) 2015 85.2/68.0Net Official Development Assistance received (% of GNI) 2014 0.3a Refers to the nuclei of Santa Fe de Bogotá, Soacha, Chia and Funza. b Data classified according to ISICRev. 3. c Persons aged 10 years and over. d Break in the time series. e Excluding the institutional popu-lation. f Persons aged 12 years and over. g Age 10+ in rural areas. h Estimate. i Low income group. j 2013.k Data revision. l Population age 5+.
48 World Statistics Pocketbook

ComorosRegion Eastern Africa Surface area (sq km) 2 235Population (proj., 000) 807 Pop. density (per sq km) 433.7Capital city Moroni Capital city pop. (000) 56 a
Currency Comorian Franc (KMF) UN membership date 12 November 1975Economic indicators 2005 2010 2014GDP: Gross domestic product (million current US$) 386 530 648GDP growth rate (annual %, const. 2005 prices) 2.8 2.2 3.0GDP per capita (current US$) 623.6 759.3 841.2Economy: Agriculture (% of GVA) 41.0 38.5 33.6Economy: Industry (% of GVA) 11.8 11.5 10.6Economy: Services and other activity (% of GVA) 47.3 50.0 55.8Unemployment (% of labour force) b 19.7 19.4 19.4Labour force participation (female/male pop. %) b 32.2/78.7 34.1/79.0 35.1/79.3Agricultural production index (2004-2006=100) 96 114 114c
Food production index (2004-2006=100) 96 114 113c
Balance of payments, current account (million US$) –29 –91 –44d
Total trade Major trading partners 2015(million US$)c (% of exports)c (% of imports)c
Exports 10.1 France 34.7 France 21.6Imports 115.2 Singapore 12.9 United Arab Emirates 21.0Balance –105.1 Netherlands 11.9 Madagascar 13.0Social indicatorsPopulation growth rate (average annual %) 2010-2015 2.4Urban population (%) 2015 28.3Urban population growth rate (average annual %) 2010-2015 2.7Fertility rate, total (live births per woman) 2010-2015 4.6Life expectancy at birth (females/males, years) 2010-2015 64.5/61.2Total dependency ratio (Pop. aged 0-14 & 65+ per 100 pop. 15-64) 2015 76International migrant stock (000/% of total pop.) mid-2015 12.6/1.6Infant mortality rate (per 1 000 live births) 2010-2015 58Health: Total expenditure (% of GDP) 2014 6.8Education: Government expenditure (% of GDP) 2014 5.1d
Education: Primary gross enrolment ratio (f/m per 100 pop.) 2014 102.1/108.3c
Education: Secondary gross enrolment ratio (f/m per 100 pop.) 2014 60.5/58.3c
Education: Tertiary gross enrolment ratio (f/m per 100 pop.) 2014 8.0/9.8Intentional homicide rate (per 100 000 pop.) 2014 7.8d
Seats held by women in national parliaments (%) 2016 3.0Environment and infrastructureMobile-cellular subscriptions (per 100 inhabitants) 2014 50.9b
Individuals using the Internet (%) 2014 7.0b
Threatened species 2015 106Forested area (% of land area) 2013 20.3b
CO2 emission estimates (000 tons/tons per capita) 2013 161/0.2Energy production, primary (Petajoules) 2013 3Energy supply per capita (Gigajoules) 2013 7.0b
Terrestrial and marine areas protected (% of total area) 2014 2.4Population using improved drinking water sources (urban/rural, %) 2015 92.6/89.1Population using improved sanitation facilities (urban/rural, %) 2015 48.3/30.9Net Official Development Assistance received (% of GNI) 2014 11.5a 2014. b Estimate. c 2013. d 2012.
World Statistics Pocketbook 49

CongoRegion Middle Africa Surface area (sq km) 342 000Population (proj., 000) 4 741 Pop. density (per sq km) 13.9Capital city Brazzaville Capital city pop. (000) 1 888Currency CFA Franc (XAF) UN membership date 20 September 1960Economic indicators 2005 2010 2014GDP: Gross domestic product (million current US$) 6 087 12 281 14 077GDP growth rate (annual %, const. 2005 prices) 7.7 8.7 6.8GDP per capita (current US$) 1 737.6 3 020.4 3 124.8Economy: Agriculture (% of GVA) 4.6 3.7 5.1Economy: Industry (% of GVA) 73.4 78.1 70.9Economy: Services and other activity (% of GVA) 22.0 18.2 24.0Employment: Agriculture (% of employed) a 35.4 ... ...Employment: Industry (% of employed) a 20.6 ... ...Employment: Services and other (% of employed) a 42.2 ... ...Unemployment (% of labour force) b 7.3 7.2 7.2Labour force participation (female/male pop. %) b 67.4/71.6 67.5/72.3 67.1/72.6CPI: Consumer price index (2000=100) cd 110 139e 154f
Agricultural production index (2004-2006=100) 100 123 136f
Food production index (2004-2006=100) 100 123 136f
Balance of payments, current account (million US$) 696 ... ...Total trade Major trading partners 2015
(million US$)g (% of exports)g (% of imports)g
Exports 6 550.0 China 34.9 France 17.2Imports 3 347.7 Australia 9.0 China 15.4Balance 3 202.3 Gabon 8.3 Belgium 13.5Social indicatorsPopulation growth rate (average annual %) 2010-2015 2.6Urban population (%) 2015 65.4Urban population growth rate (average annual %) 2010-2015 3.2Fertility rate, total (live births per woman) 2010-2015 5.0Life expectancy at birth (females/males, years) 2010-2015 62.9/60.0Total dependency ratio (Pop. aged 0-14 & 65+ per 100 pop. 15-64) 2015 86International migrant stock (000/% of total pop.) mid-2015 393.0/8.5Tourist arrivals at national borders (000) 2014 373h
Refugees and others of concern to UNHCR mid-2015 65 810Infant mortality rate (per 1 000 live births) 2010-2015 51Health: Total expenditure (% of GDP) 2014 5.2Education: Primary gross enrolment ratio (f/m per 100 pop.) 2014 114.8/107.0i
Education: Secondary gross enrolment ratio (f/m per 100 pop.) 2014 50.6/58.4i
Education: Tertiary gross enrolment ratio (f/m per 100 pop.) 2014 8.3/11.1f
Intentional homicide rate (per 100 000 pop.) 2014 10.5i
Seats held by women in national parliaments (%) 2016 7.4Environment and infrastructureMobile-cellular subscriptions (per 100 inhabitants) 2014 108.2b
Individuals using the Internet (%) 2014 7.1b
Threatened species 2015 119Forested area (% of land area) 2013 65.5b
CO2 emission estimates (000 tons/tons per capita) 2013 2 483/0.6Energy production, primary (Petajoules) 2013 619Energy supply per capita (Gigajoules) 2013 23.0Terrestrial and marine areas protected (% of total area) 2014 31.8Population using improved drinking water sources (urban/rural, %) 2015 95.8/40.0Population using improved sanitation facilities (urban/rural, %) 2015 20.0/5.6Net Official Development Assistance received (% of GNI) 2014 0.9a Data classified according to ISIC Rev. 2. b Estimate. c Brazzaville. d African population. e Series linkedto former series. f 2013. g 2014. h Provisional data. i 2012.
50 World Statistics Pocketbook

Cook IslandsRegion Oceania-Polynesia Surface area (sq km) 236 a
Population (proj., 000) 21 Pop. density (per sq km) 87.3Capital city Avarua Capital city pop. (000) 5 b
Currency New Zealand Dollar (NZD)Economic indicators 2005 2010 2014GDP: Gross domestic product (million current US$) 183 255 311GDP growth rate (annual %, const. 2005 prices) –1.1 –3.0 6.2GDP per capita (current US$) 9 410.7 12 578.7 15 002.5Economy: Agriculture (% of GVA) c 6.9 4.9 9.0Economy: Industry (% of GVA) c 9.6 8.5 7.6Economy: Services and other activity (% of GVA) c 83.5 86.6 83.5Employment: Agriculture (% of employed) d ... ... 4.3b
Employment: Industry (% of employed) d ... ... 11.7b
Employment: Services and other (% of employed) d ... ... 84.0b
Unemployment (% of labour force) 13.1e 6.9dfg 8.2bd
Labour force participation (female/male pop. %) 63.0/75.5eh 64.2/76.1dfg 65.4/76.6bd
CPI: Consumer price index (2000=100) i 118 144 158Agricultural production index (2004-2006=100) 100 104 97j
Food production index (2004-2006=100) 100 104 97j
Total trade Major trading partners 2015(million US$)b (% of exports)b (% of imports)b
Exports 3.1 Japan 58.1 New Zealand 77.1Imports 109.3 China 16.1 Fiji 10.0Balance –106.2 United States 6.5 Australia 5.3Social indicatorsPopulation growth rate (average annual %) 2010-2015 0.5Urban population (%) 2015 74.5Urban population growth rate (average annual %) 2010-2015 0.9Fertility rate, total (live births per woman) 2010-2015 2.8b
Life expectancy at birth (females/males, years) 2010-2015 79.8/73.6k
Total dependency ratio (Pop. aged 0-14 & 65+ per 100 pop. 15-64) 2015 62g
International migrant stock (000/% of total pop.) mid-2015 4.2/19.9Tourist arrivals at national borders (000) 2014 121Infant mortality rate (per 1 000 live births) 2010-2015 7k
Health: Total expenditure (% of GDP) 2014 3.4Education: Government expenditure (% of GDP) 2014 3.9Education: Primary gross enrolment ratio (f/m per 100 pop.) 2014 104.2/107.7l
Education: Secondary gross enrolment ratio (f/m per 100 pop.) 2014 90.6/82.5l
Education: Tertiary gross enrolment ratio (f/m per 100 pop.) 2014 96.2/28.5l
Intentional homicide rate (per 100 000 pop.) 2014 3.1m
Environment and infrastructureThreatened species 2015 73Forested area (% of land area) 2013 62.9l
CO2 emission estimates (000 tons/tons per capita) 2013 70/3.4Energy supply per capita (Gigajoules) 2013 48.0l
Population using improved drinking water sources (urban/rural, %) 2015 99.9/99.9Population using improved sanitation facilities (urban/rural, %) 2015 97.6/97.6a Excluding Niue, shown separately, which is part of Cook Islands, but because of remoteness is admin-istered separately. b 2011. c At producers' prices. d Resident population (de jure). e 2001. f Break in thetime series. g 2006. h Persons aged 15 to 69 years. i Rarotonga. j 2013. k 2006 - 2012. l Estimate. m 2012.
World Statistics Pocketbook 51

Costa RicaRegion Central America Surface area (sq km) 51 100Population (proj., 000) 4 857 Pop. density (per sq km) 95.1Capital city San José Capital city pop. (000) 1 170 a
Currency Costa Rican Colon (CRC) UN membership date 2 November 1945Economic indicators 2005 2010 2014GDP: Gross domestic product (million current US$) 19 965 36 298 49 553GDP growth rate (annual %, const. 2005 prices) 5.9 5.0 3.5GDP per capita (current US$) 4 700.0 7 986.0 10 415.4Economy: Agriculture (% of GVA) 8.6 6.8 5.2Economy: Industry (% of GVA) 27.8 24.9 23.2Economy: Services and other activity (% of GVA) 63.6 68.2 71.6Employment: Agriculture (% of employed) 15.2bc 15.0 12.7de
Employment: Industry (% of employed) 21.5bc 19.5 19.0de
Employment: Services and other (% of employed) 62.9bc 64.7 68.2de
Unemployment (% of labour force) f 6.6 7.3 9.6Labour force participation (female/male pop. %) f 43.6/80.2 44.1/77.1 46.7/76.6CPI: Consumer price index (2000=100) g 170 268 323Agricultural production index (2004-2006=100) 98 113 122e
Food production index (2004-2006=100) 98 115 125e
Balance of payments, current account (million US$) –981 –1 179 –2 008Total trade Major trading partners 2015
(million US$) (% of exports) (% of imports)Exports 9 578.3 United States 40.8 United States 39.8Imports 15 504.4 Panama 5.8 China 12.6Balance –5 926.1 Guatemala 5.5 Mexico 7.4Social indicatorsPopulation growth rate (average annual %) 2010-2015 1.1Urban population (%) 2015 76.8Urban population growth rate (average annual %) 2010-2015 2.7Fertility rate, total (live births per woman) 2010-2015 1.9Life expectancy at birth (females/males, years) 2010-2015 81.7/76.7Total dependency ratio (Pop. aged 0-14 & 65+ per 100 pop. 15-64) 2015 45International migrant stock (000/% of total pop.) mid-2015 421.7/8.8h
Tourist arrivals at national borders (000) 2014 2 527Refugees and others of concern to UNHCR mid-2015 7 907Infant mortality rate (per 1 000 live births) 2010-2015 9Health: Total expenditure (% of GDP) 2014 9.3i
Health: Physicians (per 1 000 pop.) 2013 1.1Education: Government expenditure (% of GDP) 2014 7.0Education: Primary gross enrolment ratio (f/m per 100 pop.) 2014 110.3/111.3Education: Secondary gross enrolment ratio (f/m per 100 pop.) 2014 123.6/117.2Education: Tertiary gross enrolment ratio (f/m per 100 pop.) 2014 58.8/47.5Intentional homicide rate (per 100 000 pop.) 2014 10.0Seats held by women in national parliaments (%) 2016 33.3Environment and infrastructureMobile-cellular subscriptions (per 100 inhabitants) 2014 143.8f
Individuals using the Internet (%) 2014 49.4f
Patents: Resident filings (per million pop.) 2014 3.0Threatened species 2015 323Forested area (% of land area) 2013 52.8f
CO2 emission estimates (000 tons/tons per capita) 2013 7 616/1.6Energy production, primary (Petajoules) 2013 124Energy supply per capita (Gigajoules) 2013 47.0Terrestrial and marine areas protected (% of total area) 2014 3.1Population using improved drinking water sources (urban/rural, %) 2015 99.6/91.9Population using improved sanitation facilities (urban/rural, %) 2015 95.2/92.3Net Official Development Assistance received (% of GNI) 2014 0.1a Refers to the urban population of cantons. b Data classified according to ISIC Rev. 3. c Persons aged12 years and over. d Break in the time series. e 2013. f Estimate. g Central area. h Including refugees. iData revision.
52 World Statistics Pocketbook

Côte d'IvoireRegion Western Africa Surface area (sq km) 322 463Population (proj., 000) 23 254 Pop. density (per sq km) 73.1Capital city Yamoussoukro a Capital city pop. (000) 259 b
Currency CFA Franc (XOF) UN membership date 20 September 1960Economic indicators 2005 2010 2014GDP: Gross domestic product (million current US$) 17 085 24 885 34 254GDP growth rate (annual %, const. 2005 prices) 1.7 2.0 8.5GDP per capita (current US$) 942.2 1 236.1 1 546.0Economy: Agriculture (% of GVA) 25.2 27.0 25.4Economy: Industry (% of GVA) 25.5 24.7 24.0Economy: Services and other activity (% of GVA) 49.3 48.3 50.6Unemployment (% of labour force) c 9.4 9.4 9.4Labour force participation (female/male pop. %) c 50.5/82.0 51.8/81.4 52.3/80.9CPI: Consumer price index (2000=100) de 117 133f 145g
Agricultural production index (2004-2006=100) 100 107 123g
Food production index (2004-2006=100) 98 109 124g
Index of industrial production (2005=100) hi 100 103 140Balance of payments, current account (million US$) 40 465 –633g
Total trade Major trading partners 2015(million US$)b (% of exports)b (% of imports)b
Exports 12 985.1 Netherlands 10.0 Nigeria 21.8Imports 11 177.7 United States 8.4 France 12.2Balance 1 807.4 South Africa 6.9 China 8.8Social indicatorsPopulation growth rate (average annual %) 2010-2015 2.4Urban population (%) 2015 54.2Urban population growth rate (average annual %) 2010-2015 3.7Fertility rate, total (live births per woman) 2010-2015 5.1Life expectancy at birth (females/males, years) 2010-2015 51.9/50.2Total dependency ratio (Pop. aged 0-14 & 65+ per 100 pop. 15-64) 2015 84International migrant stock (000/% of total pop.) mid-2015 2 175.4/9.6j
Tourist arrivals at national borders (000) k 2014 471Refugees and others of concern to UNHCR mid-2015 726 770Infant mortality rate (per 1 000 live births) 2010-2015 73Health: Total expenditure (% of GDP) 2014 5.7Education: Government expenditure (% of GDP) 2014 4.7Education: Primary gross enrolment ratio (f/m per 100 pop.) 2014 83.6/95.6Education: Secondary gross enrolment ratio (f/m per 100 pop.) 2014 33.2/47.0Education: Tertiary gross enrolment ratio (f/m per 100 pop.) 2014 6.4/10.9Intentional homicide rate (per 100 000 pop.) 2014 11.4l
Seats held by women in national parliaments (%) 2016 9.2Environment and infrastructureMobile-cellular subscriptions (per 100 inhabitants) 2014 106.3Individuals using the Internet (%) 2014 14.6c
Patents: Resident filings (per million pop.) 2014 3.0l
Threatened species 2015 226Forested area (% of land area) 2013 32.7c
CO2 emission estimates (000 tons/tons per capita) 2013 8 988/0.4Energy production, primary (Petajoules) 2013 527Energy supply per capita (Gigajoules) 2013 25.0Terrestrial and marine areas protected (% of total area) 2014 14.9Population using improved drinking water sources (urban/rural, %) 2015 93.1/68.8Population using improved sanitation facilities (urban/rural, %) 2015 32.8/10.3Net Official Development Assistance received (% of GNI) 2014 2.8a Yamoussoukro is the capital and Abidjan is the administrative capital. b 2014. c Estimate. d Africanpopulation. e Abidjan. f Series linked to former series. g 2013. h Data classified according to ISIC Rev.3. i Country data supplemented with data from the Observatoire Economique et Statistique d’AfriqueSubsaharienne (Afristat). j Refers to foreign citizens. k Arrivals of non-resident visitors at national borders.l 2012.
World Statistics Pocketbook 53

CroatiaRegion Southern Europe Surface area (sq km) 56 594Population (proj., 000) 4 225 Pop. density (per sq km) 75.5Capital city Zagreb Capital city pop. (000) 687 a
Currency Kuna (HRK) UN membership date 22 May 1992Economic indicators 2005 2010 2014GDP: Gross domestic product (million current US$) 45 416 59 665 57 137GDP growth rate (annual %, const. 2005 prices) 4.2 –1.7 –0.4GDP per capita (current US$) 10 373.6 13 822.9 13 425.4Economy: Agriculture (% of GVA) b 5.0 4.9 4.3Economy: Industry (% of GVA) c 29.0 27.1 26.3Economy: Services and other activity (% of GVA) de 66.0 68.1 69.4Employment: Agriculture (% of employed) 14.3fg 12.5 8.7Employment: Industry (% of employed) 29.7fg 28.0 27.2Employment: Services and other (% of employed) 56.0fg 59.3 63.9Unemployment (% of labour force) h 12.6 11.6 17.3Labour force participation (female/male pop. %) h 46.2/61.1 45.8/59.2 46.5/58.9CPI: Consumer price index (2000=100) 114 133 143Agricultural production index (2004-2006=100) 98 100 96i
Food production index (2004-2006=100) 98 100 96i
Index of industrial production (2005=100) j 100 99 92Balance of payments, current account (million US$) –2 479 –894 412Total trade Major trading partners 2015
(million US$) (% of exports) (% of imports)Exports 12 846.8 Italy 13.4 Germany 15.5Imports 20 579.8 Slovenia 12.3 Italy 13.2Balance –7 733.0 Germany 11.3 Slovenia 10.7Social indicatorsPopulation growth rate (average annual %) 2010-2015 –0.4Urban population (%) 2015 59.0Urban population growth rate (average annual %) 2010-2015 0.1Fertility rate, total (live births per woman) 2010-2015 1.5Life expectancy at birth (females/males, years) 2010-2015 80.4/73.6Total dependency ratio (Pop. aged 0-14 & 65+ per 100 pop. 15-64) 2015 51International migrant stock (000/% of total pop.) mid-2015 576.9/13.6k
Tourist arrivals at national borders (000) l 2014 11 623Refugees and others of concern to UNHCR mid-2015 17 484Infant mortality rate (per 1 000 live births) 2010-2015 4Health: Total expenditure (% of GDP) 2014 7.8Education: Government expenditure (% of GDP) 2014 4.2m
Education: Primary gross enrolment ratio (f/m per 100 pop.) 2014 98.7/99.0Education: Secondary gross enrolment ratio (f/m per 100 pop.) 2014 100.9/97.2Education: Tertiary gross enrolment ratio (f/m per 100 pop.) 2014 80.7/58.8Intentional homicide rate (per 100 000 pop.) 2014 0.8Seats held by women in national parliaments (%) 2016 15.2Environment and infrastructureMobile-cellular subscriptions (per 100 inhabitants) 2014 104.4Individuals using the Internet (%) 2014 68.6n
Patents: Resident filings (per million pop.) 2014 43.0Threatened species 2015 159Forested area (% of land area) 2013 34.3h
CO2 emission estimates (000 tons/tons per capita) 2013 17 712/4.1Energy production, primary (Petajoules) 2013 152Energy supply per capita (Gigajoules) 2013 75.0Terrestrial and marine areas protected (% of total area) 2014 23.7Population using improved drinking water sources (urban/rural, %) 2015 99.6/99.7Population using improved sanitation facilities (urban/rural, %) 2015 97.8/95.8Net Official Development Assistance disbursed (% of GNI) 2014 0.1a Refers to the settlement of Zagreb. b Excludes irrigation canals and landscaping care. c Excludespublishing activities, includes irrigation canals. d Excludes repair of personal and household goods. eIncludes publishing activities and landscaping care. f Data classified according to ISIC Rev. 3. g Break inthe time series. h Estimate. i 2013. j Excluding water and waste management. k Including refugees. lArrivals of non-resident tourists in all types of tourism accommodation establishments. m 2011. n Pop-ulation age 16-74.
54 World Statistics Pocketbook

CubaRegion Caribbean Surface area (sq km) 109 884Population (proj., 000) 11 393 Pop. density (per sq km) 107.0Capital city Havana Capital city pop. (000) 2 137Currency Cuban Peso (CUP) a UN membership date 24 October 1945Economic indicators 2005 2010 2014GDP: Gross domestic product (million current US$) 42 644 64 328 82 775GDP growth rate (annual %, const. 2005 prices) 11.2 2.4 1.3GDP per capita (current US$) 3 786.8 5 688.7 7 274.3Economy: Agriculture (% of GVA) 5.6 5.0 5.0Economy: Industry (% of GVA) 19.4 20.5 20.5Economy: Services and other activity (% of GVA) 75.0 74.5 74.5Employment: Agriculture (% of employed) bc 20.2 18.5d 18.6e
Employment: Industry (% of employed) bc 19.1 17.0d 17.2e
Employment: Services and other (% of employed) bc 60.6 64.5d 64.2e
Unemployment (% of labour force) f 1.9 2.5 2.7Labour force participation (female/male pop. %) f 38.2/67.3 42.4/68.9 42.7/68.8CPI: Consumer price index (2000=100) 109 ... ...Agricultural production index (2004-2006=100) 97 88 100e
Food production index (2004-2006=100) 97 88 101e
Social indicatorsPopulation growth rate (average annual %) 2010-2015 0.1Urban population (%) 2015 77.1Urban population growth rate (average annual %) 2010-2015 0.1Fertility rate, total (live births per woman) 2010-2015 1.6Life expectancy at birth (females/males, years) 2010-2015 81.3/77.1Total dependency ratio (Pop. aged 0-14 & 65+ per 100 pop. 15-64) 2015 43International migrant stock (000/% of total pop.) mid-2015 13.3/0.1Tourist arrivals at national borders (000) 2014 2 970g
Refugees and others of concern to UNHCR mid-2015 325Infant mortality rate (per 1 000 live births) 2010-2015 5Health: Total expenditure (% of GDP) 2014 11.1Education: Primary gross enrolment ratio (f/m per 100 pop.) 2014 95.8/100.3Education: Secondary gross enrolment ratio (f/m per 100 pop.) 2014 101.4/98.1Education: Tertiary gross enrolment ratio (f/m per 100 pop.) 2014 50.8/32.0Intentional homicide rate (per 100 000 pop.) 2014 4.7h
Seats held by women in national parliaments (%) 2016 48.9Environment and infrastructureMobile-cellular subscriptions (per 100 inhabitants) 2014 22.5Individuals using the Internet (%) 2014 30.0f
Patents: Resident filings (per million pop.) 2014 2.0Threatened species 2015 337Forested area (% of land area) 2013 29.1f
CO2 emission estimates (000 tons/tons per capita) 2013 39 340/3.5Energy production, primary (Petajoules) 2013 218f
Energy supply per capita (Gigajoules) 2013 51.0f
Terrestrial and marine areas protected (% of total area) 2014 5.0Population using improved drinking water sources (urban/rural, %) 2015 96.4/89.8Population using improved sanitation facilities (urban/rural, %) 2015 94.4/89.1a The national currency of Cuba is the Cuban Peso (CUP). The convertible peso (CUC) is used by foreignersand tourists in Cuba. b Data classified according to ISIC Rev. 2. c Labour force data for males refers toages 17-59 and data for females to ages 17-54. d Break in the time series. e 2013. f Estimate. g Arrivalsby air. h 2011.
World Statistics Pocketbook 55
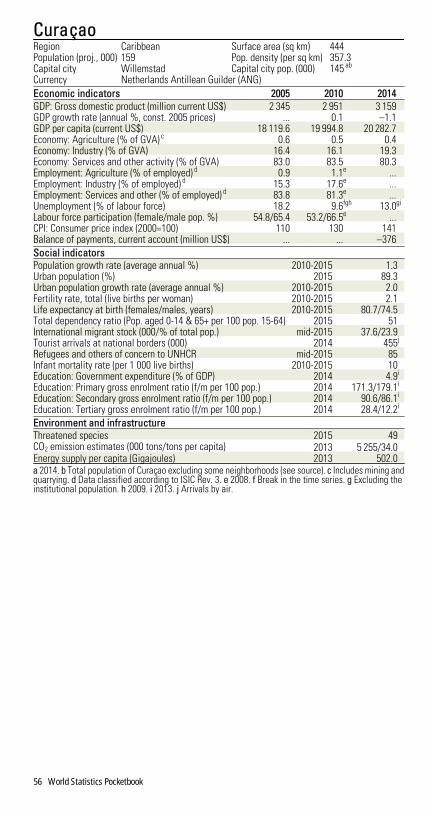
CuraçaoRegion Caribbean Surface area (sq km) 444Population (proj., 000) 159 Pop. density (per sq km) 357.3Capital city Willemstad Capital city pop. (000) 145 ab
Currency Netherlands Antillean Guilder (ANG)Economic indicators 2005 2010 2014GDP: Gross domestic product (million current US$) 2 345 2 951 3 159GDP growth rate (annual %, const. 2005 prices) ... 0.1 –1.1GDP per capita (current US$) 18 119.6 19 994.8 20 282.7Economy: Agriculture (% of GVA) c 0.6 0.5 0.4Economy: Industry (% of GVA) 16.4 16.1 19.3Economy: Services and other activity (% of GVA) 83.0 83.5 80.3Employment: Agriculture (% of employed) d 0.9 1.1e ...Employment: Industry (% of employed) d 15.3 17.6e ...Employment: Services and other (% of employed) d 83.8 81.3e ...Unemployment (% of labour force) 18.2 9.6fgh 13.0gi
Labour force participation (female/male pop. %) 54.8/65.4 53.2/66.5e ...CPI: Consumer price index (2000=100) 110 130 141Balance of payments, current account (million US$) ... ... –376Social indicatorsPopulation growth rate (average annual %) 2010-2015 1.3Urban population (%) 2015 89.3Urban population growth rate (average annual %) 2010-2015 2.0Fertility rate, total (live births per woman) 2010-2015 2.1Life expectancy at birth (females/males, years) 2010-2015 80.7/74.5Total dependency ratio (Pop. aged 0-14 & 65+ per 100 pop. 15-64) 2015 51International migrant stock (000/% of total pop.) mid-2015 37.6/23.9Tourist arrivals at national borders (000) 2014 455j
Refugees and others of concern to UNHCR mid-2015 85Infant mortality rate (per 1 000 live births) 2010-2015 10Education: Government expenditure (% of GDP) 2014 4.9i
Education: Primary gross enrolment ratio (f/m per 100 pop.) 2014 171.3/179.1i
Education: Secondary gross enrolment ratio (f/m per 100 pop.) 2014 90.6/86.1i
Education: Tertiary gross enrolment ratio (f/m per 100 pop.) 2014 28.4/12.2i
Environment and infrastructureThreatened species 2015 49CO2 emission estimates (000 tons/tons per capita) 2013 5 255/34.0Energy supply per capita (Gigajoules) 2013 502.0a 2014. b Total population of Curaçao excluding some neighborhoods (see source). c Includes mining andquarrying. d Data classified according to ISIC Rev. 3. e 2008. f Break in the time series. g Excluding theinstitutional population. h 2009. i 2013. j Arrivals by air.
56 World Statistics Pocketbook

CyprusaRegion Western Asia Surface area (sq km) 9 251Population (proj., 000) 1 177 b Pop. density (per sq km) 127.3 b
Capital city Nicosia Capital city pop. (000) 251 c
Currency Euro (EUR) UN membership date 20 September 1960Economic indicators 2005 2010 2014GDP: Gross domestic product (million current US$) 18 850 25 320 23 077GDP growth rate (annual %, const. 2005 prices) 3.9 1.4 –2.5GDP per capita (current US$) 25 523.0 30 526.3 26 147.1Economy: Agriculture (% of GVA) d 2.7 2.4 2.3Economy: Industry (% of GVA) e 20.1 16.6 10.8Economy: Services and other activity (% of GVA) fg 77.3 81.1 86.9Employment: Agriculture (% of employed) 3.7h 2.8 3.9Employment: Industry (% of employed) 24.3h 20.7 16.5Employment: Services and other (% of employed) 72.0h 76.5 79.6Unemployment (% of labour force) i 5.3 6.3 16.1Labour force participation (female/male pop. %) i 53.6/73.1 57.2/71.3 57.3/69.9CPI: Consumer price index (2000=100) 115 129 134Agricultural production index (2004-2006=100) 98 83 81j
Food production index (2004-2006=100) 98 84 81j
Index of industrial production (2005=100) 100 100 72Balance of payments, current account (million US$) –971 –2 728 –1 053Total trade Major trading partners 2015
(million US$) (% of exports) (% of imports)Exports 1 931.4 Bunkers 12.2k Greece 25.3Imports 5 666.0 Greece 10.7 United Kingdom 8.8Balance –3 734.6 Ireland 9.3 Italy 7.9Social indicatorsPopulation growth rate (average annual %) 2010-2015 1.1b
Urban population (%) 2015 66.9Urban population growth rate (average annual %) 2010-2015 0.9Fertility rate, total (live births per woman) 2010-2015 1.5b
Life expectancy at birth (females/males, years) 2010-2015 82.2/77.7b
Total dependency ratio (Pop. aged 0-14 & 65+ per 100 pop. 15-64) 2015 42b
International migrant stock (000/% of total pop.) mid-2015 196.2/16.8b
Tourist arrivals at national borders (000) 2014 2 441Refugees and others of concern to UNHCR mid-2015 14 102Infant mortality rate (per 1 000 live births) 2010-2015 4b
Health: Total expenditure (% of GDP) 2014 7.4l
Health: Physicians (per 1 000 pop.) 2013 2.3m
Education: Government expenditure (% of GDP) 2014 6.6n
Education: Primary gross enrolment ratio (f/m per 100 pop.) 2014 99.6/98.8i
Education: Secondary gross enrolment ratio (f/m per 100 pop.) 2014 99.5/99.4i
Education: Tertiary gross enrolment ratio (f/m per 100 pop.) 2014 62.6/44.1i
Intentional homicide rate (per 100 000 pop.) 2014 0.1Seats held by women in national parliaments (%) 2016 12.5Environment and infrastructureMobile-cellular subscriptions (per 100 inhabitants) 2014 96.3Individuals using the Internet (%) 2014 69.3o
Patents: Resident filings (per million pop.) 2014 44.0Threatened species 2015 60Forested area (% of land area) 2013 18.7i
CO2 emission estimates (000 tons/tons per capita) 2013 5 948/5.2Energy production, primary (Petajoules) 2013 5Energy supply per capita (Gigajoules) 2013 71.0Terrestrial and marine areas protected (% of total area) 2014 2.0Population using improved drinking water sources (urban/rural, %) 2015 100.0/100.0Population using improved sanitation facilities (urban/rural, %) 2015 100.0/100.0Net Official Development Assistance disbursed (% of GNI) 2014 0.1j
a Data generally refer to the government-controlled area unless otherwise indicated. b Including northernCyprus. c 2014. d Excludes irrigation canals and landscaping care. e Excludes publishing activities, in-cludes irrigation canals. f Excludes repair of personal and household goods. g Includes publishing activitiesand landscaping care. h Data classified according to ISIC Rev. 3. i Estimate. j 2013. k See technical notes.l Data is converted from SHA 2011. m 2012. n 2011. o Population age 16-74.
World Statistics Pocketbook 57

Czech RepublicRegion Eastern Europe Surface area (sq km) 78 867Population (proj., 000) 10 548 Pop. density (per sq km) 136.6Capital city Prague Capital city pop. (000) 1 314Currency Czech Koruna (CZK) UN membership date 19 January 1993Economic indicators 2005 2010 2014GDP: Gross domestic product (million current US$) 135 990 207 016 205 270GDP growth rate (annual %, const. 2005 prices) 6.4 2.3 2.0GDP per capita (current US$) 13 292.1 19 703.4 19 470.4Economy: Agriculture (% of GVA) a 2.5 1.7 2.7Economy: Industry (% of GVA) b 37.7 36.8 38.0Economy: Services and other activity (% of GVA) cd 59.8 61.5 59.3Employment: Agriculture (% of employed) 3.9ef 3.1 2.7Employment: Industry (% of employed) 39.7ef 38.3 38.3Employment: Services and other (% of employed) 56.3ef 58.7 58.9Unemployment (% of labour force) g 7.9 7.3 6.1Labour force participation (female/male pop. %) g 50.8/68.9 49.3/68.0 51.0/68.3CPI: Consumer price index (2000=100) 112 129 138Agricultural production index (2004-2006=100) 100 91 93h
Food production index (2004-2006=100) 100 91 93h
Index of industrial production (2005=100) i 100 110 122Balance of payments, current account (million US$) –1 210 –7 351 1 343Total trade Major trading partners 2015
(million US$) (% of exports) (% of imports)Exports 155 677.7 Germany 32.5 Germany 26.2Imports 137 485.7 Slovakia 9.0 China 13.4Balance 18 192.0 Poland 5.8 Poland 7.8Social indicatorsPopulation growth rate (average annual %) 2010-2015 0.1Urban population (%) 2015 73.0Urban population growth rate (average annual %) 2010-2015 0.4Fertility rate, total (live births per woman) 2010-2015 1.5Life expectancy at birth (females/males, years) 2010-2015 81.3/75.4Total dependency ratio (Pop. aged 0-14 & 65+ per 100 pop. 15-64) 2015 50International migrant stock (000/% of total pop.) mid-2015 405.1/3.8j
Tourist arrivals at national borders (000) 2014 10 617Refugees and others of concern to UNHCR mid-2015 5 048k
Infant mortality rate (per 1 000 live births) 2010-2015 2Health: Total expenditure (% of GDP) 2014 7.4Education: Government expenditure (% of GDP) 2014 4.3l
Education: Primary gross enrolment ratio (f/m per 100 pop.) 2014 98.9/98.9Education: Secondary gross enrolment ratio (f/m per 100 pop.) 2014 105.4/104.9Education: Tertiary gross enrolment ratio (f/m per 100 pop.) 2014 77.4/55.2Intentional homicide rate (per 100 000 pop.) 2014 0.7Seats held by women in national parliaments (%) 2016 20.0Environment and infrastructureMobile-cellular subscriptions (per 100 inhabitants) 2014 130.0g
Individuals using the Internet (%) 2014 79.7m
Patents: Resident filings (per million pop.) 2014 102.0Threatened species 2015 45Forested area (% of land area) 2013 34.5g
CO2 emission estimates (000 tons/tons per capita) 2013 98 661/9.4Energy production, primary (Petajoules) 2013 1 258Energy supply per capita (Gigajoules) 2013 166.0Terrestrial and marine areas protected (% of total area) 2014 21.1Population using improved drinking water sources (urban/rural, %) 2015 100.0/100.0Population using improved sanitation facilities (urban/rural, %) 2015 99.1/99.2Net Official Development Assistance disbursed (% of GNI) n 2014 0.1a Excludes irrigation canals and landscaping care. b Excludes publishing activities, includes irrigationcanals. c Excludes repair of personal and household goods. d Includes publishing activities and land-scaping care. e Data classified according to ISIC Rev. 3. f Break in the time series. g Estimate. h 2013. iExcluding water and waste management. j Refers to foreign citizens. k Refugee population relates to theend of 2014. l 2012. m Population age 16-74. n Development Assistance Committee member (OECD).
58 World Statistics Pocketbook

Democratic People's Republic of KoreaRegion Eastern Asia Surface area (sq km) 120 538Population (proj., 000) 25 281 Pop. density (per sq km) 210.0Capital city Pyongyang Capital city pop. (000) 2 863Currency North Korean Won (KPW) UN membership date 17 September 1991Economic indicators 2005 2010 2014GDP: Gross domestic product (million current US$) 13 031 13 945 17 396GDP growth rate (annual %, const. 2005 prices) 3.8 –0.5 1.0GDP per capita (current US$) 547.9 569.8 695.9Economy: Agriculture (% of GVA) 25.0 20.8 21.8Economy: Industry (% of GVA) 42.8 48.2 46.9Economy: Services and other activity (% of GVA) 32.2 31.0 31.3Unemployment (% of labour force) a 6.8 6.7 6.7Labour force participation (female/male pop. %) a 74.5/88.6 73.9/86.9 73.6/85.9Agricultural production index (2004-2006=100) 101 98 103b
Food production index (2004-2006=100) 101 98 102b
Social indicatorsPopulation growth rate (average annual %) 2010-2015 0.5Urban population (%) 2015 60.9Urban population growth rate (average annual %) 2010-2015 0.8Fertility rate, total (live births per woman) 2010-2015 2.0Life expectancy at birth (females/males, years) 2010-2015 73.3/66.3Total dependency ratio (Pop. aged 0-14 & 65+ per 100 pop. 15-64) 2015 44International migrant stock (000/% of total pop.) mid-2015 48.5/0.2a
Infant mortality rate (per 1 000 live births) 2010-2015 22Intentional homicide rate (per 100 000 pop.) 2014 4.7c
Seats held by women in national parliaments (%) 2016 16.3Environment and infrastructureMobile-cellular subscriptions (per 100 inhabitants) 2014 11.2a
Individuals using the Internet (%) 2014 0.0ad
Patents: Resident filings (per million pop.) 2014 337.0c
Threatened species 2015 64Forested area (% of land area) 2013 43.9a
CO2 emission estimates (000 tons/tons per capita) 2013 50 091/2.0Energy production, primary (Petajoules) 2013 1 009Energy supply per capita (Gigajoules) 2013 25.0Terrestrial and marine areas protected (% of total area) 2014 1.3Population using improved drinking water sources (urban/rural, %) 2015 99.9/99.4Population using improved sanitation facilities (urban/rural, %) 2015 87.9/72.5a Estimate. b 2013. c 2012. d Commercially not available. Local Intranet available in country.
World Statistics Pocketbook 59

Democratic Republic of the CongoRegion Middle Africa Surface area (sq km) 2 344 858Population (proj., 000) 79 723 Pop. density (per sq km) 35.2Capital city Kinshasa Capital city pop. (000) 11 587Currency Congolese Franc (CDF) UN membership date 20 September 1960Economic indicators 2005 2010 2014GDP: Gross domestic product (million current US$) 11 965 21 672 35 909GDP growth rate (annual %, const. 2005 prices) 6.1 7.1 9.5GDP per capita (current US$) 213.3 328.7 479.6Economy: Agriculture (% of GVA) 22.3 22.4 21.5Economy: Industry (% of GVA) 32.9 40.5 43.5Economy: Services and other activity (% of GVA) 44.9 37.1 35.0Unemployment (% of labour force) a 3.7 3.7 3.8Labour force participation (female/male pop. %) a 70.9/73.0 70.7/72.2 70.5/71.7Agricultural production index (2004-2006=100) 100 106 117b
Food production index (2004-2006=100) 100 107 117b
Balance of payments, current account (million US$) –389 –2 174 –3 040Social indicatorsPopulation growth rate (average annual %) 2010-2015 3.2Urban population (%) 2015 42.5Urban population growth rate (average annual %) 2010-2015 4.0Fertility rate, total (live births per woman) 2010-2015 6.2Life expectancy at birth (females/males, years) 2010-2015 59.5/56.7Total dependency ratio (Pop. aged 0-14 & 65+ per 100 pop. 15-64) 2015 96International migrant stock (000/% of total pop.) mid-2015 545.7/0.7c
Tourist arrivals at national borders (000) 2014 191bd
Refugees and others of concern to UNHCR mid-2015 2 001 006e
Infant mortality rate (per 1 000 live births) 2010-2015 73Health: Total expenditure (% of GDP) 2014 4.3e
Education: Government expenditure (% of GDP) 2014 2.2b
Education: Primary gross enrolment ratio (f/m per 100 pop.) 2014 101.8/112.0Education: Secondary gross enrolment ratio (f/m per 100 pop.) 2014 33.3/53.6Education: Tertiary gross enrolment ratio (f/m per 100 pop.) 2014 4.2/9.1b
Intentional homicide rate (per 100 000 pop.) 2014 12.5f
Seats held by women in national parliaments (%) 2016 8.9Environment and infrastructureMobile-cellular subscriptions (per 100 inhabitants) 2014 53.5Individuals using the Internet (%) 2014 3.0a
Threatened species 2015 333Forested area (% of land area) 2013 67.6a
CO2 emission estimates (000 tons/tons per capita) 2013 2 780/<Energy production, primary (Petajoules) 2013 906Energy supply per capita (Gigajoules) 2013 12.0Terrestrial and marine areas protected (% of total area) 2014 12.1Population using improved drinking water sources (urban/rural, %) 2015 81.1/31.2Population using improved sanitation facilities (urban/rural, %) 2015 28.6/28.7Net Official Development Assistance received (% of GNI) 2014 8.3a Estimate. b 2013. c Including refugees. d The arrivals data relate only to three border posts (N'Djiliairport in Kinshasa, the Luano airport in Lubumbashi, and the land border-crossing of Kasumbalesa inKatanga province). e Data revision. f 2012.
60 World Statistics Pocketbook

DenmarkRegion Northern Europe Surface area (sq km) 42 921Population (proj., 000) 5 691 Pop. density (per sq km) 134.1Capital city Copenhagen Capital city pop. (000) 1 268 a
Currency Danish Krone (DKK) UN membership date 24 October 1945Economic indicators 2005 2010 2014GDP: Gross domestic product (million current US$) 264 559 319 812 346 119GDP growth rate (annual %, const. 2005 prices) 2.4 1.6 1.3GDP per capita (current US$) 48 832.4 57 613.9 61 293.7Economy: Agriculture (% of GVA) b 1.4 1.4 1.6Economy: Industry (% of GVA) c 26.2 22.8 22.8Economy: Services and other activity (% of GVA) de 72.5 75.8 75.6Employment: Agriculture (% of employed) 3.0fg 2.3 2.3Employment: Industry (% of employed) 23.9fg 19.7 19.3Employment: Services and other (% of employed) 72.9fg 77.9 78.0Unemployment (% of labour force) h 4.8 7.5 6.6Labour force participation (female/male pop. %) h 60.5/71.4 59.8/69.1 58.1/66.3CPI: Consumer price index (2000=100) 110 122 131Agricultural production index (2004-2006=100) 101 101 100i
Food production index (2004-2006=100) 101 101 100i
Index of industrial production (2005=100) j 100 86 89Balance of payments, current account (million US$) 11 104 18 183 21 421Total trade Major trading partners 2015
(million US$)k (% of exports)k (% of imports)k
Exports 94 484.1 Germany 16.3 Germany 20.4Imports 85 502.1 Areas nes 11.5l Sweden 12.3Balance 8 982.0 Sweden 11.1 Netherlands 8.0Social indicatorsPopulation growth rate (average annual %) 2010-2015 0.4Urban population (%) 2015 87.7Urban population growth rate (average annual %) 2010-2015 0.6Fertility rate, total (live births per woman) 2010-2015 1.7Life expectancy at birth (females/males, years) 2010-2015 81.9/78.0Total dependency ratio (Pop. aged 0-14 & 65+ per 100 pop. 15-64) 2015 56International migrant stock (000/% of total pop.) mid-2015 572.5/10.1Tourist arrivals at national borders (000) m 2014 10 267g
Refugees and others of concern to UNHCR mid-2015 27 335n
Infant mortality rate (per 1 000 live births) 2010-2015 3Health: Total expenditure (% of GDP) 2014 10.8Education: Government expenditure (% of GDP) 2014 8.6o
Education: Primary gross enrolment ratio (f/m per 100 pop.) 2014 100.7/102.0Education: Secondary gross enrolment ratio (f/m per 100 pop.) 2014 132.2/127.7Education: Tertiary gross enrolment ratio (f/m per 100 pop.) 2014 95.4/68.2Intentional homicide rate (per 100 000 pop.) 2014 1.0Seats held by women in national parliaments (%) 2016 37.4Environment and infrastructureMobile-cellular subscriptions (per 100 inhabitants) 2014 126.0Individuals using the Internet (%) 2014 96.0p
Patents: Resident filings (per million pop.) 2014 596.0Threatened species 2015 36Forested area (% of land area) 2013 14.2h
CO2 emission estimates (000 tons/tons per capita) 2013 38 067/6.8Energy production, primary (Petajoules) 2013 699k
Energy supply per capita (Gigajoules) 2013 129.0k
Terrestrial and marine areas protected (% of total area) 2014 18.0Population using improved drinking water sources (urban/rural, %) 2015 100.0/100.0Population using improved sanitation facilities (urban/rural, %) 2015 99.6/99.6Net Official Development Assistance disbursed (% of GNI) q 2014 0.9a Refers to the Greater Copenhagen Region, consisting of (parts of) 16 municipalities. b Excludes irrigationcanals and landscaping care. c Excludes publishing activities, includes irrigation canals. d Excludes repairof personal and household goods. e Includes publishing activities and landscaping care. f Data classifiedaccording to ISIC Rev. 3. g Break in the time series. h Estimate. i 2013. j Excluding water and wastemanagement. k Excluding the Faeroe Islands and Greenland. l See technical notes. m Arrivals of non-resident tourists in all types of tourism accommodation establishments. n Refugee population relates tothe end of 2014. o 2011. p Population age 16-74. q Development Assistance Committee member (OECD).
World Statistics Pocketbook 61

DjiboutiRegion Eastern Africa Surface area (sq km) 23 200Population (proj., 000) 900 Pop. density (per sq km) 38.8Capital city Djibouti Capital city pop. (000) 529 a
Currency Djibouti Franc (DJF) UN membership date 20 September 1977Economic indicators 2005 2010 2014GDP: Gross domestic product (million current US$) 709 1 067 1 589GDP growth rate (annual %, const. 2005 prices) 3.2 3.5 6.0GDP per capita (current US$) 910.4 1 284.3 1 813.6Economy: Agriculture (% of GVA) 3.6 3.6 3.2Economy: Industry (% of GVA) 16.2 19.0 22.7Economy: Services and other activity (% of GVA) 80.2 77.4 74.0Unemployment (% of labour force) b 59.4 59.4 55.7Labour force participation (female/male pop. %) b 33.0/66.2 35.6/66.8 36.5/67.9Agricultural production index (2004-2006=100) 95 119 134c
Food production index (2004-2006=100) 95 119 134c
Balance of payments, current account (million US$) 20 50 –309c
Social indicatorsPopulation growth rate (average annual %) 2010-2015 1.3Urban population (%) 2015 77.3Urban population growth rate (average annual %) 2010-2015 1.6Fertility rate, total (live births per woman) 2010-2015 3.3Life expectancy at birth (females/males, years) 2010-2015 63.2/60.0Total dependency ratio (Pop. aged 0-14 & 65+ per 100 pop. 15-64) 2015 59International migrant stock (000/% of total pop.) mid-2015 112.4/12.7d
Tourist arrivals at national borders (000) e 2014 63c
Refugees and others of concern to UNHCR mid-2015 17 373Infant mortality rate (per 1 000 live births) 2010-2015 55Health: Total expenditure (% of GDP) 2014 10.6Education: Primary gross enrolment ratio (f/m per 100 pop.) 2014 63.3/72.5Education: Secondary gross enrolment ratio (f/m per 100 pop.) 2014 41.5/51.1Education: Tertiary gross enrolment ratio (f/m per 100 pop.) 2014 4.0/5.9f
Intentional homicide rate (per 100 000 pop.) 2014 7.0g
Seats held by women in national parliaments (%) 2016 12.7Environment and infrastructureMobile-cellular subscriptions (per 100 inhabitants) 2014 32.4Individuals using the Internet (%) 2014 10.7b
Patents: Resident filings (per million pop.) 2014 1.0c
Threatened species 2015 94Forested area (% of land area) 2013 0.2b
CO2 emission estimates (000 tons/tons per capita) 2013 609/0.7Energy production, primary (Petajoules) 2013 3Energy supply per capita (Gigajoules) 2013 13.0b
Terrestrial and marine areas protected (% of total area) 2014 1.1Population using improved drinking water sources (urban/rural, %) 2015 97.4/64.7Population using improved sanitation facilities (urban/rural, %) 2015 59.8/5.1a Refers to the population of the 'cercle'. b Estimate. c 2013. d Including refugees. e Arrivals of non-resident tourists in hotels and similar establishments. f 2011. g 2012.
62 World Statistics Pocketbook

DominicaRegion Caribbean Surface area (sq km) 750Population (proj., 000) 73 Pop. density (per sq km) 97.4Capital city Roseau Capital city pop. (000) 15 a
Currency East Caribbean Dollar (XCD) UN membership date 18 December 1978Economic indicators 2005 2010 2014GDP: Gross domestic product (million current US$) 370 493 533GDP growth rate (annual %, const. 2005 prices) –0.3 1.2 1.1GDP per capita (current US$) 5 251.0 6 926.7 7 361.2Economy: Agriculture (% of GVA) 13.2 13.8 16.7Economy: Industry (% of GVA) 15.0 14.4 13.8Economy: Services and other activity (% of GVA) 71.9 71.8 69.5Employment: Agriculture (% of employed) b 21.0c ... ...Employment: Industry (% of employed) b 20.0c ... ...Employment: Services and other (% of employed) b 58.8c ... ...Unemployment (% of labour force) 11.0c ... ...Labour force participation (female/male pop. %) 45.0/70.2c ... ...CPI: Consumer price index (2000=100) d 106 122e 126f
Agricultural production index (2004-2006=100) 95 111 113f
Food production index (2004-2006=100) 95 112 114f
Balance of payments, current account (million US$) –76 –80 –72f
Total trade Major trading partners 2015(million US$)g (% of exports)g (% of imports)g
Exports 37.0 Trinidad and Tobago 18.6 United States 36.8Imports 211.9 Jamaica 16.2 Trinidad and Tobago 17.0Balance –174.9 Saint Kitts and Nevis 14.3 Areas nes 8.6h
Social indicatorsPopulation growth rate (average annual %) 2010-2015 0.4Urban population (%) 2015 69.5Urban population growth rate (average annual %) 2010-2015 0.8Life expectancy at birth (females/males, years) 2010-2015 78.2/73.8i
Total dependency ratio (Pop. aged 0-14 & 65+ per 100 pop. 15-64) 2015 66j
International migrant stock (000/% of total pop.) mid-2015 6.7/9.3Tourist arrivals at national borders (000) 2014 82Health: Total expenditure (% of GDP) 2014 5.5Education: Primary gross enrolment ratio (f/m per 100 pop.) 2014 118.0/117.9Education: Secondary gross enrolment ratio (f/m per 100 pop.) 2014 100.1/93.5k
Intentional homicide rate (per 100 000 pop.) 2014 8.4k
Seats held by women in national parliaments (%) 2016 21.9Environment and infrastructureMobile-cellular subscriptions (per 100 inhabitants) 2014 127.5l
Individuals using the Internet (%) 2014 62.9l
Threatened species 2015 62Forested area (% of land area) 2013 58.5l
CO2 emission estimates (000 tons/tons per capita) 2013 132/1.8Energy production, primary (Petajoules) 2013 0Energy supply per capita (Gigajoules) 2013 28.0l
Terrestrial and marine areas protected (% of total area) 2014 0.6Population using improved drinking water sources (urban/rural, %) 2015 95.7/...Net Official Development Assistance received (% of GNI) 2014 3.0a 2014. b Data classified according to ISIC Rev. 2. c 2001. d Index base: 2001=100. e Series linked toformer series. f 2013. g 2012. h See technical notes. i 2008. j 2006. k 2011. l Estimate.
World Statistics Pocketbook 63

Dominican RepublicRegion Caribbean Surface area (sq km) 48 231Population (proj., 000) 10 649 Pop. density (per sq km) 220.4Capital city Santo Domingo Capital city pop. (000) 2 945Currency Dominican Peso (DOP) UN membership date 24 October 1945Economic indicators 2005 2010 2014GDP: Gross domestic product (million current US$) 35 662 53 043 63 969GDP growth rate (annual %, const. 2005 prices) 9.3 8.3 7.3GDP per capita (current US$) 3 860.6 5 359.0 6 147.4Economy: Agriculture (% of GVA) a 8.1 6.5 6.2Economy: Industry (% of GVA) b 32.7 30.1 28.7Economy: Services and other activity (% of GVA) cd 59.2 63.4 65.1Employment: Agriculture (% of employed) ef 14.6 12.0 14.5g
Employment: Industry (% of employed) ef 22.3 14.9 17.4g
Employment: Services and other (% of employed) ef 58.8 52.4 41.9g
Unemployment (% of labour force) h 18.0 12.4 14.5Labour force participation (female/male pop. %) h 48.8/80.7 49.3/78.7 52.2/78.7CPI: Consumer price index (2000=100) 230 314 381Agricultural production index (2004-2006=100) 99 128 133i
Food production index (2004-2006=100) 99 130 136i
Index of industrial production (2005=100) j 100 114 129i
Balance of payments, current account (million US$) –473 –4 006g –2 026Total trade Major trading partners 2015
(million US$) (% of exports) (% of imports)Exports 8 384.1 United States 53.6 United States 41.3Imports 17 347.8 Haiti 12.1 China 13.4Balance –8 963.7 Canada 8.4 Mexico 4.6Social indicatorsPopulation growth rate (average annual %) 2010-2015 1.2Urban population (%) 2015 79.0Urban population growth rate (average annual %) 2010-2015 2.6Fertility rate, total (live births per woman) 2010-2015 2.5Life expectancy at birth (females/males, years) 2010-2015 76.5/70.2Total dependency ratio (Pop. aged 0-14 & 65+ per 100 pop. 15-64) 2015 58International migrant stock (000/% of total pop.) mid-2015 415.6/4.0Tourist arrivals at national borders (000) 2014 5 141kl
Refugees and others of concern to UNHCR mid-2015 135 131m
Infant mortality rate (per 1 000 live births) 2010-2015 25Health: Total expenditure (% of GDP) 2014 4.4n
Health: Physicians (per 1 000 pop.) 2013 1.5o
Education: Primary gross enrolment ratio (f/m per 100 pop.) 2014 95.7/105.4Education: Secondary gross enrolment ratio (f/m per 100 pop.) 2014 82.4/74.4Education: Tertiary gross enrolment ratio (f/m per 100 pop.) 2014 58.8/36.4Intentional homicide rate (per 100 000 pop.) 2014 17.4Seats held by women in national parliaments (%) 2016 20.8Environment and infrastructureMobile-cellular subscriptions (per 100 inhabitants) 2014 78.9p
Individuals using the Internet (%) 2014 49.6h
Patents: Resident filings (per million pop.) 2014 1.0Threatened species 2015 153Forested area (% of land area) 2013 39.7h
CO2 emission estimates (000 tons/tons per capita) 2013 22 072/2.2Energy production, primary (Petajoules) 2013 43Energy supply per capita (Gigajoules) 2013 33.0Terrestrial and marine areas protected (% of total area) 2014 11.2Population using improved drinking water sources (urban/rural, %) 2015 85.5/81.9Population using improved sanitation facilities (urban/rural, %) 2015 86.2/75.7Net Official Development Assistance received (% of GNI) 2014 0.3a Excludes irrigation canals and landscaping care. b Excludes publishing activities, includes irrigationcanals. c Excludes repair of personal and household goods. d Includes publishing activities and land-scaping care. e Persons aged 10 years and over. f Data classified according to ISIC Rev. 2. g Break in thetime series. h Estimate. i 2013. j Data classified according to ISIC Rev. 3. k Including nationals residingabroad. l Arrivals by air. m Revised estimate includes only individuals born in the country where bothparents were born abroad. This estimate does not include subsequent generations of individuals of foreigndescent as such it does not include all persons without nationality. n Data revision. o 2011. p Decreasedue to operator updating their records to exclude inactive subscriptions.
64 World Statistics Pocketbook

EcuadorRegion South America Surface area (sq km) 257 217Population (proj., 000) 16 386 Pop. density (per sq km) 66.0Capital city Quito Capital city pop. (000) 1 726Currency US Dollar (USD) UN membership date 21 December 1945Economic indicators 2005 2010 2014GDP: Gross domestic product (million current US$) 41 507 69 555 100 917GDP growth rate (annual %, const. 2005 prices) 5.3 3.5 3.7GDP per capita (current US$) 3 021.9 4 657.3 6 345.8Economy: Agriculture (% of GVA) 10.0 10.2 9.1Economy: Industry (% of GVA) 33.4 36.3 39.1Economy: Services and other activity (% of GVA) 56.6 53.5 51.8Employment: Agriculture (% of employed) 31.5ab 28.2ab 25.3cd
Employment: Industry (% of employed) 17.2ab 18.6ab 20.4cd
Employment: Services and other (% of employed) 51.3ab 53.1ab 54.3cd
Unemployment (% of labour force) e 4.8 5.0 3.8Labour force participation (female/male pop. %) e 55.3/84.6 49.9/80.6 48.9/79.6CPI: Consumer price index (2000=100) 175f 219 256Agricultural production index (2004-2006=100) 98 121 116d
Food production index (2004-2006=100) 98 123 117d
Balance of payments, current account (million US$) 474 –1 586 –590Total trade Major trading partners 2015
(million US$) (% of exports) (% of imports)Exports 18 330.6 United States 39.4 United States 23.8Imports 21 387.3 Chile 6.2 China 19.0Balance –3 056.7 Peru 5.1 Colombia 7.5Social indicatorsPopulation growth rate (average annual %) 2010-2015 1.6Urban population (%) 2015 63.7Urban population growth rate (average annual %) 2010-2015 1.9Fertility rate, total (live births per woman) 2010-2015 2.6Life expectancy at birth (females/males, years) 2010-2015 78.4/72.8Total dependency ratio (Pop. aged 0-14 & 65+ per 100 pop. 15-64) 2015 56International migrant stock (000/% of total pop.) mid-2015 387.5/2.4g
Tourist arrivals at national borders (000) h 2014 1 557i
Refugees and others of concern to UNHCR mid-2015 133 305j
Infant mortality rate (per 1 000 live births) 2010-2015 21Health: Total expenditure (% of GDP) 2014 9.2k
Health: Physicians (per 1 000 pop.) 2013 1.7l
Education: Government expenditure (% of GDP) 2014 4.2m
Education: Primary gross enrolment ratio (f/m per 100 pop.) 2014 113.4/113.2Education: Secondary gross enrolment ratio (f/m per 100 pop.) 2014 106.3/102.2Education: Tertiary gross enrolment ratio (f/m per 100 pop.) 2014 45.3/34.6m
Intentional homicide rate (per 100 000 pop.) 2014 8.2Seats held by women in national parliaments (%) 2016 41.6Environment and infrastructureMobile-cellular subscriptions (per 100 inhabitants) 2014 103.9Individuals using the Internet (%) 2014 43.0e
Threatened species 2015 2 308Forested area (% of land area) 2013 51.2e
CO2 emission estimates (000 tons/tons per capita) 2013 43 527/2.8Energy production, primary (Petajoules) 2013 1 293Energy supply per capita (Gigajoules) 2013 43.0Terrestrial and marine areas protected (% of total area) 2014 15.4Population using improved drinking water sources (urban/rural, %) 2015 93.4/75.5Population using improved sanitation facilities (urban/rural, %) 2015 87.0/80.7Net Official Development Assistance received (% of GNI) 2014 0.2a Persons aged 10 years and over. b Data classified according to ISIC Rev. 2. c Break in the time series.d 2013. e Estimate. f Series linked to former series. g Including refugees. h Arrivals of non-resident visitorsat national borders. i Excluding nationals residing abroad. j All figures relate to the end of 2014. k Datarevision. l 2011. m 2012.
World Statistics Pocketbook 65

EgyptRegion Northern Africa Surface area (sq km) 1 002 000Population (proj., 000) 93 384 Pop. density (per sq km) 93.8Capital city Cairo Capital city pop. (000) 18 772Currency Egyptian Pound (EGP) UN membership date 24 October 1945Economic indicators 2005 2010 2014GDP: Gross domestic product (million current US$) 94 456 214 630 282 242GDP growth rate (annual %, const. 2005 prices) 4.6 5.1 2.2GDP per capita (current US$) 1 260.4 2 616.1 3 150.7Economy: Agriculture (% of GVA) a 14.4 14.0 14.5Economy: Industry (% of GVA) a 36.9 37.5 40.0Economy: Services and other activity (% of GVA) a 48.8 48.5 45.6Employment: Agriculture (% of employed) 30.9bc 28.2de 28.0df
Employment: Industry (% of employed) 21.5bc 25.3de 24.1df
Employment: Services and other (% of employed) 47.5bc 46.3de 47.9df
Unemployment (% of labour force) g 11.2 9.0 13.0Labour force participation (female/male pop. %) g 20.5/75.3 22.7/75.6 22.6/75.9CPI: Consumer price index (2000=100) 134 232h 329Agricultural production index (2004-2006=100) 99 109 118f
Food production index (2004-2006=100) 99 110 120f
Balance of payments, current account (million US$) 2 103 –4 504 –5 972Total trade Major trading partners 2015
(million US$) (% of exports) (% of imports)Exports 21 967.3 Saudi Arabia 9.2 China 13.1Imports 74 361.3 Italy 7.4 Germany 7.8Balance –52 394.0 Turkey 5.8 United States 5.9Social indicatorsPopulation growth rate (average annual %) 2010-2015 2.2Urban population (%) 2015 43.1Urban population growth rate (average annual %) 2010-2015 1.7Fertility rate, total (live births per woman) 2010-2015 3.4Life expectancy at birth (females/males, years) 2010-2015 73.1/68.7Total dependency ratio (Pop. aged 0-14 & 65+ per 100 pop. 15-64) 2015 62International migrant stock (000/% of total pop.) mid-2015 491.6/0.5i
Tourist arrivals at national borders (000) 2014 9 628Refugees and others of concern to UNHCR mid-2015 256 384Infant mortality rate (per 1 000 live births) 2010-2015 19Health: Total expenditure (% of GDP) 2014 5.6Education: Primary gross enrolment ratio (f/m per 100 pop.) 2014 103.8/104.1Education: Secondary gross enrolment ratio (f/m per 100 pop.) 2014 85.9/86.3Education: Tertiary gross enrolment ratio (f/m per 100 pop.) 2014 29.9/33.4Intentional homicide rate (per 100 000 pop.) 2014 3.2j
Seats held by women in national parliaments (%) 2016 14.9Environment and infrastructureMobile-cellular subscriptions (per 100 inhabitants) 2014 114.3Individuals using the Internet (%) 2014 31.7k
Patents: Resident filings (per million pop.) 2014 9.0Threatened species 2015 141Forested area (% of land area) 2013 0.1g
CO2 emission estimates (000 tons/tons per capita) 2013 213 012/2.4Energy production, primary (Petajoules) 2013 3 445Energy supply per capita (Gigajoules) 2013 39.0Terrestrial and marine areas protected (% of total area) 2014 9.6Population using improved drinking water sources (urban/rural, %) 2015 100.0/99.0Population using improved sanitation facilities (urban/rural, %) 2015 96.8/93.1Net Official Development Assistance received (% of GNI) 2014 1.3a At factor cost. b Data classified according to ISIC Rev. 3. c Persons aged 15 to 64 years. d Break in thetime series. e Civilians only. f 2013. g Estimate. h Series linked to former series. i Including refugees. j2011. k Population age 6+.
66 World Statistics Pocketbook
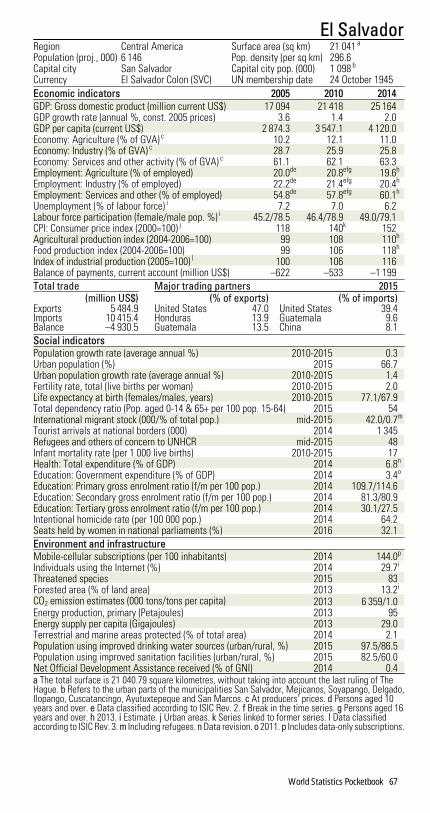
El SalvadorRegion Central America Surface area (sq km) 21 041 a
Population (proj., 000) 6 146 Pop. density (per sq km) 296.6Capital city San Salvador Capital city pop. (000) 1 098 b
Currency El Salvador Colon (SVC) UN membership date 24 October 1945Economic indicators 2005 2010 2014GDP: Gross domestic product (million current US$) 17 094 21 418 25 164GDP growth rate (annual %, const. 2005 prices) 3.6 1.4 2.0GDP per capita (current US$) 2 874.3 3 547.1 4 120.0Economy: Agriculture (% of GVA) c 10.2 12.1 11.0Economy: Industry (% of GVA) c 28.7 25.9 25.8Economy: Services and other activity (% of GVA) c 61.1 62.1 63.3Employment: Agriculture (% of employed) 20.0de 20.8efg 19.6h
Employment: Industry (% of employed) 22.2de 21.4efg 20.4h
Employment: Services and other (% of employed) 54.8de 57.8efg 60.1h
Unemployment (% of labour force) i 7.2 7.0 6.2Labour force participation (female/male pop. %) i 45.2/78.5 46.4/78.9 49.0/79.1CPI: Consumer price index (2000=100) j 118 140k 152Agricultural production index (2004-2006=100) 99 108 110h
Food production index (2004-2006=100) 99 106 118h
Index of industrial production (2005=100) l 100 106 116Balance of payments, current account (million US$) –622 –533 –1 199Total trade Major trading partners 2015
(million US$) (% of exports) (% of imports)Exports 5 484.9 United States 47.0 United States 39.4Imports 10 415.4 Honduras 13.9 Guatemala 9.6Balance –4 930.5 Guatemala 13.5 China 8.1Social indicatorsPopulation growth rate (average annual %) 2010-2015 0.3Urban population (%) 2015 66.7Urban population growth rate (average annual %) 2010-2015 1.4Fertility rate, total (live births per woman) 2010-2015 2.0Life expectancy at birth (females/males, years) 2010-2015 77.1/67.9Total dependency ratio (Pop. aged 0-14 & 65+ per 100 pop. 15-64) 2015 54International migrant stock (000/% of total pop.) mid-2015 42.0/0.7m
Tourist arrivals at national borders (000) 2014 1 345Refugees and others of concern to UNHCR mid-2015 48Infant mortality rate (per 1 000 live births) 2010-2015 17Health: Total expenditure (% of GDP) 2014 6.8n
Education: Government expenditure (% of GDP) 2014 3.4o
Education: Primary gross enrolment ratio (f/m per 100 pop.) 2014 109.7/114.6Education: Secondary gross enrolment ratio (f/m per 100 pop.) 2014 81.3/80.9Education: Tertiary gross enrolment ratio (f/m per 100 pop.) 2014 30.1/27.5Intentional homicide rate (per 100 000 pop.) 2014 64.2Seats held by women in national parliaments (%) 2016 32.1Environment and infrastructureMobile-cellular subscriptions (per 100 inhabitants) 2014 144.0p
Individuals using the Internet (%) 2014 29.7i
Threatened species 2015 83Forested area (% of land area) 2013 13.2i
CO2 emission estimates (000 tons/tons per capita) 2013 6 359/1.0Energy production, primary (Petajoules) 2013 95Energy supply per capita (Gigajoules) 2013 29.0Terrestrial and marine areas protected (% of total area) 2014 2.1Population using improved drinking water sources (urban/rural, %) 2015 97.5/86.5Population using improved sanitation facilities (urban/rural, %) 2015 82.5/60.0Net Official Development Assistance received (% of GNI) 2014 0.4a The total surface is 21 040.79 square kilometres, without taking into account the last ruling of TheHague. b Refers to the urban parts of the municipalities San Salvador, Mejicanos, Soyapango, Delgado,Ilopango, Cuscatancingo, Ayutuxtepeque and San Marcos. c At producers' prices. d Persons aged 10years and over. e Data classified according to ISIC Rev. 2. f Break in the time series. g Persons aged 16years and over. h 2013. i Estimate. j Urban areas. k Series linked to former series. l Data classifiedaccording to ISIC Rev. 3. m Including refugees. n Data revision. o 2011. p Includes data-only subscriptions.
World Statistics Pocketbook 67
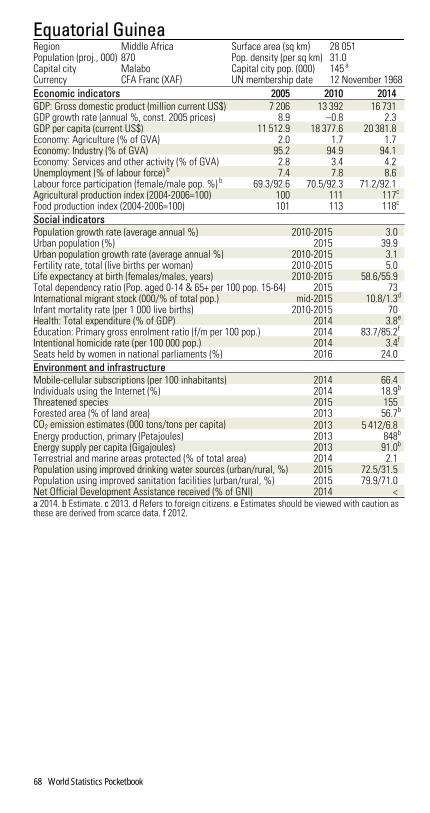
Equatorial GuineaRegion Middle Africa Surface area (sq km) 28 051Population (proj., 000) 870 Pop. density (per sq km) 31.0Capital city Malabo Capital city pop. (000) 145 a
Currency CFA Franc (XAF) UN membership date 12 November 1968Economic indicators 2005 2010 2014GDP: Gross domestic product (million current US$) 7 206 13 392 16 731GDP growth rate (annual %, const. 2005 prices) 8.9 –0.8 2.3GDP per capita (current US$) 11 512.9 18 377.6 20 381.8Economy: Agriculture (% of GVA) 2.0 1.7 1.7Economy: Industry (% of GVA) 95.2 94.9 94.1Economy: Services and other activity (% of GVA) 2.8 3.4 4.2Unemployment (% of labour force) b 7.4 7.8 8.6Labour force participation (female/male pop. %) b 69.3/92.6 70.5/92.3 71.2/92.1Agricultural production index (2004-2006=100) 100 111 117c
Food production index (2004-2006=100) 101 113 118c
Social indicatorsPopulation growth rate (average annual %) 2010-2015 3.0Urban population (%) 2015 39.9Urban population growth rate (average annual %) 2010-2015 3.1Fertility rate, total (live births per woman) 2010-2015 5.0Life expectancy at birth (females/males, years) 2010-2015 58.6/55.9Total dependency ratio (Pop. aged 0-14 & 65+ per 100 pop. 15-64) 2015 73International migrant stock (000/% of total pop.) mid-2015 10.8/1.3d
Infant mortality rate (per 1 000 live births) 2010-2015 70Health: Total expenditure (% of GDP) 2014 3.8e
Education: Primary gross enrolment ratio (f/m per 100 pop.) 2014 83.7/85.2f
Intentional homicide rate (per 100 000 pop.) 2014 3.4f
Seats held by women in national parliaments (%) 2016 24.0Environment and infrastructureMobile-cellular subscriptions (per 100 inhabitants) 2014 66.4Individuals using the Internet (%) 2014 18.9b
Threatened species 2015 155Forested area (% of land area) 2013 56.7b
CO2 emission estimates (000 tons/tons per capita) 2013 5 412/6.8Energy production, primary (Petajoules) 2013 848b
Energy supply per capita (Gigajoules) 2013 91.0b
Terrestrial and marine areas protected (% of total area) 2014 2.1Population using improved drinking water sources (urban/rural, %) 2015 72.5/31.5Population using improved sanitation facilities (urban/rural, %) 2015 79.9/71.0Net Official Development Assistance received (% of GNI) 2014 <a 2014. b Estimate. c 2013. d Refers to foreign citizens. e Estimates should be viewed with caution asthese are derived from scarce data. f 2012.
68 World Statistics Pocketbook

EritreaRegion Eastern Africa Surface area (sq km) 117 600Population (proj., 000) 5 352 Pop. density (per sq km) 53.0Capital city Asmara Capital city pop. (000) 804Currency Nakfa (ERN) UN membership date 28 May 1993Economic indicators 2005 2010 2014GDP: Gross domestic product (million current US$) 1 098 2 117 3 858GDP growth rate (annual %, const. 2005 prices) 1.5 2.2 1.7GDP per capita (current US$) 262.1 451.4 754.9Economy: Agriculture (% of GVA) 24.2 19.1 17.2Economy: Industry (% of GVA) 21.9 23.1 23.6Economy: Services and other activity (% of GVA) 53.9 57.8 59.2Unemployment (% of labour force) a 8.5 8.2 8.3Labour force participation (female/male pop. %) a 76.5/89.2 77.6/89.8 77.6/90.3Agricultural production index (2004-2006=100) 106 106 110b
Food production index (2004-2006=100) 106 106 110b
Social indicatorsPopulation growth rate (average annual %) 2010-2015 2.2Urban population (%) 2015 22.6Urban population growth rate (average annual %) 2010-2015 5.1Fertility rate, total (live births per woman) 2010-2015 4.4Life expectancy at birth (females/males, years) 2010-2015 65.2/60.9Total dependency ratio (Pop. aged 0-14 & 65+ per 100 pop. 15-64) 2015 83International migrant stock (000/% of total pop.) mid-2015 15.9/0.3a
Refugees and others of concern to UNHCR mid-2015 2 967Infant mortality rate (per 1 000 live births) 2010-2015 46Health: Total expenditure (% of GDP) 2014 3.3c
Education: Primary gross enrolment ratio (f/m per 100 pop.) 2014 47.2/55.2b
Education: Secondary gross enrolment ratio (f/m per 100 pop.) 2014 31.6/39.3b
Education: Tertiary gross enrolment ratio (f/m per 100 pop.) 2014 1.7/3.4Intentional homicide rate (per 100 000 pop.) 2014 9.7d
Seats held by women in national parliaments (%) 2016 22.0Environment and infrastructureMobile-cellular subscriptions (per 100 inhabitants) 2014 6.4a
Individuals using the Internet (%) 2014 1.0a
Threatened species 2015 113Forested area (% of land area) 2013 15.0a
CO2 emission estimates (000 tons/tons per capita) 2013 667/0.2Energy production, primary (Petajoules) 2013 27Energy supply per capita (Gigajoules) 2013 7.0Terrestrial and marine areas protected (% of total area) 2014 3.1Population using improved drinking water sources (urban/rural, %) 2015 73.2/53.3Population using improved sanitation facilities (urban/rural, %) 2015 44.6/7.3Net Official Development Assistance received (% of GNI) 2014 2.2a Estimate. b 2013. c Estimates should be viewed with caution as these are derived from scarce data.d 2012.
World Statistics Pocketbook 69

EstoniaRegion Northern Europe Surface area (sq km) 45 227Population (proj., 000) 1 309 Pop. density (per sq km) 30.9Capital city Tallinn Capital city pop. (000) 391Currency Euro (EUR) UN membership date 17 September 1991Economic indicators 2005 2010 2014GDP: Gross domestic product (million current US$) 14 003 19 505 26 485GDP growth rate (annual %, const. 2005 prices) 9.4 2.5 2.9GDP per capita (current US$) 10 329.6 14 642.5 20 122.4Economy: Agriculture (% of GVA) a 3.5 3.2 3.4Economy: Industry (% of GVA) b 29.8 28.0 28.1Economy: Services and other activity (% of GVA) cd 66.7 68.8 68.5Employment: Agriculture (% of employed) 5.2e 4.0f 3.9Employment: Industry (% of employed) 33.8e 30.9f 30.5Employment: Services and other (% of employed) 61.1e 64.9f 65.5Unemployment (% of labour force) g 8.0 16.7 7.4Labour force participation (female/male pop. %) g 53.4/65.6 56.0/67.7 55.4/69.4CPI: Consumer price index (2000=100) 119 151 169Agricultural production index (2004-2006=100) 103 110 127h
Food production index (2004-2006=100) 103 110 127h
Index of industrial production (2005=100) i 100 104 134Balance of payments, current account (million US$) –1 386 344 259Total trade Major trading partners 2015
(million US$) (% of exports) (% of imports)Exports 13 964.8 Sweden 17.3 Finland 9.9Imports 15 717.6 Finland 14.8 Germany 9.7Balance –1 752.8 Russian Federation 9.7 Russian Federation 9.6Social indicatorsPopulation growth rate (average annual %) 2010-2015 –0.3Urban population (%) 2015 67.5Urban population growth rate (average annual %) 2010-2015 –0.5Fertility rate, total (live births per woman) 2010-2015 1.6Life expectancy at birth (females/males, years) 2010-2015 81.1/71.6Total dependency ratio (Pop. aged 0-14 & 65+ per 100 pop. 15-64) 2015 54International migrant stock (000/% of total pop.) mid-2015 202.4/15.4Tourist arrivals at national borders (000) 2014 2 918Refugees and others of concern to UNHCR mid-2015 86 756j
Infant mortality rate (per 1 000 live births) 2010-2015 3Health: Total expenditure (% of GDP) 2014 6.4Health: Physicians (per 1 000 pop.) 2013 3.2k
Education: Government expenditure (% of GDP) 2014 4.7k
Education: Primary gross enrolment ratio (f/m per 100 pop.) 2014 100.4/101.0h
Education: Secondary gross enrolment ratio (f/m per 100 pop.) 2014 108.1/109.0h
Education: Tertiary gross enrolment ratio (f/m per 100 pop.) 2014 88.1/58.7h
Intentional homicide rate (per 100 000 pop.) 2014 3.1Seats held by women in national parliaments (%) 2016 23.8Environment and infrastructureMobile-cellular subscriptions (per 100 inhabitants) 2014 160.7Individuals using the Internet (%) 2014 84.2l
Patents: Resident filings (per million pop.) 2014 61.0Threatened species 2015 17Forested area (% of land area) 2013 52.7g
CO2 emission estimates (000 tons/tons per capita) 2013 19 915/15.1Energy production, primary (Petajoules) 2013 237Energy supply per capita (Gigajoules) 2013 195.0Terrestrial and marine areas protected (% of total area) 2014 19.9Population using improved drinking water sources (urban/rural, %) 2015 100.0/99.0Population using improved sanitation facilities (urban/rural, %) 2015 97.5/96.6Net Official Development Assistance disbursed (% of GNI) 2014 0.1a Excludes irrigation canals and landscaping care. b Excludes publishing activities, includes irrigationcanals. c Excludes repair of personal and household goods. d Includes publishing activities and land-scaping care. e Persons aged 15 to 74 years. f Break in the time series. g Estimate. h 2013. i Excludingwater and waste management. j Almost all people recorded as being stateless have permanent residenceand enjoy more rights than foreseen in the 1954 Convention relating to the Status of Stateless Persons.k 2012. l Population age 16-74.
70 World Statistics Pocketbook

EthiopiaRegion Eastern Africa Surface area (sq km) 1 104 300Population (proj., 000) 101 853 Pop. density (per sq km) 101.9Capital city Addis Ababa Capital city pop. (000) 3 238Currency Ethiopian Birr (ETB) UN membership date 13 November 1945Economic indicators 2005 2010 2014GDP: Gross domestic product (million current US$) 12 164 26 311 53 638GDP growth rate (annual %, const. 2005 prices) 11.8 12.6 9.9GDP per capita (current US$) 158.8 300.5 553.2Economy: Agriculture (% of GVA) 45.2 45.3 41.9Economy: Industry (% of GVA) 13.1 10.4 15.3Economy: Services and other activity (% of GVA) 41.7 44.3 42.8Employment: Agriculture (% of employed) 79.3abc 8.6abcde 72.7f
Employment: Industry (% of employed) 6.6abc 22.1abcde 7.4f
Employment: Services and other (% of employed) 13.0abc 69.2abcde 19.9f
Unemployment (% of labour force) g 5.4 5.2 5.3Labour force participation (female/male pop. %) g 78.4/90.8 77.5/90.0 76.9/89.1CPI: Consumer price index (2000=100) h 138 313 601Agricultural production index (2004-2006=100) 102 137 147f
Food production index (2004-2006=100) 103 137 148f
Index of industrial production (2005=100) ai 100 159 242f
Balance of payments, current account (million US$) –1 568 –425 –2 985j
Total trade Major trading partners 2015(million US$) (% of exports) (% of imports)
Exports 5 027.5 Somalia 13.4 China 27.8Imports 25 815.3 Kuwait 12.8 Areas nes 22.4k
Balance –20 787.8 Netherlands 10.6 Kuwait 5.7Social indicatorsPopulation growth rate (average annual %) 2010-2015 2.5Urban population (%) 2015 19.5Urban population growth rate (average annual %) 2010-2015 4.9Fertility rate, total (live births per woman) 2010-2015 4.6Life expectancy at birth (females/males, years) 2010-2015 65.0/61.3Total dependency ratio (Pop. aged 0-14 & 65+ per 100 pop. 15-64) 2015 82International migrant stock (000/% of total pop.) mid-2015 1 073.0/1.1l
Tourist arrivals at national borders (000) 2014 770mn
Refugees and others of concern to UNHCR mid-2015 705 686Infant mortality rate (per 1 000 live births) 2010-2015 50Health: Total expenditure (% of GDP) 2014 4.9Education: Government expenditure (% of GDP) 2014 4.5f
Education: Primary gross enrolment ratio (f/m per 100 pop.) 2014 95.8/104.3Education: Secondary gross enrolment ratio (f/m per 100 pop.) 2014 34.5/37.9j
Education: Tertiary gross enrolment ratio (f/m per 100 pop.) 2014 5.3/10.9Intentional homicide rate (per 100 000 pop.) 2014 8.0j
Seats held by women in national parliaments (%) 2016 38.8Environment and infrastructureMobile-cellular subscriptions (per 100 inhabitants) 2014 31.6Individuals using the Internet (%) 2014 2.9g
Threatened species 2015 145Forested area (% of land area) 2013 12.4g
CO2 emission estimates (000 tons/tons per capita) 2013 10 634/0.1Energy production, primary (Petajoules) 2013 1 285Energy supply per capita (Gigajoules) 2013 15.0Terrestrial and marine areas protected (% of total area) 2014 18.4Population using improved drinking water sources (urban/rural, %) 2015 93.1/48.6Population using improved sanitation facilities (urban/rural, %) 2015 27.2/28.2Net Official Development Assistance received (% of GNI) 2014 6.6a Data classified according to ISIC Rev. 3. b Break in the time series. c Persons aged 10 years and over.d Urban areas. e 2006. f 2013. g Estimate. h Index base: 2001=100. i Twelve months ending 30 June ofthe year stated. j 2012. k See technical notes. l Including refugees. m Including nationals residing abroad.n Arrivals through all ports of entry.
World Statistics Pocketbook 71

Faeroe IslandsRegion Northern Europe Surface area (sq km) 1 393Population (proj., 000) 48 Pop. density (per sq km) 34.6Capital city Tórshavn Capital city pop. (000) 21 a
Currency Danish Krone (DKK)Economic indicators 2005 2010 2014Employment: Agriculture (% of employed) bc 11.1 ... ...Employment: Industry (% of employed) bc 22.2 ... ...Employment: Services and other (% of employed) bc 66.7 ... ...Unemployment (% of labour force) 3.2b 6.4def 4.0deg
Labour force participation (female/male pop. %) de ... 77.5/85.3 79.4/86.0g
CPI: Consumer price index (2000=100) 109 121 125Agricultural production index (2004-2006=100) 100 102 104g
Food production index (2004-2006=100) 100 102 104g
Balance of payments, current account (million US$) 31 144 ...Social indicatorsPopulation growth rate (average annual %) 2010-2015 –0.2Urban population (%) 2015 42.0Urban population growth rate (average annual %) 2010-2015 0.5Life expectancy at birth (females/males, years) 2010-2015 82.3/76.8h
Total dependency ratio (Pop. aged 0-14 & 65+ per 100 pop. 15-64) 2015 56h
International migrant stock (000/% of total pop.) mid-2015 5.5/11.5Environment and infrastructureMobile-cellular subscriptions (per 100 inhabitants) 2014 124.1Individuals using the Internet (%) 2014 94.7i
Threatened species 2015 14Forested area (% of land area) 2013 0.1i
CO2 emission estimates (000 tons/tons per capita) 2013 594/12.3Energy production, primary (Petajoules) 2013 0Energy supply per capita (Gigajoules) 2013 179.0i
a 2014. b Persons aged 16 years and over. c Data classified according to ISIC Rev. 2. d Excluding theinstitutional population. e Persons aged 15 to 74 years. f Break in the time series. g 2013. h 2008. iEstimate.
72 World Statistics Pocketbook

Falkland Islands (Malvinas)Region South America Surface area (sq km) 12 173Population (proj., 000) 3 Pop. density (per sq km) 0.2Capital city Stanley Capital city pop. (000) 2 a
Currency Falkland Islands Pound (FKP)Economic indicators 2005 2010 2014Unemployment (% of labour force) b ... ... 1.2c
Labour force participation (female/male pop. %) b ... ... 77.2/86.0c
Agricultural production index (2004-2006=100) 103 95 95c
Food production index (2004-2006=100) 100 103 103c
Social indicatorsPopulation growth rate (average annual %) 2010-2015 0.3Urban population (%) 2015 76.2Urban population growth rate (average annual %) 2010-2015 1.0Total dependency ratio (Pop. aged 0-14 & 65+ per 100 pop. 15-64) 2015 33d
International migrant stock (000/% of total pop.) mid-2015 1.6/54.1Environment and infrastructureMobile-cellular subscriptions (per 100 inhabitants) 2014 136.7Individuals using the Internet (%) 2014 97.6e
Threatened species 2015 23Forested area (% of land area) 2013 0.0e
CO2 emission estimates (000 tons/tons per capita) 2013 55/19.0Energy production, primary (Petajoules) 2013 0e
Energy supply per capita (Gigajoules) 2013 258.0e
Terrestrial and marine areas protected (% of total area) 2014 48.2a 2014. b Persons aged 16 to 65 years. c 2013. d 2006. e Estimate.
World Statistics Pocketbook 73

FijiRegion Oceania-Melanesia Surface area (sq km) 18 272Population (proj., 000) 898 Pop. density (per sq km) 49.1Capital city Suva Capital city pop. (000) 176 a
Currency Fiji Dollar (FJD) UN membership date 13 October 1970Economic indicators 2005 2010 2014GDP: Gross domestic product (million current US$) 3 112 3 251 4 532GDP growth rate (annual %, const. 2005 prices) 0.7 3.1 3.8GDP per capita (current US$) 3 786.9 3 780.2 5 112.2Economy: Agriculture (% of GVA) 12.9 10.2 11.5Economy: Industry (% of GVA) 17.9 19.9 18.7Economy: Services and other activity (% of GVA) 69.2 69.9 69.9Employment: Agriculture (% of employed) bc 1.5 1.0d ...Employment: Industry (% of employed) bc 30.4 25.7d ...Employment: Services and other (% of employed) bc 68.1 73.2d ...Unemployment (% of labour force) e 4.6 8.9 8.3Labour force participation (female/male pop. %) e 38.1/73.8 37.4/71.8 37.1/71.4CPI: Consumer price index (2000=100) 115 146 164f
Agricultural production index (2004-2006=100) 99 82 86g
Food production index (2004-2006=100) 99 82 86g
Index of industrial production (2005=100) h 100 101 ...Balance of payments, current account (million US$) –212i –142 –561g
Total trade Major trading partners 2015(million US$)a (% of exports)a (% of imports)a
Exports 1 373.3 Bunkers 14.8j Singapore 25.6Imports 3 250.5 United States 12.4 Australia 14.0Balance –1 877.2 Australia 11.5 New Zealand 14.0Social indicatorsPopulation growth rate (average annual %) 2010-2015 0.7Urban population (%) 2015 53.7Urban population growth rate (average annual %) 2010-2015 1.5Fertility rate, total (live births per woman) 2010-2015 2.6Life expectancy at birth (females/males, years) 2010-2015 72.9/66.9Total dependency ratio (Pop. aged 0-14 & 65+ per 100 pop. 15-64) 2015 53International migrant stock (000/% of total pop.) mid-2015 13.8/1.5Tourist arrivals at national borders (000) 2014 693k
Refugees and others of concern to UNHCR mid-2015 20Infant mortality rate (per 1 000 live births) 2010-2015 16Health: Total expenditure (% of GDP) 2014 4.5Education: Government expenditure (% of GDP) 2014 3.9g
Education: Primary gross enrolment ratio (f/m per 100 pop.) 2014 106.1/105.0g
Education: Secondary gross enrolment ratio (f/m per 100 pop.) 2014 93.4/84.3l
Intentional homicide rate (per 100 000 pop.) 2014 3.0l
Seats held by women in national parliaments (%) 2016 16.0Environment and infrastructureMobile-cellular subscriptions (per 100 inhabitants) 2014 98.8m
Individuals using the Internet (%) 2014 41.8e
Threatened species 2015 278Forested area (% of land area) 2013 55.1e
CO2 emission estimates (000 tons/tons per capita) 2013 1 709/1.9Energy production, primary (Petajoules) 2013 8Energy supply per capita (Gigajoules) 2013 36.0Terrestrial and marine areas protected (% of total area) 2014 1.0Population using improved drinking water sources (urban/rural, %) 2015 99.6/91.2Population using improved sanitation facilities (urban/rural, %) 2015 93.4/88.4Net Official Development Assistance received (% of GNI) 2014 2.3a 2014. b Data classified according to ISIC Rev. 2. c Paid employment only. d 2007. e Estimate. f Serieslinked to former series. g 2013. h Data classified according to ISIC Rev. 3. i Break in the time series. j Seetechnical notes. k Excluding nationals residing abroad. l 2012. m Reduction in multiple sim usage persubscriber (of different network operators).
74 World Statistics Pocketbook

FinlandRegion Northern Europe Surface area (sq km) 338 436 a
Population (proj., 000) 5 524 a Pop. density (per sq km) 18.2 a
Capital city Helsinki Capital city pop. (000) 1 180Currency Euro (EUR) UN membership date 14 December 1955Economic indicators 2005 2010 2014GDP: Gross domestic product (million current US$) 204 431 247 800 272 217GDP growth rate (annual %, const. 2005 prices) 2.8 3.0 –0.4GDP per capita (current US$) 38 966.2 46 165.1 49 677.6Economy: Agriculture (% of GVA) b 2.6 2.7 2.8Economy: Industry (% of GVA) c 33.5 30.0 26.5Economy: Services and other activity (% of GVA) de 63.9 67.3 70.6Employment: Agriculture (% of employed) 4.6fg 4.1 3.9Employment: Industry (% of employed) 25.9fg 23.3 22.0Employment: Services and other (% of employed) 69.3fg 72.0 73.7Unemployment (% of labour force) h 8.4 8.4 8.7Labour force participation (female/male pop. %) h 56.8/65.4 56.2/64.6 55.4/62.4CPI: Consumer price index (2000=100) 106i 116 127Agricultural production index (2004-2006=100) 102 94 99j
Food production index (2004-2006=100) 102 94 99j
Index of industrial production (2005=100) 100 100 95Balance of payments, current account (million US$) 7 788g 3 168 –2 686Total trade Major trading partners 2015
(million US$) (% of exports) (% of imports)Exports 59 682.3 Germany 13.6 Germany 14.9Imports 60 174.4 Sweden 10.1 Sweden 11.2Balance –492.1 United States 6.7 Russian Federation 10.9Social indicatorsPopulation growth rate (average annual %) 2010-2015 0.5a
Urban population (%) 2015 84.2a
Urban population growth rate (average annual %) 2010-2015 0.5a
Fertility rate, total (live births per woman) 2010-2015 1.8a
Life expectancy at birth (females/males, years) 2010-2015 83.4/77.6a
Total dependency ratio (Pop. aged 0-14 & 65+ per 100 pop. 15-64) 2015 58a
International migrant stock (000/% of total pop.) mid-2015 315.9/5.7a
Tourist arrivals at national borders (000) k 2014 2 731Refugees and others of concern to UNHCR mid-2015 16 348l
Infant mortality rate (per 1 000 live births) 2010-2015 2a
Health: Total expenditure (% of GDP) 2014 9.7Education: Government expenditure (% of GDP) 2014 7.2j
Education: Primary gross enrolment ratio (f/m per 100 pop.) 2014 101.4/101.5Education: Secondary gross enrolment ratio (f/m per 100 pop.) 2014 152.1/139.1Education: Tertiary gross enrolment ratio (f/m per 100 pop.) 2014 97.2/80.5Intentional homicide rate (per 100 000 pop.) 2014 1.6Seats held by women in national parliaments (%) 2016 41.5Environment and infrastructureMobile-cellular subscriptions (per 100 inhabitants) 2014 139.7Individuals using the Internet (%) 2014 92.4m
Patents: Resident filings (per million pop.) 2014 662.0Threatened species 2015 25Forested area (% of land area) 2013 73.1h
CO2 emission estimates (000 tons/tons per capita) 2013 46 300/8.5Energy production, primary (Petajoules) 2013 755Energy supply per capita (Gigajoules) 2013 252.0Terrestrial and marine areas protected (% of total area) 2014 14.1Population using improved drinking water sources (urban/rural, %) 2015 100.0/100.0Population using improved sanitation facilities (urban/rural, %) 2015 99.5/88.0Net Official Development Assistance disbursed (% of GNI) n 2014 0.6a Including Åland Islands. b Excludes irrigation canals and landscaping care. c Excludes publishing ac-tivities, includes irrigation canals. d Excludes repair of personal and household goods. e Includespublishing activities and landscaping care. f Data classified according to ISIC Rev. 3. g Break in the timeseries. h Estimate. i Series linked to former series. j 2013. k Arrivals of non-resident tourists in all typesof tourism accommodation establishments. l Refugee population relates to the end of 2014. m Populationage 16-74. n Development Assistance Committee member (OECD).
World Statistics Pocketbook 75

FranceRegion Western Europe Surface area (sq km) 551 500Population (proj., 000) 64 668 Pop. density (per sq km) 118.1Capital city Paris Capital city pop. (000) 10 843Currency Euro (EUR) UN membership date 24 October 1945Economic indicators 2005 2010 2014GDP: Gross domestic product (million current US$) a 2 203 624 2 646 837 2 829 192GDP growth rate (annual %, const. 2005 prices) a 1.6 2.0 0.2GDP per capita (current US$) a 34 832.9 40 667.0 42 650.8Economy: Agriculture (% of GVA) ab 1.9 1.8 1.7Economy: Industry (% of GVA) ac 21.5 19.6 19.4Economy: Services and other activity (% of GVA) ade 76.6 78.6 78.9Employment: Agriculture (% of employed) 3.6fg 2.9 2.8Employment: Industry (% of employed) 23.8fg 22.2 20.5Employment: Services and other (% of employed) 72.3fg 74.4 75.8Unemployment (% of labour force) h 8.5 8.9 10.3Labour force participation (female/male pop. %) h 50.1/62.0 50.9/61.3 50.9/60.4CPI: Consumer price index (2000=100) 110 119 125Agricultural production index (2004-2006=100) 100 97 97i
Food production index (2004-2006=100) 100 97 97i
Index of industrial production (2005=100) j 100 90 87Balance of payments, current account (million US$) –137 –22 034 –27 481Total trade Major trading partners 2015
(million US$)k (% of exports)k (% of imports)k
Exports 573 055.5 Germany 13.9 Germany 14.9Imports 651 495.6 United States 8.4 United States 8.9Balance –78 440.1 Spain 6.3 China 8.1Social indicatorsPopulation growth rate (average annual %) 2010-2015 0.5Urban population (%) 2015 79.5Urban population growth rate (average annual %) 2010-2015 0.8Fertility rate, total (live births per woman) 2010-2015 2.0Life expectancy at birth (females/males, years) 2010-2015 84.9/78.8Total dependency ratio (Pop. aged 0-14 & 65+ per 100 pop. 15-64) 2015 60International migrant stock (000/% of total pop.) mid-2015 7 784.4/12.1Tourist arrivals at national borders (000) 2014 83 767Refugees and others of concern to UNHCR mid-2015 320 089Infant mortality rate (per 1 000 live births) 2010-2015 3Health: Total expenditure (% of GDP) 2014 11.5l
Health: Physicians (per 1 000 pop.) 2013 3.2Education: Government expenditure (% of GDP) 2014 5.5m
Education: Primary gross enrolment ratio (f/m per 100 pop.) 2014 105.0/105.7Education: Secondary gross enrolment ratio (f/m per 100 pop.) 2014 111.2/110.1Education: Tertiary gross enrolment ratio (f/m per 100 pop.) 2014 71.0/57.9Intentional homicide rate (per 100 000 pop.) 2014 1.2Seats held by women in national parliaments (%) 2016 26.2Environment and infrastructureMobile-cellular subscriptions (per 100 inhabitants) 2014 100.4Individuals using the Internet (%) 2014 83.8n
Patents: Resident filings (per million pop.) 2014 379.0Threatened species 2015 236o
Forested area (% of land area) 2013 30.6h
CO2 emission estimates (000 tons/tons per capita) 2013 333 191/5.2k
Energy production, primary (Petajoules) 2013 5 659k
Energy supply per capita (Gigajoules) 2013 166.0k
Terrestrial and marine areas protected (% of total area) 2014 25.7Population using improved drinking water sources (urban/rural, %) 2015 100.0/100.0Population using improved sanitation facilities (urban/rural, %) 2015 98.6/98.9Net Official Development Assistance disbursed (% of GNI) p 2014 0.4a Including Guadeloupe, Martinique, Réunion and French Guiana. b Excludes irrigation canals and land-scaping care. c Excludes publishing activities, includes irrigation canals. d Excludes repair of personaland household goods. e Includes publishing activities and landscaping care. f Data classified accordingto ISIC Rev. 3. g Break in the time series. h Estimate. i 2013. j Excluding the Overseas Departments (FrenchGuiana, Guadeloupe, Martinique, Mayotte and Réunion). k Including Monaco. l Estimates are based ondifferent national accounting bases (2000, 2005 and 2010). m 2012. n Population age 16-74. o Excludingoverseas territories. p Development Assistance Committee member (OECD).
76 World Statistics Pocketbook

French GuianaRegion South America Surface area (sq km) 83 534Population (proj., 000) 276 Pop. density (per sq km) 3.4Capital city Cayenne Capital city pop. (000) 58 a
Currency Euro (EUR)Economic indicators 2005 2010 2014Employment: Industry (% of employed) bc ... 14.1 14.9d
Employment: Services and other (% of employed) bc ... 51.5 58.3d
Unemployment (% of labour force) e 24.8 21.0 22.7Labour force participation (female/male pop. %) e 45.7/61.5 48.0/61.4 49.0/60.8CPI: Consumer price index (2000=100) 108 119 126Agricultural production index (2004-2006=100) 96 90 89f
Food production index (2004-2006=100) 96 90 89f
Social indicatorsPopulation growth rate (average annual %) 2010-2015 2.8Urban population (%) 2015 84.4Urban population growth rate (average annual %) 2010-2015 2.8Fertility rate, total (live births per woman) 2010-2015 3.5Life expectancy at birth (females/males, years) 2010-2015 82.6/75.8Total dependency ratio (Pop. aged 0-14 & 65+ per 100 pop. 15-64) 2015 63International migrant stock (000/% of total pop.) mid-2015 106.1/39.5Tourist arrivals at national borders (000) 2014 185Infant mortality rate (per 1 000 live births) 2010-2015 10Environment and infrastructureThreatened species 2015 67Forested area (% of land area) 2013 98.9e
CO2 emission estimates (000 tons/tons per capita) 2013 759/3.0Energy production, primary (Petajoules) 2013 3Energy supply per capita (Gigajoules) 2013 52.0e
Terrestrial and marine areas protected (% of total area) 2014 48.8a 2014. b Persons aged 15 to 64 years. c Excluding the institutional population. d 2012. e Estimate. f 2013.
World Statistics Pocketbook 77

French PolynesiaRegion Oceania-Polynesia Surface area (sq km) 4 000Population (proj., 000) 286 Pop. density (per sq km) 78.1Capital city Papeete Capital city pop. (000) 133 ab
Currency CFP Franc (XPF)Economic indicators 2005 2010 2014GDP: Gross domestic product (million current US$) 5 703 6 081 5 623GDP growth rate (annual %, const. 2005 prices) 1.4 –2.5 –2.7GDP per capita (current US$) 22 374.0 22 683.7 20 098.5Economy: Agriculture (% of GVA) 3.4 2.5 2.7Economy: Industry (% of GVA) 12.7 12.3 12.1Economy: Services and other activity (% of GVA) 83.9 85.2 85.3Employment: Agriculture (% of employed) c 3.5 2.7 2.8d
Employment: Industry (% of employed) c 17.2 15.9 15.8d
Employment: Services and other (% of employed) c 79.2 81.4 81.4d
Unemployment (% of labour force) e 15.7 11.6 18.0Labour force participation (female/male pop. %) e 47.2/65.8 47.0/64.1 46.8/63.3CPI: Consumer price index (2000=100) 106 116 122Agricultural production index (2004-2006=100) 104 99 105f
Food production index (2004-2006=100) 104 99 105f
Balance of payments, current account (million US$) 9 –18 208Total trade Major trading partners 2015
(million US$)a (% of exports)a (% of imports)a
Exports 170.1 China, Hong Kong SAR 28.7 France 25.9Imports 1 761.7 Japan 27.6 Singapore 13.4Balance –1 591.6 United States 11.9 United States 10.7Social indicatorsPopulation growth rate (average annual %) 2010-2015 1.1Urban population (%) 2015 55.9Urban population growth rate (average annual %) 2010-2015 0.9Fertility rate, total (live births per woman) 2010-2015 2.1Life expectancy at birth (females/males, years) 2010-2015 78.6/74.0Total dependency ratio (Pop. aged 0-14 & 65+ per 100 pop. 15-64) 2015 42International migrant stock (000/% of total pop.) mid-2015 30.1/10.6Tourist arrivals at national borders (000) 2014 181g
Infant mortality rate (per 1 000 live births) 2010-2015 7Environment and infrastructureMobile-cellular subscriptions (per 100 inhabitants) 2014 85.7e
Individuals using the Internet (%) 2014 60.7e
Threatened species 2015 175Forested area (% of land area) 2013 42.4e
CO2 emission estimates (000 tons/tons per capita) 2013 821/3.0Energy production, primary (Petajoules) 2013 1e
Energy supply per capita (Gigajoules) 2013 44.0Terrestrial and marine areas protected (% of total area) 2014 <Population using improved drinking water sources (urban/rural, %) 2015 100.0/100.0Population using improved sanitation facilities (urban/rural, %) 2015 98.5/98.5a 2014. b Refers to the total population in the communes of Arue, Faaa, Mahina, Papara, Papeete, Piraeand Punaauia. c Employees only. d 2011. e Estimate. f 2013. g Excluding nationals residing abroad.
78 World Statistics Pocketbook

GabonRegion Middle Africa Surface area (sq km) 267 668Population (proj., 000) 1 763 Pop. density (per sq km) 6.8Capital city Libreville Capital city pop. (000) 707Currency CFA Franc (XAF) UN membership date 20 September 1960Economic indicators 2005 2010 2014GDP: Gross domestic product (million current US$) 9 579 12 882 17 413GDP growth rate (annual %, const. 2005 prices) 1.1 6.8 5.0GDP per capita (current US$) 6 952.5 8 354.4 10 317.5Economy: Agriculture (% of GVA) 5.2 4.6 3.9Economy: Industry (% of GVA) 62.6 55.6 50.9Economy: Services and other activity (% of GVA) 32.2 39.8 45.2Employment: Agriculture (% of employed) a 24.2 ... ...Employment: Industry (% of employed) a 11.8 ... ...Employment: Services and other (% of employed) a 64.0 ... ...Unemployment (% of labour force) b 21.7 20.4 20.4Labour force participation (female/male pop. %) b 54.1/64.1 39.0/56.4 39.5/57.2CPI: Consumer price index (2000=100) cd 105 123 128e
Agricultural production index (2004-2006=100) 100 117 122e
Food production index (2004-2006=100) 100 115 120e
Index of industrial production (2005=100) fg 100h 117h ...Balance of payments, current account (million US$) 1 983 ... ...Social indicatorsPopulation growth rate (average annual %) 2010-2015 2.3Urban population (%) 2015 87.2Urban population growth rate (average annual %) 2010-2015 2.7Fertility rate, total (live births per woman) 2010-2015 4.0Life expectancy at birth (females/males, years) 2010-2015 64.1/63.2Total dependency ratio (Pop. aged 0-14 & 65+ per 100 pop. 15-64) 2015 73International migrant stock (000/% of total pop.) mid-2015 268.4/15.6i
Refugees and others of concern to UNHCR mid-2015 2 894Infant mortality rate (per 1 000 live births) 2010-2015 43Health: Total expenditure (% of GDP) 2014 3.4Education: Primary gross enrolment ratio (f/m per 100 pop.) 2014 139.9/144.0j
Intentional homicide rate (per 100 000 pop.) 2014 9.4k
Seats held by women in national parliaments (%) 2016 14.2Environment and infrastructureMobile-cellular subscriptions (per 100 inhabitants) 2014 210.4b
Individuals using the Internet (%) 2014 9.8b
Threatened species 2015 231Forested area (% of land area) 2013 87.7b
CO2 emission estimates (000 tons/tons per capita) 2013 4 756/2.9Energy production, primary (Petajoules) 2013 569Energy supply per capita (Gigajoules) 2013 60.0Terrestrial and marine areas protected (% of total area) 2014 12.3Population using improved drinking water sources (urban/rural, %) 2015 97.2/66.7Population using improved sanitation facilities (urban/rural, %) 2015 43.4/31.6Net Official Development Assistance received (% of GNI) 2014 0.7a Data classified according to ISIC Rev. 2. b Estimate. c African population. d Libreville. e 2013. f Dataclassified according to ISIC Rev. 3. g Country data supplemented with data from the Observatoire Econ-omique et Statistique d’Afrique Subsaharienne (Afristat). h Data refers to manufacturing and utilitiesonly. i Refers to foreign citizens. j 2011. k 2012.
World Statistics Pocketbook 79

GambiaRegion Western Africa Surface area (sq km) 11 295Population (proj., 000) 2 055 Pop. density (per sq km) 203.1Capital city Banjul Capital city pop. (000) 504 a
Currency Dalasi (GMD) UN membership date 21 September 1965Economic indicators 2005 2010 2014GDP: Gross domestic product (million current US$) 624 952 851GDP growth rate (annual %, const. 2005 prices) –0.9 6.5 1.6GDP per capita (current US$) 433.3 562.6 441.3Economy: Agriculture (% of GVA) 28.6 30.7 19.7Economy: Industry (% of GVA) 14.9 13.1 15.2Economy: Services and other activity (% of GVA) 56.5 56.3 65.1Employment: Agriculture (% of employed) ... ... 31.5Employment: Industry (% of employed) ... ... 13.9Employment: Services and other (% of employed) ... ... 54.6Unemployment (% of labour force) b 30.3 29.8 30.2Labour force participation (female/male pop. %) b 71.7/83.5 72.2/83.2 72.2/82.8CPI: Consumer price index (2000=100) c 157 193 223d
Agricultural production index (2004-2006=100) 94 134 98d
Food production index (2004-2006=100) 94 134 98d
Balance of payments, current account (million US$) –51 21 –15e
Total trade Major trading partners 2015(million US$)f (% of exports)f (% of imports)f
Exports 103.9 Mali 37.8 Côte d'Ivoire 20.6Imports 387.2 Guinea 24.7 Brazil 11.0Balance –283.3 Senegal 16.0 China 8.3Social indicatorsPopulation growth rate (average annual %) 2010-2015 3.2Urban population (%) 2015 59.6Urban population growth rate (average annual %) 2010-2015 4.3Fertility rate, total (live births per woman) 2010-2015 5.8Life expectancy at birth (females/males, years) 2010-2015 61.2/58.5Total dependency ratio (Pop. aged 0-14 & 65+ per 100 pop. 15-64) 2015 94International migrant stock (000/% of total pop.) mid-2015 192.5/9.7Tourist arrivals at national borders (000) 2014 156g
Refugees and others of concern to UNHCR mid-2015 11 775Infant mortality rate (per 1 000 live births) 2010-2015 47Health: Total expenditure (% of GDP) 2014 7.3Education: Government expenditure (% of GDP) 2014 2.8d
Education: Primary gross enrolment ratio (f/m per 100 pop.) 2014 88.0/83.5Education: Tertiary gross enrolment ratio (f/m per 100 pop.) 2014 2.5/3.7e
Intentional homicide rate (per 100 000 pop.) 2014 9.4e
Seats held by women in national parliaments (%) 2016 9.4Environment and infrastructureMobile-cellular subscriptions (per 100 inhabitants) 2014 119.6Individuals using the Internet (%) 2014 15.6b
Threatened species 2015 55Forested area (% of land area) 2013 47.9b
CO2 emission estimates (000 tons/tons per capita) 2013 491/0.3Energy production, primary (Petajoules) 2013 7Energy supply per capita (Gigajoules) 2013 7.0b
Terrestrial and marine areas protected (% of total area) 2014 1.4Population using improved drinking water sources (urban/rural, %) 2015 94.2/84.4Population using improved sanitation facilities (urban/rural, %) 2015 61.5/55.0Net Official Development Assistance received (% of GNI) 2014 12.8a Refers to the local government areas of Banjul and Kanifing. b Estimate. c Banjul, Kombo St. Mary. d2013. e 2012. f 2014. g Charter tourists only.
80 World Statistics Pocketbook
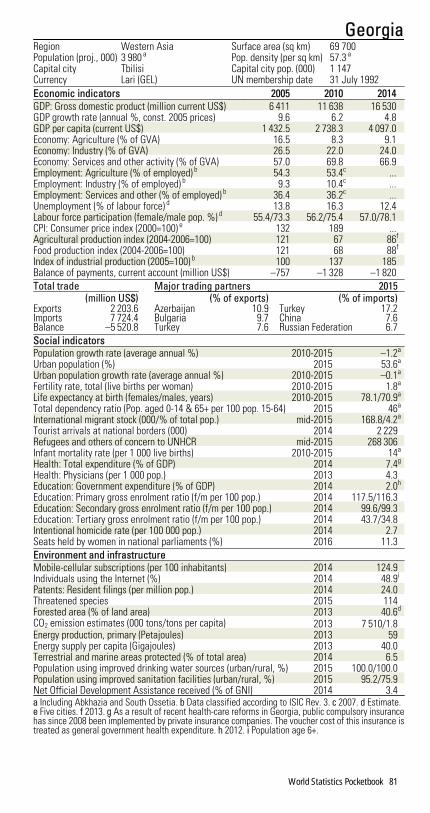
GeorgiaRegion Western Asia Surface area (sq km) 69 700Population (proj., 000) 3 980 a Pop. density (per sq km) 57.3 a
Capital city Tbilisi Capital city pop. (000) 1 147Currency Lari (GEL) UN membership date 31 July 1992Economic indicators 2005 2010 2014GDP: Gross domestic product (million current US$) 6 411 11 638 16 530GDP growth rate (annual %, const. 2005 prices) 9.6 6.2 4.8GDP per capita (current US$) 1 432.5 2 738.3 4 097.0Economy: Agriculture (% of GVA) 16.5 8.3 9.1Economy: Industry (% of GVA) 26.5 22.0 24.0Economy: Services and other activity (% of GVA) 57.0 69.8 66.9Employment: Agriculture (% of employed) b 54.3 53.4c ...Employment: Industry (% of employed) b 9.3 10.4c ...Employment: Services and other (% of employed) b 36.4 36.2c ...Unemployment (% of labour force) d 13.8 16.3 12.4Labour force participation (female/male pop. %) d 55.4/73.3 56.2/75.4 57.0/78.1CPI: Consumer price index (2000=100) e 132 189 ...Agricultural production index (2004-2006=100) 121 67 86f
Food production index (2004-2006=100) 121 68 88f
Index of industrial production (2005=100) b 100 137 185Balance of payments, current account (million US$) –757 –1 328 –1 820Total trade Major trading partners 2015
(million US$) (% of exports) (% of imports)Exports 2 203.6 Azerbaijan 10.9 Turkey 17.2Imports 7 724.4 Bulgaria 9.7 China 7.6Balance –5 520.8 Turkey 7.6 Russian Federation 6.7Social indicatorsPopulation growth rate (average annual %) 2010-2015 –1.2a
Urban population (%) 2015 53.6a
Urban population growth rate (average annual %) 2010-2015 –0.1a
Fertility rate, total (live births per woman) 2010-2015 1.8a
Life expectancy at birth (females/males, years) 2010-2015 78.1/70.9a
Total dependency ratio (Pop. aged 0-14 & 65+ per 100 pop. 15-64) 2015 46a
International migrant stock (000/% of total pop.) mid-2015 168.8/4.2a
Tourist arrivals at national borders (000) 2014 2 229Refugees and others of concern to UNHCR mid-2015 268 306Infant mortality rate (per 1 000 live births) 2010-2015 14a
Health: Total expenditure (% of GDP) 2014 7.4g
Health: Physicians (per 1 000 pop.) 2013 4.3Education: Government expenditure (% of GDP) 2014 2.0h
Education: Primary gross enrolment ratio (f/m per 100 pop.) 2014 117.5/116.3Education: Secondary gross enrolment ratio (f/m per 100 pop.) 2014 99.6/99.3Education: Tertiary gross enrolment ratio (f/m per 100 pop.) 2014 43.7/34.8Intentional homicide rate (per 100 000 pop.) 2014 2.7Seats held by women in national parliaments (%) 2016 11.3Environment and infrastructureMobile-cellular subscriptions (per 100 inhabitants) 2014 124.9Individuals using the Internet (%) 2014 48.9i
Patents: Resident filings (per million pop.) 2014 24.0Threatened species 2015 114Forested area (% of land area) 2013 40.6d
CO2 emission estimates (000 tons/tons per capita) 2013 7 510/1.8Energy production, primary (Petajoules) 2013 59Energy supply per capita (Gigajoules) 2013 40.0Terrestrial and marine areas protected (% of total area) 2014 6.5Population using improved drinking water sources (urban/rural, %) 2015 100.0/100.0Population using improved sanitation facilities (urban/rural, %) 2015 95.2/75.9Net Official Development Assistance received (% of GNI) 2014 3.4a Including Abkhazia and South Ossetia. b Data classified according to ISIC Rev. 3. c 2007. d Estimate.e Five cities. f 2013. g As a result of recent health-care reforms in Georgia, public compulsory insurancehas since 2008 been implemented by private insurance companies. The voucher cost of this insurance istreated as general government health expenditure. h 2012. i Population age 6+.
World Statistics Pocketbook 81

GermanyRegion Western Europe Surface area (sq km) 357 340Population (proj., 000) 80 682 Pop. density (per sq km) 231.5Capital city Berlin Capital city pop. (000) 3 563Currency Euro (EUR) UN membership date 18 September 1973Economic indicators 2005 2010 2014GDP: Gross domestic product (million current US$) 2 861 339 3 417 095 3 868 291GDP growth rate (annual %, const. 2005 prices) 0.7 4.1 1.6GDP per capita (current US$) 35 217.9 42 482.5 47 966.2Economy: Agriculture (% of GVA) a 0.8 0.7 0.7Economy: Industry (% of GVA) b 29.4 30.2 30.3Economy: Services and other activity (% of GVA) cd 69.8 69.1 69.0Employment: Agriculture (% of employed) 2.3ef 1.5 1.3Employment: Industry (% of employed) 30.0ef 28.5 28.3Employment: Services and other (% of employed) 67.8ef 69.9 70.4Unemployment (% of labour force) g 11.2 7.1 5.0Labour force participation (female/male pop. %) g 50.6/66.9 52.8/66.5 54.5/66.5CPI: Consumer price index (2000=100) 108 117 125Agricultural production index (2004-2006=100) 100 102 105h
Food production index (2004-2006=100) 100 102 105h
Index of industrial production (2005=100) i 100 104 112Balance of payments, current account (million US$) 132 197 193 330 280 339Total trade Major trading partners 2015
(million US$) (% of exports) (% of imports)Exports 1 331 193.8 United States 9.5 China 9.7Imports 1 056 340.5 France 8.6 Netherlands 9.3Balance 274 853.3 United Kingdom 7.4 France 7.0Social indicatorsPopulation growth rate (average annual %) 2010-2015 0.1Urban population (%) 2015 75.3Urban population growth rate (average annual %) 2010-2015 0.2Fertility rate, total (live births per woman) 2010-2015 1.4Life expectancy at birth (females/males, years) 2010-2015 83.1/78.2Total dependency ratio (Pop. aged 0-14 & 65+ per 100 pop. 15-64) 2015 52International migrant stock (000/% of total pop.) mid-2015 12 005.7/14.9Tourist arrivals at national borders (000) j 2014 32 999Refugees and others of concern to UNHCR mid-2015 573 828Infant mortality rate (per 1 000 live births) 2010-2015 3Health: Total expenditure (% of GDP) 2014 11.3Health: Physicians (per 1 000 pop.) 2013 3.9k
Education: Government expenditure (% of GDP) 2014 4.9k
Education: Primary gross enrolment ratio (f/m per 100 pop.) 2014 103.0/103.7Education: Secondary gross enrolment ratio (f/m per 100 pop.) 2014 99.5/105.2Education: Tertiary gross enrolment ratio (f/m per 100 pop.) 2014 63.3/67.6Intentional homicide rate (per 100 000 pop.) 2014 0.9Seats held by women in national parliaments (%) 2016 36.5Environment and infrastructureMobile-cellular subscriptions (per 100 inhabitants) 2014 120.4Individuals using the Internet (%) 2014 86.2l
Patents: Resident filings (per million pop.) 2014 913.0Threatened species 2015 107Forested area (% of land area) 2013 32.8g
CO2 emission estimates (000 tons/tons per capita) 2013 757 313/9.4Energy production, primary (Petajoules) 2013 5 032Energy supply per capita (Gigajoules) 2013 165.0Terrestrial and marine areas protected (% of total area) 2014 38.5Population using improved drinking water sources (urban/rural, %) 2015 100.0/100.0Population using improved sanitation facilities (urban/rural, %) 2015 99.3/99.0Net Official Development Assistance disbursed (% of GNI) m 2014 0.4a Excludes irrigation canals and landscaping care. b Excludes publishing activities, includes irrigationcanals. c Excludes repair of personal and household goods. d Includes publishing activities and land-scaping care. e Data classified according to ISIC Rev. 3. f Break in the time series. g Estimate. h 2013. iExcluding water and waste management. j Arrivals of non-resident tourists in all types of tourism ac-commodation establishments. k 2012. l Population age 16-74. m Development Assistance Committeemember (OECD).
82 World Statistics Pocketbook

GhanaRegion Western Africa Surface area (sq km) 238 537Population (proj., 000) 28 033 Pop. density (per sq km) 123.2Capital city Accra Capital city pop. (000) 2 277Currency Ghana Cedi (GHS) UN membership date 8 March 1957Economic indicators 2005 2010 2014GDP: Gross domestic product (million current US$) 17 199 32 174 37 177GDP growth rate (annual %, const. 2005 prices) 6.2 7.9 4.0GDP per capita (current US$) 804.1 1 323.1 1 387.9Economy: Agriculture (% of GVA) 31.8 29.8a 22.0a
Economy: Industry (% of GVA) 20.3 19.1b 28.4b
Economy: Services and other activity (% of GVA) 47.9 51.1cd 49.6cd
Employment: Agriculture (% of employed) ... 41.5 44.7ef
Employment: Industry (% of employed) ... 15.4 14.4ef
Employment: Services and other (% of employed) ... 43.1 40.9ef
Unemployment (% of labour force) g 4.0 4.2 5.9Labour force participation (female/male pop. %) g 67.6/71.7 71.6/75.2 75.3/78.4CPI: Consumer price index (2000=100) 251 511 783Agricultural production index (2004-2006=100) 100 125 143f
Food production index (2004-2006=100) 100 125 143f
Balance of payments, current account (million US$) –1 105 –2 747 –3 698Total trade Major trading partners 2015
(million US$)f (% of exports)f (% of imports)f
Exports 12 643.9 South Africa 22.4 China 17.8Imports 12 787.2 United Arab Emirates 13.1 United States 9.8Balance –143.3 Switzerland 9.3 Belgium 7.2Social indicatorsPopulation growth rate (average annual %) 2010-2015 2.4Urban population (%) 2015 54.0Urban population growth rate (average annual %) 2010-2015 3.4Fertility rate, total (live births per woman) 2010-2015 4.3Life expectancy at birth (females/males, years) 2010-2015 62.0/60.1Total dependency ratio (Pop. aged 0-14 & 65+ per 100 pop. 15-64) 2015 73International migrant stock (000/% of total pop.) mid-2015 399.5/1.5Tourist arrivals at national borders (000) 2014 1 093h
Refugees and others of concern to UNHCR mid-2015 21 331Infant mortality rate (per 1 000 live births) 2010-2015 51Health: Total expenditure (% of GDP) 2014 3.6i
Education: Government expenditure (% of GDP) 2014 6.0f
Education: Primary gross enrolment ratio (f/m per 100 pop.) 2014 106.4/106.5Education: Secondary gross enrolment ratio (f/m per 100 pop.) 2014 64.9/69.2Education: Tertiary gross enrolment ratio (f/m per 100 pop.) 2014 12.4/18.6Intentional homicide rate (per 100 000 pop.) 2014 1.7j
Seats held by women in national parliaments (%) 2016 10.9Environment and infrastructureMobile-cellular subscriptions (per 100 inhabitants) 2014 114.8Individuals using the Internet (%) 2014 18.9g
Threatened species 2015 223Forested area (% of land area) 2013 40.8g
CO2 emission estimates (000 tons/tons per capita) 2013 14 620/0.6Energy production, primary (Petajoules) 2013 351Energy supply per capita (Gigajoules) 2013 12.0Terrestrial and marine areas protected (% of total area) 2014 7.8Population using improved drinking water sources (urban/rural, %) 2015 92.6/84.1Population using improved sanitation facilities (urban/rural, %) 2015 20.2/8.6Net Official Development Assistance received (% of GNI) 2014 3.1a Excludes irrigation canals and landscaping care. b Excludes publishing activities, includes irrigationcanals. c Excludes repair of personal and household goods. d Includes publishing activities and land-scaping care. e Break in the time series. f 2013. g Estimate. h Including nationals residing abroad. i In2010, Ghana revalued its economy from 1993 base to 2006, increasing its overall GDP by more than 60per cent. Estimates have been updated taking into account 2010 GDP rebasing data series. j 2011.
World Statistics Pocketbook 83
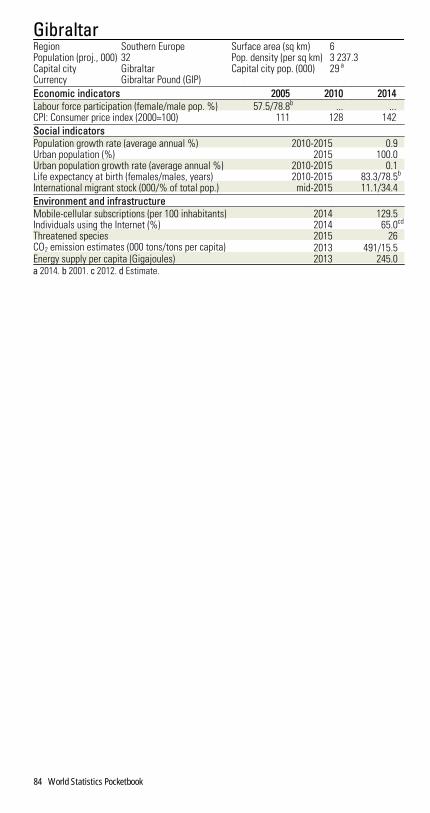
GibraltarRegion Southern Europe Surface area (sq km) 6Population (proj., 000) 32 Pop. density (per sq km) 3 237.3Capital city Gibraltar Capital city pop. (000) 29 a
Currency Gibraltar Pound (GIP)Economic indicators 2005 2010 2014Labour force participation (female/male pop. %) 57.5/78.8b ... ...CPI: Consumer price index (2000=100) 111 128 142Social indicatorsPopulation growth rate (average annual %) 2010-2015 0.9Urban population (%) 2015 100.0Urban population growth rate (average annual %) 2010-2015 0.1Life expectancy at birth (females/males, years) 2010-2015 83.3/78.5b
International migrant stock (000/% of total pop.) mid-2015 11.1/34.4Environment and infrastructureMobile-cellular subscriptions (per 100 inhabitants) 2014 129.5Individuals using the Internet (%) 2014 65.0cd
Threatened species 2015 26CO2 emission estimates (000 tons/tons per capita) 2013 491/15.5Energy supply per capita (Gigajoules) 2013 245.0a 2014. b 2001. c 2012. d Estimate.
84 World Statistics Pocketbook

GreeceRegion Southern Europe Surface area (sq km) 131 957Population (proj., 000) 10 920 Pop. density (per sq km) 84.7Capital city Athens Capital city pop. (000) 3 052 a
Currency Euro (EUR) UN membership date 25 October 1945Economic indicators 2005 2010 2014GDP: Gross domestic product (million current US$) 247 777 299 362 235 574GDP growth rate (annual %, const. 2005 prices) 0.6 –5.5 0.7GDP per capita (current US$) 22 383.4 26 782.5 21 414.3Economy: Agriculture (% of GVA) b 4.8 3.3 3.8Economy: Industry (% of GVA) c 19.8 15.7 15.8Economy: Services and other activity (% of GVA) de 75.4 81.1 80.4Employment: Agriculture (% of employed) 11.5fg 11.7 13.0Employment: Industry (% of employed) 22.6fg 19.8 15.1Employment: Services and other (% of employed) 65.9fg 68.5 71.8Unemployment (% of labour force) h 10.2 12.5 26.5Labour force participation (female/male pop. %) h 42.1/64.2 44.2/63.7 44.1/60.1CPI: Consumer price index (2000=100) 118i 139 142Agricultural production index (2004-2006=100) 103 83 86j
Food production index (2004-2006=100) 103 87 88j
Index of industrial production (2005=100) 100 85 74Balance of payments, current account (million US$) –18 233 –30 275 –4 872Total trade Major trading partners 2015
(million US$) (% of exports) (% of imports)Exports 28 289.2 Italy 11.4 Germany 10.6Imports 47 264.0 Germany 7.3 Russian Federation 8.0Balance –18 974.8 Turkey 6.7 Italy 7.9Social indicatorsPopulation growth rate (average annual %) 2010-2015 –0.4Urban population (%) 2015 78.0Urban population growth rate (average annual %) 2010-2015 0.5Fertility rate, total (live births per woman) 2010-2015 1.3Life expectancy at birth (females/males, years) 2010-2015 83.6/77.6Total dependency ratio (Pop. aged 0-14 & 65+ per 100 pop. 15-64) 2015 56International migrant stock (000/% of total pop.) mid-2015 1 242.5/11.3Tourist arrivals at national borders (000) 2014 22 033Refugees and others of concern to UNHCR mid-2015 37 602Infant mortality rate (per 1 000 live births) 2010-2015 3Health: Total expenditure (% of GDP) 2014 8.1Education: Primary gross enrolment ratio (f/m per 100 pop.) 2014 97.9/99.3j
Education: Secondary gross enrolment ratio (f/m per 100 pop.) 2014 105.9/110.4j
Education: Tertiary gross enrolment ratio (f/m per 100 pop.) 2014 110.2/110.1j
Intentional homicide rate (per 100 000 pop.) 2014 0.1Seats held by women in national parliaments (%) 2016 19.7Environment and infrastructureMobile-cellular subscriptions (per 100 inhabitants) 2014 115.0k
Individuals using the Internet (%) 2014 63.2l
Patents: Resident filings (per million pop.) 2014 68.0Threatened species 2015 291Forested area (% of land area) 2013 31.0h
CO2 emission estimates (000 tons/tons per capita) 2013 69 156/6.3Energy production, primary (Petajoules) 2013 390Energy supply per capita (Gigajoules) 2013 90.0Terrestrial and marine areas protected (% of total area) 2014 8.6Population using improved drinking water sources (urban/rural, %) 2015 100.0/100.0Population using improved sanitation facilities (urban/rural, %) 2015 99.2/98.1Net Official Development Assistance disbursed (% of GNI) m 2014 0.1a Refers to the localities of Calithèa, Peristérion and Piraeus, among others. b Excludes irrigation canalsand landscaping care. c Excludes publishing activities, includes irrigation canals. d Excludes repair ofpersonal and household goods. e Includes publishing activities and landscaping care. f Data classifiedaccording to ISIC Rev. 3. g Break in the time series. h Estimate. i Series linked to former series. j 2013.k Data from one operator refer to end of the third quarter. l Population age 16-74. m DevelopmentAssistance Committee member (OECD).
World Statistics Pocketbook 85

GreenlandRegion Northern America Surface area (sq km) 2 166 086Population (proj., 000) 56 Pop. density (per sq km) 0.1Capital city Nuuk Capital city pop. (000) 17 a
Currency Danish Krone (DKK)Economic indicators 2005 2010 2014GDP: Gross domestic product (million current US$) 1 650 2 287 2 441GDP growth rate (annual %, const. 2005 prices) 3.7 2.5 –1.6GDP per capita (current US$) 28 968.6 40 450.4 43 429.7Economy: Agriculture (% of GVA) 10.2 7.5 10.6Economy: Industry (% of GVA) 15.3 17.6 13.9Economy: Services and other activity (% of GVA) 74.5 74.9 75.4Employment: Agriculture (% of employed) bc ... ... 4.6d
Employment: Industry (% of employed) bc ... ... 12.6d
Employment: Services and other (% of employed) bc ... ... 82.5d
Unemployment (% of labour force) 9.3 8.4ef 9.7cgh
CPI: Consumer price index (2000=100) 113 132 144Agricultural production index (2004-2006=100) 100 99 99h
Food production index (2004-2006=100) 99 99 99h
Total trade Major trading partners 2015(million US$) (% of exports) (% of imports)
Exports 394.9 Denmark 81.6 Denmark 73.2Imports 586.2 Portugal 7.2 Sweden 9.1Balance –191.3 Areas nes 6.4i China 2.7Social indicatorsPopulation growth rate (average annual %) 2010-2015 –0.1Urban population (%) 2015 86.4Urban population growth rate (average annual %) 2010-2015 0.7Fertility rate, total (live births per woman) 2010-2015 2.0j
Life expectancy at birth (females/males, years) 2010-2015 73.5/68.7k
Total dependency ratio (Pop. aged 0-14 & 65+ per 100 pop. 15-64) 2015 41h
International migrant stock (000/% of total pop.) mid-2015 6.0/10.7Intentional homicide rate (per 100 000 pop.) 2014 1.8d
Environment and infrastructureMobile-cellular subscriptions (per 100 inhabitants) 2014 106.4l
Individuals using the Internet (%) 2014 66.7l
Threatened species 2015 17Forested area (% of land area) 2013 0.0l
CO2 emission estimates (000 tons/tons per capita) 2013 568/10.1Energy production, primary (Petajoules) 2013 1Energy supply per capita (Gigajoules) 2013 166.0Terrestrial and marine areas protected (% of total area) 2014 22.4Population using improved drinking water sources (urban/rural, %) 2015 100.0/100.0Population using improved sanitation facilities (urban/rural, %) 2015 100.0/100.0a 2014. b Persons aged 15 to 64 years. c Nationals, residents. d 2011. e 2006. f Break in the time series.g Persons aged 18 to 64 years. h 2013. i See technical notes. j 2012. k 2008 - 2012. l Estimate.
86 World Statistics Pocketbook

GrenadaRegion Caribbean Surface area (sq km) 345Population (proj., 000) 107 Pop. density (per sq km) 315.7Capital city Saint George's Capital city pop. (000) 38 a
Currency East Caribbean Dollar (XCD) UN membership date 17 September 1974Economic indicators 2005 2010 2014GDP: Gross domestic product (million current US$) 701 777 884GDP growth rate (annual %, const. 2005 prices) 13.3 –0.5 2.4GDP per capita (current US$) 6 804.3 7 418.1 8 312.6Economy: Agriculture (% of GVA) 3.4 5.2 6.5Economy: Industry (% of GVA) 26.2 16.8 14.0Economy: Services and other activity (% of GVA) 70.5 78.1 79.5Unemployment (% of labour force) 10.2b ... ...CPI: Consumer price index (2000=100) 112 136c 142d
Agricultural production index (2004-2006=100) 77 90 97d
Food production index (2004-2006=100) 77 90 97d
Balance of payments, current account (million US$) –193 –204 –213d
Social indicatorsPopulation growth rate (average annual %) 2010-2015 0.4Urban population (%) 2015 35.6Urban population growth rate (average annual %) 2010-2015 0.3Fertility rate, total (live births per woman) 2010-2015 2.2Life expectancy at birth (females/males, years) 2010-2015 75.6/70.8Total dependency ratio (Pop. aged 0-14 & 65+ per 100 pop. 15-64) 2015 51International migrant stock (000/% of total pop.) mid-2015 7.1/6.6Tourist arrivals at national borders (000) 2014 134Infant mortality rate (per 1 000 live births) 2010-2015 10Health: Total expenditure (% of GDP) 2014 6.1Education: Primary gross enrolment ratio (f/m per 100 pop.) 2014 102.3/104.0Education: Secondary gross enrolment ratio (f/m per 100 pop.) 2014 100.5/101.2Intentional homicide rate (per 100 000 pop.) 2014 7.5Seats held by women in national parliaments (%) 2016 33.3Environment and infrastructureMobile-cellular subscriptions (per 100 inhabitants) 2014 126.5e
Individuals using the Internet (%) 2014 37.4e
Threatened species 2015 51Forested area (% of land area) 2013 50.0e
CO2 emission estimates (000 tons/tons per capita) 2013 304/2.9Energy production, primary (Petajoules) 2013 0Energy supply per capita (Gigajoules) 2013 43.0Terrestrial and marine areas protected (% of total area) 2014 0.1Population using improved drinking water sources (urban/rural, %) 2015 99.0/95.3Population using improved sanitation facilities (urban/rural, %) 2015 97.5/98.3Net Official Development Assistance received (% of GNI) 2014 4.6a 2014. b 2001. c Series linked to former series. d 2013. e Estimate.
World Statistics Pocketbook 87

GuadeloupeRegion Caribbean Surface area (sq km) 1 705Population (proj., 000) 471 a Pop. density (per sq km) 278.4 a
Capital city Basse-Terre Capital city pop. (000) 55 b
Currency Euro (EUR)Economic indicators 2005 2010 2014Employment: Agriculture (% of employed) cd ... ... 3.3e
Employment: Industry (% of employed) cd ... 13.8 13.5e
Employment: Services and other (% of employed) cd ... 64.4 65.5e
Unemployment (% of labour force) f 25.9 23.8 26.2Labour force participation (female/male pop. %) f 48.9/56.6 51.8/57.7 51.2/59.1CPI: Consumer price index (2000=100) 112 122 129Agricultural production index (2004-2006=100) 103 89 100g
Food production index (2004-2006=100) 103 89 100g
Social indicatorsPopulation growth rate (average annual %) 2010-2015 0.5a
Urban population (%) 2015 98.4a
Urban population growth rate (average annual %) 2010-2015 0.5a
Fertility rate, total (live births per woman) 2010-2015 2.2a
Life expectancy at birth (females/males, years) 2010-2015 84.0/76.8a
Total dependency ratio (Pop. aged 0-14 & 65+ per 100 pop. 15-64) 2015 58a
International migrant stock (000/% of total pop.) mid-2015 98.5/21.0a
Tourist arrivals at national borders (000) 2014 487hi
Infant mortality rate (per 1 000 live births) 2010-2015 6a
Environment and infrastructureThreatened species 2015 70i
Forested area (% of land area) 2013 43.0f
CO2 emission estimates (000 tons/tons per capita) 2013 2 142/4.6Energy production, primary (Petajoules) 2013 4f
Energy supply per capita (Gigajoules) 2013 70.0f
Terrestrial and marine areas protected (% of total area) 2014 2.6Population using improved drinking water sources (urban/rural, %) 2015 99.3/99.8Population using improved sanitation facilities (urban/rural, %) 2015 97.0/...a Including Saint-Barthélemy and Saint-Martin (French part). b 2014. c Persons aged 15 to 64 years. dExcluding the institutional population. e 2012. f Estimate. g 2013. h 2013.""Arrivals by air. i Excluding thenorth islands, Saint Barthélémy and Saint Martin (French part).
88 World Statistics Pocketbook
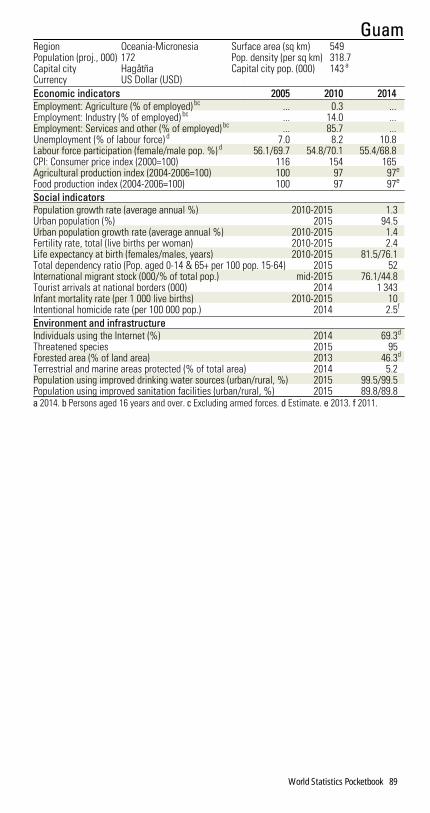
GuamRegion Oceania-Micronesia Surface area (sq km) 549Population (proj., 000) 172 Pop. density (per sq km) 318.7Capital city Hagåtña Capital city pop. (000) 143 a
Currency US Dollar (USD)Economic indicators 2005 2010 2014Employment: Agriculture (% of employed) bc ... 0.3 ...Employment: Industry (% of employed) bc ... 14.0 ...Employment: Services and other (% of employed) bc ... 85.7 ...Unemployment (% of labour force) d 7.0 8.2 10.8Labour force participation (female/male pop. %) d 56.1/69.7 54.8/70.1 55.4/68.8CPI: Consumer price index (2000=100) 116 154 165Agricultural production index (2004-2006=100) 100 97 97e
Food production index (2004-2006=100) 100 97 97e
Social indicatorsPopulation growth rate (average annual %) 2010-2015 1.3Urban population (%) 2015 94.5Urban population growth rate (average annual %) 2010-2015 1.4Fertility rate, total (live births per woman) 2010-2015 2.4Life expectancy at birth (females/males, years) 2010-2015 81.5/76.1Total dependency ratio (Pop. aged 0-14 & 65+ per 100 pop. 15-64) 2015 52International migrant stock (000/% of total pop.) mid-2015 76.1/44.8Tourist arrivals at national borders (000) 2014 1 343Infant mortality rate (per 1 000 live births) 2010-2015 10Intentional homicide rate (per 100 000 pop.) 2014 2.5f
Environment and infrastructureIndividuals using the Internet (%) 2014 69.3d
Threatened species 2015 95Forested area (% of land area) 2013 46.3d
Terrestrial and marine areas protected (% of total area) 2014 5.2Population using improved drinking water sources (urban/rural, %) 2015 99.5/99.5Population using improved sanitation facilities (urban/rural, %) 2015 89.8/89.8a 2014. b Persons aged 16 years and over. c Excluding armed forces. d Estimate. e 2013. f 2011.
World Statistics Pocketbook 89

GuatemalaRegion Central America Surface area (sq km) 108 889Population (proj., 000) 16 673 Pop. density (per sq km) 155.6Capital city Guatemala City Capital city pop. (000) 2 918Currency Quetzal (GTQ) UN membership date 21 November 1945Economic indicators 2005 2010 2014GDP: Gross domestic product (million current US$) 27 211 41 338 58 827GDP growth rate (annual %, const. 2005 prices) 3.3 2.9 4.3GDP per capita (current US$) 2 064.0 2 806.0 3 673.1Economy: Agriculture (% of GVA) 13.1 11.4 11.2Economy: Industry (% of GVA) 28.6 28.0 28.1Economy: Services and other activity (% of GVA) 58.3 60.6 60.8Employment: Agriculture (% of employed) 38.3abc 33.2adef 32.7g
Employment: Industry (% of employed) 19.5abc 22.8adef 17.1g
Employment: Services and other (% of employed) 42.2abc 44.0adef 50.2g
Unemployment (% of labour force) h 2.4 3.7 2.8Labour force participation (female/male pop. %) h 45.1/87.6 41.8/85.7 41.0/83.4CPI: Consumer price index (2000=100) 144 193 229Agricultural production index (2004-2006=100) 98 128 147g
Food production index (2004-2006=100) 98 131 150g
Balance of payments, current account (million US$) –1 301 –563 –1 230Total trade Major trading partners 2015
(million US$) (% of exports) (% of imports)Exports 10 797.0 United States 35.8 United States 37.1Imports 17 631.1 El Salvador 11.5 Mexico 11.6Balance –6 834.1 Honduras 8.4 China 10.6Social indicatorsPopulation growth rate (average annual %) 2010-2015 2.1Urban population (%) 2015 51.6Urban population growth rate (average annual %) 2010-2015 3.4Fertility rate, total (live births per woman) 2010-2015 3.3Life expectancy at birth (females/males, years) 2010-2015 75.0/67.9Total dependency ratio (Pop. aged 0-14 & 65+ per 100 pop. 15-64) 2015 71International migrant stock (000/% of total pop.) mid-2015 76.4/0.5i
Tourist arrivals at national borders (000) 2014 1 455Refugees and others of concern to UNHCR mid-2015 275Infant mortality rate (per 1 000 live births) 2010-2015 23Health: Total expenditure (% of GDP) 2014 6.2j
Education: Government expenditure (% of GDP) 2014 2.8g
Education: Primary gross enrolment ratio (f/m per 100 pop.) 2014 101.6/105.5Education: Secondary gross enrolment ratio (f/m per 100 pop.) 2014 61.5/65.5Education: Tertiary gross enrolment ratio (f/m per 100 pop.) 2014 18.9/17.8g
Intentional homicide rate (per 100 000 pop.) 2014 31.2Seats held by women in national parliaments (%) 2016 13.9Environment and infrastructureMobile-cellular subscriptions (per 100 inhabitants) 2014 106.6k
Individuals using the Internet (%) 2014 23.4h
Patents: Resident filings (per million pop.) 2014 1.0Threatened species 2015 282Forested area (% of land area) 2013 33.7h
CO2 emission estimates (000 tons/tons per capita) 2013 13 597/0.9Energy production, primary (Petajoules) 2013 310Energy supply per capita (Gigajoules) 2013 29.0Terrestrial and marine areas protected (% of total area) 2014 15.7Population using improved drinking water sources (urban/rural, %) 2015 98.4/86.8Population using improved sanitation facilities (urban/rural, %) 2015 77.5/49.3Net Official Development Assistance received (% of GNI) 2014 0.5a Persons aged 10 years and over. b Data classified according to ISIC Rev. 2. c 2004. d Data classifiedaccording to ISIC Rev. 3. e Break in the time series. f 2006. g 2013. h Estimate. i Including refugees. jData revision. k New tax on numbering resources, which has prompted operators to return several num-bers, either inactive ones or with low consumption.
90 World Statistics Pocketbook

GuineaRegion Western Africa Surface area (sq km) 245 857Population (proj., 000) 12 947 Pop. density (per sq km) 52.7Capital city Conakry Capital city pop. (000) 1 936Currency Guinean Franc (GNF) UN membership date 12 December 1958Economic indicators 2005 2010 2014GDP: Gross domestic product (million current US$) 2 823 4 730 6 579GDP growth rate (annual %, const. 2005 prices) 3.0 1.9 1.3GDP per capita (current US$) 291.9 429.5 535.9Economy: Agriculture (% of GVA) 24.3 22.1 18.0Economy: Industry (% of GVA) 34.8 44.7 41.4Economy: Services and other activity (% of GVA) 40.9 33.2 40.6Employment: Agriculture (% of employed) ... 74.3 74.8a
Employment: Industry (% of employed) ... 5.8 5.6a
Employment: Services and other (% of employed) ... 19.9 19.3a
Unemployment (% of labour force) b 1.7 1.6 1.7Labour force participation (female/male pop. %) b 62.7/80.9 66.1/80.9 79.5/85.1CPI: Consumer price index (2000=100) c 185 439 753Agricultural production index (2004-2006=100) 101 113 123d
Food production index (2004-2006=100) 101 113 123d
Balance of payments, current account (million US$) –160 –329 –1 240d
Total trade Major trading partners 2015(million US$) (% of exports) (% of imports)
Exports 1 573.7 Ghana 22.0 China 14.9Imports 2 138.6 India 16.4 Netherlands 13.4Balance –564.9 United Arab Emirates 9.9 India 10.9Social indicatorsPopulation growth rate (average annual %) 2010-2015 2.7Urban population (%) 2015 37.2Urban population growth rate (average annual %) 2010-2015 3.8Fertility rate, total (live births per woman) 2010-2015 5.1Life expectancy at birth (females/males, years) 2010-2015 58.5/57.6Total dependency ratio (Pop. aged 0-14 & 65+ per 100 pop. 15-64) 2015 84International migrant stock (000/% of total pop.) mid-2015 228.4/1.8ef
Tourist arrivals at national borders (000) 2014 33g
Refugees and others of concern to UNHCR mid-2015 8 997Infant mortality rate (per 1 000 live births) 2010-2015 59Health: Total expenditure (% of GDP) 2014 5.6Education: Government expenditure (% of GDP) 2014 3.5d
Education: Primary gross enrolment ratio (f/m per 100 pop.) 2014 83.8/98.6Education: Secondary gross enrolment ratio (f/m per 100 pop.) 2014 30.7/46.8Education: Tertiary gross enrolment ratio (f/m per 100 pop.) 2014 6.7/14.9Intentional homicide rate (per 100 000 pop.) 2014 8.7a
Seats held by women in national parliaments (%) 2016 21.9Environment and infrastructureMobile-cellular subscriptions (per 100 inhabitants) 2014 72.1b
Individuals using the Internet (%) 2014 1.7b
Threatened species 2015 163Forested area (% of land area) 2013 26.2b
CO2 emission estimates (000 tons/tons per capita) 2013 2 299/0.2Energy production, primary (Petajoules) 2013 113Energy supply per capita (Gigajoules) 2013 12.0Terrestrial and marine areas protected (% of total area) 2014 20.3Population using improved drinking water sources (urban/rural, %) 2015 92.7/67.4Population using improved sanitation facilities (urban/rural, %) 2015 34.1/11.8Net Official Development Assistance received (% of GNI) 2014 9.2a 2012. b Estimate. c Conakry. d 2013. e Including refugees. f Refers to foreign citizens. g Arrivals by airat Conakry airport.
World Statistics Pocketbook 91
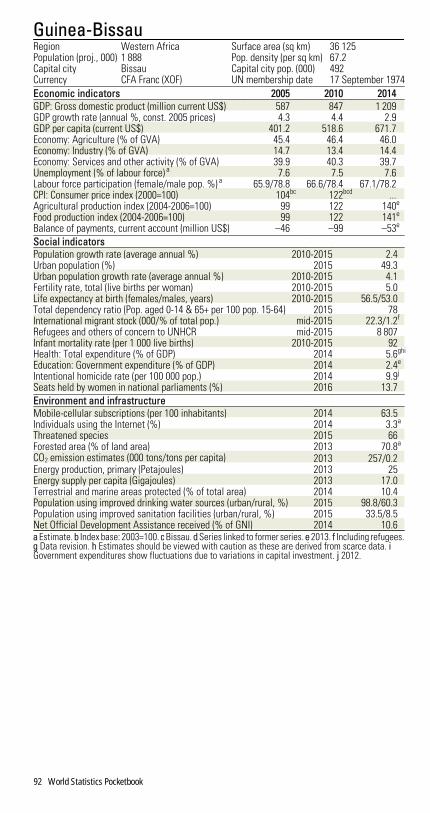
Guinea-BissauRegion Western Africa Surface area (sq km) 36 125Population (proj., 000) 1 888 Pop. density (per sq km) 67.2Capital city Bissau Capital city pop. (000) 492Currency CFA Franc (XOF) UN membership date 17 September 1974Economic indicators 2005 2010 2014GDP: Gross domestic product (million current US$) 587 847 1 209GDP growth rate (annual %, const. 2005 prices) 4.3 4.4 2.9GDP per capita (current US$) 401.2 518.6 671.7Economy: Agriculture (% of GVA) 45.4 46.4 46.0Economy: Industry (% of GVA) 14.7 13.4 14.4Economy: Services and other activity (% of GVA) 39.9 40.3 39.7Unemployment (% of labour force) a 7.6 7.5 7.6Labour force participation (female/male pop. %) a 65.9/78.8 66.6/78.4 67.1/78.2CPI: Consumer price index (2000=100) 104bc 122bcd ...Agricultural production index (2004-2006=100) 99 122 140e
Food production index (2004-2006=100) 99 122 141e
Balance of payments, current account (million US$) –46 –99 –53e
Social indicatorsPopulation growth rate (average annual %) 2010-2015 2.4Urban population (%) 2015 49.3Urban population growth rate (average annual %) 2010-2015 4.1Fertility rate, total (live births per woman) 2010-2015 5.0Life expectancy at birth (females/males, years) 2010-2015 56.5/53.0Total dependency ratio (Pop. aged 0-14 & 65+ per 100 pop. 15-64) 2015 78International migrant stock (000/% of total pop.) mid-2015 22.3/1.2f
Refugees and others of concern to UNHCR mid-2015 8 807Infant mortality rate (per 1 000 live births) 2010-2015 92Health: Total expenditure (% of GDP) 2014 5.6ghi
Education: Government expenditure (% of GDP) 2014 2.4e
Intentional homicide rate (per 100 000 pop.) 2014 9.9j
Seats held by women in national parliaments (%) 2016 13.7Environment and infrastructureMobile-cellular subscriptions (per 100 inhabitants) 2014 63.5Individuals using the Internet (%) 2014 3.3a
Threatened species 2015 66Forested area (% of land area) 2013 70.8a
CO2 emission estimates (000 tons/tons per capita) 2013 257/0.2Energy production, primary (Petajoules) 2013 25Energy supply per capita (Gigajoules) 2013 17.0Terrestrial and marine areas protected (% of total area) 2014 10.4Population using improved drinking water sources (urban/rural, %) 2015 98.8/60.3Population using improved sanitation facilities (urban/rural, %) 2015 33.5/8.5Net Official Development Assistance received (% of GNI) 2014 10.6a Estimate. b Index base: 2003=100. c Bissau. d Series linked to former series. e 2013. f Including refugees.g Data revision. h Estimates should be viewed with caution as these are derived from scarce data. iGovernment expenditures show fluctuations due to variations in capital investment. j 2012.
92 World Statistics Pocketbook

GuyanaRegion South America Surface area (sq km) 214 969Population (proj., 000) 771 Pop. density (per sq km) 3.9Capital city Georgetown Capital city pop. (000) 124 a
Currency Guyana Dollar (GYD) UN membership date 20 September 1966Economic indicators 2005 2010 2014GDP: Gross domestic product (million current US$) 1 315 2 259 3 086GDP growth rate (annual %, const. 2005 prices) –2.0 5.4 3.1GDP per capita (current US$) 1 771.7 2 998.9 4 039.6Economy: Agriculture (% of GVA) 25.7b 17.6 18.2Economy: Industry (% of GVA) 28.7 34.5 32.8Economy: Services and other activity (% of GVA) 45.6 47.9 49.1Employment: Agriculture (% of employed) c 21.4d ... ...Employment: Industry (% of employed) c 24.5d ... ...Employment: Services and other (% of employed) c 50.5d ... ...Unemployment (% of labour force) e 10.2 11.0 11.2Labour force participation (female/male pop. %) e 38.7/82.1 40.4/79.7 41.8/77.4CPI: Consumer price index (2000=100) f 128 177g ...Agricultural production index (2004-2006=100) 94 108 129h
Food production index (2004-2006=100) 94 108 129h
Balance of payments, current account (million US$) –96 –246 –385Total trade Major trading partners 2015
(million US$) (% of exports) (% of imports)Exports 1 285.8 United States 24.2 Republic of Korea 32.1Imports 2 185.7 Canada 12.3 United States 19.6Balance –899.9 Trinidad and Tobago 9.6 Trinidad and Tobago 15.1Social indicatorsPopulation growth rate (average annual %) 2010-2015 0.4Urban population (%) 2015 28.6Urban population growth rate (average annual %) 2010-2015 0.8Fertility rate, total (live births per woman) 2010-2015 2.6Life expectancy at birth (females/males, years) 2010-2015 68.6/64.0Total dependency ratio (Pop. aged 0-14 & 65+ per 100 pop. 15-64) 2015 51International migrant stock (000/% of total pop.) mid-2015 15.4/2.0Tourist arrivals at national borders (000) 2014 206i
Refugees and others of concern to UNHCR mid-2015 12Infant mortality rate (per 1 000 live births) 2010-2015 33Health: Total expenditure (% of GDP) 2014 5.3Education: Government expenditure (% of GDP) 2014 3.2j
Education: Primary gross enrolment ratio (f/m per 100 pop.) 2014 83.9/86.9j
Education: Secondary gross enrolment ratio (f/m per 100 pop.) 2014 89.0/89.7j
Education: Tertiary gross enrolment ratio (f/m per 100 pop.) 2014 16.8/8.2j
Intentional homicide rate (per 100 000 pop.) 2014 20.4h
Seats held by women in national parliaments (%) 2016 30.4Environment and infrastructureMobile-cellular subscriptions (per 100 inhabitants) 2014 70.5Individuals using the Internet (%) 2014 37.4e
Threatened species 2015 87Forested area (% of land area) 2013 84.1e
CO2 emission estimates (000 tons/tons per capita) 2013 1 936/2.5Energy production, primary (Petajoules) 2013 7Energy supply per capita (Gigajoules) 2013 45.0Terrestrial and marine areas protected (% of total area) 2014 5.3Population using improved drinking water sources (urban/rural, %) 2015 98.2/98.3Population using improved sanitation facilities (urban/rural, %) 2015 87.9/82.0Net Official Development Assistance received (% of GNI) 2014 4.9a 2014. b Includes processing of sugar and rice. c Data classified according to ISIC Rev. 3. d 2002. eEstimate. f Georgetown. g Series linked to former series. h 2013. i Arrivals to Timehri airport only. j 2012.
World Statistics Pocketbook 93

HaitiRegion Caribbean Surface area (sq km) 27 750Population (proj., 000) 10 848 Pop. density (per sq km) 393.6Capital city Port-au-Prince Capital city pop. (000) 2 440Currency Gourde (HTG) UN membership date 24 October 1945Economic indicators 2005 2010 2014GDP: Gross domestic product (million current US$) 4 154 6 708 8 599GDP growth rate (annual %, const. 2005 prices) 1.8 –5.5 2.8GDP per capita (current US$) 448.5 670.8 813.4Economy: Agriculture (% of GVA) 22.4 21.0 17.6Economy: Industry (% of GVA) 32.9 33.7 37.7Economy: Services and other activity (% of GVA) 44.8 45.4 44.8Unemployment (% of labour force) a 7.4 7.7 6.9Labour force participation (female/male pop. %) a 58.4/69.4 60.2/70.5 61.3/71.2CPI: Consumer price index (2000=100) 252b 375 478Agricultural production index (2004-2006=100) 102 111 118c
Food production index (2004-2006=100) 102 113 121c
Balance of payments, current account (million US$) –356 –1 942 –1 365Social indicatorsPopulation growth rate (average annual %) 2010-2015 1.4Urban population (%) 2015 58.6Urban population growth rate (average annual %) 2010-2015 3.8Fertility rate, total (live births per woman) 2010-2015 3.1Life expectancy at birth (females/males, years) 2010-2015 64.4/60.2Total dependency ratio (Pop. aged 0-14 & 65+ per 100 pop. 15-64) 2015 62International migrant stock (000/% of total pop.) mid-2015 39.5/0.4Tourist arrivals at national borders (000) 2014 465de
Refugees and others of concern to UNHCR mid-2015 10Infant mortality rate (per 1 000 live births) 2010-2015 47Health: Total expenditure (% of GDP) 2014 7.6f
Intentional homicide rate (per 100 000 pop.) 2014 10.0g
Seats held by women in national parliaments (%) 2016 0.0Environment and infrastructureMobile-cellular subscriptions (per 100 inhabitants) 2014 64.7Individuals using the Internet (%) 2014 11.4a
Threatened species 2015 169Forested area (% of land area) 2013 3.6a
CO2 emission estimates (000 tons/tons per capita) 2013 2 406/0.2Energy production, primary (Petajoules) 2013 140Energy supply per capita (Gigajoules) 2013 16.0Terrestrial and marine areas protected (% of total area) 2014 0.1Population using improved drinking water sources (urban/rural, %) 2015 64.9/47.6Population using improved sanitation facilities (urban/rural, %) 2015 33.6/19.2Net Official Development Assistance received (% of GNI) 2014 12.4a Estimate. b Series linked to former series. c 2013. d Including nationals residing abroad. e Arrivals byair. f Data revision. g 2012.
94 World Statistics Pocketbook
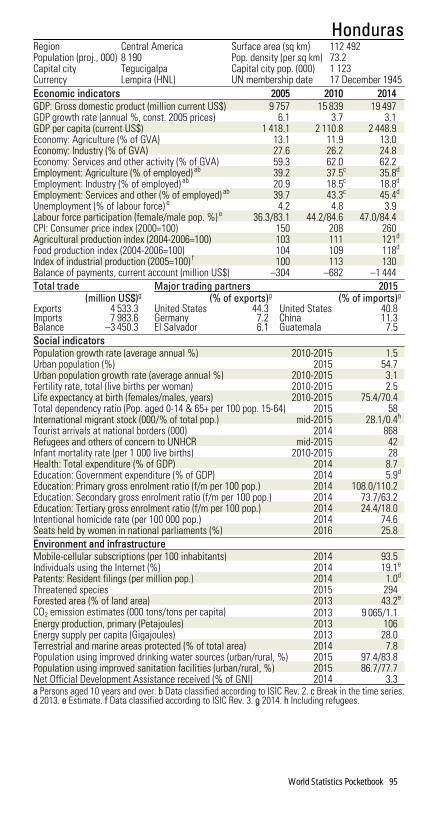
HondurasRegion Central America Surface area (sq km) 112 492Population (proj., 000) 8 190 Pop. density (per sq km) 73.2Capital city Tegucigalpa Capital city pop. (000) 1 123Currency Lempira (HNL) UN membership date 17 December 1945Economic indicators 2005 2010 2014GDP: Gross domestic product (million current US$) 9 757 15 839 19 497GDP growth rate (annual %, const. 2005 prices) 6.1 3.7 3.1GDP per capita (current US$) 1 418.1 2 110.8 2 448.9Economy: Agriculture (% of GVA) 13.1 11.9 13.0Economy: Industry (% of GVA) 27.6 26.2 24.8Economy: Services and other activity (% of GVA) 59.3 62.0 62.2Employment: Agriculture (% of employed) ab 39.2 37.5c 35.8d
Employment: Industry (% of employed) ab 20.9 18.5c 18.8d
Employment: Services and other (% of employed) ab 39.7 43.3c 45.4d
Unemployment (% of labour force) e 4.2 4.8 3.9Labour force participation (female/male pop. %) e 36.3/83.1 44.2/84.6 47.0/84.4CPI: Consumer price index (2000=100) 150 208 260Agricultural production index (2004-2006=100) 103 111 121d
Food production index (2004-2006=100) 104 109 118d
Index of industrial production (2005=100) f 100 113 130Balance of payments, current account (million US$) –304 –682 –1 444Total trade Major trading partners 2015
(million US$)g (% of exports)g (% of imports)g
Exports 4 533.3 United States 44.3 United States 40.8Imports 7 983.6 Germany 7.2 China 11.3Balance –3 450.3 El Salvador 6.1 Guatemala 7.5Social indicatorsPopulation growth rate (average annual %) 2010-2015 1.5Urban population (%) 2015 54.7Urban population growth rate (average annual %) 2010-2015 3.1Fertility rate, total (live births per woman) 2010-2015 2.5Life expectancy at birth (females/males, years) 2010-2015 75.4/70.4Total dependency ratio (Pop. aged 0-14 & 65+ per 100 pop. 15-64) 2015 58International migrant stock (000/% of total pop.) mid-2015 28.1/0.4h
Tourist arrivals at national borders (000) 2014 868Refugees and others of concern to UNHCR mid-2015 42Infant mortality rate (per 1 000 live births) 2010-2015 28Health: Total expenditure (% of GDP) 2014 8.7Education: Government expenditure (% of GDP) 2014 5.9d
Education: Primary gross enrolment ratio (f/m per 100 pop.) 2014 108.0/110.2Education: Secondary gross enrolment ratio (f/m per 100 pop.) 2014 73.7/63.2Education: Tertiary gross enrolment ratio (f/m per 100 pop.) 2014 24.4/18.0Intentional homicide rate (per 100 000 pop.) 2014 74.6Seats held by women in national parliaments (%) 2016 25.8Environment and infrastructureMobile-cellular subscriptions (per 100 inhabitants) 2014 93.5Individuals using the Internet (%) 2014 19.1e
Patents: Resident filings (per million pop.) 2014 1.0d
Threatened species 2015 294Forested area (% of land area) 2013 43.2e
CO2 emission estimates (000 tons/tons per capita) 2013 9 065/1.1Energy production, primary (Petajoules) 2013 106Energy supply per capita (Gigajoules) 2013 28.0Terrestrial and marine areas protected (% of total area) 2014 7.8Population using improved drinking water sources (urban/rural, %) 2015 97.4/83.8Population using improved sanitation facilities (urban/rural, %) 2015 86.7/77.7Net Official Development Assistance received (% of GNI) 2014 3.3a Persons aged 10 years and over. b Data classified according to ISIC Rev. 2. c Break in the time series.d 2013. e Estimate. f Data classified according to ISIC Rev. 3. g 2014. h Including refugees.
World Statistics Pocketbook 95

HungaryRegion Eastern Europe Surface area (sq km) 93 024Population (proj., 000) 9 821 Pop. density (per sq km) 108.5Capital city Budapest Capital city pop. (000) 1 714Currency Forint (HUF) UN membership date 14 December 1955Economic indicators 2005 2010 2014GDP: Gross domestic product (million current US$) 112 531 130 091 138 347GDP growth rate (annual %, const. 2005 prices) 4.4 0.7 3.7GDP per capita (current US$) 11 146.1 12 990.1 13 989.2Economy: Agriculture (% of GVA) a 4.3 3.6 4.5Economy: Industry (% of GVA) b 31.5 30.2 31.2Economy: Services and other activity (% of GVA) cd 64.3 66.3 64.4Employment: Agriculture (% of employed) 4.8ef 4.5 4.6Employment: Industry (% of employed) 32.6ef 30.8 30.5Employment: Services and other (% of employed) 62.5ef 64.7 64.5Unemployment (% of labour force) g 7.2 11.2 7.7Labour force participation (female/male pop. %) g 42.9/58.3 43.7/58.3 46.3/62.5CPI: Consumer price index (2000=100) 133 173 193Agricultural production index (2004-2006=100) 97 80 88h
Food production index (2004-2006=100) 96 80 88h
Index of industrial production (2005=100) i 100 108 122Balance of payments, current account (million US$) –7 883 346 3 044Total trade Major trading partners 2015
(million US$) (% of exports) (% of imports)Exports 100 166.5 Germany 27.3 Germany 26.1Imports 90 374.3 Romania 5.2 Austria 6.6Balance 9 792.2 Slovakia 5.0 China 5.8Social indicatorsPopulation growth rate (average annual %) 2010-2015 –0.3Urban population (%) 2015 71.2Urban population growth rate (average annual %) 2010-2015 0.5Fertility rate, total (live births per woman) 2010-2015 1.3Life expectancy at birth (females/males, years) 2010-2015 78.5/71.2Total dependency ratio (Pop. aged 0-14 & 65+ per 100 pop. 15-64) 2015 48International migrant stock (000/% of total pop.) mid-2015 449.6/4.6j
Tourist arrivals at national borders (000) 2014 12 140Refugees and others of concern to UNHCR mid-2015 28 751Infant mortality rate (per 1 000 live births) 2010-2015 5Health: Total expenditure (% of GDP) 2014 7.4Health: Physicians (per 1 000 pop.) 2013 3.1k
Education: Government expenditure (% of GDP) 2014 4.6l
Education: Primary gross enrolment ratio (f/m per 100 pop.) 2014 100.9/102.1Education: Secondary gross enrolment ratio (f/m per 100 pop.) 2014 107.1/106.9Education: Tertiary gross enrolment ratio (f/m per 100 pop.) 2014 60.0/46.6Intentional homicide rate (per 100 000 pop.) 2014 1.5Seats held by women in national parliaments (%) 2016 10.1Environment and infrastructureMobile-cellular subscriptions (per 100 inhabitants) 2014 118.1Individuals using the Internet (%) 2014 76.1m
Patents: Resident filings (per million pop.) 2014 67.0Threatened species 2015 67Forested area (% of land area) 2013 22.8g
CO2 emission estimates (000 tons/tons per capita) 2013 41 441/4.2Energy production, primary (Petajoules) 2013 426Energy supply per capita (Gigajoules) 2013 95.0Terrestrial and marine areas protected (% of total area) 2014 22.6Population using improved drinking water sources (urban/rural, %) 2015 100.0/100.0Population using improved sanitation facilities (urban/rural, %) 2015 97.8/98.6Net Official Development Assistance disbursed (% of GNI) 2014 0.1a Excludes irrigation canals and landscaping care. b Excludes publishing activities, includes irrigationcanals. c Excludes repair of personal and household goods. d Includes publishing activities and land-scaping care. e Data classified according to ISIC Rev. 3. f Break in the time series. g Estimate. h 2013. iExcluding water and waste management. j Including refugees. k 2012. l 2011. m Population age 16-74.
96 World Statistics Pocketbook

IcelandRegion Northern Europe Surface area (sq km) 103 000Population (proj., 000) 332 Pop. density (per sq km) 3.3Capital city Reykjavik Capital city pop. (000) 184 a
Currency Iceland Krona (ISK) UN membership date 19 November 1946Economic indicators 2005 2010 2014GDP: Gross domestic product (million current US$) 16 749 13 237 17 036GDP growth rate (annual %, const. 2005 prices) 6.0 –3.6 1.8GDP per capita (current US$) 56 443.5 41 619.9 52 047.5Economy: Agriculture (% of GVA) b 5.8 7.4 6.0Economy: Industry (% of GVA) c 25.1 24.8 23.6Economy: Services and other activity (% of GVA) de 69.2 67.8 70.2Employment: Agriculture (% of employed) 6.3f 5.4 4.2Employment: Industry (% of employed) 21.6f 18.2 18.2Employment: Services and other (% of employed) 71.3f 75.9 77.1Unemployment (% of labour force) g 2.5 7.6 4.9Labour force participation (female/male pop. %) g 70.8/80.2 70.4/78.6 70.9/77.7CPI: Consumer price index (2000=100) h 122 182 211Agricultural production index (2004-2006=100) 99 110 114i
Food production index (2004-2006=100) 99 110 114i
Balance of payments, current account (million US$) –2 339 –308 551Total trade Major trading partners 2015
(million US$) (% of exports) (% of imports)Exports 4 723.3 Netherlands 26.1 Norway 10.1Imports 5 285.8 United Kingdom 11.6 Germany 8.6Balance –562.5 Spain 11.5 United States 7.9Social indicatorsPopulation growth rate (average annual %) 2010-2015 0.7Urban population (%) 2015 94.1Urban population growth rate (average annual %) 2010-2015 1.3Fertility rate, total (live births per woman) 2010-2015 2.0Life expectancy at birth (females/males, years) 2010-2015 83.8/80.7Total dependency ratio (Pop. aged 0-14 & 65+ per 100 pop. 15-64) 2015 52International migrant stock (000/% of total pop.) mid-2015 37.5/11.4Tourist arrivals at national borders (000) 2014 998Refugees and others of concern to UNHCR mid-2015 448Infant mortality rate (per 1 000 live births) 2010-2015 2Health: Total expenditure (% of GDP) 2014 8.9Health: Physicians (per 1 000 pop.) 2013 3.5j
Education: Government expenditure (% of GDP) 2014 7.1k
Education: Primary gross enrolment ratio (f/m per 100 pop.) 2014 98.9/98.5j
Education: Secondary gross enrolment ratio (f/m per 100 pop.) 2014 110.8/111.6j
Education: Tertiary gross enrolment ratio (f/m per 100 pop.) 2014 104.6/60.7j
Intentional homicide rate (per 100 000 pop.) 2014 0.3i
Seats held by women in national parliaments (%) 2016 41.3Environment and infrastructureMobile-cellular subscriptions (per 100 inhabitants) 2014 111.1Individuals using the Internet (%) 2014 98.2l
Patents: Resident filings (per million pop.) 2014 281.0Threatened species 2015 21Forested area (% of land area) 2013 0.5g
CO2 emission estimates (000 tons/tons per capita) 2013 1 969/6.1Energy production, primary (Petajoules) 2013 286Energy supply per capita (Gigajoules) 2013 957.0Terrestrial and marine areas protected (% of total area) 2014 2.3Population using improved drinking water sources (urban/rural, %) 2015 100.0/100.0Population using improved sanitation facilities (urban/rural, %) 2015 98.7/100.0Net Official Development Assistance disbursed (% of GNI) m 2014 0.2a 2014. b Excludes irrigation canals and landscaping care. c Excludes publishing activities, includesirrigation canals. d Excludes repair of personal and household goods. e Includes publishing activities andlandscaping care. f Data classified according to ISIC Rev. 3. g Estimate. h Annual averages are based onthe months February-December and January of the following year. i 2013. j 2012. k 2011. l Populationage 16-74. m Development Assistance Committee member (OECD).
World Statistics Pocketbook 97

IndiaRegion Southern Asia Surface area (sq km) 3 287 263Population (proj., 000) 1 326 802 Pop. density (per sq km) 446.3Capital city New Delhi Capital city pop. (000) 250 a
Currency Indian Rupee (INR) UN membership date 30 October 1945Economic indicators 2005 2010 2014GDP: Gross domestic product (million current US$) 820 980 1 668 768 2 054 941GDP growth rate (annual %, const. 2005 prices) 9.3 10.3 7.3GDP per capita (current US$) 717.4 1 355.6 1 586.5Economy: Agriculture (% of GVA) b 19.3 18.7 17.0Economy: Industry (% of GVA) c 34.3 33.1 30.0Economy: Services and other activity (% of GVA) de 46.4 48.2 53.0Employment: Agriculture (% of employed) 55.8fg 51.1fg 49.7hi
Employment: Industry (% of employed) 19.0fg 22.4fg 21.5hi
Employment: Services and other (% of employed) 25.2fg 26.6fg 28.7hi
Unemployment (% of labour force) j 4.4 3.5 3.5Labour force participation (female/male pop. %) j 36.8/83.1 28.6/80.5 26.7/79.1CPI: Consumer price index (2000=100) k 122 183 256Agricultural production index (2004-2006=100) 100 125 140i
Food production index (2004-2006=100) 100 123 139i
Index of industrial production (2005=100) fl 100 152 163Balance of payments, current account (million US$) –10 284 –54 516 –27 452Total trade Major trading partners 2015
(million US$) (% of exports) (% of imports)Exports 264 381.0 United States 15.2 China 15.8Imports 390 744.7 United Arab Emirates 11.3 Saudi Arabia 5.5Balance –126 363.7 China, Hong Kong SAR 4.6 Switzerland 5.4Social indicatorsPopulation growth rate (average annual %) 2010-2015 1.3Urban population (%) 2015 32.7Urban population growth rate (average annual %) 2010-2015 2.4Fertility rate, total (live births per woman) 2010-2015 2.5Life expectancy at birth (females/males, years) 2010-2015 68.9/66.1Total dependency ratio (Pop. aged 0-14 & 65+ per 100 pop. 15-64) 2015 52International migrant stock (000/% of total pop.) mid-2015 5 241.0/0.4m
Tourist arrivals at national borders (000) 2014 7 679n
Refugees and others of concern to UNHCR mid-2015 205 764Infant mortality rate (per 1 000 live births) 2010-2015 41Health: Total expenditure (% of GDP) 2014 4.7Health: Physicians (per 1 000 pop.) 2013 0.7o
Education: Government expenditure (% of GDP) 2014 3.8o
Education: Primary gross enrolment ratio (f/m per 100 pop.) 2014 117.0/104.9i
Education: Secondary gross enrolment ratio (f/m per 100 pop.) 2014 69.2/68.6i
Education: Tertiary gross enrolment ratio (f/m per 100 pop.) 2014 23.1/24.6i
Intentional homicide rate (per 100 000 pop.) 2014 3.2Seats held by women in national parliaments (%) 2016 12.0Environment and infrastructureMobile-cellular subscriptions (per 100 inhabitants) 2014 74.5p
Individuals using the Internet (%) 2014 18.0j
Patents: Resident filings (per million pop.) 2014 9.0Threatened species 2015 1 039Forested area (% of land area) 2013 23.7j
CO2 emission estimates (000 tons/tons per capita) 2013 2 034 752/1.6Energy production, primary (Petajoules) 2013 22 401Energy supply per capita (Gigajoules) 2013 26.0Terrestrial and marine areas protected (% of total area) 2014 3.1Population using improved drinking water sources (urban/rural, %) 2015 97.1/92.7Population using improved sanitation facilities (urban/rural, %) 2015 62.6/28.5Net Official Development Assistance received (% of GNI) 2014 0.2a 2011. b Excludes irrigation canals and landscaping care. c Excludes publishing activities, includesirrigation canals. d Excludes repair of personal and household goods. e Includes publishing activities andlandscaping care. f Data classified according to ISIC Rev. 3. g Excluding Leh and Kargil of Jammu andKashmir districts, some villages in Nagaland, Andaman and Nicobar Islands. h Break in the time series.i 2013. j Estimate. k Industrial workers. l Twelve months beginning 1 April of the year stated. m Includingrefugees. n Excluding nationals residing abroad. o 2012. p Data as at the end of December.
98 World Statistics Pocketbook

IndonesiaRegion South-Eastern Asia Surface area (sq km) 1 910 931Population (proj., 000) 260 581 Pop. density (per sq km) 143.8Capital city Jakarta Capital city pop. (000) 10 323 a
Currency Rupiah (IDR) UN membership date 28 September 1950Economic indicators 2005 2010 2014GDP: Gross domestic product (million current US$) 304 372 755 094 888 538GDP growth rate (annual %, const. 2005 prices) 5.7 6.2 5.0GDP per capita (current US$) 1 345.3 3 125.2 3 491.9Economy: Agriculture (% of GVA) b 12.1 14.3 13.7Economy: Industry (% of GVA) c 43.1 43.9 43.0Economy: Services and other activity (% of GVA) de 44.8 41.8 43.3Employment: Agriculture (% of employed) 44.0f 38.3fg 34.3h
Employment: Industry (% of employed) 18.7f 19.3fg 21.0h
Employment: Services and other (% of employed) 37.2f 42.3fg 44.8h
Unemployment (% of labour force) i 11.2 7.1 5.9Labour force participation (female/male pop. %) i 50.0/85.3 51.9/84.3 50.8/84.0CPI: Consumer price index (2000=100) 156 227 283j
Agricultural production index (2004-2006=100) 98 123 137k
Food production index (2004-2006=100) 98 124 138k
Balance of payments, current account (million US$) 278 5 144g –27 516Total trade Major trading partners 2015
(million US$)l (% of exports)l (% of imports)l
Exports 176 036.2 Japan 13.1 China 17.2Imports 178 179.3 China 10.0 Singapore 14.1Balance –2 143.1 Singapore 9.5 Japan 9.5Social indicatorsPopulation growth rate (average annual %) 2010-2015 1.3Urban population (%) 2015 53.7Urban population growth rate (average annual %) 2010-2015 2.7Fertility rate, total (live births per woman) 2010-2015 2.5Life expectancy at birth (females/males, years) 2010-2015 70.7/66.6Total dependency ratio (Pop. aged 0-14 & 65+ per 100 pop. 15-64) 2015 49International migrant stock (000/% of total pop.) mid-2015 328.9/0.1m
Tourist arrivals at national borders (000) 2014 9 435Refugees and others of concern to UNHCR mid-2015 13 188Infant mortality rate (per 1 000 live births) 2010-2015 25Health: Total expenditure (% of GDP) 2014 2.9Health: Physicians (per 1 000 pop.) 2013 0.2n
Education: Government expenditure (% of GDP) 2014 3.3Education: Primary gross enrolment ratio (f/m per 100 pop.) 2014 104.5/107.0Education: Secondary gross enrolment ratio (f/m per 100 pop.) 2014 82.2/82.8Education: Tertiary gross enrolment ratio (f/m per 100 pop.) 2014 32.8/29.4Intentional homicide rate (per 100 000 pop.) 2014 0.5Seats held by women in national parliaments (%) 2016 17.1Environment and infrastructureMobile-cellular subscriptions (per 100 inhabitants) 2014 126.2i
Individuals using the Internet (%) 2014 17.1o
Patents: Resident filings (per million pop.) 2014 3.0Threatened species 2015 1 246Forested area (% of land area) 2013 51.0i
CO2 emission estimates (000 tons/tons per capita) 2013 479 365/1.9Energy production, primary (Petajoules) 2013 19 754Energy supply per capita (Gigajoules) 2013 35.0Terrestrial and marine areas protected (% of total area) 2014 6.0Population using improved drinking water sources (urban/rural, %) 2015 94.2/79.5Population using improved sanitation facilities (urban/rural, %) 2015 72.3/47.5Net Official Development Assistance received (% of GNI) 2014 –0.1a Refers to the functional urban area. b Excludes irrigation canals and landscaping care. c Excludespublishing activities, includes irrigation canals. d Excludes repair of personal and household goods. eIncludes publishing activities and landscaping care. f Data classified according to ISIC Rev. 3. g Break inthe time series. h Data classified according to ISIC Rev. 2. i Estimate. j Series linked to former series. k2013. l 2014. m Including refugees. n 2012. o Population age 5+.
World Statistics Pocketbook 99

Iran (Islamic Republic of)Region Southern Asia Surface area (sq km) 1 628 750 a
Population (proj., 000) 80 043 Pop. density (per sq km) 49.2Capital city Tehran Capital city pop. (000) 8 432Currency Iranian Rial (IRR) UN membership date 24 October 1945Economic indicators 2005 2010 2014GDP: Gross domestic product (million current US$) 219 846 467 790 425 326GDP growth rate (annual %, const. 2005 prices) 4.2 6.6 4.3GDP per capita (current US$) 3 135.2 6 299.9 5 442.9Economy: Agriculture (% of GVA) 6.5 6.7 7.4Economy: Industry (% of GVA) 45.7 40.3 41.6Economy: Services and other activity (% of GVA) 47.9 53.1 51.0Employment: Agriculture (% of employed) b 24.7cd 19.2ce 17.9e
Employment: Industry (% of employed) b 30.3cd 32.2ce 33.8e
Employment: Services and other (% of employed) b 44.8cd 48.6ce 48.3e
Unemployment (% of labour force) f 12.1 13.5 10.6Labour force participation (female/male pop. %) f 19.4/74.2 16.0/70.0 16.0/72.4CPI: Consumer price index (2000=100) 193 386 913Agricultural production index (2004-2006=100) 103 108 113g
Food production index (2004-2006=100) 103 108 114g
Total trade Major trading partners 2015(million US$)h (% of exports)hi (% of imports)h
Exports 130 544.0 Asia nes 47.0 United Arab Emirates 26.6Imports 68 319.0 Europe nes 18.9 Areas nes 14.7i
Balance 62 225.0 Areas nes 7.1 China 10.3Social indicatorsPopulation growth rate (average annual %) 2010-2015 1.3Urban population (%) 2015 73.4Urban population growth rate (average annual %) 2010-2015 2.1Fertility rate, total (live births per woman) 2010-2015 1.8Life expectancy at birth (females/males, years) 2010-2015 76.2/74.0Total dependency ratio (Pop. aged 0-14 & 65+ per 100 pop. 15-64) 2015 40International migrant stock (000/% of total pop.) mid-2015 2 726.4/3.5j
Tourist arrivals at national borders (000) k 2014 4 967Refugees and others of concern to UNHCR mid-2015 979 491Infant mortality rate (per 1 000 live births) 2010-2015 15Health: Total expenditure (% of GDP) 2014 6.9l
Education: Government expenditure (% of GDP) 2014 3.0Education: Primary gross enrolment ratio (f/m per 100 pop.) 2014 111.6/106.9Education: Secondary gross enrolment ratio (f/m per 100 pop.) 2014 87.9/88.9Education: Tertiary gross enrolment ratio (f/m per 100 pop.) 2014 63.6/68.2Intentional homicide rate (per 100 000 pop.) 2014 4.8m
Seats held by women in national parliaments (%) 2016 3.1Environment and infrastructureMobile-cellular subscriptions (per 100 inhabitants) 2014 87.8Individuals using the Internet (%) 2014 39.4f
Patents: Resident filings (per million pop.) 2014 174.0Threatened species 2015 121Forested area (% of land area) 2013 6.6f
CO2 emission estimates (000 tons/tons per capita) 2013 616 976/8.0Energy production, primary (Petajoules) 2013 12 544Energy supply per capita (Gigajoules) 2013 119.0Terrestrial and marine areas protected (% of total area) 2014 6.7Population using improved drinking water sources (urban/rural, %) 2015 97.7/92.1Population using improved sanitation facilities (urban/rural, %) 2015 92.8/82.3a Land area only. b Persons aged 10 years and over. c Data classified according to ISIC Rev. 3. d Breakin the time series. e Excluding the institutional population. f Estimate. g 2013. h 2011. i See technicalnotes. j Including refugees. k Arrivals of non-resident visitors at national borders. l Exchange rate changedin 2002 from multiple to a managed floating exchange rate. Inter-bank market rate used prior to 2002.m 2012.
100 World Statistics Pocketbook

IraqRegion Western Asia Surface area (sq km) 435 052Population (proj., 000) 37 548 Pop. density (per sq km) 86.5Capital city Baghdad Capital city pop. (000) 6 643Currency Iraqi Dinar (IQD) UN membership date 21 December 1945Economic indicators 2005 2010 2014GDP: Gross domestic product (million current US$) 36 268 117 138 225 422GDP growth rate (annual %, const. 2005 prices) 4.4 5.5 –3.9GDP per capita (current US$) 1 342.4 3 794.8 6 390.7Economy: Agriculture (% of GVA) 6.9 5.1 4.2Economy: Industry (% of GVA) 63.3 55.4 59.0Economy: Services and other activity (% of GVA) 29.9 39.4 36.9Employment: Agriculture (% of employed) a 17.0b 23.4cd ...Employment: Industry (% of employed) a 17.8b 18.2cd ...Employment: Services and other (% of employed) a 65.2b 58.3cd ...Unemployment (% of labour force) e 18.0 15.2 16.0Labour force participation (female/male pop. %) e 13.7/68.9 14.5/69.3 15.0/69.6CPI: Consumer price index (2000=100) 323 660f 770Agricultural production index (2004-2006=100) 104 104 129g
Food production index (2004-2006=100) 104 104 129g
Balance of payments, current account (million US$) –7 513 6 488 29 541h
Total trade Major trading partners 2015(million US$) (% of exports) (% of imports)
Exports 89 741.9g ... ...Social indicatorsPopulation growth rate (average annual %) 2010-2015 3.3Urban population (%) 2015 69.5Urban population growth rate (average annual %) 2010-2015 3.0Fertility rate, total (live births per woman) 2010-2015 4.6Life expectancy at birth (females/males, years) 2010-2015 71.4/67.0Total dependency ratio (Pop. aged 0-14 & 65+ per 100 pop. 15-64) 2015 79International migrant stock (000/% of total pop.) mid-2015 353.9/1.0ij
Tourist arrivals at national borders (000) k 2014 892gl
Refugees and others of concern to UNHCR mid-2015 4 311 660m
Infant mortality rate (per 1 000 live births) 2010-2015 32Health: Total expenditure (% of GDP) 2014 5.5cno
Intentional homicide rate (per 100 000 pop.) 2014 7.9p
Seats held by women in national parliaments (%) 2016 26.5Environment and infrastructureMobile-cellular subscriptions (per 100 inhabitants) 2014 94.9e
Individuals using the Internet (%) 2014 11.3e
Threatened species 2015 69Forested area (% of land area) 2013 1.9e
CO2 emission estimates (000 tons/tons per capita) 2013 167 813/4.9Energy production, primary (Petajoules) 2013 6 522Energy supply per capita (Gigajoules) 2013 61.0Terrestrial and marine areas protected (% of total area) 2014 0.4Population using improved drinking water sources (urban/rural, %) 2015 93.8/70.1Population using improved sanitation facilities (urban/rural, %) 2015 86.4/83.8Net Official Development Assistance received (% of GNI) 2014 0.6a Data classified according to ISIC Rev. 3. b 2004. c Break in the time series. d 2008. e Estimate. f Serieslinked to former series. g 2013. h 2012. i Including refugees. j Refers to foreign citizens. k Arrivals of non-resident visitors at national borders. l Including residents and non-residents. m Including an estimate forstateless persons populations in line with Law 26 of 2006, which allows stateless persons to apply fornationality in certain circumstances. n Estimates should be viewed with caution as these are derivedfrom scarce data. o The estimates do not include expenditures for Northern Iraq. p 2011.
World Statistics Pocketbook 101

IrelandRegion Northern Europe Surface area (sq km) 69 797Population (proj., 000) 4 714 Pop. density (per sq km) 68.4Capital city Dublin Capital city pop. (000) 1 169Currency Euro (EUR) UN membership date 14 December 1955Economic indicators 2005 2010 2014GDP: Gross domestic product (million current US$) 211 383 220 063 250 814GDP growth rate (annual %, const. 2005 prices) 6.3 0.4 5.2GDP per capita (current US$) 50 285.1 47 660.2 53 648.1Economy: Agriculture (% of GVA) a 1.2 1.1 1.6Economy: Industry (% of GVA) b 34.5 26.7 25.6Economy: Services and other activity (% of GVA) cd 64.4 72.3 72.8Employment: Agriculture (% of employed) e 6.0 4.8 6.1Employment: Industry (% of employed) e 27.6 20.2 18.4Employment: Services and other (% of employed) e 65.8 74.4 75.2Unemployment (% of labour force) f 4.3 13.9 11.3Labour force participation (female/male pop. %) f 52.4/72.9 53.3/69.2 52.7/68.2CPI: Consumer price index (2000=100) 119 128 134Agricultural production index (2004-2006=100) 99 100 99g
Food production index (2004-2006=100) 99 100 99g
Index of industrial production (2005=100) h 100 109 129Balance of payments, current account (million US$) –7 150 2 319 8 914i
Total trade Major trading partners 2015(million US$) (% of exports) (% of imports)
Exports 123 152.3 United States 23.6 United Kingdom 26.6Imports 74 334.5 United Kingdom 13.9 United States 14.6Balance 48 817.8 Belgium 13.1 France 10.6Social indicatorsPopulation growth rate (average annual %) 2010-2015 0.3Urban population (%) 2015 63.2Urban population growth rate (average annual %) 2010-2015 1.6Fertility rate, total (live births per woman) 2010-2015 2.0Life expectancy at birth (females/males, years) 2010-2015 82.7/78.4Total dependency ratio (Pop. aged 0-14 & 65+ per 100 pop. 15-64) 2015 54International migrant stock (000/% of total pop.) mid-2015 746.3/15.9Tourist arrivals at national borders (000) 2014 8 813j
Refugees and others of concern to UNHCR mid-2015 10 252k
Infant mortality rate (per 1 000 live births) 2010-2015 3Health: Total expenditure (% of GDP) 2014 7.8Health: Physicians (per 1 000 pop.) 2013 2.7Education: Government expenditure (% of GDP) 2014 5.8l
Education: Primary gross enrolment ratio (f/m per 100 pop.) 2014 103.1/102.6g
Education: Secondary gross enrolment ratio (f/m per 100 pop.) 2014 127.5/124.8l
Education: Tertiary gross enrolment ratio (f/m per 100 pop.) 2014 75.2/71.2g
Intentional homicide rate (per 100 000 pop.) 2014 1.1Seats held by women in national parliaments (%) 2016 16.3Environment and infrastructureMobile-cellular subscriptions (per 100 inhabitants) 2014 104.3Individuals using the Internet (%) 2014 79.7m
Patents: Resident filings (per million pop.) 2014 191.0Threatened species 2015 39Forested area (% of land area) 2013 10.8f
CO2 emission estimates (000 tons/tons per capita) 2013 34 965/7.5Energy production, primary (Petajoules) 2013 95Energy supply per capita (Gigajoules) 2013 117.0Terrestrial and marine areas protected (% of total area) 2014 3.5Population using improved drinking water sources (urban/rural, %) 2015 97.9/97.8Population using improved sanitation facilities (urban/rural, %) 2015 89.1/92.9Net Official Development Assistance disbursed (% of GNI) n 2014 0.4a Excludes irrigation canals and landscaping care. b Excludes publishing activities, includes irrigationcanals. c Excludes repair of personal and household goods. d Includes publishing activities and land-scaping care. e Data classified according to ISIC Rev. 2. f Estimate. g 2013. h Excluding water and wastemanagement. i Break in the time series. j Including tourists from Northern Ireland. k Refugee populationrelates to the end of 2014. l 2012. m Population age 16-74. n Development Assistance Committee member(OECD).
102 World Statistics Pocketbook

Isle of ManRegion Northern Europe Surface area (sq km) 572Population (proj., 000) 88 Pop. density (per sq km) 155.1Capital city Douglas Capital city pop. (000) 29 a
Currency Pound Sterling (GBP)Economic indicators 2005 2010 2014Employment: Agriculture (% of employed) b 1.4c 1.9d ...Employment: Industry (% of employed) b 16.1c 14.8d ...Employment: Services and other (% of employed) b 82.5c 83.3d ...Unemployment (% of labour force) 1.6c 2.4d 2.6efg
Labour force participation (female/male pop. %) 55.7/71.4c 56.3/69.9d 57.5/69.3ehi
CPI: Consumer price index (2000=100) 117 140 161Social indicatorsPopulation growth rate (average annual %) 2010-2015 0.8Urban population (%) 2015 52.2Urban population growth rate (average annual %) 2010-2015 0.8Life expectancy at birth (females/males, years) 2010-2015 79.9/73.6j
Total dependency ratio (Pop. aged 0-14 & 65+ per 100 pop. 15-64) 2015 52i
International migrant stock (000/% of total pop.) mid-2015 45.2/51.5Environment and infrastructureThreatened species 2015 3Forested area (% of land area) 2013 6.1k
Energy production, primary (Petajoules) 2013 0k
Energy supply per capita (Gigajoules) 2013 4.0k
a 2014. b Data classified according to ISIC Rev. 3. c 2001. d 2006. e Break in the time series. f Personsaged 15 to 64 years. g 2013. h Persons aged 16 years and over. i 2011. j 1996. k Estimate.
World Statistics Pocketbook 103

IsraelRegion Western Asia Surface area (sq km) 22 072Population (proj., 000) 8 193 Pop. density (per sq km) 378.6Capital city Jerusalem a Capital city pop. (000) 839 b
Currency New Israeli Sheqel (ILS) UN membership date 11 May 1949Economic indicators 2005 2010 2014GDP: Gross domestic product (million current US$) 142 838 234 323 305 673GDP growth rate (annual %, const. 2005 prices) 4.4 5.5 2.6GDP per capita (current US$) 21 630.0 31 578.4 38 500.3Economy: Agriculture (% of GVA) c 1.7 1.7 1.3Economy: Industry (% of GVA) d 22.8 22.6 22.1Economy: Services and other activity (% of GVA) ef 75.4 75.7 76.6Employment: Agriculture (% of employed) 2.0g 1.6gh 1.1Employment: Industry (% of employed) 21.4g 20.2gh 17.6Employment: Services and other (% of employed) 75.7g 77.2gh 79.7Unemployment (% of labour force) i 8.0 6.0 5.9Labour force participation (female/male pop. %) i 55.4/69.3 57.1/69.7 59.0/69.5CPI: Consumer price index (2000=100) 109 124 133Agricultural production index (2004-2006=100) 100 104 110j
Food production index (2004-2006=100) 100 105 111j
Index of industrial production (2005=100) k ... 126 136Balance of payments, current account (million US$) 4 043 7 855 12 927Total trade Major trading partners 2015
(million US$) (% of exports) (% of imports)Exports 64 062.2 United States 28.3 United States 13.0Imports 62 067.8 China, Hong Kong SAR 8.3 Areas nes 10.7l
Balance 1 994.4 United Kingdom 6.2 China 9.3Social indicatorsPopulation growth rate (average annual %) 2010-2015 1.7Urban population (%) 2015 92.1Urban population growth rate (average annual %) 2010-2015 1.4Fertility rate, total (live births per woman) 2010-2015 3.1Life expectancy at birth (females/males, years) 2010-2015 83.8/80.2Total dependency ratio (Pop. aged 0-14 & 65+ per 100 pop. 15-64) 2015 64International migrant stock (000/% of total pop.) mid-2015 2 011.7/25.0m
Tourist arrivals at national borders (000) 2014 2 927n
Refugees and others of concern to UNHCR mid-2015 45 179Infant mortality rate (per 1 000 live births) 2010-2015 3Health: Total expenditure (% of GDP) 2014 7.8Health: Physicians (per 1 000 pop.) 2013 3.3o
Education: Government expenditure (% of GDP) 2014 5.9j
Education: Primary gross enrolment ratio (f/m per 100 pop.) 2014 104.4/104.0Education: Secondary gross enrolment ratio (f/m per 100 pop.) 2014 102.7/101.1Education: Tertiary gross enrolment ratio (f/m per 100 pop.) 2014 76.2/56.7Intentional homicide rate (per 100 000 pop.) 2014 1.7o
Seats held by women in national parliaments (%) 2016 26.7Environment and infrastructureMobile-cellular subscriptions (per 100 inhabitants) 2014 121.5i
Individuals using the Internet (%) 2014 71.5i
Patents: Resident filings (per million pop.) 2014 137.0Threatened species 2015 152Forested area (% of land area) 2013 7.4i
CO2 emission estimates (000 tons/tons per capita) 2013 71 074/9.1Energy production, primary (Petajoules) 2013 270Energy supply per capita (Gigajoules) 2013 128.0Terrestrial and marine areas protected (% of total area) 2014 8.6Population using improved drinking water sources (urban/rural, %) 2015 100.0/100.0Population using improved sanitation facilities (urban/rural, %) 2015 100.0/100.0Net Official Development Assistance disbursed (% of GNI) 2014 0.1a Designation and data provided by Israel. The position of the United Nations on Jerusalem is stated inA/RES/181 (II) and subsequent General Assembly and Security Council resolutions. b Including EastJerusalem. c Excludes irrigation canals and landscaping care. d Excludes publishing activities, includesirrigation canals. e Excludes repair of personal and household goods. f Includes publishing activities andlandscaping care. g Data classified according to ISIC Rev. 3. h Break in the time series. i Estimate. j 2013.k Data refers to mining and manufacturing. l See technical notes. m Including refugees. n Excludingnationals residing abroad. o 2012.
104 World Statistics Pocketbook

ItalyRegion Southern Europe Surface area (sq km) 302 073Population (proj., 000) 59 801 Pop. density (per sq km) 203.3Capital city Rome Capital city pop. (000) 3 718Currency Euro (EUR) UN membership date 14 December 1955Economic indicators 2005 2010 2014GDP: Gross domestic product (million current US$) 1 853 466 2 126 621 2 141 161GDP growth rate (annual %, const. 2005 prices) 1.0 1.7 –0.4GDP per capita (current US$) 31 598.2 35 688.7 35 812.2Economy: Agriculture (% of GVA) a 2.3 2.0 2.2Economy: Industry (% of GVA) b 25.8 24.4 23.5Economy: Services and other activity (% of GVA) cd 71.9 73.7 74.3Employment: Agriculture (% of employed) 4.0e 3.6 3.5Employment: Industry (% of employed) 30.9e 28.8 27.1Employment: Services and other (% of employed) 65.1e 67.6 69.5Unemployment (% of labour force) f 7.7 8.4 12.7Labour force participation (female/male pop. %) f 37.8/61.0 37.8/59.1 39.4/58.3CPI: Consumer price index (2000=100) 112g 123g 133Agricultural production index (2004-2006=100) 100 97 90h
Food production index (2004-2006=100) 100 97 91h
Index of industrial production (2005=100) i 100 89 81Balance of payments, current account (million US$) –29 744 –74 385 39 908Total trade Major trading partners 2015
(million US$)j (% of exports)j (% of imports)j
Exports 458 751.2 Germany 12.3 Germany 15.4Imports 408 971.0 France 10.3 France 8.7Balance 49 780.2 United States 8.7 China 7.6Social indicatorsPopulation growth rate (average annual %) 2010-2015 0.1Urban population (%) 2015 69.0Urban population growth rate (average annual %) 2010-2015 0.4Fertility rate, total (live births per woman) 2010-2015 1.4Life expectancy at birth (females/males, years) 2010-2015 85.2/80.3Total dependency ratio (Pop. aged 0-14 & 65+ per 100 pop. 15-64) 2015 57International migrant stock (000/% of total pop.) mid-2015 5 788.9/9.7Tourist arrivals at national borders (000) 2014 48 576k
Refugees and others of concern to UNHCR mid-2015 142 628l
Infant mortality rate (per 1 000 live births) 2010-2015 2Health: Total expenditure (% of GDP) 2014 9.3Health: Physicians (per 1 000 pop.) 2013 3.8m
Education: Government expenditure (% of GDP) 2014 4.1n
Education: Primary gross enrolment ratio (f/m per 100 pop.) 2014 101.4/102.3h
Education: Secondary gross enrolment ratio (f/m per 100 pop.) 2014 101.4/103.4h
Education: Tertiary gross enrolment ratio (f/m per 100 pop.) 2014 74.2/53.2h
Intentional homicide rate (per 100 000 pop.) 2014 0.8Seats held by women in national parliaments (%) 2016 31.0Environment and infrastructureMobile-cellular subscriptions (per 100 inhabitants) 2014 154.3o
Individuals using the Internet (%) 2014 62.0p
Patents: Resident filings (per million pop.) 2014 200.0Threatened species 2015 279Forested area (% of land area) 2013 31.2f
CO2 emission estimates (000 tons/tons per capita) 2013 344 768/5.8j
Energy production, primary (Petajoules) 2013 1 542q
Energy supply per capita (Gigajoules) 2013 109.0q
Terrestrial and marine areas protected (% of total area) 2014 13.3Population using improved drinking water sources (urban/rural, %) 2015 100.0/100.0Population using improved sanitation facilities (urban/rural, %) 2015 99.5/99.7Net Official Development Assistance disbursed (% of GNI) r 2014 0.2a Excludes irrigation canals and landscaping care. b Excludes publishing activities, includes irrigationcanals. c Excludes repair of personal and household goods. d Includes publishing activities and land-scaping care. e Data classified according to ISIC Rev. 3. f Estimate. g Excluding tobacco. h 2013. i Excludingwater and waste management. j Including San Marino. k Excluding seasonal and border workers. l Refugeepopulation relates to the end of 2014. m 2012. n 2011. o Data as at the end of December. p Populationage 16-74. q Data include San Marino and the Holy See. r Development Assistance Committee member(OECD).
World Statistics Pocketbook 105

JamaicaRegion Caribbean Surface area (sq km) 10 991Population (proj., 000) 2 803 Pop. density (per sq km) 258.9Capital city Kingston Capital city pop. (000) 588Currency Jamaican Dollar (JMD) UN membership date 18 September 1962Economic indicators 2005 2010 2014GDP: Gross domestic product (million current US$) 11 244 13 218 13 927GDP growth rate (annual %, const. 2005 prices) 0.9 –1.5 0.7GDP per capita (current US$) 4 198.8 4 822.0 5 003.8Economy: Agriculture (% of GVA) 5.7 5.9 6.7Economy: Industry (% of GVA) 23.9 20.1 20.7Economy: Services and other activity (% of GVA) 70.4 74.1 72.6Employment: Agriculture (% of employed) a 18.1b 20.2cde 18.2cdf
Employment: Industry (% of employed) a 17.7b 15.9cde 15.2cdf
Employment: Services and other (% of employed) a 64.0b 63.8cde 66.5cdf
Unemployment (% of labour force) g 10.9 12.4 13.7Labour force participation (female/male pop. %) g 57.3/75.1 55.1/71.0 57.6/72.1CPI: Consumer price index (2000=100) 166 296 403Agricultural production index (2004-2006=100) 96 99 106f
Food production index (2004-2006=100) 96 99 106f
Balance of payments, current account (million US$) –1 071 –934 –1 110Total trade Major trading partners 2015
(million US$)h (% of exports)h (% of imports)h
Exports 1 452.0 United States 39.5 United States 39.2Imports 5 835.5 Canada 15.3 Venezuela 11.5Balance –4 383.5 Netherlands 5.7 Trinidad and Tobago 10.2Social indicatorsPopulation growth rate (average annual %) 2010-2015 0.4Urban population (%) 2015 54.8Urban population growth rate (average annual %) 2010-2015 0.9Fertility rate, total (live births per woman) 2010-2015 2.1Life expectancy at birth (females/males, years) 2010-2015 77.9/73.1Total dependency ratio (Pop. aged 0-14 & 65+ per 100 pop. 15-64) 2015 49International migrant stock (000/% of total pop.) mid-2015 23.2/0.8Tourist arrivals at national borders (000) 2014 2 080i
Refugees and others of concern to UNHCR mid-2015 18Infant mortality rate (per 1 000 live births) 2010-2015 15Health: Total expenditure (% of GDP) 2014 5.4j
Education: Government expenditure (% of GDP) 2014 6.0Education: Secondary gross enrolment ratio (f/m per 100 pop.) 2014 71.5/66.3Education: Tertiary gross enrolment ratio (f/m per 100 pop.) 2014 39.0/17.1f
Intentional homicide rate (per 100 000 pop.) 2014 36.1Seats held by women in national parliaments (%) 2016 12.7Environment and infrastructureMobile-cellular subscriptions (per 100 inhabitants) 2014 102.9Individuals using the Internet (%) 2014 40.5g
Patents: Resident filings (per million pop.) 2014 12.0Threatened species 2015 298Forested area (% of land area) 2013 31.0g
CO2 emission estimates (000 tons/tons per capita) 2013 7 726/2.8Energy production, primary (Petajoules) 2013 7Energy supply per capita (Gigajoules) 2013 39.0Terrestrial and marine areas protected (% of total area) 2014 1.4Population using improved drinking water sources (urban/rural, %) 2015 97.5/89.4Population using improved sanitation facilities (urban/rural, %) 2015 79.9/84.1a Persons aged 14 years and over. b Data classified according to ISIC Rev. 2. c Data classified accordingto ISIC Rev. 3. d Break in the time series. e Services include activities not adequately defined. f 2013. gEstimate. h 2014. i Arrivals of non-resident tourists by air. Including nationals residing abroad. E/D cards.j Data revision.
106 World Statistics Pocketbook

JapanRegion Eastern Asia Surface area (sq km) 377 930 a
Population (proj., 000) 126 324 Pop. density (per sq km) 346.5Capital city Tokyo Capital city pop. (000) 38 001 b
Currency Yen (JPY) UN membership date 18 December 1956Economic indicators 2005 2010 2014GDP: Gross domestic product (million current US$) 4 571 867 5 498 719 4 602 419GDP growth rate (annual %, const. 2005 prices) 1.3 4.7 –0.1GDP per capita (current US$) 36 005.0 43 188.3 36 298.2Economy: Agriculture (% of GVA) c 1.2 1.2 1.2Economy: Industry (% of GVA) d 28.1 27.5 26.8Economy: Services and other activity (% of GVA) ef 70.7 71.3 72.0Employment: Agriculture (% of employed) 4.4 4.0g 3.7h
Employment: Industry (% of employed) 28.4 25.4g 25.8h
Employment: Services and other (% of employed) 66.0 69.5g 69.1h
Unemployment (% of labour force) i 4.4 4.9 3.5Labour force participation (female/male pop. %) i 48.4/73.3 49.4/71.7 49.3/70.5CPI: Consumer price index (2000=100) 98j 97 100Agricultural production index (2004-2006=100) 101 97 98h
Food production index (2004-2006=100) 101 97 98h
Balance of payments, current account (million US$) 170 123 220 888 24 021Total trade Major trading partners 2015
(million US$) (% of exports) (% of imports)Exports 625 024.8 United States 20.2 China 25.6Imports 626 082.8 China 17.5 United States 10.9Balance –1 058.0 Republic of Korea 7.0 Australia 5.6Social indicatorsPopulation growth rate (average annual %) 2010-2015 –0.1Urban population (%) 2015 93.5Urban population growth rate (average annual %) 2010-2015 0.6Fertility rate, total (live births per woman) 2010-2015 1.4Life expectancy at birth (females/males, years) 2010-2015 86.5/80.0Total dependency ratio (Pop. aged 0-14 & 65+ per 100 pop. 15-64) 2015 65International migrant stock (000/% of total pop.) mid-2015 2 043.9/1.6k
Tourist arrivals at national borders (000) l 2014 13 413m
Refugees and others of concern to UNHCR mid-2015 13 755i
Infant mortality rate (per 1 000 live births) 2010-2015 2Health: Total expenditure (% of GDP) 2014 10.2Education: Government expenditure (% of GDP) 2014 3.8Education: Primary gross enrolment ratio (f/m per 100 pop.) 2014 101.5/101.7h
Education: Secondary gross enrolment ratio (f/m per 100 pop.) 2014 102.1/101.7h
Education: Tertiary gross enrolment ratio (f/m per 100 pop.) 2014 59.5/65.2h
Intentional homicide rate (per 100 000 pop.) 2014 0.3Seats held by women in national parliaments (%) 2016 9.5Environment and infrastructureMobile-cellular subscriptions (per 100 inhabitants) 2014 120.2n
Individuals using the Internet (%) 2014 90.6i
Patents: Resident filings (per million pop.) 2014 2 092.0Threatened species 2015 364Forested area (% of land area) 2013 68.5i
CO2 emission estimates (000 tons/tons per capita) 2013 1 243 384/9.8Energy production, primary (Petajoules) 2013 1 172Energy supply per capita (Gigajoules) 2013 149.0Terrestrial and marine areas protected (% of total area) 2014 2.1Population using improved drinking water sources (urban/rural, %) 2015 100.0/100.0Population using improved sanitation facilities (urban/rural, %) 2015 100.0/100.0Net Official Development Assistance disbursed (% of GNI) o 2014 0.2a Data refer to 1 October 2007. b Major metropolitan areas. c Excludes irrigation canals and landscapingcare. d Excludes publishing activities, includes irrigation canals. e Excludes repair of personal and house-hold goods. f Includes publishing activities and landscaping care. g Break in the time series. h 2013. iEstimate. j Series linked to former series. k Refers to foreign citizens. l Arrivals of non-resident visitorsat national borders. m Excluding nationals residing abroad. n Data as at the end of December. o Devel-opment Assistance Committee member (OECD).
World Statistics Pocketbook 107

JordanRegion Western Asia Surface area (sq km) 89 318Population (proj., 000) 7 748 Pop. density (per sq km) 87.3Capital city Amman Capital city pop. (000) 1 155 a
Currency Jordanian Dinar (JOD) UN membership date 14 December 1955Economic indicators 2005 2010 2014GDP: Gross domestic product (million current US$) 12 589 26 425 35 827GDP growth rate (annual %, const. 2005 prices) 8.2 2.3 3.1GDP per capita (current US$) 2 360.5 4 054.3 4 831.0Economy: Agriculture (% of GVA) 3.0 3.2 3.6Economy: Industry (% of GVA) 26.9 29.2 28.2Economy: Services and other activity (% of GVA) 70.2 67.6 68.2Employment: Agriculture (% of employed) 3.4bc 2.0 1.8Employment: Industry (% of employed) 20.7bc 17.5 18.5Employment: Services and other (% of employed) 76.0bc 80.5 79.6Unemployment (% of labour force) d 14.8 12.5 11.9Labour force participation (female/male pop. %) d 12.3/67.6 15.4/67.6 14.1/64.3CPI: Consumer price index (2000=100) 113 149 177Agricultural production index (2004-2006=100) 98 129 137e
Food production index (2004-2006=100) 97 129 137e
Index of industrial production (2005=100) b 100 105 109Balance of payments, current account (million US$) –2 271 –1 882 –2 419Total trade Major trading partners 2015
(million US$) (% of exports) (% of imports)Exports 7 860.3 United States 18.4 Saudi Arabia 15.5Imports 20 043.0 Saudi Arabia 14.8 China 12.9Balance –12 182.7 Free zones 10.7f United States 6.2Social indicatorsPopulation growth rate (average annual %) 2010-2015 3.1Urban population (%) 2015 83.7Urban population growth rate (average annual %) 2010-2015 3.8Fertility rate, total (live births per woman) 2010-2015 3.5Life expectancy at birth (females/males, years) 2010-2015 75.5/72.2Total dependency ratio (Pop. aged 0-14 & 65+ per 100 pop. 15-64) 2015 65International migrant stock (000/% of total pop.) mid-2015 3 112.0/41.0gh
Tourist arrivals at national borders (000) 2014 3 990i
Refugees and others of concern to UNHCR mid-2015 684 795j
Infant mortality rate (per 1 000 live births) 2010-2015 17Health: Total expenditure (% of GDP) 2014 7.5kl
Education: Primary gross enrolment ratio (f/m per 100 pop.) 2014 88.2/89.3m
Education: Secondary gross enrolment ratio (f/m per 100 pop.) 2014 86.4/82.3m
Education: Tertiary gross enrolment ratio (f/m per 100 pop.) 2014 51.6/43.8m
Intentional homicide rate (per 100 000 pop.) 2014 2.3m
Seats held by women in national parliaments (%) 2016 12.0Environment and infrastructureMobile-cellular subscriptions (per 100 inhabitants) 2014 147.8Individuals using the Internet (%) 2014 44.0d
Patents: Resident filings (per million pop.) 2014 6.0Threatened species 2015 102Forested area (% of land area) 2013 1.1d
CO2 emission estimates (000 tons/tons per capita) 2013 24 807/3.5Energy production, primary (Petajoules) 2013 7Energy supply per capita (Gigajoules) 2013 45.0Terrestrial and marine areas protected (% of total area) 2014 2.1Population using improved drinking water sources (urban/rural, %) 2015 97.8/92.3Population using improved sanitation facilities (urban/rural, %) 2015 98.6/98.9Net Official Development Assistance received (% of GNI) 2014 7.6a Excluding Syrian refugees. b Data classified according to ISIC Rev. 3. c Break in the time series. dEstimate. e 2013. f See technical notes. g Including refugees. h Refers to foreign citizens. i Includingnationals residing abroad. j Includes 32,800 Iraqi refugees registered with UNHCR in Jordan. The Gov-ernment estimated the number of Iraqis at 400,000 individuals at the end of March 2015. This includedrefugees and other categories of Iraqis. k Data revision. l The public expenditure on health includescontributions from the United Nations Relief and Works Agency for Palestine Refugees in the Near East(UNRWA) made to Palestinian refugees residing in Jordanian territories. m 2012.
108 World Statistics Pocketbook

KazakhstanRegion Central Asia Surface area (sq km) 2 724 902Population (proj., 000) 17 855 Pop. density (per sq km) 6.6Capital city Astana Capital city pop. (000) 759Currency Tenge (KZT) UN membership date 2 March 1992Economic indicators 2005 2010 2014GDP: Gross domestic product (million current US$) 57 124 148 047 216 036GDP growth rate (annual %, const. 2005 prices) 9.7 7.3 4.3GDP per capita (current US$) 3 696.9 9 076.7 12 436.2Economy: Agriculture (% of GVA) 6.6 4.6a 4.5a
Economy: Industry (% of GVA) 39.2 41.8b 36.1b
Economy: Services and other activity (% of GVA) 54.2 53.6cd 59.4cd
Employment: Agriculture (% of employed) 32.4e 28.3f 24.2fgh
Employment: Industry (% of employed) 18.0e 18.7f 19.8fgh
Employment: Services and other (% of employed) 49.6e 53.0f 56.0fgh
Unemployment (% of labour force) i 8.1 5.8 5.1Labour force participation (female/male pop. %) i 64.4/75.2 65.5/75.8 65.8/76.5CPI: Consumer price index (2000=100) 140 ... ...Agricultural production index (2004-2006=100) 100 107 127h
Food production index (2004-2006=100) 100 108 126h
Balance of payments, current account (million US$) –1 036 1 386 4 643Total trade Major trading partners 2015
(million US$)j (% of exports)j (% of imports)j
Exports 79 458.7 Italy 20.2 Russian Federation 33.4Imports 41 295.5 China 12.3 China 17.8Balance 38 163.2 Netherlands 11.0 Germany 5.6Social indicatorsPopulation growth rate (average annual %) 2010-2015 1.6Urban population (%) 2015 53.2Urban population growth rate (average annual %) 2010-2015 0.9Fertility rate, total (live births per woman) 2010-2015 2.6Life expectancy at birth (females/males, years) 2010-2015 73.9/64.3Total dependency ratio (Pop. aged 0-14 & 65+ per 100 pop. 15-64) 2015 50International migrant stock (000/% of total pop.) mid-2015 3 546.8/20.1Tourist arrivals at national borders (000) 2014 4 560Refugees and others of concern to UNHCR mid-2015 7 849Infant mortality rate (per 1 000 live births) 2010-2015 14Health: Total expenditure (% of GDP) 2014 4.4Health: Physicians (per 1 000 pop.) 2013 3.6Education: Primary gross enrolment ratio (f/m per 100 pop.) 2014 111.3/111.4Education: Secondary gross enrolment ratio (f/m per 100 pop.) 2014 106.8/104.2Education: Tertiary gross enrolment ratio (f/m per 100 pop.) 2014 54.2/42.9Intentional homicide rate (per 100 000 pop.) 2014 7.4h
Seats held by women in national parliaments (%) 2016 26.2Environment and infrastructureMobile-cellular subscriptions (per 100 inhabitants) 2014 168.6Individuals using the Internet (%) 2014 54.9i
Patents: Resident filings (per million pop.) 2014 105.0Threatened species 2015 78Forested area (% of land area) 2013 1.2i
CO2 emission estimates (000 tons/tons per capita) 2013 262 902/15.4Energy production, primary (Petajoules) 2013 7 198Energy supply per capita (Gigajoules) 2013 208.0Terrestrial and marine areas protected (% of total area) 2014 3.3Population using improved drinking water sources (urban/rural, %) 2015 99.4/85.6Population using improved sanitation facilities (urban/rural, %) 2015 97.1/98.1Net Official Development Assistance disbursed (% of GNI) 2014 <Net Official Development Assistance received (% of GNI) 2014 0.1a Excludes irrigation canals and landscaping care. b Excludes publishing activities, includes irrigationcanals. c Excludes repair of personal and household goods. d Includes publishing activities and land-scaping care. e Data classified according to ISIC Rev. 3. f Break in the time series. g Excluding theinstitutional population. h 2013. i Estimate. j 2014.
World Statistics Pocketbook 109

KenyaRegion Eastern Africa Surface area (sq km) 591 958Population (proj., 000) 47 251 Pop. density (per sq km) 83.0Capital city Nairobi Capital city pop. (000) 3 915Currency Kenyan Shilling (KES) UN membership date 16 December 1963Economic indicators 2005 2010 2014GDP: Gross domestic product (million current US$) 21 506 40 000 60 936GDP growth rate (annual %, const. 2005 prices) 5.9 8.4 5.3GDP per capita (current US$) 608.4 991.9 1 358.3Economy: Agriculture (% of GVA) a 23.2 27.1 29.5Economy: Industry (% of GVA) b 22.3 20.3 18.8Economy: Services and other activity (% of GVA) cd 54.5 52.6 51.7Employment: Agriculture (% of employed) e 61.1 ... ...Employment: Industry (% of employed) e 6.7 ... ...Employment: Services and other (% of employed) e 32.2 ... ...Unemployment (% of labour force) f 9.5 9.2 9.2Labour force participation (female/male pop. %) f 59.9/69.8 61.0/71.4 61.9/72.0CPI: Consumer price index (2000=100) 149gh 134ijk 188k
Agricultural production index (2004-2006=100) 103 123 123l
Food production index (2004-2006=100) 103 124 123l
Balance of payments, current account (million US$) –252 –2 369 –6 339Total trade Major trading partners 2015
(million US$)l (% of exports)l (% of imports)l
Exports 5 537.0 Uganda 11.9 India 18.3Imports 16 394.5 United Kingdom 7.9 China 12.9Balance –10 857.5 United Rep. Tanzania 7.7 United Arab Emirates 8.3Social indicatorsPopulation growth rate (average annual %) 2010-2015 2.7Urban population (%) 2015 25.6Urban population growth rate (average annual %) 2010-2015 4.3Fertility rate, total (live births per woman) 2010-2015 4.4Life expectancy at birth (females/males, years) 2010-2015 62.2/59.1Total dependency ratio (Pop. aged 0-14 & 65+ per 100 pop. 15-64) 2015 81International migrant stock (000/% of total pop.) mid-2015 1 084.4/2.4m
Tourist arrivals at national borders (000) 2014 1 261Refugees and others of concern to UNHCR mid-2015 613 844Infant mortality rate (per 1 000 live births) 2010-2015 52Health: Total expenditure (% of GDP) 2014 5.7n
Health: Physicians (per 1 000 pop.) 2013 0.2Education: Primary gross enrolment ratio (f/m per 100 pop.) 2014 111.6/111.2Education: Secondary gross enrolment ratio (f/m per 100 pop.) 2014 65.2/70.1o
Intentional homicide rate (per 100 000 pop.) 2014 5.9Seats held by women in national parliaments (%) 2016 19.7Environment and infrastructureMobile-cellular subscriptions (per 100 inhabitants) 2014 73.8Individuals using the Internet (%) 2014 43.4f
Patents: Resident filings (per million pop.) 2014 3.0Threatened species 2015 463Forested area (% of land area) 2013 7.6f
CO2 emission estimates (000 tons/tons per capita) 2013 13 300/0.3Energy production, primary (Petajoules) 2013 719f
Energy supply per capita (Gigajoules) 2013 20.0f
Terrestrial and marine areas protected (% of total area) 2014 10.6Population using improved drinking water sources (urban/rural, %) 2015 81.7/56.8Population using improved sanitation facilities (urban/rural, %) 2015 31.2/29.7Net Official Development Assistance received (% of GNI) 2014 4.4a Excludes irrigation canals and landscaping care. b Excludes publishing activities, includes irrigationcanals. c Excludes repair of personal and household goods. d Includes publishing activities and land-scaping care. e Data classified according to ISIC Rev. 2. f Estimate. g Low income group. h Nairobi. iSeries linked to former series. j Break in the time series. k Index base: 2007=100. l 2013. m Includingrefugees. n In 2014, Kenya revalued its base year from 2002 to 2009, which increased its GDP by 25 percent in 2013. o 2012.
110 World Statistics Pocketbook

KiribatiRegion Oceania-Micronesia Surface area (sq km) 726 a
Population (proj., 000) 114 Pop. density (per sq km) 141.2Capital city Bairiki Capital city pop. (000) 4 b
Currency Australian Dollar (AUD) UN membership date 14 September 1999Economic indicators 2005 2010 2014GDP: Gross domestic product (million current US$) 112 156 180GDP growth rate (annual %, const. 2005 prices) 5.0 –0.9 3.7GDP per capita (current US$) 1 214.5 1 515.4 1 631.9Economy: Agriculture (% of GVA) 21.8 24.3 25.2Economy: Industry (% of GVA) 9.3 10.2 10.9Economy: Services and other activity (% of GVA) 68.9 65.6 63.9Employment: Agriculture (% of employed) 7.1c 22.1 ...Employment: Industry (% of employed) 8.4c 16.1 ...Employment: Services and other (% of employed) 81.1c 61.8 ...Unemployment (% of labour force) d 14.7 30.6 ...Labour force participation (female/male pop. %) 20.4/32.8ef 52.3/66.8f ...CPI: Consumer price index (2000=100) 110g ... ...Agricultural production index (2004-2006=100) 95 118 121h
Food production index (2004-2006=100) 95 118 121h
Balance of payments, current account (million US$) ... –3 45Total trade Major trading partners 2015
(million US$)h (% of exports)h (% of imports)h
Exports 6.7 Morocco 23.9 Australia 26.8Imports 97.1 Marshall Islands 13.4 Singapore 21.1Balance –90.4 Fiji 11.9 Fiji 14.9Social indicatorsPopulation growth rate (average annual %) 2010-2015 1.8Urban population (%) 2015 44.3Urban population growth rate (average annual %) 2010-2015 1.8Fertility rate, total (live births per woman) 2010-2015 3.8Life expectancy at birth (females/males, years) 2010-2015 68.9/62.6Total dependency ratio (Pop. aged 0-14 & 65+ per 100 pop. 15-64) 2015 63International migrant stock (000/% of total pop.) mid-2015 3.2/2.8Tourist arrivals at national borders (000) 2014 6hi
Infant mortality rate (per 1 000 live births) 2010-2015 47Health: Total expenditure (% of GDP) 2014 10.2Education: Primary gross enrolment ratio (f/m per 100 pop.) 2014 115.2/111.2Intentional homicide rate (per 100 000 pop.) 2014 7.5j
Seats held by women in national parliaments (%) 2016 6.5Environment and infrastructureMobile-cellular subscriptions (per 100 inhabitants) 2014 17.4k
Individuals using the Internet (%) 2014 12.3k
Patents: Resident filings (per million pop.) 2014 176.0h
Threatened species 2015 100Forested area (% of land area) 2013 15.0k
CO2 emission estimates (000 tons/tons per capita) 2013 62/0.6Energy production, primary (Petajoules) 2013 0Energy supply per capita (Gigajoules) 2013 8.0k
Terrestrial and marine areas protected (% of total area) 2014 11.8Population using improved drinking water sources (urban/rural, %) 2015 87.4/50.6Population using improved sanitation facilities (urban/rural, %) 2015 51.2/30.6Net Official Development Assistance received (% of GNI) 2014 35.2a Land area only. Excluding 84 square km of uninhabited islands. b 2010. c Data classified according toISIC Rev. 2. d De facto population. e Break in the time series. f Persons present (de facto). g Tarawa. h2013. i Air arrivals. Tarawa and Christmas Island. j 2012. k Estimate.
World Statistics Pocketbook 111

KuwaitRegion Western Asia Surface area (sq km) 17 818Population (proj., 000) 4 007 Pop. density (per sq km) 224.9Capital city Kuwait City Capital city pop. (000) 2 779Currency Kuwaiti Dinar (KWD) UN membership date 14 May 1963Economic indicators 2005 2010 2014GDP: Gross domestic product (million current US$) 80 798 115 416 163 637GDP growth rate (annual %, const. 2005 prices) 10.6 –2.4 –1.6GDP per capita (current US$) 35 694.4 37 724.2 43 600.4Economy: Agriculture (% of GVA) 0.3 0.4 0.4Economy: Industry (% of GVA) 60.2 58.2 61.9Economy: Services and other activity (% of GVA) 39.5 41.4 37.7Employment: Agriculture (% of employed) 2.7ab 2.5c 1.2b
Employment: Industry (% of employed) 20.6ab 25.1c 40.2b
Employment: Services and other (% of employed) 76.1ab 72.3c 58.6b
Unemployment (% of labour force) d 2.0 1.8 3.5Labour force participation (female/male pop. %) d 45.0/81.9 46.9/83.8 48.3/84.1CPI: Consumer price index (2000=100) 109 141 157Agricultural production index (2004-2006=100) 97 134 171e
Food production index (2004-2006=100) 97 135 172e
Index of industrial production (2005=100) a 100 89 115e
Balance of payments, current account (million US$) 30 071 36 989 53 968Total trade Major trading partners 2015
(million US$) (% of exports) (% of imports)Exports 55 161.6 ... China 16.0Imports 31 907.2 ... United States 9.4Balance 23 254.4 ... United Arab Emirates 9.3Social indicatorsPopulation growth rate (average annual %) 2010-2015 4.8Urban population (%) 2015 98.3Urban population growth rate (average annual %) 2010-2015 3.6Fertility rate, total (live births per woman) 2010-2015 2.2Life expectancy at birth (females/males, years) 2010-2015 75.6/73.3Total dependency ratio (Pop. aged 0-14 & 65+ per 100 pop. 15-64) 2015 32International migrant stock (000/% of total pop.) mid-2015 2 866.1/73.6fg
Tourist arrivals at national borders (000) h 2014 6 528Refugees and others of concern to UNHCR mid-2015 94 633Infant mortality rate (per 1 000 live births) 2010-2015 9Health: Total expenditure (% of GDP) 2014 3.0Education: Primary gross enrolment ratio (f/m per 100 pop.) 2014 103.0/102.4Education: Secondary gross enrolment ratio (f/m per 100 pop.) 2014 98.9/88.9d
Education: Tertiary gross enrolment ratio (f/m per 100 pop.) 2014 33.1/20.4e
Intentional homicide rate (per 100 000 pop.) 2014 1.8i
Seats held by women in national parliaments (%) 2016 1.5Environment and infrastructureMobile-cellular subscriptions (per 100 inhabitants) 2014 218.4Individuals using the Internet (%) 2014 78.7d
Threatened species 2015 42Forested area (% of land area) 2013 0.4d
CO2 emission estimates (000 tons/tons per capita) 2013 97 960/27.3Energy production, primary (Petajoules) 2013 7 113j
Energy supply per capita (Gigajoules) 2013 410.0j
Terrestrial and marine areas protected (% of total area) 2014 11.0Population using improved drinking water sources (urban/rural, %) 2015 99.0/99.0Population using improved sanitation facilities (urban/rural, %) 2015 100.0/100.0a Data classified according to ISIC Rev. 3. b Break in the time series. c 2008. d Estimate. e 2013. f Includingrefugees. g Refers to foreign citizens. h Arrivals of non-resident visitors at national borders. i 2012. j Thedata for crude oil production include 50 per cent of the output of the Neutral Zone.
112 World Statistics Pocketbook

KyrgyzstanRegion Central Asia Surface area (sq km) 199 949Population (proj., 000) 6 034 Pop. density (per sq km) 31.5Capital city Bishkek Capital city pop. (000) 865Currency Som (KGS) UN membership date 2 March 1992Economic indicators 2005 2010 2014GDP: Gross domestic product (million current US$) 2 460 4 794 7 404GDP growth rate (annual %, const. 2005 prices) –0.2 –0.5 3.6GDP per capita (current US$) 480.9 877.4 1 267.1Economy: Agriculture (% of GVA) a 31.3 18.8 16.6Economy: Industry (% of GVA) b 22.1 28.2 25.8Economy: Services and other activity (% of GVA) cd 46.6 53.0 57.6Employment: Agriculture (% of employed) 38.5e 34.0ef 31.7gh
Employment: Industry (% of employed) 17.6e 20.6ef 20.2gh
Employment: Services and other (% of employed) 43.9e 45.3ef 48.1gh
Unemployment (% of labour force) i 8.1 8.6 8.2Labour force participation (female/male pop. %) i 54.1/76.1 52.2/76.6 49.2/76.8CPI: Consumer price index (2000=100) 122 ... ...Agricultural production index (2004-2006=100) 98 105 112h
Food production index (2004-2006=100) 98 107 114h
Index of industrial production (2005=100) e 100 69 ...Balance of payments, current account (million US$) –62 –317 –1 788Total trade Major trading partners 2015
(million US$) (% of exports) (% of imports)Exports 1 441.5 Switzerland 39.0 Russian Federation 31.3Imports 4 068.1 Kazakhstan 15.8 China 25.3Balance –2 626.6 Russian Federation 10.9 Kazakhstan 16.7Social indicatorsPopulation growth rate (average annual %) 2010-2015 1.7Urban population (%) 2015 35.7Urban population growth rate (average annual %) 2010-2015 1.6Fertility rate, total (live births per woman) 2010-2015 3.1Life expectancy at birth (females/males, years) 2010-2015 74.3/66.4Total dependency ratio (Pop. aged 0-14 & 65+ per 100 pop. 15-64) 2015 55International migrant stock (000/% of total pop.) mid-2015 204.4/3.4Tourist arrivals at national borders (000) j 2014 2 849Refugees and others of concern to UNHCR mid-2015 14 279Infant mortality rate (per 1 000 live births) 2010-2015 20Health: Total expenditure (% of GDP) 2014 6.5Health: Physicians (per 1 000 pop.) 2013 2.0Education: Government expenditure (% of GDP) 2014 6.8h
Education: Primary gross enrolment ratio (f/m per 100 pop.) 2014 107.0/108.3Education: Secondary gross enrolment ratio (f/m per 100 pop.) 2014 91.2/90.4Education: Tertiary gross enrolment ratio (f/m per 100 pop.) 2014 52.1/39.9Intentional homicide rate (per 100 000 pop.) 2014 3.7Seats held by women in national parliaments (%) 2016 19.2Environment and infrastructureMobile-cellular subscriptions (per 100 inhabitants) 2014 134.5Individuals using the Internet (%) 2014 28.3i
Patents: Resident filings (per million pop.) 2014 23.0Threatened species 2015 41Forested area (% of land area) 2013 3.4i
CO2 emission estimates (000 tons/tons per capita) 2013 9 842/1.7Energy production, primary (Petajoules) 2013 74Energy supply per capita (Gigajoules) 2013 29.0Terrestrial and marine areas protected (% of total area) 2014 6.9Population using improved drinking water sources (urban/rural, %) 2015 96.7/86.2Population using improved sanitation facilities (urban/rural, %) 2015 89.2/95.6Net Official Development Assistance received (% of GNI) 2014 8.7a Excludes irrigation canals and landscaping care. b Excludes publishing activities, includes irrigationcanals. c Excludes repair of personal and household goods. d Includes publishing activities and land-scaping care. e Data classified according to ISIC Rev. 3. f 2008. g Break in the time series. h 2013. iEstimate. j Arrivals of non-resident visitors at national borders.
World Statistics Pocketbook 113

Lao People's Democratic RepublicRegion South-Eastern Asia Surface area (sq km) 236 800Population (proj., 000) 6 918 Pop. density (per sq km) 30.0Capital city Vientiane Capital city pop. (000) 997Currency Kip (LAK) UN membership date 14 December 1955Economic indicators 2005 2010 2014GDP: Gross domestic product (million current US$) 2 717 6 744 11 749GDP growth rate (annual %, const. 2005 prices) 6.8 8.1 7.6GDP per capita (current US$) 472.9 1 077.2 1 756.4Economy: Agriculture (% of GVA) 36.3 29.7 23.9Economy: Industry (% of GVA) 23.2 28.9 33.5Economy: Services and other activity (% of GVA) 40.5 41.4 42.5Employment: Agriculture (% of employed) ... 71.3 ...Employment: Industry (% of employed) ... 8.3 ...Employment: Services and other (% of employed) ... 20.2 ...Unemployment (% of labour force) a 1.4 1.5 1.5Labour force participation (female/male pop. %) a 78.9/78.8 77.9/77.0 77.7/76.7CPI: Consumer price index (2000=100) 163b 208 258Agricultural production index (2004-2006=100) 100 130 156c
Food production index (2004-2006=100) 100 128 153c
Balance of payments, current account (million US$) –174 29 –376c
Social indicatorsPopulation growth rate (average annual %) 2010-2015 1.7Urban population (%) 2015 38.6Urban population growth rate (average annual %) 2010-2015 4.9Fertility rate, total (live births per woman) 2010-2015 3.1Life expectancy at birth (females/males, years) 2010-2015 66.8/64.1Total dependency ratio (Pop. aged 0-14 & 65+ per 100 pop. 15-64) 2015 63International migrant stock (000/% of total pop.) mid-2015 22.2/0.3de
Tourist arrivals at national borders (000) 2014 3 164Infant mortality rate (per 1 000 live births) 2010-2015 47Health: Total expenditure (% of GDP) 2014 1.9Health: Physicians (per 1 000 pop.) 2013 0.2f
Education: Government expenditure (% of GDP) 2014 4.2Education: Primary gross enrolment ratio (f/m per 100 pop.) 2014 113.5/119.1Education: Secondary gross enrolment ratio (f/m per 100 pop.) 2014 54.6/59.8Education: Tertiary gross enrolment ratio (f/m per 100 pop.) 2014 16.7/17.9Intentional homicide rate (per 100 000 pop.) 2014 7.3f
Seats held by women in national parliaments (%) 2016 25.0Environment and infrastructureMobile-cellular subscriptions (per 100 inhabitants) 2014 67.0Individuals using the Internet (%) 2014 14.3a
Threatened species 2015 210Forested area (% of land area) 2013 79.7a
CO2 emission estimates (000 tons/tons per capita) 2013 2 175/0.3Energy production, primary (Petajoules) 2013 85Energy supply per capita (Gigajoules) 2013 13.0Terrestrial and marine areas protected (% of total area) 2014 16.7Population using improved drinking water sources (urban/rural, %) 2015 85.7/69.4Population using improved sanitation facilities (urban/rural, %) 2015 94.5/56.0Net Official Development Assistance received (% of GNI) 2014 4.2a Estimate. b Series linked to former series. c 2013. d Including refugees. e Refers to foreign citizens. f2012.
114 World Statistics Pocketbook

LatviaRegion Northern Europe Surface area (sq km) 64 573Population (proj., 000) 1 956 Pop. density (per sq km) 31.4Capital city Riga Capital city pop. (000) 621Currency Euro (EUR) UN membership date 17 September 1991Economic indicators 2005 2010 2014GDP: Gross domestic product (million current US$) 16 903 23 743 31 286GDP growth rate (annual %, const. 2005 prices) 10.7 –3.8 2.4GDP per capita (current US$) 7 588.1 11 357.7 15 726.5Economy: Agriculture (% of GVA) a 4.3 4.4 3.3Economy: Industry (% of GVA) b 22.9 23.8 23.4Economy: Services and other activity (% of GVA) cd 72.8 71.8 73.4Employment: Agriculture (% of employed) 11.6ef 8.3 7.3Employment: Industry (% of employed) 26.7ef 23.4 24.1Employment: Services and other (% of employed) 61.4ef 68.3 68.6Unemployment (% of labour force) g 10.0 19.5 10.8Labour force participation (female/male pop. %) g 50.9/66.3 53.8/65.4 54.2/67.5CPI: Consumer price index (2000=100) 122 169 181Agricultural production index (2004-2006=100) 105 109 117h
Food production index (2004-2006=100) 105 109 118h
Index of industrial production (2005=100) i 100 98 111Balance of payments, current account (million US$) –1 988 563 –629Total trade Major trading partners 2015
(million US$) (% of exports) (% of imports)Exports 11 500.4 Lithuania 19.0 Lithuania 17.5Imports 13 846.1 Estonia 11.7 Germany 11.4Balance –2 345.7 Russian Federation 8.0 Poland 11.1Social indicatorsPopulation growth rate (average annual %) 2010-2015 –1.2Urban population (%) 2015 67.4Urban population growth rate (average annual %) 2010-2015 –0.7Fertility rate, total (live births per woman) 2010-2015 1.5Life expectancy at birth (females/males, years) 2010-2015 78.7/68.9Total dependency ratio (Pop. aged 0-14 & 65+ per 100 pop. 15-64) 2015 52International migrant stock (000/% of total pop.) mid-2015 263.1/13.4Tourist arrivals at national borders (000) 2014 1 843j
Refugees and others of concern to UNHCR mid-2015 263 168k
Infant mortality rate (per 1 000 live births) 2010-2015 6Health: Total expenditure (% of GDP) 2014 5.9Health: Physicians (per 1 000 pop.) 2013 3.6l
Education: Government expenditure (% of GDP) 2014 4.9h
Education: Primary gross enrolment ratio (f/m per 100 pop.) 2014 100.0/100.8Education: Secondary gross enrolment ratio (f/m per 100 pop.) 2014 114.0/116.6Education: Tertiary gross enrolment ratio (f/m per 100 pop.) 2014 79.2/55.5Intentional homicide rate (per 100 000 pop.) 2014 3.9Seats held by women in national parliaments (%) 2016 18.0Environment and infrastructureMobile-cellular subscriptions (per 100 inhabitants) 2014 124.2Individuals using the Internet (%) 2014 75.8m
Patents: Resident filings (per million pop.) 2014 56.0Threatened species 2015 25Forested area (% of land area) 2013 54.0g
CO2 emission estimates (000 tons/tons per capita) 2013 7 081/3.5Energy production, primary (Petajoules) 2013 90Energy supply per capita (Gigajoules) 2013 91.0Terrestrial and marine areas protected (% of total area) 2014 17.8Population using improved drinking water sources (urban/rural, %) 2015 99.8/98.3Population using improved sanitation facilities (urban/rural, %) 2015 90.8/81.5Net Official Development Assistance disbursed (% of GNI) 2014 0.1a Excludes irrigation canals and landscaping care. b Excludes publishing activities, includes irrigationcanals. c Excludes repair of personal and household goods. d Includes publishing activities and land-scaping care. e Data classified according to ISIC Rev. 3. f Break in the time series. g Estimate. h 2013. iExcluding water and waste management. j Non-resident departures. Survey of persons crossing the stateborder. k The figure of stateless persons includes persons covered by two separate Laws; Law on StatelessPersons dated 17 February 2004 and the Law on the Status of Those Former USSR Citizens who are notCitizens of Latvia or of Any Other State. l 2012. m Population age 16-74.
World Statistics Pocketbook 115

LebanonRegion Western Asia Surface area (sq km) 10 452Population (proj., 000) 5 988 Pop. density (per sq km) 585.4Capital city Beirut Capital city pop. (000) 2 226 a
Currency Lebanese Pound (LBP) UN membership date 24 October 1945Economic indicators 2005 2010 2014GDP: Gross domestic product (million current US$) 21 490 38 420 49 631GDP growth rate (annual %, const. 2005 prices) 2.8 8.0 2.0GDP per capita (current US$) 5 390.2 8 858.3 8 843.6Economy: Agriculture (% of GVA) 4.0b 4.3b 3.2Economy: Industry (% of GVA) c 16.7 15.7 23.6Economy: Services and other activity (% of GVA) de 79.3 80.1 73.2Unemployment (% of labour force) f 8.2 6.2 6.7Labour force participation (female/male pop. %) f 20.3/70.6 22.0/70.0 23.2/70.2CPI: Consumer price index (2000=100) 105g 105hi 126ij
Agricultural production index (2004-2006=100) 97 95 97k
Food production index (2004-2006=100) 97 94 97k
Balance of payments, current account (million US$) –2 748 –7 552 –12 207Total trade Major trading partners 2015
(million US$)l (% of exports)l (% of imports)l
Exports 3 312.2 Saudi Arabia 11.4 China 12.1Imports 20 487.4 United Arab Emirates 9.7 Italy 8.0Balance –17 175.2 South Africa 9.0 France 6.2Social indicatorsPopulation growth rate (average annual %) 2010-2015 6.0Urban population (%) 2015 87.8Urban population growth rate (average annual %) 2010-2015 3.2Fertility rate, total (live births per woman) 2010-2015 1.7Life expectancy at birth (females/males, years) 2010-2015 80.9/77.1Total dependency ratio (Pop. aged 0-14 & 65+ per 100 pop. 15-64) 2015 47International migrant stock (000/% of total pop.) mid-2015 1 997.8/34.2m
Tourist arrivals at national borders (000) 2014 1 355n
Refugees and others of concern to UNHCR mid-2015 1 189 052Infant mortality rate (per 1 000 live births) 2010-2015 9Health: Total expenditure (% of GDP) 2014 6.4Health: Physicians (per 1 000 pop.) 2013 3.2o
Education: Government expenditure (% of GDP) 2014 2.6k
Education: Primary gross enrolment ratio (f/m per 100 pop.) 2014 92.8/101.7k
Education: Secondary gross enrolment ratio (f/m per 100 pop.) 2014 68.4/68.0k
Education: Tertiary gross enrolment ratio (f/m per 100 pop.) 2014 45.8/39.5Intentional homicide rate (per 100 000 pop.) 2014 4.3Seats held by women in national parliaments (%) 2016 3.1Environment and infrastructureMobile-cellular subscriptions (per 100 inhabitants) 2014 88.4Individuals using the Internet (%) 2014 74.7f
Threatened species 2015 69Forested area (% of land area) 2013 13.4f
CO2 emission estimates (000 tons/tons per capita) 2013 22 581/4.3Energy production, primary (Petajoules) 2013 10Energy supply per capita (Gigajoules) 2013 55.0Terrestrial and marine areas protected (% of total area) 2014 0.9Population using improved drinking water sources (urban/rural, %) 2015 99.0/99.0Population using improved sanitation facilities (urban/rural, %) 2015 80.7/80.7Net Official Development Assistance received (% of GNI) 2014 1.8a Excluding Syrian refugees. b Excludes irrigation canals and landscaping care. c Excludes publishingactivities, includes irrigation canals. d Excludes repair of personal and household goods. e Includespublishing activities and landscaping care. f Estimate. g Beirut. h Break in the time series. i Index base:2008=100. j Series linked to former series. k 2013. l 2014. m Including refugees. n Excluding nationalsresiding abroad, Syrian nationals and Palestinians. o 2011.
116 World Statistics Pocketbook

LesothoRegion Southern Africa Surface area (sq km) 30 355Population (proj., 000) 2 160 Pop. density (per sq km) 71.2Capital city Maseru Capital city pop. (000) 267 a
Currency Loti (LSL) UN membership date 17 October 1966Economic indicators 2005 2010 2014GDP: Gross domestic product (million current US$) 1 368 2 187 2 081GDP growth rate (annual %, const. 2005 prices) 2.7 7.9 3.5GDP per capita (current US$) 710.5 1 088.0 986.4Economy: Agriculture (% of GVA) 9.0 8.3 8.0Economy: Industry (% of GVA) 32.9 31.2 31.2Economy: Services and other activity (% of GVA) 58.2 60.5 60.8Employment: Agriculture (% of employed) bc ... 12.1d ...Employment: Industry (% of employed) c ... 41.7d ...Employment: Services and other (% of employed) bc ... 45.5d ...Unemployment (% of labour force) e 36.1 25.6 26.4Labour force participation (female/male pop. %) e 61.8/75.6 58.6/73.2 59.1/73.6CPI: Consumer price index (2000=100) 140 198f 244Agricultural production index (2004-2006=100) 102 110 111g
Food production index (2004-2006=100) 102 111 112g
Balance of payments, current account (million US$) 166 –158 –228Total trade Major trading partners 2015
(million US$)h (% of exports)h (% of imports)h
Exports 678.2 South Africa 47.3 South Africa 88.9Imports 1 594.2 United States 43.9 Asia nes 4.7i
Balance –916.0 Belgium 3.2 China 2.8Social indicatorsPopulation growth rate (average annual %) 2010-2015 1.2Urban population (%) 2015 27.3Urban population growth rate (average annual %) 2010-2015 3.1Fertility rate, total (live births per woman) 2010-2015 3.3Life expectancy at birth (females/males, years) 2010-2015 49.6/49.2Total dependency ratio (Pop. aged 0-14 & 65+ per 100 pop. 15-64) 2015 67International migrant stock (000/% of total pop.) mid-2015 6.6/0.3jk
Tourist arrivals at national borders (000) 2014 320g
Refugees and others of concern to UNHCR mid-2015 45Infant mortality rate (per 1 000 live births) 2010-2015 60Health: Total expenditure (% of GDP) 2014 10.6Education: Primary gross enrolment ratio (f/m per 100 pop.) 2014 105.9/108.3Education: Secondary gross enrolment ratio (f/m per 100 pop.) 2014 60.4/44.1Education: Tertiary gross enrolment ratio (f/m per 100 pop.) 2014 11.7/8.0Seats held by women in national parliaments (%) 2016 25.0Environment and infrastructureMobile-cellular subscriptions (per 100 inhabitants) 2014 101.9Individuals using the Internet (%) 2014 11.0e
Threatened species 2015 17Forested area (% of land area) 2013 1.6e
CO2 emission estimates (000 tons/tons per capita) 2013 2 296/1.1Energy production, primary (Petajoules) 2013 21Energy supply per capita (Gigajoules) 2013 23.0e
Terrestrial and marine areas protected (% of total area) 2014 0.5Population using improved drinking water sources (urban/rural, %) 2015 94.6/77.0Population using improved sanitation facilities (urban/rural, %) 2015 37.3/27.6Net Official Development Assistance received (% of GNI) 2014 4.0a 2014. b Data classified according to ISIC Rev. 3. c Persons aged 10 years and over. d 2008. e Estimate.f Series linked to former series. g 2013. h 2012. i See technical notes. j Including refugees. k Refers toforeign citizens.
World Statistics Pocketbook 117

LiberiaRegion Western Africa Surface area (sq km) 111 369Population (proj., 000) 4 615 Pop. density (per sq km) 47.9Capital city Monrovia Capital city pop. (000) 1 264Currency Liberian Dollar (LRD) UN membership date 2 November 1945Economic indicators 2005 2010 2014GDP: Gross domestic product (million current US$) 608 1 074 2 122GDP growth rate (annual %, const. 2005 prices) 9.5 10.8 6.8GDP per capita (current US$) 185.9 271.4 482.7Economy: Agriculture (% of GVA) 68.8 70.0 70.1Economy: Industry (% of GVA) 9.8 11.3 11.3Economy: Services and other activity (% of GVA) 21.5 18.7 18.6Employment: Agriculture (% of employed) ... 46.5 ...Employment: Industry (% of employed) ... 10.4 ...Employment: Services and other (% of employed) ... 41.2 ...Unemployment (% of labour force) a 4.9 3.7 4.0Labour force participation (female/male pop. %) a 58.5/62.9 58.1/64.3 58.0/63.8Agricultural production index (2004-2006=100) 105 100 101b
Food production index (2004-2006=100) 104 120 121b
Balance of payments, current account (million US$) –208 –737 –1 217Social indicatorsPopulation growth rate (average annual %) 2010-2015 2.6Urban population (%) 2015 49.7Urban population growth rate (average annual %) 2010-2015 3.4Fertility rate, total (live births per woman) 2010-2015 4.8Life expectancy at birth (females/males, years) 2010-2015 61.2/59.3Total dependency ratio (Pop. aged 0-14 & 65+ per 100 pop. 15-64) 2015 83International migrant stock (000/% of total pop.) mid-2015 113.8/2.5Refugees and others of concern to UNHCR mid-2015 40 408Infant mortality rate (per 1 000 live births) 2010-2015 61Health: Total expenditure (% of GDP) 2014 10.0Education: Government expenditure (% of GDP) 2014 2.8c
Education: Primary gross enrolment ratio (f/m per 100 pop.) 2014 91.6/99.6Education: Secondary gross enrolment ratio (f/m per 100 pop.) 2014 33.1/42.5Education: Tertiary gross enrolment ratio (f/m per 100 pop.) 2014 9.0/14.2c
Intentional homicide rate (per 100 000 pop.) 2014 3.2c
Seats held by women in national parliaments (%) 2016 11.0Environment and infrastructureMobile-cellular subscriptions (per 100 inhabitants) 2014 73.4Individuals using the Internet (%) 2014 5.4a
Threatened species 2015 158Forested area (% of land area) 2013 44.0a
CO2 emission estimates (000 tons/tons per capita) 2013 957/0.2Energy production, primary (Petajoules) 2013 71Energy supply per capita (Gigajoules) 2013 19.0Terrestrial and marine areas protected (% of total area) 2014 0.8Population using improved drinking water sources (urban/rural, %) 2015 88.7/62.6Population using improved sanitation facilities (urban/rural, %) 2015 28.0/5.9Net Official Development Assistance received (% of GNI) 2014 43.9a Estimate. b 2013. c 2012.
118 World Statistics Pocketbook

LibyaRegion Northern Africa Surface area (sq km) 1 676 198Population (proj., 000) 6 330 Pop. density (per sq km) 3.6Capital city Tripoli Capital city pop. (000) 1 126Currency Libyan Dinar (LYD) UN membership date 14 December 1955Economic indicators 2005 2010 2014GDP: Gross domestic product (million current US$) 45 451 80 942 41 319GDP growth rate (annual %, const. 2005 prices) 10.3 4.3 –24.0GDP per capita (current US$) 7 834.4 12 918.3 6 601.6Economy: Agriculture (% of GVA) 2.2 2.5 2.0Economy: Industry (% of GVA) 75.7 74.0 59.6Economy: Services and other activity (% of GVA) 22.2 23.5 38.4Unemployment (% of labour force) a 20.5 19.7 20.6Labour force participation (female/male pop. %) a 28.7/75.9 29.8/77.7 27.9/79.0Agricultural production index (2004-2006=100) 101 110 111b
Food production index (2004-2006=100) 101 110 111b
Balance of payments, current account (million US$) 14 945 16 801 –108b
Social indicatorsPopulation growth rate (average annual %) 2010-2015 <Urban population (%) 2015 78.6Urban population growth rate (average annual %) 2010-2015 1.1Fertility rate, total (live births per woman) 2010-2015 2.5Life expectancy at birth (females/males, years) 2010-2015 74.4/68.8Total dependency ratio (Pop. aged 0-14 & 65+ per 100 pop. 15-64) 2015 52International migrant stock (000/% of total pop.) mid-2015 771.2/12.3c
Refugees and others of concern to UNHCR mid-2015 471 721Infant mortality rate (per 1 000 live births) 2010-2015 24Health: Total expenditure (% of GDP) 2014 5.0d
Intentional homicide rate (per 100 000 pop.) 2014 2.5e
Seats held by women in national parliaments (%) 2016 16.0Environment and infrastructureMobile-cellular subscriptions (per 100 inhabitants) 2014 161.1a
Individuals using the Internet (%) 2014 17.8a
Threatened species 2015 54Forested area (% of land area) 2013 0.1a
CO2 emission estimates (000 tons/tons per capita) 2013 51 041/8.1Energy production, primary (Petajoules) 2013 2 554Energy supply per capita (Gigajoules) 2013 113.0Terrestrial and marine areas protected (% of total area) 2014 0.3Population using improved sanitation facilities (urban/rural, %) 2015 96.8/95.7Net Official Development Assistance received (% of GNI) 2014 0.5a Estimate. b 2013. c Refers to foreign citizens. d Estimates should be viewed with caution as these arederived from scarce data. e 2012.
World Statistics Pocketbook 119

LiechtensteinRegion Western Europe Surface area (sq km) 160Population (proj., 000) 38 Pop. density (per sq km) 236.1Capital city Vaduz Capital city pop. (000) 5 a
Currency Swiss Franc (CHF) UN membership date 18 September 1990Economic indicators 2005 2010 2014GDP: Gross domestic product (million current US$) 3 658 5 082 5 855GDP growth rate (annual %, const. 2005 prices) 4.8 7.4 1.2GDP per capita (current US$) 104 968.3 140 102.0 157 040.0Economy: Agriculture (% of GVA) b 0.9 0.8 0.8Economy: Industry (% of GVA) c 38.6 39.0 38.1Economy: Services and other activity (% of GVA) de 60.5 60.2 61.1Unemployment (% of labour force) f ... 2.6 2.6g
Labour force participation (female/male pop. %) 52.8/73.7 52.6/70.9 53.5/70.6g
Agricultural production index (2004-2006=100) 100 100 100g
Food production index (2004-2006=100) 100 100 100g
Social indicatorsPopulation growth rate (average annual %) 2010-2015 0.7Urban population (%) 2015 14.3Urban population growth rate (average annual %) 2010-2015 0.5Fertility rate, total (live births per woman) 2010-2015 1.5h
Total dependency ratio (Pop. aged 0-14 & 65+ per 100 pop. 15-64) 2015 44g
International migrant stock (000/% of total pop.) mid-2015 23.5/62.6Tourist arrivals at national borders (000) i 2014 61j
Refugees and others of concern to UNHCR mid-2015 184Education: Government expenditure (% of GDP) 2014 2.6k
Education: Primary gross enrolment ratio (f/m per 100 pop.) 2014 102.3/103.1l
Education: Secondary gross enrolment ratio (f/m per 100 pop.) 2014 103.3/127.9l
Education: Tertiary gross enrolment ratio (f/m per 100 pop.) 2014 24.1/50.8l
Intentional homicide rate (per 100 000 pop.) 2014 2.7Seats held by women in national parliaments (%) 2016 20.0Environment and infrastructureMobile-cellular subscriptions (per 100 inhabitants) 2014 104.3l
Individuals using the Internet (%) 2014 95.2l
Patents: Resident filings (per million pop.) 2014 7 473.0Threatened species 2015 4Forested area (% of land area) 2013 43.1l
CO2 emission estimates (000 tons/tons per capita) 2013 51/1.4Energy production, primary (Petajoules) 2013 1Energy supply per capita (Gigajoules) 2013 79.0Terrestrial and marine areas protected (% of total area) 2014 44.3Net Official Development Assistance disbursed (% of GNI) 2014 0.7g
a 2014. b Excludes irrigation canals and landscaping care. c Excludes publishing activities, includesirrigation canals. d Excludes repair of personal and household goods. e Includes publishing activities andlandscaping care. f Persons aged 15 to 64 years. g 2013. h 2012. i Arrivals of non-resident tourists in alltypes of tourism accommodation establishments. j Excluding long term tourists on campgrounds and inholiday flats. k 2011. l Estimate.
120 World Statistics Pocketbook

LithuaniaRegion Northern Europe Surface area (sq km) 65 300Population (proj., 000) 2 850 Pop. density (per sq km) 45.5Capital city Vilnius Capital city pop. (000) 517Currency Euro (EUR) UN membership date 17 September 1991Economic indicators 2005 2010 2014GDP: Gross domestic product (million current US$) 26 141 37 130 48 392GDP growth rate (annual %, const. 2005 prices) 7.7 1.6 3.0GDP per capita (current US$) 7 819.1 11 889.9 16 590.9Economy: Agriculture (% of GVA) a 4.8 3.3 3.4Economy: Industry (% of GVA) b 32.7 29.1 30.5Economy: Services and other activity (% of GVA) cd 62.5 67.6 66.0Employment: Agriculture (% of employed) 14.2ef 8.7 9.0Employment: Industry (% of employed) 29.1ef 24.5 24.8Employment: Services and other (% of employed) 56.1ef 66.4 65.8Unemployment (% of labour force) g 8.3 17.8 10.7Labour force participation (female/male pop. %) g 50.5/62.7 52.6/62.1 54.1/65.3CPI: Consumer price index (2000=100) 104h 134 146Agricultural production index (2004-2006=100) 106 99 118i
Food production index (2004-2006=100) 106 99 118i
Index of industrial production (2005=100) 100 103 117Balance of payments, current account (million US$) –1 878 –119 1 685Total trade Major trading partners 2015
(million US$) (% of exports) (% of imports)Exports 25 499.0 Russian Federation 13.6 Russian Federation 16.9Imports 28 172.8 Latvia 9.8 Germany 11.5Balance –2 673.8 Poland 9.7 Poland 10.3Social indicatorsPopulation growth rate (average annual %) 2010-2015 –1.6Urban population (%) 2015 66.5Urban population growth rate (average annual %) 2010-2015 –0.5Fertility rate, total (live births per woman) 2010-2015 1.6Life expectancy at birth (females/males, years) 2010-2015 78.8/67.4Total dependency ratio (Pop. aged 0-14 & 65+ per 100 pop. 15-64) 2015 50International migrant stock (000/% of total pop.) mid-2015 136.0/4.7Tourist arrivals at national borders (000) 2014 2 063Refugees and others of concern to UNHCR mid-2015 4 692Infant mortality rate (per 1 000 live births) 2010-2015 4Health: Total expenditure (% of GDP) 2014 6.6Health: Physicians (per 1 000 pop.) 2013 4.1j
Education: Government expenditure (% of GDP) 2014 4.8j
Education: Primary gross enrolment ratio (f/m per 100 pop.) 2014 102.6/102.3Education: Secondary gross enrolment ratio (f/m per 100 pop.) 2014 104.6/108.9Education: Tertiary gross enrolment ratio (f/m per 100 pop.) 2014 82.0/55.8Intentional homicide rate (per 100 000 pop.) 2014 5.5Seats held by women in national parliaments (%) 2016 23.4Environment and infrastructureMobile-cellular subscriptions (per 100 inhabitants) 2014 147.0Individuals using the Internet (%) 2014 72.1k
Patents: Resident filings (per million pop.) 2014 50.0Threatened species 2015 22Forested area (% of land area) 2013 34.7g
CO2 emission estimates (000 tons/tons per capita) 2013 12 640/4.3Energy production, primary (Petajoules) 2013 69Energy supply per capita (Gigajoules) 2013 95.0Terrestrial and marine areas protected (% of total area) 2014 16.3Population using improved drinking water sources (urban/rural, %) 2015 99.7/90.4Population using improved sanitation facilities (urban/rural, %) 2015 97.2/82.8Net Official Development Assistance disbursed (% of GNI) 2014 0.1a Excludes irrigation canals and landscaping care. b Excludes publishing activities, includes irrigationcanals. c Excludes repair of personal and household goods. d Includes publishing activities and land-scaping care. e Data classified according to ISIC Rev. 3. f Break in the time series. g Estimate. h Serieslinked to former series. i 2013. j 2012. k Population age 16-74.
World Statistics Pocketbook 121
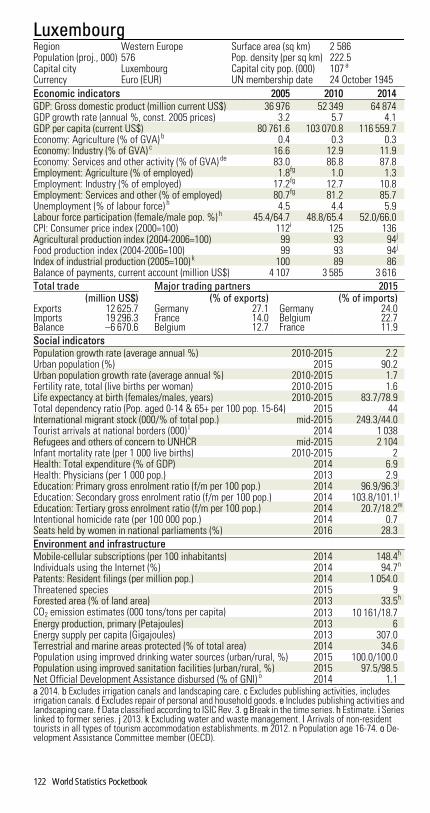
LuxembourgRegion Western Europe Surface area (sq km) 2 586Population (proj., 000) 576 Pop. density (per sq km) 222.5Capital city Luxembourg Capital city pop. (000) 107 a
Currency Euro (EUR) UN membership date 24 October 1945Economic indicators 2005 2010 2014GDP: Gross domestic product (million current US$) 36 976 52 349 64 874GDP growth rate (annual %, const. 2005 prices) 3.2 5.7 4.1GDP per capita (current US$) 80 761.6 103 070.8 116 559.7Economy: Agriculture (% of GVA) b 0.4 0.3 0.3Economy: Industry (% of GVA) c 16.6 12.9 11.9Economy: Services and other activity (% of GVA) de 83.0 86.8 87.8Employment: Agriculture (% of employed) 1.8fg 1.0 1.3Employment: Industry (% of employed) 17.2fg 12.7 10.8Employment: Services and other (% of employed) 80.7fg 81.2 85.7Unemployment (% of labour force) h 4.5 4.4 5.9Labour force participation (female/male pop. %) h 45.4/64.7 48.8/65.4 52.0/66.0CPI: Consumer price index (2000=100) 112i 125 136Agricultural production index (2004-2006=100) 99 93 94j
Food production index (2004-2006=100) 99 93 94j
Index of industrial production (2005=100) k 100 89 86Balance of payments, current account (million US$) 4 107 3 585 3 616Total trade Major trading partners 2015
(million US$) (% of exports) (% of imports)Exports 12 625.7 Germany 27.1 Germany 24.0Imports 19 296.3 France 14.0 Belgium 22.7Balance –6 670.6 Belgium 12.7 France 11.9Social indicatorsPopulation growth rate (average annual %) 2010-2015 2.2Urban population (%) 2015 90.2Urban population growth rate (average annual %) 2010-2015 1.7Fertility rate, total (live births per woman) 2010-2015 1.6Life expectancy at birth (females/males, years) 2010-2015 83.7/78.9Total dependency ratio (Pop. aged 0-14 & 65+ per 100 pop. 15-64) 2015 44International migrant stock (000/% of total pop.) mid-2015 249.3/44.0Tourist arrivals at national borders (000) l 2014 1 038Refugees and others of concern to UNHCR mid-2015 2 104Infant mortality rate (per 1 000 live births) 2010-2015 2Health: Total expenditure (% of GDP) 2014 6.9Health: Physicians (per 1 000 pop.) 2013 2.9Education: Primary gross enrolment ratio (f/m per 100 pop.) 2014 96.9/96.3j
Education: Secondary gross enrolment ratio (f/m per 100 pop.) 2014 103.8/101.1j
Education: Tertiary gross enrolment ratio (f/m per 100 pop.) 2014 20.7/18.2m
Intentional homicide rate (per 100 000 pop.) 2014 0.7Seats held by women in national parliaments (%) 2016 28.3Environment and infrastructureMobile-cellular subscriptions (per 100 inhabitants) 2014 148.4h
Individuals using the Internet (%) 2014 94.7n
Patents: Resident filings (per million pop.) 2014 1 054.0Threatened species 2015 9Forested area (% of land area) 2013 33.5h
CO2 emission estimates (000 tons/tons per capita) 2013 10 161/18.7Energy production, primary (Petajoules) 2013 6Energy supply per capita (Gigajoules) 2013 307.0Terrestrial and marine areas protected (% of total area) 2014 34.6Population using improved drinking water sources (urban/rural, %) 2015 100.0/100.0Population using improved sanitation facilities (urban/rural, %) 2015 97.5/98.5Net Official Development Assistance disbursed (% of GNI) o 2014 1.1a 2014. b Excludes irrigation canals and landscaping care. c Excludes publishing activities, includesirrigation canals. d Excludes repair of personal and household goods. e Includes publishing activities andlandscaping care. f Data classified according to ISIC Rev. 3. g Break in the time series. h Estimate. i Serieslinked to former series. j 2013. k Excluding water and waste management. l Arrivals of non-residenttourists in all types of tourism accommodation establishments. m 2012. n Population age 16-74. o De-velopment Assistance Committee member (OECD).
122 World Statistics Pocketbook

MadagascarRegion Eastern Africa Surface area (sq km) 587 295Population (proj., 000) 24 916 Pop. density (per sq km) 42.8Capital city Antananarivo Capital city pop. (000) 2 610Currency Malagasy Ariary (MGA) UN membership date 20 September 1960Economic indicators 2005 2010 2014GDP: Gross domestic product (million current US$) 5 039 8 733 10 674GDP growth rate (annual %, const. 2005 prices) 4.6 0.4 3.4GDP per capita (current US$) 275.5 414.3 452.8Economy: Agriculture (% of GVA) 28.1 27.6 25.7Economy: Industry (% of GVA) 18.7 19.5 18.6Economy: Services and other activity (% of GVA) 53.3 52.9 55.6Employment: Agriculture (% of employed) 82.0abc ... 75.3de
Employment: Industry (% of employed) 3.4abc ... 7.9de
Employment: Services and other (% of employed) 14.6abc ... 16.9de
Unemployment (% of labour force) f 2.6 3.8 1.8Labour force participation (female/male pop. %) f 84.2/89.2 87.2/91.0 83.9/89.1CPI: Consumer price index (2000=100) 153 263 344Agricultural production index (2004-2006=100) 103 124 119g
Food production index (2004-2006=100) 103 124 119g
Balance of payments, current account (million US$) –767 –896 –622g
Total trade Major trading partners 2015(million US$)h (% of exports)h (% of imports)h
Exports 2 243.2 France 23.5 United Arab Emirates 17.2Imports 3 354.8 United States 8.3 China 15.3Balance –1 111.6 Netherlands 6.5 India 6.2Social indicatorsPopulation growth rate (average annual %) 2010-2015 2.8Urban population (%) 2015 35.1Urban population growth rate (average annual %) 2010-2015 4.7Fertility rate, total (live births per woman) 2010-2015 4.5Life expectancy at birth (females/males, years) 2010-2015 66.0/63.0Total dependency ratio (Pop. aged 0-14 & 65+ per 100 pop. 15-64) 2015 80International migrant stock (000/% of total pop.) mid-2015 32.1/0.1i
Tourist arrivals at national borders (000) 2014 222j
Refugees and others of concern to UNHCR mid-2015 19Infant mortality rate (per 1 000 live births) 2010-2015 37Health: Total expenditure (% of GDP) 2014 3.0k
Education: Government expenditure (% of GDP) 2014 2.1g
Education: Primary gross enrolment ratio (f/m per 100 pop.) 2014 146.5/147.0Education: Secondary gross enrolment ratio (f/m per 100 pop.) 2014 38.1/38.8Education: Tertiary gross enrolment ratio (f/m per 100 pop.) 2014 4.1/4.4g
Seats held by women in national parliaments (%) 2016 20.5Environment and infrastructureMobile-cellular subscriptions (per 100 inhabitants) 2014 38.2Individuals using the Internet (%) 2014 3.7f
Threatened species 2015 965Forested area (% of land area) 2013 21.5f
CO2 emission estimates (000 tons/tons per capita) 2013 3 077/0.2Energy production, primary (Petajoules) 2013 127Energy supply per capita (Gigajoules) 2013 7.0Terrestrial and marine areas protected (% of total area) 2014 2.0Population using improved drinking water sources (urban/rural, %) 2015 81.6/35.3Population using improved sanitation facilities (urban/rural, %) 2015 18.0/8.7Net Official Development Assistance received (% of GNI) 2014 5.7a Data classified according to ISIC Rev. 3. b Break in the time series. c Persons aged 6 years and over.d Persons aged 10 years and over. e 2012. f Estimate. g 2013. h 2014. i Refers to foreign citizens. j Arrivalsof non-resident tourists by air. k Data revision.
World Statistics Pocketbook 123

MalawiRegion Eastern Africa Surface area (sq km) 118 484Population (proj., 000) 17 750 Pop. density (per sq km) 188.3Capital city Lilongwe Capital city pop. (000) 905Currency Malawi Kwacha (MWK) UN membership date 1 December 1964Economic indicators 2005 2010 2014GDP: Gross domestic product (million current US$) 3 656 6 960 5 720GDP growth rate (annual %, const. 2005 prices) 4.7 4.9 6.5GDP per capita (current US$) 286.8 471.2 342.6Economy: Agriculture (% of GVA) a 37.1 31.9 29.0Economy: Industry (% of GVA) b 16.8 16.4 15.7Economy: Services and other activity (% of GVA) cd 46.1 51.7 55.3Employment: Agriculture (% of employed) ... ... 64.1e
Employment: Industry (% of employed) ... ... 7.4e
Employment: Services and other (% of employed) ... ... 28.5e
Unemployment (% of labour force) f 7.7 6.7 6.6Labour force participation (female/male pop. %) f 78.7/85.8 83.6/80.7 81.2/80.7CPI: Consumer price index (2000=100) 199 309 636g
Agricultural production index (2004-2006=100) 85 155 187e
Food production index (2004-2006=100) 85 157 193e
Balance of payments, current account (million US$) –507 –969 –1 078Total trade Major trading partners 2015
(million US$)h (% of exports)h (% of imports)h
Exports 1 341.9 Belgium 12.8 South Africa 19.0Imports 2 774.4 Mozambique 9.7 Mozambique 11.8Balance –1 432.5 South Africa 7.8 India 11.8Social indicatorsPopulation growth rate (average annual %) 2010-2015 3.1Urban population (%) 2015 16.3Urban population growth rate (average annual %) 2010-2015 3.8Fertility rate, total (live births per woman) 2010-2015 5.3Life expectancy at birth (females/males, years) 2010-2015 62.0/59.9Total dependency ratio (Pop. aged 0-14 & 65+ per 100 pop. 15-64) 2015 95International migrant stock (000/% of total pop.) mid-2015 215.2/1.3i
Tourist arrivals at national borders (000) 2014 795ej
Refugees and others of concern to UNHCR mid-2015 22 632Infant mortality rate (per 1 000 live births) 2010-2015 60Health: Total expenditure (% of GDP) 2014 11.4Education: Government expenditure (% of GDP) 2014 6.9Education: Primary gross enrolment ratio (f/m per 100 pop.) 2014 148.0/145.1Education: Secondary gross enrolment ratio (f/m per 100 pop.) 2014 37.5/41.4Education: Tertiary gross enrolment ratio (f/m per 100 pop.) 2014 0.6/1.0k
Intentional homicide rate (per 100 000 pop.) 2014 1.8l
Seats held by women in national parliaments (%) 2016 16.7Environment and infrastructureMobile-cellular subscriptions (per 100 inhabitants) 2014 30.5f
Individuals using the Internet (%) 2014 5.8f
Threatened species 2015 171Forested area (% of land area) 2013 33.8f
CO2 emission estimates (000 tons/tons per capita) 2013 1 272/0.1Energy production, primary (Petajoules) 2013 87Energy supply per capita (Gigajoules) 2013 6.0Terrestrial and marine areas protected (% of total area) 2014 16.8Population using improved drinking water sources (urban/rural, %) 2015 95.7/89.1Population using improved sanitation facilities (urban/rural, %) 2015 47.3/39.8Net Official Development Assistance received (% of GNI) 2014 22.8a Excludes irrigation canals and landscaping care. b Excludes publishing activities, includes irrigationcanals. c Excludes repair of personal and household goods. d Includes publishing activities and land-scaping care. e 2013. f Estimate. g Series linked to former series. h 2014. i Including refugees. j Departures.k 2011. l 2012.
124 World Statistics Pocketbook

MalaysiaRegion South-Eastern Asia Surface area (sq km) 330 396Population (proj., 000) 30 752 a Pop. density (per sq km) 93.6 a
Capital city Kuala Lumpur b Capital city pop. (000) 6 837 c
Currency Malaysian Ringgit (MYR) UN membership date 17 September 1957Economic indicators 2005 2010 2014GDP: Gross domestic product (million current US$) 143 534 247 534 326 933GDP growth rate (annual %, const. 2005 prices) 5.3 7.4 6.0GDP per capita (current US$) 5 564.2 8 802.9 10 933.5Economy: Agriculture (% of GVA) 8.4 10.5 9.2Economy: Industry (% of GVA) 46.9 41.6 41.0Economy: Services and other activity (% of GVA) 44.7 48.0 49.9Employment: Agriculture (% of employed) d 14.6e 13.3f 12.2f
Employment: Industry (% of employed) d 29.7e 27.6f 27.4f
Employment: Services and other (% of employed) d 55.6e 59.2f 60.3f
Unemployment (% of labour force) g 3.5 3.4 2.9Labour force participation (female/male pop. %) g 44.2/77.8 43.8/75.9 49.2/77.5CPI: Consumer price index (2000=100) 109h 124 137Agricultural production index (2004-2006=100) 100 111 121i
Food production index (2004-2006=100) 100 115 128i
Index of industrial production (2005=100) e 100 107 116i
Balance of payments, current account (million US$) 19 980 25 644f 14 472Total trade Major trading partners 2015
(million US$) (% of exports) (% of imports)Exports 200 210.9 Singapore 13.9 China 18.9Imports 176 174.6 China 13.0 Singapore 12.0Balance 24 036.3 Japan 9.5 United States 8.1Social indicatorsPopulation growth rate (average annual %) 2010-2015 1.5a
Urban population (%) 2015 74.7a
Urban population growth rate (average annual %) 2010-2015 2.7a
Fertility rate, total (live births per woman) 2010-2015 2.0a
Life expectancy at birth (females/males, years) 2010-2015 76.9/72.2a
Total dependency ratio (Pop. aged 0-14 & 65+ per 100 pop. 15-64) 2015 44a
International migrant stock (000/% of total pop.) mid-2015 2 514.2/8.3ajk
Tourist arrivals at national borders (000) 2014 27 437l
Refugees and others of concern to UNHCR mid-2015 271 973Infant mortality rate (per 1 000 live births) 2010-2015 7a
Health: Total expenditure (% of GDP) 2014 4.2Education: Government expenditure (% of GDP) 2014 6.1i
Seats held by women in national parliaments (%) 2016 10.4Environment and infrastructureMobile-cellular subscriptions (per 100 inhabitants) 2014 148.8Individuals using the Internet (%) 2014 67.5g
Patents: Resident filings (per million pop.) 2014 45.0Threatened species 2015 1 252Forested area (% of land area) 2013 67.5g
CO2 emission estimates (000 tons/tons per capita) 2013 236 511/8.0Energy production, primary (Petajoules) 2013 3 529Energy supply per capita (Gigajoules) 2013 116.0Terrestrial and marine areas protected (% of total area) 2014 8.0Population using improved drinking water sources (urban/rural, %) 2015 100.0/93.0Population using improved sanitation facilities (urban/rural, %) 2015 96.1/95.9Net Official Development Assistance received (% of GNI) 2014 0.0a Including Sabah and Sarawak. b Kuala Lumpur is the capital and Putrajaya is the administrative capital.c Refers to the Greater Kuala Lumpur. d Persons aged 15 to 64 years. e Data classified according to ISICRev. 3. f Break in the time series. g Estimate. h Series linked to former series. i 2013. j Including refugees.k Refers to foreign citizens. l Including Singapore residents crossing the frontier by road through JohoreCauseway.
World Statistics Pocketbook 125

MaldivesRegion Southern Asia Surface area (sq km) 300Population (proj., 000) 370 Pop. density (per sq km) 1 232.7Capital city Male Capital city pop. (000) 156 a
Currency Rufiyaa (MVR) UN membership date 21 September 1965Economic indicators 2005 2010 2014GDP: Gross domestic product (million current US$) 1 120 2 332 3 032GDP growth rate (annual %, const. 2005 prices) –8.6 7.1 8.5GDP per capita (current US$) 3 671.9 7 013.4 8 483.8Economy: Agriculture (% of GVA) bc 7.5 4.1 3.5Economy: Industry (% of GVA) b 14.8 14.9 18.1Economy: Services and other activity (% of GVA) b 77.7 81.0 78.4Employment: Agriculture (% of employed) d 17.3ef 14.6egh ...Employment: Industry (% of employed) d 23.4ef 15.7egh ...Employment: Services and other (% of employed) d 56.7ef 67.0egh ...Unemployment (% of labour force) i 13.4 11.7 11.6Labour force participation (female/male pop. %) i 50.4/74.5 55.2/76.3 57.0/78.4CPI: Consumer price index (2000=100) j 107k 146 196Agricultural production index (2004-2006=100) 89 72 64l
Food production index (2004-2006=100) 89 72 64l
Balance of payments, current account (million US$) –273 –196 –125Total trade Major trading partners 2015
(million US$) (% of exports) (% of imports)Exports 144.2 Thailand 25.5 United Arab Emirates 21.4Imports 1 913.8 Sri Lanka 12.0 Singapore 14.7Balance –1 769.6 France 10.5 India 11.0Social indicatorsPopulation growth rate (average annual %) 2010-2015 1.8Urban population (%) 2015 45.5Urban population growth rate (average annual %) 2010-2015 4.5Fertility rate, total (live births per woman) 2010-2015 2.2Life expectancy at birth (females/males, years) 2010-2015 77.4/75.4Total dependency ratio (Pop. aged 0-14 & 65+ per 100 pop. 15-64) 2015 47International migrant stock (000/% of total pop.) mid-2015 94.1/25.9mn
Tourist arrivals at national borders (000) 2014 1 205o
Infant mortality rate (per 1 000 live births) 2010-2015 9Health: Total expenditure (% of GDP) 2014 13.7Education: Government expenditure (% of GDP) 2014 5.2p
Intentional homicide rate (per 100 000 pop.) 2014 0.9l
Seats held by women in national parliaments (%) 2016 5.9Environment and infrastructureMobile-cellular subscriptions (per 100 inhabitants) 2014 189.4Individuals using the Internet (%) 2014 49.3i
Threatened species 2015 69Forested area (% of land area) 2013 3.3i
CO2 emission estimates (000 tons/tons per capita) 2013 1 049/3.0Energy production, primary (Petajoules) 2013 0Energy supply per capita (Gigajoules) 2013 43.0Terrestrial and marine areas protected (% of total area) 2014 0.1Population using improved drinking water sources (urban/rural, %) 2015 99.5/97.9Population using improved sanitation facilities (urban/rural, %) 2015 97.5/98.3Net Official Development Assistance received (% of GNI) 2014 1.0a 2014. b At producers' prices. c Includes mining and quarrying. d Data classified according to ISIC Rev.3. e Break in the time series. f 2003. g Nonstandard reference group coverage. h Nonstandard geographicalcoverage. i Estimate. j Male. k Series linked to former series. l 2013. m Including refugees. n Refers toforeign citizens. o Arrivals by air. p 2012.
126 World Statistics Pocketbook

MaliRegion Western Africa Surface area (sq km) 1 240 192Population (proj., 000) 18 135 Pop. density (per sq km) 14.9Capital city Bamako Capital city pop. (000) 2 515Currency CFA Franc (XOF) UN membership date 28 September 1960Economic indicators 2005 2010 2014GDP: Gross domestic product (million current US$) 5 486 9 400 11 979GDP growth rate (annual %, const. 2005 prices) 6.1 5.8 7.2GDP per capita (current US$) 425.9 619.8 701.1Economy: Agriculture (% of GVA) 37.5 40.5 39.5Economy: Industry (% of GVA) 24.0 20.1 22.3Economy: Services and other activity (% of GVA) 38.5 39.4 38.2Employment: Agriculture (% of employed) a 41.5b 66.0cd ...Employment: Industry (% of employed) a 16.5b 5.6cd ...Employment: Services and other (% of employed) a 41.9b 28.3cd ...Unemployment (% of labour force) e 9.6 7.3 8.2Labour force participation (female/male pop. %) e 38.3/70.1 50.3/81.4 49.8/82.2CPI: Consumer price index (2000=100) f 112 131g 142Agricultural production index (2004-2006=100) 103 142 141h
Food production index (2004-2006=100) 103 154 150h
Index of industrial production (2005=100) ai 100 74 91Balance of payments, current account (million US$) –438c –1 190 –375h
Total trade Major trading partners 2015(million US$)j (% of exports)j (% of imports)j
Exports 2 610.4 South Africa 51.8 Senegal 25.1Imports 3 462.7 Switzerland 11.6 France 10.8Balance –852.3 China 7.8 China 10.6Social indicatorsPopulation growth rate (average annual %) 2010-2015 3.0Urban population (%) 2015 39.9Urban population growth rate (average annual %) 2010-2015 5.1Fertility rate, total (live births per woman) 2010-2015 6.4Life expectancy at birth (females/males, years) 2010-2015 57.0/57.4Total dependency ratio (Pop. aged 0-14 & 65+ per 100 pop. 15-64) 2015 100International migrant stock (000/% of total pop.) mid-2015 363.1/2.1k
Tourist arrivals at national borders (000) 2014 168Refugees and others of concern to UNHCR mid-2015 148 309Infant mortality rate (per 1 000 live births) 2010-2015 84Health: Total expenditure (% of GDP) 2014 6.9Education: Government expenditure (% of GDP) 2014 4.4Education: Primary gross enrolment ratio (f/m per 100 pop.) 2014 73.0/81.2Education: Secondary gross enrolment ratio (f/m per 100 pop.) 2014 37.4/49.4Education: Tertiary gross enrolment ratio (f/m per 100 pop.) 2014 4.1/9.6j
Intentional homicide rate (per 100 000 pop.) 2014 10.2j
Seats held by women in national parliaments (%) 2016 8.8Environment and infrastructureMobile-cellular subscriptions (per 100 inhabitants) 2014 149.0Individuals using the Internet (%) 2014 7.0e
Threatened species 2015 39Forested area (% of land area) 2013 4.0e
CO2 emission estimates (000 tons/tons per capita) 2013 1 027/0.1Energy production, primary (Petajoules) 2013 53Energy supply per capita (Gigajoules) 2013 4.0Terrestrial and marine areas protected (% of total area) 2014 8.4Population using improved drinking water sources (urban/rural, %) 2015 96.5/64.1Population using improved sanitation facilities (urban/rural, %) 2015 37.6/16.1Net Official Development Assistance received (% of GNI) 2014 10.7a Data classified according to ISIC Rev. 3. b 2004. c Break in the time series. d 2006. e Estimate. f Bamako.g Series linked to former series. h 2013. i Country data supplemented with data from the ObservatoireEconomique et Statistique d’Afrique Subsaharienne (Afristat). j 2012. k Including refugees.
World Statistics Pocketbook 127

MaltaRegion Southern Europe Surface area (sq km) 316Population (proj., 000) 420 Pop. density (per sq km) 1 311.3Capital city Valletta Capital city pop. (000) 197 a
Currency Euro (EUR) UN membership date 1 December 1964Economic indicators 2005 2010 2014GDP: Gross domestic product (million current US$) 6 393 8 741 10 536GDP growth rate (annual %, const. 2005 prices) 3.8 3.5 3.5GDP per capita (current US$) 16 099.8 21 211.6 25 222.4Economy: Agriculture (% of GVA) b 2.2 1.7 1.3Economy: Industry (% of GVA) c 23.3 19.1 15.3Economy: Services and other activity (% of GVA) de 74.5 79.3 83.4Employment: Agriculture (% of employed) 2.0f 1.3 1.2Employment: Industry (% of employed) 30.0f 25.7 21.6Employment: Services and other (% of employed) 67.8f 72.6 77.1Unemployment (% of labour force) g 6.9 6.8 5.9Labour force participation (female/male pop. %) g 29.1/68.8 32.6/66.0 38.5/66.1CPI: Consumer price index (2000=100) 113 127h 136Agricultural production index (2004-2006=100) 97 99 92i
Food production index (2004-2006=100) 97 99 92i
Index of industrial production (2005=100) 100 103 97Balance of payments, current account (million US$) –418 –420 422Total trade Major trading partners 2015
(million US$) (% of exports) (% of imports)Exports 2 580.8 Germany 13.3 Italy 23.0Imports 5 793.7 France 10.1 Netherlands 8.3Balance –3 212.9 Bunkers 7.4j United Kingdom 7.5Social indicatorsPopulation growth rate (average annual %) 2010-2015 0.3Urban population (%) 2015 95.4Urban population growth rate (average annual %) 2010-2015 0.5Fertility rate, total (live births per woman) 2010-2015 1.4Life expectancy at birth (females/males, years) 2010-2015 82.0/78.6Total dependency ratio (Pop. aged 0-14 & 65+ per 100 pop. 15-64) 2015 51International migrant stock (000/% of total pop.) mid-2015 41.4/9.9Tourist arrivals at national borders (000) 2014 1 690k
Refugees and others of concern to UNHCR mid-2015 6 520Infant mortality rate (per 1 000 live births) 2010-2015 5Health: Total expenditure (% of GDP) 2014 9.8Health: Physicians (per 1 000 pop.) 2013 3.5Education: Government expenditure (% of GDP) 2014 6.8l
Education: Primary gross enrolment ratio (f/m per 100 pop.) 2014 95.0/100.0Education: Secondary gross enrolment ratio (f/m per 100 pop.) 2014 80.6/91.0Education: Tertiary gross enrolment ratio (f/m per 100 pop.) 2014 48.0/42.0Intentional homicide rate (per 100 000 pop.) 2014 1.4Seats held by women in national parliaments (%) 2016 12.9Environment and infrastructureMobile-cellular subscriptions (per 100 inhabitants) 2014 127.0Individuals using the Internet (%) 2014 73.2m
Patents: Resident filings (per million pop.) 2014 150.0Threatened species 2015 31Forested area (% of land area) 2013 1.1g
CO2 emission estimates (000 tons/tons per capita) 2013 2 219/5.3Energy production, primary (Petajoules) 2013 0Energy supply per capita (Gigajoules) 2013 75.0Terrestrial and marine areas protected (% of total area) 2014 0.5Population using improved drinking water sources (urban/rural, %) 2015 100.0/100.0Population using improved sanitation facilities (urban/rural, %) 2015 100.0/100.0Net Official Development Assistance disbursed (% of GNI) 2014 0.2a 2014. b Excludes irrigation canals and landscaping care. c Excludes publishing activities, includesirrigation canals. d Excludes repair of personal and household goods. e Includes publishing activities andlandscaping care. f Data classified according to ISIC Rev. 3. g Estimate. h Series linked to former series.i 2013. j See technical notes. k Departures by air and by sea. l 2012. m Population age 16-74.
128 World Statistics Pocketbook
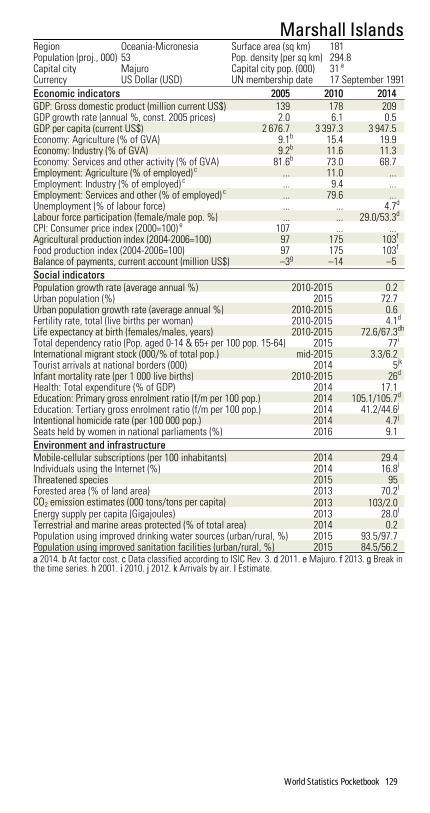
Marshall IslandsRegion Oceania-Micronesia Surface area (sq km) 181Population (proj., 000) 53 Pop. density (per sq km) 294.8Capital city Majuro Capital city pop. (000) 31 a
Currency US Dollar (USD) UN membership date 17 September 1991Economic indicators 2005 2010 2014GDP: Gross domestic product (million current US$) 139 178 209GDP growth rate (annual %, const. 2005 prices) 2.0 6.1 0.5GDP per capita (current US$) 2 676.7 3 397.3 3 947.5Economy: Agriculture (% of GVA) 9.1b 15.4 19.9Economy: Industry (% of GVA) 9.2b 11.6 11.3Economy: Services and other activity (% of GVA) 81.6b 73.0 68.7Employment: Agriculture (% of employed) c ... 11.0 ...Employment: Industry (% of employed) c ... 9.4 ...Employment: Services and other (% of employed) c ... 79.6 ...Unemployment (% of labour force) ... ... 4.7d
Labour force participation (female/male pop. %) ... ... 29.0/53.3d
CPI: Consumer price index (2000=100) e 107 ... ...Agricultural production index (2004-2006=100) 97 175 103f
Food production index (2004-2006=100) 97 175 103f
Balance of payments, current account (million US$) –3g –14 –5Social indicatorsPopulation growth rate (average annual %) 2010-2015 0.2Urban population (%) 2015 72.7Urban population growth rate (average annual %) 2010-2015 0.6Fertility rate, total (live births per woman) 2010-2015 4.1d
Life expectancy at birth (females/males, years) 2010-2015 72.6/67.3dh
Total dependency ratio (Pop. aged 0-14 & 65+ per 100 pop. 15-64) 2015 77i
International migrant stock (000/% of total pop.) mid-2015 3.3/6.2Tourist arrivals at national borders (000) 2014 5jk
Infant mortality rate (per 1 000 live births) 2010-2015 26d
Health: Total expenditure (% of GDP) 2014 17.1Education: Primary gross enrolment ratio (f/m per 100 pop.) 2014 105.1/105.7d
Education: Tertiary gross enrolment ratio (f/m per 100 pop.) 2014 41.2/44.6j
Intentional homicide rate (per 100 000 pop.) 2014 4.7j
Seats held by women in national parliaments (%) 2016 9.1Environment and infrastructureMobile-cellular subscriptions (per 100 inhabitants) 2014 29.4Individuals using the Internet (%) 2014 16.8l
Threatened species 2015 95Forested area (% of land area) 2013 70.2l
CO2 emission estimates (000 tons/tons per capita) 2013 103/2.0Energy supply per capita (Gigajoules) 2013 28.0l
Terrestrial and marine areas protected (% of total area) 2014 0.2Population using improved drinking water sources (urban/rural, %) 2015 93.5/97.7Population using improved sanitation facilities (urban/rural, %) 2015 84.5/56.2a 2014. b At factor cost. c Data classified according to ISIC Rev. 3. d 2011. e Majuro. f 2013. g Break inthe time series. h 2001. i 2010. j 2012. k Arrivals by air. l Estimate.
World Statistics Pocketbook 129

MartiniqueRegion Caribbean Surface area (sq km) 1 128Population (proj., 000) 396 Pop. density (per sq km) 373.9Capital city Fort-de-France Capital city pop. (000) 86 a
Currency Euro (EUR)Economic indicators 2005 2010 2014Employment: Agriculture (% of employed) bc ... 4.1 3.9d
Employment: Industry (% of employed) bc ... 11.9 11.8d
Employment: Services and other (% of employed) bc ... 65.3 69.0d
Unemployment (% of labour force) e 18.7 21.0 23.0Labour force participation (female/male pop. %) e 46.0/53.0 49.5/55.8 52.0/52.3CPI: Consumer price index (2000=100) 111 121 129Agricultural production index (2004-2006=100) 99 81 101f
Food production index (2004-2006=100) 99 81 101f
Social indicatorsPopulation growth rate (average annual %) 2010-2015 0.1Urban population (%) 2015 88.9Urban population growth rate (average annual %) 2010-2015 0.2Fertility rate, total (live births per woman) 2010-2015 2.0Life expectancy at birth (females/males, years) 2010-2015 84.4/77.8Total dependency ratio (Pop. aged 0-14 & 65+ per 100 pop. 15-64) 2015 57International migrant stock (000/% of total pop.) mid-2015 61.7/15.6Tourist arrivals at national borders (000) 2014 490Infant mortality rate (per 1 000 live births) 2010-2015 6Environment and infrastructureThreatened species 2015 45Forested area (% of land area) 2013 45.8e
CO2 emission estimates (000 tons/tons per capita) 2013 2 420/6.1Energy production, primary (Petajoules) 2013 1e
Energy supply per capita (Gigajoules) 2013 84.0e
Terrestrial and marine areas protected (% of total area) 2014 11.6Population using improved drinking water sources (urban/rural, %) 2015 100.0/99.8a 2014. b Persons aged 15 to 64 years. c Excluding the institutional population. d 2012. e Estimate. f 2013.
130 World Statistics Pocketbook

MauritaniaRegion Western Africa Surface area (sq km) 1 030 700Population (proj., 000) 4 167 Pop. density (per sq km) 4.0Capital city Nouakchott Capital city pop. (000) 968Currency Ouguiya (MRO) UN membership date 27 October 1961Economic indicators 2005 2010 2014GDP: Gross domestic product (million current US$) 2 184 4 338 5 092GDP growth rate (annual %, const. 2005 prices) 9.0 4.8 6.4GDP per capita (current US$) 692.6 1 207.8 1 282.8Economy: Agriculture (% of GVA) 29.8 21.3 20.6Economy: Industry (% of GVA) 32.4 40.9 44.5Economy: Services and other activity (% of GVA) 37.9 37.8 35.0Unemployment (% of labour force) a 32.1 30.9 30.9Labour force participation (female/male pop. %) a 27.8/65.9 28.8/65.5 29.0/65.2CPI: Consumer price index (2000=100) 139 185 214b
Agricultural production index (2004-2006=100) 100 113 120b
Food production index (2004-2006=100) 100 113 120b
Balance of payments, current account (million US$) ... ... –1 535Total trade Major trading partners 2015
(million US$)c (% of exports)c (% of imports)c
Exports 2 139.8 China 32.7 United States 23.7Imports 3 641.8 Switzerland 17.1 United Arab Emirates 18.5Balance –1 502.0 Spain 6.6 France 10.0Social indicatorsPopulation growth rate (average annual %) 2010-2015 2.5Urban population (%) 2015 59.9Urban population growth rate (average annual %) 2010-2015 3.5Fertility rate, total (live births per woman) 2010-2015 4.7Life expectancy at birth (females/males, years) 2010-2015 64.3/61.3Total dependency ratio (Pop. aged 0-14 & 65+ per 100 pop. 15-64) 2015 76International migrant stock (000/% of total pop.) mid-2015 138.2/3.4de
Refugees and others of concern to UNHCR mid-2015 77 258Infant mortality rate (per 1 000 live births) 2010-2015 67Health: Total expenditure (% of GDP) 2014 3.8Education: Government expenditure (% of GDP) 2014 3.3b
Education: Primary gross enrolment ratio (f/m per 100 pop.) 2014 100.7/95.4Education: Secondary gross enrolment ratio (f/m per 100 pop.) 2014 28.6/31.3Education: Tertiary gross enrolment ratio (f/m per 100 pop.) 2014 3.3/7.5b
Intentional homicide rate (per 100 000 pop.) 2014 11.4f
Seats held by women in national parliaments (%) 2016 25.2Environment and infrastructureMobile-cellular subscriptions (per 100 inhabitants) 2014 94.2Individuals using the Internet (%) 2014 10.7a
Threatened species 2015 69Forested area (% of land area) 2013 0.2a
CO2 emission estimates (000 tons/tons per capita) 2013 2 648/0.7Energy production, primary (Petajoules) 2013 31Energy supply per capita (Gigajoules) 2013 13.0a
Terrestrial and marine areas protected (% of total area) 2014 1.4Population using improved drinking water sources (urban/rural, %) 2015 58.4/57.1Population using improved sanitation facilities (urban/rural, %) 2015 57.6/13.9Net Official Development Assistance received (% of GNI) 2014 5.4a Estimate. b 2013. c 2014. d Including refugees. e Refers to foreign citizens. f 2012.
World Statistics Pocketbook 131

MauritiusRegion Eastern Africa Surface area (sq km) 1 969 a
Population (proj., 000) 1 278 b Pop. density (per sq km) 629.3 b
Capital city Port Louis Capital city pop. (000) 136 c
Currency Mauritius Rupee (MUR) UN membership date 24 April 1968Economic indicators 2005 2010 2014GDP: Gross domestic product (million current US$) 6 489 9 718 12 616GDP growth rate (annual %, const. 2005 prices) 1.8 4.1 3.6GDP per capita (current US$) 5 309.9 7 787.4 9 945.4Economy: Agriculture (% of GVA) 5.7 3.6d 3.0d
Economy: Industry (% of GVA) 26.6 26.6e 23.5e
Economy: Services and other activity (% of GVA) 67.8 69.9fg 73.5fg
Employment: Agriculture (% of employed) 10.0h ... 8.0ij
Employment: Industry (% of employed) 32.4h 27.5 29.8ijk
Employment: Services and other (% of employed) 57.5h 49.5 63.5ijk
Unemployment (% of labour force) l 9.6 7.7 7.7Labour force participation (female/male pop. %) l 41.1/76.8 43.2/74.4 46.7/75.1CPI: Consumer price index (2000=100) 128 176 208Agricultural production index (2004-2006=100) 98 99 94m
Food production index (2004-2006=100) 98 99 94m
Index of industrial production (2005=100) h 100 112 ...Balance of payments, current account (million US$) –324 –1 006 –714Total trade Major trading partners 2015
(million US$) (% of exports) (% of imports)Exports 2 481.1 United Kingdom 13.1 China 18.2Imports 4 458.3 United Arab Emirates 12.4 India 18.1Balance –1 977.2 France 11.9 France 7.2Social indicatorsPopulation growth rate (average annual %) 2010-2015 0.4b
Urban population (%) 2015 39.7b
Urban population growth rate (average annual %) 2010-2015 –0.1b
Fertility rate, total (live births per woman) 2010-2015 1.5b
Life expectancy at birth (females/males, years) 2010-2015 77.7/70.7b
Total dependency ratio (Pop. aged 0-14 & 65+ per 100 pop. 15-64) 2015 41b
International migrant stock (000/% of total pop.) mid-2015 28.6/2.3bn
Tourist arrivals at national borders (000) 2014 1 039Infant mortality rate (per 1 000 live births) 2010-2015 12b
Health: Total expenditure (% of GDP) 2014 4.8Education: Government expenditure (% of GDP) 2014 5.0Education: Primary gross enrolment ratio (f/m per 100 pop.) 2014 103.7/101.7Education: Secondary gross enrolment ratio (f/m per 100 pop.) 2014 99.0/96.9Education: Tertiary gross enrolment ratio (f/m per 100 pop.) 2014 42.7/34.7Intentional homicide rate (per 100 000 pop.) 2014 2.7o
Seats held by women in national parliaments (%) 2016 11.6Environment and infrastructureMobile-cellular subscriptions (per 100 inhabitants) 2014 132.3Individuals using the Internet (%) 2014 41.4l
Patents: Resident filings (per million pop.) 2014 2.0m
Threatened species 2015 249Forested area (% of land area) 2013 19.0l
CO2 emission estimates (000 tons/tons per capita) 2013 3 726/2.9Energy production, primary (Petajoules) 2013 9Energy supply per capita (Gigajoules) 2013 46.0Terrestrial and marine areas protected (% of total area) 2014 <Population using improved drinking water sources (urban/rural, %) 2015 99.9/99.8Population using improved sanitation facilities (urban/rural, %) 2015 93.9/92.6Net Official Development Assistance received (% of GNI) 2014 0.4a Excludes the islands of St. Brandon and Agalega. b Including Agalega, Rodrigues and Saint Brandon.c 2014. d Excludes irrigation canals and landscaping care. e Excludes publishing activities, includesirrigation canals. f Excludes repair of personal and household goods. g Includes publishing activities andlandscaping care. h Data classified according to ISIC Rev. 3. i Persons aged 16 years and over. j Nationals,residents. k Break in the time series. l Estimate. m 2013. n Refers to foreign citizens. o 2011.
132 World Statistics Pocketbook

MexicoRegion Central America Surface area (sq km) 1 964 375Population (proj., 000) 128 632 Pop. density (per sq km) 66.2Capital city Mexico City Capital city pop. (000) 20 999 a
Currency Mexican Peso (MXN) UN membership date 7 November 1945Economic indicators 2005 2010 2014GDP: Gross domestic product (million current US$) 864 810 1 049 925 1 294 695GDP growth rate (annual %, const. 2005 prices) 3.1 5.2 2.2GDP per capita (current US$) 7 880.0 8 851.3 10 325.7Economy: Agriculture (% of GVA) b 3.2 3.3 3.3Economy: Industry (% of GVA) c 38.8 38.3 37.7Economy: Services and other activity (% of GVA) de 58.1 58.3 59.0Employment: Agriculture (% of employed) f 14.9g 13.1hi 13.4hj
Employment: Industry (% of employed) f 25.5g 25.5hi 23.6hj
Employment: Services and other (% of employed) f 59.0g 60.6hi 62.4hj
Unemployment (% of labour force) k 3.5 5.2 4.9Labour force participation (female/male pop. %) k 41.0/80.9 43.8/80.7 45.3/79.5CPI: Consumer price index (2000=100) 127 158 184Agricultural production index (2004-2006=100) 98 108 115j
Food production index (2004-2006=100) 98 108 115j
Index of industrial production (2005=100) 100 101 110Balance of payments, current account (million US$) –9 046 –4 867 –24 036Total trade Major trading partners 2015
(million US$) (% of exports) (% of imports)Exports 380 749.9 United States 81.2 United States 47.4Imports 395 232.2 Canada 2.8 China 17.7Balance –14 482.3 China 1.3 Japan 4.4Social indicatorsPopulation growth rate (average annual %) 2010-2015 1.4Urban population (%) 2015 79.2Urban population growth rate (average annual %) 2010-2015 1.6Fertility rate, total (live births per woman) 2010-2015 2.3Life expectancy at birth (females/males, years) 2010-2015 78.9/74.0Total dependency ratio (Pop. aged 0-14 & 65+ per 100 pop. 15-64) 2015 52International migrant stock (000/% of total pop.) mid-2015 1 193.2/0.9l
Tourist arrivals at national borders (000) 2014 29 346m
Refugees and others of concern to UNHCR mid-2015 2 226Infant mortality rate (per 1 000 live births) 2010-2015 19Health: Total expenditure (% of GDP) 2014 6.3Health: Physicians (per 1 000 pop.) 2013 2.1n
Education: Government expenditure (% of GDP) 2014 5.2n
Education: Primary gross enrolment ratio (f/m per 100 pop.) 2014 103.2/103.6Education: Secondary gross enrolment ratio (f/m per 100 pop.) 2014 93.5/87.7Education: Tertiary gross enrolment ratio (f/m per 100 pop.) 2014 30.0/29.9Intentional homicide rate (per 100 000 pop.) 2014 15.7Seats held by women in national parliaments (%) 2016 42.4Environment and infrastructureMobile-cellular subscriptions (per 100 inhabitants) 2014 82.5ko
Individuals using the Internet (%) 2014 44.4p
Patents: Resident filings (per million pop.) 2014 10.0Threatened species 2015 1 109Forested area (% of land area) 2013 34.1k
CO2 emission estimates (000 tons/tons per capita) 2013 488 602/4.0Energy production, primary (Petajoules) 2013 8 849Energy supply per capita (Gigajoules) 2013 64.0Terrestrial and marine areas protected (% of total area) 2014 6.0Population using improved drinking water sources (urban/rural, %) 2015 97.2/92.1Population using improved sanitation facilities (urban/rural, %) 2015 88.0/74.5Net Official Development Assistance received (% of GNI) 2014 0.1a Refers to the total population in seventy-six municipalities of the Metropolitan Area of Mexico City.b Excludes irrigation canals and landscaping care. c Excludes publishing activities, includes irrigationcanals. d Excludes repair of personal and household goods. e Includes publishing activities and land-scaping care. f Data classified according to ISIC Rev. 2. g Persons aged 12 years and over. h Break in thetime series. i Persons aged 14 years and over. j 2013. k Estimate. l Including refugees. m Including nationalsresiding abroad. n 2011. o Data as at the end of September. p Population age 6+.
World Statistics Pocketbook 133

Micronesia (Federated States of)Region Oceania-Micronesia Surface area (sq km) 702Population (proj., 000) 105 Pop. density (per sq km) 150.0Capital city Palikir Capital city pop. (000) 7 a
Currency US Dollar (USD) UN membership date 17 September 1991Economic indicators 2005 2010 2014GDP: Gross domestic product (million current US$) 250 294 308GDP growth rate (annual %, const. 2005 prices) 2.2 3.2 –1.6GDP per capita (current US$) 2 351.7 2 833.6 2 960.3Economy: Agriculture (% of GVA) 24.1 26.3 27.5Economy: Industry (% of GVA) 5.7 7.8 6.1Economy: Services and other activity (% of GVA) 70.2 65.9 66.5Agricultural production index (2004-2006=100) 101 98 102b
Food production index (2004-2006=100) 101 98 102b
Balance of payments, current account (million US$) ... –25 22Total trade Major trading partners 2015
(million US$)b (% of exports)b (% of imports)b
Exports 27.6 ... United States 37.0Imports 187.7 ... Guam 22.1Balance –160.1 ... Areas nes 6.9c
Social indicatorsPopulation growth rate (average annual %) 2010-2015 0.2Urban population (%) 2015 22.4Urban population growth rate (average annual %) 2010-2015 0.3Fertility rate, total (live births per woman) 2010-2015 3.3Life expectancy at birth (females/males, years) 2010-2015 69.9/68.0Total dependency ratio (Pop. aged 0-14 & 65+ per 100 pop. 15-64) 2015 62International migrant stock (000/% of total pop.) mid-2015 2.8/2.6Tourist arrivals at national borders (000) 2014 35d
Refugees and others of concern to UNHCR mid-2015 34Infant mortality rate (per 1 000 live births) 2010-2015 33Health: Total expenditure (% of GDP) 2014 13.7Education: Primary gross enrolment ratio (f/m per 100 pop.) 2014 97.2/98.1Intentional homicide rate (per 100 000 pop.) 2014 4.8e
Seats held by women in national parliaments (%) 2016 0.0Environment and infrastructureMobile-cellular subscriptions (per 100 inhabitants) 2014 30.3bf
Individuals using the Internet (%) 2014 29.7g
Threatened species 2015 163Forested area (% of land area) 2013 91.7g
CO2 emission estimates (000 tons/tons per capita) 2013 147/1.4Energy production, primary (Petajoules) 2013 0Energy supply per capita (Gigajoules) 2013 21.0g
Population using improved drinking water sources (urban/rural, %) 2015 94.8/87.4Population using improved sanitation facilities (urban/rural, %) 2015 85.1/49.0a 2014. b 2013. c See technical notes. d Arrivals in the States of Kosrae, Chuuk, Pohnpei and Yap; excludingFSM citizens. e 2012. f Data as of 12 March. g Estimate.
134 World Statistics Pocketbook

MonacoRegion Western Europe Surface area (sq km) 2Population (proj., 000) 38 Pop. density (per sq km) 25 411.4Capital city Monaco Capital city pop. (000) 38 a
Currency Euro (EUR) UN membership date 28 May 1993Economic indicators 2005 2010 2014GDP: Gross domestic product (million current US$) 4 203 5 362 7 060GDP growth rate (annual %, const. 2005 prices) 1.6 2.2 7.2GDP per capita (current US$) 124 316.1 145 538.1 187 649.8Economy: Industry (% of GVA) bc 12.2 12.9 12.8Economy: Services and other activity (% of GVA) bde 87.9 87.1 87.2Social indicatorsPopulation growth rate (average annual %) 2010-2015 0.5Urban population (%) 2015 100.0Urban population growth rate (average annual %) 2010-2015 0.8Total dependency ratio (Pop. aged 0-14 & 65+ per 100 pop. 15-64) 2015 59f
International migrant stock (000/% of total pop.) mid-2015 21.0/55.8Tourist arrivals at national borders (000) g 2014 329Refugees and others of concern to UNHCR mid-2015 33Health: Total expenditure (% of GDP) 2014 4.3Health: Physicians (per 1 000 pop.) 2013 7.2h
Education: Government expenditure (% of GDP) 2014 1.0Seats held by women in national parliaments (%) 2016 20.8Environment and infrastructureMobile-cellular subscriptions (per 100 inhabitants) 2014 88.5Individuals using the Internet (%) 2014 92.4i
Patents: Resident filings (per million pop.) 2014 735.0Threatened species 2015 16Terrestrial and marine areas protected (% of total area) 2014 99.7Population using improved drinking water sources (urban/rural, %) 2015 100.0/...Population using improved sanitation facilities (urban/rural, %) 2015 100.0/...a 2014. b At producers' prices. c Excludes publishing activities, includes irrigation canals. d Excludesrepair of personal and household goods. e Includes publishing activities and landscaping care. f 2008.g Arrivals of non-resident tourists in hotels and similar establishments. h 2012. i Estimate.
World Statistics Pocketbook 135

MongoliaRegion Eastern Asia Surface area (sq km) 1 564 116Population (proj., 000) 3 006 Pop. density (per sq km) 1.9Capital city Ulaanbaatar Capital city pop. (000) 1 377Currency Tugrik (MNT) UN membership date 27 October 1961Economic indicators 2005 2010 2014GDP: Gross domestic product (million current US$) 2 926 7 189 12 067GDP growth rate (annual %, const. 2005 prices) 7.3 6.4 7.8GDP per capita (current US$) 1 158.1 2 650.4 4 146.9Economy: Agriculture (% of GVA) a 17.8 13.1 15.6Economy: Industry (% of GVA) b 37.4 37.0 36.2Economy: Services and other activity (% of GVA) cd 44.8 50.0 48.2Employment: Agriculture (% of employed) 39.9ef 33.5g 35.0h
Employment: Industry (% of employed) 16.8ef 16.2g 18.2h
Employment: Services and other (% of employed) 43.3ef 50.2g 46.8h
Unemployment (% of labour force) i 6.7 6.5 7.3Labour force participation (female/male pop. %) i 55.4/65.2 55.1/67.6 56.2/68.4CPI: Consumer price index (2000=100) 138j 166gk ...Agricultural production index (2004-2006=100) 97 115 145l
Food production index (2004-2006=100) 97 115 147l
Index of industrial production (2005=100) e 100 155 183Balance of payments, current account (million US$) –5 –887 –1 405Total trade Major trading partners 2015
(million US$) (% of exports) (% of imports)Exports 4 669.3 China 83.5 China 35.8Imports 3 796.6 United Kingdom 7.2 Russian Federation 26.9Balance 872.7 Switzerland 2.3 Japan 7.2Social indicatorsPopulation growth rate (average annual %) 2010-2015 1.7Urban population (%) 2015 72.0Urban population growth rate (average annual %) 2010-2015 2.8Fertility rate, total (live births per woman) 2010-2015 2.7Life expectancy at birth (females/males, years) 2010-2015 73.3/64.8Total dependency ratio (Pop. aged 0-14 & 65+ per 100 pop. 15-64) 2015 48International migrant stock (000/% of total pop.) mid-2015 17.6/0.6m
Tourist arrivals at national borders (000) 2014 393n
Refugees and others of concern to UNHCR mid-2015 32Infant mortality rate (per 1 000 live births) 2010-2015 26Health: Total expenditure (% of GDP) 2014 4.7Health: Physicians (per 1 000 pop.) 2013 2.8o
Education: Government expenditure (% of GDP) 2014 4.6o
Education: Primary gross enrolment ratio (f/m per 100 pop.) 2014 100.6/102.7Education: Secondary gross enrolment ratio (f/m per 100 pop.) 2014 91.9/89.6Education: Tertiary gross enrolment ratio (f/m per 100 pop.) 2014 75.9/52.9Intentional homicide rate (per 100 000 pop.) 2014 7.5Seats held by women in national parliaments (%) 2016 14.5Environment and infrastructureMobile-cellular subscriptions (per 100 inhabitants) 2014 105.1Individuals using the Internet (%) 2014 27.0i
Patents: Resident filings (per million pop.) 2014 48.0Threatened species 2015 36Forested area (% of land area) 2013 8.2i
CO2 emission estimates (000 tons/tons per capita) 2013 41 591/14.6Energy production, primary (Petajoules) 2013 808Energy supply per capita (Gigajoules) 2013 166.0Terrestrial and marine areas protected (% of total area) 2014 17.2Population using improved drinking water sources (urban/rural, %) 2015 66.5/59.2Population using improved sanitation facilities (urban/rural, %) 2015 66.4/42.6Net Official Development Assistance received (% of GNI) 2014 2.8a Excludes irrigation canals and landscaping care. b Excludes publishing activities, includes irrigationcanals. c Excludes repair of personal and household goods. d Includes publishing activities and land-scaping care. e Data classified according to ISIC Rev. 3. f Persons aged 16 years and over. g Break in thetime series. h 2012. i Estimate. j Ulan Bator. k Index base: 2006=100. l 2013. m Refers to foreign citizens.n Excluding diplomats and foreign residents in Mongolia. o 2011.
136 World Statistics Pocketbook

MontenegroRegion Southern Europe Surface area (sq km) 13 812Population (proj., 000) 626 Pop. density (per sq km) 46.6Capital city Podgorica Capital city pop. (000) 165 a
Currency Euro (EUR) UN membership date 28 June 2006Economic indicators 2005 2010 2014GDP: Gross domestic product (million current US$) 2 257 4 139 4 588GDP growth rate (annual %, const. 2005 prices) 4.2 2.5 1.8GDP per capita (current US$) 3 661.8 6 654.8 7 337.0Economy: Agriculture (% of GVA) 10.4 9.2b 10.0b
Economy: Industry (% of GVA) 20.7 20.5c 17.7c
Economy: Services and other activity (% of GVA) 68.9 70.3de 72.3de
Employment: Agriculture (% of employed) 8.6fgh 6.2f 5.7g
Employment: Industry (% of employed) 19.2fgh 20.0f 17.5g
Employment: Services and other (% of employed) 72.1fgh 73.8f 73.0g
Unemployment (% of labour force) i 19.3 19.7 18.0Labour force participation (female/male pop. %) i 42.6/59.0 42.9/58.9 42.0/56.2CPI: Consumer price index (2000=100) j 100 122 ...Agricultural production index (2004-2006=100) ... 91 98k
Food production index (2004-2006=100) ... 91 98k
Index of industrial production (2005=100) l 100 79 65Balance of payments, current account (million US$) ... –952 –699Total trade Major trading partners 2015
(million US$) (% of exports) (% of imports)Exports 353.1 Serbia 22.1 Serbia 28.1Imports 2 050.2 Italy 12.6 China 10.3Balance –1 697.1 Areas nes 9.5m Bosnia-Herzegovina 6.5Social indicatorsPopulation growth rate (average annual %) 2010-2015 0.1Urban population (%) 2015 64.0Urban population growth rate (average annual %) 2010-2015 0.3Fertility rate, total (live births per woman) 2010-2015 1.7Life expectancy at birth (females/males, years) 2010-2015 78.2/73.8Total dependency ratio (Pop. aged 0-14 & 65+ per 100 pop. 15-64) 2015 48International migrant stock (000/% of total pop.) mid-2015 82.5/13.2Tourist arrivals at national borders (000) n 2014 1 350Refugees and others of concern to UNHCR mid-2015 19 812Infant mortality rate (per 1 000 live births) 2010-2015 4Health: Total expenditure (% of GDP) 2014 6.4Health: Physicians (per 1 000 pop.) 2013 2.1Education: Primary gross enrolment ratio (f/m per 100 pop.) 2014 95.4/95.2o
Education: Secondary gross enrolment ratio (f/m per 100 pop.) 2014 91.8/91.0o
Intentional homicide rate (per 100 000 pop.) 2014 3.2Seats held by women in national parliaments (%) 2016 17.3Environment and infrastructureMobile-cellular subscriptions (per 100 inhabitants) 2014 163.0Individuals using the Internet (%) 2014 61.0i
Patents: Resident filings (per million pop.) 2014 21.0Threatened species 2015 85Forested area (% of land area) 2013 61.5i
CO2 emission estimates (000 tons/tons per capita) 2013 2 248/3.6Energy production, primary (Petajoules) 2013 32Energy supply per capita (Gigajoules) 2013 67.0Terrestrial and marine areas protected (% of total area) 2014 2.7Population using improved drinking water sources (urban/rural, %) 2015 100.0/99.2Population using improved sanitation facilities (urban/rural, %) 2015 98.0/92.2Net Official Development Assistance received (% of GNI) 2014 2.2a 2014. b Excludes irrigation canals and landscaping care. c Excludes publishing activities, includesirrigation canals. d Excludes repair of personal and household goods. e Includes publishing activities andlandscaping care. f Data classified according to ISIC Rev. 3. g Break in the time series. h Persons aged15 to 64 years. i Estimate. j Index base: 2005=100. k 2013. l Excluding water and waste management.m See technical notes. n Arrivals of non-resident tourists in all types of tourism accommodation estab-lishments. o 2012.
World Statistics Pocketbook 137

MontserratRegion Caribbean Surface area (sq km) 103Population (proj., 000) 5 Pop. density (per sq km) 51.5Capital city Brades Estate Capital city pop. (000) 0.5 a
Currency East Caribbean Dollar (XCD)Economic indicators 2005 2010 2014GDP: Gross domestic product (million current US$) 49 56 63GDP growth rate (annual %, const. 2005 prices) 3.1 –2.8 3.7GDP per capita (current US$) 10 231.1 11 207.6 12 384.2Economy: Agriculture (% of GVA) 0.9 1.1 1.5Economy: Industry (% of GVA) 16.7 13.3 13.9Economy: Services and other activity (% of GVA) 82.5 85.7 84.6Unemployment (% of labour force) 9.5bc ... 5.6d
Labour force participation (female/male pop. %) 80.6/89.2c ... ...Agricultural production index (2004-2006=100) 98 99 101e
Food production index (2004-2006=100) 98 99 101e
Balance of payments, current account (million US$) –16 –19 –27e
Total trade Major trading partners 2015(million US$)a (% of exports)a (% of imports)a
Exports 3.4 United States 29.4 United States 72.8Imports 41.9 France 23.5 Trinidad and Tobago 6.0Balance –38.5 Saint Kitts and Nevis 23.5 United Kingdom 4.1Social indicatorsPopulation growth rate (average annual %) 2010-2015 0.7Urban population (%) 2015 9.0Urban population growth rate (average annual %) 2010-2015 0.7Total dependency ratio (Pop. aged 0-14 & 65+ per 100 pop. 15-64) 2015 51d
International migrant stock (000/% of total pop.) mid-2015 1.4/26.4Tourist arrivals at national borders (000) 2014 9Environment and infrastructureMobile-cellular subscriptions (per 100 inhabitants) 2014 87.6f
Individuals using the Internet (%) 2014 54.6f
Threatened species 2015 54Forested area (% of land area) 2013 25.0f
CO2 emission estimates (000 tons/tons per capita) 2013 51/10.3Energy supply per capita (Gigajoules) 2013 153.0Terrestrial and marine areas protected (% of total area) 2014 2.5Population using improved drinking water sources (urban/rural, %) 2015 99.0/99.0a 2014. b Break in the time series. c 2001. d 2011. e 2013. f Estimate.
138 World Statistics Pocketbook

MoroccoRegion Northern Africa Surface area (sq km) 446 550Population (proj., 000) 34 817 Pop. density (per sq km) 78.0Capital city Rabat Capital city pop. (000) 1 967 a
Currency Moroccan Dirham (MAD) UN membership date 12 November 1956Economic indicators 2005 2010 2014GDP: Gross domestic product (million current US$) b 62 545 93 217 110 009GDP growth rate (annual %, const. 2005 prices) b 3.0 3.8 2.4GDP per capita (current US$) b 2 058.4 2 903.3 3 243.1Economy: Agriculture (% of GVA) b 13.1 14.4 13.0Economy: Industry (% of GVA) b 29.0 28.6 29.3Economy: Services and other activity (% of GVA) b 58.0 56.9 57.7Employment: Agriculture (% of employed) c 45.4 40.2d 39.2de
Employment: Industry (% of employed) c 19.5 22.1d 21.4de
Employment: Services and other (% of employed) c 35.0 37.6d 39.4de
Unemployment (% of labour force) f 11.0 9.1 9.9Labour force participation (female/male pop. %) f 27.7/77.2 25.7/75.2 25.2/74.2CPI: Consumer price index (2000=100) 107 108dg 113g
Agricultural production index (2004-2006=100) 93 126 134h
Food production index (2004-2006=100) 93 127 135h
Balance of payments, current account (million US$) 949 –4 209 –8 692h
Total trade Major trading partners 2015(million US$)i (% of exports)i (% of imports)i
Exports 23 815.8 Spain 21.9 France 13.5Imports 46 191.7 France 20.8 Spain 13.3Balance –22 375.9 Brazil 4.6 China 7.6Social indicatorsPopulation growth rate (average annual %) 2010-2015 1.4Urban population (%) 2015 60.2Urban population growth rate (average annual %) 2010-2015 2.3Fertility rate, total (live births per woman) 2010-2015 2.6Life expectancy at birth (females/males, years) 2010-2015 74.6/72.6Total dependency ratio (Pop. aged 0-14 & 65+ per 100 pop. 15-64) 2015 50International migrant stock (000/% of total pop.) mid-2015 88.5/0.3j
Tourist arrivals at national borders (000) 2014 10 283k
Refugees and others of concern to UNHCR mid-2015 4 360Infant mortality rate (per 1 000 live births) 2010-2015 26Health: Total expenditure (% of GDP) 2014 5.9Education: Primary gross enrolment ratio (f/m per 100 pop.) 2014 113.4/118.7Education: Secondary gross enrolment ratio (f/m per 100 pop.) 2014 63.5/74.4e
Education: Tertiary gross enrolment ratio (f/m per 100 pop.) 2014 24.1/25.0Intentional homicide rate (per 100 000 pop.) 2014 1.0Seats held by women in national parliaments (%) 2016 17.0Environment and infrastructureMobile-cellular subscriptions (per 100 inhabitants) 2014 131.7l
Individuals using the Internet (%) 2014 56.8mn
Patents: Resident filings (per million pop.) 2014 11.0Threatened species 2015 176Forested area (% of land area) 2013 12.7f
CO2 emission estimates (000 tons/tons per capita) 2013 58 558/1.7Energy production, primary (Petajoules) 2013 82Energy supply per capita (Gigajoules) 2013 23.0Terrestrial and marine areas protected (% of total area) 2014 20.1Population using improved drinking water sources (urban/rural, %) 2015 98.7/65.3Population using improved sanitation facilities (urban/rural, %) 2015 84.1/65.5Net Official Development Assistance received (% of GNI) 2014 2.2a Including Salé and Temara. b Including Western Sahara. c Data classified according to ISIC Rev. 3. dBreak in the time series. e 2012. f Estimate. g Index base: 2006=100. h 2013. i 2014. j Refers to foreigncitizens. k Including nationals residing abroad. l Data as at the end of December. m Users in the last 3months. n Population age 5 to 75.
World Statistics Pocketbook 139

MozambiqueRegion Eastern Africa Surface area (sq km) 799 380Population (proj., 000) 28 751 Pop. density (per sq km) 36.6Capital city Maputo Capital city pop. (000) 1 187Currency Mozambique Metical (MZN) UN membership date 16 September 1975Economic indicators 2005 2010 2014GDP: Gross domestic product (million current US$) 7 724 10 154 17 081GDP growth rate (annual %, const. 2005 prices) 8.7 6.7 7.2GDP per capita (current US$) 365.6 417.5 627.6Economy: Agriculture (% of GVA) a 25.4 28.9 24.6Economy: Industry (% of GVA) b 20.7 18.6 20.6Economy: Services and other activity (% of GVA) cd 53.9 52.5 54.7Employment: Agriculture (% of employed) e 80.5f ... ...Employment: Industry (% of employed) e 3.4f ... ...Employment: Services and other (% of employed) e 16.1f ... ...Unemployment (% of labour force) g 21.6 22.2 22.4Labour force participation (female/male pop. %) g 87.0/82.8 84.3/78.7 82.6/75.3CPI: Consumer price index (2000=100) 173 287 350Agricultural production index (2004-2006=100) 96 148 157h
Food production index (2004-2006=100) 95 153 161h
Balance of payments, current account (million US$) –761 –1 679 –5 797Total trade Major trading partners 2015
(million US$) (% of exports) (% of imports)Exports 3 196.1 Netherlands 29.8 South Africa 30.1Imports 7 907.6 South Africa 18.3 China 12.5Balance –4 711.5 India 10.6 Netherlands 7.3Social indicatorsPopulation growth rate (average annual %) 2010-2015 2.8Urban population (%) 2015 32.2Urban population growth rate (average annual %) 2010-2015 3.3Fertility rate, total (live births per woman) 2010-2015 5.5Life expectancy at birth (females/males, years) 2010-2015 56.2/52.9Total dependency ratio (Pop. aged 0-14 & 65+ per 100 pop. 15-64) 2015 95International migrant stock (000/% of total pop.) mid-2015 222.9/0.8i
Tourist arrivals at national borders (000) 2014 1 661j
Refugees and others of concern to UNHCR mid-2015 18 816Infant mortality rate (per 1 000 live births) 2010-2015 64Health: Total expenditure (% of GDP) 2014 7.0k
Health: Physicians (per 1 000 pop.) 2013 <l
Education: Government expenditure (% of GDP) 2014 6.5h
Education: Primary gross enrolment ratio (f/m per 100 pop.) 2014 99.6/108.6Education: Secondary gross enrolment ratio (f/m per 100 pop.) 2014 23.5/25.5Education: Tertiary gross enrolment ratio (f/m per 100 pop.) 2014 5.0/7.0Seats held by women in national parliaments (%) 2016 39.6Environment and infrastructureMobile-cellular subscriptions (per 100 inhabitants) 2014 69.7Individuals using the Internet (%) 2014 5.9g
Threatened species 2015 268Forested area (% of land area) 2013 48.8g
CO2 emission estimates (000 tons/tons per capita) 2013 4 019/0.2Energy production, primary (Petajoules) 2013 734Energy supply per capita (Gigajoules) 2013 18.0Terrestrial and marine areas protected (% of total area) 2014 10.9Population using improved drinking water sources (urban/rural, %) 2015 80.6/37.0Population using improved sanitation facilities (urban/rural, %) 2015 42.4/10.1Net Official Development Assistance received (% of GNI) 2014 12.9a Excludes irrigation canals and landscaping care. b Excludes publishing activities, includes irrigationcanals. c Excludes repair of personal and household goods. d Includes publishing activities and land-scaping care. e Data classified according to ISIC Rev. 2. f 2003. g Estimate. h 2013. i Including refugees.j The data of all the border posts of the country are used. k Data revision. l 2012.
140 World Statistics Pocketbook

MyanmarRegion South-Eastern Asia Surface area (sq km) 676 577Population (proj., 000) 54 363 Pop. density (per sq km) 83.2Capital city Nay Pyi Taw Capital city pop. (000) 1 030Currency Kyat (MMK) UN membership date 19 April 1948Economic indicators 2005 2010 2014GDP: Gross domestic product (million current US$) 11 931 41 445 66 478GDP growth rate (annual %, const. 2005 prices) 13.6 10.2 8.7GDP per capita (current US$) 238.7 801.1 1 244.0Economy: Agriculture (% of GVA) a 46.7 36.9 27.9Economy: Industry (% of GVA) a 17.5 26.5 34.5Economy: Services and other activity (% of GVA) ab 35.8 36.7 37.7Unemployment (% of labour force) c 5.4 4.2 4.6Labour force participation (female/male pop. %) c 75.4/80.8 75.8/81.5 75.3/81.2CPI: Consumer price index (2000=100) 297 156de 166ef
Agricultural production index (2004-2006=100) 99 135 132g
Food production index (2004-2006=100) 99 135 131g
Balance of payments, current account (million US$) 582 1 574 –1 641Social indicatorsPopulation growth rate (average annual %) 2010-2015 0.8Urban population (%) 2015 34.1Urban population growth rate (average annual %) 2010-2015 2.5Fertility rate, total (live births per woman) 2010-2015 2.3Life expectancy at birth (females/males, years) 2010-2015 67.7/63.6Total dependency ratio (Pop. aged 0-14 & 65+ per 100 pop. 15-64) 2015 49International migrant stock (000/% of total pop.) mid-2015 73.3/0.1h
Tourist arrivals at national borders (000) 2014 3 081Refugees and others of concern to UNHCR mid-2015 1 466 501i
Infant mortality rate (per 1 000 live births) 2010-2015 46Health: Total expenditure (% of GDP) 2014 2.3Health: Physicians (per 1 000 pop.) 2013 0.6f
Education: Primary gross enrolment ratio (f/m per 100 pop.) 2014 98.3/101.0Education: Secondary gross enrolment ratio (f/m per 100 pop.) 2014 52.0/50.7Education: Tertiary gross enrolment ratio (f/m per 100 pop.) 2014 14.9/12.1f
Intentional homicide rate (per 100 000 pop.) 2014 2.5f
Seats held by women in national parliaments (%) 2016 9.9Environment and infrastructureMobile-cellular subscriptions (per 100 inhabitants) 2014 49.5Individuals using the Internet (%) 2014 2.1c
Threatened species 2015 301Forested area (% of land area) 2013 46.1c
CO2 emission estimates (000 tons/tons per capita) 2013 12 603/0.2Energy production, primary (Petajoules) 2013 972Energy supply per capita (Gigajoules) 2013 13.0Terrestrial and marine areas protected (% of total area) 2014 4.1Population using improved drinking water sources (urban/rural, %) 2015 92.7/74.4Population using improved sanitation facilities (urban/rural, %) 2015 84.3/77.1Net Official Development Assistance received (% of GNI) 2014 2.2a At producers' prices. b Includes gas and water. c Estimate. d Break in the time series. e Index base:2006=100. f 2012. g 2013. h Refers to foreign citizens. i Stateless persons population refers to personswithout citizeship in Rakhine State only.
World Statistics Pocketbook 141
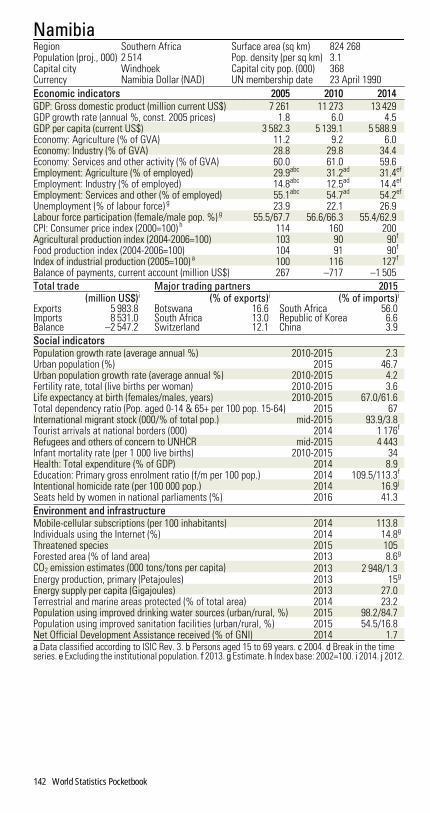
NamibiaRegion Southern Africa Surface area (sq km) 824 268Population (proj., 000) 2 514 Pop. density (per sq km) 3.1Capital city Windhoek Capital city pop. (000) 368Currency Namibia Dollar (NAD) UN membership date 23 April 1990Economic indicators 2005 2010 2014GDP: Gross domestic product (million current US$) 7 261 11 273 13 429GDP growth rate (annual %, const. 2005 prices) 1.8 6.0 4.5GDP per capita (current US$) 3 582.3 5 139.1 5 588.9Economy: Agriculture (% of GVA) 11.2 9.2 6.0Economy: Industry (% of GVA) 28.8 29.8 34.4Economy: Services and other activity (% of GVA) 60.0 61.0 59.6Employment: Agriculture (% of employed) 29.9abc 31.2ad 31.4ef
Employment: Industry (% of employed) 14.8abc 12.5ad 14.4ef
Employment: Services and other (% of employed) 55.1abc 54.7ad 54.2ef
Unemployment (% of labour force) g 23.9 22.1 26.9Labour force participation (female/male pop. %) g 55.5/67.7 56.6/66.3 55.4/62.9CPI: Consumer price index (2000=100) h 114 160 200Agricultural production index (2004-2006=100) 103 90 90f
Food production index (2004-2006=100) 104 91 90f
Index of industrial production (2005=100) a 100 116 127f
Balance of payments, current account (million US$) 267 –717 –1 505Total trade Major trading partners 2015
(million US$)i (% of exports)i (% of imports)i
Exports 5 983.8 Botswana 16.6 South Africa 56.0Imports 8 531.0 South Africa 13.0 Republic of Korea 6.6Balance –2 547.2 Switzerland 12.1 China 3.9Social indicatorsPopulation growth rate (average annual %) 2010-2015 2.3Urban population (%) 2015 46.7Urban population growth rate (average annual %) 2010-2015 4.2Fertility rate, total (live births per woman) 2010-2015 3.6Life expectancy at birth (females/males, years) 2010-2015 67.0/61.6Total dependency ratio (Pop. aged 0-14 & 65+ per 100 pop. 15-64) 2015 67International migrant stock (000/% of total pop.) mid-2015 93.9/3.8Tourist arrivals at national borders (000) 2014 1 176f
Refugees and others of concern to UNHCR mid-2015 4 443Infant mortality rate (per 1 000 live births) 2010-2015 34Health: Total expenditure (% of GDP) 2014 8.9Education: Primary gross enrolment ratio (f/m per 100 pop.) 2014 109.5/113.3f
Intentional homicide rate (per 100 000 pop.) 2014 16.9j
Seats held by women in national parliaments (%) 2016 41.3Environment and infrastructureMobile-cellular subscriptions (per 100 inhabitants) 2014 113.8Individuals using the Internet (%) 2014 14.8g
Threatened species 2015 105Forested area (% of land area) 2013 8.6g
CO2 emission estimates (000 tons/tons per capita) 2013 2 948/1.3Energy production, primary (Petajoules) 2013 15g
Energy supply per capita (Gigajoules) 2013 27.0Terrestrial and marine areas protected (% of total area) 2014 23.2Population using improved drinking water sources (urban/rural, %) 2015 98.2/84.7Population using improved sanitation facilities (urban/rural, %) 2015 54.5/16.8Net Official Development Assistance received (% of GNI) 2014 1.7a Data classified according to ISIC Rev. 3. b Persons aged 15 to 69 years. c 2004. d Break in the timeseries. e Excluding the institutional population. f 2013. g Estimate. h Index base: 2002=100. i 2014. j 2012.
142 World Statistics Pocketbook

NauruRegion Oceania-Micronesia Surface area (sq km) 21Population (proj., 000) 10 Pop. density (per sq km) 513.2Capital city Yaren Capital city pop. (000) 10 ab
Currency Australian Dollar (AUD) UN membership date 14 September 1999Economic indicators 2005 2010 2014GDP: Gross domestic product (million current US$) 26 62 182GDP growth rate (annual %, const. 2005 prices) –12.1 20.1 12.6GDP per capita (current US$) 2 599.4 6 233.9 17 856.8Economy: Agriculture (% of GVA) c 7.8 4.2 3.2Economy: Industry (% of GVA) c –6.5d 47.4 58.2Economy: Services and other activity (% of GVA) c 98.7 48.4 38.6Unemployment (% of labour force) 22.7ef ... 23.0gh
Labour force participation (female/male pop. %) 69.6/86.8ef ... 49.3/78.9h
Agricultural production index (2004-2006=100) 101 104 106i
Food production index (2004-2006=100) 101 104 106i
Social indicatorsPopulation growth rate (average annual %) 2010-2015 0.4Urban population (%) 2015 100.0Urban population growth rate (average annual %) 2010-2015 0.2Fertility rate, total (live births per woman) 2010-2015 4.3j
Life expectancy at birth (females/males, years) 2010-2015 63.2/57.5k
Total dependency ratio (Pop. aged 0-14 & 65+ per 100 pop. 15-64) 2015 73il
International migrant stock (000/% of total pop.) mid-2015 3.2/31.1m
Refugees and others of concern to UNHCR mid-2015 1 322Infant mortality rate (per 1 000 live births) 2010-2015 33k
Health: Total expenditure (% of GDP) 2014 3.3Education: Primary gross enrolment ratio (f/m per 100 pop.) 2014 100.4/109.5n
Education: Secondary gross enrolment ratio (f/m per 100 pop.) 2014 83.4/81.9n
Intentional homicide rate (per 100 000 pop.) 2014 1.3o
Seats held by women in national parliaments (%) 2016 5.3Environment and infrastructureMobile-cellular subscriptions (per 100 inhabitants) 2014 67.8o
Threatened species 2015 80Forested area (% of land area) 2013 0.0n
CO2 emission estimates (000 tons/tons per capita) 2013 44/4.3Energy supply per capita (Gigajoules) 2013 60.0n
Population using improved drinking water sources (urban/rural, %) 2015 96.5/...Population using improved sanitation facilities (urban/rural, %) 2015 65.6/...a 2014. b Refers to Nauru. c At producers' prices. d Negative value is due to negative value added inelectricity and utilities and a sharp decline in mining. e Persons aged 16 years and over. f 2002. g Breakin the time series. h 2011. i 2013. j 2009 - 2011. k 2007 - 2011. l Data calculated on ages 0-15 years and60 years and older as a ratio of 16-59 years old. m Refers to foreign citizens. n Estimate. o 2012.
World Statistics Pocketbook 143

NepalRegion Southern Asia Surface area (sq km) 147 181Population (proj., 000) 28 851 Pop. density (per sq km) 201.3Capital city Kathmandu Capital city pop. (000) 1 183 a
Currency Nepalese Rupee (NPR) UN membership date 14 December 1955Economic indicators 2005 2010 2014GDP: Gross domestic product (million current US$) 8 259 16 281 19 489GDP growth rate (annual %, const. 2005 prices) 3.1 4.8 5.4GDP per capita (current US$) 323.8 605.8 691.7Economy: Agriculture (% of GVA) 35.2 35.4 32.5Economy: Industry (% of GVA) 17.1 15.1 15.1Economy: Services and other activity (% of GVA) 47.7 49.5 52.4Employment: Agriculture (% of employed) 65.7bcde 73.9bcfg 66.5h
Employment: Industry (% of employed) 13.4bcde 10.8bcfg 11.2h
Employment: Services and other (% of employed) 20.7bcde 15.3bcfg 22.4h
Unemployment (% of labour force) i 2.8 2.6 3.1Labour force participation (female/male pop. %) i 80.4/89.0 79.8/87.5 79.7/86.8CPI: Consumer price index (2000=100) 123 193j 271Agricultural production index (2004-2006=100) 100 114 132h
Food production index (2004-2006=100) 100 114 132h
Balance of payments, current account (million US$) 153 –128 488Total trade Major trading partners 2015
(million US$) (% of exports) (% of imports)Exports 660.2 India 63.5 India 60.6Imports 6 612.1 United States 10.7 China 13.9Balance –5 951.9 Germany 4.1 United Arab Emirates 4.0Social indicatorsPopulation growth rate (average annual %) 2010-2015 1.2Urban population (%) 2015 18.6Urban population growth rate (average annual %) 2010-2015 3.2Fertility rate, total (live births per woman) 2010-2015 2.3Life expectancy at birth (females/males, years) 2010-2015 70.5/67.6Total dependency ratio (Pop. aged 0-14 & 65+ per 100 pop. 15-64) 2015 62International migrant stock (000/% of total pop.) mid-2015 518.3/1.8k
Tourist arrivals at national borders (000) 2014 790l
Refugees and others of concern to UNHCR mid-2015 36 753m
Infant mortality rate (per 1 000 live births) 2010-2015 32Health: Total expenditure (% of GDP) 2014 5.8Education: Government expenditure (% of GDP) 2014 4.7Education: Primary gross enrolment ratio (f/m per 100 pop.) 2014 140.6/130.1Education: Secondary gross enrolment ratio (f/m per 100 pop.) 2014 68.9/64.9i
Education: Tertiary gross enrolment ratio (f/m per 100 pop.) 2014 15.3/18.7h
Intentional homicide rate (per 100 000 pop.) 2014 2.9n
Seats held by women in national parliaments (%) 2016 29.5Environment and infrastructureMobile-cellular subscriptions (per 100 inhabitants) 2014 82.5Individuals using the Internet (%) 2014 15.4i
Patents: Resident filings (per million pop.) 2014 1.0h
Threatened species 2015 105Forested area (% of land area) 2013 25.4i
CO2 emission estimates (000 tons/tons per capita) 2013 6 502/0.2Energy production, primary (Petajoules) 2013 386Energy supply per capita (Gigajoules) 2013 16.0Terrestrial and marine areas protected (% of total area) 2014 22.9Population using improved drinking water sources (urban/rural, %) 2015 90.9/91.8Population using improved sanitation facilities (urban/rural, %) 2015 56.0/43.5Net Official Development Assistance received (% of GNI) 2014 4.4a Refers to the municipality. b Data classified according to ISIC Rev. 3. c Break in the time series. dPersons aged 10 years and over. e 2001. f Excluding the institutional population. g 2008. h 2013. i Estimate.j Series linked to former series. k Including refugees. l Including arrivals from India. m Various studiesestimate that a large number of individuals lack citizenship certificates in Nepal. While these individualsare not all necessarily stateless, UNHCR has been working closely with the Government of Nepal andpartners to address this situation. n 2011.
144 World Statistics Pocketbook

NetherlandsRegion Western Europe Surface area (sq km) 37 354Population (proj., 000) 16 980 Pop. density (per sq km) 503.6Capital city Amsterdam a Capital city pop. (000) 1 091Currency Euro (EUR) UN membership date 10 December 1945Economic indicators 2005 2010 2014GDP: Gross domestic product (million current US$) 678 517 836 390 879 319GDP growth rate (annual %, const. 2005 prices) 2.2 1.4 1.0GDP per capita (current US$) 41 546.1 50 289.3 52 129.4Economy: Agriculture (% of GVA) b 2.0 1.9 1.8Economy: Industry (% of GVA) c 24.0 22.1 21.2Economy: Services and other activity (% of GVA) de 74.0 76.0 77.0Employment: Agriculture (% of employed) 3.0f 2.6 2.0Employment: Industry (% of employed) 19.7f 16.1 15.1Employment: Services and other (% of employed) 72.6f 71.9 75.3Unemployment (% of labour force) g 4.7 4.5 6.8Labour force participation (female/male pop. %) g 56.7/72.5 58.1/71.2 57.7/70.6CPI: Consumer price index (2000=100) 113 122 133Agricultural production index (2004-2006=100) 100 111 113h
Food production index (2004-2006=100) 100 112 113h
Index of industrial production (2005=100) 100 107 103Balance of payments, current account (million US$) 41 599 61 820 93 401Total trade Major trading partners 2015
(million US$) (% of exports) (% of imports)Exports 471 957.7 Germany 23.2 Germany 17.2Imports 419 077.2 Belgium 10.4 Belgium 9.8Balance 52 880.5 United Kingdom 8.9 China 9.1Social indicatorsPopulation growth rate (average annual %) 2010-2015 0.4Urban population (%) 2015 90.5Urban population growth rate (average annual %) 2010-2015 1.1Fertility rate, total (live births per woman) 2010-2015 1.8Life expectancy at birth (females/males, years) 2010-2015 83.1/79.4Total dependency ratio (Pop. aged 0-14 & 65+ per 100 pop. 15-64) 2015 53International migrant stock (000/% of total pop.) mid-2015 1 979.5/11.7Tourist arrivals at national borders (000) i 2014 13 925Refugees and others of concern to UNHCR mid-2015 92 542j
Infant mortality rate (per 1 000 live births) 2010-2015 3Health: Total expenditure (% of GDP) 2014 10.9Education: Government expenditure (% of GDP) 2014 5.6h
Education: Primary gross enrolment ratio (f/m per 100 pop.) 2014 104.1/104.8Education: Secondary gross enrolment ratio (f/m per 100 pop.) 2014 129.8/134.4gh
Education: Tertiary gross enrolment ratio (f/m per 100 pop.) 2014 82.5/74.7k
Intentional homicide rate (per 100 000 pop.) 2014 0.7h
Seats held by women in national parliaments (%) 2016 37.3Environment and infrastructureMobile-cellular subscriptions (per 100 inhabitants) 2014 116.4lm
Individuals using the Internet (%) 2014 93.2n
Patents: Resident filings (per million pop.) 2014 543.0Threatened species 2015 29Forested area (% of land area) 2013 11.1g
CO2 emission estimates (000 tons/tons per capita) 2013 169 973/10.1Energy production, primary (Petajoules) 2013 2 908Energy supply per capita (Gigajoules) 2013 190.0Terrestrial and marine areas protected (% of total area) 2014 18.1Population using improved drinking water sources (urban/rural, %) 2015 100.0/100.0Population using improved sanitation facilities (urban/rural, %) 2015 97.5/99.9Net Official Development Assistance disbursed (% of GNI) o 2014 0.6a Amsterdam is the capital and The Hague is the seat of government. b Excludes irrigation canals andlandscaping care. c Excludes publishing activities, includes irrigation canals. d Excludes repair of personaland household goods. e Includes publishing activities and landscaping care. f Data classified accordingto ISIC Rev. 3. g Estimate. h 2013. i Arrivals of non-resident tourists in all types of tourism accommodationestablishments. j Refugee population relates to the end of 2014. k 2012. l Excludes data-only subscriptions.m Data refers to the third quarter. n Population age 16-74. o Development Assistance Committee member(OECD).
World Statistics Pocketbook 145

New CaledoniaRegion Oceania-Melanesia Surface area (sq km) 18 575Population (proj., 000) 266 Pop. density (per sq km) 14.6Capital city Nouméa Capital city pop. (000) 181 a
Currency CFP Franc (XPF)Economic indicators 2005 2010 2014GDP: Gross domestic product (million current US$) 6 236 9 355 10 234GDP growth rate (annual %, const. 2005 prices) 3.6 6.9 3.1GDP per capita (current US$) 27 269.8 37 976.1 39 391.5Economy: Agriculture (% of GVA) 1.7 1.4 1.4Economy: Industry (% of GVA) 26.6 25.6 24.9Economy: Services and other activity (% of GVA) 71.7 73.1 73.7Employment: Agriculture (% of employed) bc 3.1 2.7d ...Employment: Industry (% of employed) bc 21.3 22.4d ...Employment: Services and other (% of employed) bc 42.7 43.0d ...Unemployment (% of labour force) e 16.9 15.1 15.6Labour force participation (female/male pop. %) e 47.8/69.9 45.9/67.3 45.6/66.9CPI: Consumer price index (2000=100) f 108 119 126Agricultural production index (2004-2006=100) 100 98 103g
Food production index (2004-2006=100) 100 98 103g
Balance of payments, current account (million US$) –112 –1 360 –1 469Total trade Major trading partners 2015
(million US$)a (% of exports)a (% of imports)a
Exports 1 619.0 China 19.1 France 22.3Imports 3 315.2 Japan 15.3 Singapore 17.5Balance –1 696.2 Australia 11.7 Australia 8.9Social indicatorsPopulation growth rate (average annual %) 2010-2015 1.3Urban population (%) 2015 70.2Urban population growth rate (average annual %) 2010-2015 2.2Fertility rate, total (live births per woman) 2010-2015 2.1Life expectancy at birth (females/males, years) 2010-2015 79.3/73.6Total dependency ratio (Pop. aged 0-14 & 65+ per 100 pop. 15-64) 2015 48International migrant stock (000/% of total pop.) mid-2015 64.3/24.4Tourist arrivals at national borders (000) 2014 107h
Infant mortality rate (per 1 000 live births) 2010-2015 13Environment and infrastructureMobile-cellular subscriptions (per 100 inhabitants) 2014 93.6e
Individuals using the Internet (%) 2014 70.0e
Threatened species 2015 493Forested area (% of land area) 2013 45.9e
CO2 emission estimates (000 tons/tons per capita) 2013 3 861/15.0Energy production, primary (Petajoules) 2013 2Energy supply per capita (Gigajoules) 2013 200.0Terrestrial and marine areas protected (% of total area) 2014 91.0Population using improved drinking water sources (urban/rural, %) 2015 98.5/98.5Population using improved sanitation facilities (urban/rural, %) 2015 100.0/100.0a 2014. b Data classified according to ISIC Rev. 3. c Persons aged 14 years and over. d 2008. e Estimate.f Nouméa. g 2013. h Including nationals residing abroad.
146 World Statistics Pocketbook

New ZealandRegion Oceania Surface area (sq km) 268 107Population (proj., 000) 4 565 Pop. density (per sq km) 17.3Capital city Wellington Capital city pop. (000) 383Currency New Zealand Dollar (NZD) UN membership date 24 October 1945Economic indicators 2005 2010 2014GDP: Gross domestic product (million current US$) 114 722 146 583 198 652GDP growth rate (annual %, const. 2005 prices) 3.4 1.4 3.2GDP per capita (current US$) 27 746.2 33 550.5 44 189.2Economy: Agriculture (% of GVA) 4.9 7.2 6.6Economy: Industry (% of GVA) 25.8 23.0 23.0Economy: Services and other activity (% of GVA) 69.3 69.9 70.5Employment: Agriculture (% of employed) 7.1a 6.8b 6.4c
Employment: Industry (% of employed) 22.2a 20.9b 20.2c
Employment: Services and other (% of employed) 70.6a 71.9b 73.0c
Unemployment (% of labour force) d 3.8 6.5 5.8Labour force participation (female/male pop. %) d 60.3/74.8 61.5/74.2 62.6/73.4CPI: Consumer price index (2000=100) 113 130 140Agricultural production index (2004-2006=100) 99 104 108c
Food production index (2004-2006=100) 99 105 110c
Index of industrial production (2005=100) e 100 96 97Balance of payments, current account (million US$) –8 025 –3 430 –6 137Total trade Major trading partners 2015
(million US$) (% of exports) (% of imports)Exports 34 166.8 China 17.6 China 19.6Imports 36 333.7 Australia 17.0 Australia 11.9Balance –2 166.9 United States 11.8 United States 11.8Social indicatorsPopulation growth rate (average annual %) 2010-2015 0.7Urban population (%) 2015 86.3Urban population growth rate (average annual %) 2010-2015 1.1Fertility rate, total (live births per woman) 2010-2015 2.1Life expectancy at birth (females/males, years) 2010-2015 83.4/79.7Total dependency ratio (Pop. aged 0-14 & 65+ per 100 pop. 15-64) 2015 54International migrant stock (000/% of total pop.) mid-2015 1 039.7/23.0Tourist arrivals at national borders (000) 2014 2 772Refugees and others of concern to UNHCR mid-2015 1 600f
Infant mortality rate (per 1 000 live births) 2010-2015 4Health: Total expenditure (% of GDP) 2014 11.0Education: Government expenditure (% of GDP) 2014 6.4Education: Primary gross enrolment ratio (f/m per 100 pop.) 2014 98.5/98.8Education: Secondary gross enrolment ratio (f/m per 100 pop.) 2014 121.0/114.2Education: Tertiary gross enrolment ratio (f/m per 100 pop.) 2014 94.0/68.2Intentional homicide rate (per 100 000 pop.) 2014 0.9Seats held by women in national parliaments (%) 2016 31.4Environment and infrastructureMobile-cellular subscriptions (per 100 inhabitants) 2014 112.1dg
Individuals using the Internet (%) 2014 85.5d
Patents: Resident filings (per million pop.) 2014 363.0Threatened species 2015 197Forested area (% of land area) 2013 38.6d
CO2 emission estimates (000 tons/tons per capita) 2013 33 960/7.6Energy production, primary (Petajoules) 2013 739Energy supply per capita (Gigajoules) 2013 196.0Terrestrial and marine areas protected (% of total area) 2014 29.8Population using improved drinking water sources (urban/rural, %) 2015 100.0/100.0Net Official Development Assistance disbursed (% of GNI) h 2014 0.3a Data classified according to ISIC Rev. 3. b Break in the time series. c 2013. d Estimate. e Twelve monthsending 31 March of the year stated. f Refugee population relates to the end of 2014. g Data refers tosubscriptions active in the last 3 months (or 90 days). h Development Assistance Committee member(OECD).
World Statistics Pocketbook 147

NicaraguaRegion Central America Surface area (sq km) 130 373Population (proj., 000) 6 150 Pop. density (per sq km) 51.1Capital city Managua Capital city pop. (000) 956Currency Cordoba Oro (NIO) UN membership date 24 October 1945Economic indicators 2005 2010 2014GDP: Gross domestic product (million current US$) 6 321 8 741 11 806GDP growth rate (annual %, const. 2005 prices) 4.3 3.2 4.7GDP per capita (current US$) 1 175.1 1 523.5 1 963.1Economy: Agriculture (% of GVA) 17.7 18.8 20.5Economy: Industry (% of GVA) 23.0 24.3 25.7Economy: Services and other activity (% of GVA) 59.3 57.0 53.8Employment: Agriculture (% of employed) 28.9ab 32.2cde ...Employment: Industry (% of employed) 19.7ab 16.5cde ...Employment: Services and other (% of employed) 51.4ab 51.3cde ...Unemployment (% of labour force) f 5.6 8.0 5.6Labour force participation (female/male pop. %) f 43.7/80.4 46.8/80.6 48.9/80.2CPI: Consumer price index (2000=100) g 147 234h 308Agricultural production index (2004-2006=100) 104 118 138i
Food production index (2004-2006=100) 102 119 140i
Balance of payments, current account (million US$) –784d –780 –838Total trade Major trading partners 2015
(million US$)j (% of exports)j (% of imports)j
Exports 4 973.5 United States 48.4 United States 16.3Imports 5 746.4 Mexico 12.4 China 14.9Balance –772.9 Venezuela 7.8 Mexico 9.5Social indicatorsPopulation growth rate (average annual %) 2010-2015 1.2Urban population (%) 2015 58.8Urban population growth rate (average annual %) 2010-2015 2.0Fertility rate, total (live births per woman) 2010-2015 2.3Life expectancy at birth (females/males, years) 2010-2015 77.5/71.4Total dependency ratio (Pop. aged 0-14 & 65+ per 100 pop. 15-64) 2015 54International migrant stock (000/% of total pop.) mid-2015 40.3/0.7k
Tourist arrivals at national borders (000) 2014 1 330l
Refugees and others of concern to UNHCR mid-2015 391Infant mortality rate (per 1 000 live births) 2010-2015 20Health: Total expenditure (% of GDP) 2014 9.0Health: Physicians (per 1 000 pop.) 2013 0.9j
Intentional homicide rate (per 100 000 pop.) 2014 11.5m
Seats held by women in national parliaments (%) 2016 41.3Environment and infrastructureMobile-cellular subscriptions (per 100 inhabitants) 2014 114.6fn
Individuals using the Internet (%) 2014 17.6f
Patents: Resident filings (per million pop.) 2014 1.0m
Threatened species 2015 141Forested area (% of land area) 2013 25.9f
CO2 emission estimates (000 tons/tons per capita) 2013 4 569/0.8Energy production, primary (Petajoules) 2013 89Energy supply per capita (Gigajoules) 2013 25.0Terrestrial and marine areas protected (% of total area) 2014 22.0Population using improved drinking water sources (urban/rural, %) 2015 99.3/69.4Population using improved sanitation facilities (urban/rural, %) 2015 76.5/55.7Net Official Development Assistance received (% of GNI) 2014 3.7a Persons aged 10 years and over. b Data classified according to ISIC Rev. 2. c Data classified accordingto ISIC Rev. 3. d Break in the time series. e Persons aged 14 years and over. f Estimate. g Index base:1999=100. h Series linked to former series. i 2013. j 2014. k Including refugees. l Including nationalsresiding abroad. m 2012. n Includes inactive subscriptions.
148 World Statistics Pocketbook

NigerRegion Western Africa Surface area (sq km) 1 267 000Population (proj., 000) 20 715 Pop. density (per sq km) 16.4Capital city Niamey Capital city pop. (000) 1 090Currency CFA Franc (XOF) UN membership date 20 September 1960Economic indicators 2005 2010 2014GDP: Gross domestic product (million current US$) 3 369 5 719 8 169GDP growth rate (annual %, const. 2005 prices) 7.4 8.4 6.9GDP per capita (current US$) 249.8 351.0 427.4Economy: Agriculture (% of GVA) a 45.5 43.8 39.2Economy: Industry (% of GVA) b 11.8 16.7 20.9Economy: Services and other activity (% of GVA) cd 42.7 39.4 39.9Employment: Agriculture (% of employed) e 56.9 ... ...Employment: Industry (% of employed) e 11.1 ... ...Employment: Services and other (% of employed) e 31.1 ... ...Unemployment (% of labour force) f 3.1 2.4 2.7Labour force participation (female/male pop. %) f 39.2/90.7 39.8/90.1 40.2/89.5CPI: Consumer price index (2000=100) gh 114 128i 134Agricultural production index (2004-2006=100) 102 145 132j
Food production index (2004-2006=100) 102 145 132j
Balance of payments, current account (million US$) –312 –1 136 –1 150j
Total trade Major trading partners 2015(million US$)k (% of exports)k (% of imports)k
Exports 1 049.7 France 36.5 China 22.6Imports 2 151.1 Burkina Faso 15.7 France 14.6Balance –1 101.4 Nigeria 12.7 United States 5.3Social indicatorsPopulation growth rate (average annual %) 2010-2015 4.0Urban population (%) 2015 18.7Urban population growth rate (average annual %) 2010-2015 5.1Fertility rate, total (live births per woman) 2010-2015 7.6Life expectancy at birth (females/males, years) 2010-2015 61.6/59.9Total dependency ratio (Pop. aged 0-14 & 65+ per 100 pop. 15-64) 2015 113International migrant stock (000/% of total pop.) mid-2015 189.3/1.0l
Tourist arrivals at national borders (000) 2014 135Refugees and others of concern to UNHCR mid-2015 202 186Infant mortality rate (per 1 000 live births) 2010-2015 60Health: Total expenditure (% of GDP) 2014 5.8Education: Government expenditure (% of GDP) 2014 6.8Education: Primary gross enrolment ratio (f/m per 100 pop.) 2014 65.0/75.9Education: Secondary gross enrolment ratio (f/m per 100 pop.) 2014 15.6/22.1Education: Tertiary gross enrolment ratio (f/m per 100 pop.) 2014 0.9/2.6m
Intentional homicide rate (per 100 000 pop.) 2014 4.5m
Seats held by women in national parliaments (%) 2016 13.3Environment and infrastructureMobile-cellular subscriptions (per 100 inhabitants) 2014 44.4f
Individuals using the Internet (%) 2014 2.0f
Threatened species 2015 31Forested area (% of land area) 2013 0.9f
CO2 emission estimates (000 tons/tons per capita) 2013 1 962/0.1Energy production, primary (Petajoules) 2013 101Energy supply per capita (Gigajoules) 2013 5.0Terrestrial and marine areas protected (% of total area) 2014 17.6Population using improved drinking water sources (urban/rural, %) 2015 100.0/48.6Population using improved sanitation facilities (urban/rural, %) 2015 37.9/4.7Net Official Development Assistance received (% of GNI) 2014 11.4a Excludes irrigation canals and landscaping care. b Excludes publishing activities, includes irrigationcanals. c Excludes repair of personal and household goods. d Includes publishing activities and land-scaping care. e Data classified according to ISIC Rev. 2. f Estimate. g African population. h Niamey. iSeries linked to former series. j 2013. k 2014. l Including refugees. m 2012.
World Statistics Pocketbook 149

NigeriaRegion Western Africa Surface area (sq km) 923 768Population (proj., 000) 186 988 Pop. density (per sq km) 205.3Capital city Abuja Capital city pop. (000) 2 440Currency Naira (NGN) UN membership date 7 October 1960Economic indicators 2005 2010 2014GDP: Gross domestic product (million current US$) 180 502 369 062 568 499GDP growth rate (annual %, const. 2005 prices) 6.5 7.8 6.3GDP per capita (current US$) 1 292.9 2 315.0 3 203.2Economy: Agriculture (% of GVA) a 25.6 23.9 20.2Economy: Industry (% of GVA) b 23.7 25.3 25.0Economy: Services and other activity (% of GVA) cd 50.7 50.8 54.8Employment: Agriculture (% of employed) 44.6efg 48.6hi ...Employment: Industry (% of employed) 11.5efg 8.5hi ...Employment: Services and other (% of employed) 41.7efg 42.9hi ...Unemployment (% of labour force) j 7.3 7.3 4.8Labour force participation (female/male pop. %) j 47.6/62.1 47.9/63.2 48.3/63.8CPI: Consumer price index (2000=100) k 207 338l 493Agricultural production index (2004-2006=100) 100 104 110m
Food production index (2004-2006=100) 100 104 111m
Balance of payments, current account (million US$) 36 529 13 111 1 268Total trade Major trading partners 2015
(million US$)n (% of exports)n (% of imports)n
Exports 102 878.5 India 14.6 China 21.9Imports 46 532.3 Netherlands 10.2 United States 10.4Balance 56 346.2 Spain 9.3 Belgium 7.2Social indicatorsPopulation growth rate (average annual %) 2010-2015 2.7Urban population (%) 2015 47.8Urban population growth rate (average annual %) 2010-2015 4.7Fertility rate, total (live births per woman) 2010-2015 5.7Life expectancy at birth (females/males, years) 2010-2015 52.6/52.0Total dependency ratio (Pop. aged 0-14 & 65+ per 100 pop. 15-64) 2015 88International migrant stock (000/% of total pop.) mid-2015 1 199.1/0.7op
Tourist arrivals at national borders (000) 2014 600m
Refugees and others of concern to UNHCR mid-2015 1 510 205Infant mortality rate (per 1 000 live births) 2010-2015 76Health: Total expenditure (% of GDP) 2014 3.7q
Intentional homicide rate (per 100 000 pop.) 2014 10.1r
Seats held by women in national parliaments (%) 2016 5.6Environment and infrastructureMobile-cellular subscriptions (per 100 inhabitants) 2014 77.8Individuals using the Internet (%) 2014 42.7j
Threatened species 2015 333Forested area (% of land area) 2013 8.6j
CO2 emission estimates (000 tons/tons per capita) 2013 95 650/0.6Energy production, primary (Petajoules) 2013 10 668Energy supply per capita (Gigajoules) 2013 32.0Terrestrial and marine areas protected (% of total area) 2014 11.8Population using improved drinking water sources (urban/rural, %) 2015 80.8/57.3Population using improved sanitation facilities (urban/rural, %) 2015 32.8/25.4Net Official Development Assistance received (% of GNI) 2014 0.5a Excludes irrigation canals and landscaping care. b Excludes publishing activities, includes irrigationcanals. c Excludes repair of personal and household goods. d Includes publishing activities and land-scaping care. e Break in the time series. f Data classified according to ISIC Rev. 2. g 2004. h Data classifiedaccording to ISIC Rev. 3. i 2007. j Estimate. k Rural and urban areas. l Series linked to former series. m2013. n 2014. o Including refugees. p Refers to foreign citizens. q In 2014, a revised GDP series waspublished following a statistical rebasing exercise (the base year changed from 1990 to 2010). Nigeriahas emerged as Africa's largest economy, with a GDP increase of 89% for year 2013. r 2012.
150 World Statistics Pocketbook

NiueRegion Oceania-Polynesia Surface area (sq km) 260Population (proj., 000) 2 Pop. density (per sq km) 6.2Capital city Alofi Capital city pop. (000) 1 a
Currency New Zealand Dollar (NZD)Economic indicators 2005 2010 2014Employment: Agriculture (% of employed) b 4.8c ... ...Employment: Industry (% of employed) b 9.3c ... ...Employment: Services and other (% of employed) b 85.9c ... ...Unemployment (% of labour force) 9.7c ... ...Labour force participation (female/male pop. %) 74.8/76.7d ... ...CPI: Consumer price index (2000=100) 119 ... ...Agricultural production index (2004-2006=100) 101 93 92e
Food production index (2004-2006=100) 101 93 92e
Social indicatorsPopulation growth rate (average annual %) 2010-2015 –0.1Urban population (%) 2015 42.5Urban population growth rate (average annual %) 2010-2015 –0.9Fertility rate, total (live births per woman) 2010-2015 2.2f
Life expectancy at birth (females/males, years) 2010-2015 72.8/66.1f
Total dependency ratio (Pop. aged 0-14 & 65+ per 100 pop. 15-64) 2015 61g
International migrant stock (000/% of total pop.) mid-2015 0.6/34.6Tourist arrivals at national borders (000) 2014 7eh
Infant mortality rate (per 1 000 live births) 2010-2015 10f
Health: Total expenditure (% of GDP) 2014 7.5Education: Primary gross enrolment ratio (f/m per 100 pop.) 2014 125.3/127.4i
Intentional homicide rate (per 100 000 pop.) 2014 3.1j
Environment and infrastructureIndividuals using the Internet (%) 2014 91.6i
Threatened species 2015 50Forested area (% of land area) 2013 70.4i
CO2 emission estimates (000 tons/tons per capita) 2013 11/5.7Energy production, primary (Petajoules) 2013 0Energy supply per capita (Gigajoules) 2013 65.0i
Terrestrial and marine areas protected (% of total area) 2014 <Population using improved drinking water sources (urban/rural, %) 2015 98.4/98.6Population using improved sanitation facilities (urban/rural, %) 2015 100.0/100.0a 2014. b Data classified according to ISIC Rev. 3. c 2002. d 2001. e 2013. f 2006 - 2011. g 2010. h IncludingNiueans residing usually in New Zealand. i Estimate. j 2012.
World Statistics Pocketbook 151

Northern Mariana IslandsRegion Oceania-Micronesia Surface area (sq km) 457Population (proj., 000) 55 Pop. density (per sq km) 120.4Capital city Garapan Capital city pop. (000) 4 a
Currency US Dollar (USD)Economic indicators 2005 2010 2014Unemployment (% of labour force) b 6.5 11.2c ...Labour force participation (female/male pop. %) b 81.3/82.5d 66.6/77.6c ...CPI: Consumer price index (2000=100) 100e ... ...Social indicatorsPopulation growth rate (average annual %) 2010-2015 0.4Urban population (%) 2015 89.2Urban population growth rate (average annual %) 2010-2015 0.4Fertility rate, total (live births per woman) 2010-2015 2.2a
Life expectancy at birth (females/males, years) 2010-2015 77.6/75.0f
Total dependency ratio (Pop. aged 0-14 & 65+ per 100 pop. 15-64) 2015 42g
International migrant stock (000/% of total pop.) mid-2015 21.7/39.3Tourist arrivals at national borders (000) 2014 460h
Infant mortality rate (per 1 000 live births) 2010-2015 5i
Environment and infrastructureThreatened species 2015 99Forested area (% of land area) 2013 64.9j
Terrestrial and marine areas protected (% of total area) 2014 26.3Population using improved drinking water sources (urban/rural, %) 2015 97.5/97.5Population using improved sanitation facilities (urban/rural, %) 2015 79.7/79.7a 2010. b Persons aged 16 years and over. c Break in the time series. d 2003. e Saipan. f 2008 - 2012. g2011. h Arrivals by air. i 2006 - 2008. j Estimate.
152 World Statistics Pocketbook

NorwayRegion Northern Europe Surface area (sq km) 386 209 a
Population (proj., 000) 5 272 a Pop. density (per sq km) 14.4 a
Capital city Oslo Capital city pop. (000) 986Currency Norwegian Krone (NOK) UN membership date 27 November 1945Economic indicators 2005 2010 2014GDP: Gross domestic product (million current US$) 308 722 428 527 500 519GDP growth rate (annual %, const. 2005 prices) 2.6 0.6 2.2GDP per capita (current US$) 66 759.6 87 610.9 97 226.5Economy: Agriculture (% of GVA) b 1.6 1.8 1.7Economy: Industry (% of GVA) c 42.6 39.1 38.4Economy: Services and other activity (% of GVA) de 55.9 59.2 59.9Employment: Agriculture (% of employed) 3.2fg 2.4 2.1Employment: Industry (% of employed) 21.0fg 19.8 20.5Employment: Services and other (% of employed) 75.8fg 77.7 77.0Unemployment (% of labour force) h 4.4 3.5 3.5Labour force participation (female/male pop. %) h 60.3/70.5 61.4/70.0 61.2/68.6CPI: Consumer price index (2000=100) 109 122 130Agricultural production index (2004-2006=100) 99 102 102i
Food production index (2004-2006=100) 99 102 102i
Index of industrial production (2005=100) j 100 88 85Balance of payments, current account (million US$) 49 967 50 258 47 163Total trade Major trading partners 2015
(million US$)a (% of exports)a (% of imports)a
Exports 106 251.1 United Kingdom 21.8 Sweden 11.5Imports 76 979.3 Germany 17.6 Germany 11.3Balance 29 271.8 Netherlands 9.9 China 10.4Social indicatorsPopulation growth rate (average annual %) 2010-2015 1.3a
Urban population (%) 2015 80.5a
Urban population growth rate (average annual %) 2010-2015 1.4a
Fertility rate, total (live births per woman) 2010-2015 1.8a
Life expectancy at birth (females/males, years) 2010-2015 83.4/79.2a
Total dependency ratio (Pop. aged 0-14 & 65+ per 100 pop. 15-64) 2015 52a
International migrant stock (000/% of total pop.) mid-2015 741.8/14.2a
Tourist arrivals at national borders (000) 2014 4 855k
Refugees and others of concern to UNHCR mid-2015 54 925l
Infant mortality rate (per 1 000 live births) 2010-2015 3a
Health: Total expenditure (% of GDP) 2014 9.7Health: Physicians (per 1 000 pop.) 2013 4.3m
Education: Government expenditure (% of GDP) 2014 7.4m
Education: Primary gross enrolment ratio (f/m per 100 pop.) 2014 100.1/100.2Education: Secondary gross enrolment ratio (f/m per 100 pop.) 2014 110.6/114.5Education: Tertiary gross enrolment ratio (f/m per 100 pop.) 2014 91.4/63.0Intentional homicide rate (per 100 000 pop.) 2014 0.6Seats held by women in national parliaments (%) 2016 39.6Environment and infrastructureMobile-cellular subscriptions (per 100 inhabitants) 2014 116.5n
Individuals using the Internet (%) 2014 96.3o
Patents: Resident filings (per million pop.) 2014 318.0Threatened species 2015 44p
Forested area (% of land area) 2013 33.2h
CO2 emission estimates (000 tons/tons per capita) 2013 59 636/11.7Energy production, primary (Petajoules) 2013 8 133a
Energy supply per capita (Gigajoules) 2013 273.0a
Terrestrial and marine areas protected (% of total area) 2014 9.1Population using improved drinking water sources (urban/rural, %) 2015 100.0/100.0Population using improved sanitation facilities (urban/rural, %) 2015 98.0/98.3Net Official Development Assistance disbursed (% of GNI) q 2014 1.0a Including Svalbard and Jan Mayen Islands. b Excludes irrigation canals and landscaping care. c Excludespublishing activities, includes irrigation canals. d Excludes repair of personal and household goods. eIncludes publishing activities and landscaping care. f Data classified according to ISIC Rev. 3. g Break inthe time series. h Estimate. i 2013. j Excluding water and waste management. k Non-resident touristsstaying in all types of accommodation establishments. l Refugee population relates to the end of 2014.m 2012. n Data as at the end of June. o Population age 16-74. p Excluding overseas territories. q Devel-opment Assistance Committee member (OECD).
World Statistics Pocketbook 153
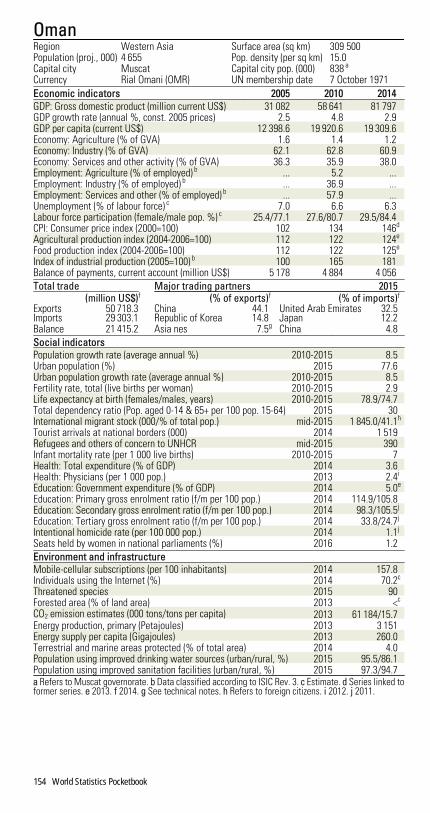
OmanRegion Western Asia Surface area (sq km) 309 500Population (proj., 000) 4 655 Pop. density (per sq km) 15.0Capital city Muscat Capital city pop. (000) 838 a
Currency Rial Omani (OMR) UN membership date 7 October 1971Economic indicators 2005 2010 2014GDP: Gross domestic product (million current US$) 31 082 58 641 81 797GDP growth rate (annual %, const. 2005 prices) 2.5 4.8 2.9GDP per capita (current US$) 12 398.6 19 920.6 19 309.6Economy: Agriculture (% of GVA) 1.6 1.4 1.2Economy: Industry (% of GVA) 62.1 62.8 60.9Economy: Services and other activity (% of GVA) 36.3 35.9 38.0Employment: Agriculture (% of employed) b ... 5.2 ...Employment: Industry (% of employed) b ... 36.9 ...Employment: Services and other (% of employed) b ... 57.9 ...Unemployment (% of labour force) c 7.0 6.6 6.3Labour force participation (female/male pop. %) c 25.4/77.1 27.6/80.7 29.5/84.4CPI: Consumer price index (2000=100) 102 134 146d
Agricultural production index (2004-2006=100) 112 122 124e
Food production index (2004-2006=100) 112 122 125e
Index of industrial production (2005=100) b 100 165 181Balance of payments, current account (million US$) 5 178 4 884 4 056Total trade Major trading partners 2015
(million US$)f (% of exports)f (% of imports)f
Exports 50 718.3 China 44.1 United Arab Emirates 32.5Imports 29 303.1 Republic of Korea 14.8 Japan 12.2Balance 21 415.2 Asia nes 7.5g China 4.8Social indicatorsPopulation growth rate (average annual %) 2010-2015 8.5Urban population (%) 2015 77.6Urban population growth rate (average annual %) 2010-2015 8.5Fertility rate, total (live births per woman) 2010-2015 2.9Life expectancy at birth (females/males, years) 2010-2015 78.9/74.7Total dependency ratio (Pop. aged 0-14 & 65+ per 100 pop. 15-64) 2015 30International migrant stock (000/% of total pop.) mid-2015 1 845.0/41.1h
Tourist arrivals at national borders (000) 2014 1 519Refugees and others of concern to UNHCR mid-2015 390Infant mortality rate (per 1 000 live births) 2010-2015 7Health: Total expenditure (% of GDP) 2014 3.6Health: Physicians (per 1 000 pop.) 2013 2.4i
Education: Government expenditure (% of GDP) 2014 5.0e
Education: Primary gross enrolment ratio (f/m per 100 pop.) 2014 114.9/105.8Education: Secondary gross enrolment ratio (f/m per 100 pop.) 2014 98.3/105.5j
Education: Tertiary gross enrolment ratio (f/m per 100 pop.) 2014 33.8/24.7j
Intentional homicide rate (per 100 000 pop.) 2014 1.1j
Seats held by women in national parliaments (%) 2016 1.2Environment and infrastructureMobile-cellular subscriptions (per 100 inhabitants) 2014 157.8Individuals using the Internet (%) 2014 70.2c
Threatened species 2015 90Forested area (% of land area) 2013 <c
CO2 emission estimates (000 tons/tons per capita) 2013 61 184/15.7Energy production, primary (Petajoules) 2013 3 151Energy supply per capita (Gigajoules) 2013 260.0Terrestrial and marine areas protected (% of total area) 2014 4.0Population using improved drinking water sources (urban/rural, %) 2015 95.5/86.1Population using improved sanitation facilities (urban/rural, %) 2015 97.3/94.7a Refers to Muscat governorate. b Data classified according to ISIC Rev. 3. c Estimate. d Series linked toformer series. e 2013. f 2014. g See technical notes. h Refers to foreign citizens. i 2012. j 2011.
154 World Statistics Pocketbook

PakistanRegion Southern Asia Surface area (sq km) 796 095Population (proj., 000) 192 827 Pop. density (per sq km) 250.1Capital city Islamabad Capital city pop. (000) 1 365Currency Pakistan Rupee (PKR) UN membership date 30 September 1947Economic indicators 2005 2010 2014GDP: Gross domestic product (million current US$) 117 708 174 508 251 255GDP growth rate (annual %, const. 2005 prices) 7.7 1.6 5.4GDP per capita (current US$) 767.6 1 026.3 1 357.8Economy: Agriculture (% of GVA) a 24.3 24.3 25.1Economy: Industry (% of GVA) b 21.1 20.6 21.3Economy: Services and other activity (% of GVA) cd 54.6 55.1 53.6Employment: Agriculture (% of employed) 43.0ef 45.0gh 43.5Employment: Industry (% of employed) 20.3ef 20.9gh 22.5Employment: Services and other (% of employed) 36.6ef 34.2gh 34.0Unemployment (% of labour force) i 7.1 5.3 5.6Labour force participation (female/male pop. %) i 19.3/84.1 23.9/82.8 24.1/82.1CPI: Consumer price index (2000=100) 129 234 316Agricultural production index (2004-2006=100) 100 110 95j
Food production index (2004-2006=100) 101 113 94j
Balance of payments, current account (million US$) –3 606h –1 354 –3 544Total trade Major trading partners 2015
(million US$) (% of exports) (% of imports)Exports 22 089.0 United States 16.6 China 25.0Imports 43 989.6 China 8.8 United Arab Emirates 13.0Balance –21 900.6 Afghanistan 7.8 Saudi Arabia 6.8Social indicatorsPopulation growth rate (average annual %) 2010-2015 2.1Urban population (%) 2015 38.8Urban population growth rate (average annual %) 2010-2015 2.8Fertility rate, total (live births per woman) 2010-2015 3.7Life expectancy at birth (females/males, years) 2010-2015 66.8/65.0Total dependency ratio (Pop. aged 0-14 & 65+ per 100 pop. 15-64) 2015 65International migrant stock (000/% of total pop.) mid-2015 3 629.0/1.9k
Tourist arrivals at national borders (000) 2014 966l
Refugees and others of concern to UNHCR mid-2015 3 439 965Infant mortality rate (per 1 000 live births) 2010-2015 70Health: Total expenditure (% of GDP) 2014 2.6mn
Education: Government expenditure (% of GDP) 2014 2.5Education: Primary gross enrolment ratio (f/m per 100 pop.) 2014 85.8/100.7Education: Secondary gross enrolment ratio (f/m per 100 pop.) 2014 36.6/46.3Education: Tertiary gross enrolment ratio (f/m per 100 pop.) 2014 10.7/10.1Intentional homicide rate (per 100 000 pop.) 2014 7.8l
Seats held by women in national parliaments (%) 2016 20.6Environment and infrastructureMobile-cellular subscriptions (per 100 inhabitants) 2014 73.3o
Individuals using the Internet (%) 2014 13.8i
Patents: Resident filings (per million pop.) 2014 1.0Threatened species 2015 129Forested area (% of land area) 2013 2.0i
CO2 emission estimates (000 tons/tons per capita) 2013 153 369/0.8Energy production, primary (Petajoules) 2013 2 009Energy supply per capita (Gigajoules) 2013 16.0Terrestrial and marine areas protected (% of total area) 2014 8.6Population using improved drinking water sources (urban/rural, %) 2015 93.9/89.9Population using improved sanitation facilities (urban/rural, %) 2015 83.1/51.1Net Official Development Assistance received (% of GNI) 2014 1.4a Excludes irrigation canals and landscaping care. b Excludes publishing activities, includes irrigationcanals. c Excludes repair of personal and household goods. d Includes publishing activities and land-scaping care. e Persons aged 10 years and over. f Data classified according to ISIC Rev. 2. g Data classifiedaccording to ISIC Rev. 3. h Break in the time series. i Estimate. j 2013. k Including refugees. l 2012. mData revision. n Total level of government expenditure on health increased due to the inclusion of localgovernment expenditure, as well as a more-comprehensive estimation of regional expenditure on health.o Data as at the end of December.
World Statistics Pocketbook 155

PalauRegion Oceania-Micronesia Surface area (sq km) 459Population (proj., 000) 22 Pop. density (per sq km) 46.7Capital city Melekeok Capital city pop. (000) 12 ab
Currency US Dollar (USD) UN membership date 15 December 1994Economic indicators 2005 2010 2014GDP: Gross domestic product (million current US$) 180 185 234GDP growth rate (annual %, const. 2005 prices) –0.5 –7.2 –0.1GDP per capita (current US$) 9 038.3 9 049.8 11 067.9Economy: Agriculture (% of GVA) c 4.3 4.6 4.3Economy: Industry (% of GVA) d 17.6 9.9 8.6Economy: Services and other activity (% of GVA) ef 78.2 85.5 87.1Employment: Agriculture (% of employed) ... 2.4ghi ...Employment: Industry (% of employed) ... 11.8ghi ...Employment: Services and other (% of employed) ... 85.9ghi ...Unemployment (% of labour force) h 4.2 ... ...Labour force participation (female/male pop. %) h 58.1/75.4 ... ...Balance of payments, current account (million US$) –40j –19 –48Total trade Major trading partners 2015
(million US$)a (% of exports)a (% of imports)a
Exports 11.4 Japan 40.4 United States 33.2Imports 165.0 United States 38.6 Singapore 19.7Balance –153.6 Areas nes 12.3k Japan 12.2Social indicatorsPopulation growth rate (average annual %) 2010-2015 0.8Urban population (%) 2015 87.1Urban population growth rate (average annual %) 2010-2015 1.7Fertility rate, total (live births per woman) 2010-2015 1.7l
Life expectancy at birth (females/males, years) 2010-2015 72.1/66.3m
Total dependency ratio (Pop. aged 0-14 & 65+ per 100 pop. 15-64) 2015 42n
International migrant stock (000/% of total pop.) mid-2015 5.7/26.6Tourist arrivals at national borders (000) 2014 141o
Refugees and others of concern to UNHCR mid-2015 1Infant mortality rate (per 1 000 live births) 2010-2015 12l
Health: Total expenditure (% of GDP) 2014 9.0Education: Primary gross enrolment ratio (f/m per 100 pop.) 2014 111.8/116.5p
Education: Secondary gross enrolment ratio (f/m per 100 pop.) 2014 116.9/110.5p
Education: Tertiary gross enrolment ratio (f/m per 100 pop.) 2014 76.1/49.1pq
Intentional homicide rate (per 100 000 pop.) 2014 3.1r
Seats held by women in national parliaments (%) 2016 0.0Environment and infrastructureMobile-cellular subscriptions (per 100 inhabitants) 2014 90.6Threatened species 2015 177Forested area (% of land area) 2013 87.6p
CO2 emission estimates (000 tons/tons per capita) 2013 224/10.7Energy production, primary (Petajoules) 2013 0p
Energy supply per capita (Gigajoules) 2013 152.0p
Terrestrial and marine areas protected (% of total area) 2014 0.2Population using improved drinking water sources (urban/rural, %) 2015 97.0/...Population using improved sanitation facilities (urban/rural, %) 2015 100.0/100.0Net Official Development Assistance received (% of GNI) 2014 9.6a 2014. b Refers to Koror. c Excludes irrigation canals and landscaping care. d Excludes publishingactivities, includes irrigation canals. e Excludes repair of personal and household goods. f Includes pub-lishing activities and landscaping care. g Data classified according to ISIC Rev. 3. h Persons aged 16 yearsand over. i 2008. j Break in the time series. k See technical notes. l 2010. m 2001 - 2005. n 2005. o Airarrivals (Palau International Airport). p Estimate. q 2013. r 2012.
156 World Statistics Pocketbook

PanamaRegion Central America Surface area (sq km) 75 320Population (proj., 000) 3 990 Pop. density (per sq km) 53.7Capital city Panama City Capital city pop. (000) 1 673 a
Currency Balboa (PAB) UN membership date 13 November 1945Economic indicators 2005 2010 2014GDP: Gross domestic product (million current US$) 15 465 28 917 49 166GDP growth rate (annual %, const. 2005 prices) 7.2 5.8 6.1GDP per capita (current US$) 4 659.0 7 987.1 12 712.5Economy: Agriculture (% of GVA) 6.8 3.9 3.3Economy: Industry (% of GVA) 16.3 20.3 22.7Economy: Services and other activity (% of GVA) 76.9 75.8 74.1Employment: Agriculture (% of employed) 15.7b 17.4bc 16.7cde
Employment: Industry (% of employed) 17.2b 18.7bc 18.2cde
Employment: Services and other (% of employed) 67.1b 63.9bc 65.0cde
Unemployment (% of labour force) f 9.8 6.5 4.8Labour force participation (female/male pop. %) f 48.0/81.1 49.0/82.0 50.5/80.5CPI: Consumer price index (2000=100) gh 103 127 148i
Agricultural production index (2004-2006=100) 99 107 116i
Food production index (2004-2006=100) 99 107 117i
Balance of payments, current account (million US$) –1 064 –3 113 –4 794Total trade Major trading partners 2015
(million US$) (% of exports) (% of imports)Exports 695.7 United States 19.7 United States 25.9Imports 12 129.0 Germany 13.2 Free zones 16.0j
Balance –11 433.3 Costa Rica 7.7 China 9.6Social indicatorsPopulation growth rate (average annual %) 2010-2015 1.6Urban population (%) 2015 66.6Urban population growth rate (average annual %) 2010-2015 2.1Fertility rate, total (live births per woman) 2010-2015 2.5Life expectancy at birth (females/males, years) 2010-2015 80.5/74.3Total dependency ratio (Pop. aged 0-14 & 65+ per 100 pop. 15-64) 2015 53International migrant stock (000/% of total pop.) mid-2015 184.7/4.7Tourist arrivals at national borders (000) 2014 1 745Refugees and others of concern to UNHCR mid-2015 19 343Infant mortality rate (per 1 000 live births) 2010-2015 15Health: Total expenditure (% of GDP) 2014 8.0Health: Physicians (per 1 000 pop.) 2013 1.7Education: Government expenditure (% of GDP) 2014 3.3k
Education: Primary gross enrolment ratio (f/m per 100 pop.) 2014 103.7/106.9i
Education: Secondary gross enrolment ratio (f/m per 100 pop.) 2014 77.9/73.2i
Education: Tertiary gross enrolment ratio (f/m per 100 pop.) 2014 46.5/31.2i
Intentional homicide rate (per 100 000 pop.) 2014 17.4i
Seats held by women in national parliaments (%) 2016 18.3Environment and infrastructureMobile-cellular subscriptions (per 100 inhabitants) 2014 158.1f
Individuals using the Internet (%) 2014 44.9Patents: Resident filings (per million pop.) 2014 3.0Threatened species 2015 373Forested area (% of land area) 2013 62.6f
CO2 emission estimates (000 tons/tons per capita) 2013 10 363/2.7Energy production, primary (Petajoules) 2013 31Energy supply per capita (Gigajoules) 2013 42.0Terrestrial and marine areas protected (% of total area) 2014 5.2Population using improved drinking water sources (urban/rural, %) 2015 97.7/88.6Population using improved sanitation facilities (urban/rural, %) 2015 83.5/58.0Net Official Development Assistance received (% of GNI) 2014 –0.5a Refers to the metropolitan area of Panama City. b Data classified according to ISIC Rev. 3. c Break inthe time series. d Excluding the institutional population. e 2012. f Estimate. g Urban areas. h Index base:2003=100. i 2013. j See technical notes. k 2011.
World Statistics Pocketbook 157

Papua New GuineaRegion Oceania-Melanesia Surface area (sq km) 462 840Population (proj., 000) 7 776 Pop. density (per sq km) 17.2Capital city Port Moresby Capital city pop. (000) 345Currency Kina (PGK) UN membership date 10 October 1975Economic indicators 2005 2010 2014GDP: Gross domestic product (million current US$) 4 866 9 707 16 576GDP growth rate (annual %, const. 2005 prices) 3.9 7.6 8.4GDP per capita (current US$) 799.5 1 417.6 2 220.9Economy: Agriculture (% of GVA) 34.0 31.5 25.6Economy: Industry (% of GVA) 44.3 45.1 49.1Economy: Services and other activity (% of GVA) 21.7 23.4 25.4Unemployment (% of labour force) a 3.4 3.6 3.3Labour force participation (female/male pop. %) a 71.3/74.4 70.5/72.9 69.6/71.0CPI: Consumer price index (2000=100) 146 189 217b
Agricultural production index (2004-2006=100) 100 112 118b
Food production index (2004-2006=100) 99 112 118b
Balance of payments, current account (million US$) 539 –914 1 932Total trade Major trading partners 2015
(million US$)c (% of exports)c (% of imports)c
Exports 4 517.7 Australia 35.9 Australia 34.4Imports 8 340.7 Japan 11.7 Singapore 14.3Balance –3 823.0 Germany 7.0 China 6.9Social indicatorsPopulation growth rate (average annual %) 2010-2015 2.1Urban population (%) 2015 13.0Urban population growth rate (average annual %) 2010-2015 2.1Fertility rate, total (live births per woman) 2010-2015 3.8Life expectancy at birth (females/males, years) 2010-2015 64.5/60.3Total dependency ratio (Pop. aged 0-14 & 65+ per 100 pop. 15-64) 2015 67International migrant stock (000/% of total pop.) mid-2015 25.8/0.3de
Tourist arrivals at national borders (000) 2014 182Refugees and others of concern to UNHCR mid-2015 9 910Infant mortality rate (per 1 000 live births) 2010-2015 48Health: Total expenditure (% of GDP) 2014 4.3Education: Primary gross enrolment ratio (f/m per 100 pop.) 2014 109.3/119.8c
Education: Secondary gross enrolment ratio (f/m per 100 pop.) 2014 34.6/45.8c
Seats held by women in national parliaments (%) 2016 2.7Environment and infrastructureMobile-cellular subscriptions (per 100 inhabitants) 2014 44.9a
Individuals using the Internet (%) 2014 9.4a
Threatened species 2015 478Forested area (% of land area) 2013 74.1a
CO2 emission estimates (000 tons/tons per capita) 2013 6 073/0.8Energy production, primary (Petajoules) 2013 99Energy supply per capita (Gigajoules) 2013 20.0Terrestrial and marine areas protected (% of total area) 2014 0.7Population using improved drinking water sources (urban/rural, %) 2015 88.0/32.8Population using improved sanitation facilities (urban/rural, %) 2015 56.4/13.3a Estimate. b 2013. c 2012. d Including refugees. e Refers to foreign citizens.
158 World Statistics Pocketbook

ParaguayRegion South America Surface area (sq km) 406 752Population (proj., 000) 6 725 Pop. density (per sq km) 16.9Capital city Asunción Capital city pop. (000) 2 356 a
Currency Guarani (PYG) UN membership date 24 October 1945Economic indicators 2005 2010 2014GDP: Gross domestic product (million current US$) 8 735 20 048 30 985GDP growth rate (annual %, const. 2005 prices) 2.1 13.1 4.4GDP per capita (current US$) 1 507.2 3 228.3 4 728.7Economy: Agriculture (% of GVA) 19.6 22.5 20.9Economy: Industry (% of GVA) 34.8 30.1 28.8Economy: Services and other activity (% of GVA) 45.7 47.4 50.3Employment: Agriculture (% of employed) b 32.4c 26.8defg 22.8dfg
Employment: Industry (% of employed) b 15.7c 18.8defg 18.9dfg
Employment: Services and other (% of employed) b 51.9c 54.3defg 58.2dfg
Unemployment (% of labour force) h 5.8 5.7 6.0Labour force participation (female/male pop. %) h 54.3/85.7 54.6/84.6 58.0/84.5CPI: Consumer price index (2000=100) i 150 212 256Agricultural production index (2004-2006=100) 97 137 157j
Food production index (2004-2006=100) 98 142 163j
Index of industrial production (2005=100) d 100 110 125Balance of payments, current account (million US$) –68 –57 –117Total trade Major trading partners 2015
(million US$) (% of exports) (% of imports)Exports 8 361.2 Brazil 31.6 Brazil 25.0Imports 10 291.2 Russian Federation 9.1 China 23.5Balance –1 930.0 Argentina 8.1 Argentina 14.9Social indicatorsPopulation growth rate (average annual %) 2010-2015 1.3Urban population (%) 2015 59.7Urban population growth rate (average annual %) 2010-2015 2.1Fertility rate, total (live births per woman) 2010-2015 2.6Life expectancy at birth (females/males, years) 2010-2015 74.9/70.7Total dependency ratio (Pop. aged 0-14 & 65+ per 100 pop. 15-64) 2015 57International migrant stock (000/% of total pop.) mid-2015 156.5/2.4Tourist arrivals at national borders (000) 2014 649kl
Refugees and others of concern to UNHCR mid-2015 200Infant mortality rate (per 1 000 live births) 2010-2015 29Health: Total expenditure (% of GDP) 2014 9.8m
Health: Physicians (per 1 000 pop.) 2013 1.2n
Education: Government expenditure (% of GDP) 2014 5.0n
Education: Primary gross enrolment ratio (f/m per 100 pop.) 2014 104.3/107.6n
Education: Secondary gross enrolment ratio (f/m per 100 pop.) 2014 79.1/74.2n
Intentional homicide rate (per 100 000 pop.) 2014 8.8Seats held by women in national parliaments (%) 2016 15.0Environment and infrastructureMobile-cellular subscriptions (per 100 inhabitants) 2014 105.6Individuals using the Internet (%) 2014 43.0op
Threatened species 2015 58Forested area (% of land area) 2013 40.2h
CO2 emission estimates (000 tons/tons per capita) 2013 4 972/0.8Energy production, primary (Petajoules) 2013 335Energy supply per capita (Gigajoules) 2013 35.0Terrestrial and marine areas protected (% of total area) 2014 6.5Population using improved drinking water sources (urban/rural, %) 2015 100.0/95.0Population using improved sanitation facilities (urban/rural, %) 2015 95.5/78.4Net Official Development Assistance received (% of GNI) 2014 0.2a Refers to the metropolitan area of Asunción. b Persons aged 10 years and over. c Data classifiedaccording to ISIC Rev. 2. d Data classified according to ISIC Rev. 3. e Break in the time series. f Excludingthe institutional population. g Excluding some areas. h Estimate. i Asunción. j 2013. k E/D cards in theSilvio Petirossi airport and passenger counts at the national border crossings. l Excluding nationalsresiding abroad and crew members. m A study of Health Accounts is in the process (2012-2013). n 2012.o Population age 10+. p Users in the last 3 months.
World Statistics Pocketbook 159

PeruRegion South America Surface area (sq km) 1 285 216Population (proj., 000) 31 774 Pop. density (per sq km) 24.8Capital city Lima Capital city pop. (000) 9 897 a
Currency Sol (PEN) UN membership date 31 October 1945Economic indicators 2005 2010 2014GDP: Gross domestic product (million current US$) 76 080 147 070 201 809GDP growth rate (annual %, const. 2005 prices) 6.3 8.5 2.4GDP per capita (current US$) 2 755.5 5 006.9 6 515.6Economy: Agriculture (% of GVA) b 7.5 7.5 7.3Economy: Industry (% of GVA) c 37.7 39.2 35.7Economy: Services and other activity (% of GVA) de 54.7 53.2 57.0Employment: Agriculture (% of employed) fgh 10.8 ... ...Employment: Industry (% of employed) fh 18.6g 23.9ij 22.9j
Employment: Services and other (% of employed) fh 70.6g 74.7ij 75.9j
Unemployment (% of labour force) k 5.2 4.0 3.3Labour force participation (female/male pop. %) k 57.5/78.9 65.6/84.3 65.5/82.5CPI: Consumer price index (2000=100) lm 110 126n 144Agricultural production index (2004-2006=100) 99 128 144o
Food production index (2004-2006=100) 100 130 147o
Index of industrial production (2005=100) f 100 131 142o
Balance of payments, current account (million US$) 1 148 –3 782 –8 031Total trade Major trading partners 2015
(million US$) (% of exports) (% of imports)Exports 33 244.9 China 22.1 China 22.7Imports 38 104.6 United States 15.1 United States 20.6Balance –4 859.7 Switzerland 8.1 Brazil 5.1Social indicatorsPopulation growth rate (average annual %) 2010-2015 1.3Urban population (%) 2015 78.6Urban population growth rate (average annual %) 2010-2015 1.7Fertility rate, total (live births per woman) 2010-2015 2.5Life expectancy at birth (females/males, years) 2010-2015 76.8/71.5Total dependency ratio (Pop. aged 0-14 & 65+ per 100 pop. 15-64) 2015 53International migrant stock (000/% of total pop.) mid-2015 90.9/0.3Tourist arrivals at national borders (000) 2014 3 215pqr
Refugees and others of concern to UNHCR mid-2015 1 773Infant mortality rate (per 1 000 live births) 2010-2015 19Health: Total expenditure (% of GDP) 2014 5.5s
Health: Physicians (per 1 000 pop.) 2013 1.1t
Education: Government expenditure (% of GDP) 2014 3.7Education: Primary gross enrolment ratio (f/m per 100 pop.) 2014 101.4/101.4Education: Secondary gross enrolment ratio (f/m per 100 pop.) 2014 95.5/95.7Intentional homicide rate (per 100 000 pop.) 2014 6.7Seats held by women in national parliaments (%) 2016 22.3Environment and infrastructureMobile-cellular subscriptions (per 100 inhabitants) 2014 102.9u
Individuals using the Internet (%) 2014 40.2v
Patents: Resident filings (per million pop.) 2014 3.0Threatened species 2015 643Forested area (% of land area) 2013 58.1k
CO2 emission estimates (000 tons/tons per capita) 2013 57 154/1.9Energy production, primary (Petajoules) 2013 982Energy supply per capita (Gigajoules) 2013 28.0Terrestrial and marine areas protected (% of total area) 2014 19.4Population using improved drinking water sources (urban/rural, %) 2015 91.5/69.3Population using improved sanitation facilities (urban/rural, %) 2015 82.5/53.2Net Official Development Assistance received (% of GNI) 2014 0.2a Refers to Gran Lima. b Excludes irrigation canals and landscaping care. c Excludes publishing activities,includes irrigation canals. d Excludes repair of personal and household goods. e Includes publishingactivities and landscaping care. f Data classified according to ISIC Rev. 3. g Urban areas. h Persons aged14 years and over. i Break in the time series. j Main city or metropolitan area. k Estimate. l Metropolitanareas. m Lima. n Series linked to former series. o 2013. p Including nationals residing abroad. q Provisionaldata. r Including tourists with identity document other than a passport. s Data revision. t 2012. u Excludesdata-only subscriptions. v Population age 6+.
160 World Statistics Pocketbook

PhilippinesRegion South-Eastern Asia Surface area (sq km) 300 000Population (proj., 000) 102 250 Pop. density (per sq km) 342.9Capital city Manila Capital city pop. (000) 12 946 a
Currency Philippine Peso (PHP) UN membership date 24 October 1945Economic indicators 2005 2010 2014GDP: Gross domestic product (million current US$) 103 072 199 591 284 582GDP growth rate (annual %, const. 2005 prices) 4.8 7.6 6.1GDP per capita (current US$) 1 196.5 2 145.2 2 870.5Economy: Agriculture (% of GVA) b 12.7 12.3 11.3Economy: Industry (% of GVA) c 33.9 32.6 31.2Economy: Services and other activity (% of GVA) de 53.5 55.1 57.5Employment: Agriculture (% of employed) 36.0fg 33.2fhi 30.4Employment: Industry (% of employed) 15.6fg 15.0fhi 15.9Employment: Services and other (% of employed) 48.5fg 51.8fhi 53.6Unemployment (% of labour force) j 7.7 7.4 6.6Labour force participation (female/male pop. %) j 49.8/80.0 50.2/79.6 50.4/78.8CPI: Consumer price index (2000=100) 130 166 192Agricultural production index (2004-2006=100) 100 112 120k
Food production index (2004-2006=100) 100 113 120k
Balance of payments, current account (million US$) 1 990h 7 179 10 917Total trade Major trading partners 2015
(million US$) (% of exports) (% of imports)Exports 58 648.1 Japan 21.1 China 16.4Imports 70 153.5 United States 15.0 United States 10.9Balance –11 505.4 China 10.9 Japan 9.6Social indicatorsPopulation growth rate (average annual %) 2010-2015 1.6Urban population (%) 2015 44.4Urban population growth rate (average annual %) 2010-2015 1.3Fertility rate, total (live births per woman) 2010-2015 3.0Life expectancy at birth (females/males, years) 2010-2015 71.6/64.7Total dependency ratio (Pop. aged 0-14 & 65+ per 100 pop. 15-64) 2015 58International migrant stock (000/% of total pop.) mid-2015 211.9/0.2lm
Tourist arrivals at national borders (000) 2014 4 833n
Refugees and others of concern to UNHCR mid-2015 386 163Infant mortality rate (per 1 000 live births) 2010-2015 23Health: Total expenditure (% of GDP) 2014 4.7Education: Primary gross enrolment ratio (f/m per 100 pop.) 2014 116.9/116.8k
Education: Secondary gross enrolment ratio (f/m per 100 pop.) 2014 92.7/84.4k
Education: Tertiary gross enrolment ratio (f/m per 100 pop.) 2014 40.3/31.4Intentional homicide rate (per 100 000 pop.) 2014 9.9Seats held by women in national parliaments (%) 2016 27.2Environment and infrastructureMobile-cellular subscriptions (per 100 inhabitants) 2014 111.2Individuals using the Internet (%) 2014 39.7j
Patents: Resident filings (per million pop.) 2014 3.0Threatened species 2015 767Forested area (% of land area) 2013 25.4j
CO2 emission estimates (000 tons/tons per capita) 2013 98 239/1.0Energy production, primary (Petajoules) 2013 935Energy supply per capita (Gigajoules) 2013 18.0Terrestrial and marine areas protected (% of total area) 2014 2.4Population using improved drinking water sources (urban/rural, %) 2015 93.7/90.3Population using improved sanitation facilities (urban/rural, %) 2015 77.9/70.8Net Official Development Assistance received (% of GNI) 2014 0.2a Refers to the National Capital Region. b Excludes irrigation canals and landscaping care. c Excludespublishing activities, includes irrigation canals. d Excludes repair of personal and household goods. eIncludes publishing activities and landscaping care. f Data classified according to ISIC Rev. 3. g Excludingregular military living in barracks. h Break in the time series. i Nonstandard population coverage. j Esti-mate. k 2013. l Including refugees. m Refers to foreign citizens. n Including nationals residing abroad.
World Statistics Pocketbook 161

PolandRegion Eastern Europe Surface area (sq km) 311 888Population (proj., 000) 38 593 Pop. density (per sq km) 126.0Capital city Warsaw Capital city pop. (000) 1 722Currency Zloty (PLN) UN membership date 24 October 1945Economic indicators 2005 2010 2014GDP: Gross domestic product (million current US$) 304 412 479 243 544 959GDP growth rate (annual %, const. 2005 prices) 3.6 3.7 3.3GDP per capita (current US$) 7 914.3 12 423.8 14 110.8Economy: Agriculture (% of GVA) a 3.3 2.9 2.9Economy: Industry (% of GVA) b 32.1 33.3 32.5Economy: Services and other activity (% of GVA) cd 64.6 63.8 64.6Employment: Agriculture (% of employed) 16.5e 12.6 11.2Employment: Industry (% of employed) 29.7e 30.6 30.8Employment: Services and other (% of employed) 53.8e 56.7 57.9Unemployment (% of labour force) f 17.7 9.6 9.0Labour force participation (female/male pop. %) f 47.5/62.5 48.3/64.3 49.2/65.4CPI: Consumer price index (2000=100) 115 131 143Agricultural production index (2004-2006=100) 99 101 106g
Food production index (2004-2006=100) 99 101 106g
Index of industrial production (2005=100) 100 134 154Balance of payments, current account (million US$) –7 981 –25 875 –11 124Total trade Major trading partners 2015
(million US$) (% of exports) (% of imports)Exports 194 461.2 Germany 26.9 Germany 22.6Imports 189 696.5 United Kingdom 6.8 China 11.8Balance 4 764.7 Czech Republic 6.5 Russian Federation 7.6Social indicatorsPopulation growth rate (average annual %) 2010-2015 <Urban population (%) 2015 60.5Urban population growth rate (average annual %) 2010-2015 –0.1Fertility rate, total (live births per woman) 2010-2015 1.4Life expectancy at birth (females/males, years) 2010-2015 81.1/73.1Total dependency ratio (Pop. aged 0-14 & 65+ per 100 pop. 15-64) 2015 44International migrant stock (000/% of total pop.) mid-2015 619.4/1.6Tourist arrivals at national borders (000) 2014 16 000Refugees and others of concern to UNHCR mid-2015 29 036h
Infant mortality rate (per 1 000 live births) 2010-2015 5Health: Total expenditure (% of GDP) 2014 6.4Health: Physicians (per 1 000 pop.) 2013 2.2i
Education: Government expenditure (% of GDP) 2014 4.8i
Education: Primary gross enrolment ratio (f/m per 100 pop.) 2014 101.4/101.2g
Education: Secondary gross enrolment ratio (f/m per 100 pop.) 2014 106.7/110.6g
Education: Tertiary gross enrolment ratio (f/m per 100 pop.) 2014 86.9/56.1g
Intentional homicide rate (per 100 000 pop.) 2014 0.7Seats held by women in national parliaments (%) 2016 27.4Environment and infrastructureMobile-cellular subscriptions (per 100 inhabitants) 2014 156.5f
Individuals using the Internet (%) 2014 66.6j
Patents: Resident filings (per million pop.) 2014 116.0Threatened species 2015 51Forested area (% of land area) 2013 30.7f
CO2 emission estimates (000 tons/tons per capita) 2013 302 333/7.8Energy production, primary (Petajoules) 2013 2 969Energy supply per capita (Gigajoules) 2013 107.0Terrestrial and marine areas protected (% of total area) 2014 29.3Population using improved drinking water sources (urban/rural, %) 2015 99.3/96.9Population using improved sanitation facilities (urban/rural, %) 2015 97.5/96.8Net Official Development Assistance disbursed (% of GNI) k 2014 0.1a Excludes irrigation canals and landscaping care. b Excludes publishing activities, includes irrigationcanals. c Excludes repair of personal and household goods. d Includes publishing activities and land-scaping care. e Data classified according to ISIC Rev. 3. f Estimate. g 2013. h Refugee population relatesto the end of 2014. i 2012. j Population age 16-74. k Development Assistance Committee member (OECD).
162 World Statistics Pocketbook

PortugalRegion Southern Europe Surface area (sq km) 92 225Population (proj., 000) 10 304 Pop. density (per sq km) 112.5Capital city Lisbon Capital city pop. (000) 2 884 a
Currency Euro (EUR) UN membership date 14 December 1955Economic indicators 2005 2010 2014GDP: Gross domestic product (million current US$) 197 300 238 303 230 117GDP growth rate (annual %, const. 2005 prices) 0.8 1.9 0.9GDP per capita (current US$) 18 826.2 22 513.7 22 121.6Economy: Agriculture (% of GVA) b 2.7 2.2 2.3Economy: Industry (% of GVA) c 24.6 22.6 21.6Economy: Services and other activity (% of GVA) de 72.7 75.2 76.1Employment: Agriculture (% of employed) 8.0fg 7.1 5.5Employment: Industry (% of employed) 32.1fg 28.8 24.9Employment: Services and other (% of employed) 60.0fg 64.0 69.5Unemployment (% of labour force) h 7.6 10.8 13.9Labour force participation (female/male pop. %) h 55.4/69.3 55.8/66.8 53.7/64.4CPI: Consumer price index (2000=100) i 117 127 135Agricultural production index (2004-2006=100) 97 104 104j
Food production index (2004-2006=100) 97 105 104j
Index of industrial production (2005=100) 100 92 88Balance of payments, current account (million US$) –19 537 –24 199 1 209Total trade Major trading partners 2015
(million US$) (% of exports) (% of imports)Exports 55 241.1 Spain 25.0 Spain 27.2Imports 66 657.7 France 12.1 Germany 11.7Balance –11 416.6 Germany 11.8 France 6.6Social indicatorsPopulation growth rate (average annual %) 2010-2015 –0.5Urban population (%) 2015 63.5Urban population growth rate (average annual %) 2010-2015 1.0Fertility rate, total (live births per woman) 2010-2015 1.3Life expectancy at birth (females/males, years) 2010-2015 83.5/77.4Total dependency ratio (Pop. aged 0-14 & 65+ per 100 pop. 15-64) 2015 54International migrant stock (000/% of total pop.) mid-2015 837.3/8.1Tourist arrivals at national borders (000) k 2014 9 092Refugees and others of concern to UNHCR mid-2015 1 354l
Infant mortality rate (per 1 000 live births) 2010-2015 3Health: Total expenditure (% of GDP) 2014 9.5Health: Physicians (per 1 000 pop.) 2013 4.1m
Education: Government expenditure (% of GDP) 2014 5.1n
Education: Primary gross enrolment ratio (f/m per 100 pop.) 2014 106.1/110.8Education: Secondary gross enrolment ratio (f/m per 100 pop.) 2014 115.0/117.8Education: Tertiary gross enrolment ratio (f/m per 100 pop.) 2014 70.4/60.9Intentional homicide rate (per 100 000 pop.) 2014 0.9Seats held by women in national parliaments (%) 2016 34.8Environment and infrastructureMobile-cellular subscriptions (per 100 inhabitants) 2014 111.8o
Individuals using the Internet (%) 2014 64.6p
Patents: Resident filings (per million pop.) 2014 80.0Threatened species 2015 256Forested area (% of land area) 2013 35.0h
CO2 emission estimates (000 tons/tons per capita) 2013 46 263/4.4Energy production, primary (Petajoules) 2013 241q
Energy supply per capita (Gigajoules) 2013 86.0q
Terrestrial and marine areas protected (% of total area) 2014 1.9Population using improved drinking water sources (urban/rural, %) 2015 100.0/100.0Population using improved sanitation facilities (urban/rural, %) 2015 99.6/99.8Net Official Development Assistance disbursed (% of GNI) r 2014 0.2a Refers to Grande Lisboa, the Peninsula of Setúbal, and the municipality Azambuja. b Excludes irrigationcanals and landscaping care. c Excludes publishing activities, includes irrigation canals. d Excludes repairof personal and household goods. e Includes publishing activities and landscaping care. f Data classifiedaccording to ISIC Rev. 3. g Break in the time series. h Estimate. i Excluding `Rent´. j 2013. k Arrivals ofnon-resident tourists in all types of tourism accommodation establishments. l Refugee population relatesto the end of 2014. m 2012. n 2011. o Excludes data-only subscriptions. p Population age 16-74. q Dataincludes the Azores and Madeira. r Development Assistance Committee member (OECD).
World Statistics Pocketbook 163

Puerto RicoRegion Caribbean Surface area (sq km) 8 868Population (proj., 000) 3 681 Pop. density (per sq km) 415.0Capital city San Juan Capital city pop. (000) 2 463 a
Currency US Dollar (USD)Economic indicators 2005 2010 2014GDP: Gross domestic product (million current US$) 83 915 98 381 103 676GDP growth rate (annual %, const. 2005 prices) –2.0 –0.4 –0.1GDP per capita (current US$) 22 310.9 26 520.2 28 122.9Economy: Agriculture (% of GVA) b 0.6 0.8 0.8Economy: Industry (% of GVA) b 47.3 50.8 50.8Economy: Services and other activity (% of GVA) b 52.1 48.4 48.4Employment: Agriculture (% of employed) cd 2.1 1.6e 1.6f
Employment: Industry (% of employed) cd 19.0 13.7e 13.5f
Employment: Services and other (% of employed) cd 79.0 84.7e 84.9f
Unemployment (% of labour force) g 11.3 16.1 13.9Labour force participation (female/male pop. %) g 38.1/61.0 35.1/53.7 34.2/51.4CPI: Consumer price index (2000=100) 111 131 139Agricultural production index (2004-2006=100) 97 105 111h
Food production index (2004-2006=100) 97 107 112h
Social indicatorsPopulation growth rate (average annual %) 2010-2015 –0.1Urban population (%) 2015 93.6Urban population growth rate (average annual %) 2010-2015 –0.2Fertility rate, total (live births per woman) 2010-2015 1.6Life expectancy at birth (females/males, years) 2010-2015 83.2/75.2Total dependency ratio (Pop. aged 0-14 & 65+ per 100 pop. 15-64) 2015 50International migrant stock (000/% of total pop.) mid-2015 275.0/7.5Tourist arrivals at national borders (000) 2014 3 246i
Infant mortality rate (per 1 000 live births) 2010-2015 6Education: Government expenditure (% of GDP) 2014 6.4h
Education: Primary gross enrolment ratio (f/m per 100 pop.) 2014 90.5/88.7h
Education: Secondary gross enrolment ratio (f/m per 100 pop.) 2014 83.3/78.4h
Education: Tertiary gross enrolment ratio (f/m per 100 pop.) 2014 100.4/70.4h
Intentional homicide rate (per 100 000 pop.) 2014 18.5Environment and infrastructureMobile-cellular subscriptions (per 100 inhabitants) 2014 87.1Individuals using the Internet (%) 2014 78.8g
Threatened species 2015 127Forested area (% of land area) 2013 55.2g
Energy production, primary (Petajoules) 2013 1Energy supply per capita (Gigajoules) 2013 15.0Terrestrial and marine areas protected (% of total area) 2014 0.6Population using improved sanitation facilities (urban/rural, %) 2015 99.3/99.3a Refers to the Metropolitan Statistical Area. b At producers' prices. c Data classified according to ISICRev. 2. d Persons aged 16 years and over. e Break in the time series. f 2011. g Estimate. h 2013. i Arrivalsof non-resident tourists by air.
164 World Statistics Pocketbook

QatarRegion Western Asia Surface area (sq km) 11 607Population (proj., 000) 2 291 Pop. density (per sq km) 197.4Capital city Doha Capital city pop. (000) 718Currency Qatari Rial (QAR) UN membership date 21 September 1971Economic indicators 2005 2010 2014GDP: Gross domestic product (million current US$) 44 531 125 122 211 817GDP growth rate (annual %, const. 2005 prices) 7.5 16.7 6.2GDP per capita (current US$) 53 207.3 70 870.3 97 518.6Economy: Agriculture (% of GVA) a 0.1 0.1 0.1Economy: Industry (% of GVA) a 73.8 66.8 65.1Economy: Services and other activity (% of GVA) a 26.0 33.1 34.8Employment: Agriculture (% of employed) 2.7bcd 1.6bef 1.4cghi
Employment: Industry (% of employed) 41.0bcd 58.4bef 51.6cghi
Employment: Services and other (% of employed) 56.2bcd 40.0bef 46.8cghi
Unemployment (% of labour force) j 1.0 0.4 0.2Labour force participation (female/male pop. %) j 43.5/94.1 51.5/95.7 53.3/94.0CPI: Consumer price index (2000=100) k 119 162 178Agricultural production index (2004-2006=100) 95 120 134i
Food production index (2004-2006=100) 95 120 134i
Index of industrial production (2005=100) b 100 190 226Balance of payments, current account (million US$) ... ... 49 662Total trade Major trading partners 2015
(million US$) (% of exports) (% of imports)Exports 77 971.1 Japan 20.8 China 11.5Imports 32 610.5 Republic of Korea 17.3 United States 11.0Balance 45 360.6 India 11.9 United Arab Emirates 8.8Social indicatorsPopulation growth rate (average annual %) 2010-2015 4.7Urban population (%) 2015 99.2Urban population growth rate (average annual %) 2010-2015 6.0Fertility rate, total (live births per woman) 2010-2015 2.1Life expectancy at birth (females/males, years) 2010-2015 79.7/77.1Total dependency ratio (Pop. aged 0-14 & 65+ per 100 pop. 15-64) 2015 20International migrant stock (000/% of total pop.) mid-2015 1 687.6/75.5l
Tourist arrivals at national borders (000) 2014 2 826Refugees and others of concern to UNHCR mid-2015 1 433Infant mortality rate (per 1 000 live births) 2010-2015 6Health: Total expenditure (% of GDP) 2014 2.2m
Education: Government expenditure (% of GDP) 2014 3.6Education: Primary gross enrolment ratio (f/m per 100 pop.) 2014 99.0/103.7n
Education: Secondary gross enrolment ratio (f/m per 100 pop.) 2014 103.2/116.1n
Education: Tertiary gross enrolment ratio (f/m per 100 pop.) 2014 45.9/7.3Intentional homicide rate (per 100 000 pop.) 2014 7.2o
Seats held by women in national parliaments (%) 2016 0.0Environment and infrastructureMobile-cellular subscriptions (per 100 inhabitants) 2014 145.8Individuals using the Internet (%) 2014 91.5j
Patents: Resident filings (per million pop.) 2014 4.0Threatened species 2015 35Forested area (% of land area) 2013 0.0j
CO2 emission estimates (000 tons/tons per capita) 2013 85 023/40.5Energy production, primary (Petajoules) 2013 9 271Energy supply per capita (Gigajoules) 2013 664.0Terrestrial and marine areas protected (% of total area) 2014 1.2Population using improved drinking water sources (urban/rural, %) 2015 100.0/100.0Population using improved sanitation facilities (urban/rural, %) 2015 98.0/98.0a At producers' prices. b Data classified according to ISIC Rev. 3. c Break in the time series. d 2004. ePaid employment only. f 2009. g Persons aged 15 to 76 years. h Excluding persons temporarily absentfrom work. i 2013. j Estimate. k Index base: 2002=100. l Refers to foreign citizens. m Data revision. n2011. o 2012.
World Statistics Pocketbook 165

Republic of KoreaRegion Eastern Asia Surface area (sq km) 100 266Population (proj., 000) 50 504 Pop. density (per sq km) 519.4Capital city Seoul Capital city pop. (000) 9 774 a
Currency South Korean Won (KRW) UN membership date 17 September 1991Economic indicators 2005 2010 2014GDP: Gross domestic product (million current US$) 898 137 1 094 499 1 410 383GDP growth rate (annual %, const. 2005 prices) 3.9 6.5 3.3GDP per capita (current US$) 18 866.1 22 295.8 28 165.8Economy: Agriculture (% of GVA) b 3.2 2.5 2.3Economy: Industry (% of GVA) c 37.5 38.3 38.2Economy: Services and other activity (% of GVA) de 59.4 59.3 59.4Employment: Agriculture (% of employed) 7.9f 6.6gh 6.1gi
Employment: Industry (% of employed) 26.8f 24.9gh 24.4gi
Employment: Services and other (% of employed) 65.2f 68.5gh 69.5gi
Unemployment (% of labour force) j 3.7 3.7 3.5Labour force participation (female/male pop. %) j 49.5/72.6 49.3/71.7 50.0/71.8CPI: Consumer price index (2000=100) k 100 116 127Agricultural production index (2004-2006=100) 100 102 104i
Food production index (2004-2006=100) 100 102 104i
Index of industrial production (2005=100) l 100 139 151Balance of payments, current account (million US$) 12 655 28 850 84 373Total trade Major trading partners 2015
(million US$)m (% of exports)m (% of imports)m
Exports 573 074.8 China 25.4 China 17.1Imports 525 557.0 United States 12.3 Japan 10.2Balance 47 517.8 Japan 5.6 United States 8.7Social indicatorsPopulation growth rate (average annual %) 2010-2015 0.5Urban population (%) 2015 82.5Urban population growth rate (average annual %) 2010-2015 0.7Fertility rate, total (live births per woman) 2010-2015 1.3Life expectancy at birth (females/males, years) 2010-2015 84.6/78.0Total dependency ratio (Pop. aged 0-14 & 65+ per 100 pop. 15-64) 2015 37International migrant stock (000/% of total pop.) mid-2015 1 327.3/2.6n
Tourist arrivals at national borders (000) o 2014 14 202p
Refugees and others of concern to UNHCR mid-2015 6 615Infant mortality rate (per 1 000 live births) 2010-2015 3Health: Total expenditure (% of GDP) 2014 7.4Health: Physicians (per 1 000 pop.) 2013 2.1q
Education: Government expenditure (% of GDP) 2014 4.6q
Education: Primary gross enrolment ratio (f/m per 100 pop.) 2014 98.6/99.5i
Education: Secondary gross enrolment ratio (f/m per 100 pop.) 2014 97.2/98.3i
Education: Tertiary gross enrolment ratio (f/m per 100 pop.) 2014 81.3/107.8i
Intentional homicide rate (per 100 000 pop.) 2014 0.7Seats held by women in national parliaments (%) 2016 16.3Environment and infrastructureMobile-cellular subscriptions (per 100 inhabitants) 2014 115.5Individuals using the Internet (%) 2014 84.3r
Patents: Resident filings (per million pop.) 2014 3 254.0Threatened species 2015 76Forested area (% of land area) 2013 63.6j
CO2 emission estimates (000 tons/tons per capita) 2013 592 499/11.9Energy production, primary (Petajoules) 2013 1 799Energy supply per capita (Gigajoules) 2013 221.0Terrestrial and marine areas protected (% of total area) 2014 2.6Population using improved drinking water sources (urban/rural, %) 2015 99.7/...Population using improved sanitation facilities (urban/rural, %) 2015 100.0/100.0Net Official Development Assistance disbursed (% of GNI) s 2014 0.1a Refers to Seoul Special City. b Excludes irrigation canals and landscaping care. c Excludes publishingactivities, includes irrigation canals. d Excludes repair of personal and household goods. e Includespublishing activities and landscaping care. f Data classified according to ISIC Rev. 3. g Break in the timeseries. h Excluding overseas territories. i 2013. j Estimate. k Index base: 2005=100. l Excluding water andwaste management. m 2014. n Refers to foreign citizens. o Arrivals of non-resident visitors at nationalborders. p Including nationals residing abroad and crew members. q 2012. r Population age 3+. s Devel-opment Assistance Committee member (OECD).
166 World Statistics Pocketbook

Republic of MoldovaRegion Eastern Europe Surface area (sq km) 33 846Population (proj., 000) 4 063 a Pop. density (per sq km) 123.7 a
Capital city Chisinau Capital city pop. (000) 725Currency Moldovan Leu (MDL) UN membership date 2 March 1992Economic indicators 2005 2010 2014GDP: Gross domestic product (million current US$) 2 988 5 812 7 944GDP growth rate (annual %, const. 2005 prices) 7.5 7.1 4.4GDP per capita (current US$) 718.8 1 422.9 1 950.8Economy: Agriculture (% of GVA) 19.1 14.1 14.9Economy: Industry (% of GVA) 22.2 19.5 20.5Economy: Services and other activity (% of GVA) 58.7 66.4 64.7Employment: Agriculture (% of employed) b 40.6 27.5cdef 28.8cdeg
Employment: Industry (% of employed) b 16.0 18.7cdef 17.7cdeg
Employment: Services and other (% of employed) b 43.3 53.8cdef 53.5cdeg
Unemployment (% of labour force) h 7.3 7.4 3.9Labour force participation (female/male pop. %) h 47.9/50.4 38.6/45.3 38.5/45.0CPI: Consumer price index (2000=100) i 99 152 189Agricultural production index (2004-2006=100) 100 93 101g
Food production index (2004-2006=100) 100 93 101g
Index of industrial production (2005=100) b 100 82 94g
Balance of payments, current account (million US$) –248 –545 –676Total trade Major trading partners 2015
(million US$) (% of exports) (% of imports)Exports 1 966.8 Romania 22.7 Romania 13.9Imports 3 986.8 Russian Federation 12.2 Russian Federation 13.4Balance –2 020.0 Italy 10.0 Ukraine 9.3Social indicatorsPopulation growth rate (average annual %) 2010-2015 –0.1a
Urban population (%) 2015 45.0a
Urban population growth rate (average annual %) 2010-2015 –0.7a
Fertility rate, total (live births per woman) 2010-2015 1.3a
Life expectancy at birth (females/males, years) 2010-2015 75.4/67.2a
Total dependency ratio (Pop. aged 0-14 & 65+ per 100 pop. 15-64) 2015 35a
International migrant stock (000/% of total pop.) mid-2015 142.9/3.5a
Tourist arrivals at national borders (000) j 2014 94k
Refugees and others of concern to UNHCR mid-2015 6 786Infant mortality rate (per 1 000 live births) 2010-2015 11a
Health: Total expenditure (% of GDP) 2014 10.3Health: Physicians (per 1 000 pop.) 2013 3.0Education: Government expenditure (% of GDP) 2014 7.5Education: Primary gross enrolment ratio (f/m per 100 pop.) 2014 92.9/93.3h
Education: Secondary gross enrolment ratio (f/m per 100 pop.) 2014 87.9/86.8h
Education: Tertiary gross enrolment ratio (f/m per 100 pop.) 2014 46.6/36.1gh
Intentional homicide rate (per 100 000 pop.) 2014 3.2Seats held by women in national parliaments (%) 2016 21.8Environment and infrastructureMobile-cellular subscriptions (per 100 inhabitants) 2014 108.0Individuals using the Internet (%) 2014 46.6h
Patents: Resident filings (per million pop.) 2014 19.0Threatened species 2015 29Forested area (% of land area) 2013 12.2h
CO2 emission estimates (000 tons/tons per capita) 2013 4 976/1.2Energy production, primary (Petajoules) 2013 12Energy supply per capita (Gigajoules) 2013 23.0Terrestrial and marine areas protected (% of total area) 2014 3.8Population using improved drinking water sources (urban/rural, %) 2015 96.9/81.4Population using improved sanitation facilities (urban/rural, %) 2015 87.8/67.1Net Official Development Assistance received (% of GNI) 2014 5.9a Including Transnistria. b Data classified according to ISIC Rev. 3. c Break in the time series. d Excludingthe institutional population. e Excluding some areas. f Persons aged 15 to 76 years. g 2013. h Estimate.i Index base: 2005=100. j Arrivals of non-resident tourists in all types of tourism accommodation estab-lishments. k Excluding the left side of the river Nistru and the municipality of Bender.
World Statistics Pocketbook 167

RéunionRegion Eastern Africa Surface area (sq km) 2 513Population (proj., 000) 867 Pop. density (per sq km) 346.9Capital city Saint-Denis Capital city pop. (000) 144 a
Currency Euro (EUR)Economic indicators 2005 2010 2014Employment: Agriculture (% of employed) b ... 4.2c 4.3de
Employment: Industry (% of employed) b ... 14.1c 12.7de
Employment: Services and other (% of employed) b ... 67.1c 81.7de
Unemployment (% of labour force) f 30.1 28.9 29.6Labour force participation (female/male pop. %) f 49.8/64.5 49.1/62.2 48.4/60.4CPI: Consumer price index (2000=100) 110 121 127Agricultural production index (2004-2006=100) 99 104 107g
Food production index (2004-2006=100) 99 104 107g
Social indicatorsPopulation growth rate (average annual %) 2010-2015 0.7Urban population (%) 2015 95.0Urban population growth rate (average annual %) 2010-2015 1.4Fertility rate, total (live births per woman) 2010-2015 2.2Life expectancy at birth (females/males, years) 2010-2015 82.9/76.0Total dependency ratio (Pop. aged 0-14 & 65+ per 100 pop. 15-64) 2015 51International migrant stock (000/% of total pop.) mid-2015 127.2/14.8Tourist arrivals at national borders (000) 2014 406Infant mortality rate (per 1 000 live births) 2010-2015 4Environment and infrastructureThreatened species 2015 126Forested area (% of land area) 2013 35.1f
CO2 emission estimates (000 tons/tons per capita) 2013 4 316/5.1Energy production, primary (Petajoules) 2013 8f
Energy supply per capita (Gigajoules) 2013 70.0f
Terrestrial and marine areas protected (% of total area) 2014 23.5Population using improved drinking water sources (urban/rural, %) 2015 99.2/97.8Population using improved sanitation facilities (urban/rural, %) 2015 98.4/95.3a 2014. b Excluding the institutional population. c Persons aged 15 to 64 years. d Break in the time series.e 2012. f Estimate. g 2013.
168 World Statistics Pocketbook

RomaniaRegion Eastern Europe Surface area (sq km) 238 391Population (proj., 000) 19 373 Pop. density (per sq km) 84.2Capital city Bucharest Capital city pop. (000) 1 868Currency Romanian Leu (RON) UN membership date 14 December 1955Economic indicators 2005 2010 2014GDP: Gross domestic product (million current US$) 99 699 167 998 199 045GDP growth rate (annual %, const. 2005 prices) 4.2 –0.8 2.8GDP per capita (current US$) 4 657.2 8 276.2 10 128.7Economy: Agriculture (% of GVA) a 9.5 6.3 5.4Economy: Industry (% of GVA) b 36.1 41.3 34.4Economy: Services and other activity (% of GVA) cd 54.5 52.4 60.3Employment: Agriculture (% of employed) 28.8ef 27.7 25.4Employment: Industry (% of employed) 32.1ef 29.7 30.1Employment: Services and other (% of employed) 39.1ef 42.6 44.5Unemployment (% of labour force) g 7.2 7.0 6.8Labour force participation (female/male pop. %) g 47.4/62.1 47.3/63.6 47.7/65.1CPI: Consumer price index (2000=100) h 232 313 359Agricultural production index (2004-2006=100) 95 91 97i
Food production index (2004-2006=100) 95 91 97i
Index of industrial production (2005=100) j 100 123 155Balance of payments, current account (million US$) –8 541f –8 479 –951Total trade Major trading partners 2015
(million US$) (% of exports) (% of imports)Exports 60 605.0 Germany 19.8 Germany 19.8Imports 69 857.7 Italy 12.4 Italy 10.9Balance –9 252.7 France 6.8 Hungary 7.9Social indicatorsPopulation growth rate (average annual %) 2010-2015 –0.8Urban population (%) 2015 54.6Urban population growth rate (average annual %) 2010-2015 <Fertility rate, total (live births per woman) 2010-2015 1.5Life expectancy at birth (females/males, years) 2010-2015 78.1/70.9Total dependency ratio (Pop. aged 0-14 & 65+ per 100 pop. 15-64) 2015 49International migrant stock (000/% of total pop.) mid-2015 226.9/1.2Tourist arrivals at national borders (000) k 2014 8 442Refugees and others of concern to UNHCR mid-2015 2 858Infant mortality rate (per 1 000 live births) 2010-2015 10Health: Total expenditure (% of GDP) 2014 5.6Health: Physicians (per 1 000 pop.) 2013 2.5l
Education: Government expenditure (% of GDP) 2014 2.9l
Education: Primary gross enrolment ratio (f/m per 100 pop.) 2014 94.6/96.4l
Education: Secondary gross enrolment ratio (f/m per 100 pop.) 2014 94.3/95.2Education: Tertiary gross enrolment ratio (f/m per 100 pop.) 2014 59.1/47.7Intentional homicide rate (per 100 000 pop.) 2014 1.5Seats held by women in national parliaments (%) 2016 13.7Environment and infrastructureMobile-cellular subscriptions (per 100 inhabitants) 2014 105.9m
Individuals using the Internet (%) 2014 54.1n
Patents: Resident filings (per million pop.) 2014 49.0Threatened species 2015 85Forested area (% of land area) 2013 29.2g
CO2 emission estimates (000 tons/tons per capita) 2013 70 736/3.6Energy production, primary (Petajoules) 2013 1 090Energy supply per capita (Gigajoules) 2013 68.0Terrestrial and marine areas protected (% of total area) 2014 22.1Population using improved drinking water sources (urban/rural, %) 2015 100.0/100.0Population using improved sanitation facilities (urban/rural, %) 2015 92.2/63.4Net Official Development Assistance disbursed (% of GNI) 2014 0.1a Excludes irrigation canals and landscaping care. b Excludes publishing activities, includes irrigationcanals. c Excludes repair of personal and household goods. d Includes publishing activities and land-scaping care. e Data classified according to ISIC Rev. 3. f Break in the time series. g Estimate. h Annualaverage is weighted mean of monthly data. i 2013. j Excluding water and waste management. k Arrivalsof non-resident visitors at national borders. l 2012. m Data refers to pre-paid subscriptions active in thelast 6 months (or 180 days). n Population age 16-74.
World Statistics Pocketbook 169

Russian FederationRegion Eastern Europe Surface area (sq km) 17 098 246Population (proj., 000) 143 440 Pop. density (per sq km) 8.8Capital city Moscow Capital city pop. (000) 12 166Currency Russian Ruble (RUB) UN membership date 24 October 1945Economic indicators 2005 2010 2014GDP: Gross domestic product (million current US$) 764 016 1 524 917 1 849 940GDP growth rate (annual %, const. 2005 prices) 6.4 4.5 0.6GDP per capita (current US$) 5 319.6 10 652.0 12 897.9Economy: Agriculture (% of GVA) 5.0 3.9 4.1Economy: Industry (% of GVA) 38.1 34.7 36.8Economy: Services and other activity (% of GVA) 57.0 61.4 59.1Employment: Agriculture (% of employed) ab 10.2 7.9cde 6.7Employment: Industry (% of employed) ab 29.8 27.7cde 27.5Employment: Services and other (% of employed) ab 60.0 64.4cde 65.8Unemployment (% of labour force) f 7.1 7.3 5.2Labour force participation (female/male pop. %) f 56.2/68.6 56.5/70.8 56.7/71.6CPI: Consumer price index (2000=100) 200 325 396g
Agricultural production index (2004-2006=100) 100 94 117g
Food production index (2004-2006=100) 100 94 117g
Index of industrial production (2005=100) a 100 109 121Balance of payments, current account (million US$) 84 389 67 452 58 432Total trade Major trading partners 2015
(million US$) (% of exports) (% of imports)Exports 343 907.7 Areas nes 15.4h China 19.3Imports 182 782.0 Netherlands 11.7 Germany 10.4Balance 161 125.7 China 8.2 United States 6.3Social indicatorsPopulation growth rate (average annual %) 2010-2015 <Urban population (%) 2015 74.0Urban population growth rate (average annual %) 2010-2015 –0.1Fertility rate, total (live births per woman) 2010-2015 1.7Life expectancy at birth (females/males, years) 2010-2015 75.6/64.2Total dependency ratio (Pop. aged 0-14 & 65+ per 100 pop. 15-64) 2015 43International migrant stock (000/% of total pop.) mid-2015 11 643.3/8.1Tourist arrivals at national borders (000) i 2014 32 421Refugees and others of concern to UNHCR mid-2015 431 210j
Infant mortality rate (per 1 000 live births) 2010-2015 8Health: Total expenditure (% of GDP) 2014 7.1Education: Government expenditure (% of GDP) 2014 4.2k
Education: Primary gross enrolment ratio (f/m per 100 pop.) 2014 98.9/98.2Education: Secondary gross enrolment ratio (f/m per 100 pop.) 2014 99.5/101.6Education: Tertiary gross enrolment ratio (f/m per 100 pop.) 2014 86.2/71.5Intentional homicide rate (per 100 000 pop.) 2014 9.5Seats held by women in national parliaments (%) 2016 13.6Environment and infrastructureMobile-cellular subscriptions (per 100 inhabitants) 2014 155.1Individuals using the Internet (%) 2014 70.5l
Patents: Resident filings (per million pop.) 2014 169.0Threatened species 2015 217Forested area (% of land area) 2013 49.8f
CO2 emission estimates (000 tons/tons per capita) 2013 1 789 074/12.5Energy production, primary (Petajoules) 2013 56 266Energy supply per capita (Gigajoules) 2013 214.0Terrestrial and marine areas protected (% of total area) 2014 8.8Population using improved drinking water sources (urban/rural, %) 2015 98.9/91.3Population using improved sanitation facilities (urban/rural, %) 2015 77.0/58.8Net Official Development Assistance disbursed (% of GNI) m 2014 0.1a Data classified according to ISIC Rev. 3. b Persons aged 15 to 72 years. c Break in the time series. dExcluding the institutional population. e Excluding some areas. f Estimate. g 2013. h See technical notes.i Arrivals of non-resident visitors at national borders. j Stateless persons refers to census figure from2010 adjusted to reflect the number of people who acquired nationality in 2011-2014. k 2012. l Populationage 15-72. m Some of the debt relief reported by Russia from 2014 onwards may correspond to the creditsincluded in these estimates. Therefore, the statistics currently published on ODA by Russia and theestimates from the previous Chairman's reports should not be used at the same time.
170 World Statistics Pocketbook

RwandaRegion Eastern Africa Surface area (sq km) 26 338Population (proj., 000) 11 883 Pop. density (per sq km) 481.7Capital city Kigali Capital city pop. (000) 1 257Currency Rwanda Franc (RWF) UN membership date 18 September 1962Economic indicators 2005 2010 2014GDP: Gross domestic product (million current US$) 2 581 5 699 7 903GDP growth rate (annual %, const. 2005 prices) 9.4 7.3 7.0GDP per capita (current US$) 286.6 553.6 696.9Economy: Agriculture (% of GVA) a 41.3 34.8 35.0Economy: Industry (% of GVA) b 12.5 13.8 15.2Economy: Services and other activity (% of GVA) cd 46.2 51.5 49.8Employment: Agriculture (% of employed) 78.8e ... 75.3fg
Employment: Industry (% of employed) 3.8e ... 6.7fg
Employment: Services and other (% of employed) 16.4e ... 16.2fg
Unemployment (% of labour force) h 2.5 2.2 2.7Labour force participation (female/male pop. %) h 85.6/82.5 86.4/84.0 86.5/83.1CPI: Consumer price index (2000=100) 138i 100fj 123jk
Agricultural production index (2004-2006=100) 100 145 170l
Food production index (2004-2006=100) 101 146 172l
Balance of payments, current account (million US$) –98 –412 –1 047Total trade Major trading partners 2015
(million US$)m (% of exports)m (% of imports)m
Exports 653.4 United Rep. Tanzania 27.8 China 18.7Imports 1 954.2 Dem. Rep. of Congo 23.5 Uganda 13.7Balance –1 300.8 Uganda 12.0 Kenya 9.2Social indicatorsPopulation growth rate (average annual %) 2010-2015 2.4Urban population (%) 2015 28.8Urban population growth rate (average annual %) 2010-2015 6.4Fertility rate, total (live births per woman) 2010-2015 4.1Life expectancy at birth (females/males, years) 2010-2015 66.3/59.7Total dependency ratio (Pop. aged 0-14 & 65+ per 100 pop. 15-64) 2015 78International migrant stock (000/% of total pop.) mid-2015 441.5/3.8n
Tourist arrivals at national borders (000) 2014 926Refugees and others of concern to UNHCR mid-2015 135 553Infant mortality rate (per 1 000 live births) 2010-2015 49Health: Total expenditure (% of GDP) 2014 7.5Education: Government expenditure (% of GDP) 2014 5.0l
Education: Primary gross enrolment ratio (f/m per 100 pop.) 2014 135.1/132.0Education: Secondary gross enrolment ratio (f/m per 100 pop.) 2014 40.9/37.3Education: Tertiary gross enrolment ratio (f/m per 100 pop.) 2014 6.6/8.5l
Seats held by women in national parliaments (%) 2016 63.8Environment and infrastructureMobile-cellular subscriptions (per 100 inhabitants) 2014 64.0Individuals using the Internet (%) 2014 10.6h
Patents: Resident filings (per million pop.) 2014 3.0g
Threatened species 2015 61Forested area (% of land area) 2013 18.9h
CO2 emission estimates (000 tons/tons per capita) 2013 799/0.1Energy production, primary (Petajoules) 2013 83h
Energy supply per capita (Gigajoules) 2013 9.0h
Terrestrial and marine areas protected (% of total area) 2014 9.4Population using improved drinking water sources (urban/rural, %) 2015 86.6/71.9Population using improved sanitation facilities (urban/rural, %) 2015 58.5/62.9Net Official Development Assistance received (% of GNI) 2014 13.3a Excludes irrigation canals and landscaping care. b Excludes publishing activities, includes irrigationcanals. c Excludes repair of personal and household goods. d Includes publishing activities and land-scaping care. e Data classified according to ISIC Rev. 3. f Break in the time series. g 2012. h Estimate. iKigali. j Index base: 2010=100. k Series linked to former series. l 2013. m 2014. n Including refugees.
World Statistics Pocketbook 171

Saint HelenaRegion Western Africa Surface area (sq km) 308 a
Population (proj., 000) 4 a Pop. density (per sq km) 10.1 a
Capital city Jamestown Capital city pop. (000) 1 b
Currency Saint Helena Pound (SHP)Economic indicators 2005 2010 2014Employment: Agriculture (% of employed) cd ... 7.3e ...Employment: Industry (% of employed) cd ... 20.0e ...Employment: Services and other (% of employed) cd ... 72.7e ...Unemployment (% of labour force) 5.2 2.0 ...CPI: Consumer price index (2000=100) 116 155f 180Social indicatorsPopulation growth rate (average annual %) 2010-2015 –1.0a
Urban population (%) 2015 39.4a
Urban population growth rate (average annual %) 2010-2015 –0.6a
Life expectancy at birth (females/males, years) 2010-2015 79.7/72.0g
Total dependency ratio (Pop. aged 0-14 & 65+ per 100 pop. 15-64) 2015 49h
International migrant stock (000/% of total pop.) mid-2015 0.6/15.3a
Environment and infrastructureIndividuals using the Internet (%) 2014 37.6hi
Threatened species 2015 80a
Forested area (% of land area) 2013 5.1ai
CO2 emission estimates (000 tons/tons per capita) 2013 11/3.0Energy production, primary (Petajoules) 2013 0Energy supply per capita (Gigajoules) 2013 40.0a Including Ascension and Tristan da Cunha. b 2014. c Data classified according to ISIC Rev. 3. d Personsaged 15 to 69 years. e 2008. f Series linked to former series. g 2003 - 2012. h 2012. i Estimate.
172 World Statistics Pocketbook

Saint Kitts and NevisRegion Caribbean Surface area (sq km) 261Population (proj., 000) 56 Pop. density (per sq km) 216.1Capital city Basseterre Capital city pop. (000) 14 a
Currency East Caribbean Dollar (XCD) UN membership date 23 September 1983Economic indicators 2005 2010 2014GDP: Gross domestic product (million current US$) 543 692 852GDP growth rate (annual %, const. 2005 prices) 9.3 –3.2 6.9GDP per capita (current US$) 11 053.7 13 227.0 15 510.4Economy: Agriculture (% of GVA) 1.9 1.6 1.5Economy: Industry (% of GVA) 25.5 26.4 25.1Economy: Services and other activity (% of GVA) 72.7 72.0 73.4Employment: Agriculture (% of employed) b 0.2c ... ...Employment: Industry (% of employed) b 48.8c ... ...Employment: Services and other (% of employed) b 42.1c ... ...Unemployment (% of labour force) 5.1c ... ...Labour force participation (female/male pop. %) 74.9/62.8c ... ...CPI: Consumer price index (2000=100) d 111 136 149Agricultural production index (2004-2006=100) 91 34 42e
Food production index (2004-2006=100) 91 34 42e
Balance of payments, current account (million US$) –65 –139 –63e
Total trade Major trading partners 2015(million US$)f (% of exports)f (% of imports)f
Exports 44.9 United States 81.7 United States 67.3Imports 246.7 Antigua and Barbuda 3.1 Trinidad and Tobago 6.3Balance –201.8 Trinidad and Tobago 2.7 United Kingdom 4.1Social indicatorsPopulation growth rate (average annual %) 2010-2015 1.2Urban population (%) 2015 32.0Urban population growth rate (average annual %) 2010-2015 1.3Life expectancy at birth (females/males, years) 2010-2015 70.7/68.2g
International migrant stock (000/% of total pop.) mid-2015 7.4/13.4Tourist arrivals at national borders (000) 2014 113h
Refugees and others of concern to UNHCR mid-2015 1Health: Total expenditure (% of GDP) 2014 5.1i
Education: Primary gross enrolment ratio (f/m per 100 pop.) 2014 84.5/83.0Education: Secondary gross enrolment ratio (f/m per 100 pop.) 2014 92.8/90.3Education: Tertiary gross enrolment ratio (f/m per 100 pop.) 2014 79.7/78.5Intentional homicide rate (per 100 000 pop.) 2014 33.6j
Seats held by women in national parliaments (%) 2016 13.3Environment and infrastructureMobile-cellular subscriptions (per 100 inhabitants) 2014 139.8k
Individuals using the Internet (%) 2014 65.4k
Threatened species 2015 51Forested area (% of land area) 2013 42.3k
CO2 emission estimates (000 tons/tons per capita) 2013 279/5.1Energy supply per capita (Gigajoules) 2013 73.0k
Terrestrial and marine areas protected (% of total area) 2014 0.3Population using improved drinking water sources (urban/rural, %) 2015 98.3/98.3a 2014. b Data classified according to ISIC Rev. 2. c 2001. d Index base: 2001=100. e 2013. f 2011. g 1998.h Arrivals of non-resident tourists by air. i Data revision. j 2012. k Estimate.
World Statistics Pocketbook 173

Saint LuciaRegion Caribbean Surface area (sq km) 539 a
Population (proj., 000) 186 Pop. density (per sq km) 305.6Capital city Castries Capital city pop. (000) 22 b
Currency East Caribbean Dollar (XCD) UN membership date 18 September 1979Economic indicators 2005 2010 2014GDP: Gross domestic product (million current US$) 935 1 244 1 406GDP growth rate (annual %, const. 2005 prices) –1.7 –1.0 0.5GDP per capita (current US$) 5 655.5 7 014.2 7 655.0Economy: Agriculture (% of GVA) 3.5 2.9 2.8Economy: Industry (% of GVA) 18.7 15.5 13.3Economy: Services and other activity (% of GVA) 77.8 81.6 84.0Employment: Agriculture (% of employed) c 13.1 12.9d ...Employment: Industry (% of employed) c 19.3 19.6d ...Employment: Services and other (% of employed) c 62.5 59.6d ...Unemployment (% of labour force) e 18.7 20.6 20.9Labour force participation (female/male pop. %) e 63.1/77.6 61.9/75.5 63.0/76.4CPI: Consumer price index (2000=100) 112 128 144Agricultural production index (2004-2006=100) 89 91 94f
Food production index (2004-2006=100) 89 91 94f
Balance of payments, current account (million US$) –129 –203 –100f
Total trade Major trading partners 2015(million US$)b (% of exports)b (% of imports)b
Exports 146.3 United States 44.4 United States 45.5Imports 642.1 Trinidad and Tobago 14.6 Trinidad and Tobago 20.8Balance –495.8 United Kingdom 11.5 United Kingdom 4.5Social indicatorsPopulation growth rate (average annual %) 2010-2015 0.8Urban population (%) 2015 18.5Urban population growth rate (average annual %) 2010-2015 0.9Fertility rate, total (live births per woman) 2010-2015 1.9Life expectancy at birth (females/males, years) 2010-2015 77.6/72.2Total dependency ratio (Pop. aged 0-14 & 65+ per 100 pop. 15-64) 2015 47International migrant stock (000/% of total pop.) mid-2015 12.8/6.9Tourist arrivals at national borders (000) 2014 338g
Refugees and others of concern to UNHCR mid-2015 64Infant mortality rate (per 1 000 live births) 2010-2015 11Health: Total expenditure (% of GDP) 2014 6.7Education: Government expenditure (% of GDP) 2014 4.8Education: Secondary gross enrolment ratio (f/m per 100 pop.) 2014 86.2/86.7Education: Tertiary gross enrolment ratio (f/m per 100 pop.) 2014 22.9/10.9Intentional homicide rate (per 100 000 pop.) 2014 21.6h
Seats held by women in national parliaments (%) 2016 16.7Environment and infrastructureMobile-cellular subscriptions (per 100 inhabitants) 2014 102.6ij
Individuals using the Internet (%) 2014 51.0e
Threatened species 2015 58Forested area (% of land area) 2013 33.5e
CO2 emission estimates (000 tons/tons per capita) 2013 407/2.2Energy production, primary (Petajoules) 2013 0Energy supply per capita (Gigajoules) 2013 33.0Terrestrial and marine areas protected (% of total area) 2014 0.7Population using improved drinking water sources (urban/rural, %) 2015 99.5/95.6Population using improved sanitation facilities (urban/rural, %) 2015 84.7/91.9Net Official Development Assistance received (% of GNI) 2014 1.4a Refers to habitable area. Excludes St. Lucia's Forest Reserve. b 2014. c Data classified according toISIC Rev. 3. d 2006. e Estimate. f 2013. g Excluding nationals residing abroad. h 2012. i Break in the timeseries. j Decrease due to change in operator's method of counting pre-paid subscriptions.
174 World Statistics Pocketbook

Saint Pierre and MiquelonRegion Northern America Surface area (sq km) 242Population (proj., 000) 6 Pop. density (per sq km) 27.4Capital city Saint-Pierre Capital city pop. (000) 5 a
Currency Euro (EUR)Economic indicators 2005 2010 2014CPI: Consumer price index (2000=100) 114 ... ...Agricultural production index (2004-2006=100) 92 109 110b
Food production index (2004-2006=100) 92 109 110b
Social indicatorsPopulation growth rate (average annual %) 2010-2015 0.1Urban population (%) 2015 90.4Urban population growth rate (average annual %) 2010-2015 0.1Total dependency ratio (Pop. aged 0-14 & 65+ per 100 pop. 15-64) 2015 48c
International migrant stock (000/% of total pop.) mid-2015 1.0/15.7Environment and infrastructureThreatened species 2015 7Forested area (% of land area) 2013 12.4d
CO2 emission estimates (000 tons/tons per capita) 2013 73/11.7Energy production, primary (Petajoules) 2013 0d
Energy supply per capita (Gigajoules) 2013 162.0d
a 2014. b 2013. c 2006. d Estimate.
World Statistics Pocketbook 175

Saint Vincent and the GrenadinesRegion Caribbean Surface area (sq km) 389Population (proj., 000) 110 Pop. density (per sq km) 281.1Capital city Kingstown Capital city pop. (000) 27 a
Currency East Caribbean Dollar (XCD) UN membership date 16 September 1980Economic indicators 2005 2010 2014GDP: Gross domestic product (million current US$) 551 681 729GDP growth rate (annual %, const. 2005 prices) 2.5 –3.4 0.6GDP per capita (current US$) 5 064.2 6 231.7 6 668.9Economy: Agriculture (% of GVA) 6.2 7.1 7.7Economy: Industry (% of GVA) 18.6 19.2 16.9Economy: Services and other activity (% of GVA) 75.2 73.7 75.4Employment: Agriculture (% of employed) b 22.2c 23.8de ...Employment: Industry (% of employed) b 14.2c 16.2de ...Employment: Services and other (% of employed) b 60.5c 55.2de ...Unemployment (% of labour force) f 19.4 19.1 19.7Labour force participation (female/male pop. %) f 53.3/78.0 55.4/77.9 56.3/77.4CPI: Consumer price index (2000=100) g 109 135 156Agricultural production index (2004-2006=100) 104 120 119h
Food production index (2004-2006=100) 104 120 119h
Balance of payments, current account (million US$) –102 –208 –210h
Total trade Major trading partners 2015(million US$) (% of exports) (% of imports)
Exports 45.8 Barbados 17.9 United States 38.2Imports 333.7 Saint Lucia 17.2 Trinidad and Tobago 17.6Balance –287.9 Antigua and Barbuda 14.4 United Kingdom 7.2Social indicatorsPopulation growth rate (average annual %) 2010-2015 <Urban population (%) 2015 50.6Urban population growth rate (average annual %) 2010-2015 0.7Fertility rate, total (live births per woman) 2010-2015 2.0Life expectancy at birth (females/males, years) 2010-2015 74.9/70.7Total dependency ratio (Pop. aged 0-14 & 65+ per 100 pop. 15-64) 2015 47International migrant stock (000/% of total pop.) mid-2015 4.6/4.2Tourist arrivals at national borders (000) 2014 71i
Infant mortality rate (per 1 000 live births) 2010-2015 17Health: Total expenditure (% of GDP) 2014 8.6Education: Primary gross enrolment ratio (f/m per 100 pop.) 2014 103.0/106.3Education: Secondary gross enrolment ratio (f/m per 100 pop.) 2014 103.2/106.2Intentional homicide rate (per 100 000 pop.) 2014 25.6j
Seats held by women in national parliaments (%) 2016 13.0Environment and infrastructureMobile-cellular subscriptions (per 100 inhabitants) 2014 105.2Individuals using the Internet (%) 2014 56.5f
Threatened species 2015 54Forested area (% of land area) 2013 69.2f
CO2 emission estimates (000 tons/tons per capita) 2013 209/1.9Energy production, primary (Petajoules) 2013 0f
Energy supply per capita (Gigajoules) 2013 28.0Terrestrial and marine areas protected (% of total area) 2014 0.5Population using improved drinking water sources (urban/rural, %) 2015 95.1/95.1Net Official Development Assistance received (% of GNI) 2014 1.3a 2014. b Data classified according to ISIC Rev. 2. c 2001. d Break in the time series. e 2008. f Estimate.g Saint Vincent. h 2013. i Arrivals of non-resident tourists by air. j 2012.
176 World Statistics Pocketbook

SamoaRegion Oceania-Polynesia Surface area (sq km) 2 842Population (proj., 000) 195 Pop. density (per sq km) 68.7Capital city Apia Capital city pop. (000) 37 a
Currency Tala (WST) UN membership date 15 December 1976Economic indicators 2005 2010 2014GDP: Gross domestic product (million current US$) 434 680 824GDP growth rate (annual %, const. 2005 prices) 5.1 4.4 1.6GDP per capita (current US$) 2 413.5 3 656.2 4 293.7Economy: Agriculture (% of GVA) b 12.3 9.1 9.2Economy: Industry (% of GVA) b 30.6 25.9 24.9Economy: Services and other activity (% of GVA) b 57.2 65.0 65.8Employment: Agriculture (% of employed) 39.9cd 35.4cef 5.4eg
Employment: Industry (% of employed) 19.7cd 21.8cef 14.8eg
Employment: Services and other (% of employed) 38.7cd 38.1cef 79.9eg
Unemployment (% of labour force) h 4.7 2.1 6.6Labour force participation (female/male pop. %) h 28.3/69.2 24.1/60.5 23.1/58.0CPI: Consumer price index (2000=100) i 133 174 189j
Agricultural production index (2004-2006=100) 102 106 110j
Food production index (2004-2006=100) 102 106 110j
Balance of payments, current account (million US$) –48e –44 –49Total trade Major trading partners 2015
(million US$) (% of exports) (% of imports)Exports 58.9 Australia 42.1 New Zealand 26.0Imports 370.6 American Samoa 18.3 Singapore 15.5Balance –311.7 New Zealand 14.9 China 14.8Social indicatorsPopulation growth rate (average annual %) 2010-2015 0.8Urban population (%) 2015 19.1Urban population growth rate (average annual %) 2010-2015 –0.2Fertility rate, total (live births per woman) 2010-2015 4.2Life expectancy at birth (females/males, years) 2010-2015 76.4/70.0Total dependency ratio (Pop. aged 0-14 & 65+ per 100 pop. 15-64) 2015 74International migrant stock (000/% of total pop.) mid-2015 4.9/2.6Tourist arrivals at national borders (000) 2014 120Infant mortality rate (per 1 000 live births) 2010-2015 20Health: Total expenditure (% of GDP) 2014 7.2Education: Primary gross enrolment ratio (f/m per 100 pop.) 2014 106.3/106.1Education: Secondary gross enrolment ratio (f/m per 100 pop.) 2014 92.2/81.9Intentional homicide rate (per 100 000 pop.) 2014 3.2j
Seats held by women in national parliaments (%) 2016 6.1Environment and infrastructureMobile-cellular subscriptions (per 100 inhabitants) 2014 55.5Individuals using the Internet (%) 2014 21.2h
Patents: Resident filings (per million pop.) 2014 5.0Threatened species 2015 90Forested area (% of land area) 2013 60.4h
CO2 emission estimates (000 tons/tons per capita) 2013 238/1.3Energy production, primary (Petajoules) 2013 1Energy supply per capita (Gigajoules) 2013 22.0Terrestrial and marine areas protected (% of total area) 2014 0.2Population using improved drinking water sources (urban/rural, %) 2015 97.5/99.3Population using improved sanitation facilities (urban/rural, %) 2015 93.3/91.1Net Official Development Assistance received (% of GNI) 2014 12.0a 2014. b At producers' prices. c Data classified according to ISIC Rev. 3. d 2001. e Break in the timeseries. f 2006. g 2012. h Estimate. i Excluding `Rent´. j 2013.
World Statistics Pocketbook 177

San MarinoRegion Southern Europe Surface area (sq km) 61Population (proj., 000) 32 Pop. density (per sq km) 532.5Capital city San Marino Capital city pop. (000) 4 a
Currency Euro (EUR) UN membership date 2 March 1992Economic indicators 2005 2010 2014GDP: Gross domestic product (million current US$) 2 027 2 139 1 845GDP growth rate (annual %, const. 2005 prices) 2.3 –4.7 –1.0GDP per capita (current US$) 69 332.8 69 708.1 58 392.9Economy: Agriculture (% of GVA) b 0.1 0.1 0.1Economy: Industry (% of GVA) c 38.2 35.6 34.6Economy: Services and other activity (% of GVA) de 61.7 64.4 65.4Employment: Agriculture (% of employed) 0.5f 0.3g ...Employment: Industry (% of employed) 39.3f 34.3g ...Employment: Services and other (% of employed) 60.2f 65.4g ...Unemployment (% of labour force) ... 4.4 6.6gh
Labour force participation (female/male pop. %) 53.8/79.2i ... ...CPI: Consumer price index (2000=100) j 103 118 128Social indicatorsPopulation growth rate (average annual %) 2010-2015 0.7Urban population (%) 2015 94.2Urban population growth rate (average annual %) 2010-2015 0.6Life expectancy at birth (females/males, years) 2010-2015 86.1/81.6k
Total dependency ratio (Pop. aged 0-14 & 65+ per 100 pop. 15-64) 2015 49lm
International migrant stock (000/% of total pop.) mid-2015 4.7/14.8Tourist arrivals at national borders (000) n 2014 75o
Health: Total expenditure (% of GDP) 2014 6.1Health: Physicians (per 1 000 pop.) 2013 5.1Education: Government expenditure (% of GDP) 2014 2.4p
Education: Primary gross enrolment ratio (f/m per 100 pop.) 2014 92.7/93.9kq
Education: Secondary gross enrolment ratio (f/m per 100 pop.) 2014 95.9/93.5kq
Education: Tertiary gross enrolment ratio (f/m per 100 pop.) 2014 69.9/50.5kq
Intentional homicide rate (per 100 000 pop.) 2014 0.0p
Seats held by women in national parliaments (%) 2016 16.7Environment and infrastructureMobile-cellular subscriptions (per 100 inhabitants) 2014 118.9q
Threatened species 2015 1Forested area (% of land area) 2013 0.0q
a 2014. b Excludes irrigation canals and landscaping care. c Excludes publishing activities, includesirrigation canals. d Excludes repair of personal and household goods. e Includes publishing activities andlandscaping care. f Data classified according to ISIC Rev. 3. g Break in the time series. h Persons aged14 years and over. i 2003. j Index base: 2003=100. k 2012. l 2013. m Data calculated on ages 0-15 yearsand 66 years and older as a ratio of 16-65 years old. n Arrivals of non-resident tourists in hotels andsimilar establishments. o Including Italian tourists. p 2011. q Estimate.
178 World Statistics Pocketbook
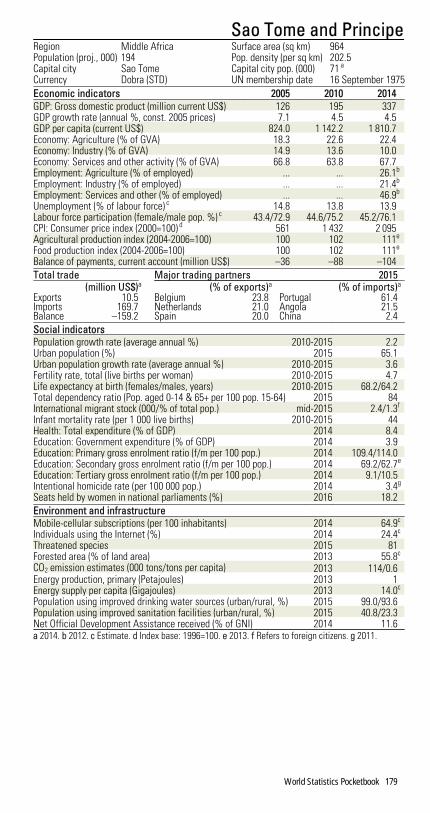
Sao Tome and PrincipeRegion Middle Africa Surface area (sq km) 964Population (proj., 000) 194 Pop. density (per sq km) 202.5Capital city Sao Tome Capital city pop. (000) 71 a
Currency Dobra (STD) UN membership date 16 September 1975Economic indicators 2005 2010 2014GDP: Gross domestic product (million current US$) 126 195 337GDP growth rate (annual %, const. 2005 prices) 7.1 4.5 4.5GDP per capita (current US$) 824.0 1 142.2 1 810.7Economy: Agriculture (% of GVA) 18.3 22.6 22.4Economy: Industry (% of GVA) 14.9 13.6 10.0Economy: Services and other activity (% of GVA) 66.8 63.8 67.7Employment: Agriculture (% of employed) ... ... 26.1b
Employment: Industry (% of employed) ... ... 21.4b
Employment: Services and other (% of employed) ... ... 46.9b
Unemployment (% of labour force) c 14.8 13.8 13.9Labour force participation (female/male pop. %) c 43.4/72.9 44.6/75.2 45.2/76.1CPI: Consumer price index (2000=100) d 561 1 432 2 095Agricultural production index (2004-2006=100) 100 102 111e
Food production index (2004-2006=100) 100 102 111e
Balance of payments, current account (million US$) –36 –88 –104Total trade Major trading partners 2015
(million US$)a (% of exports)a (% of imports)a
Exports 10.5 Belgium 23.8 Portugal 61.4Imports 169.7 Netherlands 21.0 Angola 21.5Balance –159.2 Spain 20.0 China 2.4Social indicatorsPopulation growth rate (average annual %) 2010-2015 2.2Urban population (%) 2015 65.1Urban population growth rate (average annual %) 2010-2015 3.6Fertility rate, total (live births per woman) 2010-2015 4.7Life expectancy at birth (females/males, years) 2010-2015 68.2/64.2Total dependency ratio (Pop. aged 0-14 & 65+ per 100 pop. 15-64) 2015 84International migrant stock (000/% of total pop.) mid-2015 2.4/1.3f
Infant mortality rate (per 1 000 live births) 2010-2015 44Health: Total expenditure (% of GDP) 2014 8.4Education: Government expenditure (% of GDP) 2014 3.9Education: Primary gross enrolment ratio (f/m per 100 pop.) 2014 109.4/114.0Education: Secondary gross enrolment ratio (f/m per 100 pop.) 2014 69.2/62.7e
Education: Tertiary gross enrolment ratio (f/m per 100 pop.) 2014 9.1/10.5Intentional homicide rate (per 100 000 pop.) 2014 3.4g
Seats held by women in national parliaments (%) 2016 18.2Environment and infrastructureMobile-cellular subscriptions (per 100 inhabitants) 2014 64.9c
Individuals using the Internet (%) 2014 24.4c
Threatened species 2015 81Forested area (% of land area) 2013 55.8c
CO2 emission estimates (000 tons/tons per capita) 2013 114/0.6Energy production, primary (Petajoules) 2013 1Energy supply per capita (Gigajoules) 2013 14.0c
Population using improved drinking water sources (urban/rural, %) 2015 99.0/93.6Population using improved sanitation facilities (urban/rural, %) 2015 40.8/23.3Net Official Development Assistance received (% of GNI) 2014 11.6a 2014. b 2012. c Estimate. d Index base: 1996=100. e 2013. f Refers to foreign citizens. g 2011.
World Statistics Pocketbook 179

Saudi ArabiaRegion Western Asia Surface area (sq km) 2 206 714Population (proj., 000) 32 158 Pop. density (per sq km) 15.0Capital city Riyadh Capital city pop. (000) 6 370Currency Saudi Riyal (SAR) UN membership date 24 October 1945Economic indicators 2005 2010 2014GDP: Gross domestic product (million current US$) 328 461 526 811 752 460GDP growth rate (annual %, const. 2005 prices) 5.6 4.8 3.6GDP per capita (current US$) 13 273.7 18 754.0 24 362.1Economy: Agriculture (% of GVA) 3.2 2.4 1.9Economy: Industry (% of GVA) 61.8 58.4 57.5Economy: Services and other activity (% of GVA) 35.0 39.2 40.6Employment: Agriculture (% of employed) 4.7ab 4.1ac 4.9d
Employment: Industry (% of employed) 21.0ab 20.4ac 24.2d
Employment: Services and other (% of employed) 74.4ab 75.5ac 70.9d
Unemployment (% of labour force) e 5.8 5.6 5.9Labour force participation (female/male pop. %) e 17.5/75.4 18.3/75.8 20.0/78.9CPI: Consumer price index (2000=100) f 100 130 139Agricultural production index (2004-2006=100) 100 108 107d
Food production index (2004-2006=100) 100 108 108d
Index of industrial production (2005=100) a 100 112 135Balance of payments, current account (million US$) 90 060g 66 751 73 758Total trade Major trading partners 2015
(million US$) (% of exports)h (% of imports)Exports 201 491.8 Asia nes 48.1 China 14.6Imports 163 821.0 N & C Ame nes 10.5 United States 13.4Balance 37 670.8 Europe nes 9.5 Germany 7.2Social indicatorsPopulation growth rate (average annual %) 2010-2015 2.3Urban population (%) 2015 83.1Urban population growth rate (average annual %) 2010-2015 2.1Fertility rate, total (live births per woman) 2010-2015 2.9Life expectancy at birth (females/males, years) 2010-2015 75.5/72.8Total dependency ratio (Pop. aged 0-14 & 65+ per 100 pop. 15-64) 2015 46International migrant stock (000/% of total pop.) mid-2015 10 185.9/32.3ij
Tourist arrivals at national borders (000) 2014 18 259Refugees and others of concern to UNHCR mid-2015 70 304Infant mortality rate (per 1 000 live births) 2010-2015 15Health: Total expenditure (% of GDP) 2014 4.7k
Health: Physicians (per 1 000 pop.) 2013 2.5l
Education: Primary gross enrolment ratio (f/m per 100 pop.) 2014 108.3/109.2Education: Secondary gross enrolment ratio (f/m per 100 pop.) 2014 93.8/122.6e
Education: Tertiary gross enrolment ratio (f/m per 100 pop.) 2014 59.9/62.4Intentional homicide rate (per 100 000 pop.) 2014 6.2l
Seats held by women in national parliaments (%) 2016 19.9Environment and infrastructureMobile-cellular subscriptions (per 100 inhabitants) 2014 179.6Individuals using the Internet (%) 2014 63.7Patents: Resident filings (per million pop.) 2014 32.0Threatened species 2015 119Forested area (% of land area) 2013 0.5e
CO2 emission estimates (000 tons/tons per capita) 2013 541 429/17.9Energy production, primary (Petajoules) 2013 25 573m
Energy supply per capita (Gigajoules) 2013 264.0m
Terrestrial and marine areas protected (% of total area) 2014 28.2Population using improved drinking water sources (urban/rural, %) 2015 97.0/97.0Population using improved sanitation facilities (urban/rural, %) 2015 100.0/100.0a Data classified according to ISIC Rev. 3. b 2002. c 2009. d 2013. e Estimate. f All cities. g Break in thetime series. h See technical notes. i Including refugees. j Refers to foreign citizens. k Data revision. l2012. m The data for crude oil production include 50 per cent of the output of the Neutral Zone.
180 World Statistics Pocketbook

SenegalRegion Western Africa Surface area (sq km) 196 712 a
Population (proj., 000) 15 590 Pop. density (per sq km) 81.0Capital city Dakar Capital city pop. (000) 3 520Currency CFA Franc (XOF) UN membership date 28 September 1960Economic indicators 2005 2010 2014GDP: Gross domestic product (million current US$) 8 708 12 926 15 658GDP growth rate (annual %, const. 2005 prices) 5.6 4.2 4.4GDP per capita (current US$) 772.7 997.6 1 067.2Economy: Agriculture (% of GVA) 16.8 17.5 15.3Economy: Industry (% of GVA) 23.6 23.4 24.3Economy: Services and other activity (% of GVA) 59.6 59.2 60.4Employment: Agriculture (% of employed) 45.6bc 33.7de 46.1fg
Employment: Industry (% of employed) 12.4bc 14.8de 18.1fg
Employment: Services and other (% of employed) 36.1bc 36.1de 22.4fg
Unemployment (% of labour force) h 8.5 9.3 9.7Labour force participation (female/male pop. %) h 35.6/71.2 42.4/69.6 44.9/70.0CPI: Consumer price index (2000=100) 108i 99fj 104j
Agricultural production index (2004-2006=100) 110 151 126k
Food production index (2004-2006=100) 110 152 126k
Index of industrial production (2005=100) d 100 104 103Balance of payments, current account (million US$) –676f –589 ...Total trade Major trading partners 2015
(million US$)l (% of exports)l (% of imports)l
Exports 2 813.7 Mali 16.8 France 16.4Imports 6 556.7 Switzerland 9.7 Netherlands 8.2Balance –3 743.0 Bunkers 8.3m Nigeria 8.0Social indicatorsPopulation growth rate (average annual %) 2010-2015 3.1Urban population (%) 2015 43.7Urban population growth rate (average annual %) 2010-2015 3.6Fertility rate, total (live births per woman) 2010-2015 5.2Life expectancy at birth (females/males, years) 2010-2015 67.6/63.9Total dependency ratio (Pop. aged 0-14 & 65+ per 100 pop. 15-64) 2015 88International migrant stock (000/% of total pop.) mid-2015 263.2/1.7n
Tourist arrivals at national borders (000) 2014 836h
Refugees and others of concern to UNHCR mid-2015 17 260Infant mortality rate (per 1 000 live births) 2010-2015 44Health: Total expenditure (% of GDP) 2014 4.7Education: Primary gross enrolment ratio (f/m per 100 pop.) 2014 84.3/77.5Education: Secondary gross enrolment ratio (f/m per 100 pop.) 2014 38.3/41.9gh
Intentional homicide rate (per 100 000 pop.) 2014 7.9o
Seats held by women in national parliaments (%) 2016 42.7Environment and infrastructureMobile-cellular subscriptions (per 100 inhabitants) 2014 98.8Individuals using the Internet (%) 2014 17.7h
Threatened species 2015 106Forested area (% of land area) 2013 43.4h
CO2 emission estimates (000 tons/tons per capita) 2013 8 423/0.6Energy production, primary (Petajoules) 2013 75Energy supply per capita (Gigajoules) 2013 11.0Terrestrial and marine areas protected (% of total area) 2014 14.5Population using improved drinking water sources (urban/rural, %) 2015 92.9/67.3Population using improved sanitation facilities (urban/rural, %) 2015 65.4/33.8Net Official Development Assistance received (% of GNI) 2014 7.2a Surface area is based on the 2002 population and housing census. b Data classified according to ISICRev. 2. c 2001. d Data classified according to ISIC Rev. 3. e 2006. f Break in the time series. g 2011. hEstimate. i Dakar. j Index base: 2008=100. k 2013. l 2014. m See technical notes. n Including refugees.o 2012.
World Statistics Pocketbook 181

SerbiaRegion Southern Europe Surface area (sq km) 88 361Population (proj., 000) 8 813 a Pop. density (per sq km) 100.8 a
Capital city Belgrade Capital city pop. (000) 1 182 b
Currency Serbian Dinar (RSD) UN membership date 1 November 2000Economic indicators 2005 2010 2014GDP: Gross domestic product (million current US$) c 26 252 39 460 43 866GDP growth rate (annual %, const. 2005 prices) c 5.5 0.6 –1.8GDP per capita (current US$) c 3 528.1 5 411.9 6 154.8Economy: Agriculture (% of GVA) cd 12.0 10.2 9.7Economy: Industry (% of GVA) ce 29.3 28.4 29.8Economy: Services and other activity (% of GVA) cfg 58.7 61.4 60.5Employment: Agriculture (% of employed) 23.3h 22.2i 21.3jkl
Employment: Industry (% of employed) 27.6h 26.0i 25.9jkl
Employment: Services and other (% of employed) 49.1h 51.8i 52.9jkl
Unemployment (% of labour force) m 20.8 19.2 18.9Labour force participation (female/male pop. %) m 44.9/63.9 42.6/59.1 43.4/60.2CPI: Consumer price index (2000=100) 330 137in ...Agricultural production index (2004-2006=100) ... 103 105l
Food production index (2004-2006=100) ... 103 105l
Index of industrial production (2005=100) o 100 97 96Balance of payments, current account (million US$) ... –2 692 –2 635Total trade Major trading partners 2015
(million US$) (% of exports) (% of imports)Exports 13 365.2 Italy 16.2 Germany 12.4Imports 18 215.9 Germany 12.5 Italy 10.6Balance –4 850.7 Bosnia-Herzegovina 8.8 Russian Federation 9.6Social indicatorsPopulation growth rate (average annual %) 2010-2015 –0.5a
Urban population (%) 2015 55.6a
Urban population growth rate (average annual %) 2010-2015 –0.3a
Fertility rate, total (live births per woman) 2010-2015 1.6a
Life expectancy at birth (females/males, years) 2010-2015 77.5/71.8a
Total dependency ratio (Pop. aged 0-14 & 65+ per 100 pop. 15-64) 2015 50a
International migrant stock (000/% of total pop.) mid-2015 807.4/9.1a
Tourist arrivals at national borders (000) p 2014 1 029Refugees and others of concern to UNHCR mid-2015 259 722a
Infant mortality rate (per 1 000 live births) 2010-2015 10a
Health: Total expenditure (% of GDP) 2014 10.4Education: Government expenditure (% of GDP) 2014 4.4q
Education: Primary gross enrolment ratio (f/m per 100 pop.) 2014 101.4/100.9m
Education: Secondary gross enrolment ratio (f/m per 100 pop.) 2014 95.4/93.3m
Education: Tertiary gross enrolment ratio (f/m per 100 pop.) 2014 66.0/50.5m
Intentional homicide rate (per 100 000 pop.) 2014 1.3Seats held by women in national parliaments (%) 2016 34.0Environment and infrastructureMobile-cellular subscriptions (per 100 inhabitants) 2014 122.1Individuals using the Internet (%) 2014 53.5m
Patents: Resident filings (per million pop.) 2014 30.0Threatened species 2015 56Forested area (% of land area) 2013 31.1m
CO2 emission estimates (000 tons/tons per capita) 2013 44 869/5.0Energy production, primary (Petajoules) 2013 473r
Energy supply per capita (Gigajoules) 2013 69.0r
Terrestrial and marine areas protected (% of total area) 2014 6.8Population using improved drinking water sources (urban/rural, %) 2015 99.4/98.9Population using improved sanitation facilities (urban/rural, %) 2015 98.2/94.2Net Official Development Assistance received (% of GNI) 2014 0.9a Including Kosovo. b Refers to Belgrade settlement. c Excluding Kosovo and Metohija. d Excludes irri-gation canals and landscaping care. e Excludes publishing activities, includes irrigation canals. f Excludesrepair of personal and household goods. g Includes publishing activities and landscaping care. h Dataclassified according to ISIC Rev. 3. i Break in the time series. j Excluding the institutional population. kExcluding some areas. l 2013. m Estimate. n Index base: 2006=100. o Excluding water and waste man-agement. p Arrivals of non-resident tourists in all types of tourism accommodation establishments. q2012. r Excluding Kosovo.
182 World Statistics Pocketbook

SeychellesRegion Eastern Africa Surface area (sq km) 457Population (proj., 000) 97 Pop. density (per sq km) 210.9Capital city Victoria Capital city pop. (000) 26 a
Currency Seychelles Rupee (SCR) UN membership date 21 September 1976Economic indicators 2005 2010 2014GDP: Gross domestic product (million current US$) 919 970 1 511GDP growth rate (annual %, const. 2005 prices) 9.0 6.0 8.7GDP per capita (current US$) 10 356.5 10 420.8 15 758.6Economy: Agriculture (% of GVA) b 3.9 2.7 2.4Economy: Industry (% of GVA) c 19.4 16.5 15.9Economy: Services and other activity (% of GVA) de 76.8 80.8 81.6Employment: Agriculture (% of employed) fg ... ... 3.6h
Employment: Industry (% of employed) fg ... ... 17.9h
Employment: Services and other (% of employed) fg ... ... 78.2h
Unemployment (% of labour force) 5.5i ... 4.1fgh
Labour force participation (female/male pop. %) fg ... ... 61.9/68.3h
CPI: Consumer price index (2000=100) 115 215 250Agricultural production index (2004-2006=100) 98 91 110j
Food production index (2004-2006=100) 98 94 114j
Balance of payments, current account (million US$) –188 –214 –310Social indicatorsPopulation growth rate (average annual %) 2010-2015 0.7Urban population (%) 2015 53.9Urban population growth rate (average annual %) 2010-2015 1.1Fertility rate, total (live births per woman) 2010-2015 2.3Life expectancy at birth (females/males, years) 2010-2015 77.9/68.7Total dependency ratio (Pop. aged 0-14 & 65+ per 100 pop. 15-64) 2015 44International migrant stock (000/% of total pop.) mid-2015 12.8/13.3Tourist arrivals at national borders (000) 2014 233Infant mortality rate (per 1 000 live births) 2010-2015 10Health: Total expenditure (% of GDP) 2014 3.4Health: Physicians (per 1 000 pop.) 2013 1.1k
Education: Government expenditure (% of GDP) 2014 3.6h
Education: Primary gross enrolment ratio (f/m per 100 pop.) 2014 104.7/103.6Education: Secondary gross enrolment ratio (f/m per 100 pop.) 2014 75.4/73.9Education: Tertiary gross enrolment ratio (f/m per 100 pop.) 2014 9.4/3.8Seats held by women in national parliaments (%) 2016 43.8Environment and infrastructureMobile-cellular subscriptions (per 100 inhabitants) 2014 162.2Individuals using the Internet (%) 2014 54.3l
Threatened species 2015 435Forested area (% of land area) 2013 89.4l
CO2 emission estimates (000 tons/tons per capita) 2013 645/6.8Energy production, primary (Petajoules) 2013 0Energy supply per capita (Gigajoules) 2013 94.0Terrestrial and marine areas protected (% of total area) 2014 0.1Population using improved drinking water sources (urban/rural, %) 2015 95.7/95.7Population using improved sanitation facilities (urban/rural, %) 2015 98.4/98.4Net Official Development Assistance received (% of GNI) 2014 0.7a 2014. b Excludes irrigation canals and landscaping care. c Excludes publishing activities, includesirrigation canals. d Includes publishing activities and landscaping care. e Excludes repair of personal andhousehold goods. f Excluding the institutional population. g Excluding some areas. h 2011. i Break in thetime series. j 2013. k 2012. l Estimate.
World Statistics Pocketbook 183

Sierra LeoneRegion Western Africa Surface area (sq km) 72 300Population (proj., 000) 6 592 Pop. density (per sq km) 91.3Capital city Freetown Capital city pop. (000) 1 007Currency Leone (SLL) UN membership date 27 September 1961Economic indicators 2005 2010 2014GDP: Gross domestic product (million current US$) 1 651 2 578 4 893GDP growth rate (annual %, const. 2005 prices) 4.5 5.4 7.0GDP per capita (current US$) 325.5 446.4 774.8Economy: Agriculture (% of GVA) 51.0 55.2 52.3Economy: Industry (% of GVA) 11.6 8.1 15.2Economy: Services and other activity (% of GVA) 37.4 36.7 32.4Employment: Agriculture (% of employed) a 68.5bc ... ...Employment: Industry (% of employed) a 6.5bc ... ...Employment: Services and other (% of employed) a 25.0bc ... ...Unemployment (% of labour force) d 3.4 3.4 3.4Labour force participation (female/male pop. %) d 65.1/66.7 65.1/67.9 65.0/68.5CPI: Consumer price index (2000=100) e 132 239f 370Agricultural production index (2004-2006=100) 93 149 169g
Food production index (2004-2006=100) 93 149 169g
Balance of payments, current account (million US$) –171 –746 –1 317Total trade Major trading partners 2015
(million US$)h (% of exports)h (% of imports)h
Exports 279.3 China 86.4 Benin 35.6Imports 2 056.8 Guinea 3.0 Belgium 14.2Balance –1 777.5 Netherlands 2.8 China 8.2Social indicatorsPopulation growth rate (average annual %) 2010-2015 2.2Urban population (%) 2015 39.9Urban population growth rate (average annual %) 2010-2015 2.8Fertility rate, total (live births per woman) 2010-2015 4.8Life expectancy at birth (females/males, years) 2010-2015 50.7/49.7Total dependency ratio (Pop. aged 0-14 & 65+ per 100 pop. 15-64) 2015 82International migrant stock (000/% of total pop.) mid-2015 91.2/1.4i
Tourist arrivals at national borders (000) 2014 44j
Refugees and others of concern to UNHCR mid-2015 1 387Infant mortality rate (per 1 000 live births) 2010-2015 94Health: Total expenditure (% of GDP) 2014 11.1k
Education: Government expenditure (% of GDP) 2014 2.8Education: Primary gross enrolment ratio (f/m per 100 pop.) 2014 129.8/130.3g
Education: Secondary gross enrolment ratio (f/m per 100 pop.) 2014 40.0/46.9g
Intentional homicide rate (per 100 000 pop.) 2014 1.9l
Seats held by women in national parliaments (%) 2016 12.4Environment and infrastructureMobile-cellular subscriptions (per 100 inhabitants) 2014 76.7d
Individuals using the Internet (%) 2014 2.1d
Threatened species 2015 158Forested area (% of land area) 2013 40.4d
CO2 emission estimates (000 tons/tons per capita) 2013 1 192/0.2Energy production, primary (Petajoules) 2013 52Energy supply per capita (Gigajoules) 2013 11.0Terrestrial and marine areas protected (% of total area) 2014 3.8Population using improved drinking water sources (urban/rural, %) 2015 84.9/47.8Population using improved sanitation facilities (urban/rural, %) 2015 22.9/6.9Net Official Development Assistance received (% of GNI) 2014 20.9a Data classified according to ISIC Rev. 3. b Persons aged 10 years and over. c 2004. d Estimate. e Indexbase: 2003=100. f Series linked to former series. g 2013. h 2014. i Including refugees. j Arrivals by air.k Data revision. l 2012.
184 World Statistics Pocketbook

SingaporeRegion South-Eastern Asia Surface area (sq km) 718 a
Population (proj., 000) 5 697 Pop. density (per sq km) 8 137.9Capital city Singapore Capital city pop. (000) 5 619Currency Singapore Dollar (SGD) UN membership date 21 September 1965Economic indicators 2005 2010 2014GDP: Gross domestic product (million current US$) 127 418 236 420 307 872GDP growth rate (annual %, const. 2005 prices) 7.5 15.2 2.9GDP per capita (current US$) 28 343.2 46 548.9 55 909.8Economy: Agriculture (% of GVA) bc 0.1 < <Economy: Industry (% of GVA) de 32.4 27.6 24.9Economy: Services and other activity (% of GVA) fg 67.6 72.3 75.0Employment: Agriculture (% of employed) 1.1hij ... ...Employment: Industry (% of employed) 21.7hij 30.4 28.3Employment: Services and other (% of employed) 77.3hij 68.9 70.6Unemployment (% of labour force) k 4.1 3.1 2.8Labour force participation (female/male pop. %) k 53.5/76.7 57.3/77.5 58.5/76.7CPI: Consumer price index (2000=100) 103 117 132l
Agricultural production index (2004-2006=100) 90 92 112l
Food production index (2004-2006=100) 90 92 112l
Balance of payments, current account (million US$) 27 868 55 943 58 772Total trade Major trading partners 2015
(million US$) (% of exports) (% of imports)Exports 346 638.0 China 13.8 China 14.2Imports 296 744.6 China, Hong Kong SAR 11.4 United States 11.2Balance 49 893.4 Malaysia 10.9 Malaysia 11.1Social indicatorsPopulation growth rate (average annual %) 2010-2015 2.0Urban population (%) 2015 100.0Urban population growth rate (average annual %) 2010-2015 2.0Fertility rate, total (live births per woman) 2010-2015 1.2Life expectancy at birth (females/males, years) 2010-2015 85.6/79.6Total dependency ratio (Pop. aged 0-14 & 65+ per 100 pop. 15-64) 2015 37International migrant stock (000/% of total pop.) mid-2015 2 543.6/45.4Tourist arrivals at national borders (000) 2014 11 864Refugees and others of concern to UNHCR mid-2015 1Infant mortality rate (per 1 000 live births) 2010-2015 2Health: Total expenditure (% of GDP) 2014 4.9Health: Physicians (per 1 000 pop.) 2013 2.0Education: Government expenditure (% of GDP) 2014 2.9l
Intentional homicide rate (per 100 000 pop.) 2014 0.3Seats held by women in national parliaments (%) 2016 23.1Environment and infrastructureMobile-cellular subscriptions (per 100 inhabitants) 2014 158.1k
Individuals using the Internet (%) 2014 82.0k
Patents: Resident filings (per million pop.) 2014 238.0Threatened species 2015 287Forested area (% of land area) 2013 23.1k
CO2 emission estimates (000 tons/tons per capita) 2013 50 557/9.4Energy production, primary (Petajoules) 2013 0Energy supply per capita (Gigajoules) 2013 207.0Terrestrial and marine areas protected (% of total area) 2014 3.4Population using improved drinking water sources (urban/rural, %) 2015 100.0/...Population using improved sanitation facilities (urban/rural, %) 2015 100.0/...a The land area of Singapore comprises the mainland and other islands. b Excludes irrigation canals andlandscaping care. c Includes mining and quarrying. d Excludes publishing activities, includes irrigationcanals. e Excludes mining and quarrying. f Excludes repair of personal and household goods. g Includespublishing activities and landscaping care. h Data classified according to ISIC Rev. 3. i Data refer topermanent residents. j Agriculture includes mining and quarrying, electricity, gas and water supply andnot classifiable by economic activity. k Estimate. l 2013.
World Statistics Pocketbook 185

Sint Maarten (Dutch part)Region Caribbean Surface area (sq km) 34Population (proj., 000) 40 Pop. density (per sq km) 1 162.9Capital city Philipsburg Capital city pop. (000) 1 a
Currency Netherlands Antillean Guilder (ANG)Economic indicators 2005 2010 2014GDP: Gross domestic product (million current US$) 705 892 1 059GDP growth rate (annual %, const. 2005 prices) ... 1.1 1.7GDP per capita (current US$) 21 662.5 26 937.1 28 084.1Economy: Agriculture (% of GVA) 0.5 0.2 0.1Economy: Industry (% of GVA) 16.0 13.0 12.0Economy: Services and other activity (% of GVA) 83.5 86.8 87.9Balance of payments, current account (million US$) ... ... –47Social indicatorsPopulation growth rate (average annual %) 2010-2015 3.1Urban population (%) 2015 100.0Urban population growth rate (average annual %) 2010-2015 2.0International migrant stock (000/% of total pop.) mid-2015 27.3/70.5Tourist arrivals at national borders (000) 2014 500bc
Refugees and others of concern to UNHCR mid-2015 8Environment and infrastructureThreatened species 2015 49CO2 emission estimates (000 tons/tons per capita) 2013 763/20.9Energy supply per capita (Gigajoules) 2013 327.0d
a 2001. b Arrivals by air. c Including arrivals to Saint Martin (the French side of the island). d Estimate.
186 World Statistics Pocketbook

SlovakiaRegion Eastern Europe Surface area (sq km) 49 035 a
Population (proj., 000) 5 429 Pop. density (per sq km) 112.9Capital city Bratislava Capital city pop. (000) 401Currency Euro (EUR) UN membership date 19 January 1993Economic indicators 2005 2010 2014GDP: Gross domestic product (million current US$) 48 805 89 249 100 249GDP growth rate (annual %, const. 2005 prices) 6.4 5.1 2.5GDP per capita (current US$) 9 062.9 16 506.6 18 486.3Economy: Agriculture (% of GVA) b 3.6 2.8 4.4Economy: Industry (% of GVA) c 36.1 35.2 33.6Economy: Services and other activity (% of GVA) de 60.3 62.0 62.0Employment: Agriculture (% of employed) 4.7fg 3.2 3.5Employment: Industry (% of employed) 38.9fg 37.2 35.5Employment: Services and other (% of employed) 56.2fg 59.5 60.9Unemployment (% of labour force) h 16.3 14.4 13.2Labour force participation (female/male pop. %) h 51.2/68.5 50.8/67.8 51.4/68.4CPI: Consumer price index (2000=100) 133 153 167Agricultural production index (2004-2006=100) 102 82 89i
Food production index (2004-2006=100) 102 82 89i
Index of industrial production (2005=100) j 100 127 158Balance of payments, current account (million US$) –5 125 –4 211 176Total trade Major trading partners 2015
(million US$) (% of exports) (% of imports)Exports 75 256.9 Germany 22.7 Germany 15.4Imports 73 147.0 Czech Republic 12.4 Czech Republic 10.9Balance 2 109.9 Poland 8.3 Europe nes 10.6k
Social indicatorsPopulation growth rate (average annual %) 2010-2015 0.1Urban population (%) 2015 53.6Urban population growth rate (average annual %) 2010-2015 –0.3Fertility rate, total (live births per woman) 2010-2015 1.4Life expectancy at birth (females/males, years) 2010-2015 79.7/72.2Total dependency ratio (Pop. aged 0-14 & 65+ per 100 pop. 15-64) 2015 41International migrant stock (000/% of total pop.) mid-2015 177.2/3.3Tourist arrivals at national borders (000) 2014 6 235l
Refugees and others of concern to UNHCR mid-2015 2 531m
Infant mortality rate (per 1 000 live births) 2010-2015 5Health: Total expenditure (% of GDP) 2014 8.1Health: Physicians (per 1 000 pop.) 2013 3.3l
Education: Government expenditure (% of GDP) 2014 4.1i
Education: Primary gross enrolment ratio (f/m per 100 pop.) 2014 100.4/101.6Education: Secondary gross enrolment ratio (f/m per 100 pop.) 2014 92.4/91.5Education: Tertiary gross enrolment ratio (f/m per 100 pop.) 2014 64.6/41.8Intentional homicide rate (per 100 000 pop.) 2014 1.1Seats held by women in national parliaments (%) 2016 18.7Environment and infrastructureMobile-cellular subscriptions (per 100 inhabitants) 2014 116.9Individuals using the Internet (%) 2014 80.0n
Patents: Resident filings (per million pop.) 2014 44.0Threatened species 2015 45Forested area (% of land area) 2013 40.3h
CO2 emission estimates (000 tons/tons per capita) 2013 33 678/6.2Energy production, primary (Petajoules) 2013 269Energy supply per capita (Gigajoules) 2013 131.0Terrestrial and marine areas protected (% of total area) 2014 36.6Population using improved drinking water sources (urban/rural, %) 2015 100.0/100.0Population using improved sanitation facilities (urban/rural, %) 2015 99.4/98.2Net Official Development Assistance disbursed (% of GNI) o 2014 0.1a Excluding inland water. b Excludes irrigation canals and landscaping care. c Excludes publishing ac-tivities, includes irrigation canals. d Excludes repair of personal and household goods. e Includespublishing activities and landscaping care. f Data classified according to ISIC Rev. 3. g Break in the timeseries. h Estimate. i 2013. j Excluding water and waste management. k See technical notes. l 2012. mRefugee population relates to the end of 2014. n Population age 16-74. o Development Assistance Com-mittee member (OECD).
World Statistics Pocketbook 187

SloveniaRegion Southern Europe Surface area (sq km) 20 273Population (proj., 000) 2 069 Pop. density (per sq km) 102.8Capital city Ljubljana Capital city pop. (000) 279 a
Currency Euro (EUR) UN membership date 22 May 1992Economic indicators 2005 2010 2014GDP: Gross domestic product (million current US$) 36 345 48 014 49 491GDP growth rate (annual %, const. 2005 prices) 4.0 1.2 3.1GDP per capita (current US$) 18 204.1 23 393.0 23 954.4Economy: Agriculture (% of GVA) b 2.6 2.0 2.2Economy: Industry (% of GVA) c 34.1 30.6 33.2Economy: Services and other activity (% of GVA) de 63.3 67.4 64.6Employment: Agriculture (% of employed) 7.3fg 7.0 7.7Employment: Industry (% of employed) 37.7fg 33.1 31.5Employment: Services and other (% of employed) 54.5fg 59.5 60.2Unemployment (% of labour force) h 6.5 7.2 9.7Labour force participation (female/male pop. %) h 52.8/66.0 53.2/65.5 52.4/63.3CPI: Consumer price index (2000=100) 131 150 160Agricultural production index (2004-2006=100) 99 92 81i
Food production index (2004-2006=100) 99 92 81i
Index of industrial production (2005=100) j 100 103 104Balance of payments, current account (million US$) –681 –55 3 451Total trade Major trading partners 2015
(million US$) (% of exports) (% of imports)Exports 26 616.0 Germany 20.6 Germany 17.3Imports 25 763.9 Italy 11.2 Italy 14.4Balance 852.1 Austria 8.3 Austria 8.6Social indicatorsPopulation growth rate (average annual %) 2010-2015 0.2Urban population (%) 2015 49.7Urban population growth rate (average annual %) 2010-2015 0.1Fertility rate, total (live births per woman) 2010-2015 1.6Life expectancy at birth (females/males, years) 2010-2015 83.1/76.9Total dependency ratio (Pop. aged 0-14 & 65+ per 100 pop. 15-64) 2015 49International migrant stock (000/% of total pop.) mid-2015 236.0/11.4Tourist arrivals at national borders (000) k 2014 2 411Refugees and others of concern to UNHCR mid-2015 330Infant mortality rate (per 1 000 live births) 2010-2015 3Health: Total expenditure (% of GDP) 2014 9.2Education: Government expenditure (% of GDP) 2014 5.7l
Education: Primary gross enrolment ratio (f/m per 100 pop.) 2014 99.4/99.2Education: Secondary gross enrolment ratio (f/m per 100 pop.) 2014 110.5/110.8Education: Tertiary gross enrolment ratio (f/m per 100 pop.) 2014 98.5/68.2Intentional homicide rate (per 100 000 pop.) 2014 0.7Seats held by women in national parliaments (%) 2016 36.7Environment and infrastructureMobile-cellular subscriptions (per 100 inhabitants) 2014 112.1Individuals using the Internet (%) 2014 71.6m
Threatened species 2015 125Forested area (% of land area) 2013 62.0h
CO2 emission estimates (000 tons/tons per capita) 2013 14 441/7.0Energy production, primary (Petajoules) 2013 149Energy supply per capita (Gigajoules) 2013 139.0Terrestrial and marine areas protected (% of total area) 2014 54.0Population using improved drinking water sources (urban/rural, %) 2015 99.7/99.4Population using improved sanitation facilities (urban/rural, %) 2015 99.1/99.1Net Official Development Assistance disbursed (% of GNI) n 2014 0.1a 2014. b Excludes irrigation canals and landscaping care. c Excludes publishing activities, includesirrigation canals. d Excludes repair of personal and household goods. e Includes publishing activities andlandscaping care. f Data classified according to ISIC Rev. 3. g Break in the time series. h Estimate. i 2013.j Excluding water and waste management. k Arrivals of non-resident tourists in all types of tourismaccommodation establishments. l 2012. m Population age 16-74. n Development Assistance Committeemember (OECD).
188 World Statistics Pocketbook

Solomon IslandsRegion Oceania-Melanesia Surface area (sq km) 28 896Population (proj., 000) 595 Pop. density (per sq km) 21.3Capital city Honiara Capital city pop. (000) 73 a
Currency Solomon Is. Dollar (SBD) b UN membership date 19 September 1978Economic indicators 2005 2010 2014GDP: Gross domestic product (million current US$) 429 720 1 103GDP growth rate (annual %, const. 2005 prices) 12.9 10.6 1.5GDP per capita (current US$) 915.1 1 367.6 1 927.2Economy: Agriculture (% of GVA) 30.4 28.7 28.2Economy: Industry (% of GVA) 7.5 13.3 15.8Economy: Services and other activity (% of GVA) 62.1 57.9 56.0Unemployment (% of labour force) c 39.7 35.6 33.9Labour force participation (female/male pop. %) c 61.3/74.3 61.2/74.2 61.2/73.6CPI: Consumer price index (2000=100) d 149 226 271e
Agricultural production index (2004-2006=100) 103 110 118e
Food production index (2004-2006=100) 103 110 118e
Balance of payments, current account (million US$) –90 –144 –50Total trade Major trading partners 2015
(million US$) (% of exports) (% of imports)Exports 400.4 China 58.0 Australia 28.9Imports 465.8 United Kingdom 7.4 Singapore 17.1Balance –65.4 India 7.2 Malaysia 10.7Social indicatorsPopulation growth rate (average annual %) 2010-2015 2.1Urban population (%) 2015 22.3Urban population growth rate (average annual %) 2010-2015 4.3Fertility rate, total (live births per woman) 2010-2015 4.1Life expectancy at birth (females/males, years) 2010-2015 69.0/66.2Total dependency ratio (Pop. aged 0-14 & 65+ per 100 pop. 15-64) 2015 75International migrant stock (000/% of total pop.) mid-2015 2.6/0.4Tourist arrivals at national borders (000) 2014 20Refugees and others of concern to UNHCR mid-2015 3Infant mortality rate (per 1 000 live births) 2010-2015 38Health: Total expenditure (% of GDP) 2014 5.1Education: Primary gross enrolment ratio (f/m per 100 pop.) 2014 112.1/115.5Education: Secondary gross enrolment ratio (f/m per 100 pop.) 2014 47.0/49.8f
Seats held by women in national parliaments (%) 2016 2.0Environment and infrastructureMobile-cellular subscriptions (per 100 inhabitants) 2014 65.8Individuals using the Internet (%) 2014 9.0c
Threatened species 2015 238Forested area (% of land area) 2013 78.5c
CO2 emission estimates (000 tons/tons per capita) 2013 198/0.4Energy production, primary (Petajoules) 2013 3c
Energy supply per capita (Gigajoules) 2013 11.0c
Terrestrial and marine areas protected (% of total area) 2014 0.2Population using improved drinking water sources (urban/rural, %) 2015 93.2/77.2Population using improved sanitation facilities (urban/rural, %) 2015 81.4/15.0Net Official Development Assistance received (% of GNI) 2014 18.1a 2014. b Solomon Islands Dollar. c Estimate. d Honiara. e 2013. f 2012.
World Statistics Pocketbook 189

SomaliaRegion Eastern Africa Surface area (sq km) 637 657Population (proj., 000) 11 079 Pop. density (per sq km) 17.7Capital city Mogadishu Capital city pop. (000) 2 138Currency Somali Shilling (SOS) UN membership date 20 September 1960Economic indicators 2005 2010 2014GDP: Gross domestic product (million current US$) 2 316 1 071 1 375GDP growth rate (annual %, const. 2005 prices) 3.0 2.6 2.6GDP per capita (current US$) 273.5 111.8 130.7Economy: Agriculture (% of GVA) 60.1 60.2 60.2Economy: Industry (% of GVA) 7.4 7.4 7.4Economy: Services and other activity (% of GVA) 32.6 32.5 32.5Unemployment (% of labour force) a 7.5 7.5 7.5Labour force participation (female/male pop. %) a 32.4/76.8 32.4/76.3 33.2/75.9Agricultural production index (2004-2006=100) 100 104 117b
Food production index (2004-2006=100) 100 104 117b
Social indicatorsPopulation growth rate (average annual %) 2010-2015 2.4Urban population (%) 2015 39.6Urban population growth rate (average annual %) 2010-2015 4.1Fertility rate, total (live births per woman) 2010-2015 6.6Life expectancy at birth (females/males, years) 2010-2015 56.5/53.3Total dependency ratio (Pop. aged 0-14 & 65+ per 100 pop. 15-64) 2015 98International migrant stock (000/% of total pop.) mid-2015 25.3/0.2ac
Refugees and others of concern to UNHCR mid-2015 1 164 975Infant mortality rate (per 1 000 live births) 2010-2015 79Intentional homicide rate (per 100 000 pop.) 2014 5.6d
Seats held by women in national parliaments (%) 2016 13.8Environment and infrastructureMobile-cellular subscriptions (per 100 inhabitants) 2014 50.9a
Individuals using the Internet (%) 2014 1.6a
Threatened species 2015 165Forested area (% of land area) 2013 10.4a
CO2 emission estimates (000 tons/tons per capita) 2013 623/0.1Energy production, primary (Petajoules) 2013 125Energy supply per capita (Gigajoules) 2013 12.0Terrestrial and marine areas protected (% of total area) 2014 0.3a Estimate. b 2013. c Including refugees. d 2012.
190 World Statistics Pocketbook

South AfricaRegion Southern Africa Surface area (sq km) 1 221 037Population (proj., 000) 54 979 Pop. density (per sq km) 45.3Capital city Pretoria a Capital city pop. (000) 2 059Currency Rand (ZAR) UN membership date 7 November 1945Economic indicators 2005 2010 2014GDP: Gross domestic product (million current US$) 257 772 375 348 349 819GDP growth rate (annual %, const. 2005 prices) 5.3 3.0 1.5GDP per capita (current US$) 5 331.0 7 271.2 6 481.8Economy: Agriculture (% of GVA) 2.7 2.6 2.5Economy: Industry (% of GVA) 30.3 30.2 29.5Economy: Services and other activity (% of GVA) 67.1 67.2 68.1Employment: Agriculture (% of employed) b 5.8c 4.9de 4.6de
Employment: Industry (% of employed) b 25.3c 24.5de 23.5de
Employment: Services and other (% of employed) b 59.1c 70.6de 71.9de
Unemployment (% of labour force) f 23.8 24.7 24.9Labour force participation (female/male pop. %) f 46.7/61.5 43.8/59.4 46.1/59.8CPI: Consumer price index (2000=100) 128 142 176Agricultural production index (2004-2006=100) 102 118 122g
Food production index (2004-2006=100) 102 118 123g
Balance of payments, current account (million US$) –8 015 –5 492 –19 086Total trade Major trading partners 2015
(million US$) (% of exports) (% of imports)Exports 69 631.1 China 8.3 China 18.3Imports 79 590.9 United States 7.5 Germany 11.8Balance –9 959.8 Germany 6.1 United States 6.7Social indicatorsPopulation growth rate (average annual %) 2010-2015 1.1Urban population (%) 2015 64.8Urban population growth rate (average annual %) 2010-2015 1.6Fertility rate, total (live births per woman) 2010-2015 2.4Life expectancy at birth (females/males, years) 2010-2015 59.1/54.9Total dependency ratio (Pop. aged 0-14 & 65+ per 100 pop. 15-64) 2015 52International migrant stock (000/% of total pop.) mid-2015 3 142.5/5.8h
Tourist arrivals at national borders (000) 2014 9 549ei
Refugees and others of concern to UNHCR mid-2015 912 592Infant mortality rate (per 1 000 live births) 2010-2015 38Health: Total expenditure (% of GDP) 2014 8.8Health: Physicians (per 1 000 pop.) 2013 0.8Education: Government expenditure (% of GDP) 2014 6.1Education: Primary gross enrolment ratio (f/m per 100 pop.) 2014 97.3/102.2Education: Secondary gross enrolment ratio (f/m per 100 pop.) 2014 103.8/85.3f
Education: Tertiary gross enrolment ratio (f/m per 100 pop.) 2014 23.5/16.0g
Intentional homicide rate (per 100 000 pop.) 2014 33.0Seats held by women in national parliaments (%) 2016 42.0Environment and infrastructureMobile-cellular subscriptions (per 100 inhabitants) 2014 149.7Individuals using the Internet (%) 2014 49.0f
Patents: Resident filings (per million pop.) 2014 15.0Threatened species 2015 527Forested area (% of land area) 2013 7.6f
CO2 emission estimates (000 tons/tons per capita) 2013 471 239/8.8Energy production, primary (Petajoules) 2013 6 999Energy supply per capita (Gigajoules) 2013 119.0Terrestrial and marine areas protected (% of total area) 2014 10.2Population using improved drinking water sources (urban/rural, %) 2015 99.6/81.4Population using improved sanitation facilities (urban/rural, %) 2015 69.6/60.5Net Official Development Assistance received (% of GNI) 2014 0.3a Pretoria is the administrative capital, Cape Town is the legislative capital and Bloemfontein is thejudiciary capital. b Persons aged 15 to 64 years. c Data classified according to ISIC Rev. 2. d Data classifiedaccording to ISIC Rev. 3. e Break in the time series. f Estimate. g 2013. h Including refugees. i Excludingtransit.
World Statistics Pocketbook 191

South SudanRegion Eastern Africa Surface area (sq km) 658 841Population (proj., 000) 12 733 Pop. density (per sq km) 20.8Capital city Juba Capital city pop. (000) 321Currency S. Sudanese Pound (SSP) a UN membership date 14 July 2011Economic indicators 2005 2010 2014GDP: Gross domestic product (million current US$) ... 15 720 11 007GDP growth rate (annual %, const. 2005 prices) ... 5.5 2.9GDP per capita (current US$) ... 1 563.2 924.1Economy: Agriculture (% of GVA) ... 5.1 4.2Economy: Industry (% of GVA) ... 55.4 59.0Economy: Services and other activity (% of GVA) ... 39.4 36.9Unemployment (% of labour force) b ... 13.7c ...Labour force participation (female/male pop. %) d 70.5/77.1 70.8/76.1 71.1/75.2Social indicatorsPopulation growth rate (average annual %) 2010-2015 4.1Urban population (%) 2015 18.8Urban population growth rate (average annual %) 2010-2015 5.1Fertility rate, total (live births per woman) 2010-2015 5.2Life expectancy at birth (females/males, years) 2010-2015 56.0/54.1Total dependency ratio (Pop. aged 0-14 & 65+ per 100 pop. 15-64) 2015 84International migrant stock (000/% of total pop.) mid-2015 824.1/6.7e
Refugees and others of concern to UNHCR mid-2015 2 058 533f
Infant mortality rate (per 1 000 live births) 2010-2015 78Health: Total expenditure (% of GDP) 2014 2.7g
Education: Government expenditure (% of GDP) 2014 0.8h
Education: Primary gross enrolment ratio (f/m per 100 pop.) 2014 67.0/101.1h
Intentional homicide rate (per 100 000 pop.) 2014 13.9i
Seats held by women in national parliaments (%) 2016 26.5Environment and infrastructureMobile-cellular subscriptions (per 100 inhabitants) 2014 24.5Individuals using the Internet (%) 2014 15.9d
Threatened species 2015 42CO2 emission estimates (000 tons/tons per capita) 2013 1 448/0.1Energy production, primary (Petajoules) 2013 217Energy supply per capita (Gigajoules) 2013 2.0Terrestrial and marine areas protected (% of total area) 2014 20.8Population using improved drinking water sources (urban/rural, %) 2015 66.8/56.9Population using improved sanitation facilities (urban/rural, %) 2015 16.4/4.5Net Official Development Assistance received (% of GNI) 2014 20.0a South Sudanese Pound. b Persons aged 10 years and over. c 2008. d Estimate. e Including refugees. fIDP figure in South Sudan includes 105,000 people who are in an IDP-like situation. g Estimates shouldbe viewed with caution as these are derived from scarce data. h 2011. i 2012.
192 World Statistics Pocketbook

SpainRegion Southern Europe Surface area (sq km) 505 970Population (proj., 000) 46 065 a Pop. density (per sq km) 92.4 a
Capital city Madrid Capital city pop. (000) 6 199Currency Euro (EUR) UN membership date 14 December 1955Economic indicators 2005 2010 2014GDP: Gross domestic product (million current US$) 1 157 248 1 431 588 1 381 342GDP growth rate (annual %, const. 2005 prices) 3.7 0.0 1.4GDP per capita (current US$) 26 388.2 30 719.8 29 860.6Economy: Agriculture (% of GVA) b 3.0 2.6 2.5Economy: Industry (% of GVA) c 30.4 26.0 22.4Economy: Services and other activity (% of GVA) de 66.5 71.4 75.1Employment: Agriculture (% of employed) 5.2f 4.1 4.2Employment: Industry (% of employed) 29.7f 23.1 19.5Employment: Services and other (% of employed) 65.1f 72.8 76.3Unemployment (% of labour force) g 9.1 19.9 24.4Labour force participation (female/male pop. %) g 45.9/68.3 51.4/67.5 52.5/65.1CPI: Consumer price index (2000=100) h 114 128 137Agricultural production index (2004-2006=100) 95 103 109i
Food production index (2004-2006=100) 94 104 110i
Index of industrial production (2005=100) j 100 83 76Balance of payments, current account (million US$) –87 006 –56 363 12 808Total trade Major trading partners 2015
(million US$) (% of exports) (% of imports)Exports 278 122.0 France 15.5 Germany 13.1Imports 305 266.0 Germany 10.8 France 10.8Balance –27 144.0 Italy 7.5 China 8.7Social indicatorsPopulation growth rate (average annual %) 2010-2015 –0.2a
Urban population (%) 2015 79.6a
Urban population growth rate (average annual %) 2010-2015 0.7a
Fertility rate, total (live births per woman) 2010-2015 1.3a
Life expectancy at birth (females/males, years) 2010-2015 85.1/79.4a
Total dependency ratio (Pop. aged 0-14 & 65+ per 100 pop. 15-64) 2015 51a
International migrant stock (000/% of total pop.) mid-2015 5 853.0/12.7a
Tourist arrivals at national borders (000) 2014 64 995Refugees and others of concern to UNHCR mid-2015 17 258k
Infant mortality rate (per 1 000 live births) 2010-2015 3a
Health: Total expenditure (% of GDP) 2014 9.0Health: Physicians (per 1 000 pop.) 2013 5.0Education: Government expenditure (% of GDP) 2014 4.3i
Education: Primary gross enrolment ratio (f/m per 100 pop.) 2014 105.3/104.1Education: Secondary gross enrolment ratio (f/m per 100 pop.) 2014 130.4/129.9Education: Tertiary gross enrolment ratio (f/m per 100 pop.) 2014 96.9/81.5Intentional homicide rate (per 100 000 pop.) 2014 0.7Seats held by women in national parliaments (%) 2016 40.0Environment and infrastructureMobile-cellular subscriptions (per 100 inhabitants) 2014 107.9gl
Individuals using the Internet (%) 2014 76.2m
Patents: Resident filings (per million pop.) 2014 95.0Threatened species 2015 551Forested area (% of land area) 2013 36.7g
CO2 emission estimates (000 tons/tons per capita) 2013 236 969/5.1Energy production, primary (Petajoules) 2013 1 508n
Energy supply per capita (Gigajoules) 2013 106.0n
Terrestrial and marine areas protected (% of total area) 2014 10.2Population using improved drinking water sources (urban/rural, %) 2015 100.0/100.0Population using improved sanitation facilities (urban/rural, %) 2015 99.8/100.0Net Official Development Assistance disbursed (% of GNI) o 2014 0.1a Including Canary Islands, Ceuta and Melilla. b Excludes irrigation canals and landscaping care. c Ex-cludes publishing activities, includes irrigation canals. d Excludes repair of personal and household goods.e Includes publishing activities and landscaping care. f Data classified according to ISIC Rev. 3. g Estimate.h Index base: 2001=100. i 2013. j Excluding water and waste management. k Refugee population relatesto the end of 2014. l Data refers to the fourth quarter. m Population age 16-74. n Data include the CanaryIslands. o Development Assistance Committee member (OECD).
World Statistics Pocketbook 193

Sri LankaRegion Southern Asia Surface area (sq km) 65 610Population (proj., 000) 20 811 Pop. density (per sq km) 331.9Capital city Colombo a Capital city pop. (000) 707Currency Sri Lanka Rupee (LKR) UN membership date 14 December 1955Economic indicators 2005 2010 2014GDP: Gross domestic product (million current US$) 24 406 49 566 74 941GDP growth rate (annual %, const. 2005 prices) 6.2 8.0 7.4GDP per capita (current US$) 1 249.9 2 453.6 3 634.6Economy: Agriculture (% of GVA) b 11.8 12.8 9.9Economy: Industry (% of GVA) b 30.2 29.4 33.8Economy: Services and other activity (% of GVA) b 58.0 57.8 56.3Employment: Agriculture (% of employed) 30.7cde 32.7cef 30.4d
Employment: Industry (% of employed) 25.6cde 24.2cef 25.5d
Employment: Services and other (% of employed) 38.4cde 40.4cef 43.4d
Unemployment (% of labour force) g 7.7 4.9 4.3Labour force participation (female/male pop. %) g 34.4/76.2 34.6/76.6 30.1/76.0CPI: Consumer price index (2000=100) h 160 219di 278i
Agricultural production index (2004-2006=100) 102 124 136j
Food production index (2004-2006=100) 102 125 141j
Balance of payments, current account (million US$) –743 –1 127 –2 018Total trade Major trading partners 2015
(million US$) (% of exports) (% of imports)Exports 10 439.7 United States 26.8Imports 18 967.2 United Kingdom 9.9 China 19.7Balance –8 527.5 Japan 7.3Social indicatorsPopulation growth rate (average annual %) 2010-2015 0.5Urban population (%) 2015 18.4Urban population growth rate (average annual %) 2010-2015 0.8Fertility rate, total (live births per woman) 2010-2015 2.1Life expectancy at birth (females/males, years) 2010-2015 78.0/71.2Total dependency ratio (Pop. aged 0-14 & 65+ per 100 pop. 15-64) 2015 51International migrant stock (000/% of total pop.) mid-2015 38.7/0.2k
Tourist arrivals at national borders (000) 2014 1 527l
Refugees and others of concern to UNHCR mid-2015 51 808m
Infant mortality rate (per 1 000 live births) 2010-2015 8Health: Total expenditure (% of GDP) 2014 3.5Education: Government expenditure (% of GDP) 2014 1.6j
Education: Primary gross enrolment ratio (f/m per 100 pop.) 2014 100.1/102.4Education: Secondary gross enrolment ratio (f/m per 100 pop.) 2014 102.0/97.5j
Education: Tertiary gross enrolment ratio (f/m per 100 pop.) 2014 24.7/16.6Intentional homicide rate (per 100 000 pop.) 2014 2.9j
Seats held by women in national parliaments (%) 2016 5.8Environment and infrastructureMobile-cellular subscriptions (per 100 inhabitants) 2014 103.2Individuals using the Internet (%) 2014 25.8g
Patents: Resident filings (per million pop.) 2014 16.0j
Threatened species 2015 580Forested area (% of land area) 2013 33.2g
CO2 emission estimates (000 tons/tons per capita) 2013 16 025/0.8Energy production, primary (Petajoules) 2013 184Energy supply per capita (Gigajoules) 2013 19.0Terrestrial and marine areas protected (% of total area) 2014 2.6Population using improved drinking water sources (urban/rural, %) 2015 98.5/95.0Population using improved sanitation facilities (urban/rural, %) 2015 88.1/96.7Net Official Development Assistance received (% of GNI) 2014 0.7a Colombo is the capital and Sri Jayewardenepura Kotte is the legislative capital. b At producers' prices.c Data classified according to ISIC Rev. 3. d Break in the time series. e Persons aged 10 years and over.f Excluding the Northern province. g Estimate. h Colombo. i Index base: 2002=100. j 2013. k Includingrefugees. l Excluding nationals residing abroad. m The statistics of the remaining IDPs as at mid-2015,while provided by the Government authorities at the district level, are being reviewed by the centralauthorities. Once this review has been concluded, the statistics will be changed accordingly.
194 World Statistics Pocketbook

State of PalestineRegion Western Asia Surface area (sq km) 6 020Population (proj., 000) 4 797 a Pop. density (per sq km) 796.9 a
Capital city East Jerusalem b Capital city pop. (000) 256 c
Economic indicators 2005 2010 2014GDP: Gross domestic product (million current US$) 4 832 8 913 12 766GDP growth rate (annual %, const. 2005 prices) 10.8 8.1 –0.4GDP per capita (current US$) 1 349.9 2 190.6 2 810.6Economy: Agriculture (% of GVA) d 5.8 6.4 5.5Economy: Industry (% of GVA) e 25.8 23.3 23.4Economy: Services and other activity (% of GVA) fg 68.3 70.2 71.1Employment: Agriculture (% of employed) 14.6h 11.8ij 10.5kl
Employment: Industry (% of employed) 26.3h 24.6ij 28.4kl
Employment: Services and other (% of employed) 59.1h 63.6ij 61.1kl
Unemployment (% of labour force) m 23.6 23.7 26.9Labour force participation (female/male pop. %) m 14.1/66.8 14.8/66.2 17.6/68.8CPI: Consumer price index (2000=100) 119 148 162n
Agricultural production index (2004-2006=100) 107 81 93l
Food production index (2004-2006=100) 107 81 93l
Index of industrial production (2005=100) 100 115 130Balance of payments, current account (million US$) –1 365 –1 307 –1 387Total trade Major trading partners 2015
(million US$)c (% of exports)c (% of imports)c
Exports 943.7 Israel 83.9 Israel 69.6Imports 5 683.2 Jordan 7.0 Turkey 5.7Balance –4 739.5 United Arab Emirates 1.5 China 5.0Social indicatorsPopulation growth rate (average annual %) 2010-2015 2.8a
Urban population (%) 2015 75.3a
Urban population growth rate (average annual %) 2010-2015 2.8a
Fertility rate, total (live births per woman) 2010-2015 4.3a
Life expectancy at birth (females/males, years) 2010-2015 74.7/70.7a
Total dependency ratio (Pop. aged 0-14 & 65+ per 100 pop. 15-64) 2015 76a
International migrant stock (000/% of total pop.) mid-2015 255.5/5.5ao
Tourist arrivals at national borders (000) p 2014 556q
Refugees and others of concern to UNHCR mid-2015 3Infant mortality rate (per 1 000 live births) 2010-2015 21a
Education: Primary gross enrolment ratio (f/m per 100 pop.) 2014 94.6/95.3Education: Secondary gross enrolment ratio (f/m per 100 pop.) 2014 86.2/78.5Education: Tertiary gross enrolment ratio (f/m per 100 pop.) 2014 53.8/34.6Intentional homicide rate (per 100 000 pop.) 2014 0.6r
Environment and infrastructureMobile-cellular subscriptions (per 100 inhabitants) 2014 72.1Individuals using the Internet (%) 2014 53.7s
Threatened species 2015 24Forested area (% of land area) 2013 1.5m
CO2 emission estimates (000 tons/tons per capita) 2013 2 439/0.6Energy production, primary (Petajoules) 2013 8Energy supply per capita (Gigajoules) 2013 14.0Population using improved drinking water sources (urban/rural, %) 2015 50.7/81.5Population using improved sanitation facilities (urban/rural, %) 2015 93.1/90.2a Including East Jerusalem. b Designation and data provided by the State of Palestine. The position ofthe United Nations on Jerusalem is stated in A/RES/181 (II) and subsequent General Assembly andSecurity Council resolutions. c 2014. d Excludes irrigation canals and landscaping care. e Excludes pub-lishing activities, includes irrigation canals. f Excludes repair of personal and household goods. g Includespublishing activities and landscaping care. h Data classified according to ISIC Rev. 3. i Data classifiedaccording to ISIC Rev. 2. j Services includes electricity, gas and water. k Break in the time series. l 2013.m Estimate. n Series linked to former series. o Refugees are not part of the foreign-born migrant stockin the State of Palestine. p Arrivals of non-resident tourists in hotels and similar establishments. q WestBank only. r 2012. s Population age 10+.
World Statistics Pocketbook 195

SudanRegion Northern Africa Surface area (sq km) ...Population (proj., 000) 41 176 Pop. density (per sq km) 23.3Capital city Khartoum Capital city pop. (000) 5 129Currency Sudanese Pound (SDG) UN membership date 12 November 1956Economic indicators 2005 2010 2014GDP: Gross domestic product (million current US$) ... 53 945 81 894GDP growth rate (annual %, const. 2005 prices) ... 6.9 3.1GDP per capita (current US$) ... 1 493.7 2 081.2Economy: Agriculture (% of GVA) ... 42.9 32.2Economy: Industry (% of GVA) ... 13.7 21.9Economy: Services and other activity (% of GVA) ... 43.4 45.9Employment: Agriculture (% of employed) ... ... 44.6a
Employment: Industry (% of employed) ... ... 15.3a
Employment: Services and other (% of employed) ... ... 40.1a
Unemployment (% of labour force) b 14.0 13.0 13.3Labour force participation (female/male pop. %) b 24.5/73.9 23.2/72.9 24.2/72.1Balance of payments, current account (million US$) –2 473 –1 725 –4 852c
Social indicatorsPopulation growth rate (average annual %) 2010-2015 2.2Urban population (%) 2015 33.8Urban population growth rate (average annual %) 2010-2015 2.5Fertility rate, total (live births per woman) 2010-2015 4.5Life expectancy at birth (females/males, years) 2010-2015 64.6/61.6Total dependency ratio (Pop. aged 0-14 & 65+ per 100 pop. 15-64) 2015 78International migrant stock (000/% of total pop.) mid-2015 503.5/1.3d
Tourist arrivals at national borders (000) 2014 684e
Refugees and others of concern to UNHCR mid-2015 2 767 909f
Infant mortality rate (per 1 000 live births) 2010-2015 53Health: Total expenditure (% of GDP) 2014 8.4gh
Education: Primary gross enrolment ratio (f/m per 100 pop.) 2014 66.7/74.1i
Education: Secondary gross enrolment ratio (f/m per 100 pop.) 2014 41.5/43.9i
Education: Tertiary gross enrolment ratio (f/m per 100 pop.) 2014 17.9/16.0i
Intentional homicide rate (per 100 000 pop.) 2014 6.5j
Seats held by women in national parliaments (%) 2016 30.5Environment and infrastructureMobile-cellular subscriptions (per 100 inhabitants) 2014 72.2Individuals using the Internet (%) 2014 24.6b
Threatened species 2015 123CO2 emission estimates (000 tons/tons per capita) 2013 15 445/0.4Energy production, primary (Petajoules) 2013 672Energy supply per capita (Gigajoules) 2013 16.0Terrestrial and marine areas protected (% of total area) 2014 1.7Net Official Development Assistance received (% of GNI) 2014 1.2a 2011. b Estimate. c Break in the time series. d Including refugees. e Including nationals residing abroad.f IDP figure in Sudan includes 77,300 people who are in an IDP-like situation. g Data revision. h Estimatesshould be viewed with caution as these are derived from scarce data. i 2013. j 2012.
196 World Statistics Pocketbook

SurinameRegion South America Surface area (sq km) 163 820Population (proj., 000) 548 Pop. density (per sq km) 3.5Capital city Paramaribo Capital city pop. (000) 234 ab
Currency Surinam Dollar (SRD) UN membership date 4 December 1975Economic indicators 2005 2010 2014GDP: Gross domestic product (million current US$) 2 193 4 368 5 210GDP growth rate (annual %, const. 2005 prices) 3.9 5.2 1.8GDP per capita (current US$) 4 457.4 8 430.9 9 680.2Economy: Agriculture (% of GVA) 11.3 10.2 9.9Economy: Industry (% of GVA) 37.4 37.9 32.6Economy: Services and other activity (% of GVA) 51.3 51.9 57.6Employment: Agriculture (% of employed) 8.0cd ... 3.2ef
Employment: Industry (% of employed) 23.0cd ... 22.4ef
Employment: Services and other (% of employed) 64.3cd ... 72.9ef
Unemployment (% of labour force) g 8.5 7.6 6.9Labour force participation (female/male pop. %) g 37.6/67.2 39.9/68.4 40.5/68.6CPI: Consumer price index (2000=100) hi 171 249 324Agricultural production index (2004-2006=100) 99 137 146f
Food production index (2004-2006=100) 99 137 146f
Balance of payments, current account (million US$) –144 651 –415Total trade Major trading partners 2015
(million US$)a (% of exports)a (% of imports)a
Exports 1 917.7 United States 24.3 United States 27.5Imports 1 826.7 United Arab Emirates 22.0 Netherlands 14.4Balance 91.0 Switzerland 13.6 Trinidad and Tobago 10.6Social indicatorsPopulation growth rate (average annual %) 2010-2015 0.9Urban population (%) 2015 66.0Urban population growth rate (average annual %) 2010-2015 0.8Fertility rate, total (live births per woman) 2010-2015 2.4Life expectancy at birth (females/males, years) 2010-2015 74.2/67.8Total dependency ratio (Pop. aged 0-14 & 65+ per 100 pop. 15-64) 2015 51International migrant stock (000/% of total pop.) mid-2015 46.8/8.6j
Tourist arrivals at national borders (000) 2014 252Refugees and others of concern to UNHCR mid-2015 1Infant mortality rate (per 1 000 live births) 2010-2015 17Health: Total expenditure (% of GDP) 2014 5.7Education: Primary gross enrolment ratio (f/m per 100 pop.) 2014 118.3/121.6Education: Secondary gross enrolment ratio (f/m per 100 pop.) 2014 89.2/68.2f
Intentional homicide rate (per 100 000 pop.) 2014 9.5k
Seats held by women in national parliaments (%) 2016 25.5Environment and infrastructureMobile-cellular subscriptions (per 100 inhabitants) 2014 170.6g
Individuals using the Internet (%) 2014 40.1g
Threatened species 2015 76Forested area (% of land area) 2013 98.3g
CO2 emission estimates (000 tons/tons per capita) 2013 2 101/3.9Energy production, primary (Petajoules) 2013 42Energy supply per capita (Gigajoules) 2013 65.0Terrestrial and marine areas protected (% of total area) 2014 8.6Population using improved drinking water sources (urban/rural, %) 2015 98.1/88.4Population using improved sanitation facilities (urban/rural, %) 2015 88.4/61.4a 2014. b Refers to the total population of the District of Paramaribo. c Data classified according to ISICRev. 3. d 2004. e Break in the time series. f 2013. g Estimate. h Index base: 2001=100. i Paramaribo. jRefers to foreign citizens. k 2012.
World Statistics Pocketbook 197

SwazilandRegion Southern Africa Surface area (sq km) 17 363Population (proj., 000) 1 304 Pop. density (per sq km) 75.8Capital city Mbabane a Capital city pop. (000) 66 b
Currency Lilangeni (SZL) UN membership date 24 September 1968Economic indicators 2005 2010 2014GDP: Gross domestic product (million current US$) 3 200 4 548 4 482GDP growth rate (annual %, const. 2005 prices) 4.4 1.5 2.6GDP per capita (current US$) 2 896.9 3 812.0 3 531.8Economy: Agriculture (% of GVA) 6.8 6.5 6.0Economy: Industry (% of GVA) 43.7 43.2 44.3Economy: Services and other activity (% of GVA) 49.5 50.3 49.8Unemployment (% of labour force) c 25.5 28.0 26.1Labour force participation (female/male pop. %) c 35.1/64.3 37.8/62.7 39.7/63.6CPI: Consumer price index (2000=100) 140 127def 164f
Agricultural production index (2004-2006=100) 103 104 112g
Food production index (2004-2006=100) 103 104 113g
Index of industrial production (2005=100) ... 132 153Balance of payments, current account (million US$) –103 –389 58Social indicatorsPopulation growth rate (average annual %) 2010-2015 1.5Urban population (%) 2015 21.3Urban population growth rate (average annual %) 2010-2015 1.3Fertility rate, total (live births per woman) 2010-2015 3.4Life expectancy at birth (females/males, years) 2010-2015 48.5/49.7Total dependency ratio (Pop. aged 0-14 & 65+ per 100 pop. 15-64) 2015 69International migrant stock (000/% of total pop.) mid-2015 31.6/2.5h
Tourist arrivals at national borders (000) 2014 968g
Refugees and others of concern to UNHCR mid-2015 864Infant mortality rate (per 1 000 live births) 2010-2015 65Health: Total expenditure (% of GDP) 2014 9.3Education: Government expenditure (% of GDP) 2014 8.6i
Education: Primary gross enrolment ratio (f/m per 100 pop.) 2014 108.3/118.2g
Education: Secondary gross enrolment ratio (f/m per 100 pop.) 2014 62.4/63.6g
Education: Tertiary gross enrolment ratio (f/m per 100 pop.) 2014 5.5/5.2g
Seats held by women in national parliaments (%) 2016 6.2Environment and infrastructureMobile-cellular subscriptions (per 100 inhabitants) 2014 72.3c
Individuals using the Internet (%) 2014 27.1c
Patents: Resident filings (per million pop.) 2014 2.0j
Threatened species 2015 34Forested area (% of land area) 2013 33.5c
CO2 emission estimates (000 tons/tons per capita) 2013 1 089/0.9Energy production, primary (Petajoules) 2013 38Energy supply per capita (Gigajoules) 2013 39.0Terrestrial and marine areas protected (% of total area) 2014 4.0Population using improved drinking water sources (urban/rural, %) 2015 93.6/68.9Population using improved sanitation facilities (urban/rural, %) 2015 63.1/56.0Net Official Development Assistance received (% of GNI) 2014 2.7a Mbabane is the administrative capital and Lobamba is the legislative capital. b 2014. c Estimate. dSeries linked to former series. e Break in the time series. f Index base: 2007=100. g 2013. h Includingrefugees. i 2011. j 2012.
198 World Statistics Pocketbook

SwedenRegion Northern Europe Surface area (sq km) 450 295Population (proj., 000) 9 852 Pop. density (per sq km) 24.0Capital city Stockholm Capital city pop. (000) 1 486 a
Currency Swedish Krona (SEK) UN membership date 19 November 1946Economic indicators 2005 2010 2014GDP: Gross domestic product (million current US$) 389 043 488 378 571 090GDP growth rate (annual %, const. 2005 prices) 2.8 6.0 2.3GDP per capita (current US$) 43 082.6 52 053.1 58 855.6Economy: Agriculture (% of GVA) b 1.1 1.6 1.4Economy: Industry (% of GVA) c 29.7 28.9 26.0Economy: Services and other activity (% of GVA) de 69.2 69.4 72.6Employment: Agriculture (% of employed) 2.0fg 1.8 1.7Employment: Industry (% of employed) 22.0fg 20.0 18.7Employment: Services and other (% of employed) 75.6fg 77.9 79.0Unemployment (% of labour force) h 7.5 8.6 8.0Labour force participation (female/male pop. %) h 59.3/68.2 59.0/68.1 60.9/68.3CPI: Consumer price index (2000=100) 108 116 120Agricultural production index (2004-2006=100) 100 94 96i
Food production index (2004-2006=100) 100 94 96i
Index of industrial production (2005=100) j 100 93 88Balance of payments, current account (million US$) 26 423 29 402 32 640Total trade Major trading partners 2015
(million US$) (% of exports) (% of imports)Exports 140 089.8 Norway 10.1 Germany 18.0Imports 137 986.7 Germany 10.0 Netherlands 8.3Balance 2 103.1 United States 7.3 Norway 8.2Social indicatorsPopulation growth rate (average annual %) 2010-2015 0.8Urban population (%) 2015 85.8Urban population growth rate (average annual %) 2010-2015 0.8Fertility rate, total (live births per woman) 2010-2015 1.9Life expectancy at birth (females/males, years) 2010-2015 83.7/80.1Total dependency ratio (Pop. aged 0-14 & 65+ per 100 pop. 15-64) 2015 59International migrant stock (000/% of total pop.) mid-2015 1 639.8/16.8Tourist arrivals at national borders (000) 2014 10 522Refugees and others of concern to UNHCR mid-2015 225 509k
Infant mortality rate (per 1 000 live births) 2010-2015 3Health: Total expenditure (% of GDP) 2014 11.9Health: Physicians (per 1 000 pop.) 2013 3.9l
Education: Government expenditure (% of GDP) 2014 7.7i
Education: Primary gross enrolment ratio (f/m per 100 pop.) 2014 124.3/117.7Education: Secondary gross enrolment ratio (f/m per 100 pop.) 2014 141.6/124.8Education: Tertiary gross enrolment ratio (f/m per 100 pop.) 2014 76.0/49.4Intentional homicide rate (per 100 000 pop.) 2014 0.9Seats held by women in national parliaments (%) 2016 43.6Environment and infrastructureMobile-cellular subscriptions (per 100 inhabitants) 2014 127.8h
Individuals using the Internet (%) 2014 92.5m
Patents: Resident filings (per million pop.) 2014 604.0Threatened species 2015 36Forested area (% of land area) 2013 68.9h
CO2 emission estimates (000 tons/tons per capita) 2013 44 327/4.6Energy production, primary (Petajoules) 2013 1 450Energy supply per capita (Gigajoules) 2013 212.0Terrestrial and marine areas protected (% of total area) 2014 13.0Population using improved drinking water sources (urban/rural, %) 2015 100.0/100.0Population using improved sanitation facilities (urban/rural, %) 2015 99.3/99.7Net Official Development Assistance disbursed (% of GNI) n 2014 1.1a Refers to 'tätort' (according to the administrative divisions of 2005). b Excludes irrigation canals andlandscaping care. c Excludes publishing activities, includes irrigation canals. d Excludes repair of personaland household goods. e Includes publishing activities and landscaping care. f Data classified accordingto ISIC Rev. 3. g Break in the time series. h Estimate. i 2013. j Excluding water and waste management.k Refugee population relates to the end of 2014. l 2011. m Population age 16-74. n Development Assis-tance Committee member (OECD).
World Statistics Pocketbook 199

SwitzerlandRegion Western Europe Surface area (sq km) 41 285Population (proj., 000) 8 380 Pop. density (per sq km) 212.1Capital city Bern Capital city pop. (000) 358Currency Swiss Franc (CHF) UN membership date 10 September 2002Economic indicators 2005 2010 2014GDP: Gross domestic product (million current US$) 407 543 581 209 701 037GDP growth rate (annual %, const. 2005 prices) 3.0 3.0 1.9GDP per capita (current US$) 55 009.4 74 223.4 85 373.8Economy: Agriculture (% of GVA) a 0.9 0.7 0.8Economy: Industry (% of GVA) b 26.8 26.3 26.3Economy: Services and other activity (% of GVA) cd 72.3 73.0 73.0Employment: Agriculture (% of employed) 3.5e 3.0 3.2Employment: Industry (% of employed) 22.5e 21.3 20.1Employment: Services and other (% of employed) 73.4e 71.2 73.9Unemployment (% of labour force) f 4.4 4.5 4.5Labour force participation (female/male pop. %) f 59.5/75.0 60.8/75.3 62.7/74.9CPI: Consumer price index (2000=100) 104 109 108Agricultural production index (2004-2006=100) 99 103 101g
Food production index (2004-2006=100) 99 103 101g
Index of industrial production (2005=100) h 100 119 130Balance of payments, current account (million US$) 57 530 86 601 61 539Total trade Major trading partners 2015
(million US$)i (% of exports)i (% of imports)i
Exports 291 959.2 Germany 14.2 Germany 20.6Imports 253 152.5 United States 10.6 United Kingdom 12.8Balance 38 806.7 China, Hong Kong SAR 8.7 United States 8.0Social indicatorsPopulation growth rate (average annual %) 2010-2015 1.2Urban population (%) 2015 73.9Urban population growth rate (average annual %) 2010-2015 1.1Fertility rate, total (live births per woman) 2010-2015 1.5Life expectancy at birth (females/males, years) 2010-2015 84.7/80.4Total dependency ratio (Pop. aged 0-14 & 65+ per 100 pop. 15-64) 2015 49International migrant stock (000/% of total pop.) mid-2015 2 438.7/29.4Tourist arrivals at national borders (000) j 2014 9 158k
Refugees and others of concern to UNHCR mid-2015 86 551Infant mortality rate (per 1 000 live births) 2010-2015 4Health: Total expenditure (% of GDP) 2014 11.7Health: Physicians (per 1 000 pop.) 2013 4.1l
Education: Government expenditure (% of GDP) 2014 5.1l
Education: Primary gross enrolment ratio (f/m per 100 pop.) 2014 103.3/103.2Education: Secondary gross enrolment ratio (f/m per 100 pop.) 2014 98.2/101.3Education: Tertiary gross enrolment ratio (f/m per 100 pop.) 2014 57.7/56.8Intentional homicide rate (per 100 000 pop.) 2014 0.5Seats held by women in national parliaments (%) 2016 32.0Environment and infrastructureMobile-cellular subscriptions (per 100 inhabitants) 2014 140.5f
Individuals using the Internet (%) 2014 87.0mn
Patents: Resident filings (per million pop.) 2014 1 018.0Threatened species 2015 62Forested area (% of land area) 2013 31.5f
CO2 emission estimates (000 tons/tons per capita) 2013 40 348/5.0Energy production, primary (Petajoules) 2013 539i
Energy supply per capita (Gigajoules) 2013 136.0i
Terrestrial and marine areas protected (% of total area) 2014 9.9Population using improved drinking water sources (urban/rural, %) 2015 100.0/100.0Population using improved sanitation facilities (urban/rural, %) 2015 99.9/99.8Net Official Development Assistance disbursed (% of GNI) o 2014 0.5a Excludes irrigation canals and landscaping care. b Excludes publishing activities, includes irrigationcanals. c Excludes repair of personal and household goods. d Includes publishing activities and land-scaping care. e Data classified according to ISIC Rev. 3. f Estimate. g 2013. h Excluding water and wastemanagement. i Including Liechtenstein. j Arrivals of non-resident tourists in hotels and similar estab-lishments. k Including health establishments. l 2012. m Users in the last 6 months. n Persons aged 14years and over. o Development Assistance Committee member (OECD).
200 World Statistics Pocketbook

Syrian Arab RepublicRegion Western Asia Surface area (sq km) 185 180Population (proj., 000) 18 564 Pop. density (per sq km) 101.1Capital city Damascus Capital city pop. (000) 2 566 a
Currency Syrian Pound (SYP) UN membership date 24 October 1945Economic indicators 2005 2010 2014GDP: Gross domestic product (million current US$) 28 397 60 465 34 184GDP growth rate (annual %, const. 2005 prices) 6.2 3.4 0.4GDP per capita (current US$) 1 566.1 2 918.1 1 821.0Economy: Agriculture (% of GVA) b 20.3 19.7 20.6Economy: Industry (% of GVA) b 31.2 30.7 30.2Economy: Services and other activity (% of GVA) b 48.5 49.6 49.2Employment: Agriculture (% of employed) c 27.0d 15.2e 13.2f
Employment: Industry (% of employed) c 25.6d 32.9e 31.4f
Employment: Services and other (% of employed) c 47.4d 53.0e 55.3f
Unemployment (% of labour force) g 9.2 8.4 13.2Labour force participation (female/male pop. %) g 16.3/76.1 13.3/72.7 12.3/71.6CPI: Consumer price index (2000=100) 122 173 473h
Agricultural production index (2004-2006=100) 100 89 79h
Food production index (2004-2006=100) 99 92 82h
Index of industrial production (2005=100) c 100 98 ...Balance of payments, current account (million US$) 295 –367 ...Social indicatorsPopulation growth rate (average annual %) 2010-2015 –2.3Urban population (%) 2015 57.7Urban population growth rate (average annual %) 2010-2015 1.4Fertility rate, total (live births per woman) 2010-2015 3.0Life expectancy at birth (females/males, years) 2010-2015 76.3/64.0Total dependency ratio (Pop. aged 0-14 & 65+ per 100 pop. 15-64) 2015 70International migrant stock (000/% of total pop.) mid-2015 875.2/4.7ij
Refugees and others of concern to UNHCR mid-2015 7 946 539k
Infant mortality rate (per 1 000 live births) 2010-2015 18Health: Total expenditure (% of GDP) 2014 3.3l
Education: Primary gross enrolment ratio (f/m per 100 pop.) 2014 78.7/81.4h
Education: Secondary gross enrolment ratio (f/m per 100 pop.) 2014 50.5/50.5h
Education: Tertiary gross enrolment ratio (f/m per 100 pop.) 2014 33.6/32.4h
Seats held by women in national parliaments (%) 2016 12.4Environment and infrastructureMobile-cellular subscriptions (per 100 inhabitants) 2014 71.0Individuals using the Internet (%) 2014 28.1g
Threatened species 2015 108Forested area (% of land area) 2013 2.7g
CO2 emission estimates (000 tons/tons per capita) 2013 36 065/1.9Energy production, primary (Petajoules) 2013 316Energy supply per capita (Gigajoules) 2013 28.0Terrestrial and marine areas protected (% of total area) 2014 0.7Population using improved drinking water sources (urban/rural, %) 2015 92.3/87.2Population using improved sanitation facilities (urban/rural, %) 2015 96.2/95.1a Excluding refugees or internally displaced persons (if applicable). b At producers' prices. c Data classifiedaccording to ISIC Rev. 3. d 2003. e Break in the time series. f 2011. g Estimate. h 2013. i Including refugees.j Refers to foreign citizens. k Refugee figure for Iraqis in the Syrian Arab Republic is a Governmentestimate. UNHCR has registered and is assisting 23,500 Iraqis at mid-2015. l The exchange rate used forthe Syrian Arab Republic is the rate for non-commercial transactions from the Central Bank of Syria.
World Statistics Pocketbook 201

TajikistanRegion Central Asia Surface area (sq km) 142 600Population (proj., 000) 8 670 Pop. density (per sq km) 61.9Capital city Dushanbe Capital city pop. (000) 822Currency Somoni (TJS) UN membership date 2 March 1992Economic indicators 2005 2010 2014GDP: Gross domestic product (million current US$) 2 312 5 642 9 242GDP growth rate (annual %, const. 2005 prices) 6.7 6.5 6.7GDP per capita (current US$) 339.8 744.2 1 114.0Economy: Agriculture (% of GVA) 23.8 21.9 27.2Economy: Industry (% of GVA) 30.7 27.9 25.5Economy: Services and other activity (% of GVA) 45.6 50.3 47.3Employment: Agriculture (% of employed) 55.5ab 52.9cde ...Employment: Industry (% of employed) 17.9ab 15.6cde ...Employment: Services and other (% of employed) 26.2ab 31.1cde ...Unemployment (% of labour force) f 11.8 11.6 10.9Labour force participation (female/male pop. %) f 57.7/74.7 58.3/76.3 59.3/77.3Agricultural production index (2004-2006=100) 99 123 154g
Food production index (2004-2006=100) 99 137 170g
Index of industrial production (2005=100) a 100 114 145Balance of payments, current account (million US$) –19 –370 –946c
Social indicatorsPopulation growth rate (average annual %) 2010-2015 2.2Urban population (%) 2015 26.8Urban population growth rate (average annual %) 2010-2015 2.6Fertility rate, total (live births per woman) 2010-2015 3.6Life expectancy at birth (females/males, years) 2010-2015 72.8/65.9Total dependency ratio (Pop. aged 0-14 & 65+ per 100 pop. 15-64) 2015 61International migrant stock (000/% of total pop.) mid-2015 275.1/3.2Tourist arrivals at national borders (000) h 2014 213Refugees and others of concern to UNHCR mid-2015 11 943i
Infant mortality rate (per 1 000 live births) 2010-2015 40Health: Total expenditure (% of GDP) 2014 6.9Health: Physicians (per 1 000 pop.) 2013 1.9Education: Government expenditure (% of GDP) 2014 4.0j
Education: Primary gross enrolment ratio (f/m per 100 pop.) 2014 97.1/97.5Education: Secondary gross enrolment ratio (f/m per 100 pop.) 2014 83.1/92.5g
Education: Tertiary gross enrolment ratio (f/m per 100 pop.) 2014 18.4/30.4Intentional homicide rate (per 100 000 pop.) 2014 1.4g
Seats held by women in national parliaments (%) 2016 19.0Environment and infrastructureMobile-cellular subscriptions (per 100 inhabitants) 2014 95.1f
Individuals using the Internet (%) 2014 17.5f
Patents: Resident filings (per million pop.) 2014 1.0j
Threatened species 2015 41Forested area (% of land area) 2013 2.9f
CO2 emission estimates (000 tons/tons per capita) 2013 3 586/0.4Energy production, primary (Petajoules) 2013 72Energy supply per capita (Gigajoules) 2013 13.0Terrestrial and marine areas protected (% of total area) 2014 21.9Population using improved drinking water sources (urban/rural, %) 2015 93.1/66.7Population using improved sanitation facilities (urban/rural, %) 2015 93.8/95.5Net Official Development Assistance received (% of GNI) 2014 3.9a Data classified according to ISIC Rev. 3. b 2004. c Break in the time series. d Persons aged 15 to 75years. e 2009. f Estimate. g 2013. h Arrivals of non-resident visitors at national borders. i Figure refersto a registration exercise in three regions and 637 persons registered as stateless by the Ministry ofInternal Affairs of Tajikistan. j 2012.
202 World Statistics Pocketbook
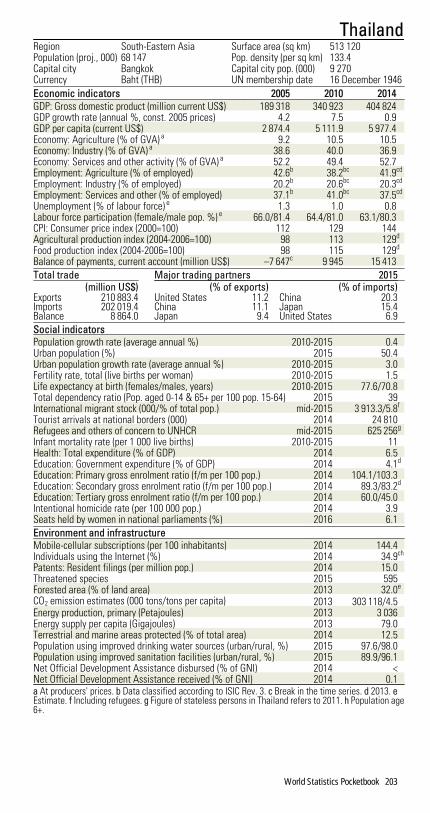
ThailandRegion South-Eastern Asia Surface area (sq km) 513 120Population (proj., 000) 68 147 Pop. density (per sq km) 133.4Capital city Bangkok Capital city pop. (000) 9 270Currency Baht (THB) UN membership date 16 December 1946Economic indicators 2005 2010 2014GDP: Gross domestic product (million current US$) 189 318 340 923 404 824GDP growth rate (annual %, const. 2005 prices) 4.2 7.5 0.9GDP per capita (current US$) 2 874.4 5 111.9 5 977.4Economy: Agriculture (% of GVA) a 9.2 10.5 10.5Economy: Industry (% of GVA) a 38.6 40.0 36.9Economy: Services and other activity (% of GVA) a 52.2 49.4 52.7Employment: Agriculture (% of employed) 42.6b 38.2bc 41.9cd
Employment: Industry (% of employed) 20.2b 20.6bc 20.3cd
Employment: Services and other (% of employed) 37.1b 41.0bc 37.5cd
Unemployment (% of labour force) e 1.3 1.0 0.8Labour force participation (female/male pop. %) e 66.0/81.4 64.4/81.0 63.1/80.3CPI: Consumer price index (2000=100) 112 129 144Agricultural production index (2004-2006=100) 98 113 129d
Food production index (2004-2006=100) 98 115 129d
Balance of payments, current account (million US$) –7 647c 9 945 15 413Total trade Major trading partners 2015
(million US$) (% of exports) (% of imports)Exports 210 883.4 United States 11.2 China 20.3Imports 202 019.4 China 11.1 Japan 15.4Balance 8 864.0 Japan 9.4 United States 6.9Social indicatorsPopulation growth rate (average annual %) 2010-2015 0.4Urban population (%) 2015 50.4Urban population growth rate (average annual %) 2010-2015 3.0Fertility rate, total (live births per woman) 2010-2015 1.5Life expectancy at birth (females/males, years) 2010-2015 77.6/70.8Total dependency ratio (Pop. aged 0-14 & 65+ per 100 pop. 15-64) 2015 39International migrant stock (000/% of total pop.) mid-2015 3 913.3/5.8f
Tourist arrivals at national borders (000) 2014 24 810Refugees and others of concern to UNHCR mid-2015 625 256g
Infant mortality rate (per 1 000 live births) 2010-2015 11Health: Total expenditure (% of GDP) 2014 6.5Education: Government expenditure (% of GDP) 2014 4.1d
Education: Primary gross enrolment ratio (f/m per 100 pop.) 2014 104.1/103.3Education: Secondary gross enrolment ratio (f/m per 100 pop.) 2014 89.3/83.2d
Education: Tertiary gross enrolment ratio (f/m per 100 pop.) 2014 60.0/45.0Intentional homicide rate (per 100 000 pop.) 2014 3.9Seats held by women in national parliaments (%) 2016 6.1Environment and infrastructureMobile-cellular subscriptions (per 100 inhabitants) 2014 144.4Individuals using the Internet (%) 2014 34.9ch
Patents: Resident filings (per million pop.) 2014 15.0Threatened species 2015 595Forested area (% of land area) 2013 32.0e
CO2 emission estimates (000 tons/tons per capita) 2013 303 118/4.5Energy production, primary (Petajoules) 2013 3 036Energy supply per capita (Gigajoules) 2013 79.0Terrestrial and marine areas protected (% of total area) 2014 12.5Population using improved drinking water sources (urban/rural, %) 2015 97.6/98.0Population using improved sanitation facilities (urban/rural, %) 2015 89.9/96.1Net Official Development Assistance disbursed (% of GNI) 2014 <Net Official Development Assistance received (% of GNI) 2014 0.1a At producers' prices. b Data classified according to ISIC Rev. 3. c Break in the time series. d 2013. eEstimate. f Including refugees. g Figure of stateless persons in Thailand refers to 2011. h Population age6+.
World Statistics Pocketbook 203

The former Yugoslav Republic of MacedoniaRegion Southern Europe Surface area (sq km) 25 713Population (proj., 000) 2 081 Pop. density (per sq km) 82.5Capital city Skopje Capital city pop. (000) 503Currency Denar (MKD) UN membership date 8 April 1993Economic indicators 2005 2010 2014GDP: Gross domestic product (million current US$) 6 259 9 407 11 319GDP growth rate (annual %, const. 2005 prices) 4.7 3.4 3.8GDP per capita (current US$) 3 063.6 4 561.2 5 453.3Economy: Agriculture (% of GVA) a 11.3 11.7 10.2Economy: Industry (% of GVA) b 23.7 24.4 24.8Economy: Services and other activity (% of GVA) cd 65.0 63.9 65.0Employment: Agriculture (% of employed) 19.5e 18.9efg 18.0Employment: Industry (% of employed) 32.3e 31.6efg 30.6Employment: Services and other (% of employed) 48.2e 49.5efg 51.4Unemployment (% of labour force) h 37.3 32.0 28.0Labour force participation (female/male pop. %) h 42.6/64.6 43.1/69.3 43.9/68.2CPI: Consumer price index (2000=100) 109i 125j ...Agricultural production index (2004-2006=100) 100 116 115k
Food production index (2004-2006=100) 99 116 115k
Index of industrial production (2005=100) l 100 101 113Balance of payments, current account (million US$) –159 –198 –104Total trade Major trading partners 2015
(million US$) (% of exports) (% of imports)Exports 4 489.9 Germany 44.3 Germany 12.6Imports 6 399.8 Serbia 8.7 United Kingdom 9.7Balance –1 909.9 Bulgaria 6.0 Serbia 8.1Social indicatorsPopulation growth rate (average annual %) 2010-2015 0.2Urban population (%) 2015 57.1Urban population growth rate (average annual %) 2010-2015 0.1Fertility rate, total (live births per woman) 2010-2015 1.5Life expectancy at birth (females/males, years) 2010-2015 77.5/72.9Total dependency ratio (Pop. aged 0-14 & 65+ per 100 pop. 15-64) 2015 41International migrant stock (000/% of total pop.) mid-2015 130.7/6.3Tourist arrivals at national borders (000) m 2014 425Refugees and others of concern to UNHCR mid-2015 1 588Infant mortality rate (per 1 000 live births) 2010-2015 10Health: Total expenditure (% of GDP) 2014 6.5Education: Primary gross enrolment ratio (f/m per 100 pop.) 2014 85.1/86.4n
Education: Secondary gross enrolment ratio (f/m per 100 pop.) 2014 81.2/82.9n
Education: Tertiary gross enrolment ratio (f/m per 100 pop.) 2014 44.1/34.9k
Intentional homicide rate (per 100 000 pop.) 2014 1.6Seats held by women in national parliaments (%) 2016 33.3Environment and infrastructureMobile-cellular subscriptions (per 100 inhabitants) 2014 109.1o
Individuals using the Internet (%) 2014 68.1pq
Patents: Resident filings (per million pop.) 2014 20.0k
Threatened species 2015 100Forested area (% of land area) 2013 39.6h
CO2 emission estimates (000 tons/tons per capita) 2013 8 295/4.0Energy production, primary (Petajoules) 2013 59Energy supply per capita (Gigajoules) 2013 56.0Terrestrial and marine areas protected (% of total area) 2014 9.7Population using improved drinking water sources (urban/rural, %) 2015 99.8/98.9Population using improved sanitation facilities (urban/rural, %) 2015 97.2/82.6Net Official Development Assistance received (% of GNI) 2014 1.9a Excludes irrigation canals and landscaping care. b Excludes publishing activities, includes irrigationcanals. c Excludes repair of personal and household goods. d Includes publishing activities and land-scaping care. e Data classified according to ISIC Rev. 3. f Break in the time series. g 2008. h Estimate. iAnnual average is weighted mean of monthly data. j Series linked to former series. k 2013. l Excludingwater and waste management. m Arrivals of non-resident tourists in all types of tourism accommodationestablishments. n 2012. o Data refers to the third quarter. p Population age 16-74. q Users in the last 3months.
204 World Statistics Pocketbook

Timor-LesteRegion South-Eastern Asia Surface area (sq km) 14 919Population (proj., 000) 1 211 Pop. density (per sq km) 81.5Capital city Dili Capital city pop. (000) 228 a
Currency US Dollar (USD) UN membership date 27 September 2002Economic indicators 2005 2010 2014GDP: Gross domestic product (million current US$) 1 850 4 069 4 970GDP growth rate (annual %, const. 2005 prices) 52.7 –3.3 4.5GDP per capita (current US$) 1 869.4 3 848.9 4 294.1Economy: Agriculture (% of GVA) b 7.3 4.7 3.9Economy: Industry (% of GVA) c 76.7 81.5 84.1Economy: Services and other activity (% of GVA) de 16.0 13.8 12.1Employment: Agriculture (% of employed) 81.6fgh 50.6i ...Employment: Industry (% of employed) 3.9fgh 9.2i ...Employment: Services and other (% of employed) 11.2fgh 39.8i ...Unemployment (% of labour force) j 6.7 3.9 4.4Labour force participation (female/male pop. %) j 32.0/66.3 26.1/55.3 26.7/55.6Agricultural production index (2004-2006=100) 98 121 113k
Food production index (2004-2006=100) 98 126 119k
Balance of payments, current account (million US$) ... 1 671 1 106Total trade Major trading partners 2015
(million US$)k (% of exports)k (% of imports)k
Exports 53.1 Indonesia 34.8 Indonesia 34.3Imports 513.7 Germany 14.5 Malaysia 15.4Balance –460.6 United States 13.7 Singapore 12.8Social indicatorsPopulation growth rate (average annual %) 2010-2015 2.3Urban population (%) 2015 32.8Urban population growth rate (average annual %) 2010-2015 3.8Fertility rate, total (live births per woman) 2010-2015 5.9Life expectancy at birth (females/males, years) 2010-2015 69.5/66.1Total dependency ratio (Pop. aged 0-14 & 65+ per 100 pop. 15-64) 2015 92International migrant stock (000/% of total pop.) mid-2015 10.8/0.9Tourist arrivals at national borders (000) 2014 60l
Refugees and others of concern to UNHCR mid-2015 5Infant mortality rate (per 1 000 live births) 2010-2015 44Health: Total expenditure (% of GDP) 2014 1.5Health: Physicians (per 1 000 pop.) 2013 0.1m
Education: Government expenditure (% of GDP) 2014 7.7Education: Primary gross enrolment ratio (f/m per 100 pop.) 2014 136.1/137.6Education: Secondary gross enrolment ratio (f/m per 100 pop.) 2014 76.0/70.3Seats held by women in national parliaments (%) 2016 38.5Environment and infrastructureMobile-cellular subscriptions (per 100 inhabitants) 2014 58.7j
Individuals using the Internet (%) 2014 1.1j
Threatened species 2015 21Forested area (% of land area) 2013 47.6j
CO2 emission estimates (000 tons/tons per capita) 2013 440/0.4Energy production, primary (Petajoules) 2013 168Energy supply per capita (Gigajoules) 2013 6.0j
Terrestrial and marine areas protected (% of total area) 2014 2.1Population using improved drinking water sources (urban/rural, %) 2015 95.2/60.5Population using improved sanitation facilities (urban/rural, %) 2015 69.0/26.8Net Official Development Assistance received (% of GNI) 2014 6.4a 2014. b Excludes irrigation canals and landscaping care. c Excludes publishing activities, includesirrigation canals. d Includes publishing activities and landscaping care. e Excludes repair of personal andhousehold goods. f Data classified according to ISIC Rev. 3. g Persons aged 15 to 64 years. h 2001. i Breakin the time series. j Estimate. k 2013. l Arrivals by air at Dili Airport. m 2011.
World Statistics Pocketbook 205

TogoRegion Western Africa Surface area (sq km) 56 785Population (proj., 000) 7 497 Pop. density (per sq km) 137.8Capital city Lomé Capital city pop. (000) 956Currency CFA Franc (XOF) UN membership date 20 September 1960Economic indicators 2005 2010 2014GDP: Gross domestic product (million current US$) 2 110 3 173 4 576GDP growth rate (annual %, const. 2005 prices) 1.2 4.0 6.1GDP per capita (current US$) 378.3 496.4 643.1Economy: Agriculture (% of GVA) 43.4 46.1 46.7Economy: Industry (% of GVA) a 19.0 18.2 19.4Economy: Services and other activity (% of GVA) b 37.6 35.7 33.9Employment: Agriculture (% of employed) c ... 54.1d ...Employment: Industry (% of employed) c ... 6.8d ...Employment: Services and other (% of employed) c ... 37.5d ...Unemployment (% of labour force) e 8.0 7.8 7.7Labour force participation (female/male pop. %) e 79.8/80.4 81.0/80.3 81.1/80.5CPI: Consumer price index (2000=100) f 114 134g 145Agricultural production index (2004-2006=100) 96 123 121h
Food production index (2004-2006=100) 99 129 125h
Index of industrial production (2005=100) 100 124 156Balance of payments, current account (million US$) –204 –200 –568h
Total trade Major trading partners 2015(million US$) (% of exports) (% of imports)
Exports 671.9 Burkina Faso 16.2 China 20.1Imports 1 732.1 Benin 14.9 France 9.4Balance –1 060.2 Niger 9.7 South Africa 4.9Social indicatorsPopulation growth rate (average annual %) 2010-2015 2.7Urban population (%) 2015 40.0Urban population growth rate (average annual %) 2010-2015 3.8Fertility rate, total (live births per woman) 2010-2015 4.7Life expectancy at birth (females/males, years) 2010-2015 59.7/58.3Total dependency ratio (Pop. aged 0-14 & 65+ per 100 pop. 15-64) 2015 82International migrant stock (000/% of total pop.) mid-2015 276.8/3.8ij
Tourist arrivals at national borders (000) k 2014 282Refugees and others of concern to UNHCR mid-2015 22 564Infant mortality rate (per 1 000 live births) 2010-2015 50Health: Total expenditure (% of GDP) 2014 5.3Education: Government expenditure (% of GDP) 2014 4.8Education: Primary gross enrolment ratio (f/m per 100 pop.) 2014 121.4/128.8Education: Tertiary gross enrolment ratio (f/m per 100 pop.) 2014 5.9/14.3Intentional homicide rate (per 100 000 pop.) 2014 9.2l
Seats held by women in national parliaments (%) 2016 17.6Environment and infrastructureMobile-cellular subscriptions (per 100 inhabitants) 2014 69.0e
Individuals using the Internet (%) 2014 5.7e
Threatened species 2015 66Forested area (% of land area) 2013 4.2e
CO2 emission estimates (000 tons/tons per capita) 2013 2 230/0.3Energy production, primary (Petajoules) 2013 108Energy supply per capita (Gigajoules) 2013 19.0Terrestrial and marine areas protected (% of total area) 2014 19.8Population using improved drinking water sources (urban/rural, %) 2015 91.4/44.2Population using improved sanitation facilities (urban/rural, %) 2015 24.7/2.9Net Official Development Assistance received (% of GNI) 2014 5.1a Construction refers to buildings and public works. b Refers to trade only. c Data classified according toISIC Rev. 2. d 2006. e Estimate. f Lomé. g Series linked to former series. h 2013. i Including refugees. jRefers to foreign citizens. k Arrivals of non-resident tourists in hotels and similar establishments. l 2012.
206 World Statistics Pocketbook

TokelauRegion Oceania-Polynesia Surface area (sq km) 12Population (proj., 000) 1 Pop. density (per sq km) 127.6Capital city Tokelau a Capital city pop. (000) ...Currency New Zealand Dollar (NZD)Economic indicators 2005 2010 2014Agricultural production index (2004-2006=100) 102 120 125b
Food production index (2004-2006=100) 102 120 125b
Social indicatorsPopulation growth rate (average annual %) 2010-2015 1.9Urban population (%) 2015 0.0Urban population growth rate (average annual %) 2010-2015 0.0Fertility rate, total (live births per woman) 2010-2015 2.1c
Life expectancy at birth (females/males, years) 2010-2015 70.4/67.8d
Total dependency ratio (Pop. aged 0-14 & 65+ per 100 pop. 15-64) 2015 60b
International migrant stock (000/% of total pop.) mid-2015 0.5/39.0Infant mortality rate (per 1 000 live births) 2010-2015 31e
Environment and infrastructureThreatened species 2015 46Forested area (% of land area) 2013 0.0f
Population using improved drinking water sources (urban/rural, %) 2015 .../100.0Population using improved sanitation facilities (urban/rural, %) 2015 .../90.5a The "capital" rotates yearly between the three atolls of Atafu, Fakaofo and Nukunomu, each with fewerthan 500 inhabitants in 2011. b 2013. c 2006 - 2011. d 1990. e 2000 - 2003. f Estimate.
World Statistics Pocketbook 207

TongaRegion Oceania-Polynesia Surface area (sq km) 747Population (proj., 000) 107 Pop. density (per sq km) 148.5Capital city Nuku'alofa Capital city pop. (000) 25 a
Currency Pa'anga (TOP) UN membership date 14 September 1999Economic indicators 2005 2010 2014GDP: Gross domestic product (million current US$) 262 374 435GDP growth rate (annual %, const. 2005 prices) 1.6 3.6 2.0GDP per capita (current US$) 2 593.2 3 596.8 4 121.7Economy: Agriculture (% of GVA) 20.2 18.3 19.4Economy: Industry (% of GVA) 19.1 20.0 18.2Economy: Services and other activity (% of GVA) 60.7 61.7 62.4Employment: Agriculture (% of employed) b 31.8c ... ...Employment: Industry (% of employed) b 30.6c ... ...Employment: Services and other (% of employed) b 37.5c ... ...Unemployment (% of labour force) d 5.0 5.2 5.3Labour force participation (female/male pop. %) d 53.1/75.0 53.1/75.2 52.9/74.3CPI: Consumer price index (2000=100) e 160 210 233Agricultural production index (2004-2006=100) 97 136 131f
Food production index (2004-2006=100) 97 136 131f
Balance of payments, current account (million US$) –21 –80 –33f
Total trade Major trading partners 2015(million US$)a (% of exports)a (% of imports)a
Exports 18.9 New Zealand 23.3 New Zealand 28.6Imports 218.2 China, Hong Kong SAR 17.5 Singapore 21.1Balance –199.3 Areas nes 15.3g United States 10.9Social indicatorsPopulation growth rate (average annual %) 2010-2015 0.4Urban population (%) 2015 23.7Urban population growth rate (average annual %) 2010-2015 0.7Fertility rate, total (live births per woman) 2010-2015 3.8Life expectancy at birth (females/males, years) 2010-2015 75.6/69.7Total dependency ratio (Pop. aged 0-14 & 65+ per 100 pop. 15-64) 2015 74International migrant stock (000/% of total pop.) mid-2015 5.7/5.4Tourist arrivals at national borders (000) 2014 50h
Infant mortality rate (per 1 000 live births) 2010-2015 20Health: Total expenditure (% of GDP) 2014 5.2Education: Primary gross enrolment ratio (f/m per 100 pop.) 2014 107.5/108.6Education: Secondary gross enrolment ratio (f/m per 100 pop.) 2014 94.2/86.4Intentional homicide rate (per 100 000 pop.) 2014 0.1i
Seats held by women in national parliaments (%) 2016 0.0Environment and infrastructureMobile-cellular subscriptions (per 100 inhabitants) 2014 64.3d
Individuals using the Internet (%) 2014 40.0d
Threatened species 2015 74Forested area (% of land area) 2013 12.5d
CO2 emission estimates (000 tons/tons per capita) 2013 209/2.0Energy production, primary (Petajoules) 2013 0Energy supply per capita (Gigajoules) 2013 28.0Terrestrial and marine areas protected (% of total area) 2014 1.5Population using improved drinking water sources (urban/rural, %) 2015 99.7/99.6Population using improved sanitation facilities (urban/rural, %) 2015 97.6/89.0Net Official Development Assistance received (% of GNI) 2014 18.0a 2014. b Data classified according to ISIC Rev. 3. c 2003. d Estimate. e Excluding `Rent´. f 2013. g Seetechnical notes. h Arrivals by air. i 2012.
208 World Statistics Pocketbook

Trinidad and TobagoRegion Caribbean Surface area (sq km) 5 130Population (proj., 000) 1 365 Pop. density (per sq km) 266.1Capital city Port of Spain Capital city pop. (000) 34 a
Currency TT Dollar (TTD) b UN membership date 18 September 1962Economic indicators 2005 2010 2014GDP: Gross domestic product (million current US$) 15 982 21 038 28 069GDP growth rate (annual %, const. 2005 prices) 6.2 –0.1 1.9GDP per capita (current US$) 12 323.2 15 840.4 20 722.7Economy: Agriculture (% of GVA) 0.5 0.5 0.4Economy: Industry (% of GVA) 56.7 53.3 52.0Economy: Services and other activity (% of GVA) 42.8 46.2 47.6Employment: Agriculture (% of employed) c 4.3 3.8d ...Employment: Industry (% of employed) c 31.0 32.2d ...Employment: Services and other (% of employed) c 64.3 63.8d ...Unemployment (% of labour force) e 8.0 5.9 3.3Labour force participation (female/male pop. %) e 53.5/76.2 52.5/75.4 52.6/73.7CPI: Consumer price index (2000=100) 126 196 250Agricultural production index (2004-2006=100) 99 96 96f
Food production index (2004-2006=100) 99 96 96f
Index of industrial production (2005=100) g 100 159 142Balance of payments, current account (million US$) 3 881 4 172 ...Social indicatorsPopulation growth rate (average annual %) 2010-2015 0.5Urban population (%) 2015 8.4Urban population growth rate (average annual %) 2010-2015 –1.2Fertility rate, total (live births per woman) 2010-2015 1.8Life expectancy at birth (females/males, years) 2010-2015 73.8/66.9Total dependency ratio (Pop. aged 0-14 & 65+ per 100 pop. 15-64) 2015 43International migrant stock (000/% of total pop.) mid-2015 49.9/3.7Tourist arrivals at national borders (000) 2014 412h
Refugees and others of concern to UNHCR mid-2015 180Infant mortality rate (per 1 000 live births) 2010-2015 25Health: Total expenditure (% of GDP) 2014 5.9i
Intentional homicide rate (per 100 000 pop.) 2014 25.9Seats held by women in national parliaments (%) 2016 31.0Environment and infrastructureMobile-cellular subscriptions (per 100 inhabitants) 2014 147.3Individuals using the Internet (%) 2014 65.1e
Patents: Resident filings (per million pop.) 2014 1.0Threatened species 2015 65Forested area (% of land area) 2013 45.1e
CO2 emission estimates (000 tons/tons per capita) 2013 46 542/34.5Energy production, primary (Petajoules) 2013 1 673Energy supply per capita (Gigajoules) 2013 611.0Terrestrial and marine areas protected (% of total area) 2014 2.6Population using improved drinking water sources (urban/rural, %) 2015 95.1/95.1Population using improved sanitation facilities (urban/rural, %) 2015 91.5/91.5a 2014. b Trinidad and Tobago Dollar. c Data classified according to ISIC Rev. 2. d 2008. e Estimate. f2013. g Data classified according to ISIC Rev. 3. h Arrivals by air. i Data revision.
World Statistics Pocketbook 209

TunisiaRegion Northern Africa Surface area (sq km) 163 610Population (proj., 000) 11 375 Pop. density (per sq km) 73.2Capital city Tunis Capital city pop. (000) 1 993 a
Currency Tunisian Dinar (TND) UN membership date 12 November 1956Economic indicators 2005 2010 2014GDP: Gross domestic product (million current US$) 32 272 44 051 47 423GDP growth rate (annual %, const. 2005 prices) 4.0 3.0 2.3GDP per capita (current US$) 3 194.5 4 140.5 4 260.8Economy: Agriculture (% of GVA) b 10.0 8.1 9.4Economy: Industry (% of GVA) b 28.8 31.1 29.1Economy: Services and other activity (% of GVA) b 61.3 60.8 61.6Employment: Agriculture (% of employed) cd ... 17.6 14.8e
Employment: Industry (% of employed) cd ... 32.7 33.5e
Employment: Services and other (% of employed) cd ... 48.8 51.5e
Unemployment (% of labour force) f 14.2 13.0 15.3Labour force participation (female/male pop. %) f 24.0/68.0 24.5/69.7 25.0/71.2CPI: Consumer price index (2000=100) 114 139g 170Agricultural production index (2004-2006=100) 101 107 118h
Food production index (2004-2006=100) 101 107 118h
Index of industrial production (2005=100) 100 115 112Balance of payments, current account (million US$) –299 –2 104 –4 302Total trade Major trading partners 2015
(million US$) (% of exports) (% of imports)Exports 14 073.5 France 29.3 France 17.8Imports 20 222.5 Italy 18.5 Italy 14.9Balance –6 149.0 Germany 10.5 China 8.4Social indicatorsPopulation growth rate (average annual %) 2010-2015 1.1Urban population (%) 2015 66.8Urban population growth rate (average annual %) 2010-2015 1.4Fertility rate, total (live births per woman) 2010-2015 2.2Life expectancy at birth (females/males, years) 2010-2015 77.0/72.3Total dependency ratio (Pop. aged 0-14 & 65+ per 100 pop. 15-64) 2015 45International migrant stock (000/% of total pop.) mid-2015 56.7/0.5i
Tourist arrivals at national borders (000) 2014 7 163Refugees and others of concern to UNHCR mid-2015 983Infant mortality rate (per 1 000 live births) 2010-2015 19Health: Total expenditure (% of GDP) 2014 7.0j
Education: Government expenditure (% of GDP) 2014 6.2k
Education: Primary gross enrolment ratio (f/m per 100 pop.) 2014 111.4/114.7Education: Secondary gross enrolment ratio (f/m per 100 pop.) 2014 94.2/90.0l
Education: Tertiary gross enrolment ratio (f/m per 100 pop.) 2014 43.1/26.3Intentional homicide rate (per 100 000 pop.) 2014 3.1k
Seats held by women in national parliaments (%) 2016 31.3Environment and infrastructureMobile-cellular subscriptions (per 100 inhabitants) 2014 128.5Individuals using the Internet (%) 2014 46.2f
Patents: Resident filings (per million pop.) 2014 13.0Threatened species 2015 83Forested area (% of land area) 2013 6.6f
CO2 emission estimates (000 tons/tons per capita) 2013 27 668/2.5Energy production, primary (Petajoules) 2013 298Energy supply per capita (Gigajoules) 2013 39.0Terrestrial and marine areas protected (% of total area) 2014 3.7Population using improved drinking water sources (urban/rural, %) 2015 100.0/93.2Population using improved sanitation facilities (urban/rural, %) 2015 97.4/79.8a Refers to Grand Tunis. b At factor cost. c Data classified according to ISIC Rev. 3. d Industry includesrepairs. e Break in the time series. f Estimate. g Series linked to former series. h 2013. i Refers to foreigncitizens. j Data revision. k 2012. l 2011.
210 World Statistics Pocketbook

TurkeyRegion Western Asia Surface area (sq km) 783 562Population (proj., 000) 79 622 Pop. density (per sq km) 103.5Capital city Ankara Capital city pop. (000) 4 750 a
Currency Turkish Lira (TRY) UN membership date 24 October 1945Economic indicators 2005 2010 2014GDP: Gross domestic product (million current US$) 482 986 731 144 798 414GDP growth rate (annual %, const. 2005 prices) 8.4 9.2 2.9GDP per capita (current US$) 7 117.3 10 111.2 10 299.0Economy: Agriculture (% of GVA) b 10.6 9.5 8.0Economy: Industry (% of GVA) c 28.0 26.4 27.1Economy: Services and other activity (% of GVA) de 61.4 64.2 64.9Employment: Agriculture (% of employed) 29.5fg 22.4 19.7Employment: Industry (% of employed) 24.8fg 26.8 28.4Employment: Services and other (% of employed) 45.8fg 50.8 51.9Unemployment (% of labour force) h 10.6 10.7 9.9Labour force participation (female/male pop. %) h 23.4/70.3 27.6/70.7 30.4/71.5CPI: Consumer price index (2000=100) 381i 578 784Agricultural production index (2004-2006=100) 101 110 125j
Food production index (2004-2006=100) 101 111 127j
Index of industrial production (2005=100) k 100 116 140Balance of payments, current account (million US$) –21 449 –45 312 –46 526Total trade Major trading partners 2015
(million US$) (% of exports) (% of imports)Exports 143 850.4 Germany 9.3 China 12.0Imports 207 206.5 United Kingdom 7.3 Germany 10.3Balance –63 356.1 Iraq 5.9 Russian Federation 9.8Social indicatorsPopulation growth rate (average annual %) 2010-2015 1.7Urban population (%) 2015 73.4Urban population growth rate (average annual %) 2010-2015 2.0Fertility rate, total (live births per woman) 2010-2015 2.1Life expectancy at birth (females/males, years) 2010-2015 78.1/71.5Total dependency ratio (Pop. aged 0-14 & 65+ per 100 pop. 15-64) 2015 50International migrant stock (000/% of total pop.) mid-2015 2 964.9/3.8l
Tourist arrivals at national borders (000) 2014 39 811m
Refugees and others of concern to UNHCR mid-2015 1 985 269n
Infant mortality rate (per 1 000 live births) 2010-2015 13Health: Total expenditure (% of GDP) 2014 5.4Health: Physicians (per 1 000 pop.) 2013 1.7o
Education: Primary gross enrolment ratio (f/m per 100 pop.) 2014 106.5/107.2j
Education: Secondary gross enrolment ratio (f/m per 100 pop.) 2014 98.7/101.8j
Education: Tertiary gross enrolment ratio (f/m per 100 pop.) 2014 72.9/84.9j
Intentional homicide rate (per 100 000 pop.) 2014 4.3p
Seats held by women in national parliaments (%) 2016 14.9Environment and infrastructureMobile-cellular subscriptions (per 100 inhabitants) 2014 94.8Individuals using the Internet (%) 2014 51.0qr
Patents: Resident filings (per million pop.) 2014 68.0Threatened species 2015 370Forested area (% of land area) 2013 15.0h
CO2 emission estimates (000 tons/tons per capita) 2013 323 451/4.3Energy production, primary (Petajoules) 2013 1 352Energy supply per capita (Gigajoules) 2013 64.0Terrestrial and marine areas protected (% of total area) 2014 0.2Population using improved drinking water sources (urban/rural, %) 2015 100.0/100.0Population using improved sanitation facilities (urban/rural, %) 2015 98.3/85.5Net Official Development Assistance disbursed (% of GNI) 2014 0.5Net Official Development Assistance received (% of GNI) 2014 0.4a Refers to Altindag, Cankaya, Etimesgut, Golbasi, Keçioren, Mamak, Sincan and Yenimahalle. b Excludesirrigation canals and landscaping care. c Excludes publishing activities, includes irrigation canals. dExcludes repair of personal and household goods. e Includes publishing activities and landscaping care.f Data classified according to ISIC Rev. 3. g Break in the time series. h Estimate. i Series linked to formerseries. j 2013. k Excluding water and waste management. l Including refugees. m Turkish citizens residentabroad are included. n Refugee figure for Syrians in Turkey is a Government estimate. o 2011. p 2012.q Population age 16-74. r Users in the last 12 months.
World Statistics Pocketbook 211

TurkmenistanRegion Central Asia Surface area (sq km) 488 100Population (proj., 000) 5 439 Pop. density (per sq km) 11.6Capital city Ashgabat Capital city pop. (000) 746Currency Turkmenistan New Manat (TMT)UN membership date 2 March 1992Economic indicators 2005 2010 2014GDP: Gross domestic product (million current US$) 14 182 22 148 47 932GDP growth rate (annual %, const. 2005 prices) 13.0 9.2 10.3GDP per capita (current US$) 2 987.1 4 392.7 9 031.5Economy: Agriculture (% of GVA) 18.8 14.6 14.6Economy: Industry (% of GVA) 37.6 48.4 48.4Economy: Services and other activity (% of GVA) 43.6 37.0 37.0Unemployment (% of labour force) a 10.4 10.4 10.1Labour force participation (female/male pop. %) a 47.0/74.8 46.4/75.7 47.1/77.3Agricultural production index (2004-2006=100) 104 102 103b
Food production index (2004-2006=100) 102 106 109b
Social indicatorsPopulation growth rate (average annual %) 2010-2015 1.3Urban population (%) 2015 50.0Urban population growth rate (average annual %) 2010-2015 1.9Fertility rate, total (live births per woman) 2010-2015 2.3Life expectancy at birth (females/males, years) 2010-2015 69.7/61.3Total dependency ratio (Pop. aged 0-14 & 65+ per 100 pop. 15-64) 2015 48International migrant stock (000/% of total pop.) mid-2015 196.4/3.7Refugees and others of concern to UNHCR mid-2015 7 171Infant mortality rate (per 1 000 live births) 2010-2015 47Health: Total expenditure (% of GDP) 2014 2.1Education: Government expenditure (% of GDP) 2014 3.1c
Education: Primary gross enrolment ratio (f/m per 100 pop.) 2014 88.6/90.1Education: Secondary gross enrolment ratio (f/m per 100 pop.) 2014 83.7/86.9Education: Tertiary gross enrolment ratio (f/m per 100 pop.) 2014 6.2/9.7Intentional homicide rate (per 100 000 pop.) 2014 4.3c
Seats held by women in national parliaments (%) 2016 25.8Environment and infrastructureMobile-cellular subscriptions (per 100 inhabitants) 2014 135.8a
Individuals using the Internet (%) 2014 12.2a
Threatened species 2015 49Forested area (% of land area) 2013 8.8a
CO2 emission estimates (000 tons/tons per capita) 2013 66 893/12.8Energy production, primary (Petajoules) 2013 3 210Energy supply per capita (Gigajoules) 2013 210.0Terrestrial and marine areas protected (% of total area) 2014 3.2Net Official Development Assistance received (% of GNI) 2014 0.1a Estimate. b 2013. c 2012.
212 World Statistics Pocketbook

Turks and Caicos IslandsRegion Caribbean Surface area (sq km) 948 a
Population (proj., 000) 35 Pop. density (per sq km) 36.7Capital city Cockburn Town Capital city pop. (000) 0.1 b
Currency US Dollar (USD)Economic indicators 2005 2010 2014GDP: Gross domestic product (million current US$) 579 687 797GDP growth rate (annual %, const. 2005 prices) 14.4 1.0 4.6GDP per capita (current US$) 21 877.0 22 159.5 23 614.7Economy: Agriculture (% of GVA) 1.2 0.6 0.6Economy: Industry (% of GVA) 19.7 12.4 11.0Economy: Services and other activity (% of GVA) 79.1 86.9 88.4Employment: Agriculture (% of employed) c 1.4 1.2de ...Employment: Industry (% of employed) c 16.8 23.1de ...Employment: Services and other (% of employed) c 70.9 74.0de ...Unemployment (% of labour force) 8.0 8.3de ...Total trade Major trading partners 2015
(million US$)f (% of exports)f (% of imports)f
Exports 11.8 United States 93.2 United States 75.4Imports 268.5 Areas nes 6.8g Bahamas 13.8Balance –256.7 Areas nes 9.1g
Social indicatorsPopulation growth rate (average annual %) 2010-2015 2.1Urban population (%) 2015 92.2Urban population growth rate (average annual %) 2010-2015 2.5Life expectancy at birth (females/males, years) 2010-2015 77.4/79.0b
International migrant stock (000/% of total pop.) mid-2015 11.7/34.0Tourist arrivals at national borders (000) 2014 357Refugees and others of concern to UNHCR mid-2015 8Environment and infrastructureThreatened species 2015 56Forested area (% of land area) 2013 36.2h
CO2 emission estimates (000 tons/tons per capita) 2013 198/6.0Energy production, primary (Petajoules) 2013 0Energy supply per capita (Gigajoules) 2013 85.0h
Terrestrial and marine areas protected (% of total area) 2014 3.6a Including low water level for all islands (area to shoreline). b 2001. c Data classified according to ISICRev. 3. d Break in the time series. e 2008. f 2012. g See technical notes. h Estimate.
World Statistics Pocketbook 213

TuvaluRegion Oceania-Polynesia Surface area (sq km) 26Population (proj., 000) 10 Pop. density (per sq km) 331.4Capital city Funafuti Capital city pop. (000) 6 a
Currency Australian Dollar (AUD) UN membership date 5 September 2000Economic indicators 2005 2010 2014GDP: Gross domestic product (million current US$) 22 32 38GDP growth rate (annual %, const. 2005 prices) –3.9 –2.7 2.2GDP per capita (current US$) 2 258.8 3 238.5 3 796.0Economy: Agriculture (% of GVA) 21.6 27.6 25.9Economy: Industry (% of GVA) 8.5 5.7 8.3Economy: Services and other activity (% of GVA) 69.9 66.7 65.8Unemployment (% of labour force) 6.5 ... ...Labour force participation (female/male pop. %) 47.9/69.6 ... ...CPI: Consumer price index (2000=100) b 117 ... ...Agricultural production index (2004-2006=100) 101 111 108c
Food production index (2004-2006=100) 101 111 108c
Balance of payments, current account (million US$) –4 –14 7c
Social indicatorsPopulation growth rate (average annual %) 2010-2015 0.2Urban population (%) 2015 59.7Urban population growth rate (average annual %) 2010-2015 1.9Fertility rate, total (live births per woman) 2010-2015 3.2d
Life expectancy at birth (females/males, years) 2010-2015 71.9/67.4e
Total dependency ratio (Pop. aged 0-14 & 65+ per 100 pop. 15-64) 2015 71cf
International migrant stock (000/% of total pop.) mid-2015 0.1/1.4g
Tourist arrivals at national borders (000) 2014 1Infant mortality rate (per 1 000 live births) 2010-2015 10e
Health: Total expenditure (% of GDP) 2014 16.5Education: Primary gross enrolment ratio (f/m per 100 pop.) 2014 102.1/100.7h
Education: Secondary gross enrolment ratio (f/m per 100 pop.) 2014 90.2/72.3h
Intentional homicide rate (per 100 000 pop.) 2014 20.3i
Seats held by women in national parliaments (%) 2016 6.7Environment and infrastructureMobile-cellular subscriptions (per 100 inhabitants) 2014 38.4h
Individuals using the Internet (%) 2014 37.0ch
Threatened species 2015 93Forested area (% of land area) 2013 33.3h
Terrestrial and marine areas protected (% of total area) 2014 <Population using improved drinking water sources (urban/rural, %) 2015 98.3/97.0Population using improved sanitation facilities (urban/rural, %) 2015 86.3/...a 2014. b Funafuti. c 2013. d 2009. e 2010. f Data calculated on ages 0-15 years and 60 years and olderas a ratio of 16-59 years old. g Refers to foreign citizens. h Estimate. i 2012.
214 World Statistics Pocketbook

UgandaRegion Eastern Africa Surface area (sq km) 241 550Population (proj., 000) 40 323 Pop. density (per sq km) 201.8Capital city Kampala Capital city pop. (000) 1 936Currency Uganda Shilling (UGX) UN membership date 25 October 1962Economic indicators 2005 2010 2014GDP: Gross domestic product (million current US$) 10 984 19 687 27 465GDP growth rate (annual %, const. 2005 prices) 10.0 7.7 4.7GDP per capita (current US$) 391.7 593.9 726.9Economy: Agriculture (% of GVA) a 29.1 26.2 27.0Economy: Industry (% of GVA) b 19.9 20.4 21.9Economy: Services and other activity (% of GVA) cd 51.0 53.5 51.1Employment: Agriculture (% of employed) 71.6efg 73.8hi 71.9j
Employment: Industry (% of employed) 4.5efg 7.1hi 4.4j
Employment: Services and other (% of employed) 23.2efg 19.1hi 20.2j
Unemployment (% of labour force) k 2.0 4.2 3.8Labour force participation (female/male pop. %) k 77.1/79.7 80.6/85.4 82.3/87.6CPI: Consumer price index (2000=100) 124 186 277Agricultural production index (2004-2006=100) 100 112 112j
Food production index (2004-2006=100) 100 112 111j
Balance of payments, current account (million US$) –13 –1 659 –2 674Total trade Major trading partners 2015
(million US$)l (% of exports)l (% of imports)l
Exports 2 262.0 Kenya 13.1 India 24.5Imports 6 073.5 South Sudan 12.4 China 12.2Balance –3 811.5 Rwanda 10.8 Kenya 9.8Social indicatorsPopulation growth rate (average annual %) 2010-2015 3.3Urban population (%) 2015 16.1Urban population growth rate (average annual %) 2010-2015 5.4Fertility rate, total (live births per woman) 2010-2015 5.9Life expectancy at birth (females/males, years) 2010-2015 58.8/55.7Total dependency ratio (Pop. aged 0-14 & 65+ per 100 pop. 15-64) 2015 102International migrant stock (000/% of total pop.) mid-2015 749.5/1.9m
Tourist arrivals at national borders (000) 2014 1 266Refugees and others of concern to UNHCR mid-2015 646 465Infant mortality rate (per 1 000 live births) 2010-2015 61Health: Total expenditure (% of GDP) 2014 7.2n
Education: Government expenditure (% of GDP) 2014 2.2j
Education: Primary gross enrolment ratio (f/m per 100 pop.) 2014 110.9/108.9j
Education: Secondary gross enrolment ratio (f/m per 100 pop.) 2014 25.7/29.5j
Education: Tertiary gross enrolment ratio (f/m per 100 pop.) 2014 3.9/5.0o
Intentional homicide rate (per 100 000 pop.) 2014 11.8Seats held by women in national parliaments (%) 2016 35.0Environment and infrastructureMobile-cellular subscriptions (per 100 inhabitants) 2014 52.4p
Individuals using the Internet (%) 2014 17.7k
Threatened species 2015 188Forested area (% of land area) 2013 11.7k
CO2 emission estimates (000 tons/tons per capita) 2013 4 895/0.2Energy production, primary (Petajoules) 2013 398Energy supply per capita (Gigajoules) 2013 12.0Terrestrial and marine areas protected (% of total area) 2014 16.0Population using improved drinking water sources (urban/rural, %) 2015 95.5/75.8Population using improved sanitation facilities (urban/rural, %) 2015 28.6/17.3Net Official Development Assistance received (% of GNI) 2014 6.3a Excludes irrigation canals and landscaping care. b Excludes publishing activities, includes irrigationcanals. c Excludes repair of personal and household goods. d Includes publishing activities and land-scaping care. e Data classified according to ISIC Rev. 3. f Break in the time series. g Persons aged 14 to64 years. h Persons aged 10 to 76 years. i 2009. j 2013. k Estimate. l 2014. m Including refugees. n Unlikeother countries, in Uganda fiscal year 2010/2011 corresponds to calendar year 2010. o 2011. p Data asat the end of December.
World Statistics Pocketbook 215
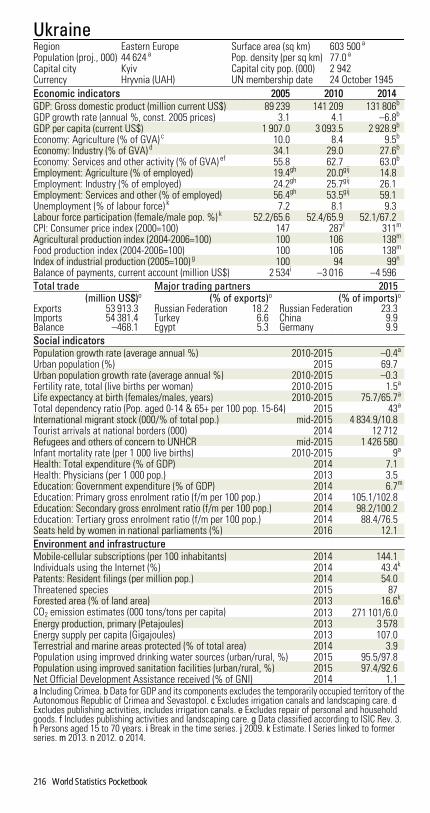
UkraineRegion Eastern Europe Surface area (sq km) 603 500 a
Population (proj., 000) 44 624 a Pop. density (per sq km) 77.0 a
Capital city Kyiv Capital city pop. (000) 2 942Currency Hryvnia (UAH) UN membership date 24 October 1945Economic indicators 2005 2010 2014GDP: Gross domestic product (million current US$) 89 239 141 209 131 806b
GDP growth rate (annual %, const. 2005 prices) 3.1 4.1 –6.8b
GDP per capita (current US$) 1 907.0 3 093.5 2 928.9b
Economy: Agriculture (% of GVA) c 10.0 8.4 9.5b
Economy: Industry (% of GVA) d 34.1 29.0 27.6b
Economy: Services and other activity (% of GVA) ef 55.8 62.7 63.0b
Employment: Agriculture (% of employed) 19.4gh 20.0gij 14.8Employment: Industry (% of employed) 24.2gh 25.7gij 26.1Employment: Services and other (% of employed) 56.4gh 53.5gij 59.1Unemployment (% of labour force) k 7.2 8.1 9.3Labour force participation (female/male pop. %) k 52.2/65.6 52.4/65.9 52.1/67.2CPI: Consumer price index (2000=100) 147 287l 311m
Agricultural production index (2004-2006=100) 100 106 138m
Food production index (2004-2006=100) 100 106 138m
Index of industrial production (2005=100) g 100 94 99n
Balance of payments, current account (million US$) 2 534i –3 016 –4 596Total trade Major trading partners 2015
(million US$)o (% of exports)o (% of imports)o
Exports 53 913.3 Russian Federation 18.2 Russian Federation 23.3Imports 54 381.4 Turkey 6.6 China 9.9Balance –468.1 Egypt 5.3 Germany 9.9Social indicatorsPopulation growth rate (average annual %) 2010-2015 –0.4a
Urban population (%) 2015 69.7Urban population growth rate (average annual %) 2010-2015 –0.3Fertility rate, total (live births per woman) 2010-2015 1.5a
Life expectancy at birth (females/males, years) 2010-2015 75.7/65.7a
Total dependency ratio (Pop. aged 0-14 & 65+ per 100 pop. 15-64) 2015 43a
International migrant stock (000/% of total pop.) mid-2015 4 834.9/10.8Tourist arrivals at national borders (000) 2014 12 712Refugees and others of concern to UNHCR mid-2015 1 426 580Infant mortality rate (per 1 000 live births) 2010-2015 9a
Health: Total expenditure (% of GDP) 2014 7.1Health: Physicians (per 1 000 pop.) 2013 3.5Education: Government expenditure (% of GDP) 2014 6.7m
Education: Primary gross enrolment ratio (f/m per 100 pop.) 2014 105.1/102.8Education: Secondary gross enrolment ratio (f/m per 100 pop.) 2014 98.2/100.2Education: Tertiary gross enrolment ratio (f/m per 100 pop.) 2014 88.4/76.5Seats held by women in national parliaments (%) 2016 12.1Environment and infrastructureMobile-cellular subscriptions (per 100 inhabitants) 2014 144.1Individuals using the Internet (%) 2014 43.4k
Patents: Resident filings (per million pop.) 2014 54.0Threatened species 2015 87Forested area (% of land area) 2013 16.6k
CO2 emission estimates (000 tons/tons per capita) 2013 271 101/6.0Energy production, primary (Petajoules) 2013 3 578Energy supply per capita (Gigajoules) 2013 107.0Terrestrial and marine areas protected (% of total area) 2014 3.9Population using improved drinking water sources (urban/rural, %) 2015 95.5/97.8Population using improved sanitation facilities (urban/rural, %) 2015 97.4/92.6Net Official Development Assistance received (% of GNI) 2014 1.1a Including Crimea. b Data for GDP and its components excludes the temporarily occupied territory of theAutonomous Republic of Crimea and Sevastopol. c Excludes irrigation canals and landscaping care. dExcludes publishing activities, includes irrigation canals. e Excludes repair of personal and householdgoods. f Includes publishing activities and landscaping care. g Data classified according to ISIC Rev. 3.h Persons aged 15 to 70 years. i Break in the time series. j 2009. k Estimate. l Series linked to formerseries. m 2013. n 2012. o 2014.
216 World Statistics Pocketbook
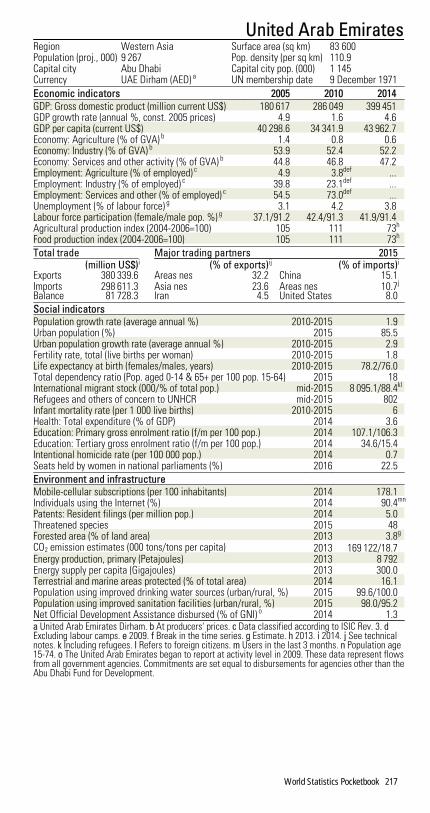
United Arab EmiratesRegion Western Asia Surface area (sq km) 83 600Population (proj., 000) 9 267 Pop. density (per sq km) 110.9Capital city Abu Dhabi Capital city pop. (000) 1 145Currency UAE Dirham (AED) a UN membership date 9 December 1971Economic indicators 2005 2010 2014GDP: Gross domestic product (million current US$) 180 617 286 049 399 451GDP growth rate (annual %, const. 2005 prices) 4.9 1.6 4.6GDP per capita (current US$) 40 298.6 34 341.9 43 962.7Economy: Agriculture (% of GVA) b 1.4 0.8 0.6Economy: Industry (% of GVA) b 53.9 52.4 52.2Economy: Services and other activity (% of GVA) b 44.8 46.8 47.2Employment: Agriculture (% of employed) c 4.9 3.8def ...Employment: Industry (% of employed) c 39.8 23.1def ...Employment: Services and other (% of employed) c 54.5 73.0def ...Unemployment (% of labour force) g 3.1 4.2 3.8Labour force participation (female/male pop. %) g 37.1/91.2 42.4/91.3 41.9/91.4Agricultural production index (2004-2006=100) 105 111 73h
Food production index (2004-2006=100) 105 111 73h
Total trade Major trading partners 2015(million US$)i (% of exports)ij (% of imports)i
Exports 380 339.6 Areas nes 32.2 China 15.1Imports 298 611.3 Asia nes 23.6 Areas nes 10.7j
Balance 81 728.3 Iran 4.5 United States 8.0Social indicatorsPopulation growth rate (average annual %) 2010-2015 1.9Urban population (%) 2015 85.5Urban population growth rate (average annual %) 2010-2015 2.9Fertility rate, total (live births per woman) 2010-2015 1.8Life expectancy at birth (females/males, years) 2010-2015 78.2/76.0Total dependency ratio (Pop. aged 0-14 & 65+ per 100 pop. 15-64) 2015 18International migrant stock (000/% of total pop.) mid-2015 8 095.1/88.4kl
Refugees and others of concern to UNHCR mid-2015 802Infant mortality rate (per 1 000 live births) 2010-2015 6Health: Total expenditure (% of GDP) 2014 3.6Education: Primary gross enrolment ratio (f/m per 100 pop.) 2014 107.1/106.3Education: Tertiary gross enrolment ratio (f/m per 100 pop.) 2014 34.6/15.4Intentional homicide rate (per 100 000 pop.) 2014 0.7Seats held by women in national parliaments (%) 2016 22.5Environment and infrastructureMobile-cellular subscriptions (per 100 inhabitants) 2014 178.1Individuals using the Internet (%) 2014 90.4mn
Patents: Resident filings (per million pop.) 2014 5.0Threatened species 2015 48Forested area (% of land area) 2013 3.8g
CO2 emission estimates (000 tons/tons per capita) 2013 169 122/18.7Energy production, primary (Petajoules) 2013 8 792Energy supply per capita (Gigajoules) 2013 300.0Terrestrial and marine areas protected (% of total area) 2014 16.1Population using improved drinking water sources (urban/rural, %) 2015 99.6/100.0Population using improved sanitation facilities (urban/rural, %) 2015 98.0/95.2Net Official Development Assistance disbursed (% of GNI) o 2014 1.3a United Arab Emirates Dirham. b At producers' prices. c Data classified according to ISIC Rev. 3. dExcluding labour camps. e 2009. f Break in the time series. g Estimate. h 2013. i 2014. j See technicalnotes. k Including refugees. l Refers to foreign citizens. m Users in the last 3 months. n Population age15-74. o The United Arab Emirates began to report at activity level in 2009. These data represent flowsfrom all government agencies. Commitments are set equal to disbursements for agencies other than theAbu Dhabi Fund for Development.
World Statistics Pocketbook 217

United KingdomRegion Northern Europe Surface area (sq km) 242 495Population (proj., 000) 65 111 Pop. density (per sq km) 269.1Capital city London Capital city pop. (000) 10 313Currency Pound Sterling (GBP) UN membership date 24 October 1945Economic indicators 2005 2010 2014GDP: Gross domestic product (million current US$) 2 418 949 2 403 581 2 988 893GDP growth rate (annual %, const. 2005 prices) 3.0 1.5 2.9GDP per capita (current US$) 40 175.2 38 324.4 46 460.9Economy: Agriculture (% of GVA) a 0.7 0.7 0.7Economy: Industry (% of GVA) b 23.3 20.8 21.0Economy: Services and other activity (% of GVA) cd 76.1 78.5 78.4Employment: Agriculture (% of employed) 1.3ef 1.1 1.1Employment: Industry (% of employed) 22.2ef 19.2 18.9Employment: Services and other (% of employed) 76.2ef 79.0 79.1Unemployment (% of labour force) g 4.8 7.8 6.1Labour force participation (female/male pop. %) g 54.9/69.3 55.8/68.7 56.9/68.8CPI: Consumer price index (2000=100) 113 131 150Agricultural production index (2004-2006=100) 100 102 100h
Food production index (2004-2006=100) 100 102 99h
Index of industrial production (2005=100) 100 92 90Balance of payments, current account (million US$) –30 054 –67 601 –151 882Total trade Major trading partners 2015
(million US$) (% of exports) (% of imports)Exports 465 921.6 United States 14.9 Germany 15.0Imports 629 228.9 Germany 10.0 China 10.0Balance –163 307.3 Switzerland 7.3 United States 9.2Social indicatorsPopulation growth rate (average annual %) 2010-2015 0.6Urban population (%) 2015 82.6Urban population growth rate (average annual %) 2010-2015 0.9Fertility rate, total (live births per woman) 2010-2015 1.9Life expectancy at birth (females/males, years) 2010-2015 82.4/78.5Total dependency ratio (Pop. aged 0-14 & 65+ per 100 pop. 15-64) 2015 55International migrant stock (000/% of total pop.) mid-2015 8 543.1/13.2Tourist arrivals at national borders (000) 2014 32 613Refugees and others of concern to UNHCR mid-2015 155 079i
Infant mortality rate (per 1 000 live births) 2010-2015 4Health: Total expenditure (% of GDP) 2014 9.1Health: Physicians (per 1 000 pop.) 2013 2.8Education: Government expenditure (% of GDP) 2014 5.7h
Education: Primary gross enrolment ratio (f/m per 100 pop.) 2014 108.1/108.4Education: Secondary gross enrolment ratio (f/m per 100 pop.) 2014 130.4/125.3Education: Tertiary gross enrolment ratio (f/m per 100 pop.) 2014 64.1/49.0Intentional homicide rate (per 100 000 pop.) 2014 0.9h
Seats held by women in national parliaments (%) 2016 29.4Environment and infrastructureMobile-cellular subscriptions (per 100 inhabitants) 2014 123.6Individuals using the Internet (%) 2014 91.6j
Patents: Resident filings (per million pop.) 2014 309.0Threatened species 2015 87Forested area (% of land area) 2013 12.9g
CO2 emission estimates (000 tons/tons per capita) 2013 457 473/7.2Energy production, primary (Petajoules) 2013 4 557k
Energy supply per capita (Gigajoules) 2013 124.0k
Terrestrial and marine areas protected (% of total area) 2014 13.8Population using improved drinking water sources (urban/rural, %) 2015 100.0/100.0Population using improved sanitation facilities (urban/rural, %) 2015 99.1/99.6Net Official Development Assistance disbursed (% of GNI) l 2014 0.7a Excludes irrigation canals and landscaping care. b Excludes publishing activities, includes irrigationcanals. c Excludes repair of personal and household goods. d Includes publishing activities and land-scaping care. e Data classified according to ISIC Rev. 3. f Break in the time series. g Estimate. h 2013. iRefugee population relates to the end of 2014. j Population age 16-74. k Shipments of coal and oil toJersey, Guernsey and the isle of Man from the United Kingdom are not classed as exports. Supplies ofcoal and oil to these islands are, therefore, included as part of UK supply. Exports of natural gas to theIsle of Man included with the exports to Ireland. l Development Assistance Committee member (OECD).
218 World Statistics Pocketbook

United Republic of TanzaniaRegion Eastern Africa Surface area (sq km) 947 303 a
Population (proj., 000) 55 156 a Pop. density (per sq km) 62.3 a
Capital city Dodoma Capital city pop. (000) 228 b
Currency Tanzanian Shilling (TZS) UN membership date 14 December 1961Economic indicators 2005 2010 2014GDP: Gross domestic product (million current US$) c 18 072 31 105 48 030GDP growth rate (annual %, const. 2005 prices) c 7.4 6.4 7.0GDP per capita (current US$) c 475.7 700.9 952.2Economy: Agriculture (% of GVA) cd 30.1 31.7 31.1Economy: Industry (% of GVA) ce 20.8 21.5 24.7Economy: Services and other activity (% of GVA) cfg 49.1 46.8 44.2Employment: Agriculture (% of employed) 81.0hijk 69.0chlm 66.9Employment: Industry (% of employed) 3.8hijk 4.2chlm 6.4Employment: Services and other (% of employed) 15.1hijk 26.5chlm 26.6Unemployment (% of labour force) n 3.2 2.9 3.1Labour force participation (female/male pop. %) n 88.7/90.6 83.6/86.0 74.0/83.4CPI: Consumer price index (2000=100) c 128 192o 287Agricultural production index (2004-2006=100) 98 129 154p
Food production index (2004-2006=100) 96 131 155p
Balance of payments, current account (million US$) –1 570 –2 211h –5 021Total trade Major trading partners 2015
(million US$) (% of exports) (% of imports)Exports 5 854.2 India 19.6 Saudi Arabia 40.6Imports 14 706.0 Kenya 13.6 China 12.6Balance –8 851.8 South Africa 11.5 India 8.6Social indicatorsPopulation growth rate (average annual %) 2010-2015 3.2Urban population (%) 2015 31.6a
Urban population growth rate (average annual %) 2010-2015 5.4a
Fertility rate, total (live births per woman) 2010-2015 5.2Life expectancy at birth (females/males, years) 2010-2015 65.6/62.6Total dependency ratio (Pop. aged 0-14 & 65+ per 100 pop. 15-64) 2015 94International migrant stock (000/% of total pop.) mid-2015 261.2/0.5q
Tourist arrivals at national borders (000) 2014 1 113Refugees and others of concern to UNHCR mid-2015 328 183Infant mortality rate (per 1 000 live births) 2010-2015 37Health: Total expenditure (% of GDP) 2014 5.6Health: Physicians (per 1 000 pop.) 2013 <r
Education: Government expenditure (% of GDP) 2014 3.5Education: Primary gross enrolment ratio (f/m per 100 pop.) 2014 87.4/86.2p
Education: Secondary gross enrolment ratio (f/m per 100 pop.) 2014 30.8/33.7p
Education: Tertiary gross enrolment ratio (f/m per 100 pop.) 2014 2.5/4.9p
Intentional homicide rate (per 100 000 pop.) 2014 7.9r
Seats held by women in national parliaments (%) 2016 36.6Environment and infrastructureMobile-cellular subscriptions (per 100 inhabitants) 2014 62.8Individuals using the Internet (%) 2014 4.9n
Threatened species 2015 1 077Forested area (% of land area) 2013 52.8n
CO2 emission estimates (000 tons/tons per capita) 2013 10 752/0.2Energy production, primary (Petajoules) 2013 889Energy supply per capita (Gigajoules) 2013 20.0Terrestrial and marine areas protected (% of total area) 2014 26.1Population using improved drinking water sources (urban/rural, %) 2015 77.2/45.6Population using improved sanitation facilities (urban/rural, %) 2015 31.3/8.3Net Official Development Assistance received (% of GNI) 2014 5.5a Including Zanzibar. b 2014. c Excluding Zanzibar. d Excludes irrigation canals and landscaping care. eExcludes publishing activities, includes irrigation canals. f Includes publishing activities and landscapingcare. g Excludes repair of personal and household goods. h Break in the time series. i Persons aged 10years and over. j Data classified according to ISIC Rev. 2. k 2002. l Data classified according to ISIC Rev.3. m 2007. n Estimate. o Series linked to former series. p 2013. q Including refugees. r 2012.
World Statistics Pocketbook 219

United States of AmericaRegion Northern America Surface area (sq km) 9 833 517Population (proj., 000) 324 119 Pop. density (per sq km) 35.4Capital city Washington, D.C. Capital city pop. (000) 4 955Currency US Dollar (USD) UN membership date 24 October 1945Economic indicators 2005 2010 2014GDP: Gross domestic product (million current US$) 13 093 720 14 964 380 17 348 072GDP growth rate (annual %, const. 2005 prices) 3.4 2.5 2.4GDP per capita (current US$) 44 214.7 48 291.5 54 306.3Economy: Agriculture (% of GVA) a 1.0 1.1 1.2Economy: Industry (% of GVA) b 21.5 20.2 20.4Economy: Services and other activity (% of GVA) cd 77.5 78.8 78.4Employment: Agriculture (% of employed) e 1.6fg 1.6h ...Employment: Industry (% of employed) e 20.6fg 17.2h ...Employment: Services and other (% of employed) e 77.8fg 81.2h ...Unemployment (% of labour force) i 5.2 9.7 6.3Labour force participation (female/male pop. %) i 58.3/72.2 57.6/70.0 56.1/68.5CPI: Consumer price index (2000=100) j 113 127 137Agricultural production index (2004-2006=100) 100 106 108k
Food production index (2004-2006=100) 100 107 110k
Index of industrial production (2005=100) l 100 96 108Balance of payments, current account (million US$) –745 445 –441 963 –389 525Total trade Major trading partners 2015
(million US$)m (% of exports)m (% of imports)m
Exports 1 503 870.4 Canada 18.6 China 21.8Imports 2 306 822.3 Mexico 15.7 Canada 13.1Balance –802 951.9 China 7.7 Mexico 12.9Social indicatorsPopulation growth rate (average annual %) 2010-2015 0.8Urban population (%) 2015 81.6Urban population growth rate (average annual %) 2010-2015 1.0Fertility rate, total (live births per woman) 2010-2015 1.9Life expectancy at birth (females/males, years) 2010-2015 81.3/76.5Total dependency ratio (Pop. aged 0-14 & 65+ per 100 pop. 15-64) 2015 51International migrant stock (000/% of total pop.) mid-2015 46 627.1/14.5Tourist arrivals at national borders (000) 2014 75 011h
Refugees and others of concern to UNHCR mid-2015 491 730n
Infant mortality rate (per 1 000 live births) 2010-2015 6Health: Total expenditure (% of GDP) 2014 17.1Health: Physicians (per 1 000 pop.) 2013 2.5o
Education: Government expenditure (% of GDP) 2014 5.2o
Education: Primary gross enrolment ratio (f/m per 100 pop.) 2014 99.2/99.8Education: Secondary gross enrolment ratio (f/m per 100 pop.) 2014 98.5/96.7Education: Tertiary gross enrolment ratio (f/m per 100 pop.) 2014 100.7/73.5Intentional homicide rate (per 100 000 pop.) 2014 3.9k
Seats held by women in national parliaments (%) 2016 19.4Environment and infrastructureMobile-cellular subscriptions (per 100 inhabitants) 2014 98.4i
Individuals using the Internet (%) 2014 87.4i
Patents: Resident filings (per million pop.) 2014 894.0Threatened species 2015 1 299p
Forested area (% of land area) 2013 33.8i
CO2 emission estimates (000 tons/tons per capita) 2013 5 186 168/16.1q
Energy production, primary (Petajoules) 2013 78 449r
Energy supply per capita (Gigajoules) 2013 286.0r
Terrestrial and marine areas protected (% of total area) 2014 14.8Population using improved drinking water sources (urban/rural, %) 2015 99.4/98.2Population using improved sanitation facilities (urban/rural, %) 2015 100.0/100.0Net Official Development Assistance disbursed (% of GNI) s 2014 0.2a Excludes irrigation canals and landscaping care. b Excludes publishing activities, includes irrigationcanals. c Excludes repair of personal and household goods. d Includes publishing activities and land-scaping care. e Persons aged 16 years and over. f Data classified according to ISIC Rev. 3. g Servicesinclude activities not adequately defined. h Break in the time series. i Estimate. j All urban consumers.k 2013. l Excluding water and waste management. m Including Puerto Rico and the U.S. Virgin Islands.n The refugee figure is under review. Refugee figure relates to the end of 2014. o 2011. p Excludingoverseas territories. q Including overseas territories. r Oil statistics as well as coal trade statistics alsoinclude overseas territories. s Development Assistance Committee member (OECD).220 World Statistics Pocketbook

United States Virgin IslandsRegion Caribbean Surface area (sq km) 347Population (proj., 000) 106 Pop. density (per sq km) 304.0Capital city Charlotte Amalie Capital city pop. (000) 52 a
Currency US Dollar (USD)Economic indicators 2005 2010 2014Unemployment (% of labour force) b 9.0 8.9 9.1Labour force participation (female/male pop. %) b 54.9/76.1 55.2/73.9 53.6/71.8Agricultural production index (2004-2006=100) 98 118 123c
Food production index (2004-2006=100) 98 118 123c
Social indicatorsPopulation growth rate (average annual %) 2010-2015 –<Urban population (%) 2015 95.3Urban population growth rate (average annual %) 2010-2015 0.3Fertility rate, total (live births per woman) 2010-2015 2.3Life expectancy at birth (females/males, years) 2010-2015 82.9/77.2Total dependency ratio (Pop. aged 0-14 & 65+ per 100 pop. 15-64) 2015 61International migrant stock (000/% of total pop.) mid-2015 56.7/53.4Tourist arrivals at national borders (000) 2014 602Infant mortality rate (per 1 000 live births) 2010-2015 9Environment and infrastructureIndividuals using the Internet (%) 2014 50.1b
Threatened species 2015 53Forested area (% of land area) 2013 50.9b
Terrestrial and marine areas protected (% of total area) 2014 2.8Population using improved drinking water sources (urban/rural, %) 2015 100.0/100.0Population using improved sanitation facilities (urban/rural, %) 2015 96.4/96.4a 2014. b Estimate. c 2013.
World Statistics Pocketbook 221

UruguayRegion South America Surface area (sq km) 173 626Population (proj., 000) 3 444 Pop. density (per sq km) 19.7Capital city Montevideo Capital city pop. (000) 1 707Currency Peso Uruguayo (UYU) UN membership date 18 December 1945Economic indicators 2005 2010 2014GDP: Gross domestic product (million current US$) 17 363 40 285 57 471GDP growth rate (annual %, const. 2005 prices) 7.5 7.8 3.5GDP per capita (current US$) 5 221.0 11 938.2 16 806.8Economy: Agriculture (% of GVA) 9.8 8.0 7.9Economy: Industry (% of GVA) 26.6 27.3 27.1Economy: Services and other activity (% of GVA) 63.6 64.7 65.0Employment: Agriculture (% of employed) 4.6abcde 11.6af 9.3g
Employment: Industry (% of employed) 21.9abcd 21.4af 21.6g
Employment: Services and other (% of employed) 73.5abcd 67.0af 69.1g
Unemployment (% of labour force) h 12.2 7.2 6.6Labour force participation (female/male pop. %) h 52.7/74.1 55.1/76.7 55.4/76.3CPI: Consumer price index (2000=100) i 162 230 320Agricultural production index (2004-2006=100) 101 120 131g
Food production index (2004-2006=100) 101 122 133g
Balance of payments, current account (million US$) 24 –756 –2 516Total trade Major trading partners 2015
(million US$)j (% of exports)j (% of imports)j
Exports 9 165.7 Free zones 17.8k China 18.5Imports 10 762.3 Brazil 17.6 Brazil 17.0Balance –1 596.6 China 13.3 Argentina 12.9Social indicatorsPopulation growth rate (average annual %) 2010-2015 0.3Urban population (%) 2015 95.3Urban population growth rate (average annual %) 2010-2015 0.5Fertility rate, total (live births per woman) 2010-2015 2.0Life expectancy at birth (females/males, years) 2010-2015 80.4/73.3Total dependency ratio (Pop. aged 0-14 & 65+ per 100 pop. 15-64) 2015 56International migrant stock (000/% of total pop.) mid-2015 71.8/2.1Tourist arrivals at national borders (000) 2014 2 682Refugees and others of concern to UNHCR mid-2015 357Infant mortality rate (per 1 000 live births) 2010-2015 13Health: Total expenditure (% of GDP) 2014 8.6l
Education: Government expenditure (% of GDP) 2014 4.4m
Education: Primary gross enrolment ratio (f/m per 100 pop.) 2014 108.3/111.1g
Education: Secondary gross enrolment ratio (f/m per 100 pop.) 2014 99.8/88.5g
Intentional homicide rate (per 100 000 pop.) 2014 7.8Seats held by women in national parliaments (%) 2016 16.2Environment and infrastructureMobile-cellular subscriptions (per 100 inhabitants) 2014 160.8n
Individuals using the Internet (%) 2014 61.5o
Patents: Resident filings (per million pop.) 2014 11.0Threatened species 2015 103Forested area (% of land area) 2013 10.3h
CO2 emission estimates (000 tons/tons per capita) 2013 7 605/2.2Energy production, primary (Petajoules) 2013 94Energy supply per capita (Gigajoules) 2013 58.0Terrestrial and marine areas protected (% of total area) 2014 1.7Population using improved drinking water sources (urban/rural, %) 2015 100.0/93.9Population using improved sanitation facilities (urban/rural, %) 2015 96.6/92.6Net Official Development Assistance received (% of GNI) 2014 0.2a Data classified according to ISIC Rev. 3. b Urban areas. c Persons aged 14 years and over. d Excludingconscripts. e Agriculture includes mining and quarrying. f Break in the time series. g 2013. h Estimate. iMontevideo. j 2014. k See technical notes. l Data revision. m 2011. n Includes data-only subscriptions.o Population age 6+.
222 World Statistics Pocketbook

UzbekistanRegion Central Asia Surface area (sq km) 447 400Population (proj., 000) 30 300 Pop. density (per sq km) 71.2Capital city Tashkent Capital city pop. (000) 2 251Currency Uzbekistan Sum (UZS) UN membership date 2 March 1992Economic indicators 2005 2010 2014GDP: Gross domestic product (million current US$) 14 396 39 526 63 030GDP growth rate (annual %, const. 2005 prices) 7.0 8.5 8.1GDP per capita (current US$) 555.4 1 424.9 2 138.8Economy: Agriculture (% of GVA) 29.5 19.8 19.3Economy: Industry (% of GVA) 29.1 33.4 32.9Economy: Services and other activity (% of GVA) 41.4 46.8 47.8Unemployment (% of labour force) a 10.6 10.5 10.2Labour force participation (female/male pop. %) a 47.2/72.1 47.6/74.4 48.2/75.9Agricultural production index (2004-2006=100) 100 127 152b
Food production index (2004-2006=100) 99 135 166b
Index of industrial production (2005=100) c 100 165 ...Social indicatorsPopulation growth rate (average annual %) 2010-2015 1.5Urban population (%) 2015 36.4Urban population growth rate (average annual %) 2010-2015 1.5Fertility rate, total (live births per woman) 2010-2015 2.5Life expectancy at birth (females/males, years) 2010-2015 71.6/64.9Total dependency ratio (Pop. aged 0-14 & 65+ per 100 pop. 15-64) 2015 50International migrant stock (000/% of total pop.) mid-2015 1 170.9/3.9Tourist arrivals at national borders (000) 2014 1 969b
Refugees and others of concern to UNHCR mid-2015 86 821d
Infant mortality rate (per 1 000 live births) 2010-2015 44Health: Total expenditure (% of GDP) 2014 5.8Health: Physicians (per 1 000 pop.) 2013 2.5Education: Primary gross enrolment ratio (f/m per 100 pop.) 2014 95.7/98.0e
Education: Secondary gross enrolment ratio (f/m per 100 pop.) 2014 94.9/95.9e
Education: Tertiary gross enrolment ratio (f/m per 100 pop.) 2014 6.9/10.9e
Intentional homicide rate (per 100 000 pop.) 2014 3.2f
Seats held by women in national parliaments (%) 2016 16.0Environment and infrastructureMobile-cellular subscriptions (per 100 inhabitants) 2014 73.8a
Individuals using the Internet (%) 2014 43.6a
Patents: Resident filings (per million pop.) 2014 11.0Threatened species 2015 54Forested area (% of land area) 2013 7.6a
CO2 emission estimates (000 tons/tons per capita) 2013 103 226/3.6Energy production, primary (Petajoules) 2013 2 267Energy supply per capita (Gigajoules) 2013 62.0Terrestrial and marine areas protected (% of total area) 2014 3.4Population using improved drinking water sources (urban/rural, %) 2015 98.5/...Population using improved sanitation facilities (urban/rural, %) 2015 100.0/100.0Net Official Development Assistance received (% of GNI) 2014 0.5a Estimate. b 2013. c Data classified according to ISIC Rev. 3. d Figure of stateless persons refers to thosewith permanent residence reported in 2010 by the Government. Information on other categories of state-less persons is not available. e 2011. f 2012.
World Statistics Pocketbook 223

VanuatuRegion Oceania-Melanesia Surface area (sq km) 12 189Population (proj., 000) 271 Pop. density (per sq km) 22.2Capital city Port Vila Capital city pop. (000) 53 a
Currency Vatu (VUV) UN membership date 15 September 1981Economic indicators 2005 2010 2014GDP: Gross domestic product (million current US$) 395 701 812GDP growth rate (annual %, const. 2005 prices) 5.3 1.6 3.6GDP per capita (current US$) 1 886.4 2 965.8 3 137.5Economy: Agriculture (% of GVA) b 24.1 22.0 25.9Economy: Industry (% of GVA) c 8.5 13.0 8.9Economy: Services and other activity (% of GVA) de 67.4 65.0 65.2Employment: Agriculture (% of employed) ... 60.5f ...Employment: Industry (% of employed) ... 7.0f ...Employment: Services and other (% of employed) ... 31.1f ...Unemployment (% of labour force) g 5.1 4.3 4.5Labour force participation (female/male pop. %) g 65.3/81.7 61.5/80.7 61.6/80.6CPI: Consumer price index (2000=100) 112 133 139Agricultural production index (2004-2006=100) 100 132 138h
Food production index (2004-2006=100) 100 132 138h
Balance of payments, current account (million US$) –53 –64i 19Total trade Major trading partners 2015
(million US$)j (% of exports)j (% of imports)j
Exports 63.5 Malaysia 20.5 Australia 29.7Imports 280.6 Philippines 18.1 Singapore 18.2Balance –217.1 Australia 11.3 New Zealand 12.7Social indicatorsPopulation growth rate (average annual %) 2010-2015 2.3Urban population (%) 2015 26.1Urban population growth rate (average annual %) 2010-2015 3.4Fertility rate, total (live births per woman) 2010-2015 3.4Life expectancy at birth (females/males, years) 2010-2015 73.6/69.6Total dependency ratio (Pop. aged 0-14 & 65+ per 100 pop. 15-64) 2015 69International migrant stock (000/% of total pop.) mid-2015 3.2/1.2Tourist arrivals at national borders (000) 2014 109Refugees and others of concern to UNHCR mid-2015 1Infant mortality rate (per 1 000 live births) 2010-2015 24Health: Total expenditure (% of GDP) 2014 5.0Education: Government expenditure (% of GDP) 2014 4.9Education: Primary gross enrolment ratio (f/m per 100 pop.) 2014 122.2/125.2h
Intentional homicide rate (per 100 000 pop.) 2014 2.9k
Seats held by women in national parliaments (%) 2016 0.0Environment and infrastructureMobile-cellular subscriptions (per 100 inhabitants) 2014 60.4Individuals using the Internet (%) 2014 18.8g
Threatened species 2015 137Forested area (% of land area) 2013 36.1g
CO2 emission estimates (000 tons/tons per capita) 2013 106/0.4Energy production, primary (Petajoules) 2013 1Energy supply per capita (Gigajoules) 2013 10.0Terrestrial and marine areas protected (% of total area) 2014 2.3Population using improved drinking water sources (urban/rural, %) 2015 98.9/92.9Population using improved sanitation facilities (urban/rural, %) 2015 65.1/55.4a 2014. b Excludes irrigation canals and landscaping care. c Excludes publishing activities, includesirrigation canals. d Excludes repair of personal and household goods. e Includes publishing activities andlandscaping care. f 2009. g Estimate. h 2013. i Break in the time series. j 2011. k 2012.
224 World Statistics Pocketbook

Venezuela (Bolivarian Republic of)Region South America Surface area (sq km) 912 050Population (proj., 000) 31 519 Pop. density (per sq km) 35.7Capital city Caracas Capital city pop. (000) 2 916 a
Currency Bolívar (VEF) UN membership date 15 November 1945Economic indicators 2005 2010 2014GDP: Gross domestic product (million current US$) 145 513 393 808 509 968GDP growth rate (annual %, const. 2005 prices) 10.3 –1.5 –4.0GDP per capita (current US$) 5 435.9 13 581.6 16 614.7Economy: Agriculture (% of GVA) 4.0 5.7 5.2Economy: Industry (% of GVA) 56.9 51.0 48.6Economy: Services and other activity (% of GVA) 39.2 43.4 46.2Employment: Agriculture (% of employed) b 9.7 8.7c 7.4cde
Employment: Industry (% of employed) b 20.8 22.1c 21.3cde
Employment: Services and other (% of employed) b 68.7 68.9c 71.1cde
Unemployment (% of labour force) f 11.4 8.6 7.0Labour force participation (female/male pop. %) f 51.7/81.5 50.6/79.3 51.4/78.4CPI: Consumer price index (2000=100) 255gh 156ci 544i
Agricultural production index (2004-2006=100) 101 109 134e
Food production index (2004-2006=100) 101 109 135e
Balance of payments, current account (million US$) 25 447c 5 585 3 598Total trade Major trading partners 2015
(million US$)e (% of exports)ej (% of imports)e
Exports 87 961.2 N & C Ame nes 34.0 United States 23.3Imports 44 951.8 Asia nes 31.9 China 17.0Balance 43 009.4 S. America nes 15.4 Brazil 10.0Social indicatorsPopulation growth rate (average annual %) 2010-2015 1.4Urban population (%) 2015 89.0Urban population growth rate (average annual %) 2010-2015 1.5Fertility rate, total (live births per woman) 2010-2015 2.4Life expectancy at birth (females/males, years) 2010-2015 78.2/69.9Total dependency ratio (Pop. aged 0-14 & 65+ per 100 pop. 15-64) 2015 52International migrant stock (000/% of total pop.) mid-2015 1 404.5/4.5Tourist arrivals at national borders (000) 2014 857Refugees and others of concern to UNHCR mid-2015 174 895Infant mortality rate (per 1 000 live births) 2010-2015 14Health: Total expenditure (% of GDP) 2014 5.3Education: Primary gross enrolment ratio (f/m per 100 pop.) 2014 99.7/101.9Education: Secondary gross enrolment ratio (f/m per 100 pop.) 2014 95.0/88.3Intentional homicide rate (per 100 000 pop.) 2014 62.0Seats held by women in national parliaments (%) 2016 14.4Environment and infrastructureMobile-cellular subscriptions (per 100 inhabitants) 2014 99.0f
Individuals using the Internet (%) 2014 57.0f
Threatened species 2015 312Forested area (% of land area) 2013 53.3f
CO2 emission estimates (000 tons/tons per capita) 2013 185 532/6.1Energy production, primary (Petajoules) 2013 7 716Energy supply per capita (Gigajoules) 2013 95.0Terrestrial and marine areas protected (% of total area) 2014 36.7Population using improved drinking water sources (urban/rural, %) 2015 95.0/77.9Population using improved sanitation facilities (urban/rural, %) 2015 97.5/69.9Net Official Development Assistance received (% of GNI) 2014 <a Refers to multiple municipalities and parishes (see source). b Data classified according to ISIC Rev. 2.c Break in the time series. d Excluding armed forces. e 2013. f Estimate. g Metropolitan areas. h Caracas.i Index base: 2008=100. j See technical notes.
World Statistics Pocketbook 225

Viet NamRegion South-Eastern Asia Surface area (sq km) 330 967Population (proj., 000) 94 444 Pop. density (per sq km) 304.6Capital city Hanoi Capital city pop. (000) 3 629 a
Currency Dong (VND) UN membership date 20 September 1977Economic indicators 2005 2010 2014GDP: Gross domestic product (million current US$) 57 633 115 932 186 205GDP growth rate (annual %, const. 2005 prices) 7.6 6.4 6.0GDP per capita (current US$) 684.5 1 312.1 2 014.7Economy: Agriculture (% of GVA) bc 21.0 18.9 18.1Economy: Industry (% of GVA) bd 41.5 38.2 38.5Economy: Services and other activity (% of GVA) bef 37.5 42.9 43.4Employment: Agriculture (% of employed) 57.9gh 51.7ijk 46.8ilm
Employment: Industry (% of employed) 17.4gh 20.2ijk 21.2ilm
Employment: Services and other (% of employed) 24.8gh 28.2ijk 32.0ilm
Unemployment (% of labour force) n 2.1 2.6 1.9Labour force participation (female/male pop. %) n 72.5/81.8 72.5/81.6 73.6/83.0CPI: Consumer price index (2000=100) 126o 208o 299Agricultural production index (2004-2006=100) 100 120 136m
Food production index (2004-2006=100) 100 119 133m
Index of industrial production (2005=100) 100 156 199Balance of payments, current account (million US$) –560 –4 276 9 359Total trade Major trading partners 2015
(million US$)p (% of exports)p (% of imports)p
Exports 150 217.1 United States 19.1 China 29.5Imports 147 839.0 China 9.9 Republic of Korea 14.7Balance 2 378.1 Japan 9.8 Japan 8.7Social indicatorsPopulation growth rate (average annual %) 2010-2015 1.1Urban population (%) 2015 33.6Urban population growth rate (average annual %) 2010-2015 3.0Fertility rate, total (live births per woman) 2010-2015 2.0Life expectancy at birth (females/males, years) 2010-2015 80.3/70.7Total dependency ratio (Pop. aged 0-14 & 65+ per 100 pop. 15-64) 2015 43International migrant stock (000/% of total pop.) mid-2015 72.8/0.1qr
Tourist arrivals at national borders (000) s 2014 7 874Refugees and others of concern to UNHCR mid-2015 11 000Infant mortality rate (per 1 000 live births) 2010-2015 19Health: Total expenditure (% of GDP) 2014 7.1Health: Physicians (per 1 000 pop.) 2013 1.2Education: Government expenditure (% of GDP) 2014 6.3t
Education: Primary gross enrolment ratio (f/m per 100 pop.) 2014 108.6/110.0Education: Tertiary gross enrolment ratio (f/m per 100 pop.) 2014 31.2/29.8Intentional homicide rate (per 100 000 pop.) 2014 1.5u
Seats held by women in national parliaments (%) 2016 24.3Environment and infrastructureMobile-cellular subscriptions (per 100 inhabitants) 2014 147.1Individuals using the Internet (%) 2014 48.3n
Patents: Resident filings (per million pop.) 2014 5.0Threatened species 2015 565Forested area (% of land area) 2013 46.8n
CO2 emission estimates (000 tons/tons per capita) 2013 152 624/1.7Energy production, primary (Petajoules) 2013 2 887Energy supply per capita (Gigajoules) 2013 28.0Terrestrial and marine areas protected (% of total area) 2014 2.5Population using improved drinking water sources (urban/rural, %) 2015 99.1/96.9Population using improved sanitation facilities (urban/rural, %) 2015 94.4/69.7Net Official Development Assistance received (% of GNI) 2014 2.4a Refers to urban population in the city districts. b At producers' prices. c Excludes irrigation canals andlandscaping care. d Excludes publishing activities, includes irrigation canals. e Includes publishing ac-tivities and landscaping care. f Excludes repair of personal and household goods. g Data classifiedaccording to ISIC Rev. 3. h 2004. i Break in the time series. j Data classified according to ISIC Rev. 2. k2006. l Excluding overseas territories. m 2013. n Estimate. o Series linked to former series. p 2014. qIncluding refugees. r Refers to foreign citizens. s Arrivals of non-resident visitors at national borders. t2012. u 2011.
226 World Statistics Pocketbook

Wallis and Futuna IslandsRegion Oceania-Polynesia Surface area (sq km) 142Population (proj., 000) 13 Pop. density (per sq km) 93.7Capital city Matu-Utu Capital city pop. (000) 1 a
Currency CFP Franc (XPF)Economic indicators 2005 2010 2014Agricultural production index (2004-2006=100) 104 101 103b
Food production index (2004-2006=100) 104 101 103b
Social indicatorsPopulation growth rate (average annual %) 2010-2015 –0.6Urban population (%) 2015 0.0Urban population growth rate (average annual %) 2010-2015 0.0Fertility rate, total (live births per woman) 2010-2015 2.2c
Life expectancy at birth (females/males, years) 2010-2015 78.7/72.8c
Total dependency ratio (Pop. aged 0-14 & 65+ per 100 pop. 15-64) 2015 73bd
International migrant stock (000/% of total pop.) mid-2015 2.9/21.7Infant mortality rate (per 1 000 live births) 2010-2015 12e
Environment and infrastructureIndividuals using the Internet (%) 2014 9.0fg
Threatened species 2015 88Forested area (% of land area) 2013 41.6g
CO2 emission estimates (000 tons/tons per capita) 2013 22/1.6Energy supply per capita (Gigajoules) 2013 26.0a 2014. b 2013. c 2008 - 2012. d Data calculated on ages 0-15 years and 60 years and older as a ratio of16-59 years old. e 2004 - 2012. f 2012. g Estimate.
World Statistics Pocketbook 227

Western SaharaRegion Northern Africa Surface area (sq km) 266 000 a
Population (proj., 000) 584 Pop. density (per sq km) 2.2Capital city El Aaiún Capital city pop. (000) 262 b
Currency Moroccan Dirham (MAD)Economic indicators 2005 2010 2014Unemployment (% of labour force) c 6.9 6.8 6.7Labour force participation (female/male pop. %) c 24.1/83.1 27.7/83.5 28.2/83.7Agricultural production index (2004-2006=100) 100 102 106d
Food production index (2004-2006=100) 100 102 106d
Social indicatorsPopulation growth rate (average annual %) 2010-2015 2.2Urban population (%) 2015 80.9Urban population growth rate (average annual %) 2010-2015 3.3Fertility rate, total (live births per woman) 2010-2015 2.2Life expectancy at birth (females/males, years) 2010-2015 69.8/65.9Total dependency ratio (Pop. aged 0-14 & 65+ per 100 pop. 15-64) 2015 40International migrant stock (000/% of total pop.) mid-2015 5.2/0.9c
Infant mortality rate (per 1 000 live births) 2010-2015 37Environment and infrastructureThreatened species 2015 39Forested area (% of land area) 2013 2.7c
a Comprising the Northern Region (former Saguia el Hamra) and Southern Region (former Rio de Oro).b 2014. c Estimate. d 2013.
228 World Statistics Pocketbook

YemenRegion Western Asia Surface area (sq km) 527 968Population (proj., 000) 27 478 Pop. density (per sq km) 52.0Capital city Sana'a Capital city pop. (000) 2 962Currency Yemeni Rial (YER) UN membership date 30 September 1947Economic indicators 2005 2010 2014GDP: Gross domestic product (million current US$) 19 041 30 907 37 131GDP growth rate (annual %, const. 2005 prices) 5.1 5.7 –0.2GDP per capita (current US$) 928.6 1 310.1 1 418.1Economy: Agriculture (% of GVA) 9.6 12.1 14.7Economy: Industry (% of GVA) 43.8 38.7 37.3Economy: Services and other activity (% of GVA) 46.6 49.2 48.0Employment: Agriculture (% of employed) 31.0abc 24.7d ...Employment: Industry (% of employed) 16.3abc 18.8d ...Employment: Services and other (% of employed) 52.7abc 56.2d ...Unemployment (% of labour force) e 16.1 17.8 16.4Labour force participation (female/male pop. %) e 23.6/71.3 24.8/71.4 25.6/72.8CPI: Consumer price index (2000=100) 174 292f 426g
Agricultural production index (2004-2006=100) 98 136 138g
Food production index (2004-2006=100) 98 137 138g
Balance of payments, current account (million US$) 624 –1 398 –842Total trade Major trading partners 2015
(million US$)h (% of exports)h (% of imports)h
Exports 2 416.9 China 35.6 China 11.3Imports 12 041.6 Saudi Arabia 21.0 Turkey 7.1Balance –9 624.7 Thailand 13.7 Saudi Arabia 6.8Social indicatorsPopulation growth rate (average annual %) 2010-2015 2.6Urban population (%) 2015 34.6Urban population growth rate (average annual %) 2010-2015 4.0Fertility rate, total (live births per woman) 2010-2015 4.4Life expectancy at birth (females/males, years) 2010-2015 64.9/62.2Total dependency ratio (Pop. aged 0-14 & 65+ per 100 pop. 15-64) 2015 76International migrant stock (000/% of total pop.) mid-2015 344.1/1.3ij
Tourist arrivals at national borders (000) 2014 990gk
Refugees and others of concern to UNHCR mid-2015 1 540 539Infant mortality rate (per 1 000 live births) 2010-2015 54Health: Total expenditure (% of GDP) 2014 5.6l
Education: Primary gross enrolment ratio (f/m per 100 pop.) 2014 88.9/105.8g
Education: Secondary gross enrolment ratio (f/m per 100 pop.) 2014 39.5/57.4g
Education: Tertiary gross enrolment ratio (f/m per 100 pop.) 2014 6.1/13.7m
Intentional homicide rate (per 100 000 pop.) 2014 6.7g
Seats held by women in national parliaments (%) 2016 0.0Environment and infrastructureMobile-cellular subscriptions (per 100 inhabitants) 2014 68.5e
Individuals using the Internet (%) 2014 22.6e
Patents: Resident filings (per million pop.) 2014 1.0Threatened species 2015 287Forested area (% of land area) 2013 1.0e
CO2 emission estimates (000 tons/tons per capita) 2013 25 346/1.0Energy production, primary (Petajoules) 2013 759Energy supply per capita (Gigajoules) 2013 13.0Terrestrial and marine areas protected (% of total area) 2014 0.6a Data classified according to ISIC Rev. 3. b Break in the time series. c 2004. d Persons aged 15 to 65years. e Estimate. f Series linked to former series. g 2013. h 2014. i Including refugees. j Refers to foreigncitizens. k Including nationals residing abroad. l Data revision. m 2011.
World Statistics Pocketbook 229

ZambiaRegion Eastern Africa Surface area (sq km) 752 612Population (proj., 000) 16 717 Pop. density (per sq km) 22.5Capital city Lusaka Capital city pop. (000) 2 179Currency Zambian Kwacha (ZMW) UN membership date 1 December 1964Economic indicators 2005 2010 2014GDP: Gross domestic product (million current US$) 8 332 20 265 26 963GDP growth rate (annual %, const. 2005 prices) 7.2 10.3 5.6GDP per capita (current US$) 691.8 1 456.1 1 715.1Economy: Agriculture (% of GVA) 15.5 10.2 9.3Economy: Industry (% of GVA) 28.6 34.5 31.1Economy: Services and other activity (% of GVA) 55.9 55.3 59.6Employment: Agriculture (% of employed) 72.2ab 71.3c 52.2ad
Employment: Industry (% of employed) 7.1ab 7.5c 9.5ad
Employment: Services and other (% of employed) 20.6ab 21.0c 38.3ad
Unemployment (% of labour force) e 15.9 14.0 9.6Labour force participation (female/male pop. %) e 73.5/85.6 70.4/79.8 69.8/80.9CPI: Consumer price index (2000=100) 251 420 547Agricultural production index (2004-2006=100) 101 162 179f
Food production index (2004-2006=100) 98 170 187f
Index of industrial production (2005=100) g 100 141 157f
Balance of payments, current account (million US$) –363a 1 377 –401Total trade Major trading partners 2015
(million US$)h (% of exports)h (% of imports)h
Exports 9 687.9 Switzerland 44.7 South Africa 32.4Imports 9 539.0 China 18.5 Dem. Rep. of Congo 15.3Balance 148.9 Dem. Rep. of Congo 8.3 China 9.0Social indicatorsPopulation growth rate (average annual %) 2010-2015 3.1Urban population (%) 2015 40.9Urban population growth rate (average annual %) 2010-2015 4.3Fertility rate, total (live births per woman) 2010-2015 5.5Life expectancy at birth (females/males, years) 2010-2015 60.3/57.2Total dependency ratio (Pop. aged 0-14 & 65+ per 100 pop. 15-64) 2015 95International migrant stock (000/% of total pop.) mid-2015 127.9/0.8i
Tourist arrivals at national borders (000) 2014 947Refugees and others of concern to UNHCR mid-2015 51 758Infant mortality rate (per 1 000 live births) 2010-2015 55Health: Total expenditure (% of GDP) 2014 5.0Health: Physicians (per 1 000 pop.) 2013 0.2d
Education: Primary gross enrolment ratio (f/m per 100 pop.) 2014 104.0/103.3f
Seats held by women in national parliaments (%) 2016 12.7Environment and infrastructureMobile-cellular subscriptions (per 100 inhabitants) 2014 67.3Individuals using the Internet (%) 2014 17.3e
Patents: Resident filings (per million pop.) 2014 1.0Threatened species 2015 83Forested area (% of land area) 2013 65.9e
CO2 emission estimates (000 tons/tons per capita) 2013 3 825/0.3Energy production, primary (Petajoules) 2013 362Energy supply per capita (Gigajoules) 2013 26.0Terrestrial and marine areas protected (% of total area) 2014 37.9Population using improved drinking water sources (urban/rural, %) 2015 85.6/51.3Population using improved sanitation facilities (urban/rural, %) 2015 55.6/35.7Net Official Development Assistance received (% of GNI) 2014 3.9a Break in the time series. b Data classified according to ISIC Rev. 2. c 2008. d 2012. e Estimate. f 2013.g Data classified according to ISIC Rev. 3. h 2014. i Including refugees.
230 World Statistics Pocketbook

ZimbabweRegion Eastern Africa Surface area (sq km) 390 757Population (proj., 000) 15 967 Pop. density (per sq km) 41.3Capital city Harare Capital city pop. (000) 1 501Currency Zimbabwe Dollar (ZWL) UN membership date 25 August 1980Economic indicators 2005 2010 2014GDP: Gross domestic product (million current US$) 6 223 9 422 14 719GDP growth rate (annual %, const. 2005 prices) –4.1 11.4 3.2GDP per capita (current US$) 479.3 674.3 965.5Economy: Agriculture (% of GVA) 12.3 14.5 13.2Economy: Industry (% of GVA) 41.9 30.7 31.1Economy: Services and other activity (% of GVA) 45.9 54.9 55.7Employment: Agriculture (% of employed) 64.8abc ... 65.8d
Employment: Industry (% of employed) 9.3abc ... 9.1d
Employment: Services and other (% of employed) 15.3abc ... 25.0d
Unemployment (% of labour force) e 10.5 7.4 11.3Labour force participation (female/male pop. %) e 82.5/90.2 78.0/88.7 77.6/87.2CPI: Consumer price index (2000=100) 100f 103bg 112g
Agricultural production index (2004-2006=100) 93 101 107h
Food production index (2004-2006=100) 91 96 98h
Total trade Major trading partners 2015(million US$) (% of exports) (% of imports)
Exports 2 704.1 South Africa 71.1 South Africa 38.4Imports 6 002.2 Mozambique 15.1 Singapore 22.3Balance –3 298.1 United Arab Emirates 5.5 China 7.6Social indicatorsPopulation growth rate (average annual %) 2010-2015 2.2Urban population (%) 2015 32.4Urban population growth rate (average annual %) 2010-2015 2.3Fertility rate, total (live births per woman) 2010-2015 4.0Life expectancy at birth (females/males, years) 2010-2015 56.0/53.6Total dependency ratio (Pop. aged 0-14 & 65+ per 100 pop. 15-64) 2015 80International migrant stock (000/% of total pop.) mid-2015 398.9/2.6i
Tourist arrivals at national borders (000) j 2014 1 905Refugees and others of concern to UNHCR mid-2015 308 091e
Infant mortality rate (per 1 000 live births) 2010-2015 48Health: Total expenditure (% of GDP) 2014 6.4k
Health: Physicians (per 1 000 pop.) 2013 0.1d
Education: Primary gross enrolment ratio (f/m per 100 pop.) 2014 99.1/100.8h
Education: Secondary gross enrolment ratio (f/m per 100 pop.) 2014 47.1/48.1h
Education: Tertiary gross enrolment ratio (f/m per 100 pop.) 2014 5.4/6.4h
Intentional homicide rate (per 100 000 pop.) 2014 6.7l
Seats held by women in national parliaments (%) 2016 31.5Environment and infrastructureMobile-cellular subscriptions (per 100 inhabitants) 2014 80.8Individuals using the Internet (%) 2014 19.9e
Threatened species 2015 60Forested area (% of land area) 2013 38.0e
CO2 emission estimates (000 tons/tons per capita) 2013 13 781/0.9Energy production, primary (Petajoules) 2013 422Energy supply per capita (Gigajoules) 2013 32.0Terrestrial and marine areas protected (% of total area) 2014 26.6Population using improved drinking water sources (urban/rural, %) 2015 97.0/67.3Population using improved sanitation facilities (urban/rural, %) 2015 49.3/30.9Net Official Development Assistance received (% of GNI) 2014 6.0a Data classified according to ISIC Rev. 3. b Break in the time series. c 2004. d 2011. e Estimate. f Annualaverage is calculated as geometric mean of monthly indices. Index base: 2005=100. g Index base:2009=100. h 2013. i Including refugees. j Arrivals of non-resident visitors at national borders. k Estimatesshould be viewed with caution as these are derived from scarce data. l 2012.
World Statistics Pocketbook 231


Technical notes
World Statistics Pocketbook 235
Below are brief descriptions of the indicators presented in the country profiles. The terms are
arranged in alphabetical order.
Agricultural production indices are calculated by the Laspeyres formula based on the sum of
price-weighted quantities of different agricultural commodities produced. The commodities
covered in the computation of indices of agricultural production are all crops and livestock
products originating in each country. Practically all products are covered, with the main
exception of fodder crops. Production quantities of each commodity are weighted by the
average international commodity prices in the base period and summed for each year. To
obtain the index, the aggregate for a given year is divided by the average aggregate for the
base period 2004-2006. Indices are calculated without any deductions for feed and seed and
are referred to as “gross” by the Food and Agriculture Organization of the United Nations
(FAO).
Source of the data: Food and Agriculture Organization of the United Nations (FAO), Rome,
FAOSTAT database, last accessed March 2015.
Balance of payments is a statement summarizing the economic transactions between the
residents of a country and non-residents during a specific period, usually a year. It includes
transactions in goods, services, income, transfers and financial assets and liabilities.
Generally, the balance of payments is divided into two major components: the current account
and the capital and financial account. The data on balance of payments presented in the
World Statistics Pocketbook correspond to the current account category. The current account
is a record of all transactions in the balance of payments covering the exports and imports of
goods and services, payments of income, and current transfers between residents of a country
and non-residents.
Source of the data: International Monetary Fund (IMF), Washington, D.C., the database on
International Financial Statistics, last accessed April 2016.
Capital city and capital city population is the designation of any specific city as a capital
city as reported by the country or area. The city can be the seat of the government as
determined by the country. Some countries designate more than one city to be a capital city
with a specific title function (e.g., administrative and/or legislative capital). The data refer to
the year 2015, unless otherwise stated in a footnote.
Source of the data: United Nations Population Division, New York, "World Urbanization
Prospects: The 2014 Revision".
CO2 emission estimates represent the volume of carbon dioxide (CO2) produced during the
combustion of solid, liquid, and gaseous fuels, from gas flaring and the manufacture of
cement. Original data were converted to CO2 emissions by using the conversion formula: 1
gram Carbon = 3.667 grams CO2.
Source of the data: Carbon Dioxide Information Analysis Center (CDIAC) of the Oak Ridge
National Laboratory, Oak Ridge, Tennessee, U.S.A., database on national CO2 emission
estimates, last accessed May 2016.

Technical notes (continued)
World Statistics Pocketbook 236
Consumer price index (CPI) measures the period-to-period proportional change in the prices
of a fixed set of consumer goods and services of constant quantity and characteristics,
acquired, used or paid for by the reference population. The index is constructed as a weighted
average of a large number of elementary aggregate indices. Each of the elementary aggregate
indices is estimated using a sample of prices for a defined set of goods and services obtained
in, or by residents of, a specific region from a given set of outlets or other sources of
consumption. The indices here generally refer to “all items” and to the country as a whole,
unless otherwise stated in a footnote.
Source of the data: International Labour Office (ILO), Geneva, the LABORSTA database, last
accessed April 2016.
Currency refers to those notes and coins in circulation that are commonly used to make
payments. The official currency names and the ISO currency codes are those officially in use,
and may be subject to change.
Source of the data: International Standards Organisation, Geneva, Currency Code Services –
ISO 4217 Maintenance Agency, last accessed April 2016.
Economy: Agriculture, industry and services and other activity presents the shares of the
components of Gross Value Added (GVA) at current prices by kind of economic activity;
agriculture (agriculture, hunting, forestry and fishing), industry (mining and quarrying,
manufacturing, electricity, gas and water supply; and construction) and in services and other
sectors based on the sections of the International Standard Industrial Classification of All
Economic Activities (ISIC), Revision 3, unless a different revision is stated in a footnote.
Source of the data: United Nations Statistics Division, New York, national accounts analysis
of main aggregates (AMA) database, last accessed March 2016.
Education: Government expenditure shows the trends in general government expenditures
for educational affairs and services at pre-primary, primary, secondary and tertiary levels and
subsidiary services to education, expressed as a percentage of the gross domestic product.
The data refer to the year 2014, unless stated by a footnote showing the latest available year
(no earlier than 2011).
Source of the data: United Nations Educational, Scientific and Cultural Organization
(UNESCO) Institute for Statistics, Montreal, the UNESCO Institute for Statistics (UIS) statistics
database, last accessed June 2016.
Education: Primary, secondary and tertiary gross enrolment ratio is the total enrolment in
the primary, secondary and tertiary levels of education, regardless of age, expressed as a
percentage of the eligible official school-age population corresponding to the same level of education in a given school year. Education at the primary level provides the basic elements of
education (e.g. at elementary school or primary school). Education at the secondary level is
provided at middle school, secondary school, high school, teacher-training school at this level
and schools of a vocational or technical nature. Education at the tertiary level is that which is
provided at university, teachers’ college, higher professional school, and which requires, as a
minimum condition of admission, the successful completion of education at the second level,

Technical notes (continued)
World Statistics Pocketbook 237
or evidence of the attainment of an equivalent level of knowledge. Enrolment is measured at
the beginning of the school or academic year. The gross enrolment ratio at each level will
include all pupils whatever their ages, whereas the population is limited to the range of
official school ages. Therefore, for countries with almost universal education among the
school-age population, the gross enrolment ratio can exceed 100 if the actual age distribution
of pupils extends beyond the official school ages. The data refer to the year 2014, unless
stated by a footnote showing the latest available year (no earlier than 2011).
Source of the data: United Nations Educational, Scientific and Cultural Organization
(UNESCO) Institute for Statistics, Montreal, the UNESCO Institute for Statistics (UIS) statistics
database, last accessed June 2016.
Employment in agricultural, industrial and services and other sectors: The “employed”
comprise all persons above a specified age who, during a specified brief period, either one
week or one day, were in "paid employment” or in "self-employment”, see ILO’s Current
International Recommendations on Labour Statistics. The data refer to those 15 years and
over, unless otherwise stated in a footnote, who perform any work at all in the reference
period, for pay or profit in agriculture (agriculture, forestry and fishing), industry (mining and
quarrying; manufacturing; electricity, gas, steam and air conditioning supply; water supply,
sewerage, waste management and remediation activities; and construction) and in services
and other sectors based on the sections of the International Standard Industrial Classification
of All Economic Activities (ISIC), Revision 4, unless an earlier revision is stated in a footnote.
Source of the data: International Labour Organization (ILO), Geneva, Key Indicators of the
Labour Market (KILM 9th edition), last accessed March 2016.
Energy production, primary, is the capture or extraction of fuels or energy from natural
energy flows, the biosphere and natural reserves of fossil fuels within the national territory in
a form suitable for use. Inert matter removed from the extracted fuels and quantities
reinjected, flared or vented are not included. The resulting products are referred to as
“primary” products. It excludes secondary production, that is, the manufacture of energy
products through the process of transforming primary and/or other secondary fuels or energy.
Data are provided in a common energy unit (Petajoule) and refer to the following primary
energy sources: hard coal, brown coal, peat, oil shale, conventional crude oil, natural gas
liquids (NGL), other hydrocarbons, additives and oxygenates, natural gas, fuelwood, wood
residues and by-products, bagasse, animal waste, black liquor, other vegetal material and
residues, biogasoline, biodiesels, bio jet kerosene, other liquid biofuels, biogases, industrial
waste, municipal waste, nuclear, solar photovoltaic, solar thermal, hydro, wind, geothermal,
and tide, wave and other marine sources. Peat, biomass and wastes are included only when
the production is for energy purposes. See International Recommendations for Energy
Statistics (2011) and 2012 Energy Balances for a complete description of the methodology.
Source of the data: United Nations Statistics Division, New York, Energy Statistics Yearbook
2013, last accessed March 2016.
Energy supply per capita is defined as primary energy production plus imports minus exports
minus international marine bunkers minus international aviation bunkers minus stock changes.

Technical notes (continued)
World Statistics Pocketbook 238
For imports, exports, international bunkers and stock changes, it includes secondary energy
products, in addition to primary products.
Source of the data: United Nations Statistics Division, New York, Energy Statistics Yearbook
2013, last accessed March 2016.
Fertility rate is the total fertility rate, a widely used summary indicator of fertility. It refers to
the number of children that would be born per woman, assuming no female mortality at child
bearing ages and the age-specific fertility rates of a specified country and reference period.
The data are the five-year average for the reference period 2010-2015, unless otherwise stated
in a footnote.
Source of the data: United Nations Population Division, New York, World Population
Prospects: The 2015 Revision; supplemented by data from the United Nations Statistics
Division, New York, Demographic Yearbook 2013 and Secretariat for the Pacific Community
(SPC) for small countries or areas.
Food production index covers commodities that are considered edible and contain nutrients.
Accordingly, coffee and tea are excluded because they have practically no nutritive value. The
index numbers shown may differ from those produced by countries themselves because of
differences in concepts of production, coverage, weights, time reference of data, and methods
of evaluation. The data include estimates made by FAO in cases where no official or semi-
official figures are available from the countries.
Source of the data: Food and Agriculture Organization of the United Nations (FAO), Rome,
FAOSTAT database, last accessed March 2015.
Forested area refers to the percentage of land area occupied by forest. Forest is defined in
the Food and Agriculture Organization’s Global Forest Resources Assessment as land spanning
more than 0.5 hectares with trees higher than 5 metres and a canopy cover of more than 10
percent, or trees able to reach these thresholds in situ. It does not include land that is
predominantly under agricultural or urban land use. Data are calculated from the forest
estimates divided by the land area.
Source of the data: Food and Agriculture Organization of the United Nations (FAO), Rome,
FAOSTAT database, last accessed November 2015.
Gross domestic product (GDP) is an aggregate measure of production equal to the sum of gross
value added of all resident producer units plus that part (possibly the total) of taxes on products, less
subsidies on products, that is not included in the valuation of output. It is also equal to the sum of the
final uses of goods and services (all uses except intermediate consumption) measured at purchasers’
prices, less the value of imports of goods and services, and equal to the sum of primary incomes
distributed by resident producer units (see System of National Accounts 2008). The data in the
World Statistics Pocketbook are in current United States (US) dollars and are estimates of the total
production of goods and services of the countries represented in economic terms, not as a measure
of the standard of living of their inhabitants. In order to have comparable coverage for as many
countries as possible, these US dollar estimates are based on official GDP data in national
currency, supplemented by national currency estimates prepared by the Statistics Division
using additional data from national and international sources. The estimates given here are in

Technical notes (continued)
World Statistics Pocketbook 239
most cases those accepted by the United Nations General Assembly’s Committee on
Contributions for determining United Nations members’ contributions to the United Nations
regular budget. The exchange rates for the conversion of GDP national currency data into US
dollars are the average market rates published by the International Monetary Fund, in
International Financial Statistics. Official exchange rates are used only when free market rates are
not available. For non-members of the Fund, the conversion rates used are the average of United Nations
operational rates of exchange. It should be noted that the conversion from local currency into US dollars
introduces deficiencies in comparability over time and among countries which should be considered
when using the data. For example, comparability over time is distorted when exchange rate fluctuations
differ substantially from domestic inflation rates.
Source of the data: United Nations Statistics Division, New York, national accounts analysis
of main aggregates (AMA) database, last accessed March 2016.
GDP growth rate is derived on the basis of constant 2005 price series in national currency.
The figures are computed as the geometric mean of annual rates of growth expressed in
percentages for the year 2014.
Source of the data: United Nations Statistics Division, New York, national accounts analysis
of main aggregates (AMA) database, last accessed March 2016.
GDP per capita estimates are the value of all goods and services produced in the economy
divided by the population.
Source of the data: United Nations Statistics Division, New York, national accounts analysis
of main aggregates (AMA) database, last accessed March 2016.
Health: Total expenditure is the sum of all outlays for health maintenance, restoration or
enhancement paid for in cash or supplied in kind expressed as a percentage of Gross Domestic
Product. It is the sum of General Government Expenditure on Health and Private Expenditure
on Health. General government expenditure on health is the sum of health outlays paid for in
cash or supplied in kind by government entities, such as the Ministry of Health, other
ministries, parastatal organizations or social security agencies (without double counting
government transfers to social security and extra budgetary funds). It includes all expenditure
made by these entities, regardless of the source, so includes any donor funding passing
through them. It includes transfer payments to households to offset medical care costs and
extra budgetary funds to finance health services and goods. It includes current and capital
expenditure.
Source of the data: World Health Organization (WHO), Geneva, WHO Global Health
Expenditure database, last accessed June 2016.
Health: Physicians (per 1 000 population) includes generalist medical practitioners and
specialist medical practitioners. The classification of health workers used is based on criteria
for vocational education and training, regulation of health professions, and activities and tasks
of jobs, i.e. a framework for categorizing key workforce variables according to shared
characteristics.

Technical notes (continued)
World Statistics Pocketbook 240
Source of the data: World Health Organisation (WHO), Geneva, WHO Global Health
Workforce statistics database, last accessed September 2015.
Index of Industrial production generally cover industry (mining and quarrying; manufacturing;
electricity, gas, steam and air conditioning supply; water supply, sewerage, waste
management and remediation activities; and construction) based on the sections (i.e. B, C, D
and E) of the International Standard Industrial Classification of All Economic Activities (ISIC),
Revision 4, unless a different revision/set of sections is stated in a footnote.
Source of the data: United Nations Statistics Division, New York, Environment and energy
statistics branch, Industrial and Energy Statistics Section, last accessed November 2015.
Individuals using the Internet refer to the percentage of people who used the Internet from
any location and for any purpose, irrespective of the device and network used. It can be via a
computer (i.e. desktop or laptop computer, tablet or similar handheld computer), mobile phone,
games machine, digital TV, etc. Access can be via a fixed or mobile network. There are certain
data limits to this indicator, insofar as estimates have to be calculated for many developing
countries which do not yet collect information and communications technology household
statistics.
Source of the data: International Telecommunication Union (ITU), Geneva, the ITU database,
last accessed September 2015.
Infant mortality rate (per 1 000 live births) is the ratio of infant deaths (the deaths of children
under one year of age) in a given year to the total number of live births in the same year. The
rates are the five-year projected averages for the reference period 2010-2015, unless
otherwise stated in a footnote.
Source of the data: United Nations Population Division, New York, World Population
Prospects: The 2015 Revision; supplemented by data from the United Nations Statistics
Division, New York, Demographic Yearbook 2013 and Secretariat for the Pacific Community
(SPC) for small countries or areas.
Intentional homicide rate: The rates are the annual number of unlawful deaths purposefully
inflicted on a person by another person, reported for the year per 100 000. For most countries,
country information on causes of death is not available for most causes. Estimates are
therefore based on cause of death modelling and death registration data from other countries
in the region. Further country-level information and data on specific causes was also used. The
data refer to the year 2014 unless stated by a footnote showing the latest available year (no
earlier than 2011).
Source of the data: United Nations Office on Drugs and Crime, Vienna, UNODC Statistics
database, last accessed May 2016.
International migrant stock generally represents the number of persons born in a country
other than that in which they live. When information on country of birth was not recorded,
data on the number of persons having foreign citizenship was used instead. In the absence of
any empirical data, estimates were imputed. Data refer to mid-2015. Figures for international

Technical notes (continued)
World Statistics Pocketbook 241
migrant stock as a percentage of the population are the outcome of dividing the estimated
international migrant stock by the estimated total population and multiplying the result by 100.
Source of the data: United Nations Population Division, New York, International migrant stock:
The 2015 Revision, last accessed June 2016.
Labour force participation rate is calculated by expressing the number of persons in the
labour force as a percentage of the working-age population. The labour force is the sum of the
number of persons employed and the number of unemployed (see ILO’s current International
Recommendations on Labour Statistics). The working-age population is the population above a
certain age, prescribed for the measurement of economic characteristics. The data refer to the
age group of 15 years and over and are based on ILO’s modelled estimates, unless otherwise
stated in a footnote.
Source of the data: International Labour Organization (ILO), Geneva, Key Indicators of the
Labour Market (KILM 9th edition), last accessed March 2016.
Life expectancy at birth is the average number of years of life at birth (age 0) for males and
females according to the expected mortality rates by age estimated for the reference year and
population. The data are the five-year projected averages for the reference period 2010-2015,
unless otherwise stated in a footnote.
Source of the data: United Nations Population Division, New York, World Population
Prospects: The 2015 Revision; supplemented by data from the United Nations Statistics
Division, New York, Demographic Yearbook 2013 and Secretariat for the Pacific Community
(SPC) for small countries or areas.
Major trading partners show the three largest trade partners (countries of last known
destination and origin or consignment) in international merchandise trade transactions. In
some cases a special partner is shown (i.e. Areas nes, bunkers, etc.) instead of a country and
refers to one of the following special categories. Areas not elsewhere specified (Areas nes) is
used (a) for low value trade, (b) if the partner designation was unknown to the country or if an
error was made in the partner assignment and (c) for reasons of confidentiality. If a specific
geographical location can be identified within Areas nes, then they are recorded accordingly
(i.e. Other Europe nes, South (S.) America nes, North and Central (N & C) America nes,
Oceania nes, Other Africa nes, and Other Asia nes). Bunkers are ship stores and aircraft
supplies, which consists mostly of fuels and food. Free zones belong to the geographical and
economic territory of a country but not to its customs territory. For the purpose of trade
statistics the transactions between the customs territory and the free zones are recorded, if
the reporting country uses the Special Trade System. Free zones can be commercial free zones
(duty free shops) or industrial free zones. Data are expressed as percentages of total exports
and of total imports of the country, area or special partner.
Source of the data: United Nations Statistics Division, New York, Commodity Trade Statistics
Database (COMTRADE) and the International Trade Statistics Yearbook 2015, last accessed
June 2016.
Technical notes (continued)
World Statistics Pocketbook 242
Mobile-cellular telephone subscriptions, per 100 inhabitants refer to the number of mobile
cellular telephone subscriptions in a country for each 100 inhabitants. It is calculated by
dividing the number of mobile cellular telephone subscriptions by the total population and
multiplied by 100.
Source of the data: International Telecommunication Union (ITU), Geneva, the ITU database,
last accessed September 2015.
Net Official Development Assistance received or disbursed is defined as those flows to
developing countries and multilateral institutions provided by official agencies, including state
and local governments, or by their executive agencies, each transaction of which meets the
following tests: i) it is administered with the promotion of the economic development and
welfare of developing countries as its main objective; and ii) it is concessional in character
and conveys a grant element of at least 25 per cent. It is expressed as a percentage of Gross
National Income of either the donor or recipient. The multilateral institutions include the
World Bank Group, regional banks, financial institutions of the European Union and a number
of United Nations institutions, programmes and trust funds.
Source of the data: Organisation for Economic Co-operation and Development (OECD), Paris,
the OECD Development Assistance Committee database, last accessed March 2016.
Patents: resident fillings (per million population) resident refers to an application filed by
an applicant at its national Intellectual Property (IP) office. IP grant (registration) data are
based on the same concept. In force refers to a patent or other form of IP protection that is
currently valid. Country of origin is used to catgorise IP data by resident (domestic) and non-
resident (foreign). The residence of the first-named applicant (or inventor) recorded in the IP
document (e.g. patent or trademark application) is used to classify IP data by country of origin.
Source of the data: World Intellectual Property Organization (WIPO), Geneva, WIPO statistics
database, last accessed April 2016.
Population density refers to medium fertility projected population as of 1 July 2016 per
square kilometre of surface area.
Source of the data: United Nations Population Division, New York, "World Population
Prospects: The 2015 Revision".
Population projection refers to medium fertility projected population as of 1 July 2016. The
total population of a country may comprise either all usual residents of the country (de jure
population) or all persons present in the country (de facto population) at the time of the
census; for purposes of international comparisons, the de facto definition is recommended.
Source of the data: United Nations Population Division, New York, "World Population
Prospects: The 2015 Revision".
Population growth rate is the average annual percentage change in total population size. The
data refer to the period 2010-2015, unless otherwise stated in a footnote.
Source of the data: United Nations Population Division, New York, "World Population
Prospects: The 2015 Revision".
Technical notes (continued)
World Statistics Pocketbook 243
Population using improved drinking water sources is the percentage of the population in
urban and rural areas, according to national definitions, who use any of the following types of
water supply for drinking: piped water, public tap, borehole or pump, protected well, protected
spring or rainwater. Improved water sources do not include vendor-provided water, bottled
water, tanker trucks or unprotected wells and springs. Use of an improved drinking water
source is a proxy for the use of safe drinking water, see www.wssinfo.org for further
information.
Source of the data: World Health Organization (WHO) and United Nations Children's Fund
(UNICEF), Geneva and New York, the WHO/UNICEF Joint Monitoring Programme for the Water
and Sanitation database, last accessed October 2015.
Population using improved sanitation facilities refers to the percentage of the population in
urban and rural areas, according to national definitions, with access to facilities that
hygienically separate human excreta from human, animal and insect contact. Facilities such as
sewers or septic tanks, poor flush latrines and simple pit or ventilated improved pit latrines
are assumed to be adequate, provided that they are not public. To be effective, facilities must
be correctly constructed and properly maintained. Sanitation facilities are not considered
improved when shared with other households, or open to public use. Use of an improved
sanitation facility is a proxy for access to basic sanitation, see www.wssinfo.org for further
information.
Source of the data: World Health Organization (WHO) and United Nations Children's Fund
(UNICEF), Geneva and New York, the WHO/UNICEF Joint Monitoring Programme for the Water
and Sanitation database, last accessed October 2015.
Terrestrial and marine areas protected refers to the sum of terrestrial protected areas as
well as marine protected areas in territorial waters (up to 200 nautical miles from the coast)
divided by the total area of land area (including inland waters) and territorial waters. Protected
areas are recorded in the World Database on Protected Areas (WDPA), last updated in August
2014, and include the location and extent of protected areas, determined through a GIS
analysis, spanning from 1990 to present. The WDPA is a joint initiative of UNEP and IUCN, see
www.unep-wcmc.org for further information.
Source of the data: United Nations Environment Programme (UNEP) World Conservation
Monitoring Centre (WCWC), Cambridge, Millennium Development Goals database, last
accessed November 2015.
Refugees and others of concern to the Office of the United Nations High Commissioner
for Refugees (UNHCR): The 1951 United Nations Convention relating to the Status of
Refugees states that a refugee is someone who, owing to a well-founded fear of being
persecuted for reasons of race, religion, nationality, political opinion or membership in a
particular social group, is outside the country of his or her nationality and is unable to, or
owing to such fear, is unwilling to avail himself or herself of the protection of that country; or
who, not having a nationality and being outside the country of his or her former habitual
residence, is unable or, owing to such fear, unwilling to return to it. In this series, refugees

Technical notes (continued)
World Statistics Pocketbook 244
refer to persons granted a humanitarian status and/or those granted temporary protection.
Included are persons who have been granted temporary protection on a group basis. The
series also includes returned refugees, asylum-seekers, stateless persons and persons
displaced internally within their own country and others of concern to UNHCR.
Source of the data: United Nations High Commissioner for Refugees (UNHCR), Geneva,
UNHCR Population Statistics Database, last accessed June 2016.
Region is based on macro geographical regions arranged according to continents and
component geographical regions used for statistical purposes.
Source of the data: United Nations Statistics Division, New York, Statistical Yearbook 58th
issue (Annex I) Country and area nomenclature, regional and other groupings (based on Series
M49: Standard Country or Area codes and Geographical Regions for Statistical Use), last
accessed June 2016.
Seats held by women in national parliaments refer to the number of women in the lower
chamber of national parliaments expressed as a percentage of total occupied seats in the
lower or single House, situation as of 1 February 2016.
Source of the data: Inter-Parliamentary Union (IPU), Geneva, Women in National Parliament
dataset and the Millennium Development Goals Indicators database, last accessed April 2016.
Surface area refers to land area plus inland water, unless otherwise stated in a footnote.
Source of the data: United Nations Statistics Division, New York, Demographic Yearbook
2014 and the demographic statistics database, last accessed February 2016.
Threatened species represents the number of plants and animals that are most in need of
conservation attention and are compiled by the World Conservation Union IUCN/ Species
Survival Commission (SSC).
Source of the data: World Conservation Union (IUCN) / Species Survival Commission (SSC),
Gland, Switzerland and Cambridge, United Kingdom, IUCN Red List of Threatened Species
publication, last accessed July 2015.
Total dependency ratio refers to the number of people in the population aged under 15 years
old and over 64 years old per 100 people in the population aged between 15 and 64 years old,
expressed as a ratio as 1 July 2015, unless otherwise stated in a footnote.
Source of the data: United Nations Population Division, New York, World Population
Prospects: The 2015 Revision; supplemented by data from the United Nations Statistics
Division, New York, Demographic Yearbook 2013 and Secretariat for the Pacific Community
(SPC) for small countries or areas.
Total trade: exports and imports show the movement of goods out of and into a country.
Goods simply being transported through a country (goods in transit) or temporarily admitted
(except for goods for inward processing) do not add to the stock of material resources of a
country and are not included in the international merchandise trade statistics. In the “general
trade system”, the definition of the statistical territory of a country coincides with its

Technical notes (continued)
World Statistics Pocketbook 245
economic territory. In the “special trade system”, the definition of the statistical territory
comprises only a particular part of the economic territory, mainly that part which coincides
with the free circulation area for goods. “The free circulation area” is a part of the economic
territory of a country within which goods “may be disposed of without Customs restrictions”.
In the case of exports, the transaction value is the value at which the goods were sold by the
exporter, including the cost of transportation and insurance, to bring the goods onto the
transporting vehicle at the frontier of the exporting country (an FOB-type valuation). In the case
of imports, the transaction value is the value at which the goods were purchased by the
importer plus the cost of transportation and insurance to the frontier of the importing country
(a CIF-type valuation). Both imports and exports are shown in United States dollars.
Conversion from national currencies is made by means of currency conversion factors based
on official exchange rates (par values or weighted averages).
Source of the data: United Nations Statistics Division, New York, Commodity Trade Statistics
Database (COMTRADE) and the International Trade Statistics Yearbook 2015, last accessed
June 2016.
Tourist arrivals at national borders is any person who travels to a country other than that in
which he or she has his or her usual residence but outside his/her usual environment for a
period not exceeding 12 months and whose main purpose of visit is other than the exercise of
an activity remunerated from with the country visited, and who stays at least one night in a
collective or private accommodation in the country visited (see Recommendations on Tourism
Statistics of the United Nations and the World Tourism Organization). The data refer to
arrivals of non-resident tourists at national borders, unless otherwise stated in a footnote.
Source of the data: World Tourism Organization (WTO), Madrid, the WTO Statistics
Database, last accessed April 2016.
Unemployment refers to persons above a specified age who during a specified reference
period were: “without work”, i.e. were not in paid employment or self-employment as defined
under employment; “currently available for work”, i.e. were available for paid employment or
self-employment during the reference period; and “seeking work”, i.e. had taken specific steps
in a specified recent period to seek paid employment or self-employment (see ILO’s current
International Recommendations on Labour Statistics). The data refer to the 15 years and over
age group and are based on ILO’s modelled estimates, unless otherwise stated in a footnote.
Source of the data: International Labour Organization (ILO), Geneva, Key Indicators of the
Labour Market (KILM 9th edition), last accessed March 2016.
United Nations membership dates: The United Nations is an intergovernmental organization
whose members are the countries of the world. Currently there are 193 Member States of the
United Nations, some of which joined the UN by signing and ratifying the Charter of the
United Nations in 1945; the other countries joined the UN later, through the adoption of a
resolution admitting them to membership. The process usually follows these steps: first, the
country applies for membership and makes a declaration accepting the obligations of the
Charter; second, the Security Council adopts a resolution recommending that the General
Technical notes (continued)
World Statistics Pocketbook 246
Assembly admit the country to membership and finally the General Assembly adopts a
resolution admitting the country.
Source of the data: United Nations, New York, Member states and date of admission, last
accessed December 2014.
Urban population is based on the number of persons as of 1 July 2015 defined as urban
according to national definitions of this concept. In most cases these definitions are those
used in the most recent population census.
Source of the data: United Nations Population Division, New York, "World Urbanization
Prospects: The 2014 Revision".
Urban population growth rate is based on the number of persons defined as urban according
to national definitions of this concept. In most cases these definitions are those used in the
most recent population census. The data are the five-year projected averages for the reference
period 2010-2015, unless otherwise stated in a footnote.
Source of the data: United Nations Population Division, New York, "World Urbanization
Prospects: The 2014 Revision".

Statistical sources and references
World Statistics Pocketbook 247
Statistical sources
Carbon Dioxide Information Analysis Center, Oak Ridge, Tennessee, Global, Regional, and National Fossil-Fuel CO2 Emissions, available at http://cdiac.ornl.gov/trends/emis/overview_2013.html.
Food and Agriculture Organization of the United Nations, Rome, FAOSTAT database, available at http://faostat3.fao.org/home/E.
International Labour Organization, Key Indicators of the Labour Market, 9th edition software, available at http://www.ilo.org/global/statistics-and-databases/research-and-databases/kilm/lang--en/index.htm.
__________, LABORSTA Internet database, available at http://laborsta.ilo.org/.
International Monetary Fund (IMF), Washington, Balance of Payments (BOP) database.
__________, International Financial Statistics (IFS) database.
Inter-Parliamentary Union, Women in National Parliaments, available at http://www.ipu.org/wmn-e/classif.htm.
International Telecommunication Union (ITU), Geneva, the World Telecommunication/ICT Indicators Database, available at http://www.itu.int/en/ITU-D/statistics/Pages/default.aspx.
International Union for Conservation of Nature (IUCN), The 2015 IUCN Red List of Threatened Species, available at http://www.iucnredlist.org/about/summary-statistics.
Organisation for Economic Co-operation and Development (OECD) Development Assistance Committee (DAC) statistics, available at http://stats.oecd.org/.
Secretariat of the Pacific Community (SPC) Statistics and Demography Programme, Population and demographic indicators, available at http://sdd.spc.int/en/.
United Nations Educational, Scientific and Cultural Organization (UNESCO) Institute for Statistics, Montreal, UNESCO statistics database, available at http://data.uis.unesco.org/.
United Nations High Commissioner for Refugees, Geneva, UNHCR Mid-Year Trends 2015, available at http://www.unhcr.org/en-us/statistical-yearbooks.html.
United Nations, Department of Economic and Social Affairs, Population Division, New York, Trends in International Migrant Stock: The 2015 Revision (United Nations publication POP/DB/MIG/Stock/Rev.2015/Age), available at http://www.un.org/en/development/desa/population/migration/data/index.shtml.
__________, World Population Prospects. The 2015 Revision, available at https://esa.un.org/unpd/wpp/.

Statistical sources and references (continued)
World Statistics Pocketbook 248
__________, World Urbanization Prospects: The 2014 Revision, available at https://esa.un.org/unpd/wup/.
United Nations, Department of Economic and Social Affairs, Statistics Division, New York, Commodity Trade Statistics Database (COMTRADE), available at http://comtrade.un.org/db/default.aspx.
__________, Demographic Yearbook 2013 and 2014 (United Nations Publication, ST/ESA/STAT/SER.R/42), available at http://unstats.un.org/unsd/demographic/products/dyb/dyb2.htm
__________, Energy Statistics Yearbook (Series J, United Nations publication), available at http://unstats.un.org/unsd/energy/yearbook/default.htm.
__________, International Trade Statistics Yearbook (Series G, United Nations publication), available at http://comtrade.un.org/pb/.
__________, National Accounts Statistics: Analysis of Main Aggregates (Series X, United Nations publication), available at http://unstats.un.org/unsd/snaama/introduction.asp.
__________, Standard Country or Area Codes for Statistical Use (ST/ESA/STAT/SER.M/49/Rev.4) http://unstats.un.org/unsd/methods/m49/m49.htm and United Nations Statistical Yearbook (Annex I) available at http://unstats.un.org/unsd/publications/statistical-yearbook/.
United Nations Member States website, available at http://www.un.org/en/members/.
United Nations Millennium Development Goals database available at http://mdgs.un.org/unsd/mdg/Default.aspx.
United Nations Office on Drugs and Crime, Vienna, Homicide Statistics website, available at https://www.unodc.org/unodc/en/data-and-analysis/crime-and-criminal-justice.html.
United Nations World Health Organization (WHO), Geneva, Global Health Observatory Data Repository available at http://www.who.int/gho/en/.
__________, Global Health Expenditure database available at http://apps.who.int/nha/database.
WHO / UNICEF Joint Monitoring Programme (JMP) for sanitation and water supply, available at www.wssinfo.org.
United Nations World Tourism Organization (UNWTO), Madrid, UNWTO statistics database, Yearbook of Tourism Statistics available at http://www.e-unwto.org/loi/unwtotfb.
World Intellectual Property Office (WIPO) Intellectual Property statistics data centre available at http://ipstats.wipo.int/ipstatv2/?lang=en

Statistical sources and references (continued)
World Statistics Pocketbook 249
References
Food and Agriculture Organization of the United Nations (2010). Global Forest Resources Assessment 2010 (Rome), available at http://www.fao.org/forestry/fra/fra2010/en/.
International Labour Organization (2000). Current International Recommendations on Labour Statistics, 2000 Edition (Geneva), available at http://www.ilo.org/public/english/bureau/stat/publ/currrec.htm.
United Nations (1951 and 1967). Convention relating to the Status of Refugees of 1951 (United Nations, Treaty Series, vol. 189 (1954), No. 2545, p. 137), art. 1) and Protocol relating to the Status of Refugees of 1967 (United Nations, Treaty Series, vol. 606 (1967), No. 8791, p. 267).
United Nations (1982). Concepts and Methods in Energy Statistics, with Special Reference to Energy Accounts and Balances: A Technical Report. Statistical Office, Series F, No. 29 and Corr. 1 (United Nations publication, Sales No. E.82.XVII.13 and corrigendum), available at http://unstats.un.org/unsd/publication/SeriesF/SeriesF_29E.pdf.
United Nations (2008). Principles and Recommendations for Population and Housing Censuses Rev. 2. Statistics Division, Series M, No. 67, Rev. 2 (United Nations publication, Sales No. E.07.XVII.8), available at http://unstats.un.org/unsd/publication/SeriesM/Seriesm_67rev2e.pdf.
United Nations (2008). International Standard Industrial Classification of All Economic Activities (ISIC), Rev. 4. Statistics Division, Series M, No. 4, Rev.4 (United Nations publication, Sales No. E.08.XVII.25), available at http://unstats.un.org/unsd/publication/SeriesM/seriesm_4rev4e.pdf.
United Nations (2004). International Merchandise Trade Statistics: Compilers Manual, Statistics Division, Series F, No. 87 (United Nations publication, Sales No. E.02.XVII.17), available at http://unstats.un.org/unsd/publication/SeriesF/seriesf_87e.pdf.
United Nations (2010). International Merchandise Trade Statistics: Concepts and Definitions, Statistics Division, Series M, No.52, Rev.3, (United Nations publication, Sales No. E.10.XVII.13), available at http://unstats.un.org/unsd/trade/EG-IMTS/IMTS%202010%20(English).pdf.
United Nations (2011). International Recommendations for Energy Statistics (IRES), Statistics Division, available at http://unstats.un.org/unsd/statcom/doc11/BG-IRES.pdf.
United Nations (2015). 2012 Energy Balances, Statistics Division, Series W, No. 21 (United Nations Publication, Sales No. E.15.XVII.13), available at http://unstats.un.org/unsd/energy/balance/2012/01.pdf.
Statistical sources and references (continued)
World Statistics Pocketbook 250
United Nations European Commission, International Monetary Fund, Organisation for Economic Cooperation and Development and World Bank (2009). System of National Accounts 2008 (SNA 2008), available at http://unstats.un.org/unsd/nationalaccount/sna2008.asp.
United Nations and World Tourism Organization (2008). International Recommendations for Tourism Statistics 2008, Series M, No. 83/Rev.1 (United Nations publication, Sales No. E.08.XVII.28).
World Health Organization (WHO, 2007). International Statistical Classification of Diseases and Related Health Problems, Tenth Revision (ICD-10), (Geneva), available at http://www.who.int/classifications/icd/en/.

Related statistical products
World Statistics Pocketbook 251
The World Statistics Pocketbook can also be viewed online in PDF format at
http://unstats.un.org/unsd/pocketbook/ and in UNdata at http://data.un.org/CountryProfile.aspx.
Please visit the World Statistics Pocketbook website for
updates on UN CountryStats, an app for Android devices,
available at http://unstats.un.org/unsd/pocketbook/.
Other statistical publications offering a broad cross-section of
information which may be of interest to users of the World Statistics Pocketbook include:
The Monthly Bulletin of Statistics (MBS) in print and the Monthly Bulletin of
Statistics Online, available at http://unstats.un.org/unsd/mbs/.
The Statistical Yearbook (SYB) in print and online in PDF format, available at
http://unstats.un.org/unsd/ publications/statistical-yearbook/
Both publications are available for sale in print format (see below for
instructions on how to order).
For more information about other publications and online databases
prepared by the United Nations Statistics Division, please visit: http://unstats.un.org/unsd/pubs/ and
http://unstats.un.org/unsd/databases.htm. For additional information about the work of the United Nations
Statistics Division, please visit http://unstats.un.org/unsd.
To order United Nations publications, please visit www.un.org/publications or contact:
United Nations Publications
300 East 42nd Street
New York, NY 10017
Tel: 1-888-254-4286 / Fax: 1-800-338-4550 ./ E-mail: [email protected]
Please provide the Statistical Dissemination Section – which is responsible for producing the World
Statistics Pocketbook, the Monthly Bulletin of Statistics and the Statistical Yearbook – your feedback and
suggestions regarding these statistical products, as well as the utility of the data, by contacting
