senkadagala finance company plc 2010/2011 the … · · 2011-09-05annual report 2010/2011 the...
TRANSCRIPT

Senkadagala Finance Company PLC
Annual Report 2010/2011
THE
LAIDPLANS BEST
Senkadagala Finance Company PLC 2nd Floor, No. 267, Galle Road, Colombo 3.Tel: 011-2301301Fax: 011-2301937Email: [email protected]
Senkad
agala Finance Com
pany P
LC | A
nnual Rep
ort 2010/2011

Corporate Information
Legal Status• Quoted Public Limited Liability Company incorporated on
29th December 1968. The Company re-gistered under the Companies Act, No. 7 of 2007.
• Approved and registered under the Finance Companies Act, No. 78 of 1988
• Approved and registered under the Finance Leasing Act No. 56 of 2000.
• An Approved Credit Agency under Mortgage Act, No. 6 of 1949 and the Trust Receipt Ordinance, No. 12 of 1947.
Date of Incorporation29th December 1968
Board of Directors Mr. S. K. Wickremesinghe B.Sc.(Cey)Dr. Asoka Balasuriya B.Sc.(Lond.), Ph.D. (Lond.)Mr. Lakshman Balasuriya B.Sc.(Lond), M.Sc. (Lancaster) Mr. Rohan Balasuriya B. Sc.(E.Ang.), M.Sc. .(E.Ang.)Dr. Mahendra Balasuriya B.V.Sc.Mrs. Lakshmi Fernando B.Sc. (Hons.)Dr. (Mrs.) Gayathri Madan Mohan M.B.B.S.Mr. Cyril Lionel Srimanne Herath B.A. (Cey)Mr. Ajith Fernando FCMA (UK), MA (Colombo)
Company Registration NumberPB 238 PQ
Taxpayer Identification Number (TIN)104028349
Registered Office2nd Floor, No.267, Galle Road, Colombo 3.Tel: 011-2301301Fax: 011-2301937Email: [email protected]
Web Sitewww.senfin.com
SecretariesManagers and Secretaries (Pvt) LimitedNo. 8, Tickell RoadColombo 8.
AuditorsKPMG Ford, Rhodes, Thornton & Co. Chartered Accountants Sir Mohamed Macan Markar Mawatha Colombo 3.
Legal ConsultantsMr. Parakrama Keppetipola (Attorney- at-Law)Mr. M.S. Sultan (Attorney-at-Law)
Internal AuditorsErnst & Young Advisory Services (Pvt) Ltd.No. 839/2, Peradeniya Road,Kandy.
BankersCommercial Bank of Ceylon PLCHatton National Bank PLCSampath Bank PLCHonkong & Shanghai Banking Corporation Limited
Produced by Copyline (Pvt) Ltd Printed by Gunaratne Offset Ltd

Senkadagala Finance Company PLC 1
In an era of change and development, our best laid plans have given us the scope and base to succeed. With extensive training for our employees, and establishing a vision for ourselves that looks into the future, we have had a good performance in the year under review. Our strategies and measures in the past have had concrete effects and we are proud to say that our growth and success resonates from our very foundations.
THE
LAIDPLANS BEST

Annual Report 2010/112
Our vision is to be a leading financial institution in Sri Lanka that delivers high quality services and achieves excellence in all spheres of activity while being socially conscious, at all times.
Our Vision
MissionTo provide a wide range of diversified financial services and to acquire a portfolio of loanable funds that yields an adequate return to our shareholders, whilst safeguarding the interests of our depositors and other providers of funds.

Senkadagala Finance Company PLC 3
ContentFinancial Highlights 6
Chairman’s Review 10
CEO’s Review 14
Board of Directors 18
Corporate Team 22
Management Team 24
Management Discussion and Analysis 28
Financial Review 32
Corporate Social Responsibility 36
Human Resource Management 39
Management of Risk 41
Corporate Governance 43
Financial Contents 48
Annual Report of the Board of Directors
of Senkadagala Finance Company PLC 49
Independent Auditors’ Report 53
Income Statement 54
Balance sheet 55
Statement of Changes in Equity 56
Cash Flow Statement 57
Notes to the Financial Statements 59
Depositor Information 86
Capital Adequacy 87
Relevant Central Bank Directions Applicable
to Registered Finance Companies (RFC) 88
Distribution of Shareholding 90
Sources and Distribution of Funds 91
Ten Year Summary 92
Key Ratios & Indicators 93
Glossary of Financial Terms, Terminology
and Accounting Standards 94
Branch Network 96
Notice of Meeting 98
Form of Proxy 99
Corporate Information Inner Back Cover

Annual Report 2010/114
Net income from operations grew 45% during the year to Rs. 1,023,637,002, topping the Rs. 1 billion mark for the first time in the company’s history. This was achieved by a combination of a concentrated marketing effort spearheaded by a national advertising campaign and judicious management of funding sources so as to optimize interest expenses during the year.
Annual Report 2010/114

Senkadagala Finance Company PLC 5
The ratio of gross non-performing advances improved significantly during the year ended 31 March 2011 to 2.56% from 4.32% in the previous year. This is an excellent result, - well below the industry average and is the result of the training programmes conducted by the company for its staff. The result clearly reflects the effectiveness of the stringent credit standards and vigorous credit evaluation processes employed by the company in managing credit risk during the year.
Senkadagala Finance Company PLC 5
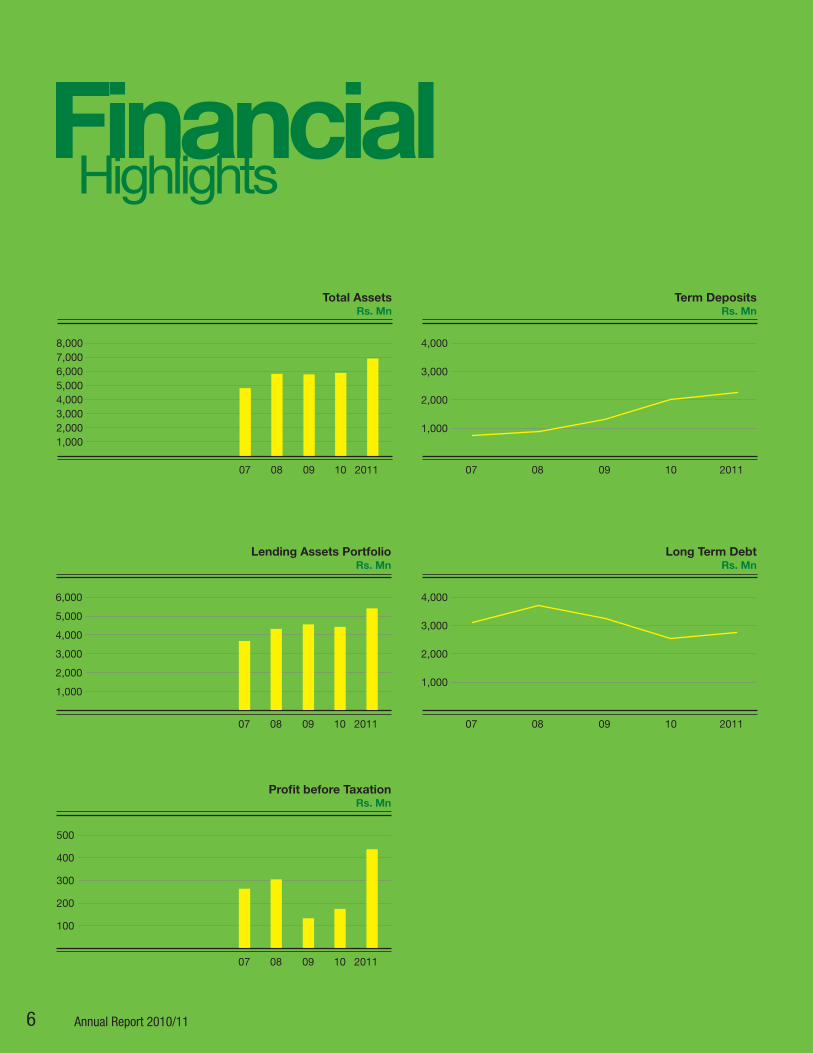
Financial Highlights
Annual Report 2010/116
07 08 09 10 2011
Total AssetsRs. Mn
8,0007,0006,0005,0004,0003,0002,0001,000
07 08 09 10 2011
Lending Assets PortfolioRs. Mn
6,000
5,000
4,000
3,000
2,000
1,000
07 08 09 10 2011
Profit before TaxationRs. Mn
500
400
300
200
100
07 08 09 10 2011
Long Term DebtRs. Mn
4,000
1,000
2,000
3,000
07 08 09 10 2011
Term DepositsRs. Mn
4,000
3,000
2,000
1,000

Senkadagala Finance Company PLC 7
in Rs. Million 2011 2010 % Change
Result for the yearTotal advances disbursed 4,069 2,361 72%Total net flow of term deposits, CDs and accounts 299 696 (57%)Net flow of Securitization (13) (973) 98.67%Capital expenditure incurred 103 104 (1%)Gross income 1,703 1,552 10%Fund based income 1,493 1,452 3%Fee based income 210 101 108%Gross interest cost 679 846 (20%)Interest on deposits 267 273 (2%)Interest on securitization 213 393 (46%)Interest on Debentures 188 151 25%Other Interest Costs 10 28 (64%)Profit before taxation 435 172 152%Profit after taxation 253 55 361%Gross dividends 43 36 19%
Financial Position at year end Shareholders’ funds (Capital and reserves) 1,115 905 23%Total deposit base (fixed deposits, CDs and Savings) 2,393 2,094 14%Loan Securitization (book value) 1,415 1,428 (1%)Advances portfolio 5,402 4,400 23%Total Assets 6,889 5,886 17%
Information per ordinary Shares Earnings per Share (Rs.) 4.75 1.03 361%Dividends per Share (Rs.) 0.81 0.68 19%Net assets per Share (Rs.) 20.89 16.96 23%
Ratios Return on average shareholders’ funds (%) 43.13 19.29 124%Return on average gross assets (%) 6.82 2.96 130%Interest Cost to income ratio 45.50 58.28 (22%)Gross interest cover (times) 1.64 1.20 38%Equity as a % of total assets 16.19 15.37 5%
Fitch Rating BBB+ BBB+
Senkadagala Finance Company PLC 7

Annual Report 2010/118

Senkadagala Finance Company PLC 9
…a creator of bonds, forming relationships, and carrying on a tradition of integrity that is unmatched
Senkadagala Finance Company PLC 9

Annual Report 2010/1110
Chairman’s
In addition to the existing sources of income, we are currently working on developing other streams of income which we hope will boost our revenue in future years.With the resurgence of the sector, the level of public confidence in the sector rose and resource mobilisation improved significantly. Depositors who had invested in alternative sectors during the preceding years returned with restored confidence to the RFC sector spurring the recovery process.
Review

Senkadagala Finance Company PLC 11
S. K. Wickremesinghe Chairman

Annual Report 2010/1112
Chairman’s Review
I have pleasure in presenting to you the Annual Report and Audited Accounts of the company for the financial year ended 31st March 2011.
The paragraphs that follow describe briefly the events of significance which occurred during the financial year ended 31st March 2011 as well as the results of the year and the outlook for the following year.
Significant eventsAs you are aware, the shares of the company were listed on the Diri Savi board of the Colombo Stock Exchange on 22nd March 2011. This was done primarily to comply with the requirement of the Central Bank of Sri Lanka which stipulated that all registered finance companies should list their shares on the stock exchange. The listing is of immense significance to our shareholders as well as to all other stakeholders of the company. The listing of a company’s shares on a stock exchange enhances the inherent value of the shares as well as the company itself and gives greater assurance to everyone dealing with the company. The name of the company will shortly change to Senkadagala Finance PLC, when the procedures currently under way at the Department of the Registrar of Companies are completed.
During the year, the company obtained the approval of the Central Bank of Sri Lanka to open five new service centres. After a detailed survey of the socio-economic environment, it was decided that these branches would be set up in Ampara, Kaduruwela, Kalutara, Tangalle and Vavuniya. This extension of our branch network will help increase our business volumes in the future and will also help with fund mobilisation.
The company was also granted a license to operate as an authorised money changer by the Central Bank. This license permits the company to buy and sell foreign currency along with the other services which it currently provides to its customers. This is a new area of business for us and, initially, 6 branches of the company’s network will engage in money changing. It is intended that, in time, all branches in our network will provide this service to our customers.
The Financial Services sectorTowards the end of the preceding financial year, the government of Sri Lanka reduced the duties applicable to the import of motor vehicles. This was a much needed move to initiate a recovery of both the motor trade as well as the financial services industry, which are dependent on each other. Importers of motor vehicles in the country sell up to 80% of their vehicles utilising the services of a financial services company and the financing of motor vehicles constitute more than 95% of the business of
finance companies. The duty reduction had the desired effect and there was a revival in both industries during the year with considerable increases in business volumes.
The financial services industry generally and the registered finance company (RFC) sector in particular suffered from a general loss of public confidence in the course of the past two years due to the failure of some deposit-taking institutions, authorised and unauthorised. With the resurgence of the sector, the level of public confidence in the sector rose and resource mobilisation improved significantly. Depositors who had invested in alternative sectors during the preceding years returned with restored confidence to the RFC sector spurring the recovery process.
During the year, the Central Bank of Sri Lanka, despite considerable pressure at times, managed both the exchange rates and the interest rates in the market judiciously to ensure there were no sharp or sudden movements, making fund management a great deal easier. In general, interest rates reduced gradually over the year. The downward movement in interest rates created the opportunity for financial institutions which had retained flexibility in their funding to widen their margins in existing portfolios. This helped increase the profitability of the sector to a great extent.
The lower interest rates resulted in a sharp reduction in the cost of borrowing generally and prospective buyers of automobiles were not slow to proceed with their long delayed acquisitions of new vehicles.
The turnaround in the market has been quite remarkable and was very welcome since the financial services industry has had a difficult time in the past two years.
The Company’s performance Along with the rest of the industry, your company achieved high rates of growth in FY 2010/2011. New business executed in FY 2010/2011 grew by 72% in comparison to business transacted in the previous financial year.
Net income from operations was Rs. 1,023,637,002 topping the Rs. 1 billion mark for the first time in the company’s history, with a growth of 45% during the year.
Profit before tax was Rs, 435,584,202 increasing by 152% from Rs. 172,613,839 in the previous year. After providing for tax, we are left with a profit for the year amounting to Rs. 253,370,362 which is an improvement of 361% over the previous year’s comparable profit of Rs. 54,950,696.

Senkadagala Finance Company PLC 13
With the resurgence of the sector, the level of public confidence in the sector rose and resource mobilisation improved significantly. Depositors who had invested in alternative sectors during the preceding years returned with restored confidence to the RFC sector spurring the recovery process.Sri Lanka Economy – Outlook in brief It is generally expected that the economy will continue to grow at or around the current rate of 8%. Barring some unforeseen shocks from external sources, this is very likely to happen, helped by the government’s plans to continue investing in infrastructure and the benefits of the past investment made in infrastructure coming on stream to help boost economic growth. Though there has been some upheaval in the European economies as well as confusion in the US economy and in the Middle East, these issues now appear to be receding with the respective governments taking positive actions.
Registered Finance Company (RFC) sector Locally, the tourism sector and the transport sector appear to have bright prospects for growth in the next few years and this is likely to create business opportunities for the company in the future.
The demand for motor vehicles has slowed, almost imperceptibly, in recent months. There is, however, a large portion of the market which still generates considerable demand, particularly for high-value vehicles to service the construction trade. The demand for smaller, more economical passenger vehicles continues to grow with many new models coming on the market.
It is unfortunate that the current tax structure makes it unprofitable for the leasing industry to lease plant and machinery. If it did not, many companies would engage in machinery leasing which would help boost growth particularly in the microenterprise sector which does not have access to finance other than through the RFCs. It is hoped that this structure will be changed in step with the other changes which the government will be making to streamline the tax structure in Sri Lanka.
The Year Forward In the months since the end of the last financial year, the volume of new business has grown at a very high rate. While this rate of growth may not continue for long all indications are that the company will enjoy a year of unprecedented growth next year.
In addition to the existing sources of income, we are currently working on developing other streams of income which we hope will boost our revenue in future years. One of these is the business of money-changing which I have already touched on in this review.
Appreciation On 1st August, we were pleased to welcome Mr Ajith Fernando, on to the board as a non-executive director. Mr. Fernando is the Group CEO of the Capital Alliance group of companies and is also Deputy Chairman of the Financial Ombudsman’s Office.
My fellow directors have been a source of support and guidance to me throughout the year and I would like to take this opportunity to express my thanks to them.
I must also thank the Chief Executive Officer, the management and staff of the company for their hard work which has led to the excellent results achieved this year.
I would also like to place on record my appreciation of the assistance we have received during the year from the Director and the staff of the Department of Supervision of Non-bank Financial Institutions of the Central Bank of Sri Lanka.
S. K. Wickremesinghe Chairman
Colombo 10th June 2011
Annual Report 2010/1114
CEO’s Review
The company decided to take advantage of the falling interest rates in the market and, at the same time, place our funding on a very secure footing by securitizing more of our receivables and borrowing against the security for longer terms.The company also launched a concentrated marketing campaign in the second half of the year spearheaded by a national advertising campaign in the media. As a result of this campaign, there was a significant increase in new business conducted by the branches in the latter months of the year which, in turn, contributed considerably to the excellent results achieved during the year.
Senkadagala Finance Company PLC 15
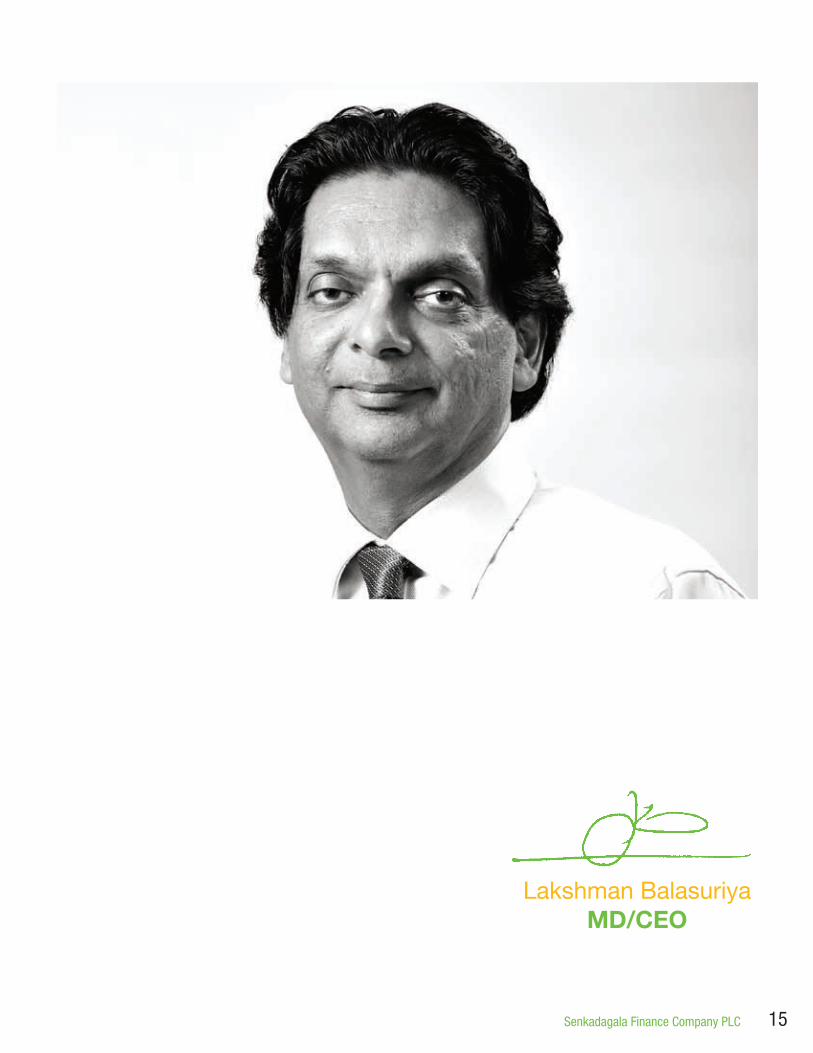
Lakshman BalasuriyaMD/CEO

Annual Report 2010/1116
The previous year was a good one for the industry and for the company. The current year has been even better so far. If this trend continues and all indications are that it will, we will have far better results by the end of the current year.
CEO’s Review
The financial year ended 31st March 2011 was a good year for the financial services industry and for the Company.
With the reduction effected by the government in import duties of motor vehicles, the demand for new motor vehicles which had been suppressed in the past three years as a result of the prohibitive rates of import duties, rose sharply and far out-stripped the available supply. Motor vehicle dealers had, up to that time, run down their inventories to very low levels and the available stocks were all snapped up in a very short period. There is usually a three month lag in deliveries from manufacturers and this held the market back until the new stocks arrived but, after that, the market has been growing each successive month.
While the rates of import duty and their impact on selling prices was the principal reason for the lack of demand for new motor vehicles, there were other events which took place that gave the market an additional boost. Chief among them was, of course, the end of the war. Another important factor was that the Central Bank of Sri Lanka managed the interest rates in the market in a manner that created conditions for easier fund management. No sudden spikes in rates were experienced during the year and rates gradually declined through the year. The lower rates of interest reduced borrowing costs and, consequently, the effective demand for new motor vehicles continued to grow. The accumulated demand for new motor vehicles which had been suppressed over the past three years created an unprecedented growth in the market and this growth was maintained throughout the year.
During the first two months of the year, the company launched a programme to re-train our staff in credit appraisal introducing new, unorthodox methods of evaluating credit. The training covered every staff member, from the most senior to the newest recruit and was conducted by a team of experienced resource persons who had played leading roles in other organisations in the field. The programme was well received by the staff. It helped motivate them and inspired new and innovative thinking. It also had a very beneficial effect on our financial results, with a significant reduction in non-performing assets.
Following upon the success of the training programme in credit appraisal, the management organised separate training programmes on specific aspects of the company’s operations for the staff and this is now a continuing process in the company. It has helped invigorate the operational staff and has increased staff morale.
The company also launched a concentrated marketing campaign in the second half of the year spearheaded by a national advertising campaign in the media. This was followed up by a series of targeted sales campaigns conducted regionally by groups of branches. As a result of this campaign, there was a significant increase in new business conducted by the branches in the latter months of the year which, in turn, contributed considerably to the excellent results achieved during the year. New business conducted during the year, increased by 72% over the previous year. As the greater part of this new business was conducted in the latter half of the year, its impact on profit will mainly be carried forward to the following year.
The company’s portfolio of receivables as at 31st March 2011 was Rs. 7.4 billion, reflecting an increase of 21% from Rs. 6.1 billion at the end of the previous year. In the previous year, our receivables experienced a decline of 7%.
Helped by the declining rates of interest in the market and the fact that a large proportion of our fund base was not tied down in long term debt, we were able to re-negotiate existing lines of credit as well as to negotiate new funding sources at lower costs. In doing so, however, a large proportion of the new funds obtained were tied to long term sources. As a result of these operations, our funding costs declined to 40% of our income, from 54% in the previous year. This was, by far, the most significant contributory factor to our increased profitability during the year.
Net income from operations rose 45% during the year to Rs. 1,023 million from Rs. 706 million in the previous year.
Personnel costs incurred during the year amounted to Rs. 135 million compared to Rs. 115 million in the previous year.

Senkadagala Finance Company PLC 17
Personnel costs were equivalent to 2% of the portfolio of receivables in both years. This is significantly lower than accepted levels in the industry and demonstrates both high productivity and commitment among our staff. Selling expenses incurred during the year amounted to Rs. 108 million, increased from Rs. 89 million in the previous year. As in the previous year, however, selling expenses remained at 6% of total income, in spite of the marketing campaign launched during the latter half of the year, clearly demonstrating that the increased selling cost paid for itself by generating proportionately increased revenues. Total operating expenses incurred during the year was Rs. 523 million compared to Rs. 444 million in the previous year, growing marginally from 29% of total income to 31%.
After deduction of all expenses, we had a profit before providing for possible loan losses and taxes amounting to Rs. 500 million. This is an increase of 91% over the profit before loan losses and taxes in the previous year, which was Rs. 261 million.
As I mentioned earlier in this review, the re-training of staff in credit evaluation has had very significant positive impacts on our results this year. One of these is that the need to make provision for loan losses has dropped considerably. We provided a sum of Rs. 64 million (i.e., a drop of 27% compared to Rs. 89 million in FY 2009/2010) for possible loan losses arriving at a profit before tax of Rs. 435 million. The profit before tax in the previous year was Rs. 172 million and the current year’s profit is an increase of 152% on this figure.
Out of the current year’s profit, we have a charge of Rs. 85 million in respect of Value Added Tax on Financial Services. This tax is only applicable to hire-purchase transactions. The new business we executed during the year had a higher than anticipated component of hire-purchase transactions in our sales mix resulting in a large increase in VAT on Financial Services payable during the year, - equivalent to 152% of the charge in the previous year. Since hire purchase transactions do not qualify for depreciation, we also had less depreciation allowances this year to offset taxes. Consequently, we made an increased provision for tax on our profit, amounting to Rs. 96 million leaving us with a net profit for the year of Rs. 253 million, which still compares favorably to Rs. 54 million earned in the year ended 31st March 2010. It reflects an increase of 361%.
Having paid out interim dividends amounting in total to Rs. 43 million, the directors transferred Rs. 13.5 million to the statutory reserve, Rs. 16.75 million to the investment reserve and Rs. 145 million to the general reserve making the total transfer to reserves equal to Rs. 175 million and retained Rs. 34 million out of the profit for the year, which when set off against the negative balance at the commencement of the year, leaves a balance of Rs. 1.7 million at the end of the financial year.
During the year, your directors utilised the sum of Rs. 320 million out of the general reserve to make a bonus issue of three shares for every two held by the shareholders. Consequently, the stated capital of the company now stands at Rs. 533 million while the general reserve is Rs. 462 million. Together with the statutory reserve and the retained profit, the company’s equity stood at a total of Rs. 1,115 million on 31st March 2011 which is a growth of 23% during the year.
The total assets of the company stood at Rs. 6.8 billion on 31st March 2011, up by 17% from Rs. 5.8 billion on 31st March of the previous year.
During the year, we had a steady inflow of funds from new depositors resulting in a 14% increase of public deposits during the year which stood at Rs. 2.3 billion on 31st March 2011, compared to Rs. 2.0 billion as at 31st March of the previous year.
As I mentioned previously in this review, the company decided to take advantage of the falling interest rates in the market and, at the same time, place our funding on a very secure footing by securitizing more of our receivables and borrowing against the security for longer terms. We have always placed a greater reliance on long term rather than on short term debt though this does result in a slightly higher cost of operational funds. We commenced the year with a short to long term borrowing mix of 46:54 and, despite the increase in public deposits during the course of the year, ended the year with a mix of 47:53 by converting our borrowing to longer terms.
While, as I said at the commencement, the previous year was a good one for the industry and for the company, the current year has been even better so far. If this trend continues and all indications are that it will, we will have far better results by the end of the current year. In order that we could be better positioned to grasp the opportunities available in the market, we are increasing our outreach by setting up more service centres for our customers. At least five more will be set up during this year.
We are also looking into diversifying our income streams so as to reduce our reliance on existing sources. The groundwork for these developments is already in place and we expect they will come on stream before the end of the year.
Lakshman BalasuriyaManaging Director/Chief Executive Officer
Colombo 10th June 2011

Board of Directors
Annual Report 2010/1118
Left to Right:S. K. Wickremesinghe - Chairman, L. Balasuriya - Managing Director/Chief Executive OfficerDr. A. Balasuriya - DirectorDr. M. Balasuriya - DirectorAjith Fernando - Director
Annual Report 2010/1118

Senkadagala Finance Company PLC 19
Not in photographMrs. L. Fernando - DirectorG. D. C. L. S. Herath - DirectorR. Balasuriya - DirectorDr. (Mrs.) G. M. Mohan - Director
Senkadagala Finance Company PLC 19

Annual Report 2010/1120
Board of Directors Contd.
S. K. WickremesingheChairmanB.Sc. (Cey.) (Appointed w.e.f. 1st April 2008)Mr. Wickremesinghe is a well-known business leader, who has in the past chaired the boards of several blue-chip companies including National Development Bank, Commercial Bank of Ceylon, Ceylon Tobacco Company, Chemical Industries (Colombo), and SriLankan Airlines. He was also Sri Lanka’s High Commissioner to the UK from 1995 to 1999.
L. Balasuriya Managing Director/Chief Executive OfficerB.Sc. (Lond.), M.Sc. (Lancaster)Mr. Balasuriya is a director of Senkadagala Hotels Ltd, E.W. Balasuriya & Co. (Pvt) Ltd. and Thompsons Beach Hotels Ltd. He has over 27 years of experience in finance, hotels and other commercial fields.
Dr. A. Balasuriya DirectorB.Sc. (Lond.), Ph.D. (Lond.)Dr. Balasuriya has over 30 years’ experience in the field of gems and jewellery. He is also a director of Senkadagala Hotels Ltd, Thompson Beach Hotels Ltd and is Chairman of E. W. Balasuriya & Co. (Pvt) Ltd.
Mrs. L. FernandoDirectorB.Sc. (Hons.)Mrs. Fernando has many years’ experience in the field of finance as well as in hotel management. She is a director of Thompsons Beach Hotels Ltd, Senkadagala Hotels Ltd and E. W. Balasuriya & Co. (Pvt) Ltd.
Dr. M. BalasuriyaDirectorB.V.Sc.Dr. Balasuriya is a director of Senkadagala Hotels Ltd, E. W. Balasuriya & Co. (Pvt) Ltd. and Thompsons Beach Hotels Ltd. He has over 27 years of experience in hotels and related fields.

Senkadagala Finance Company PLC 21Senkadagala Finance Company PLC 21
Ajith FernandoDirectorMr. Fernando is a Fellow member of the Chartered Institute of Management Accountants of the United Kingdom and has a MA in Financial Economics from the University of Colombo. He counts over 20 years’ experience in the capital markets of Sri Lanka. In 2000, he founded Capital Alliance in partnership with Asia Capital Ltd. Currently he is the group CEO of the Capital Alliance group which includes Capital Alliance Ltd., a primary dealer of government securities, appointed by the Central Bank of Sri Lanka and Capital Alliance Securities (Pvt) Ltd, a trading member of the Colombo Stock Exchange. In addition, he serves on the boards of HDFC Bank PLC and many private companies. He is Deputy Chairman of the Financial Ombudsman’s office and a director of the Lanka Financial Services Bureau.
G. D. C. L. S. HerathDirectorB.A. (Cey.)Mr. Herath is a distinguished public servant having served for many years as the Inspector General of Police of Sri Lanka. He was later appointed the Secretary of Defence. From 1994 to 2004, Mr. Herath served as Chairman of the National Savings Bank of Sri Lanka.
R. BalasuriyaDirectorB.Sc. (E. Ang.), M.Sc. (E. Ang.)Mr. Balasuriya is a director of Senkadagala Hotels Ltd, E. W. Balasuriya & Co. (Pvt) Ltd and Thompsons Beach Hotels Ltd. He has over 25 years’ experience in finance and other related fields.
Dr. (Mrs.) G. M. MohanDirectorM.B.B.S.Dr. Madan Mohan is an experienced medical consultant practising in the U.S.A. She is also a director of Senkadagala Hotels Ltd, E. W. Balasuriya & Co. (Pvt) Ltd and Thompsons Beach Hotels Ltd.

Annual Report 2010/1122
Corporate Team

Senkadagala Finance Company PLC 23
Left to Right Standing:Keerthi Aturupana (Assistant General Manager - Accounts), Jagath Jayatilake (Assistant General Manager - Operations)
Left to Right Seated:Lalith J. de Alwis (Deputy Chief Executive Officer), Timothy De Silva (Assistant General Manager - Information Technology), Pradeep Ikiriwatte (General Manager).

Annual Report 2010/1124
Management Team
Left to Right Standing:Mahesha Thrimanne (Manager - Compliance & Legal), Vajira Bandara (Manager - Recoveries), Denzil Hettiarachchi (Chief Manager - Credit)
Left to Right Seated:Shankar Supramaniam (Manager - Treasury), Raj Fernando (Manager - Personnel & Administration), M. M. Ariyaratne (Manager - Recoveries), O. Sethupathi (Manager - Deposits)
Not in photographIsha Dias (Manager - Deposits), Nandalal Rasingolla (Manager - Information Technology)

Senkadagala Finance Company PLC 25
Left to Right Standing:Roshan Jayasinghe (Regional Manager), Ravindra Dasanayake (Regional Manager), Shamila Mendis (Regional Manager), Sisira Herath (Manager - Legal)
Left to Right Seated:Krishnaveni Kumarakurubaran (Senior Secretary), Nihal Karunaratne (Chief Manager - Recoveries), Kumudu Rajapaksa (Chief Financial Officer), Thushara Ranathunga (Internal Auditor)

Annual Report 2010/1126 Annual Report 2010/1126

Senkadagala Finance Company PLC 27
…sustainable, resilient and adaptable; ready to take on challenges in an ever changing world
Senkadagala Finance Company PLC 27

Annual Report 2010/1128
Management Discussion and AnalysisGlobal Economic ConditionsGlobal economic activity in the latter part of 2010 turned out to be stronger than expected. The year 2010 witnessed a growth rebound for the world economy to 5% from a negative 0.8% in 2009. However, the uneven pace of growth across regions and uncertainty about the durability of recovery in the advanced economies persist. The positive sentiments arising from the growth momentum in major advanced economies was neutralised by the persistence of high unemployment and downside risks seen across various markets. The combination of these developments resulted in additional policy stimulus. While unprecedented monetary and fiscal stimulus helped to push growth in the US to its pre-crisis levels in the year 2010, other advanced economies faced a difficult choice between delaying fiscal exit to support growth and early exit to contain sovereign debt concerns. The risk of sovereign debt crisis spreading from the Euro-zone periphery has resurfaced in recent months.
On the other hand, in the Middle-East and North Africa, the political turmoil in the region has had a notable impact on activity.
The global financial crisis is no longer the major force dictating the pace of economic activity in Emerging Market Economies. Most Emerging Market Economies have regained near full-capacity activity levels. Inflation and overheating risks have, however, prompted monetary tightening at varied pace. Commodity prices also firmed up, largely reflecting easy liquidity conditions in advanced economies, as well as growing demand pressures in Emerging Market Economies.
Overall, global growths for 2011 is projected to be lower than 2010, before picking up in each of 2012 and 2013. The slowdown for high-income countries mainly reflects weak growth in Japan due to the after-effects of the earthquake and tsunami.
For developing countries also growth is projected to decline between 2010 and 2012 before firming somewhat in 2013, reflecting an end to bounce-back factors that served to boost growth in 2010 and the tightening of monetary and fiscal policies as capacity constraints become increasingly binding.
Sri Lankan Economic ConditionsThe year has begun with much economic optimism, with a substantial recovery in private sector credit growth and investor confidence after the end of the civil war. In 2010, the Sri Lankan economy grew by an impressive 8% and the projection of growth for 2011 is 8.5% to 9%. If this were to be realised and sustained, then the economy is on track to achieve its short-term and medium-term targets.
Growth momentum was propelled by broad-based growth across Industry subsectors. Growth in Services, both government and private services, remained strong and a strong growth in tourist arrivals and sustained activity in tourism-related segments have helped the economy to record its highest growth rates in the recent past.
Inflation, as measured by the Colombo Consumer Price Index (CCPI) was broadly stable in the last year. Inflationary pressures have been subdued due to moderate increases in imported commodity prices and benign demand pressures in the domestic economy. Inflation is expected to remain within single digit level in the next year. The unemployment rate was also at historically low levels.
The overall budget deficit continues to decline and is expected to decline further to around 5 per-cent of GDP in the medium term.
After the end of the war, CSE indexes increased rapidly creating new records. Market capitalisation at the Colombo Stock Exchange reached record highs showing investor confidence in the country’s future prospects. CSE was one of the best performing stock exchanges in the world in 2010.
Finance sector developments and outlookBoth bank and non-bank financial institutions displayed impressive performance in 2010, reflecting the increase in financial transactions to facilitate the growing economy.
After seeing liquidity problems in year 2009, registered finance companies (RFC) recovered in 2010. At the end of 2010, the total number of registered finance companies increased to 37, while their branch network increased significantly from 98 branches to 376 branches. The asset base of RFCs increased

Senkadagala Finance Company PLC 29
by 26% in 2010 and the total pre-tax profit of all RFCs increased to LKR 2.2 billion from a loss of LKR 1.2 billion in the year earlier mainly due to the decline in interest rates and increased economic activity.
The RFCs’ finance leasing and hire-purchase business consists mainly of financing of purchases of new motor vehicles. There is, therefore, a close correlation between the automobile market in Sri Lanka and the market for the financial services of RFCs in Sri Lanka.
In the latter part of the previous financial year, the government reduced the import duty on new motor vehicles. However, the effect of this reduction was felt only after 3 months which is the time frame necessary to effect new deliveries to the market. The suppressed effective demand for new motor vehicles burst upon the market causing a huge surge in demand for new vehicles which automobile dealers were able to cater to with the greatest difficulty.
This surge in demand was also seen in the demand for financial services of the RFCs in FY 2010/2011. Demand was high throughout the year and continued to grow month-on-month. This trend has extended in to the first half of FY 2011/2012.
A further boost to the market has been the effective management of interest rates by the Central Bank of Sri Lanka which has brought about a gradual reduction of interest rates. RFCs passed this benefit on to the consumer by reducing the rates at which new business was executed. This added a further impetus to the market and demand continued to remain high fuelled by the lower cost of borrowing to purchase new motor vehicles.
Business ReviewThe Company continued to gain public confidence and strengthened its position in the market through implementing strategic initiatives set in the beginning of the year. With a clear focus on leasing and hire purchase business the company was able to withstand intensified competition from its peers.
During the last year, the company took its achievements to even greater heights by successfully completing its listing on the Colombo Stock Exchange by listing 53.3 million ordinary voting shares on the Diri Savi board. In the move towards going public, the company officially changed its name from Senkadagala Finance Company Limited to Senkadagala Finance Company PLC.
With the huge surge in demand, the company felt it was an appropriate time to introduce more stringent standards of credit in its operations and, more importantly, more effective and practical measures of credit evaluation. Accordingly, the company embarked on a crash program to re-train its entire staff in credit evaluation. The programme was conducted in-house by outside resources. It was very well received by the staff and a great deal of interest and enthusiasm was evident throughout the execution of the programme. The exchange of ideas and practical experiences were very useful in helping to restructure and to refine our working processes.
The beneficial effect of the strategy is clearly evident in the improved performance of the company’s portfolio and the sharp reduction in our NPA ratio at the end of the year.
The training has in itself acted to boost the morale of our staff as it was continued through the year. Staff at all levels received continuous training through the year and skill levels were upgraded resulting in improved service quality while the market continued to provide us with the opportunity to expand our business. It is intended that this continuous training process will be a permanent fixture in future years as well.
The company maintained its focus strategy in hire purchase and leasing business without overly diversifying in to other areas and during the year the company aggressively undertook a marketing campaign to increase its hire purchase and lease portfolio to make use of the reduction of import duty on vehicles.
During the year, the company’s loans and advances grew by an impressive 23% reflecting the favorable macro and the micro conditions that prevailed during the period.

Annual Report 2010/1130
Hire Purchase Hire purchase business remained the main contributor to the company’s revenue and the portfolio grew by an impressive 18% to Rs. 3.8 billion from Rs. 3.2 billion. The interest income from the hire purchase portfolio grew by 15% in the year 2010/2011.
LeasingThe leasing portfolio saw a phenomenal growth of more than 60% to Rs. 1.46 billion reflecting the effects of reduced taxes on importing brand new and reconditioned vehicles and the effectiveness of the marketing campaign undertaken by the company.
While leasing and hire purchase portfolios contributed to 83% of the total revenue of the company, the hire purchase portfolio generates relatively higher interest income as a percentage of the total portfolio.
Recovery and NPA ManagementThe company continued its journey in improving its performance in the area of NPA management in the year 2010-11 as well. Reduction of NPAs is given utmost priority at the company and this function has steadily grown in importance.
Each branch was given its own NPA target for the year concerned and they were aggressively monitored. This combined with the effective training program conducted during the year contributed significantly to reduce the company’s NPA ratio level well below the industry average.
The following table shows the management of NPAs during the last 5 years:
2007 2008 2009 2010 2011
NPL Ratios 6.35% 6.25% 3.53% 4.32% 2.56%
FundingThe company’s main sources of funds are fixed deposits, securitised loans and debentures, apart from shareholders’ equity.
Fixed deposits accounted for 45% of non-equity funding and securitised loans and debentures together formed 53% of non-equity funding.
Total equity of the company stood at 17.8% of the total funding as at 31st March 2011.
07 08 09 10 2011
Growth in Loans and AdvancesRs. Mn
6,000
5,000
4,000
3,000
2,000
1,000
Management Discussion and Analysis Contd.
Interest Earning Asset Distribution%
LeasingHire PurchaseOther AdvancesInvestments
25%
66%
3%6%
Interest Income Distribution%
LeasingHire PurchaseOther AdvancesInvestments
15%
68%
13%4%

Senkadagala Finance Company PLC 31
The distribution of the interest expense from various sources is depicted below.
The company has funded its loan growth primarily through securitisations, and thereby limited the asset liability mismatch and in turn contained liquidity risk.
Capital AdequacyThe company has always maintained an adequate capital base. For the financial year 2010-11, the company recorded a core capital ratio of 17.7%, more than three times the minimum statutory requirement of 5%.
The company’s Total Risk Weighted Capital Ratio of 17.7% was also well above the minimum statutory requirement of 10%.
Branch Network and ExpansionThe company has a geographically well-spread branch network in the country. The company had 30 branches throughout the island at the end of March 2011. Even though no new branches were added to the network in the year 2010-11, five new service centers were added to the company’s network increasing its reach to its target market further.
Risk Management and ControlThe recognition and management of risk is at the core of the business of the company. Risk management, to the company, does not mean minimising its risk; rather, the goal of risk management is to optimise the risk-reward trade – off for the company. With this perspective, the company has developed a robust and integrated risk management framework to ensure that the company accepts only those risks that can be tailored to fall within the company’s defined range and can be adequately compensated in terms of return .
The process of risk management consisting of various stages i.e. identification, measurement, monitoring and control, is covered in its organisational policies.
The company is also preparing for migration to more sophisticated approaches for enhancing the effectiveness and robustness of risk management systems.
Information SystemsThe company has been operating with a fully computerized IT system which encompasses all the functional modules. This includes leasing, recoveries, funding and insurance activities along with an online general ledger. Apart from the core business, human-resource management functions and the payroll process are also fully computerized.
The effective use of IT has been the driving force behind the company’s cost and operational efficiencies. The company’s proprietary IT system enables prompt collection of receivables and cost management, which have been translating into better financial performance. The system was developed in-house and is being continuously fine-tuned.
Interest Bearing Liabilities Distribution%
Fixed DepositsCertificates of DepositSavings DepositsSecuritised LoansDebenturesCorporate Loans
44%
2%
26%
27%
1%
Interest Expense Distribution%
Fixed DepositsCertificates of DepositSavings DepositsSecuritised LoansDebenturesCorporate Loans
38%
1%
28%
31%
2%

Annual Report 2010/1132
Financial Review
Financial HighlightsThe company recorded an operating profit of Rs. 500 million, (growth of 91% over previous year). Net Profit stood at Rs. 253 million, recording a phenomenal growth of 361%.
Net interest income grew by 34.3% on the backdrop of rise in loans and advances by 22.8% (from Rs. 4,400 million to Rs. 5,401 million). Other operating income increased by 108.5% and covered 40.1% of operating expenses as against 22.6% in the previous year.
The key financial performance of Senkadagala Finance Company PLC for the year 2010-11 is summarised below:
2010-11 2009-10 Change
Interest Income (Rs. millions) 1,493 1,452 2.9%Interest expenses (Rs. millions) 679 846 -19.7%Net interest income (Rs. millions) 814 606 34.3%Profit for the year (Rs. millions) 253 55 361.1%Loans and advances (Rs. millions) 5,402 4,400 22.8%Total assets (Rs. millions) 6,889 5,886 17.0%Return on average shareholders’ funds (%) 43.13 19.29 123.6%Return on average gross assets (%) 6.82 2.96 130.4%Net Interest income ratio (%) 54.50 41.74 30.6%Net Interest margin (%) 15.52 12.75 21.7%
Interest IncomeEven though loans and advances grew by 22.8% during the year, interest income only increased by 2.9% reflecting the effect of lower market interest rates which prevailed in the period under review. This reflects a reduction in the average yield from the company’s interest earning assets compared to the previous year.
Interest ExpenseSenkadagala Finance Company PLC was able to grow its deposit base by 14% to Rs. 2,393 million and this in turn helped the company in reducing its interest expenses by 19.7%. This in turn resulted in a 34.3% increase in the net interest income for the period. Despite the impressive growth
in the deposit base, the interest paid on the deposits reduced by 2%. The securitised loan balance was stable when compared to the previous year’s figure. However, the total interest cost paid for securitised loans reduced significantly by 46%. The outstanding balance of debentures increased by 22% while interest paid on debentures increased by 25%.
When a five year time horizon is considered, a clear shift in the interest expense mix can be observed. Over time, interest on deposits and debentures has increased while interest paid on securitised loans has decreased.
2010-11%
Interest on DepositsInterest on Securitised LoansInterest on Debentures
40%
32%
28%
2009-10%
Interest on DepositsInterest on Securitised LoansInterest on Debentures
33%
48%
19%
07 08 09 10 2011
Interest Expense%
Interest on DepositsInterest on Securitised LoansInterest on Debentures
100908070605040302010

Senkadagala Finance Company PLC 33
Net Interest Income RatioNet interest income ratio as measured by net interest income as a percentage of total interest income improved significantly from 41.74% to 54.50%, reflecting the improved efficiency of the company’s operations and effectiveness of the training programs that were conducted.
As can be seen from the graph below, there was a marked improvement in the net interest income ratio in the current year when compared with the last two years.
Operating expenses increased slightly from Rs. 444.63 million from a year earlier to Rs. 523.24 million in the year 2010-11.Profits from operations increased by 91.1% while the profit after tax increased by a phenomenal 361.1%.
Loans and AdvancesOf the Rs.1.1 billion growth in loans and advances (22.8% increase from the previous year), Rs. 551 million came from the leasing portfolio while Rs. 582 million came from the hire purchase portfolio.
Other Operating IncomeThere was a significant improvement of the other operating income in the year 2010-11. Other operating income grew by an impressive 108.5% from Rs. 101 Million to Rs. 210 Million. This was mainly due to gains from bad debt recovery and capital gains on equity investments.
Operating Expenses 2010-11 2009-10
Personnel costs (Rs. million) 135.24 115.92Depreciation of property, plant and equipment (Rs. million) 73.79 72.55Amortization of intangible assets (Rs. million) 6.86 5.94Directors’ emoluments (Rs. million) 6.82 3.21Other operating expenses (Rs. million) 300.52 247.00Operating expenses 523.24 444.63Operating expenses/Interest income 35.04% 30.63%
It is evident from the above graph that there has been a steady growth in the hire purchase portfolio during the last five years and the leasing portfolio has also performed well except for the year 2010.
ProfitabilityDuring the year 2010-11, there was a remarkable improvement in the return on average shareholder funds. The ratio for 2010-11 stood at 43.13% well above the previous year’s 19.29% and the industry average.
07 08 09 10 2011
Interest ExpenseRs. Mn
Interest IncomeNet Interest IncomeNet Interest Income Ratio
1,8001,6001,4001,2001,000
800600400
60%
50%
40%
30%
20%
200 10%
07 08 09 10 2011
Loans and AdvancesRs. Mn
Finance LeasesHire Purchase Advances
4,0003,5003,0002,5002,0001,5001,000
500
07 08 09 10 2011
Profitability%
5045403530252015105

Annual Report 2010/1134
Return on Equity can be decomposed in to multiplication of three ratios to better understand the drivers of the movement of return on average shareholder funds.
Return on average shareholder funds is equal to the multiplication of the following three ratios.
1. Net Income/Interest Income2. Interest Income/Average Total Assets3. Average Total Assets/Average Shareholder Funds
As can be seen from the graph below, the return on equity has been mainly driven by the improvement in the net income ratio (Net income/Interest income).
Average total assets of the company have been increasing gradually in the last five years.
The growth of the asset base was mainly funded by the increase in the deposit base while debentures and equity also contributed. Securitised loan balances were stable from the previous year.
DividendA dividend at the rate of Rs. 0.81 per share for the year has been declared. This is a 19% increase from the previous year’s Rs. 0.68 per share.
Capital AdequacyThe net worth of the company in FY 2010-11 has increased to Rs. 1,115 million from Rs. 905 million. In November 2010, in a bonus issue, company issued three shares for every two shares held. This increased the company’s ordinary shares by 32,020,800 to 53,368,000.
07 08 09 10 11
Interest ExpenseRs. Mn
Return on Average Shareholders’ FundsNet Income/Interest IncomeInterest Income/Average Total AssetsAverage Total Assets/Average Shareholder Funds
60%
50%
40%
30%
20%
9
7
5
3
10%1
8
6
4
2
07 08 09 10 2011
Total AssetsRs. Mn
7,000
6,000
5,000
4,000
3,000
2,000
1,000
2010-11
FundingRs. Mn
3,000
2,500
2,000
1,500
1,000
500
DepositsSecuritised loansDebenturesEquity
2009-10
07 08 09 10 2011
Capital AdequacyRs. Mn
1,200
1,000
800
600
400
200
Financial Review Contd.

Senkadagala Finance Company PLC 35
As can be seen from the graph above, the net worth of the company has been increasing at an impressive rate over the last five years. Capital adequacy ratios indicate the adequacy of the company’s aggregate capital in relation to the risks, which arise from its assets and off balance sheet transactions, its dealing operations and its human activities, technology and natural incidents. The Central Bank of Sri Lanka has prescribed the minimum statutory limit for the capital adequacy in an attempt to ensure that a minimum capital, commensurate with risks assumed by the company, is maintained as a buffer to absorb foreseeable future credit, market and operational losses. In accordance with regulatory guidelines, the company’s Capital Adequacy Ratio was at 17.66%, which was significantly higher than the regulatory requirement of 5%. This was also a marginal improvement from the previous year.
Details of Capital Adequacy are shown below:
2010-11 2009-10
Core Capital (Tier 1) Rs. mn. 1,098.29 904.9Total Capital Base (Tier 2) Rs. mn. 1,098.29 904.9Core Capital Ratio. 17.66% 17.49%Total Risk Weighted Capital Ratio 17.66% 17.49%Capital Funds to Total Deposit Ratio 45.9% 43.2%
Capital funds to total deposits ratio was also more than 8 times the minimum regulatory requirement.
Asset Quality 2010-11 2009-10
Total Advances Rs. Mn 5,678.18 4,686.00 Gross Non-Performing Advances Rs. Mn 145.10 202.23 Net Non-Performing Advances Rs. Mn 63.41 135.78 Gross Non-Performing Advances Ratio Rs. Mn 2.56% 4.32%Net Non-Performing Advances Ratio Rs. Mn 1.12% 2.90%
The past year saw a marginal reduction in the net non-performing advances ratio from 2.9% to 1.12%. The gross non-performing advances ratio improved significantly from 4.32% to 2.56%. These statistics are well below the industry average and reflects the effectiveness of policies and procedures employed by Senkadagala Finance Company PLC in managing credit risk.

Annual Report 2010/1136
Corporate Our ResponsibilityWe define corporate social responsibility strategically. Corporate social responsibility encompasses not only what companies do with their profits, but also how they make them. It goes beyond philanthropy and compliance and addresses how companies manage their economic, social, and environmental impacts, as well as their relationships in all key spheres of influence: the workplace, the marketplace, the supply chain, the community, and the public policy realm.
The term “corporate social responsibility” is often used interchangeably with corporate responsibility, corporate citizenship, social enterprise, sustainability, sustainable development, triple-bottom line, corporate ethics, and in some cases corporate governance. Though these terms are different, they all point in the same direction. There has been a sharp escalation in the social roles which corporations are expected to play. Companies are facing new demands to engage in public-private partnerships and are under growing pressure to be accountable not only to shareholders, but also to stakeholders such as employees, consumers and local communities.
Our StaffHere at Senkadagala Finance Company PLC, one of our greatest assets is our team and we are on a constant mission to ensure that they are performing at their peak, satisfied and recognized for their input and success. It is with this in mind that we have many programmes that involve recognition and succession planning and following through with HR practices which is high priority within the company. We also believe in staff career development, staff improvement, evaluation of achievements, rewards and most importantly, health and safety which is covered by the Suwa Sampatha health insurance scheme.
Our ProjectsStarted by the Sisters of the Good Shepherd Convent Kotahena more than 30 years ago, the ‘Kusum Sevana’ Day care/ Pre School on Bloemendhal Road in Colombo 15 was created in order to cater to children who did not have access to proper food or education. Mostly from broken or negligent families, the children would call the street their home. This institution was a means of caring for and protecting those
Social Responsibility

Senkadagala Finance Company PLC 37

Annual Report 2010/1138
that do not have the means to look after themselves. The school survives mainly on donations received from charitable organisations and companies and individuals. The school currently has 130 students, for whom we have provided for and continue to be a source of assistance.
The Meemure Kanishta Vidyalaya is located in the Knuckles Mountain Range, in the Hunnasgiriya area. Situated in an impoverished village of about 300 individuals for whom farming and agriculture is the main source of livelihood, the area is practically cut off from civilization which has forced
the village to be self sufficient. Adding to the burden is the lack of proper roadways resulting in villagers having to trek through the thick jungle in order to access different areas. The school in itself has only 23 students and is unable to provide education for these students beyond the 5th Grade. Due to the isolated nature of this area, villagers often migrate to other parts of the country in search of jobs and a better life. Senkadagala Finance Company PLC has provided school uniforms, clothes, stationery and shoes to the students in order to enhance their education. We also built a reliable piping facility in order to provide clean water for the students.
Corporate Social Responsibility Contd.

Senkadagala Finance Company PLC 39
Human Resource Management
Staff Gender%
MaleFemale
83%
17%
Staff Age Analysis%
20 - 3031 - 4041 - 50> 50
69%
8%
16%
7%
Analysis by Qualification%
Full ProfessionalPart ProfessionalPost GraduateGraduateDiploma HoldersA/L Qualified
8%
14%
28%48%
2%
Analysis by Years in Service%
< 5 years5 - 10 years10 - 20 Years> 20 years
58%
10%
28%
4%
Human Resource Management (HRM) is the function within an organisation that focuses on recruitment of, management of, and providing direction for the people who work in the organisation. Human Resource Management can also be performed by line managers.
Human Resource Management is the organisational function that deals with issues related to people such as compensation, hiring, performance management, organisational development, safety, wellness, benefits, employee motivation, communication, administration and training.
Human Resource Management is also a strategic and comprehensive approach to managing people and the workplace culture and environment. At Senkadagala Finance Company PLC, we believe that effective HRM enables employees to contribute effectively and productively to the overall company direction and the accomplishment of the organisation’s goals and objectives.
As times change, we have realised that Human Resource Management is moving away from traditional means. HRM is now expected to add value to the strategic utilisation of employees and that employee programs impact the business in measurable ways. The new role of HRM involves strategic direction and HRM metrics and measurements to demonstrate value.
HRM at SFCLTraining and Development Training and development is an ongoing process at Senkadagala Finance Company PLC. Our state-of-the-art training centre in Wattala has the ability to accommodate 30 individuals at any given time. By ensuring that our staff has the access to the most comprehensive and latest methods, we are creating a team that is better prepared to take on the challenges that come with working for a leading financial institution.
Training and development occurs based on the following premises and a schedule is created every year by the staff.
• to train and impart knowledge on a specific topic e.g. credit evaluation and recovery processes
• as part of our continuing professional development• when a performance appraisal dictates that performance
improvement is required in particular aspect• for the operation of a new performance management
system• as part of succession planning to help an employee be
eligible for a planned role change in the organisation.

Annual Report 2010/1140
Selection and Recruitment In today’s rapidly changing business environment, a well defined recruitment policy is necessary for organisations to respond to its human resource requirements in time. Therefore, it is important to have a clear and concise recruitment policy in place, which can be executed effectively to recruit the best talent pool for the selection of the right candidate at the right place quickly. Creating a suitable recruitment policy is the first step in the efficient hiring process. A clear and concise recruitment policy helps ensure a sound recruitment process.
The recruitment policy of our Company • Focuses on recruiting the best potential people• Ensures that every applicant and employee is treated
equally with dignity and respect• Has an unbiased policy.• To aid and encourage employees in realising their full
potential.
• Is based on transparent, task-oriented and merit-based selection.
• Considers during selection, the factors that suit organisational needs.
• Optimises manpower at the time of selection.• Defines the competent authority to approve each selection.• Abides by relevant public policy and legislation on hiring
and employment relationship.• Integrates employee needs with the organisational needs.
Staff welfare and Employee Relations As people are our most valuable asset, the health and well being of our employees is one of the most important aspects of our HR programme. Healthy employees in turn are happy workers and at Senkadagala Finance Company PLC, we ensure that our team is looked after and this is one of our greatest investments. Thereby, we have pledged to create a safe and secure workplace in which employees are able to reach their full potential.
TRAINING PROGRAMME SCHEDULE from 01st April 2010 to 31st March 2011
17.05.2010 – 20.05.2010 Credit Evaluation, Laws of Contract, Marketing & Customer Service Branch Managers, Executives
31.05.2010 – 03.06.2010 Credit Evaluation, Laws of Contract, Marketing & Customer Service Branch Managers, Executives
07.06.2010 – 10.06.2010 Credit Evaluation, Laws of Contract, Marketing & Customer Service Branch Managers, Executives
14.06.2010 – 17.06.2010 Credit Evaluation, Laws of Contract, Marketing & Customer Service Branch Managers, Executives
*31.07.2010 Leasing & Hire Purchase (FHA Seminar) Regional Managers, Manager Recoveries Manager Legal,
*07.09.2010 Anti Money Laundering/ combating Financing Awareness Programme Kurunegala District
Senior Executives Secretaries
*25.09.2010 Workshop on Leasing, Negombo Executives
*02.10.2010 Workshop on Leasing, Galle Executives
*13.09.2010 – 17.09.201004.10.2010 – 08.10.2010
Comprehensive Seminar on IFRS SFO, Accounts Assistant
04.11.2010 – 05.11.2011 Legal Awareness Programme Branch Managers, Executives
11.11.2010 – 12.11.2011 Legal Awareness Programme Branch Managers, Executives
19.11.2010 Effective Secretarial Duties & Customer Service Secretaries
*22.01.2011 Credit Evaluation Techniques Executive
*15.02.2011 Training on the correct interpretation of Credit Report Executives, Secretaries
*21.02.2011 Training on the correct interpretation of Credit Report Executives, Secretaries
*28.02.2011 Training on the correct interpretation of Credit Report Executives, Secretaries
*07.09.2010 Anti Money Laundering/ combating Financing Awareness Programme Galle District
Managers, Executives
* Outdoor training Programmes & Workshops
Human Resource Management Contd.

Senkadagala Finance Company PLC 41
Management The company’s risk management strategy is based on a clear understanding of various risks, disciplined risk assessment and measurement procedures and continuous monitoring. Risk is an integral component of the business model of any finance company. Accordingly, the purpose of risk management is that the institution properly identifies measures and handles risks and prepares adequate reports on all these efforts so that the extent of risks which the company has assumed have been compensated with adequate return. With this in mind the company has established and operates mechanisms, which ensure the ongoing assessment of relevant risk types on an individual basis and of the overall risk position of the organization.
At Senkadagala Finance Company PLC, the board of directors approves the Integrated Risk Management Policy, which sets the objectives, principles, processes and responsibilities for risk management within the company. The policy sets guidelines for defining, quantifying, monitoring and reporting financial risks. The Integrated Risk Management Committee, which is a subcommittee of the board, is responsible for reviewing the effectiveness of risk controls and procedures including the identification, assessment and reporting of risks and the risk-governance structure and compliance with risk-control policies, procedures and regulations.
More specifically, the committee is responsible for ensuring• integrity and adequacy of the risk management function of
the company• adequacy of the company’s capital • risk exposures and risk profiles of the company are within
acceptable parameters and to make recommendations to the board of directors on any action required
• the compliance of the company’s operations with relevant laws, regulations and standards
The company is primarily exposed to credit risk, market risk, liquidity risk, operational risk and regulatory risk.
Credit RiskCredit risk is the risk that a borrower is unable to meet its financial obligations to the lender. In order to manage
credit risk, the company has established robust policies for credit appraisal and staff is regularly trained in evaluating creditworthiness of prospective clients. Senkadagala Finance Company PLC manages high-risk sectors through sector restrictions that require prior high-level clearance before taking on new exposures even for small amounts. Once credit facilities are funded, they are continually monitored to identify changes in risk profiles. Further, sourcing and approval of clients are segregated to achieve independence. Recovery and NPA management are also given greater emphasis and are aggressively monitored.
Market RiskMarket risk is the risk of potential losses accruing through adverse fluctuation in market interest rates, equity prices and exchange rates. Of these markets risks, the more frequent and most likely is the risk of adverse fluctuation of interest rates. The effect of such adverse movements could have an immediate and direct bearing on the company. Interest rate risk is the risk of loss in the net interest income of the company due to adverse changes in market interest rates. The company routinely assesses its asset and liability profile in terms of interest rate risk and, depending on this assessment, necessary realignments in the asset and liability structure are undertaken.
Liquidity RiskLiquidity risk is the risk of inadequate resources to meet financial obligations in time and in full, at an acceptable cost. As was seen in some finance companies in the recent past liquidity risk can pose serious threats to the existence of finance companies. The company understands the importance of a robust liquidity risk management policy and constantly monitors the liquidity position of the company. Senkadagala Finance Company PLC has maintained healthy liquid assets portfolio constantly and for the year 2010-11, the liquid asset ratio was 26.75 percent, well above the minimum statutory requirement of 10 percent. Government Securities to Average Deposits Ratio was recorded at 8.85 percent which is more than the minimum statutory ratio of 7.5 percent.
of Risk

Annual Report 2010/1142
Operational RiskOperational risk is the risk of loss resulting from inadequate or failed internal processes, people and systems and from external events. Senkadagala Finance Company PLC manages operational risks in a variety of ways. These include maintaining a comprehensive system of internal controls including disaster recovery plans and business continuity plans, using technology to automate processes and reduce manual errors, monitoring and analyzing risk, events and trends, employing experienced staff, monitoring business activities by compliance and audit professionals, requiring education and training of employees, and emphasizing the importance of management oversight.
Regulatory RiskRegulatory risk is the risk of non-compliance with applicable legislation, regulation and regulatory directives. Senkadagala Finance Company PLC manages day-to-day regulatory risk primarily by educating and training employees about regulatory requirements, establishing and maintaining appropriate policies and procedures, and monitoring for compliance. The company has appointed a Compliance Officer for communicating regulatory requirements to each business unit, ensuring that business units have appropriate policies and procedures in place and that staff are trained to meet regulatory requirements and for tracking, escalating and reporting significant issues and findings to senior management and the Board. Compliance with regulatory requirements is also documented through formal procedure manuals for each business unit.
Reputation RiskReputation risk is the risk to earnings, capital or brand arising from negative public or employee opinion. A company’s reputation is a valuable business asset in its own right, essential to optimizing shareholder value. Reputation risk cannot be managed in isolation from other forms of risks, since all risks can have an impact on reputation, which in turn can impact the brand, earnings and capital. Credit, liquidity, interest rate, operational, and regulatory risks must all be managed effectively in order to safeguard the Company’s reputation.
Management of Risk Contd.

Senkadagala Finance Company PLC 43
Corporate The Company has recognised the importance of establishing principles of corporate governance in running the affairs of the company and has adopted the majority of good governance practices stipulated by the Institute of Chartered Accountants of Sri Lanka (ICASL) and other regulatory authorities including the Central Bank of Sri Lanka. The company’s policy of employing principles and practice of good governance ensures that its affairs are conducted in an efficient and transparent manner and is well communicated to all branches and departments within the organisation.
The board of directors ensures that the operations of the Company are carried out in keeping with the highest ethical standards and in the best interest of all stakeholders.
The board of directors is responsible for directing the Company at a strategic level, assuring long-term value creation.
Each division of the company is headed by a member of the Corporate Management team. Targets are set for major profit and cost centers in the budget and they are reviewed at regular intervals and variances are rectified.
Composition of the Board of DirectorsThe Board consists of 8 non-executive directors which includes a non-executive Chairman. The Managing Director is the only executive director and is also the Chief Executive Officer of the company. The directors bring a range of talents, skills and expertise needed to guide the company in the interest of all stakeholders. A brief description of the directors is given in pages 20to 21 of this Annual Report.
ResponsibilitiesThe board is responsible for:• ensuring satisfactory management of the resources of the
company, as trustees of the shareholders.
• driving the business of the company to ensure long-term growth and creation of value to stakeholders.
• formulation of policies and strategies and monitoring their successful implementation.
• appointment of the Chief Executive Officer, approving the organisational structure and succession planning in the company.
• implementation of an effective internal control system.
• ensuring compliance with legal requirements and ethical standards.
• ensuring a proper risk management system is in operation.
• deciding on major capital investments, acquisition and disposal of property and premises.
• approval of the Budget and the Corporate Plan.
• approval of credit facilities beyond the limit delegated to the Chief Executive Officer and the Credit Committee.
• approval of annual and interim financial statements for publication
Independent AdviceThe Board obtains independent professional advice in various matters from external sources, as and when the necessity arises.
Company SecretaryA professional firm engaged in secretarial work ensures that all proper board procedures and legally applicable rules and regulations are adhered to. The proceedings at board meetings are minuted under the supervision of the Chairman.
Chairman and CEOThere is a clear division of responsibilities between conducting the affairs of the board and executive responsibility in running the company. The duties of the Chairman and of the CEO are separate, thereby preventing unrestricted freedom of decision making in one person. Keeping in line with this principle of corporate governance, the Chairman is a non- executive director, while the CEO is an executive director.
Governance

Annual Report 2010/1144
Board Meeting Attendance of Directors
Name Meetings Held Attendance Excused
Mr. S. K. Wickremesinghe (NED) 11 11 -
Mr. Cyril Herath (NED) 11 08 03
Dr. Asoka Balasuriya (NED) 11 09 02
Mr. Lakshman Balasuriya (ED) 11 11 -
Mr. Rohan Balasuriya (NED) 11 09 02
Dr. Mahendra Balasuriya (NED) 11 10 01
Mrs. Lakshmi Fernando (NED) 11 09 02
Dr. Mrs. Gayathri Madan Mohan (NED) 11 11 -
Mr. Ajith Fernando (NED) 11 07 -
ED – Executive DirectorNED – Non Executive Director
Dr. Mrs. Gayathri Madan Mohan and Mr. Rohan Balasuriya were represented by their alternates. Mr. Ajith Fernando joined the Board on 1st August 2010.
Committee Meetings-Attendance of DirectorsAudit Committee
Name Meetings Held Attendance Excused
Mr. S. K. Wickremesinghe (NED) 05 05 -
Mr. Cyril Herath (NED) 05 02 03
Mrs. Lakshmi Fernando (NED) 05 03 02
Mr. Ajith Fernando (NED) 05 03 -
By Invitation
Mr. Lakshman Balasuriya (ED) 05 05 -
Non-executive directors on the BoardThe Chairman and all directors, except the MD/CEO, are non-executive members of the board.
Major TransactionsThe major transactions of the company are disclosed wherever applicable.
Corporate Governance Contd.
Audit CommitteeThe Audit Committee of the board of directors comprises of 3 non-executive directors of the company. The Managing Director/CEO, the Deputy CEO and Assistant General Manager – Accounts attend the meeting by invitation. Other members of the management team attend when the need arises.

Senkadagala Finance Company PLC 45
Integrated Risk Management Committee
Name Meetings Held Attendance Excused
Mr. Cyril Herath (NED) 03 01 02
Mrs. Lakshmi Fernando (NED) 03 02 01
Mr. Ajith Fernando (NED) 03 02 -
By Invitation
Mr. S. K. Wickremesinghe (NED) 03 03 -
Mr. Lakshman Balasuriya (ED) 03 03 -
Remuneration Committee
Name Meetings Held Attendance Excused
Mr. S. K. Wickremesinghe (NED) 02 02 -
Mr. Cyril Herath (NED) 02 02 -
Dr. Mahendra Balasuriya (NED) 02 02 -
Mr. Ajith Fernando (NED) 02 02 -
By Invitation
Mr. Lakshman Balasuriya (ED) 02 02 -
ED – Executive DirectorNED – Non Executive Director
Mr. Ajith Fernando joined the Board on 1st August 2010.

Financial Reports
Annual Report 2010/1146

Senkadagala Finance Company PLC 47
… pragmatic, yet optimistic, able to manage and excel in everything we do
Senkadagala Finance Company PLC 47

Annual Report 2010/1148
Financial ContentsAnnual Report of the Board of Directors
of Senkadagala Finance Company PLC 49
Auditors’ Report 53
Income Statement 54
Balance sheet 55
Statement of Changes in Equity 56
Cash Flow Statement 57
Notes to the Financial Statements 59
Senkadagala Finance Company PLC 49
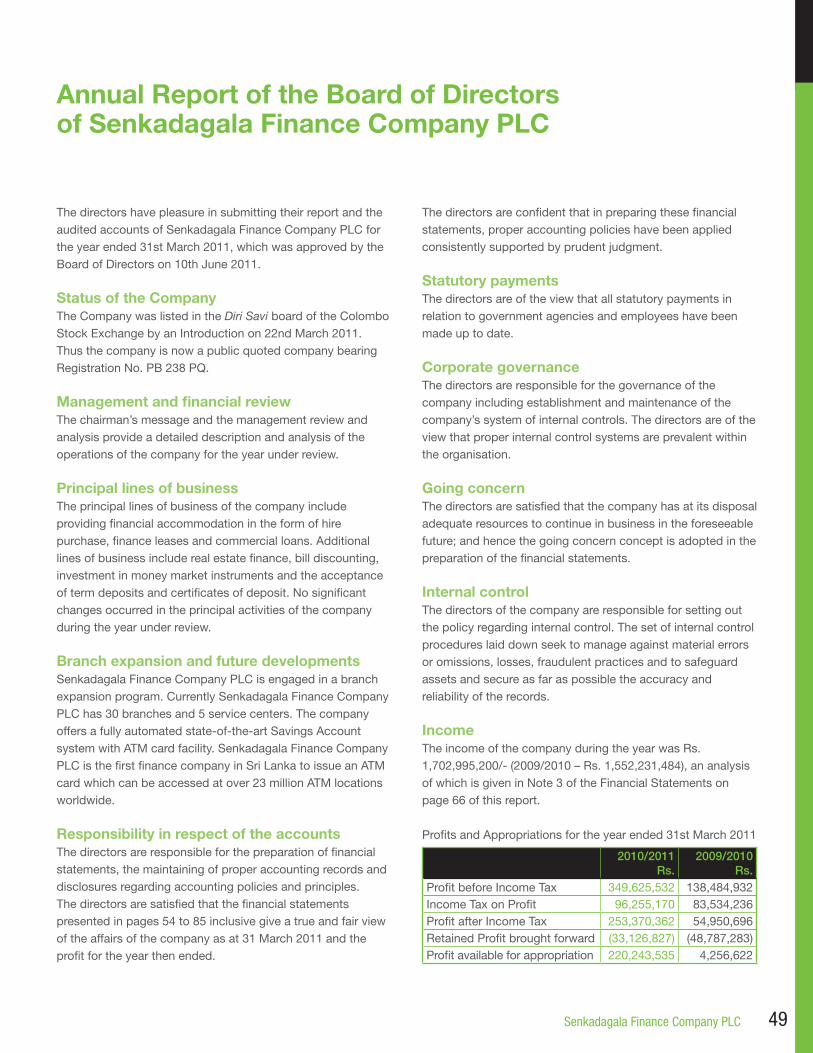
Annual Report of the Board of Directors of Senkadagala Finance Company PLC
The directors have pleasure in submitting their report and the audited accounts of Senkadagala Finance Company PLC for the year ended 31st March 2011, which was approved by the Board of Directors on 10th June 2011.
Status of the CompanyThe Company was listed in the Diri Savi board of the Colombo Stock Exchange by an Introduction on 22nd March 2011. Thus the company is now a public quoted company bearing Registration No. PB 238 PQ.
Management and financial reviewThe chairman’s message and the management review and analysis provide a detailed description and analysis of the operations of the company for the year under review.
Principal lines of businessThe principal lines of business of the company include providing financial accommodation in the form of hire purchase, finance leases and commercial loans. Additional lines of business include real estate finance, bill discounting, investment in money market instruments and the acceptance of term deposits and certificates of deposit. No significant changes occurred in the principal activities of the company during the year under review.
Branch expansion and future developmentsSenkadagala Finance Company PLC is engaged in a branch expansion program. Currently Senkadagala Finance Company PLC has 30 branches and 5 service centers. The company offers a fully automated state-of-the-art Savings Account system with ATM card facility. Senkadagala Finance Company PLC is the first finance company in Sri Lanka to issue an ATM card which can be accessed at over 23 million ATM locations worldwide.
Responsibility in respect of the accountsThe directors are responsible for the preparation of financial statements, the maintaining of proper accounting records and disclosures regarding accounting policies and principles.The directors are satisfied that the financial statements presented in pages 54 to 85 inclusive give a true and fair view of the affairs of the company as at 31 March 2011 and the profit for the year then ended.
The directors are confident that in preparing these financial statements, proper accounting policies have been applied consistently supported by prudent judgment.
Statutory paymentsThe directors are of the view that all statutory payments in relation to government agencies and employees have been made up to date.
Corporate governanceThe directors are responsible for the governance of the company including establishment and maintenance of the company’s system of internal controls. The directors are of the view that proper internal control systems are prevalent within the organisation.
Going concernThe directors are satisfied that the company has at its disposal adequate resources to continue in business in the foreseeable future; and hence the going concern concept is adopted in the preparation of the financial statements.
Internal controlThe directors of the company are responsible for setting out the policy regarding internal control. The set of internal control procedures laid down seek to manage against material errors or omissions, losses, fraudulent practices and to safeguard assets and secure as far as possible the accuracy and reliability of the records.
IncomeThe income of the company during the year was Rs. 1,702,995,200/- (2009/2010 – Rs. 1,552,231,484), an analysis of which is given in Note 3 of the Financial Statements on page 66 of this report.
Profits and Appropriations for the year ended 31st March 2011
2010/2011Rs.
2009/2010Rs.
Profit before Income Tax 349,625,532 138,484,932Income Tax on Profit 96,255,170 83,534,236Profit after Income Tax 253,370,362 54,950,696Retained Profit brought forward (33,126,827) (48,787,283)Profit available for appropriation 220,243,535 4,256,622

Annual Report 2010/1150
Annual Report of the Board of Directors of Senkadagala Finance Company PLC Contd.
Appropriated as follows
2010/2011Rs.
2009/2010Rs.
Transfer to Reserve Fund 13,500,000 3,000,000Transfer to General Reserve 145,000,000 -Transfer to Investment Fund Reserve
16,751,605 -
Total Gross Dividend 43,228,080 36,290,240Retained profit carried forward 1,763,850 (33,126,827)
Capital ExpenditureThe total expended on capital expenditure amounted to Rs.102.30 million (2009/2010 – Rs. 84.32 million). Details of property, plant and equipment are available on page 75 of this report. Details relating to the depreciation charge for the year are also available on page 75.
ReservesThe aggregate reserves as at 31st March 2011 amounted to Rs. 581.35 million. The aggregate reserves as at 31st March 2010 was Rs. 691.42 million. Movement in reserves during the year is given in the Statement of Changes in Equity on page 56.
The components of the aggregate reserves are set out below:
As at 31st March 2011Rs.
2010Rs.
Central Bank Reserve Fund 100,036,033 86,536,033General Reserve 462,810,392 638,018,392Investment Fund Reserve 16,751,605 -Profit and Loss Account 1,763,850 (33,126,827)Total Reserves 581,361,880 691,427,598
TaxationThe Company accounts for deferred taxation under the liability method on all timing differences. Details are disclosed in Note 2.1.6 (b) on page 61 and note 33.1 on page 80 of this report.
DividendsThe following dividends were declared and paid during the financial year.
Dividend Date of Payment
1st Interim 26th November 2010
2nd Interim 17th March 2011
Stated Capital and DebenturesThe stated capital as at 31st March 2011 was Rs. 533.68 million, consisting of 53,368,000 shares in issue. Details of the stated capital are given in Note 34 of the financial statements on page 81 of this report.
A capitalisation of reserves (bonus issue) in the proportion of 3 new shares for every 2 existing ordinary shares held, was effected by capitalising a sum of Rs. 320,208,000 standing to the credit of the General Reserve account during the period.
DebenturesThe Company also raised Rs. 280 million through a private placement of 5-year redeemable debentures of Rs. 100 each during the year 2010/2011.
Details of the debentures in issue as at 31st March 2011 are given in Note 32 of the financial statement on page 80.
Compliance with Laws and RegulationsThe directors are of the belief that the Company has not engaged in any activities contravening the laws and has complied with all applicable regulations.
Employment PoliciesThe Company is an equal opportunity employer. In its goals and objectives, it seeks to achieve excellence and market orientation in its service. Continuous training and social participation amongst employees are encouraged. A holistic approach prevails in the Company’s strategic outlook where a participatory management style ensures that employees are involved in the decision making process. Incentive schemes which are related to employee performance is one of the ways in which the Company ensures that rewards are directly related to performance. A Remuneration Committee ensures that a balance is struck between performance and related employee rewards structures.
The Company has also set up an in-house training facility in order to ensure that all employees meet certain standard requirements before job placement and also to enhance the existing skills of its staff. The Company had 235 employees as at 31st March 2011 (2010 - 213).

Senkadagala Finance Company PLC 51
EnvironmentThe directors are of the belief that the Company does not engage in any form of activity that is detrimental to the environment. Compliance with all environmental regulations has been adhered to.
Risk ManagementSpecific steps taken by the Company in managing risks are detailed on pages 41 to 42 of this report.
Vision and MissionThe Company’s vision and mission are stated in page 2 of this report.
ShareholdingsThere were 19 registered shareholders holding ordinary shares of the Company as at 31st March 2011. The distribution of shareholdings is given on page 90 of this report.
Equitable Treatment to ShareholdersThe Company has taken all possible steps to ensure equitable treatment to all shareholders.
DirectorsThe board of directors of Senkadagala Finance Company PLC consists of directors with financial and commercial experience. The qualifications and experience of the directors are stated on pages 20 to 21 of this report.
The following were directors during the year.• Mr. S. K. Wickremesinghe• Mr. Lakshman Balasuriya• Dr. Asoka Balasuriya• Mr. Rohan Balasuriya• Dr. Mahendra Balasuriya• Mrs. Lakshmi Fernando• Dr. (Mrs.) Gayathri Madan Mohan• Mr. L. G. D. C. L. S. Herath• Mr. W. A. T. Fernando
Board and Committee MeetingsA number of Board meetings, Audit Committee meetings and Remuneration Committee meetings were held during the year at the Registered Office of the Company. Members of each of these committees have attended these meetings on a regular basis.
Recommended for re-election• In accordance with Section 211 of the Companies Act, No.
7 of 2007, Mr. S. K. Wickremasinghe who is 83 years of age retires, and being eligible offers himself for re-election.
• In accordance with Section 211 of the Companies Act, No. 7 of 2007, Mr. L. G. D. C. L. S. Herath who is 77 years of age retires, and being eligible offers himself for re-election.
Directors and shareholdingsThe directors of the Company at the date of the report are shown below together with their respective shareholdings:
31/03/20111 31/03/2010
Mr. L. Balasuriya 3,065,832 1,400,000
Dr. A. Balasuriya 3,065,832 1,400,000
Mr. R. Balasuriya 3,065,832 1,400,000
Dr. M. Balasuriya 3,065,832 1,400,000
Dr. (Mrs.) G. Madan Mohan 3,065,832 1,400,000
Mrs. L. Fernando 2,570,002 1,166,664
Mr. S. K. Wickremesinghe - -
Mr. G. D. C. L. S. Herath - -
Mr. W. A. T. Fernando - -
The ten largest shareholders as at 31st March 2011
Name31/03/2011
No. of shares
31/03/2010No. of shares
1. E.W. Balasuriya & Co. (Pvt) Ltd 30,088,050 12,572,9802. Mr. L. Balasuriya 3,065,832 1,400,0003. Dr. A. Balasuriya 3,065,832 1,400,0004. Mr. R. Balasuriya 3,065,832 1,400,0005. Dr. M. Balasuriya 3,065,832 1,400,0006. Dr. (Mrs.) G. Madan Mohan 3,065,832 1,400,0007. Mrs. L. Fernando 2,570,002 1,166,6648. Mr. P. P. K. Ikiriwatte 2,052,502 -9. Mr. J. K. Jayatilake 2,052,492 -10. Mr. D.K.C.R. Fernando 495,830 233,332
Directors’ Interests in DebenturesThere were no debentures registered in the names of any of the directors at the beginning and at the end of the year.

Annual Report 2010/1152
Annual Report of the Board of Directors of Senkadagala Finance Company PLC Contd.
Directors’ Interests in ContractsThe directors’ interests in contracts are disclosed in Note 38 of the financial statements on pages 82 and 83 of this report.
DonationsA sum of Rs.353,275 (2009/2010 – Rs. 585,820) was paid out by way of donations during the year under review.
ProvisionsThe provisions made in the accounts in respect of bad and doubtful debts are well in excess of the mandatory provisions stipulated by the Department of Supervision of Non-Banking Financial Institutions of the Central Bank of Sri Lanka. Further, provisions are made where necessary for the fall in value of equity investments
Post Balance Sheet EventsNo post balance sheet events have arisen that would require disclosure in the accounts.
Information on Company SharesInformation relating to the shares of the Company is available in the 10 Year Summary on page 92 of this report.
Appointment of AuditorsThe financial statements of the year under review have been audited by Messrs. KPMG Ford, Rhodes, Thornton & Company, Chartered Accountants, who offer themselves for re-appointment. A resolution will be proposed at the Annual General Meeting to re-appoint them as auditors and authorizing the directors to fix their remuneration.
By order of the Board ofSENKADAGALA FINANCE COMPANY PLC
Sgd.Managers and Secretaries (Private) LimitedSecretaries
Colombo
10th June 2011

Senkadagala Finance Company PLC 53
Independent Auditors’ Report
TO THE SHAREHOLDERS OF SENKADAGALA FINANCE COMPANY PLC
Report on the Financial Statements We have audited the accompanying financial statements of Senkadagala Finance Company PLC, which comprise the balance sheet as at March 31, 2011, and the income statement, statement of changes in equity and cash flow statement for the year then ended, and a summary of significant accounting policies and other explanatory notes.
Management’s Responsibility for the Financial StatementsManagement is responsible for the preparation and fair presentation of these financial statements in accordance with Sri Lanka Accounting Standards. This responsibility includes: designing, implementing and maintaining internal control relevant to the preparation and fair presentation of financial statements that are free from material misstatement, whether due to fraud or error; selecting and applying appropriate accounting policies; and making accounting estimates that are reasonable in the circumstances.
Scope of Audit and Basis of Opinion Our responsibility is to express an opinion on these financial statements based on our audit. We conducted our audit in accordance with Sri Lanka Auditing Standards. Those standards require that we plan and perform the audit to obtain reasonable assurance whether the financial statements are free from material misstatement.
An audit includes examining, on a test basis, evidence supporting the amounts and disclosures in the financial statements. An audit also includes assessing the accounting
policies used and significant estimates made by management, as well as evaluating the overall financial statement presentation.
We have obtained all the information and explanations which to the best of our knowledge and belief were necessary for the purposes of our audit. We therefore believe that out audit provides a reasonable basis for our opinion.
OpinionIn our opinion, so far as appears from our examination, the Company maintained proper accounting records for the year ended March 31, 2011 and the financial statements give a true and fair view of the Company’s state of affairs as at March 31, 2011 and its profit and cash flows for the year then ended in accordance with Sri Lanka Accounting Standards.
Report on Other Legal and Regulatory RequirementsThese financial statements also comply with the requirements of Section 151(2) of the Companies Act No.07 of 2007 and present the information required by the Finance Companies Act No.78 of 1988.
Chartered Accountants
Colombo, 10th June, 2011ANF/DMGBD/rn.
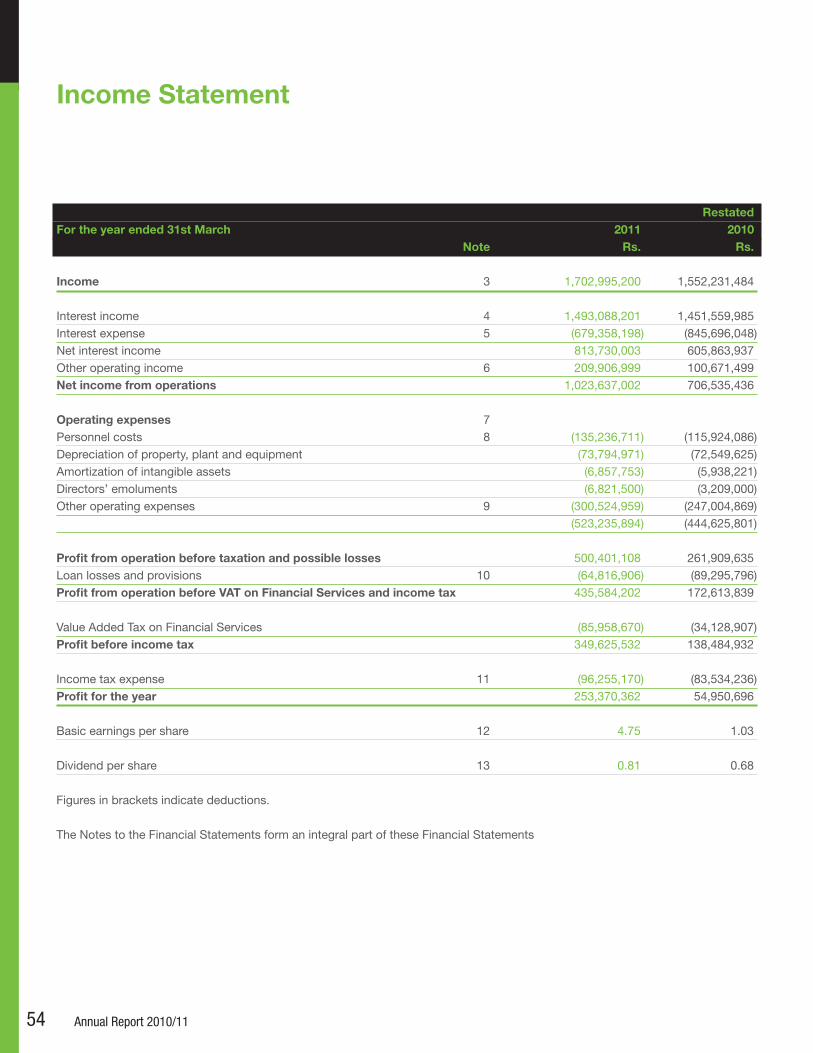
Annual Report 2010/1154
Income Statement
RestatedFor the year ended 31st March 2011 2010 Note Rs. Rs.
Income 3 1,702,995,200 1,552,231,484
Interest income 4 1,493,088,201 1,451,559,985Interest expense 5 (679,358,198) (845,696,048)Net interest income 813,730,003 605,863,937Other operating income 6 209,906,999 100,671,499Net income from operations 1,023,637,002 706,535,436
Operating expenses 7Personnel costs 8 (135,236,711) (115,924,086)Depreciation of property, plant and equipment (73,794,971) (72,549,625)Amortization of intangible assets (6,857,753) (5,938,221)Directors’ emoluments (6,821,500) (3,209,000)Other operating expenses 9 (300,524,959) (247,004,869) (523,235,894) (444,625,801)
Profit from operation before taxation and possible losses 500,401,108 261,909,635Loan losses and provisions 10 (64,816,906) (89,295,796)Profit from operation before VAT on Financial Services and income tax 435,584,202 172,613,839
Value Added Tax on Financial Services (85,958,670) (34,128,907)Profit before income tax 349,625,532 138,484,932
Income tax expense 11 (96,255,170) (83,534,236)Profit for the year 253,370,362 54,950,696
Basic earnings per share 12 4.75 1.03
Dividend per share 13 0.81 0.68
Figures in brackets indicate deductions.
The Notes to the Financial Statements form an integral part of these Financial Statements

Senkadagala Finance Company PLC 55
Balance sheet
RestatedAs at 31 st March 2011 2010 Note Rs. Rs.
AssetsCash and short term funds 14 419,137,459 496,297,284Government of Sri Lanka Treasury bills 198,509,828 163,192,153Dealing securities 15 48,344,770 23,576,282Investment securities 16 14,165,755 14,165,755Loans and advances 17 5,401,847,203 4,399,518,621Trade and other receivables 18 323,843,955 305,471,993Advances and receivables 19 48,662,155 53,555,133Deferred expenses 20 4,133,281 7,392,573Property, plant and equipment 21 396,504,943 383,099,687Intangible assets 22 33,463,630 39,557,902Total assets 6,888,612,979 5,885,827,383
LiabilitiesDeposits from customers 23 2,392,741,865 2,094,477,659Bank overdrafts 24 28,982,674 8,310,198Securitised loans 25 1,414,764,929 1,428,381,600Accrued expenses 26 124,724,577 81,080,641Accounts payable 27 21,422,509 15,723,760Trade payables 28 247,722,022 122,085,066Current tax liabilities 29 80,733,542 31,569,230Rentals received in advance 30 37,325,772 20,699,799Retirement benefit obligation 31 22,564,095 17,631,637Debentures 32 1,330,000,000 1,090,000,000Deferred tax liability 33 72,589,114 70,968,196Total liabilities 5,773,571,099 4,980,927,785
EquityStated capital 34 533,680,000 213,472,000Statutory reserve fund 35 100,036,033 86,536,033General reserve 36 462,810,392 638,018,392Investment fund reserve account 37 16,751,605 -Retained earnings 1,763,850 (33,126,827)Total equity 1,115,041,880 904,899,598Total liabilities and equity 6,888,612,979 5,885,827,383
Figures in brackets indicate deductions.The Notes to the Financial Statements form an integral part of these Financial Statements .
It is certified that the Financial Statements have been prepared in compliance with the requirements of the Companies Act, No. 7 of 2007.
Lalith J. de AlwisDeputy Chief Executive Officer
The Board of Directors is responsible for the preparation and presentation of these Financial Statements.Approved and signed for and on behalf of the Board.
S. K. Wickremesinghe Dr. A. BalasuriyaChairman Director
Colombo, Sri Lanka10th June 2011

Annual Report 2010/1156
Stated Statutory General Investment Restated TotalFor the year ended 31st March 2011 capital reserve reserve fund reserve retained fund account earnings Rs. Rs. Rs. Rs. Rs. Rs.
Balance as at 1st April 2009 as previously reported 213,472,000 83,536,033 638,018,392 - (50,694,074) 884,332,351Recognition of capital gain on Orion Fund 2008/09 (Note A) - - - - 1,906,791 1,906,791Balance as at 1st April 2009 as restated 213,472,000 83,536,033 638,018,392 - (48,787,283) 886,239,142Profit for the period (Restated) (Note A) - - - - 54,950,696 54,950,696Transfers to reserves - 3,000,000 - - (3,000,000) -Dividend paid - - - - (36,290,240) (36,290,240)Balance as at 31st March 2010 213,472,000 86,536,033 638,018,392 - (33,126,827) 904,899,598
Balance as at 1st April 2010 (As restated) 213,472,000 86,536,033 638,018,392 - (33,126,827) 904,899,598Profit for the period - - - - 253,370,362 253,370,362Bonus Share Issue 320,208,000 - (320,208,000) - - -Transfers to reserves - 13,500,000 145,000,000 16,751,605 (175,251,605) -Dividend paid - - - - (43,228,080) (43,228,080)Balance as at 31st March 2011 533,680,000 100,036,033 462,810,392 16,751,605 1,763,850 1,115,041,880
Note AThe investment portfolio held with Orion Fund Management was originally recognised at the initial cost of investments transferred to the portfolio. The management of the company decided to account for the effect of the movement of share transactions from the financial year 2010/2011 onwards. This has been accounted for retrospectively, in accordance with Sri Lanka Accounting Standards 10 - Accounting Policies, Changes in accounting estimates and errors (Revised 2005).
The capital gain generated from share transactions in prior periods has been recognized as a restatement of retained earnings. A capital gain of Rs. 1,906,791 generated in the financial year 2008/2009 has been adjusted to the opening retained earnings as at 1st April 2009.
The capital gain of Rs. 5,969,134 relating to the year ended 31st March 2010 has been adjusted to the profit for that year and the restated profit for the year ended 31st March 2010 is as follows.
Rs.
Profit for the year ended 31st March 2010 as reported previously 48,981,562Capital gain generated from share transactions on Orion Fund 5,969,134Profit for the year ended 31st March 2010 as restated 54,950,696
Figures in brackets indicate deductions.
The Notes to the Financial Statements form an integral part of these Financial Statements .
Statement of Changes in Equity

Senkadagala Finance Company PLC 57
RestatedFor the year ended 31st March 2011 2010 Rs. Rs.
Cash flows from operating activitiesInterest and commission receipts 1,493,088,201 1,451,559,985Interest payments (679,358,198) (845,696,048)Recoveries of bad debts 47,424,009 9,460,879Other operating income 142,568,570 88,457,272Operating expenditure (160,923,224) (75,748,318)Cash payments to employees and suppliers (383,921,071) (320,377,850)Operating profit before changes in operating assets and liabilities (Note A) 458,878,287 307,655,920
(Increase) / decrease in operating assetsInvestments in government securities (35,317,675) (19,842,105)Funds advanced to customers (1,040,162,702) 55,646,577Advances and receivables 4,892,978 (9,635,089)Deferred expenses - (5,264,139)Trade and other receivables (18,371,962) 74,182,856 (1,088,959,362) 95,088,100
Increase / (decrease) in operating liabilitiesDeposits from customers 298,264,206 696,327,072Gratuity paid (337,500) (2,606,693)Rentals received in advance 16,625,973 (6,397,941)Other liabilities 174,538,513 56,480,496 489,091,192 743,802,934
Net cash (used in)/generated from operating activities before income tax (140,989,883) 1,146,546,954Income tax paid (47,621,019) (32,556,218)Net cash (used in)/generated from operating activities (188,610,902) 1,113,990,736
Cash flows from investing activitiesDividend receipts 821,418 1,032,788Purchase of dealing securities (24,768,488) (5,437,289)Purchase of property, plant and equipment (102,302,021) (84,319,229)Purchase of intangible assets (763,481) (19,362,958)Proceeds from sale of property, plant and equipment 34,194,796 6,226,500Net cash (used in)/generated from investing activities (92,817,776) (101,860,188)
Cash flows from financing activitiesSecuritised loans obtained 1,020,910,000 1,005,723,000Unlisted debentures issued 240,000,000 350,000,000Repayment of securitised loans (1,034,526,671) (1,978,424,145)Redemption of listed debenture - (100,000,000)Dividends paid (42,786,951) (35,966,275)Net cash generated from /(used in) financing activities 183,596,378 (758,667,420)
Cash Flow Statement

Annual Report 2010/1158
RestatedFor the year ended 31st March 2011 2010 Rs. Rs.
Net (decrease) / increase in cash and cash equivalents (97,832,300) 253,463,124Cash and cash equivalents at the beginning of the year 487,987,086 234,523,962Cash and cash equivalents at the end of the year 390,154,785 487,987,086
Reconciliation of cash and cash equivalentsCash and short term funds 419,137,459 496,297,284Bank overdraft (28,982,674) (8,310,198) 390,154,785 487,987,086
(Note A)Reconciliation of operating profitProfit before income tax 349,625,532 138,484,932Dividends (821,418) (1,032,788)Specific provision for bad and doubtful debts on loans and advances 52,593,249 41,201,817General provision for debtors recoverable on repossessed stock 1,056,287 7,600,000Write-off of loan receivables - 2,266,787Write-off of receivables on insurance premium and search fees 2,151,080 9,051,212Specific provision for debtors recoverable on repossessed stock 5,595,276 27,738,932Reversal of specific provision on repossessed stock (21,410,692) (4,387,465)Depreciation 80,652,724 78,487,846Provision for retiring gratuity 5,269,958 4,027,548Profit on disposal of motor vehicles (19,093,002) (1,720,560)Amortization of structural fees 3,259,293 5,937,659 458,878,287 307,655,920
Figures in brackets indicate deductions.
The Notes to the Financial Statements form an integral part of these Financial Statements .
Cash Flow Statement Contd.

Senkadagala Finance Company PLC 59
1. Corporate information1.1 Domicile and legal formSenkadagala Finance Company PLC is a limited liability company domiciled in Sri Lanka incorporated under the Companies Ordinance, No 51 of 1938 on March 29, 1968 and registered under the Finance Companies Act, No.78 of 1988. Its registered office is situated at No. 267, Galle Road, Colombo 3. The company re – registered under the Companies Act, No. 7 of 2007.
As a registered finance company, it is supervised by the Department of Supervision of Non-Bank Financial Institutions of the Central Bank of Sri Lanka.
1.2 Principal activities and nature of operationsThe principal lines of business of the company can be broadly classified under two categories – fund-based and fee-based. The fund-based services include finance leasing, hire purchase finance, and commercial loans. The fee-based services are insurance brokering, vehicle valuation, etc.
1.3 Number of employeesThe number of employees of the Company at the end of the period was 235 (2010 – 213).
1.4 Responsibility for Financial StatementsThe board of directors is responsible for the preparation and presentation of the financial statements of the company in accordance with the provisions of the Companies Act, No. 7 of 2007 and Sri Lanka Accounting Standards.
The financial statements of Senkadagala Finance Company PLC for the period ended 31st March 2011 were authorised for issue by a resolution of the board of directors on 10th June 2011.
These financial statements include the following components:
• an Income Statement providing the information on the financial performance of the company for the period under review.
• a balance sheet providing information on the financial position of the company at the end of the period under review.
• a statement of changes in equity providing the information on the changes in shareholders’ equity during the period under review.
• a cash flow statement providing information on the cash and cash equivalents generating ability of the Company and the utilisation of those cash flows.
• notes to the financial statements comprising accounting policies used and other notes.
1.5 Parent Enterprise and Ultimate Parent Enterprise
The company is a subsidiary of E.W. Balasuriya and Company (Private) Limited, which is incorporated and domiciled in Sri Lanka.
2. Summary of Significant Accounting Policies
2.1 General Policies2.1.1 Basis of PreparationStatement of ComplianceThe Balance Sheet, and the related Statements of Income, Changes in Equity and Cash Flow together with the Accounting Policies and Notes (Financial Statements) of Senkadagala Finance Company PLC as at 31st March 2011 and for the period then ended, comply with the Sri Lanka Accounting Standards laid down by the Institute of Chartered Accountants of Sri Lanka and the requirements of the Companies Act, No. 7 of 2007, Finance Companies Act, No 78 of 1988 and Finance Leasing Act, No. 56 of 2000 and the amendments to these acts.
The company did not adopt any inappropriate accounting treatments which do not comply with the requirements of Sri Lanka Accounting Standards and other laws and regulations governing the preparation and presentation of financial statements.
2.1.1(a) Basis of MeasurementThe financial statements of the company are prepared under the historical cost convention basis. No adjustments have been made for inflationary factors affecting the financial statements.
Notes to the Financial Statements

Annual Report 2010/1160
2.1.1(b) Presentation and Functional CurrencyThe financial statements of the company are presented in Sri Lanka Rupees, which is the company’s functional currency.
2.1.1(c) Significant Accounting Judgments, Estimates and Assumptions
The preparation of financial statement in conformity with SLAS requires the management to make judgments, estimates and assumptions that influence the application of accounting policies and the reported amounts of assets, liabilities, income and expenses. Judgments and estimates are based on historical experience and other factors, including expectations that are believed to be reasonable under the circumstances and assumptions based on such knowledge and expectations of future events. Hence, actual experience and results may differ from these judgments and estimates.
The estimates and underlying assumptions are reviewed on an ongoing basis. Revisions to accounting estimates are recognised in the period in which the estimates are revised, if the revision affects only that period or in the period of the revision and future periods as well, if the revision affects both current and future periods.
Revisions to accounting estimates are dealt with in accordance with Sri Lanka Accounting Standard No. 10 Accounting Policies, Changes in accounting estimates and errors. (Revised 2005)
2.1.2 Going ConcernWhen preparing the financial statements, the directors have made an assessment of the ability of the constituents of the company to continue as a going concern in the foreseeable future and they do not foresee a need for liquidation or cessation of trading, taking into account all available information about the future.
2.1.3 Change to the Accounting PoliciesThere were no changes to the accounting policies adopted by the company during the period under review. However, the following two new Accounting Standards have been issued by the Institute of Chartered Accountant of Sri Lanka and are effective for the financial periods beginning on or after January 1, 2012.
• Sri Lanka Accounting Standard No. 44 ‘Financial Instruments : Presentation’
• Sri Lanka Accounting Standard No. 45 ‘Financial Instruments: Recognition and Measurement’
• Sri Lanka Accounting Standard No. 46 ‘Financial Instruments: Disclosures’
• Sri Lanka Accounting Standard No. 39 ‘Share - based Payment’
Following the convergence of Sri Lanka Accounting Standards with International Financial Reporting Standards, all existing Sri Lanka Accounting Standards will be prefixed as SLFRS or LKAS which refer to Sri Lanka Accounting Standards corresponding to IFRS or IAS, respectively. The Council of the Institute of Chartered Accountants of Sri Lanka has mandated all specified business enterprises to adopt these new accounting standards effective for financial periods beginning on or after January 1, 2012.
In order to comply with the requirement of these Accounting Standards, the company has duly planned the standards implementation programme, especially considering the complex nature of the effect of these accounting standards.
2.1.4 Comparative InformationComparative information including quantitative, narrative and descriptive information is disclosed in respect of the previous period for all amounts reported in the financial statements in order to enhance the understanding of the current period’s financial statements and to enhance inter-period comparability.
The accounting policies adopted by the company are consistent with those of the previous financial period as permitted by Sri Lanka Accounting Standard No. 3 (Revised 2005) on ‘Presentation of Financial Statements’. However, when the presentation or classification of items in the financial statement is amended, comparative amounts are also re-classified to confirm with the current period presentation.
Notes to the Financial Statements Contd.

Senkadagala Finance Company PLC 61
2.1.5 Post-Balance Sheet EventsAll material post Balance Sheet events have been considered and appropriate adjustments/ disclosures have been made in the accounts, wherever necessary.
2.1.6 TaxationTax expense comprises current tax and deferred tax.
(a) Current TaxesCurrent tax is the expected tax payable on the taxable income for the period, using tax rates enacted or substantively enacted at the reporting date, and any adjustment to tax payable in respect of previous periods.
Provision for taxation is based on the elements of income and expenditure as reported in the financial statements and computed in terms of the provisions of the Inland Revenue Act, No. 10 of 2006 and amendments thereto, at the rate of 33 1/3% (2010 – 35%).
(b) Deferred TaxationDeferred tax is provided on temporary differences at the balance sheet date between the tax bases of assets and liabilities and their carrying amounts for financial reporting purposes. Deferred tax liabilities are recognised on all temporary differences.
Deferred tax assets are recognised for all deductible differences, carry forward of unused tax credits and unused tax losses, to the extent that it is probable that taxable profit will be available against which the deductible temporary differences and the carry forward of unused tax credits and unused tax losses can be utilized.
The carrying amount of deferred income tax assets is reviewed at each balance sheet date and reduced to the extent that it is no longer probable that sufficient taxable profit will be available to allow all or part of the deferred income tax assets to be utilized.
Deferred tax assets and liabilities are measured at the tax rates that are expected to apply in the period when the assets are recognised, or the liabilities are settled, based on tax rates and tax laws that have been enacted or substantially enacted at the balance sheet date.
Current tax and deferred tax relating to items recognised directly in equity are also recognised in equity and not in the income statement.
Deferred tax assets and liabilities are set off if a legally enforceable right exists to set off current tax assets against current tax liabilities and the deferred taxes relate to the same taxable entity and the same taxation authority.
2.2 Assets and Bases of their Valuation2.2.1 Cash and Short Term Funds (Cash and Cash
Equivalents)Cash and short term funds include cash in hand, balances with banks, placements with banks and money at call at short notice. They are brought in to the financial statement at the face value.
2.2.2 Government Treasury BillsInvestments in Government Treasury Bills are acquired or incurred principally for the purpose of adherence to Central Bank regulation and sold or held as part of a portfolio that is managed for short term profit, Treasury Bill Repurchase Agreements are stated at cost and any interest accrued up to the balance sheet date is recognised in the income statement.
2.2.3 Investments(a) Dealing SecuritiesThese are marketable securities acquired and held with the intention of resale over a short period of time. Such securities are recorded at the lower of cost and market value on an aggregate portfolio basis in total.
(b) Fall in value of InvestmentsUnrealised losses on revaluation of dealing securities at the lower of cost and market value are taken to the Income Statement in accordance with Sri Lanka Accounting Standard No. 22, Accounting for Investments.
(c) Investments in AssociatesInvestments in associates are not accounted under the equity method in the company’s financial statements in accordance with the exemptions prescribed by Sri Lanka Accounting Standard No. 27, Investments in Associates.

Annual Report 2010/1162
(d) Investment SecuritiesInvestment securities are stated at cost in the company’s financial statements in accordance with Sri Lanka Accounting Standard No. 22, Accounting for Investments.
2.2.4 Loans and Advances to Customers (Lease, Hire Purchase, Loans and advances and trade and other receivables)
2.2.4 (a) Rental receivable on lease assetsAssets leased to customers which transfer substantially all the risks and rewards incidental to ownership other than the legal title are accounted for as finance leases in accordance with Sri Lanka Accounting Standard, No. 19 (Revised 2005) on Lease and reflected in the balance sheet after eliminating unearned interest income, initial rental received and provision for doubtful debts.
2.2.4 (b) Hire purchase assetsAssets hired to customers under hire purchase agreements, which transfer all the risks and rewards incidental to ownership as well as legal title at the end of such contractual period are classified as hire purchase receivables. Such assets are accounted for in a similar manner as those of finance leases.
2.2.4(c) Loans and advances and trade and other receivables
Loans and advances and trade and other receivables are stated in the balance sheet net of provision for bad and doubtful debts and interest in suspense.
2.2.4(d) Non-Performing Loans and AdvancesLoans and advances which are in arrears of capital and/or interest due are classified as non-performing in accordance with Direction No 3 of 2006.
2.2.5 Provision for loan lossesProvision for possible loan losses is made on the basis of a continuous review of all advances to customers in accordance with Finance Company Direction, No. 3 of 2006 (Provision for bad and doubtful debt) issued by the Central Bank of Sri Lanka and in accordance with Sri Lanka Accounting Standard No. 33, Revenue Recognition and Disclosure in the Financial
Statements of Finance Companies. Accordingly, specific provisions have been made as follow:
All advances in arrears for a period of 6 to 12 months 50%All advances in arrears for over 12 months 100%
In addition, wherever it is considered prudent, further provisions are made on specifically identified loans and advances.
2.2.6 Property, Plant and Equipment(a) Basis of Recognition and Measurement of
Property, Plant & EquipmentThe company applies the requirements of Sri Lanka Accounting Standard No. 18, Property, Plant & Equipment.
Property, plant and equipment are stated at cost or revalued amounts less accumulated depreciation and accumulated impairment losses, if any. Subsequent expenditure incurred for the purpose of acquiring, extending or improving assets of a permanent nature by means of which to carry on the business or to increase the earning capacity of the business is treated as capital expenditure. The carrying values of property, plant and equipment are reviewed for impairment when events or changes in circumstances indicate that the carrying value may not be recoverable.
Property, plant and equipment are recorded at cost of purchase or construction or valuation together with any incidental expenses thereon. These assets are stated at cost less accumulated depreciation, which is provided for on the basis specified below.
(b) DepreciationThe provision for depreciation is calculated by using the straight line method on the cost or valuation of property, plant & equipment other than freehold land, in order to write-off such amounts over the estimated useful economic lives of these assets in equal installments. The depreciation charges are determined separately for each item of property, plant & equipment and begin to depreciate when it is available for use.
Notes to the Financial Statements Contd.

Senkadagala Finance Company PLC 63
The estimated useful lives of the different types of assets are as follows:
Buildings 5% per annum (20 years)Office equipment 10% per annum (10 years)Computers and other equipment 25% per annum (4 years)Furniture and fittings 10% per annum (10 years)Motor vehicles 16.67% per annum (6 years)Generators 12.5% per annum (8 years)Interior construction 20% per annum (5 years)
2.2.7 Intangible Assets2.2.7.1 Basis of RecognitionAn intangible asset is recognised if it is probable that future economic benefits that are attributable to the asset will flow to the entity and the cost of the asset can be measured reliably in accordance with Sri Lanka Accounting Standard No. 37, Intangible Assets. Accordingly, these assets are stated in the balance sheet at cost less accumulated amortization and accumulated impairment loss.
2.2.7.2 AmortizationThe amortization expense on intangible assets is recognised in the income statement in the expense category consistent with the function of the intangible assets.
2.2.7.3 Computer SoftwareComputer software is stated at cost less accumulated amortization and any accumulated impairment loss. Amortization is done at 12% per annum of cost.
2.2.8 Impairment of Non Financial AssetsThe company assesses at each reporting date or more frequently if events or changes in circumstances indicate that the carrying value may be impaired, whether there is an indication that a non-financial asset may be impaired. If any such indication exists, or when an annual impairment testing for an asset is required the company makes an estimate of the asset’s recoverable amount. When the carrying value of an asset (or cash generating unit) exceeds its recoverable value, the asset (or cash generating unit) is considered impaired and is written down to its recoverable value.
For assets excluding goodwill, an assessment is made at each reporting date as to whether there is any indication that previously recognised impairment losses may no longer exist or may have decreased. If such condition exists, the recoverable value is estimated. A previously recognised impairment loss is reversed only if there has been a change in the estimates used to determine the asset’s recoverable value since the last impairment loss was recognised. If that is the case, the carrying value of the asset is increased to its recoverable value.
2.3 Liabilities and provisions2.3.1 Commitments and contingenciesAll discernible risks are accounted for in determining the amount of other liabilities.
2.3.2 Deposits from CustomersDeposits from customers include non-interest bearing deposits, savings deposits, term deposits, and certificates of deposit. They are stated in the balance sheet at the amount payable. Interest paid and payable on these deposits is charged to the income statement.
2.3.3 BorrowingsBorrowings include revolving facilities and facilities secured by securitised assets. Balances payable are stated in the balance sheet under securitised loans. Interest paid and payable on these borrowings is charged to the income statement.
2.3.4 DebenturesThese represent the funds borrowed by the company for its funding requirements. These are recorded in the balance sheet at the cash value to be paid at settlement. Interest paid and payable on these borrowings is charged to the income statement.
2.3.5 Retirement benefit obligationsRetirement benefit obligations have been provided for using the actuarial valuation method in accordance with SLAS 16 (Revised 2006) Employee Benefits.

Annual Report 2010/1164
Estimated provisions have been adjusted in the interim accounts and for the annual financial statements.
The service of a qualified actuary is obtained to determine the value of the defined benefit obligation of the company. The valuation is done on an ongoing basis and uses a Projected Unit Credit Method, which projects the current data using actuarial assumptions as specified in note 2.3.5.1 below and calculates a projected benefit at the participant’s assumed retirement date. The actuarial value of this projected benefit is then valued and discounted to the valuation date to derive the current liability.
The actuarial gains and losses are recognised in the income statement in the period in which they arise.
Up to 31st March 2008, provision had been made for retirement gratuities based on the number of years of service multiplied by half of the last month’s salary of those employees who were eligible to receive retirement benefits as at the balance sheet date.
2.3.5.1 The principal actuarial assumptions used in determining the cost are;
(i) Retirement age - normal retirement age, or age on valuation date, if greater
(ii) Payment of benefit – Gratuity is assumed to be paid immediately provided the participant has 5 years of service credit at the time of departure. It is also assumed that all participants who are eligible for a commuted pension will choose it in lieu of statutory gratuity payments.
(iii) Salary scale - annual increase of 10%(iv) Rate of interest - 11%
2.3.5.2 The liability is not externally funded.
2.4 Income statement2.4.1 Revenue Recognition(a) LeaseIn accordance with Sri Lanka Accounting Standard No. 19 (Revised 2005) on Leases, recognition of finance income on leasing is accounted based on a pattern reflecting a constant periodic rate of return on capital outstanding. The excess of aggregate rentals receivable over the cost of leased assets constitutes the total unearned interest income at the
commencement of the contract. The company recognises the interest income from unearned income on the lease on an accrual basis over the term of the lease in proportion to the remaining balance of the lease receivable. However, the recognition of income ceases when the recovery of principal or interest is in arrear for six months or more. Thereafter, interest income is accounted on a cash basis.
(b) Hire PurchaseRecognition of interest income from hire purchase facilities is similar to that of leases, which recognises interest income based on a pattern reflecting a constant rate of return on the capital outstanding.
(c) Loans & AdvancesRecognition of interest income from loans and advances is similar to that of leases, which recognises interest income based on a pattern reflecting a constant rate of return on the capital outstanding.
(d) Interest Income on Investment in Government Securities
Interest receivable is taken to the income statement on an accrual basis, based on a pattern reflecting a constant periodic rate of return. Interest on government securities is grossed up with the notional tax credit available under the Inland Revenue Act, No. 10 of 2006.
(e) Interest Income on deposits with banksInterest receivable is taken to the income statement on an accrual basis.
(f) Dividend IncomeDividend income is recognised in the income statement on the date that the company’s right to receive payment is established.
(g) Recovery of bad debtsThe recovery of bad debts is recognised as and when the debts are recovered.
(h) Commission IncomeRecognition of commission income on insurance business arranged by the company is on a cash basis.
Notes to the Financial Statements Contd.

Senkadagala Finance Company PLC 65
(i) Profit/loss from the sale of property, plant and equipment
Profits and losses arising from the sale of property, plant and equipment are recognised in the period in which the sale occurs.
(j) Profit on sales of seized vehicles stockProfits earned and losses incurred on the sales of repossessed vehicle stock are accounted in the income statement based on net realisable value.
2.5 Expenditure RecognitionIn terms of Sri Lanka Accounting Standard 33 – Revenue Recognition and Disclosure in the Financial Statements of Finance Companies, interest and other expenses payable are recognised on an accrual basis. All the expenditure incurred in the running of the company’s business and maintaining the property, plant & equipment in a state of efficiency has been charged to income in arriving at the profit for the year.
2.6 Cash Flow StatementThe cash flow statement has been prepared by using the “Direct Method” in compliance with SLAS-9, Cash Flow Statement. Cash and cash equivalents comprise mainly of cash balances and call deposits. Cash and cash equivalents are presented net of bank overdrafts for the purpose of the cash flow statement.
2.7 Segment ReportingA segment is a distinguishable component of the company that is engaged in providing services (Business Segment).
In accordance with Sri Lanka Accounting Standard No. 28 on Segment Reporting, segmental information is presented in respect of the company. The segments comprise of financing and investing.
Inter-segment transactions are based on fair market prices.
Segment results, assets and liabilities include those items directly attributable to a segment as well as those that can be allocated on a reasonable basis. Unallocated items comprise mainly of head office expenses.
Segment capital expenditure is the total cost incurred during the period to acquire segment assets that are expected to be used for more than one accounting period.

Annual Report 2010/1166
RestatedFor the year ended 31st March 2011 2010 Note Rs. Rs.
3. IncomeInterest income 4 1,493,088,201 1,451,559,985Other operating income 6 209,906,999 100,671,499 1,702,995,200 1,552,231,484
4. Interest incomeFinance leases 228,853,969 281,201,213Hire purchases 1,008,660,032 875,595,729Loans and advances 21,437,441 18,986,608Commercial Loans 19,479,833 33,553,422Fixed deposit loans 2,786,726 4,027,350Money market investments 44,296,288 45,201,087Treasury bills 4.1 17,019,638 22,046,784Default charges 150,554,274 170,947,792 1,493,088,201 1,451,559,985
4.1 Notional tax credit for withholding tax on government securities on secondary market transactions.Section 137 of the Inland Revenue Act, No. 10 of 2006 provides that a company which derives interest income from secondary market transactions in Government Securities would be entitled to a notional tax credit (being one ninth of net interest income), provided such interest income forms part of the statutory income of the company for that year of assessment.
Accordingly, the net interest earned by the Company from secondary market transactions in government securities (Treasury Bills) for the period has been grossed up in the financial statements, and the resulting notional tax credit amounts to Rs. 1,701,964. (2010 - Rs.2,204,678) for the Company.
RestatedFor the year ended 31st March 2011 2010 Note Rs. Rs.
5. Interest expensesFixed deposits 262,604,846 267,088,896Certificates of deposit 180,084 581,528Savings deposits 4,981,739 4,978,224Securitised loans 212,697,143 393,462,948Debentures 188,521,002 151,254,067Corporate loans 10,373,384 28,330,385 679,358,198 845,696,048
Notes to the Financial Statements Contd.

Senkadagala Finance Company PLC 67
RestatedFor the year ended 31st March 2011 2010 Note Rs. Rs.
6. Other operating incomeFinance charges 23,979,783 16,696,746Commission income 30,326,551 30,912,105Bad debts recovered 47,424,009 9,460,879Dividend income 821,418 1,032,788Interest on insurance 25,086,716 19,441,045Sundry income 3,670,732 2,033,311Legal fees recovered 18,975,764 10,905,458Rent income 2,080,000 1,760,000Inspection fees 1,762,187 689,473Profit on disposal of motor vehicles 19,093,002 1,720,560Capital gain on shares 36,686,837 5,969,134Discounting cheques - 50,000 209,906,999 100,671,499
7. Operating expensesOperating expenses include the following :Internal Auditors’ remuneration 5,400,000 4,614,790External Auditors’ remuneration - Audit related 550,000 450,000 - Non audit related 551,127 437,400Amortization of securitised loan structuring fee 3,259,293 5,937,659Legal expenses 4,419,874 5,783,218
8. Personnel costsSalaries and wages 109,105,141 95,127,177Contribution to Employees’ Provident Fund 13,164,557 11,307,300Contribution to Employees’ Trust Fund 3,291,139 2,823,844Retirement benefit obligations 8.1 5,269,958 4,027,548Other personnel costs 4,405,916 2,638,217 135,236,711 115,924,086
8.1 Retirement benefit obligationsAmount recognised in the income statementCurrent service cost 2,555,783 1,815,415Interest cost 2,714,175 2,212,131 5,269,958 4,027,548

Annual Report 2010/1168
RestatedFor the year ended 31st March 2011 2010 Note Rs. Rs.
9. Other operating expensesAdministrative expenses 64,287,050 40,043,338Establishment expenses 128,058,908 117,139,904Selling expenses 108,179,001 89,821,627 300,524,959 247,004,869
10. Loan losses and provisionsIrrecoverable debts written-off - 2,266,787Specific provision for bad and doubtful debts on loans and advances 52,593,249 41,201,817General provision for debtors recoverable on repossessed stock 1,056,287 7,600,000Specific provision for debtors recoverable on repossessed stock 5,595,276 27,738,932Reversal of specific provision on repossessed stock (21,410,692) (4,387,465)Loss on sale of repossessed stock 26,982,786 14,875,725 64,816,906 89,295,796
11. Income tax expenseCurrent tax expense 11.1 94,634,251 77,806,441Deferred tax charge for the period 11.2 1,620,919 5,727,795 96,255,170 83,534,236
11.1 Reconciliation of effective tax rateNet profit before tax 349,625,532 138,484,932Add - Disallowable expenses 191,262,928 227,029,929Less - Allowable expenses 35,685,886 (142,108,421)Add / (Less) - Adjustments (296,867,198) 29,323,000Business loss claimed during the year - (33,710,605)Taxable income 279,707,148 219,018,835
Income Tax at 33 1/3 % ( 35% in 2009/2010) 93,235,716 76,656,592Social Responsibility Levy @ 1.5% of Income Tax 1,398,536 1,149,849Income Tax on profit for the year 94,634,251 77,806,441Effective tax rate 27% 56%
Notes to the Financial Statements Contd.

Senkadagala Finance Company PLC 69
RestatedFor the year ended 31st March 2011 2010 Note Rs. Rs.
11.2 Deferred tax charge / (reversal) for the periodAdjustment to opening balanceAdjustment to opening deferred tax asset / liability resulting from change in tax rate.Reversal to deferred tax liability (15,427,854) -Charge to deferred tax asset 1,234,215 -
Deferred tax liability/ asset recognised / (reversed) during the yearCharge to deferred tax liability 17,195,646 6,225,093Reversal to deferred tax asset (1,381,088) (497,299)Deferred tax charge for the period 1,620,919 5,727,795
12. Basic earnings per shareBasic earnings per share have been calculated by dividing the net profit for the period attributable to the ordinary shareholders of the Company by the weighted average number of ordinary shares outstanding during the year.
Profit attributable to ordinary shareholders of the Company 253,370,362 54,950,696Weighted average number of ordinary shares 53,368,000 53,368,000Basic earnings per share 4.75 1.03
13. Dividend per shareDividends per share is calculated by dividing the proposed and/or paid dividend to ordinary shareholders of the Company by the number of ordinary shares in issue.1st interim - (2010/11 - Rs.0.46) 24,549,280 -1st interim - (2009/10 - Rs.0.90) - 19,212,480Final - (2010/11 - Rs.0.35) 18,678,800 -Final - (2009/10 - Rs.0.80) - 17,077,760 43,228,080 36,290,240Dividend per share (inclusive of proposed dividends) 0.81 0.68

Annual Report 2010/1170
RestatedAs at 31 st March 2011 2010 Note Rs. Rs.
14. Cash and short term fundsCash and bank balances 14.1 247,801,416 343,263,464Commercial Bank - Money market 96,196,901 103,033,820Repo investment with banks 75,139,142 50,000,000 419,137,459 496,297,284
14.1 Cash and bank balancesCommercial Bank Savings A/c 43,857 43,857Commercial Bank - Kandy # 2 12,777,408 6,951,624Commercial Bank - Kandy # 3 - 730,328Commercial Bank - Kandy # 4 177,901 129,967Commercial Bank # 6 13,234 3,946,180Commercial Bank, Corporate Branch - 974,674HSBC 18,095 954,554Hatton National Bank - Kandy 212,507,739 1,587,374Hatton National Bank - Colombo 25,720 30,551Sampath Bank PLC 1,215,966 10,453,027Standard Chartered Bank 14,776 15,276Nations Trust Bank PLC 37,425 -Bank of Ceylon - 58,406Bank of Ceylon 20,850 31,100Pan Asia Bank 41,639 42,821Union Bank 15,039 94,202ICICI Bank 3,529,629 8,402,459Cash value stamps - 30,449Encashment floats 3,585,142 3,551,610Cash in hand 16,290,148 14,351,398Savings ATM withdrawals (2,513,152) (9,856,119)Short term deposits - 300,739,726 247,801,416 343,263,464
15. Dealing securitiesQuoted shares 15.1 43,344,770 18,576,282Debentures - Commercial Bank - 13% (5,000 Debentures Rs.1,000/- each) 5,000,000 5,000,000 48,344,770 23,576,282
Notes to the Financial Statements Contd.

Senkadagala Finance Company PLC 71
RestatedAs at 31 st March 31.03.2011 31.03.2010 No. of Cost Market No.of Cost Market Shares Value Shares Value Rs. Rs. Rs. Rs.
15.1 Quoted sharesBank, Finance and InsuranceCentral Finance Company PLC 4,333 243,207 5,518,942 4,333 243,207 1,689,870National Development Bank PLC 384 500 122,880 384 500 80,640Commercial Bank of Ceylon PLC 208 72,450 55,286 208 72,450 41,964
Beverage, Food and TobaccoCeylon Tobacco PLC 3,100 142,017 1,109,800 3,100 142,017 775,000
Hotels and TravelsAitken Spence PLC 33 3,355 3,234 33 3,355 45,334
Investment TrustNational Equity Fund 131,400 600,925 2,986,759 131,400 600,925 2,986,759Namal Acuity Value Fund 25,000 1,250,000 2,130,000 25,000 1,250,000 1,325,000
ManufacturingRoyal Ceramics Lanka PLC 10 273 1,570 10 273 1,130Hayleys PLC 250 7,175 95,500 250 7,175 21,938
Diversified HoldingsJohn Keells Holdings PLC 1,937 13,800 553,207 1,937 13,800 356,408Orion Fund (Portfolio Investments) 1,070,969 40,862,568 50,623,873 765,401 16,094,080 28,254,166
TradingLanka Indian Oil Corporation PLC 5,500 148,500 96,800 5,500 148,500 100,375
Total cost and market value 43,344,770 63,297,851 18,576,282 35,678,584
As at 31 st March Note 2011 2010 Rs. Rs.
16. Investment securities (Unquoted)Senkadagala Hotels Limited 16.1 13,957,555 13,957,555Credit Information Bureau of Sri Lanka 8,200 8,200Finance Houses Consortium (Pvt) Ltd. 200,000 200,000 14,165,755 14,165,755

Annual Report 2010/1172
16.1 The Company holds 32.27% approximately of the issued share capital of Senkadagala Hotels Limited. The Company has not accounted for this under the equity method in accordance with Sri Lanka Accounting Standards 27 - Investments in associates. However, consolidated financial statements could be obtained from the ultimate parent of Senkadagala Hotels Limited, E.W. Balasuriya and Company (Private) Limited, incorporated and domiciled in Sri Lanka under the Companies Act, No.7 of 2007.Its registered office and principal place of business is located at No 267,Galle Road, Colombo 3.
As at 31 st March 2011 2010 Rs. Rs.
17. Loans and advancesNet investment in lease rental receivableLease rental receivable within one year from balance sheet date 754,875,359 454,328,459Unearned income (175,295,667) (106,499,171) 579,579,692 347,829,288
Lease rental receivable between one year and five years from balance sheet date 1,201,817,189 769,522,608Unearned income (333,374,087) (216,741,455) 868,443,102 552,781,153
Lease rental receivable in respect of non-performing leases 21,943,126 16,588,507Unearned income in respect of non-performing leases (6,612,935) (5,317,545) 15,330,191 11,270,961
Net investment in hire purchaseHire purchase installments receivable within one year from balance sheet date 2,062,771,795 1,621,345,772Unearned income (473,926,506) (410,679,351) 1,588,845,288 1,210,666,421Hire purchase installments receivable between one year and five years from balance sheet date 3,001,494,830 2,842,393,528Unearned income (839,151,716) (867,343,312) 2,162,343,115 1,975,050,215
Hire purchase installments receivable in respect of non-performing HP advances 40,526,211 17,538,674Unearned income in respect of non-performing HP advances (11,380,664) (5,365,092) 29,145,547 12,173,583
Net investment in Commercial loansInstallments receivable within one year from balance sheet date 32,198,907 51,385,314Unearned income (6,993,721) (11,519,886) 25,205,186 39,865,428
Notes to the Financial Statements Contd.

Senkadagala Finance Company PLC 73
As at 31 st March 2011 2010 Note Rs. Rs.
17. Loans and advances Contd.Installments receivable between one year and five years from balance sheet date 36,244,944 76,803,639Unearned income (10,527,277) (23,705,223) 25,717,667 53,098,416
Installments receivable in respect of non-performing commercial loans 21,994,294 21,828,546Unearned income in respect of non-performing commercial loans (6,317,460) (6,159,357) 15,676,834 15,669,189
Net investment in personal loansLoan installments receivable within one year from balance sheet date 35,977,587 31,149,923Unearned income (11,490,806) (10,220,428) 24,486,781 20,929,495
Loan installments receivable between one year and five years from balance sheet date 72,612,975 74,865,647Unearned income (29,099,558) (29,663,835) 43,513,417 45,201,812
Loans against fixed deposits 18,935,109 15,643,319Debtors recoverable on repossessed stock 73,781,712 165,789,373Specific provision for bad and doubtful debts on loans and advances 17.1 (48,576,634) (31,111,099)General provision for debtors recoverable on repossessed stock (8,656,287) (7,600,000)Specific provision for debtors recoverable on repossessed stock 17.2 (11,923,517) (27,738,933)Total loans and advances 5,401,847,203 4,399,518,621
17.1 Movement in specific provision for bad and doubtful debts on loans and advancesBalance at the beginning of the year 31,111,099 75,084,647Provision for the year 52,593,249 41,201,817Bad debts written-off - (85,175,365)Balance at the end of the year 83,704,348 31,111,099
Provision for bad and doubtful debts on loans and advances 48,576,635 31,111,099Provision for bad and doubtful debts on trade & other receivables 35,127,713 - 83,704,348 31,111,099
17.2 Movement in specific provision for debtors recoverable on repossessed stockBalance at the beginning of the year 27,738,933 12,540,095Provision made during the year 5,595,276 27,738,932Reversal of specific provision on repossessed stock (21,410,692) (4,387,465)Loss incurred during the year - (8,152,629)Balance at the end of the year 11,923,517 27,738,933

Annual Report 2010/1174
As at 31 st March 2011 2010 Note Rs. Rs.
18. Trade and other receivablesRental in arrears 199,286,474 212,756,704Provision for bad and doubtful debts on trade & other receivables 17.1 (35,127,713) - 164,158,761 212,756,704
Staff debtors 7,885,283 7,275,423Discounting of cheques 490,000 490,000Insurance 83,885,331 64,042,377Advances allowed to car sales 21,773,426 7,768,649Search fees and seizing charges receivable 1,649,810 1,924,251Western Union MMBL 704,600 1,022,093Goods and Services Tax recoverable 11,020,826 11,020,826Value Added Tax recoverable 19,046,975 (6,489,168)Advance payments 11,202,677 2,026,235Sundry debtors 2,026,266 3,634,603 323,843,955 305,471,993
19. Advances and receivablesDeposits 2,122,284 2,122,284Pre - paid rent 19,755,699 17,318,520Advance Company Tax recoverable 6,125,619 6,125,619Advance paid for fixed assets 884,701 6,788,447Cash cover on securitised loans 5,861,393 19,206,154Cash float with Orion Fund 13,912,459 1,994,109 48,662,155 53,555,133
20. Deferred expensesBalance at the beginning of the year 7,392,573 8,066,093Paid during the year - 5,264,139Charged during the year (3,259,292) (5,937,659)Balance at the end of the year 4,133,281 7,392,573
Loan structuring fees paid for arranging loans has been treated as a deferred expense and has been charged to the income statement over the period of repayment of the loans.
Notes to the Financial Statements Contd.

Senkadagala Finance Company PLC 75
As at Additions Disposals As at 01.04.2010 31.03.2011 Rs. Rs. Rs. Rs.
21. Property, plant and equipmentCostLand 92,741,855 - - 92,741,855Buildings 18,803,291 8,222,998 - 27,026,289Furniture and fittings 76,629,875 420,123 - 77,049,998Office equipment 68,237,385 3,699,164 - 71,936,549Air conditioners 24,818,856 571,000 - 25,389,856Computers and accessories 96,169,113 8,039,779 128,185 104,080,707Facsimile machines 893,483 21,500 28,333 886,650Generators 32,420,500 - - 32,420,500Motor vehicles 163,136,760 77,897,889 37,165,268 203,869,381Photostat machines 5,478,676 140,000 - 5,618,676Fixtures and fittings 77,799,874 2,806,608 - 80,606,482Printers 15,305,233 482,960 - 15,788,193 672,434,901 102,302,021 37,321,786 737,415,136
As at Charge for Charge on As at 01.04.2010 the Period Disposals 31.03.2011 Rs. Rs. Rs. Rs.
Accumulated depreciationBuildings 8,876,650 790,165 - 9,666,815Furniture and fittings 32,867,970 7,508,282 - 40,376,252Office equipment 20,741,620 6,615,973 - 27,357,593Air conditioners 15,180,600 3,526,111 - 18,706,711Computers and accessories 72,358,219 9,302,921 128,185 81,532,955Facsimile machines 414,994 76,462 25,264 466,192Generators 13,587,654 3,884,557 - 17,472,211Motor vehicles 63,599,828 27,889,723 22,066,543 69,423,007Photostat machines 4,248,212 581,205 - 4,829,417Fixtures and fittings 45,116,701 12,096,128 - 57,212,829Printers 12,342,767 1,523,444 - 13,866,211 289,335,214 73,794,971 22,219,992 340,910,193Net book value 383,099,687 396,504,943

Annual Report 2010/1176
21.1 Fully Depreciated Property, Plant & EquipmentThe cost of fully-depreciated Property, Plant & Equipment of the company which are still in use as at the Balance Sheet date is as follows:
As at 31 st March 2011 2010 Rs. Rs.
Buildings 3,000,000 -Air Conditioners 10,716,379 7,249,940Computers and accessories 40,437,606 32,035,620Generators 1,344,048 -Photostat machines 3,138,675 1,367,625Printers 3,483,060 2,612,245Furniture and Fittings 35,081,695 17,319,234
21.2 Property, Plant & Equipment retired from active useThe following Property, Plant & Equipment of the company were retired from active use as at the Balance Sheet date.
Furniture and Fittings 1,643,057 1,609,557Office Equipment 2,690,503 2,680,468Air Conditioners 1,456,713 1,456,713Computers and accessories 20,321,821 20,321,821Facsimile machines 100,000 100,000Photostat machines 302,050 302,050Printers 473,320 473,320
22. Intangible assetsSoftwareCostBalance at the beginning of the year 121,529,586 102,166,628Additions during the year 763,481 19,362,958Balance at the end of the year 122,293,067 121,529,586
AmortisationBalance at the beginning of the year 81,971,684 76,033,463Additions during the year 6,857,753 5,938,221Balance at the end of the year 88,829,437 81,971,684Net book value 33,463,630 39,557,902
23. Deposits from customersSavings deposits 83,986,416 66,944,059Certificates of deposit 23.1 2,897,349 68,966Fixed deposits 23.2 2,305,858,100 2,027,464,634 2,392,741,865 2,094,477,659
Notes to the Financial Statements Contd.

Senkadagala Finance Company PLC 77
As at 31 st March 2011 2010 Note Rs. Rs.
23.1 Certificates of depositFace value 3,100,000 100,000Interest in suspense (202,651) (31,034) 2,897,349 68,966
23.2 Fixed depositsFixed deposits 2,223,920,112 1,951,821,251Accrued interest 81,937,988 75,643,383 2,305,858,100 2,027,464,634
24. Bank overdraftCommercial Bank - Kandy # 1 8,121,729 6,837,325Commercial Bank - Colombo # 5 20,860,945 1,430,932Nations Trust Bank PLC - 41,941 28,982,674 8,310,198
25. Securitised loansCommercial Bank of Ceylon PLC (1) - 12,974,900Hatton National Bank PLC 297,500,000 122,500,000Commercial Bank of Ceylon PLC (2) 383,790,421 198,072,581Sampath Bank PLC 64,300,001 125,734,001Capital Alliance - 7,426,715National Development Bank PLC 45,800,000 249,700,000Nations Trust Bank PLC 60,129,508 154,959,404Waldock Mackenzie - 6,250,000HSBC - 30,000,000ICICI Bank 27,499,999 89,729,999Berkley 535,745,000 431,034,000 1,414,764,929 1,428,381,600
Securities pledgedLease and hire purchase aggregate portfolio amounting to Rs.1,627,857,572.85 have been pledged as security for the above loans.

Annual Report 2010/1178
As at 31 st March 2011 2010 Note Rs. Rs.
26. Accrued expensesAudit fees 550,000 450,000Staff bonus payable 26,032,936 8,364,193PAYE payable 2,808,891 -Interest on debentures 83,819,516 67,998,514Securitised loan repayment 978,129 1,039,899Directors’ fees - (37,500)VAT on Financial Services 7,164,228 3,132,764Nation Building Tax 93,832 132,771Commission payable 3,000,000 -Deposit insurance premium payable 277,045 - 124,724,577 81,080,641
27. Accounts payableDebit Tax 25,822 83,610Saving charges (327,815) -Dividend payable 1,780,707 1,339,578Registrar of Motor Vehicles charges 4,336,841 2,512,842Refundable deposit 422,000 372,000Mortgage fees 308,657 197,425Direct deposits 3,787,206 3,535,638Stamp Duty payable 11,089,091 7,682,667 21,422,509 15,723,760
28. Trade payablesAmounts payable to car sales 732,203 932,203Commercial Loan - payable (1,821,325) (1,784,650)Personal Loan excess payment 96,928 51,170Withholding Tax on dividends (96,676) (52,516)Withholding Tax on loans and debentures 2,413,709 2,225,641Stock payable 216,785,364 102,659,178Sundry creditors 29,602,907 18,045,128Goods and Services Tax refund for buses 8,912 8,912 247,722,022 122,085,066
Notes to the Financial Statements Contd.

Senkadagala Finance Company PLC 79
As at 31 st March 2011 2010 Note Rs. Rs.
29. Current tax liabilitiesIncome tax payable 132,676,702 77,806,441Income tax payment (20,817,496) -Economic Service Charge (17,295,531) (34,869,526)Withholding Tax on Treasury Bill interest (6,486,526) (4,020,534)Withholding Tax on commission 260,204 631,698Withholding Tax on fixed deposit interest (7,603,811) (7,978,849) 80,733,542 31,569,230
30. Rentals received in advanceInitial payment of lease 13,209,219 1,632,450Prepaid rentals 24,116,553 19,067,349 37,325,772 20,699,799
31. Retirement benefit obligationPresent value of defined benefit obligation 22,220,771 22,118,542Unrecognised actuarial gain / (loss) 343,324 (4,486,905)Net retirement benefit obligation 22,564,095 17,631,637
31.1 Retirement benefit obligationBalance at the beginning of the year 17,631,637 16,210,783Retirement benefit expense for the year 5,269,958 4,027,547Benefits paid during the year (337,500) (2,606,693)Balance at the end of the year 22,564,095 17,631,637
31.2 Unrecognised actuarial lossPresent value of defined benefit obligations at the beginning of the year 17,631,636 16,210,784Current service cost 2,555,783 1,815,415Interest cost 2,714,176 2,212,131Benefits paid during the year (337,500) (2,606,693)Expected total present value of defined benefit obligations at the end of the year 22,564,095 17,631,637Actual present value of defined benefit obligations at the end of the year 22,220,771 22,118,542Actuarial loss at the end of the year 343,324 (4,486,905)

Annual Report 2010/1180
32. DebenturesType Purpose of Interest Due/settlement 2011 2010 debenture rate (p.a) date Rs. Rs.
Unsecured, unlisted, redeemable debentures2006/2011 Working capital 16% (Fixed) 5 years from the 219,000,000 259,000,0002007/2012 requirement 16% (Fixed) date of allotment 241,000,000 241,000,0002008/2013 16% (Fixed) 240,000,000 240,000,0002009/2014 16% (Fixed) 270,000,000 290,000,0002009/2014 14.5% (Fixed) 80,000,000 60,000,0002010/2015 14.5% (Fixed) 120,000,000 -2010/2015 14.0% (Fixed) 100,000,000 -2010/2015 12.0% (Fixed) 60,000,000 - 1,330,000,000 1,090,000,000
33. Deferred tax liabilityDeferred tax liabilities [Note 33.1] 78,907,061 77,139,268Deferred tax assets [Note 33.2] (6,317,946) (6,171,073) 72,589,114 70,968,196
33.1 Deferred tax liabilities 2011 2010 Temporary Tax Temporary Tax Difference Effect Difference Effect
Balance as at 1st April 220,397,910 77,139,268 202,611,929 70,914,175Impact on rate change reversed to Income Statement - (15,427,854) - -Originating during the year 61,413,022 17,195,647 17,785,981 6,225,093 281,810,932 78,907,061 220,397,910 77,139,268
33.2 Deferred tax assetsBalance as at 1st April 17,631,637 6,171,073 16,210,783 5,673,774Impact on rate change reversed to Income Statement - (1,234,215) - -Tax Effect on retirement benefit obligation 4,932,458 1,381,088 1,420,854 497,299 22,564,095 6,317,946 17,631,637 6,171,073
Impact due to corporate income tax rate changeThe corporate income tax rate has been reduced to 28% commencing from year of assessment 2011/12 Accordingly, deferred tax asset and liability have been computed based on 28%.
Notes to the Financial Statements Contd.

Senkadagala Finance Company PLC 81
As at 31st March 2011 2010 Rs. Rs.
34. Stated capitalOrdinary shares53,368,000 ordinary shares 533,680,000 213,472,000
Allotted and fully paidBalance as at 1.4.2010 - 21,347,200 ordinary shares 213,472,000 213,472,000Bonus shares issued in November 20103 for every 2 held - 32,020,800 ordinary shares 320,208,000 -Balance as at 31.3.2011 - 53,368,000 ordinary shares 533,680,000 213,472,000
35. Statutory reserve fundBalance at the beginning of the year 86,536,033 83,536,033Transfers during the year 13,500,000 3,000,000Balance at the end of the year 100,036,033 86,536,033
The company’s statutory reserve fund was created according to the Finance Companies Direction No. 1 of 2003 issued by the Central Bank of Sri Lanka
36. General reserveBalance at the beginning of the year 638,018,392 638,018,392Issue of Bonus shares (320,208,000) -Transfers during the year 145,000,000 -Balance at the end of the year 462,810,392 638,018,392
The general reserve represents amounts set aside by the directors for future expansion and to meet any contingencies.
37. Investment fund reserveInvestment fund reserve 16,751,605 - 16,751,605 -
The investment Fund Reserve Account is credited in accordance with the Central Bank of Sri Lanka guidelines issued to create an Investment Fund Reserve which comprises 8% of the profits calculated for the payment of Value Added Tax (VAT) on Financial Services on dates as specified in the VAT Act for payment of VAT.

Annual Report 2010/1182
The company decided to make investments in goverment Treasury Bills out of the funds in the Investment Fund, details of which are set out below.
Cost : Rs. 20,000,000Period : from 28-03-2011 to 06-01-2012Rate : 7.20% p.a.Face value : Rs. 21,123,518
38. Related party transactions38.1 Transactions with related entities38.1.1 E.W. Balasuriya & Company (Pvt) LtdThe Company being a subsidiary company of E.W. Balasuriya & Company (Pvt) Ltd., Mr. L. Balasuriya, Mr. R. Balasuriya, Dr. M. Balasuriya, Dr. A. Balasuriya, Mrs. L. Fernando and Dr. Mrs. Gayathri Madan Mohan, directors of company are also directors of E. W. Balasuriya & Company (Pvt) Ltd., with which the Company had the following transactions.
a) The Company operates its following branch offices in the premises of E.W. Balasuriya & Company (Pvt) Ltd., and has paid rent expenses for the respective branches as follows.
2011 2010 Rs. Rs.
Colombo 1,607,148 1,482,000Aluthgama 803,568 775,000Negombo 803,568 775,000Wattala Yard 267,852 175,000 3,482,136 3,207,000
b) The Company paid dividend of Rs.24,371,321 during the period ended 31st March 2011 (2010 -Rs.21,430,082) to E.W. Balasuriya & Company (Pvt) Ltd.
38.1.2 Senkadagala Hotels LtdMr. L. Balasuriya, Mr. R. Balasuriya, Dr. M. Balasuriya, Dr. A. Balasuriya and Mrs. L. Fernando, directors of the Company are also directors of Senkadagala Hotels Limited.
The Company holds 32.27% approximately of issued share capital of Senkadagala Hotels Limited
The Company operates its Kandy branch office in the premises of Senkadagala Hotels Limited, and has paid Rs.852,800 to Senkadagala Hotels Limited, as rent for the year ended 31st March 2011. (2009/10 - Rs.590,850)
38.2 Transactions with key management personnel (KMP) of the CompanyAccording to Sri Lanka Accounting Standard 30 (Revised 2005) Related Party Disclosures, key management personnel are those having authority and responsibility for planning, directing and controlling the activities of the entity. Accordingly members of the board of directors of the Company (including the executive and non-executive directors, the Deputy CEO, the General Manager and the Assistant General Managers) and of the Ultimate Parent Company have been classified as key management personnel of the Company.
Notes to the Financial Statements Contd.

Senkadagala Finance Company PLC 83
38.2.1 Compensation of key management personnel
2011 2010 Rs. Rs.
Short term employee benefits Board of Directors 6,821,500 3,209,000 Other KMP 12,251,108 7,548,085
38.2.2 Post Employment benefits to key management personnelThe key management personnel are entitled to gratuity provisions in accordance with the provisions of the Gratuity Act, No. 12 of 1983.
39 Commitments and contingencies39.1 Capital expenditure commitmentsCapital expenditure approved by the Board of Directors for which provision has not been made in the financial statements approximately amounted to the following:
2011 2010 Rs. Rs.
Approved and contracted for 15,020,914 50,000,000 15,020,914 50,000,000
39.2 Contingent liabilitiesThere were no contingent liabilities at the balance sheet date, which require adjustments to or disclosures in the financial statements.
40. Events after the balance sheet dateIn accordance with the resolution passed at the meeting of the board of directors held on 29th September 2010, Senkadagala Finance Company Limited listed its ordinary shares in the Colombo Stock Exchange and accordingly the name of the Company is Senkadagala Finance Company PLC with effect from 8th June 2011.
Except as mentioned above, there were no material events occurring after the balance sheet date that require adjustment to or disclosure in the financial statements.

Annual Report 2010/1184
41. Maturity AnalysisAn analysis of the total assets employed and the total liabilities of the Company as at 31st March 2011, based on the remaining period from the balance sheet date to the respective contractual maturity dates is given below.
Up to 3 3 to 12 1 to 3 More than Total as at Months Months years 3 years 31.03.2011 Rs Rs Rs Rs Rs
Interest Earning AssetsBank and cash balances 247,801,416 - - - 247,801,416Deposits with banks & other institutions 171,336,043 - - - 171,336,043Government Treasury Bills - 198,509,828 - - 198,509,828Stock out on hire 640,171,082 1,829,702,217 1,406,379,917 1,697,638,030 5,573,891,247Debtors 125,389,050 50,759,008 9,909,472 18,537,817 204,595,347Total Interest Earning Assets 1,184,697,591 2,078,971,053 1,416,289,389 1,716,175,847 6,396,133,881
Non Interest Earning AssetsDealing securities - 48,344,770 - - 48,344,770Investment securities - - - 14,165,755 14,165,755Property, plant and equipment - - - 429,968,573 429,968,573Total Assets 1,184,697,591 2,127,315,823 1,416,289,389 2,160,310,176 6,888,612,979
Percentage (%) 31.03.2011 17.20 30.88 20.56 31.36 100.00
Interest bearing liabilitiesDeposits 192,641,351 1,254,408,061 348,681,450 428,189,249 2,223,920,112Certificates of deposit - 2,897,349 - - 2,897,349Savings deposits - 83,986,416 - - 83,986,416Bank overdraft 28,982,674 - - - 28,982,674Asset securitised funds 215,718,971 488,972,628 582,573,329 127,500,000 1,414,764,929Debentures 59,000,000 160,000,000 591,000,000 520,000,000 1,330,000,000Total interest bearing liabilities 496,342,997 1,990,264,454 1,522,254,780 1,075,689,249 5,084,551,480Non interest bearing liabilities 171,880,176 299,592,839 47,324,257 170,222,346 689,019,619Total liabilities 668,223,173 2,289,857,293 1,569,579,037 1,245,911,596 5,773,571,099
Percentage (%) 31.03.2011 11.57 39.66 27.19 21.58 100.00
Shareholders’ Funds - - - 1,115,041,880 1,115,041,880Total Shareholders’ Funds and Liabilities 668,223,173 2,289,857,293 1,569,579,037 2,360,953,475 6,888,612,979
Notes to the Financial Statements Contd.

Senkadagala Finance Company PLC 85
42. Segment reportingRestated
Leasing Hire Purchases Other Advances Investments / Property Insurance Unallocated Total
As at 31st March 2011 2010 2011 2010 2011 2010 2011 2010 2011 2010 2011 2010 2011 2010
Rs. Rs. Rs. Rs. Rs. Rs. Rs. Rs. Rs. Rs. Rs. Rs. Rs. Rs.
Revenue
Interest 228,853,969 281,201,213 1,008,660,032 875,595,729 43,704,000 56,567,380 61,315,926 67,297,871 - - - - 1,342,533,927 1,280,662,193
Commissions - - - - - - - - 55,413,267 50,353,150 - - 55,413,267 50,353,150
Rent - - - - - - 2,080,000 1,760,000 - - - - 2,080,000 1,760,000
Dividends - - - - - - 821,418 1,032,788 - - - - 821,418 1,032,788
Other income 55,779,839 - 7,689,694 246,366,749 - 210,733,659 302,146,588 218,423,353
Total revenue 228,853,969 281,201,213 1,008,660,032 875,595,729 43,704,000 56,567,380 119,997,183 77,780,353 55,413,267 50,353,150 246,366,749 210,733,659 1,702,995,200 1,552,231,484
Profit before tax 349,625,532 138,484,932
Taxation (96,255,170) (83,534,236)
Profit after tax 253,370,362 54,950,696
Segment Assets 1,463,352,985 911,881,402 3,780,333,950 3,197,890,219 158,160,268 289,747,000 1,112,639,537 1,129,675,892 - - 374,126,239 356,632,870 6,888,612,979 5,885,827,383
Segment Liabilities 801,965,981 932,594,142 3,534,616,575 2,903,883,091 153,150,594 187,603,768 420,502,467 257,955,862 - - 863,335,482 698,890,925 5,773,571,099 4,980,927,788
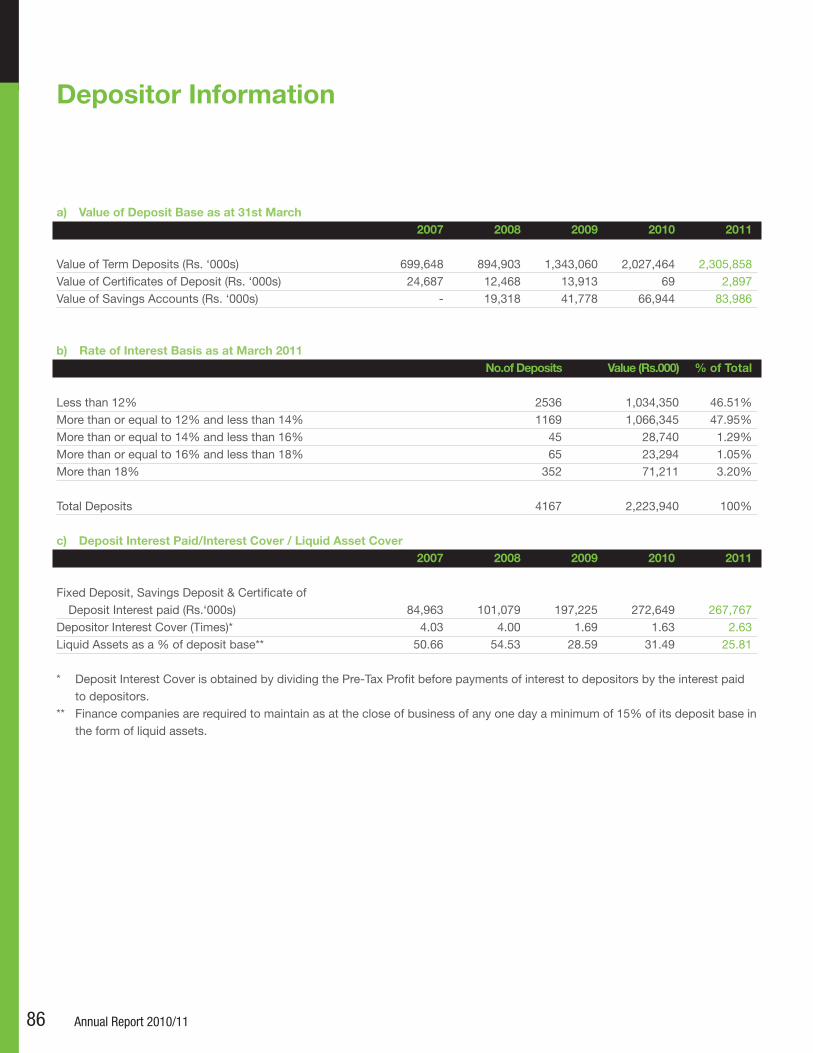
Annual Report 2010/1186
Depositor Information
a) Value of Deposit Base as at 31st March 2007 2008 2009 2010 2011
Value of Term Deposits (Rs. ‘000s) 699,648 894,903 1,343,060 2,027,464 2,305,858 Value of Certificates of Deposit (Rs. ‘000s) 24,687 12,468 13,913 69 2,897 Value of Savings Accounts (Rs. ‘000s) - 19,318 41,778 66,944 83,986
b) Rate of Interest Basis as at March 2011 No.of Deposits Value (Rs.000) % of Total
Less than 12% 2536 1,034,350 46.51%More than or equal to 12% and less than 14% 1169 1,066,345 47.95%More than or equal to 14% and less than 16% 45 28,740 1.29%More than or equal to 16% and less than 18% 65 23,294 1.05%More than 18% 352 71,211 3.20% Total Deposits 4167 2,223,940 100%
c) Deposit Interest Paid/Interest Cover / Liquid Asset Cover 2007 2008 2009 2010 2011
Fixed Deposit, Savings Deposit & Certificate of Deposit Interest paid (Rs.‘000s) 84,963 101,079 197,225 272,649 267,767 Depositor Interest Cover (Times)* 4.03 4.00 1.69 1.63 2.63Liquid Assets as a % of deposit base** 50.66 54.53 28.59 31.49 25.81
* Deposit Interest Cover is obtained by dividing the Pre-Tax Profit before payments of interest to depositors by the interest paid to depositors.
** Finance companies are required to maintain as at the close of business of any one day a minimum of 15% of its deposit base in the form of liquid assets.

Senkadagala Finance Company PLC 87
a) Risk Weighted Assets 2010/2011 2009/2010 Risk Weight 2010/2011 2009/2010 (Rs.000) (Rs.000) % (Rs.000) (Rs.000)
On-Balance Sheet-Total Assets 6,888,613 5,885,827 6,218,298 5,175,170Cash & current accounts with banks 247,801 343,263 0% - -Deposits with banks 171,336 153,034 20% 34,267 30,607Deposits with finance companies - - 20% - -Due from Central Bank of Sri Lanka - - 0% - -Sri Lanka Government Treasury Bills 198,510 163,192 0% - -Sri Lanka Govt/Central Bank securities - 0% - -Other Securities guaranteed by Sri Lanka Govt - 0% - -Loans & Advances 5,471,004 4,465,969 5,384,068 4,384,194Against deposits with the company 86,935 81,775 0% - -Against SL Govt guarantee/securities - - 0% - -Against dues/securities/guarantees of CBSL - - 0% - -Other loans & advances 5,384,068 4,384,194 100% 5,384,068 4,384,194Fixed assets 429,969 422,658 100% 429,969 422,658Other assets 369,993 337,712 100% 369,993 337,712
b) Capital Base 2010/2011 2009/2010 (Rs.000) (Rs.000)
Tier I : Core Capital 1,098,290 904,900Issued and paid up ordinary shares 533,680 213,472Statutory Reserve Fund 100,036 86,536Published retained profits/(accumulated losses) 1,764 (33,127)General & other reserves 462,810 638,018
Tier 2 : Supplementary Capital - -Eligible revaluation reserves - -Eligible general provisions - -Approved hybrid capital instruments - -Minority interest arising from preference shares issued by subsidiaries - -Eligible approved unsecured subordinated term debt - -
Total Capital Base 1,098,290 904,900
c) Capital Adequacy RatioCore Capital Ratio
= Core Capital x 100 17.66% 17.49%
Risk Weighted Assets
Total Risk Weighted Capital Ratio =
Capital Base x 100 17.66% 17.49% Risk Weighted Assets
Capital Adequacy

Annual Report 2010/1188
Relevant Central Bank Directions Applicable to Registered Finance Companies (RFC)
Capital AdequacyEvery RFC has to maintain a minimum total risk weighted capital adequacy ratio of 10% in relation to its risk weighted assets. The constituents of the capital are divided into:
(i) Tier I – Core CapitalThis represents permanent shareholders’ equity and reserves created or increased by appropriations of retained earnings or other surpluses, including share premiums, retained profits and other reserves. The core capital ratio should constitute not less than 5%, i.e. this has to be at least half of the total risk weighted capital adequacy ratio.
(ii) Tier II – Supplementary CapitalRepresents revaluation reserves, general provisions and other capital instruments which combine certain characteristics of equity and debt, such as hybrid capital instruments and unsecured subordinated term debts.Supplementary capital should not exceed 100% of the core capital.
The Central Bank also issues guidelines from time to time, to be used in computing total risk weighted assets.
Capital Adequacy Defined Capital adequacy is measured by the ratio of the company’s capital to its risk-weighted assets. This ratio is calculated in accordance with the methodologies issued by the Central Bank of Sri Lanka.
The company’s capital adequacy ratios improved in comparison to the previous year, mainly due to ploughing back of profits as reserves. The capital adequacy ratios achieved for the current year are well above the mandatory requirement stipulated, which is 5% for core capital ratio – Tier 1 and 10% for total Risk Weighted Capital Ratio.
The capital base comprises two capital structures namely, Tier 1 Capital and Tier 2 Capital.
Tier 1 Capital comprises paid up ordinary share capital, statutory reserve fund, retained earnings and other reserves excluding revaluation reserve.
Tier 2 Capital includes revaluation reserve, general provision, hybrid capital and subordinated term debt. The aggregate of Tier 2 Capital should not exceed 100% of Tier 1 Capital for purposes of calculating the risk weighted capital ratio.
In determining the capital adequacy ratios, assets are weighted based on the degree of credit risk exposure. Four risk weightings have been defined based on the risk interest in each category. The weights range from 0%, 25% and 100%.
In general a finance company having a high capital adequacy ratio is considered at lesser risk than a finance company with a low capital adequacy ratio.
Liquid AssetsEvery RFC should have a minimum holding of liquid assets at any given time. Liquid assets mean:
(a) Cash in hand(b) Balances in a current or deposit account in a commercial bank, free from any banker’s charge or lien(c) Sri Lanka Government Treasury Bills free from any charge or lien

Senkadagala Finance Company PLC 89
(d) Sri Lanka Government securities maturing within one year and free from any charge or lien.(e) Central Bank of Sri Lanka securities maturing within 1 year and free from any charge or lien.(f) Cash balance, if any, maintained with the Central Bank of Sri Lanka.
The minimum limit applicable is:1) For time deposits – 10% of outstanding deposits2) For certificates of deposit – 10% of the face value of the certificates3) For savings deposits – 15% of the outstanding deposits
The companies should maintain the liquid assets in the form of (c), (d) and (e) above equivalent to 10% of its average month-end deposit liabilities of the preceding financial year.
Direction No. 3 of 2006Bad and doubtful debts provided for under this direction are subject to a minimum of:(a) 50% of all advances in arrear for a period of 6 to 12 months(b) 100% of all advances in arrear for 12 months or more
A company may deduct the value of land and buildings held as collateral for a particular advance, in arriving at the provision figure under both (a) and (b) above, subject to the following conditions:
1) The value so deducted should not exceed the value decided by a professional valuer at the time of granting the advance.2) In case of residential properties occupied by the borrower or a tenant, there should be an agreement to grant vacant
possession in the event of the sale of such property.
Finance Companies (Minimum Core Capital)Direction No. 1 of 2006Every RFC is required to maintain, at all times, an unimpaired core capital of not less than Rs. 200 mn with effect from 1st February 2006. The direction provides for granting the RFCs that did not meet the minimum core capital requirement of Rs. 200 mn on 1st February 2006, a period of 30 months to fulfill the requirement subject to certain requirements.
Single Borrower LimitDirection No. 4 of 2006In the case of an individual borrower, the maximum single advance or the aggregate advances granted and the aggregate outstanding at any point of time on advances granted should not exceed 10% of the capital funds of the finance company.
This limit is 15% for any group of corporate or unincorporated borrowers with common directors or common partners or common proprietors.
Capital funds generally mean paid-up capital and permanent free reserves, and may include unsecured debentures and other loan stocks if approved by the Monetary Board.

Annual Report 2010/1190
Distribution of Shareholding
Shareholders as at 31st March 2011 and 2010
31st March 2011 31st March 2010 NAME NO. OF % NO. OF % SHARES SHARES
1. E. W. Balasuriya & Company (Pvt) Ltd 30,088,050 56.38 12,635,220 59.192. Mr. L. Balasuriya 3,065,832 5.74 1,400,000 6.563. Dr. A. Balasuriya 3,065,832 5.74 1,400,000 6.564. Mr. R. Balasuriya 3,065,832 5.74 1,400,000 6.565. Dr. M. Balasuriya 3,065,832 5.74 1,400,000 6.566. Dr. (Mrs) G. Madan Mohan 3,065,832 5.74 1,400,000 6.567. Mrs. L. Fernando 2,570,002 4.82 1,166,664 5.478. Mr. P. P. K. Ikiriwatte 2,052,502 3.85 - -9. Mr. J. K. Jayatileke 2,052,492 3.85 - -10. Mr. D. K. C. R. Fernando 495,830 0.93 233,332 1.0911. Mrs. S. Thaha 389,000 0.73 155,600 0.7312. Mrs. C. Fernando 155,600 0.29 62,240 0.2913. Estate of Late Mr. D.G.K. Hewamallika 155,600 0.29 62,240 0.2914. (Late) Mr. E. W. Balasuriya 41,660 0.08 16,664 0.0815. Mr. M. M. Ariyaratne 22,400 0.04 8,960 0.0416. Mrs. R. Dullewe 6,100 0.01 2,440 0.0117. Mr. C. Y. Ching 4,800 0.01 1,920 0.0118. Mrs. S. I. A. Ching 4,800 0.01 1,920 0.0119. Mr. Lakshman Balasuriya - The Trustee of the Capitalization issue -2010 4 0.00 - - 53,368,000 100

Senkadagala Finance Company PLC 91
Sources and Distribution of Funds
a) Sources and Distribution of Funds(Rs. millions) 2010 2011
Depositors’ funds 2,094 2,393Bank & other institutional borrowings 2,518 2,745Internally generated funds 692 581Stated capital 213 534Other sources 369 636 5,886 6,889
b) Use of Funds 2010 2011
Interest bearing assets excluding money market Instruments 4,400 5,402Cash & near cash items 659 617Fixed assets 423 430Other assets 404 440 5,886 6,889
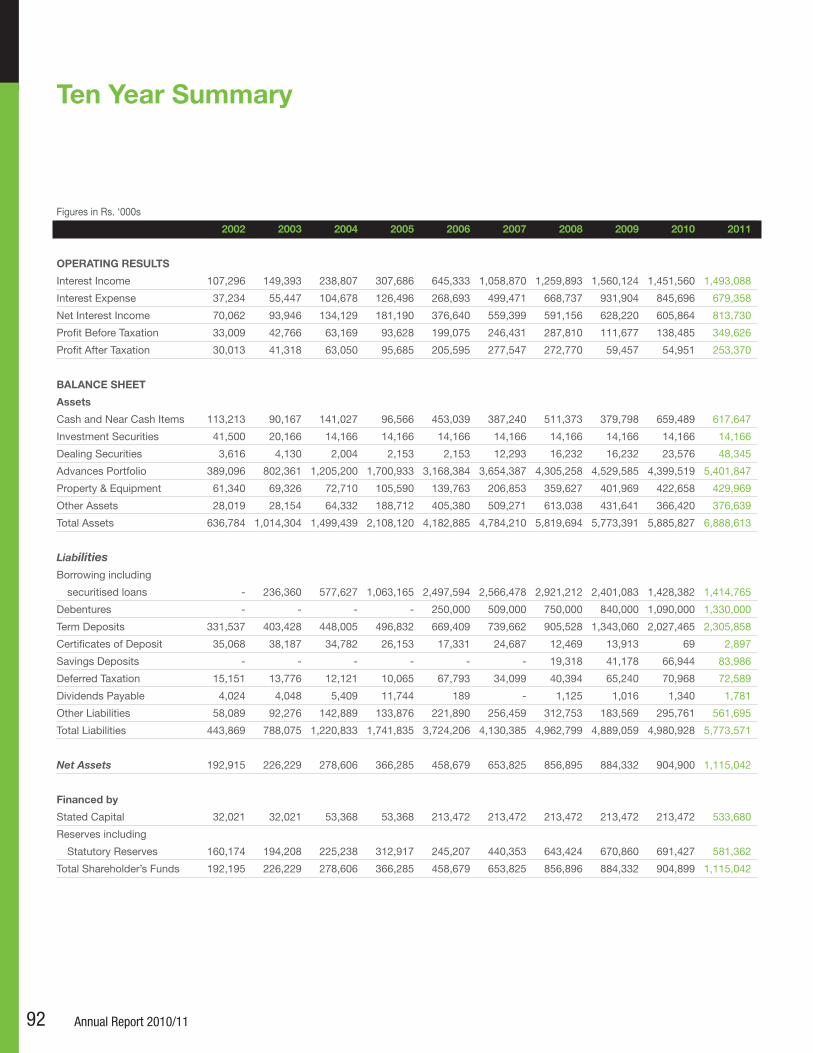
Annual Report 2010/1192
Ten Year Summary
Figures in Rs. ‘000s
2002 2003 2004 2005 2006 2007 2008 2009 2010 2011
OPERATING RESULTS
Interest Income 107,296 149,393 238,807 307,686 645,333 1,058,870 1,259,893 1,560,124 1,451,560 1,493,088
Interest Expense 37,234 55,447 104,678 126,496 268,693 499,471 668,737 931,904 845,696 679,358
Net Interest Income 70,062 93,946 134,129 181,190 376,640 559,399 591,156 628,220 605,864 813,730
Profit Before Taxation 33,009 42,766 63,169 93,628 199,075 246,431 287,810 111,677 138,485 349,626
Profit After Taxation 30,013 41,318 63,050 95,685 205,595 277,547 272,770 59,457 54,951 253,370
BALANCE SHEET
Assets
Cash and Near Cash Items 113,213 90,167 141,027 96,566 453,039 387,240 511,373 379,798 659,489 617,647
Investment Securities 41,500 20,166 14,166 14,166 14,166 14,166 14,166 14,166 14,166 14,166
Dealing Securities 3,616 4,130 2,004 2,153 2,153 12,293 16,232 16,232 23,576 48,345
Advances Portfolio 389,096 802,361 1,205,200 1,700,933 3,168,384 3,654,387 4,305,258 4,529,585 4,399,519 5,401,847
Property & Equipment 61,340 69,326 72,710 105,590 139,763 206,853 359,627 401,969 422,658 429,969
Other Assets 28,019 28,154 64,332 188,712 405,380 509,271 613,038 431,641 366,420 376,639
Total Assets 636,784 1,014,304 1,499,439 2,108,120 4,182,885 4,784,210 5,819,694 5,773,391 5,885,827 6,888,613
LiabilitiesBorrowing including
securitised loans - 236,360 577,627 1,063,165 2,497,594 2,566,478 2,921,212 2,401,083 1,428,382 1,414,765
Debentures - - - - 250,000 509,000 750,000 840,000 1,090,000 1,330,000
Term Deposits 331,537 403,428 448,005 496,832 669,409 739,662 905,528 1,343,060 2,027,465 2,305,858
Certificates of Deposit 35,068 38,187 34,782 26,153 17,331 24,687 12,469 13,913 69 2,897
Savings Deposits - - - - - - 19,318 41,178 66,944 83,986
Deferred Taxation 15,151 13,776 12,121 10,065 67,793 34,099 40,394 65,240 70,968 72,589
Dividends Payable 4,024 4,048 5,409 11,744 189 - 1,125 1,016 1,340 1,781
Other Liabilities 58,089 92,276 142,889 133,876 221,890 256,459 312,753 183,569 295,761 561,695
Total Liabilities 443,869 788,075 1,220,833 1,741,835 3,724,206 4,130,385 4,962,799 4,889,059 4,980,928 5,773,571
Net Assets 192,915 226,229 278,606 366,285 458,679 653,825 856,895 884,332 904,900 1,115,042
Financed by
Stated Capital 32,021 32,021 53,368 53,368 213,472 213,472 213,472 213,472 213,472 533,680
Reserves including
Statutory Reserves 160,174 194,208 225,238 312,917 245,207 440,353 643,424 670,860 691,427 581,362
Total Shareholder’s Funds 192,195 226,229 278,606 366,285 458,679 653,825 856,896 884,332 904,899 1,115,042

Senkadagala Finance Company PLC 93
Key Ratios & Indicators
2002 2003 2004 2005 2006 2007 2008 2009 2010 2011
Capital Adequacy
Equity as a % of Total Assets 30.18 22.3 18.58 17.37 11.38 14.28 14.61 15.32 15.37 16.19
Equity as a % of Total Deposits plus borrowings 57.97 35.36 27.16 23.48 13.99 17.94 18.72 19.29 19.62 21.7
Core Capital - Tier 1 ratio 36.85 26 21.46 18.16 14.34 15.85 16.84 16.55 17.36 17.7
Core Capital - Tier 2 ratio 36.85 26 21.46 18.16 14.34 15.85 16.84 16.55 17.36 17.7
Earnings Return on Average Total Assets (%) 5.55 5.23 5.29 5.63 6.95 5.8 5.31 2.25 2.96 6.82
Return on Average Equity (%) 18.18 20.62 26.35 31.47 50.62 49.69 36.73 15.04 19.29 43.13
Earnings per Share (Rs.) 9.37 7.74 11.81 17.93 10.02 13.53 11.29 2.79 1.03 4.75
Dividends per Share (Rs.) 2.5 2.5 2 3.7 4 3.86 3.27 1.5 0.68 0.81
Interest Cover (Times) 1.89 1.78 1.64 1.8 1.82 1.52 1.42 1.14 1.2 1.66
Dividend Cover (Times) 3.75 3.1 5.91 4.85 2.5 3.5 3.46 1.86 1.35 5.86
Liquidity Liquid Assets as a % of Total Assets (%) 17.78 8.89 9.41 4.58 10.79 8.08 8.72 6.58 11.20 8.97
Liquid Assets as a % of Total Deposits (%) 30.06 20.42 27.69 18.46 53.43 53.43 54.56 27.16 31.47 25.83

Annual Report 2010/1194
Glossary of Financial Terms, Terminology and Accounting Standards
Accounting ConventionAccounting Convention is the basis used to prepare financial statements. Generally this would require that an organisation conforms to a set of principles and conventions, applied consistently, with due regard to prudence, materiality and substance. The financial statements are prepared with regard to a set of Accounting Standards laid down by the Institute of Chartered Accountants of Sri Lanka.
Capital Adequacy RatioThe percentage of risk adjusted assets that is met by capital funds. The Central Bank has defined the types of Capital and Reserves that could be considered as capital funds.
Capital Adequacy ratios are a measure of long-term solvency.
Cash and Short-Term FundsThis comprises of cash in hand and money at call and short notice that are easily converted to cash.
Cash Flow StatementA statement setting out the cash generated from operating, investing and financing activities. Operating activities are income generating activities of the Company’s primary lines of business. Investing activities are the acquisition and disposal of long-term assets and investments. Financing activities are the changes in borrowing and equity funds.
Collection IndexThe aggregate sum of monies collected as a percentage of amount due in respect of all advances, for the period under review.
Cost to Income RatioTotal costs excluding provisions as a percentage of net interest income.
Current RatioThe current assets divided by the current liabilities.
Deferred TaxationA sum set aside in the accounts for tax that would become payable in an accounting period other than the period under review.
Depositor Interest CoverProfits before interest and taxes divided by interest paid and payable on deposits.
Dividend per ShareThis is the value of a dividend paid out divided by the number of ordinary shares in issue.
Dividend CoverEarnings per share divided by the dividend per share.
Dividend RateThe rate paid by way of dividend on the ordinary share capital.
Earnings per ShareThis is the net income after taxation divided by the number of ordinary shares in issue.
Economic Value Added (EVA)EVA is a measurement of actual creation of wealth to shareholders. The method of computation is based on the difference between economic profit less the cost of average capital of the firm.
Finance LeaseA lease that conveys to the lessee the right to use the asset for an agreed period at a stated rental.
The lessor retains ownership of the leased asset, and title may or may not be eventually transferred to the lessee at the end of the lease period. All risks and rewards incidental to ownership are with the lessee.
Interest Earning AssetsInterest earning assets are the sum of the advances portfolio and the value of the investments in treasury bills, call money and fixed deposits.
Interest IncomeInterest income is income derived from the company’s Advances portfolio (lease, hire purchase and trade loans), and other investments in Money Market instruments.
Interest CostInterest cost is the sum of money accrued and payable to the sources of borrowed capital. In general it comprises interest payments to depositors and banks.
Internal Capital Generation RateThe value of profits retained within the business as a percentage of profit available for appropriation.
Lending SpreadThe difference between the rate of return on average interest bearing assets and the rate of interest on interest bearing liabilities.

Senkadagala Finance Company PLC 95
Liquidity RatiosThe percentage of Total Assets, and the percentage of Deposit Liabilities that are in the form of Cash and Near Cash items. The liquid assets ratio made mandatory by the Central Bank is a function of all Deposit Liabilities and Net Total Assets. The Central Bank has given a broad definition as to the types of assets that could be considered as Liquid Assets. They include Cash at Bank and in hand free of any charge or lien, plus balances in Deposit accounts with a Licensed Commercial Bank free of any charge or lien, plus monies placed in the form of Sri Lanka Government Treasury bills of maturity less than 12 months, free of any charge or lien. Liquidity ratios are a measure of Short-Term risk.
Net Assets per ShareNet Assets per share is the total value of shareholders’ funds divided by the number of ordinary shares in issue.
Net Interest Margin is the difference between interest income and interest cost divided by average interest earning assets
Net Interest MarginInterest income less interest cost, expressed as a percentage of average lending assets.
Non-Performing PortfolioThe aggregate value of the advances portfolio that has been delinquent for a period in excess of 6 months.
Net Profit per EmployeeNet profit after taxation divided by the number of employees in service at the end of a financial year.
Operational ProfitOperational profit is the profit derived from earning assets. The operational profit is the difference between the net interest income and other direct costs.
Performing PortfolioThe aggregate value of the advances portfolio that is non-delinquent. Usually the test used is the period of delinquency. If such period is less than 6 months, it is considered as performing.
Post Balance Sheet EventsThese are events that occur after the Balance Sheet date. Such events are:
a) Those that provide further evidence of conditions that existed at the Balance Sheet date and,
b) Those that are indicative of conditions that arose subsequent to the Balance Sheet date.
Return on Average EquityProfits before taxation divided by the average equity.
Return on Average Total AssetsProfits before taxation divided by the average total assets.
ROAE (Return on Average Equity)Profits before taxation divided by the average value of equity funds.
Sources and Distribution of FundsA statement setting out in absolute and percentage terms the sources of total funds, and how such funds have been invested.
Sri Lanka Accounting Standard 33 (SLAS 33)Revenue recognition and disclosure in financial statements of finance companies.
This accounting standard is applicable to licensed finance companies, and is published by the Institute of Chartered Accountants of Sri Lanka. The standard contemplates the basis and convention for recognizing income, and in general includes the following:
a) Interest income recognitionb) Classification of Performing and Non-Performing Assetsc) Recognition of income derived from service charges and
default interestd) Accounting for lump sum paymentse) Balance sheet contingencies, commitments and off
balance sheet eventsf) Maturity of assets and liabilitiesg) Losses on loans and advancesh) General finance company riski) Assets pledged as securityj) Disclosure of related party assets
Stock Out on HireThe value of the principal sum not yet fallen due in respect of the advances portfolio (leasing, hire purchase and trade loans) at the end of the accounting period.
Value Added StatementValue of wealth created in any particular period by utilizing specific financial services and how such wealth is distributed amongst competing stakeholder groups.

Annual Report 2010/1196
Branch Address Tel. Number Fax Number Manager / Officer In Charge
Aluthgama No. 154, 1st Floor, Galle Road, Aluthgama.
034-2270573 034-2270578 Chanaka Welikala [email protected]
Anuradhapura No. 561/30, Priman Mawatha, Anuradhapura.
025-2237969 025-2237989 Chaminda K. Chandrasiri
Badulla No. 2, Riverside Road, Badulla.
055-2224401 055-2224407 Prabhath Weerasinghe [email protected]
Colombo 2nd Floor, No. 267, Galle Road, Colombo 3
011-2301301 011-2301937 Salinda Deergawansa [email protected]
Embilipitiya No. 325C, Ratnapura Road, Pallegama, Embilipitiya.
047-2261991 047-2261996 Malinda Weerakoon [email protected]
Galle No. 70 A 1/1, Colombo Road, Kaluwella, Galle.
091-2248111 091-2248116 Taxila De Zoysa [email protected]
Gampaha No. 560 A, Colombo Road, Gampaha
033-2233555 033-2233560 Muditha Withanage [email protected]
Horana No. 246, Panadura Road, Horana.
034-2262770 034-2262776 Ravi Karunaratne [email protected]
Ja-Ela No. 165/3, Colombo Road, Ja-Ela.
011-2247861 011-2247866 Chandana V. Kumara [email protected]
Kaduwela Kumara Building, 502/10, Colombo Road, Kaduwela.
011-2538180 011-2538186 Samantha Welivita [email protected]
Kandy No. 12, Kotugodella Veediya, Kandy.
081-2201201 081-2201207 Sampath Hettiarachchi [email protected]
Katugastota No. 437B, 1st & 2nd Floor, Katugastota Road, Kandy
081-2213860 081-2213867 K. Ravindrakumar [email protected]
Kegalle No. 263, Colombo Road, Kegalle.
035-2221277 035-2221281 Kapila Wanniarachchi [email protected]
Kelaniya No. 457, Kandy Road, Dalugama, Kelaniya.
011-2914714 011-2914887 Rienzie Muttupulle [email protected]
Kuliyapitiya No. 74 1/1, Hettipola Road, Kuliyapitiya.
037-2284630 037-2284635 Senaka Atapattu [email protected]
Branch Network

Senkadagala Finance Company PLC 97
Branch Address Tel. Number Fax Number Manager / Officer In Charge
Kurunegala No. 34, Kandy Road, Kurunegala.
037-2220402 037-2220405 Mangala Munasinghe [email protected]
Maharagama No. 161/1/A, High Level Road, Maharagama.
011-2896888 011-2896052 Vishwanath Fernando [email protected]
Matale No. 97,97A, Kings Street, Matale.
066-2222954 066-2222960 Malinda Bandaranayake
Matara No. 306, New Tangalle Road, Matara.
041-2233891 041-2233896 Tasith Samarasekara [email protected]
Mount Lavinia No. 246 1/1, Galle Road, Ratmalana South, Mount Lavinia.
011-2715001 011-2715002 Jagath Jayawardena [email protected]
Negombo No. 149, 1st Floor, Rajapaksha Broadway, Negombo.
031-2223456 031-2223462 Maheel Senanayake [email protected]
Nittambuwa No. 550/1/12, Colombo Road, Nittambuwa.
033-2297030 033-2297035 Jayantha Kumara [email protected]
Nugegoda No. 86, Nawala Road, Nugegoda.
011-2856600 011-2856650 Dharshana Kodikara [email protected]
Nuwara Eliya No. 26, Upper Lake Road, Nuwara Eliya.
052-2224123 052-2224128 Sujan Karunaratne [email protected]
Panadura No. 229, Galle Road, Panadura.
038-2243990 038-2243995 Vipul Chandrasiri [email protected]
Pelawatta No. 1067 ,Pannipitiya Road , Battaramulla.
011-2774140 011-2774145 Rukshan Kanagasundaram
Puttalam Nos. 1,2,3,4 (upstair), Kurunegala Road, Puttalam.
032-2266783 032-2266789 Diroshan Thamel [email protected]
Ratnapura No. 19, Kudugalwatte, Ratnapura
045-2226890 045-2226895 Dushmantha Gunawardana
Wattala No. 264, Negombo Road, Wattala.
011-2949611 011-2949616 Janaka Gonaduwage [email protected]
Wennappuwa No. 272, Chilaw Road, Wennappuwa.
031-2245266 031-2245271 J.Udaya Fernando [email protected]

Annual Report 2010/1198
Notice of Meeting
NOTICE IS HEREBY GIVEN that the 42nd Annual General Meeting of Senkadagala Finance Company PLC., will be held at the Registered Office of the Company, 2nd Floor, No. 267, Galle Road, Colombo 3 on 21st September, 2011 at 11 a.m. for the following purpose:
I. To receive and consider the Annual Report of the Board of Directors and the Statements of Account for the year ended 31st March 2011 and Report of the Auditors thereon.
II. To declare a Final Dividend of Rs. 20,279,840 (0.38 per share) to the shareholders of the company as recommended by the board of directors.
III. To appoint Mr. S.K. Wickremesinghe, who is 83 years of age, a director in terms of Section 211 of the Companies Act, No. 7 of 2007. Accordingly, the following resolution is to be passed for this purpose, if thought fit.
IT IS HEREBY RESOLVED: “To re elect Mr. S.K. Wickremesinghe, who is 83 years of
age, a director in terms of Section 211 of the Companies Act, No. 7 of 2007 and it is specially declared that the age limit of 70 years referred to in Section 210 of the Companies Act, No. 7 of 2007 shall not apply to the said Mr. S.K. Wickremesinghe
IV. To appoint Mr. L.G.D.C.L.S. Herath, who is 77 years of age, a director in terms of Section 211 of the Companies Act, No. 7 of 2007. Accordingly, the following resolution is to be passed for this purpose, if thought fit.
IT IS HEREBY RESOLVED: “ To re elect Mr. L.G.D.C.L.S. Herath, who is 77 years of
age, a director in terms of Section 211 of the Companies Act, No. 7 of 2007 and it is specially declared that the age limit of 70 years referred to in Section 210 of the Companies Act, No. 7 of 2007 shall not apply to the said Mr. L.G.D.C.L.S. Herath.
V. To re appoint the retiring Auditors, M/s. KPMG Ford, Rhodes, Thornton & Company – Colombo for the ensuing year and to authorise the directors to determine their remuneration.
By order of the Board ofSENKADAGALA FINANCE CO. PLC
Sgd.Managers and Secretaries (Private) LimitedSecretaries
Colombo10th June 2011
Note:i. A Member entitled to attend and vote at the Meeting is
entitled to appoint a proxy who need not be a member, to attend instead of him/her. A proxy may vote on a poll or on a show of hands and speak at the meeting.
ii. A form of proxy is enclosed in this Report.
iii. The completed form of proxy should be deposited at the Registered office of the Company at 2nd Floor, No. 267, Galle Road, Colombo 3 not less that 48 hours before the time for holding the Meeting

Senkadagala Finance Company PLC 99
Form of Proxy
I/we……………………………………………………………………………………………...............................................…………………..…
of………………………………………………………………………………………………………..………………………………………………Being a *member/members of Senkadagala Finance Company PLC hereby appoint:
Mr. Sarath Kusum Wickremesinghe of Colombo or failing himMr. Lakshman Balasuriya of Colombo or failing himDr. Asoka Balasuriya of Kandy or failing himMr, Rohan Balasuriya of Colombo or failing himDr. Mahendra Balasuriya of Colombo or failing himDr. (Mrs) Gayathri Madan Mohan of Colombo or failing herMrs. Lakshmi Fernando of Colombo or failing herMr. L.G.D.C. Lionel Sirimanne Herath of Nugegoda or failing himMr. W. A. T. Fernando of Colombo or failing him
Mr/Mrs……………………………………………………………………………….…................................................................................ of
…………………………………………………………………………………….................................…………………………………………as *my/our proxy to vote for *me/us on *my/our behalf at the 42nd Annual General Meeting of the Company to be held at the Registered Office of the Company, 2nd Floor, No. 267, Galle Road, Colombo 3 on the 21st day of September, 2011 at 11 a.m. and at any adjournment thereof, and at every poll which may be taken in consequence thereof.
FOR AGAINST
i To adopt the financial statements of the company for the year ended 31st March, 2011
ii To declare a final dividend of Rs. 0.38 per share for the financial year ended 31st Match 2011
iii To re-elect Mr. S.K. Wickremesinghe as a director in terms of Section 211 of the Companies Act No. 7 of 2007.
iv To re-elect Mr. L.G.D.C.Lionel Sirimanne Herath as a director in terms of Section 211 of the Companies Act No. 7 of 2007.
v To re-appoint the retiring auditors M/s KPMG Ford, Rhodes, Thornton & Co. and to authorize the directors to fix their remuneration
Signed this ……………………………day of ……………………….….Two thousand and eleven.
……………………………………………………. Signature
Note1. * Please delete the inappropriate words2. Instructions as to completion are set out on the reverse hereof

Annual Report 2010/11100
INSTRUCTIONS AS TO COMPLETION1. Kindly perfect the Form of Proxy after filing in legibly your name in full and address and by signing in the space provided.
Please fill in the date of signature.
2. A member entitled to attend and vote at the meeting is entitled to appoint a proxy who need not be a member, to attend and/or vote instead of him/her.
3. In the case of a corporate member, the form of proxy must be completed under its Common Seal, which should be affixed and attested in the manner prescribed by the Articles of Association.
4. If the form of proxy is signed by an Attorney, the relevant Power of Attorney should also accompany the completed form of proxy, in the manner prescribed by the Articles of Association.
5. The completed form of proxy should be deposited at the Registered Office of the Company, 2nd Floor, No. 267, Galle Road, Colombo 3 not less than Forty Eight (48) hours before the appointed time for the meeting.
Form of Proxy Contd.

Corporate Information
Legal Status• Quoted Public Limited Liability Company incorporated on
29th December 1968. The Company re-gistered under the Companies Act, No. 7 of 2007.
• Approved and registered under the Finance Companies Act, No. 78 of 1988
• Approved and registered under the Finance Leasing Act No. 56 of 2000.
• An Approved Credit Agency under Mortgage Act, No. 6 of 1949 and the Trust Receipt Ordinance, No. 12 of 1947.
Date of Incorporation29th December 1968
Board of Directors Mr. S. K. Wickremesinghe B.Sc.(Cey)Dr. Asoka Balasuriya B.Sc.(Lond.), Ph.D. (Lond.)Mr. Lakshman Balasuriya B.Sc.(Lond), M.Sc. (Lancaster) Mr. Rohan Balasuriya B. Sc.(E.Ang.), M.Sc. .(E.Ang.)Dr. Mahendra Balasuriya B.V.Sc.Mrs. Lakshmi Fernando B.Sc. (Hons.)Dr. (Mrs.) Gayathri Madan Mohan M.B.B.S.Mr. Cyril Lionel Srimanne Herath B.A. (Cey)Mr. Ajith Fernando FCMA (UK), MA (Colombo)
Company Registration NumberPB 238 PQ
Taxpayer Identification Number (TIN)104028349
Registered Office2nd Floor, No.267, Galle Road, Colombo 3.Tel: 011-2301301Fax: 011-2301937Email: [email protected]
Web Sitewww.senfin.com
SecretariesManagers and Secretaries (Pvt) LimitedNo. 8, Tickell RoadColombo 8.
AuditorsKPMG Ford, Rhodes, Thornton & Co. Chartered Accountants Sir Mohamed Macan Markar Mawatha Colombo 3.
Legal ConsultantsMr. Parakrama Keppetipola (Attorney- at-Law)Mr. M.S. Sultan (Attorney-at-Law)
Internal AuditorsErnst & Young Advisory Services (Pvt) Ltd.No. 839/2, Peradeniya Road,Kandy.
BankersCommercial Bank of Ceylon PLCHatton National Bank PLCSampath Bank PLCHonkong & Shanghai Banking Corporation Limited
Produced by Copyline (Pvt) Ltd Printed by Gunaratne Offset Ltd

Senkadagala Finance Company PLC
Annual Report 2010/2011
THE
LAIDPLANS BEST
Senkadagala Finance Company PLC 2nd Floor, No. 267, Galle Road, Colombo 3.Tel: 011-2301301Fax: 011-2301937Email: [email protected]
Senkad
agala Finance Com
pany P
LC | A
nnual Rep
ort 2010/2011