seismic yield estimation using teleseismic p-and pkp-waves
TRANSCRIPT

Geophysical Journal (1988) 95, 163-179
Seismic yield estimation using teleseismic P- and PKP-waves recorded at the GRF-(Grafenberg) array
Jorg Schlittenhardt Bundesansralt fiir Geowissenschaften und Rohstoffe, Siilleweg 2, 0-3000 Hannover 51, F. R. Germany
Accepted 1988 April 25. Received 1988 April 22; in original form 1987 November 9
SUMMARY In this paper the ‘transportability’ of magnitude-yield relations for nuclear explosions at the Nevada Test Site (NTS), USA is investigated. This test of applicability is done by comparing the yield estimates obtained in this study for the NTS and other test sites at eastern Kazakhstan, Novaya Zemlya and Mururoa (French Polynesia) to selected yield estimates of more large-scale investigations using different and more comprehensive data sets. It is shown that the transportability of magnitude-yield relations becomes possible if the differences in the absorption of seismic body waves in the upper mantle beneath the different test sites are correctly accounted for. To estimate the yields of explosions from the four test sites, a single magnitude-yield relation has been used and a uniform methodology has been applied for the determination of source-region corrections for upper mantle attenuation. A linear relation between the Grafenberg station-magnitude m,(GRF) and the network magnitude of the ISC is established, which can be used to predict the network mb from a measurement of rnb(GRF). Recordings from PKP-waves from French nuclear explosions in Mururoa can, through the appropriate determination of a core-phase magnitude rk,(GRF), be used analogously for yield estimation: However, because of the possible network-bias problem for mb measurements of Mururoa events and because of the less well known absorption correction the results for that test site must be considered less substantiated. Using the derived magnitude-yield relations the smallest observed magnitudes can be converted into yield values. The detection threshold of the GRF-array for the single station A1 lies in the kt-range for the eastern Kazakhstan and Novaya Zemlya test sites and in the 10-kt range for the Nevada Test Site. The detection threshold of the GRF-array beam for the Mururoa test site lies in the kt-range.
Key words: detection threshold, nuclear explosions, PKP core-phases, upper mantle at- tenuation differences, yield estimation
INTRODUCTION
The conventional technique for estimating the yield of underground nuclear explosions from seismic data uses measurements of the body-wave magnitude mb (Rodean 1971; Bolt 1976; Dahlman & Israelson 1977; Bache 1982). During the past several years, however, major research efforts have been made to improve seismic yield estimation techniques, particularly for Soviet explosions in Central Asia with yields near the 150 kt limit of the Threshold Test Ban Treaty (Sykes 1987). These efforts have concentrated on recalculating more accurate values of mb using station corrections (Marshall et al. 1979, 1984; Sykes & Wiggins 1986; Sykes & Ruggi 1987; Smith 1987), accurate determinations of yield using long-period surface waves (Sykes & Cifuentes 1984; Sykes & Wiggins 1986) and the use of the high-frequency surface wave Lg for yield estimation (Nuttli 1986a,b; Alexander et al. 1987). But even more sophisticated methods of yield estimation that utilise greater amounts of the information in the seismograms, like
waveform modelling (Burdick et al. 1984; Lay et al. 1984a,b; Lay 1985; Burger et al. 1986a) or the moment tensor approach for long-period body waves (Wallace et al. 1983; Stevens 1986), have been developed and successfully applied to the data. Several workers have studied the possible effects of tectonic release on yield estimates for short- and long- period body and surface waves (Burger et al. 1986b; Lay et al. 1984c; Wallace et al. 1983, 1985; Sykes & Cifuentes 1984; Given & Mellman 1985) and have demonstrated that corrections can be calculated that account for this effect. What concerns the accuracy of seismic yield estimation, one of the best seismic methods appears to be the use of the Lg phase. The factor of uncertainty claimed for this method approaches the value of 1.3, at the 95 per cent confidence level, which was found in estimating the yields of announced Nevada Test Site (NTS) explosions (in hardrock, below the water table) with yield above 10kt (Nuttli 1986b). This uncertainty factor corresponds to the uncertainty of f 3 0 per cent which is quoted for the CORRTEX (Continuous Reflectometry for Radius versus Time Experiments) method
163 Downloaded from https://academic.oup.com/gji/article-abstract/95/1/163/601294by gueston 09 February 2018
164 J . Schlittenhardt
(Richards & Lindh 1987), in which the propagation of the explosion generated shock wave is recorded within a certain radius around the detonation point (Virchow et al. 1980). However, it is widely reported that the seismic method in general, at the 95 per cent confidence level, has a factor of uncertainty equal to 2, at least when only one type of seismic method is used (Dahlman & Israelson 1977; Richards & Lindh 1987; Richards 1987).
Yields of underground nuclear explosions cannot be determined directly from seismic observations, but require experiments (explosions with announced yields) for calibrating the observed seismic waves from an explosion at a given test site. Since the USSR and France (for their test site at Mururoa in the South Pacific) have not released yield estimates for any of their weapons tests, methods for the calculation of yields of those explosions can only be indirect. The purpose of this paper is to apply known magnitude- yield relations for explosions at the Nevada Test Site (Murphy 1981) to test sites in eastern Kazakhstan, on Novaya Zemlya and at Mururoa (South Pacific), thus testing the 'transportability' of magnitude-yield relations. Since there exist pronounced differences in the absorption of seismic body waves in the upper mantle beneath the different test sites (Marshall et al. 1979; Der et af. 1985; Burger et al. 1986a; Sykes & Ruggi 1987; Evernden & Marsh, 1987) the application of source-region corrections for differences in the attenuation to the magnitude values for explosions from different test sites is essential. We therefore use magnitude corrections based on a procedure by Marshall et al. (1979).
The basis for the following investigation are the data of the Grafenberg array in southern Germany (for a description of the GRF-array see Harjes & Seidl 1978). The station-magnitude bias caused by anomalies near the GRF-array can be widely overcome by establishing relations between the GRF station-magnitude and the network- magnitude of the ISC/PDE. These relations can be determined for explosions at the Nevada Test Site and the Soviet test site in eastern Kazakhstan by linear regression analysis of the observed magnitude m,(GRF) and the network-magnitude mb of the ISC/PDE. Relative to the French test site at Mururoa GRF is located at an epicentral distance of approximately 144", so that for those events seismic signals from the P K P A-B caustic are observed at GRF. For this distance, by a proper choice of the distance correction factor in the magnitude formula (Gutenberg & Richter 1956), a core-phase magnitude fi,(GRF) can be determined, which in turn can be correlated with the ISC network-magnitude determined from stations outside the core shadow region. Using these linear relations, the network magnitude of a given event can be predicted from a measurement of m,(GRF) or mb(GRF), respectively. After an absorption correction, standard magnitude-yield relations can be evaluated. The yield estimates determined with this procedure, agree, within the confidence limits, with the results of other investigations using different seismic data. Under the assumption that the m,(ISC) values that enter into the regression analysis have zero or small standard error the factor of uncertainty for the yield values for the Semipalatinsk and Novaya Zemlya test sites is about 1.7 and for the Nevada and Mururoa test sites it is slightly below 2.0. However, yield estimations from seismic data basically
are preliminary, because the underlying yield scaling relations could be modified by future calibration experiments.
METHOD
In a review of the available observed magnitude-yield and free-field data from contained underground nuclear explosions in a variety of source media at the Nevada Test Site, Murphy (1981) comes to the conclusion that the seismic coupling for explosions in granite, shale and wet (i.e. for explosions below the water table) tuff/rhyolite emplacement media is about the same. Of course, this does not mean that coupling of explosions in granite, shale and below the water table is exactly identical. There can exist a variation of coupling even among rock of the same type. Compared to these three media (called wet hardrock in the following) explosions in unconsolidated material (e.g. dry tuff and alluvium) couple significantly less efficiently. On the other hand, explosions in salt are inferred to couple more efficiently than any other of the media studied, resulting in a magnitude-yield curve which is offset above the wet hardrock curve by as much as OSm, units. Murphy's (1981) magnitude-yield relation has the following parametric form:
m,(NTS) = c, + c, log Y. The medium dependent parameters are given in Table 1.
Applying known magnitude-yield relations from one test site to other test sites, where no magnitude-yield relations are known, implies assumptions about the coupling efficiency at these sites. In other words, the transportability of a magnitude-yield relationship requires the assumption that the source scales with yield in the same way at all test sites. We assume here that the explosions for all investigated test sites were detonated in wet hardrock. There exists a considerable amount of evidence in the literature that this is a fairly reasonable assumption, at least for explosions with yields larger than a few kilotons in regions where thick layers of dry alluvium are absent. It is commonly believed (e.g. Stevens 1986) that the Soviet test site in eastern Kazakhstan is a hardrock test site, and it can even be supposed that most of the explosions at that test area were detonated in granite (which is shown outcropping within the testing area on available geological maps, Sykes & Ruggi 1987). Similar hardrock conditions can be expected for the Soviet test site on Novaya Zemlya. Burger et af. (1986a, Fig. 9) compare the p P - P delay times from a hardrock test site (Amchitka, Aleutian Islands) and a softrock test site (Pahute Mesa, NTS) with those found for Novaya Zemlya. The majority of Novaya Zemlya events has a p P - P - l o g yield relation similar to the Amchitka relation, confirming that Novaya Zemlya is a hardrock site. For the French
Table 1. Empirical constants c, and c, for some types of rock after Murphy (1981).
cln cs Hardrock* 3.92 0.81 Alluvium 3.43 0.81 Salt 4.42 0.81
* Granite, Shale, wet Tuff/Rhyolite.
Downloaded from https://academic.oup.com/gji/article-abstract/95/1/163/601294by gueston 09 February 2018

Seismic yield estimation 165
nuclear test site on Mururoa, information about the near source structure are difficult to obtain. However, Talandier and Okal (1987) find high P-wave velocities for the basalts underlying the limestone cap in the Rangiroa atoll of the neighbouring Tuamotu Islands from seismic refraction and surface wave studies.
mb(NTS) in equation (1) is the magnitude determined by averaging data from a worldwide network of stations for events within the Nevada Test Site (ISC network magnitude). Similarly, in the following m,(SMI), m,(NVS) and m,(MRU) are the ISC network-magnitudes determined for events within the Semipalatinsk, Novaya Zemlya and Mururoa test sites, respectively. The problem of bias in magnitudes estimated by a network of stations (network- bias) has been addressed in a number of investigations (for a list of references see e.g. Ringdal 1986) and most of these studies have concluded that the bias problem can be significant mainly at low magnitudes. Compared to maximum-likelihood magnitudes conventional mb values are biased high (Ringdal 1986). For large events, however, ISC magnitudes and those computed with Ringdal's (1986) approach give essentially the same values. But still another kind of network-bias can occur, namely when different test-sites are monitored by different networks of stations. This effect could be important in the case of magnitude determinations of Mururoa explosions where a gap of contributing stations exists in the epicentral distance range from at least 20-40", whereas for the other test sites there exists a more or less uniform coverage of stations in the range 20-100" (ISC magnitudes are calculated from data of stations in the latter range). However, no results of an investigation where e.g. an existing larger network is truncated in a numerical experiment to study a possible bias, are known. Clearly this is an important topic which needs further research.
The evaluation of the empirical magnitude-yield relation in equation (1) on the basis of station magnitudes (in this case the GRF station magnitude) is inappropriate because of the well known magnitude bias reported for single station magnitudes. Therefore, on the basis of the available GRF seismograms from explosions at the various test sites, a linear regression analysis of the GRF station magnitude and the ISC network magnitude for events at SMI, NVS, NTS and MRU was made:
I S M I \ f SMI\
f SMI\ / S M I \
In equation (2), c1 and c , are the constants for the regression line following from the regression analysis. The constant cd gives the distance of that pair of lines parallel to the regression line which limits 95 per cent of the data. If one assumes the scatter is normally distributed about some mean, then for large sample numbers N and near the mean of the data this 95 per cent confidence interval cd is given
approximately by two times the standard error of the estimate (Wonnacott & Wonnacott 1985, Chap. 12). In Fig. 1 (which will be discussed later in detail), however, the exact 95 per cent confidence interval is plotted, which deviates from the straight line approximation as one moves away from the mean of the data.
Slopes other than one were allowed in equation (2) for the regression analysis of m,(ISC) and m,(GRF). For the Semipalatinsk test site (Fig. l a ) we obtained a slope significantly different from one. This result is difficult to explain theoretically and one might suspect that a slope less than one could be caused by ISC magnitudes that are too large for small events (bias problem at low magnitudes mentioned above). We have tested this hypothesis for the Semipalatinsk data by introducing lower limits of rnb == 5.0 and mb>5.5 for the ISC magnitudes used for regression analysis. As a result of this test it can be stated that the slopes c1 of the regression lines changed very little (to smaller values) and that the resulting regression lines did not differ significantly within the relevant range of m,(GRF).
Under ideal conditions and if the velocity-, density- and Q-structure beneath the test sites were all identical, an explosion of given yield in any one of the test sites would produce the same ISC network magnitude and the right hand sides of equations (1) and (2) could be readily equated to relate m,(GRF) with yield Y. However, it is a well known fact that absorption of seismic waves which travel in the upper mantle beneath the western United States is significantly higher than in other parts of the Earth (Marshall el al. 1979). Before the magnitude-yield relation for the Nevada Test Site (equation 1) can be transported to other test sites, source-region corrections 6mb which account for differences in attenuation beneath the test sites have to be determined. Graphically speaking, the application of these source-region corrections means that the P-waves from explosions in other source-regions than the Nevada Test Site subsequently undergo the (relatively strong) absorbing conditions in the upper mantle beneath this test site. The equation for the source-region corrections is :
(3)
Now, equating (1) and (3) together with equation (2) gives the relation between the GRF station magnitude m,(GRF) and yield Y :
(4) 1
C1 mb(GRF) =- (Cm - c~ + 6mb + c, log Y cd) .
In equation (4) the constants c1 and c2 of the linear regression and the source-region correction 6mb have to be taken for the test sites in eastern Kazakhstan (SMI), Novaya Zemlya (NVS), Nevada (NTS) and Mururoa (MRU), respectively. Of course, Gm,(NTS) = 0.
SOURCE REGION CORRECTIONS FOR ATTENUATION IN THE UPPER MANTLE
The attenuation of short-period P-waves is governed by the temperature structure of the upper mantle of the Earth at
Downloaded from https://academic.oup.com/gji/article-abstract/95/1/163/601294by gueston 09 February 2018

166 J . Schlittenhardt
depths from about 30 to 200km. The structure of the uppermost mantle can be very different between regions of stable cratonic structure of older geology (like the central and eastern United States, Scandinavia and eastern Kazakhstan) and young tectonic areas like Nevada in the western United States (Marshall et al. 1979). First indications of significant differences in the attenuation of short-period P-waves originating at the various test sites came from comparisons of m,: M, discrimination plots (Liebermann & Pomeroy 1969; Basham 1969; Marshall & Basham 1972) for explosions in the western United States, for which pronounced differences were found in comparison to discrimination plots for explosions in the Aleutians, the USSR and China, respectively.
Marshall et al. (1979) determined magnitude corrections to account for differences in absorption in the upper mantle beneath several source-regions. The basis for the derivation of these magnitude corrections is an empirical relation (which could be well proven for stations in North America) between the P,-velocity and the specific dissipation Qm, established originally by Marshall & Springer (1976). This relation makes it possible to calculate mean values Q, of Q, for the depth range of the upper mantle from given P-wave velocity-depth profiles for arbitrary regions of the Earth. A simple analytical relation (Marshall et al . , 1979, equation 3) gives the amplitude- or magnitude correction relative to a reference model, which has been selected to represent a tectonically stable shield region with Q, = 800. Their &-value for the region beneath the Nevada Test Site, derived from the HWNE model of Helmberger & Wiggins (1971), is 275. The resulting magnitude correction hm,(NTS) relative to the reference model is 0.39 magnitude units (Marshall et al. (1979, Table 6); the magnitude corrections are positive for conditions with greater attenuation than the reference condition). Accord- ing to Marshall et al. (1979) the total bias between e.g. NTS and any other test site is made up of two factors, a source region term and a depth-correction term, taking into account the possible differences in the superposition of pP and P. The depth-correction term as introduced by Marshall et al. corresponds to the case of constructive interference of p P and P , i.e. all explosions are normalized to the maximum amplitude of the resulting interference signal. However, for Pahute Mesa events of announced yields between 10 and 150 kt this depth-correction term is small (Marshall et al. 1979, Table 9), and the sum of the averages of this term and the corresponding source correction gives a value of 0.39 magnitude units which is equal to the value which we have taken directly from their Table 6.
This value (0.39 mb units) is similar to that obtained by Chung & Bernreuther (1981) from earthquake data; they obtained a 0.33 magnitude unit difference between western and eastern North America. The Nevada Test Site explosion data used by Nuttli (1986b), by a comparison of the mb values of explosions and earthquakes of similar size (i.e. with similar m,(Lg)) at the NTS and in eastern North America, give a bias of 0.31 magnitude units between NTS and the eastern United States. In a similar study, Nuttli (1986a) used the differences between the body-wave magnitude and the Lg-wave magnitude for explosions at the Nevada Test Site and at the Soviet test site in eastern Kazakhstan to estimate an mb bias of 0.35 units between the
two sites. Der et al. (1985a,b) have used the fall-off of the seismic spectrum of P-waves with frequencies near 1 Hz to obtain estimates of the relative attenuation beneath various testing areas. Their magnitude bias of 0.35 units is identical with Nuttli’s (1986a) value. On the other hand, Der et d ’ s (1985a,b) magnitude bias of 0.30 magnitude units between the NTS and the place of the nuclear explosion SALMON in Mississippi in the eastern United States is nearly identical to Chung & Bernreuters’s (1981) above cited value (0.33 magnitude units) between the western and eastern United States. In addition, the results of some reciprocal experiments fit at least qualitatively into that picture. In such experiments P-waves from sources outside the area of investigation are observed along a reciprocal path (e.g. at stations within the NTS) and compared to observations in areas of different tectonic structure. As a result of such an experiment, the analysis of recordings from the SALMON explosion gave low t g values for P-waves when observed in the eastern United States and high values in the western United States (Der & McElfresh 1977).
Summarizing these results it can be concluded that it is a well proven fact that differences in the tectonic gross structure (e.g. between regions of older and younger geology, as discussed above) reflect in pronounced differences in the attenuation of short-period waves passing through the upper mantle beneath such different areas. Moreover, this qualitative result can be quantified by the statement that the mb bias is very likely to be in the range 0.3-0.4 rnb units between the Central Asia and Nevada test sites (Sykes 1987).
For the source-region in eastern Kazakhstan, Marshall et al. (1979), Table 6 ) give a magnitude correction Am, of 0.01 magnitude units, relative to their reference model. For the French test site in the South Pacific and for the Soviet test site on Novaya Zemlya, Marshall et al. do not give a magnitude correction explicitly. However, using the Q,-value for the upper mantle of a typical oceanic structure (Q, =410, Ben-Menahem et al. 1970) one can calculate (using equation 3 of Marshall et al. 1979) a Am, of 0.22 magnitude units for the source region in the South Pacific. Marshall et a l .3 &-values for the upper mantle beneath Western Russia and the Scandinavian Shield (derived from the velocity profiles of Mass& & Alexander 1974) are both Q, = 790. Taking this value as being representative for the attenuation beneath the Novaya Zemlya test site, one obtains a correction Amb of 0.04 magnitude units. This value is practically identical to that found for the eastern Kazakhstan test site. This result is in excellent agreement with the results of some other investigations. For example, Der et al. (1985a,b) found identical dissipation times t; from spectra of short-period P-waves for the source-region Novaya Zemlya and Shagan River (eastern Kazakhstan), and Burger et al. (1986a) found, by a comparison of the amplitudes from two events with comparable yield at the Nevada Test Site and the Novaya Zemlya test site, an amplitude bias similar to the bias between NTS and the test site in eastern Kazakhstan.
In the following we do not consider any depth correction terms for events from the eastern Kazakhstan, Novaya Zemlya and Mururoa test sites, i.e. we assume that all explosions at these sites correspond to the case of constructive interference of pP and P. This assumption
Downloaded from https://academic.oup.com/gji/article-abstract/95/1/163/601294by gueston 09 February 2018

Seismic yield estimation 167
Table 2. Magnitude corrections Am, (relative to a reference model, see text) and magnitude corrections 6m, (relative to the absorption beneath the Nevada Test Site) for the absorption in the upper mantle beneath four test sites. bm, is the difference of Am, for the NTS minus Am, for the Semipalatinsk, Novaya Zernlya and Mururoa test sites, respectively.
Source-region Am,, 6m, ~~
Semipalatinsk Test Site 0.01 0.38 Novaya Zemlya Test Site 0.04 0.35 Nevada Test Site 0.39 0.00 Mururoa Test Site 0.22 0.17
seems to be reasonable at least for the Novaya Zemlya test site where the p P - P delay times (Burger et al., 1986a, Fig. 9) were found to be in the range 0.5-0.6s (for yields of approximately 40-150 kt) which corresponds to about half the observed signal period. Table 2 summarizes the magnitude correction Am, relative to the reference model and the magnitude corrections am, relative to the absorbing conditions in the upper mantle beneath the Nevada Test Site. 6m, for a given test site is the difference of Am, for the Nevada Test Site and Am, for the test site under consideration.
ESTIMATION OF NETWORK (ISC) m b FROM GRF STATION MAGNITUDES
To set up the relation between the GRF station-magnitude m,(GRF) and the network magnitude m,(ISC), displays of all available GRF recordings from nuclear explosions at four test sites from the period 1975 to 1986 were made to re-determine the magnitude for each event. Recordings of events which obviously were multiple explosions were omitted. We used short-period simulations of the broadband data according to the WWNSS-SP system transfer function (Seidl 1980). The maximum zero-to-peak trace amplitude and the corresponding period in a 20-s time window following the first onset were used for magnitude calculation (Gutenberg & Richter 1956). With the exception of the Mururoa test site (where we used the array-beam), all readings were taken from the vertical component of the GRF station A l . The restriction to A1 single-component seismograms allowed us to use a broader data basis (the full extension of the array has been completed in April 1980). The results are listed in Tables 4, 6, 7 and 9. The constants cl, c2 and cd of the linear regression according to equation (2) are listed in Table 3.
Semipalatinsk test site
The Soviet test site in eastern Kazakhstan can be subdivided into three distinct sub-areas at Konystan, Degelen Mountain
Table 3. Constants cl, c2 and cd of the linear regression analysis according to equation (2).
~ ~
c1 CZ cd Semipalatinsk Test Site 0.81 1.20 0.22 Novaya Zernlya Test Site 0.87 0.63 0.24 Nevada Test Site 0.98 0.01 0.29 Mururoa Test Site 0.91 0.39 0.29
and Shagan River. No distinction between these sub test sites (Marshall et al. 1984) was made, and all events were treated uniformly. The mean distance of the GRF-array to the test site is 42". At this distance structural phases from the mantle discontinuities play only a minor role. Fig. l a shows the network magnitude m,(ISC) as a function of the station magnitude m,(GRF) for 96 events. The assumption of a linear relation according to equation (2) is justified by the distribution of the data points. From the 96 available recordings, the smallest and biggest determined m,(GRF) value was 4.2 and 6.2, respectively.
Novaya Zemlya test site
The Novaya Zemlya test site has two subsites separated by about 300km. The majority of the underground nuclear tests were detonated at the northern subsite near 73"N, 55"E (Sykes & Ruggi 1987). Burger et al. (1986a) report systematically different waveform and amplitude pattern from the northern and southern subsites. We use only data from the northern part of the test site, which is located at a distance of approximately 30" from the GRF-array. As this distance is at the beginning of the teleseismic window, structural phases from the mantle discontinuities can be expected to be still present in the time interval following immediately after the first onset. From travel-time calculations, the reflection from the 670-km discontinuity is expected to arrive approximately 5 s after the first onset. This effect complicates seismogram interpretation with respect to the isolation of source effects. Fig. l b shows the network magnitude mb(ISC) as a function of the station magnitude m,(GRF) for 11 events. The assumption of a linear relation according to equation (2) is justified by the distribution of the data points. From the 11 available recordings of Novaya Zemlya events, the smallest and biggest determined m,(GRF) value was 4.8 and 6.0, respectively.
Nevada Test Site
The mean distance of the GRF-array to the Nevada Test Site is 82". At this distance the core-reflection PcP follows shortly after the direct P-wave arrival and could possibly complicate magnitude measurements. However, at that distance PcP is a very weak phase with amplitudes always less than 20 per cent of direct P (Schlittenhardt 1986). In the course of this work, a tentative separation and subsequent separate analysis of events from the Pahute Mesa and Yucca Flats (sub-areas within the NTS) was made. This is possible because precise shotpoint locations furnished by the US Department of Energy are published routinely in the Monthly Listings of the PDE of the United States Geological Survey. However, as the result of the separate regression analysis according to equation (2), neither a significant reduction of the scatter in the data points nor a significant change of the two regression lines, relative to the case where all data were treated uniformly, could be found. The effects of possible differences in the deeper crustal and upper mantle structure beneath the two sub test sites (Taylor 1983) on the P-wave amplitudes at GRF seem to be overshadowed by the inherent scatter in the data. In the following, no distinction between the sub test sites Pahute
Downloaded from https://academic.oup.com/gji/article-abstract/95/1/163/601294by gueston 09 February 2018

168 J . Schlittenhardt
Semipalatinsk Test Site:96 magnitude pairs from 1975 - 1985
/
I GRF I b
I I I I I I I I 1
L a IGRF) b m
Nevada Test Site: 65 magnitude pairs
/ from 1975 - 1986 I
I G R F ) [Isc) = 0.01 2 0.6L+ l0.98+0.12)m
Novaya Zemlya Test Site : 11 magnitude pairs 1 from 1975-1985 /
IGRFI b
I I I I I I I I I I
( G R F ) b b L m
Mururoa Test Site : 2 1 magnitude pairs from 1960 - 1985 I /
(GRFI b
m (Isc' = 0.39+0.7L+10.91+0.1L) 6 I
I I I I I I I I L 5 5 6 6
I I I I I I I I I
fi I G R F I b
d L (GRF) b C m
F i e 1. Plot of GRF station magnitude (m,(GRF) and riib(GRF), respectively) versus network magnitude m,(ISC) for, (a) the Semiplatinsk, (b) the Novaya Zemlya, (c) the Nevada and (d) the Mururoa test sites, respectively. The size of the data points is proportional to the number of events represented. The straight lint in each plot is the result of the linear regression of the data, and the (curved) lines above and below mark the 95 per cent confidence interval, i.e. that interval which contains, with 95 per cent confidence, the true m,(ISC) value, when m,(ISC) is estimated from m,(GRF) or m,(GRF), respectively, using the indicated equations. The error indicated in the equations is one standard deviation.
Mesa and Yucca Flats is made, and all events are treated uniformly. Fig. l c shows the network magnitude m,(ISC) as a function of the station magnitude m,(GRF) for 65 events. The assumption of a linear relation is justified by the distribution of the data points, although the scatter, compared to Fig. l a , increases. This can be explained by the smaller amplitude of events from the NTS (with similar size), compared to events from the Semipalatinsk test site.
For the 65 available recordings of NTS events, the smallest and biggest determined m,(GRF) value was 4.8 and 6.3, respectively.
Mu,,,,ros test site
Mururoa is located at a distance of approximately 144" from the GRF-array. Travel-time calculations (Fig. 3) for this
Downloaded from https://academic.oup.com/gji/article-abstract/95/1/163/601294by gueston 09 February 2018
Seismic yield estimation 169
distance range predict a signal composed of three single pulses. The WWNSS-SP simulated synthetic seismogram for that distance and several observed beam-seismograms confirm this theoretical prediction (Fig. 4). Seismograms like those shown in Fig. 4 can be used for yield estimation. However, a completely analogous procedure, as that used for the Soviet and US test sites, cannot be applied, because the classical body wave magnitude of Gutenberg & Richter (1956) is not defined for core-phases. By an appropriate choice of the distance-correction factor, a core-phase magnitude m,(GRF) can be determined, which yields magnitude values comparable to the classical body-wave magnitude (Schlittenhardt 1987). This is achieved by applying the distance correction factor for A=90” to Mururoa events. The core-phase magnitude fi,(GRF) can, in turn, be related to the network magnitude of the ISC, calculated from data from stations outside the core-shadow zone. Fig. Id shows the network magnitude m,(ISC) as a function of the core-phase magnitude m,(GRF) for 24 magnitude pairs from 1980 to 1985. In order to exploit the signal/noise ratio enhancement which can be achieved by beamforming, the core-phase magnitudes were determined from WWNSS-SP simulated GRF-array beams like those shown in Fig. 4. As in the previous cases, the assumption of a linear relation between the network magnitude and the station magnitude according to equation (2) is justified by the distribution of the data points. It should be noted here that this relation can be used also to estimate the network mb of weak Mururoa explosions recorded at GRF which often are not listed in the ISC/PDE bulletins. From the 24 available recordings, the smallest and biggest determined fi,,(GRF) value was 4.6 and 6.0, respectively. The core-phase magnitudes obtained here have values very similar to those determined by the ISC. They become compatible with values derived from the extended amplitude-attenuation curve of the NORSAR-array (Harjes 1985, Fig. 11) after reducing them by 0.5 magnitude units.
MAGNITUDE-YIELD RELATIONS FOR T H E GRF-ARRAY
Tables 1-3 contain the constants needed to relate the GRF station magnitude m,(GRF) and yield Y according to equation (2). Fig. 2 shows plots of the magnitude-yield relation for the GRF-array together with their correspond- ing 95 per cent confidence limits.
Comparison of results for the Semipalatinsk test site
For the examination of the magnitude-yield relation derived here for the Semipalatinsk test site, a set of ten nuclear explosions from the time period 1978-1982 is used. These ten events form a common subset of events which is included in most recent investigations of Semipalatinsk explosions. They can be considered as those events for which the most comprehensive data about source param- eters are available. For nine of these ten explosions (Table 5 ) , there exist precise relocations of Marshall et al. (1984) and the recordings from GRF are available. Additionally, these events were investigated with long- period data (Sykes & Cifuentes 1984; Given & Mellman 1985; Stevens 1986) as well as with short-period data
(Johannson 1984; Nuttli 1986a). All events have F‘ values (ratio of the seismic moments of the tectonic and explosion components) less than 0.4 (Sykes & Cifuentes 1984).
Stevens (1986) determined the moment values Mo of these nuclear explosions from observations of long-period surface waves with the SRO-network. These moment values cannot be directly converted into yield Y, because no M, - Y relation is known for the Semipalatinsk test site. However, Stevens’ (1986) moment estimates are very consistent with the M, values of Sykes & Cifuentes (1984), and the following moment-M, relation can be found:
log Mo = M, + 11.86 f 0.03. (5) Sykes & Cifuentes (1984) give an empirical relation between the surface-wave magnitude M, and yield Y for events with small tectonic release, derived from explosion data from different regions of the Earth:
M, = 2.16 + 0.95 log Y. (6)
Using equations (5) and (6) it is possible to convert Stevens’ (1986) moment values into yield Y. Additiona!ly, using equation (6), yield values can be calculated from Sykes & Cifuentes’ (1984) upper limit-values M,(max) for the surface wave magnitude M, (Table 5). M,(max) is corrected for the possible influence of tectonic release by adding a AM, value, which accounts for the most probable source mechanism (pure thrust faulting with strike of 326”) for the tectonic release triggered by an explosion at the Semipalatinsk test site. The calculation of yield from M,(max), hence, gives upper limits for the yield values. The values marked with a square and a triangle in Fig. 2a are the yields determined from Stevens’ (1986) M,-values and Sykes & Cifuentes’ (1984) M,(max) values, respectively. The values marked with a ‘y’ are Nuttli’s (1986a) yield estimates from Lg-waves recorded at short-period WWNSS-stations in Scandinavia and South Asia. The crosses in Fig. 2a mark Johannson’s (1984) yield estimates from wave form modelling of the P-wave onset from SRO-SP seismograms. All yield estimates in Fig. 2a lie within the 95 per cent confidence limits of our magnitude-yield relation, and a systematic bias of the entirety of the data from the most probable curve in the middle can not be seen. However, it is conspicuous in Fig. 2a that the majority of data points of Nuttli and Stevens lie near the upper and lower end, respectively, of the hatched area. In comparison to the middle curve in Fig. 2a too low and too high yield estimates result. In contrast, Johannson’s (1984) and Sykes & Cifuentes’ (1984) values lie in the neighbourhood of this curve. There obviously exists a discrepancy between Stevens’ yield estimates (derived from long-period data) and Nuttli’s yield estimates (from short-period data). A similar discrepancy exists also between Stevens’ (1986) moment estimates and the classical m,-values: the log-moments of the strongest explosions in eastern Kazakhstan since 1976 are 0.2 units less than the upper limit for the NTS (around 16.24 log-moment units) from the same period, which dramatically contrasts with NEIS m,-values, which show just the opposite behaviour with eastern Kazakhstan values being more than 0.3 units larger (Stevens 1986). However, Given & Mellman (1985), using the results of Stevens (1986) obtained log-moments from moment tensor inversions of eastern Kazakhstan events (assuming a 45” thrust mechan-
Downloaded from https://academic.oup.com/gji/article-abstract/95/1/163/601294by gueston 09 February 2018

170 J . Schlittenhardt
Semipalatinsk Test Site
6
5
L 0 60 120 180 240 300
Yield Y, in Kt
Figure 2a. Magnitude-yield relation of the GRF-array for the Semipalatinsk test site together with 95 per cent confidence limits (borders of the shaded area). The results of the yield estimation of several other investigations for nine nuclear explosions from 1978 to 1982 are also plotted.
ism for tectonic release) that are compatible with the upper limit of NTS moments. Hence, applying the average 0.2 log-moment units correction for tectonic release (Given & Mellman 1985) would make the yield-estimates derived from Stevens’ (1986) M,, values (Fig. 2a) much more compatible with Nuttli’s and Sykes & Cifuentes’ estimates in Fig. 2a and would reduce largely the discrepancies addressed. In other words, after applying the tectonic release correction of Given & Mellman (1985) to the moments of eastern Kazakhstan events, the log-moments of the largest NTS and eastern Kazakhstan events after 1976 are comparable and correspond to the moment expected for a 150kt explosion-source in tufflrhyolite of the Mueller-Murphy model. As was noted by Stevens’ (1986), the largest log-moments of eastern Kazakhstan events of Given and Mellman (around 16.25 log-moment units) are still less than the expected moment for a 150 kt Mueller-Murphy granite source (16.52 log-moment units). Steven’s (1986) conclu- sion, ‘that the east Kazakh explosions are not consistent with standard models of ‘granite-like’ source media’ is supported by our own theoretical investigations of reduced displacement potentials (RDP): preliminary results show that RDP’s with a relatively small overshoot ratio (like e.g. for the Sharpe source with a step pressure function acting at
the elastic radius) fail to model correctly GRF broadband seismograms from Sernipalatinsk underground explosions.
The most important conclusion from Fig. 2a in the present context is the good agreement of the middle, most probable curve in Fig. 2a with the Sykes & Cifuentes’ (1984) yield estimates. Their yield estimates can be considered to be reliable, because the long-period surface waves used are least influenced by heterogeneities along the wave path and because the calibration events (with announced yields) used were fitted well by a linear relationship between M, and log Y.
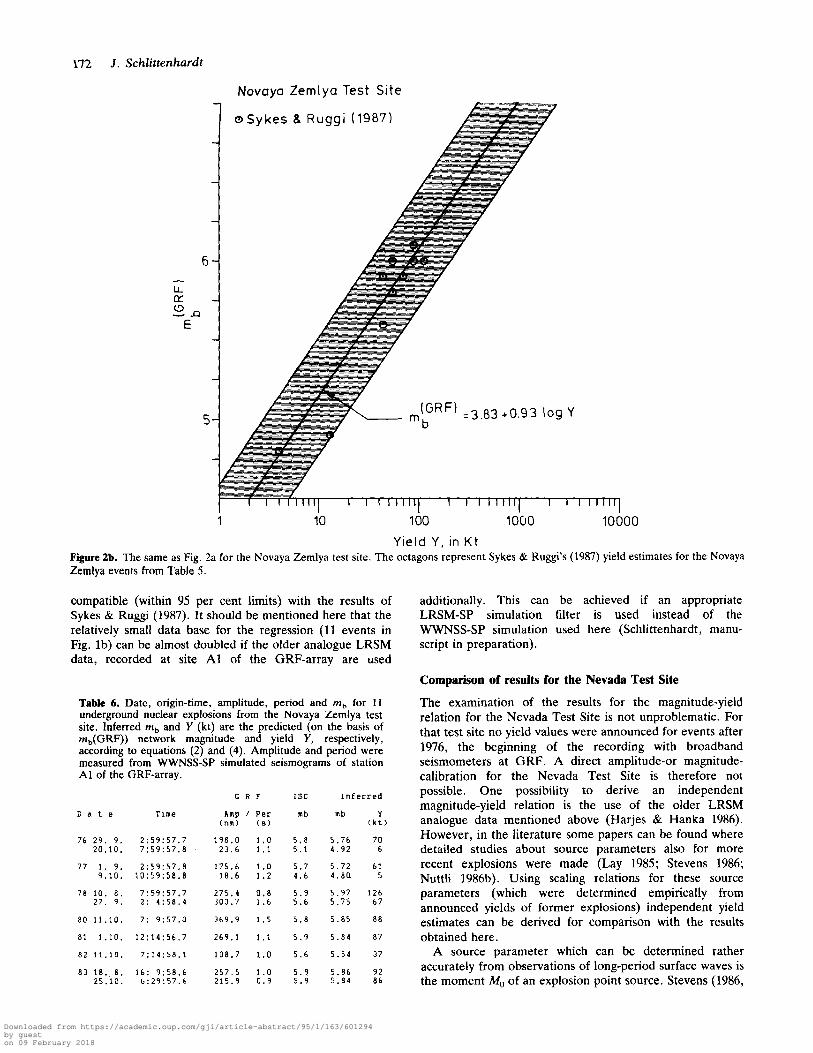
Comparison of results for the Novaya Zemlya test site
For the examination of the magnitude-yield relation for the Novaya Zemlya test site, we use Sykes & Ruggi’s (1987) yield estimates for Novaya Zemlya events, which have been derived from recalculated mb values. They show that the standard error of the mean for large underground explosions can be reduced to 0.015-0.03 mb units, if about 50-100 catalogued values of mb are used along with station corrections. Their values for the eleven events of Table 6 are plotted in Fig. 2b together with our magnitude-yield relation for the GRF-array. The middle curve in Fig. 2b is
Downloaded from https://academic.oup.com/gji/article-abstract/95/1/163/601294by gueston 09 February 2018
Seismic yield estimation 171
Table 4. Date, origin-time, amplitude, period and mb for 96 underground nuclear explosions from the Semipalatinsk test site. Inferred mb and Y (kt) are the predicted (on the basis of m,(GRF)) network magnitude and yield Y , respectively, according to equations (2) and (4). Amplitude and period were measured from WWNSS-SP simulated seismograms of station A1 of the GRF-array.
G R F
A m / Per
I sc
m b
5 . 7 5 . 4 5 . 6 5 . 5
5 . 3 5 . 8 5 . 1 5 . 8 5 . 8 5 . 9 5 . 1
5 . 4 5 . 1 5 . 8 5 . 1 5 . 1 5 . 8 6 . 0 4 . 9
5 . 2 5 . 6 4 . 7 5 . 7 6 . 0 5 . 2 5 . 2 5 . 6 4 . 8 4 - 7
5 . 4 5 . 4 5 . 2 5 . 3 6 . 2 5 . 8 5 . 2 6 . 1 6 . 1 5 . 2 6 . 0 6 . 0 6 . 2
4 . 9 5 . 0 5 . 5 5 . 5 5 . 6 5 . 7 5 . 9 5 . 9 4 . 5 5 . 9
Inferred I sc mb
5 . 6 5 . 9 5 . 4 5 . 0 5 . 1 4 . 9 b . 0 6 . 0 4 . 9 5 . 6 5 .0 6 . 2
5 . 4 6 . 1 6 . 1 4 . 7 5 . 4 5 . 2 6 . 1
4 . 9 5 . 4 6 . 0 6 . 1 5 . 4 5 . 4 5 . 5
5 . 8 5 . 7 5 . 9 5 . 7 5 . 9 6 . 0 6 . 2 5 . 0 6 . 2 5 . 8 6 . 1 6 . 0
5 . 9 5 . 9 6 . 0 6 . 0 5 . 9 5 . 0
Inferred C R F
Amp / Per. ( n m ) ( 9 )
nb
5 . 7 4 5 . 4 1 5 . 5 3 5 . 8 0
5 . 1 7 5 . 8 1 4 . 9 5 5 . 7 5 5 . 8 2 5 . 8 2 5 . 2 0
5 . 3 1 5 . 1 9 5 . 7 5 5 . 0 9 5 . 1 0 5 . 8 1 5 . 8 6 4 . 9 6
5 . 1 1 5 . 6 2 4 . 7 9 5 . 7 7 5 . 9 3 5 . 2 7 5 . 2 8 5 . 5 8 4 . 8 0 4 . 8 0
5 . 3 8 5 . 1 4 5 . 2 9 5 . 3 0 6 . 0 6 5 . 8 8 5 . 0 5 6 . 0 9 6 . 1 8 5 . 2 8 6 . 1 7 5 . 9 7 6 . 1 3
4 :83 4 . 9 5 5 . 4 8 5 . 4 0 5 . 5 5 5 . 7 0 5 . 8 3 5 . 9 6 4 . 6 3 5 . 8 6
Y ( k t )
6 1 23 33 7 2
1 2 7 3
6 6 2 7 5 7 5 1 3
1 8 1 2 6 2 10 1 0 72 83
6
10 42
4 6 5
1 0 3 1 6 1 6 3 8
4 4
21 1 1 1 7 1 7
1 4 8 8 9 8
2 1 0 1 6 *
1 1 4 1 7 9
5 6
29 2 3 3 5 5 3 7 7
1 1 2 3
8 4
1 6 0
nb
5 . 5 2 5 . 9 4 5 . 4 4 5 . 2 3 5 . 0 2 5 . 0 8 6 . 1 0 5 . 9 5 5 . 0 7 5 . 5 3 4 . 9 0 6 . 0 9
5 . 3 6 b . D 8 6 . 0 4 4 . 5 4 5 . 1 2 5 . 4 1 6 . 0 4
4 . 7 9 5 . 5 1 5 . 9 2 6 . 0 2 5 . 5 4 5 . 4 4 5 . 5 7
5 . 7 9 5 . 6 2 5 . 9 3 5 . 7 7 5 . 9 1 5 . 9 8 6 . 0 4 5 . 3 6 6 . 1 1 5 . 8 1 5 . 9 6 6 . 0 4
5.88 5 . 9 4 5 . 9 6 6 . 0 1 5 . 9 0 4 . 8 7
Y ( k t )
32 1 0 5
26 14
8 9
1 6 7 1 1 0
9 33
5 1 6 4
21 1 5 7 1 4 1
2 10 24
1 3 9
4 3 1
1 0 0 1 3 1
34 26 3 7
6 9 43
1 0 3 6 6 9 8
1 1 8 1 4 1
20 1 7 2
74 1 1 2 1 3 9
88 1 0 5 1 1 1 130
94 5
D a t e Time D a t e Time ( n m i
1 5 2 . 5 6 3 . 2 8 9 . 6
1 9 6 . 4
3 4 . 7 2 3 4 . 9
1 5 . 9 1 9 9 . 1 2 5 8 . 1 2 4 0 . 1
4 4 . 1
5 6 . 0 2 8 . 2
1 8 5 . 3 2 6 . 0 2 4 . 3
2 3 1 . 6 2 2 8 . 7
1 3 . 1
2 7 . 1 1 0 5 . 5
8 . 1 2 0 7 . 2 3 3 0 . 1
4 9 . 7 3 7 . 1
1 0 3 . 1 8 . 5 9 . 4
7 2 . 4 2 5 . 0 4 5 . 3 3 9 . 3
4 7 3 . 8 3 0 6 . 1
3 0 . 1 5 1 4 . 9 6 2 7 . 2
3 7 . 3 5 0 7 . 7 3 6 5 . 0 5 3 5 . 4
1 4 , 4 1 2 . 9 9 8 . 0 5 6 . 8
1 1 1 . 7 1 8 1 . 2 2 4 7 . 7 3 5 8 . 1
6 . 3 2 6 9 . 7
( 9 )
1 . 1 1 . 2 1 . 2 1 . 2
1 . 3 1 . 4 1 . 1 1 . 4 1 . 5 1 . 4 1 . 5
1 . 4 1 . 0 1 . 3 1 . 2 1 . 1 1 . 4 1 . 2 0 . 9
1 . 2 1 . 1
1 0 3 . 5 3 1 2 . 3
7 5 . 4 4 4 . 1 1 7 . 4 3 3 . 2
5 3 6 . 1 3 5 4 . 0
2 1 . 9 1 0 6 . 7
1 1 . 1 5 2 7 . 6
4 6 . 7 5 0 4 . 6 4 8 4 . 2
4 . 5 2 8 . 3 9 1 . 3
4 4 6 . 3
8 . 2 9 1 . 2
3 2 0 . 2 4 5 2 . 0 1 3 0 . 2
8 2 . 3 1 0 1 . 8
2 0 4 . 1 1 3 6 . 9 3 3 0 . 1 2 1 1 . 2 3 1 4 . 8 3 7 7 . 7 4 5 4 . 2
4 6 . 2 4 3 5 . 6 2 3 5 . 5 2 8 2 . 6 4 1 5 . 7
2 4 2 . 7 3 1 1 . 8 3 8 2 . 5 3 5 6 . 7 3 0 2 . 0
1 0 . 3
1 . 4 1 . 3 1 . 3 1 . 4 1 . 0
75 2 0 . 2 . 11. 3 . 27 . 4. 8. 6 .
76 9 . 6 . 4. 7 .
2 3 . 7 . 28 . 8. 2 3 . 1 1 .
7 . 1 2 . 3 0 . 1 2 .
5 : 3 2 : 5 7 . 7 5 : 4 2 : 5 7 . 7 5 : 36 : 5 7 . 2 3 : 2 6 : 5 7 . 6
8 1 2 9 . 3 . 2 2 . 4 . 2 7 . 5 . 3 0 . 6 . 1 7 . 7 .
4 : 3 : 1 9 . 8 1 : 1 7 : 1 1 . 4 3:58: 1 2 . 1 1 : 5 7 : 1 3 . 0 2 : 3 7 : 1 5 . 3
3: 2 : 5 7 . 5 2 :56: 5 7 . 5
2 : 5 6 : 5 7 . 6 5 : 2 : 5 7 . 5
2 : 3 2 : M . O
4 : 5 6 : 5 7 . 5 3 : 5 6 : 5 7 . 6
1 4 . 8 . 1 3 . 9 . 1 8 . 1 0 . 2 0 . 1 1 . 2 9 . 1 1 . 2 2 . 1 2 . 2 7 . 1 2 .
2 : 2 7 : 1 2 . 8
3 : 5 7 : 2 . 7 4 : 5 7 : 2 . 5 3 : 3 5 : 8 . 6 4 : 3 1 : 2 . 4 3 : 4 3 : 1 4 . 1
2 : 1 7 : 1 8 . 1 . 6 . 4 . 4 .1 . 4 . 9 . 4
. o
. 4 . 5 . o . 2 . 7 . 4
. 9
. 3
. 4
. 5
. 7
. 4
. 2
. 3
. 4
.4
. 4
. 4
. 4
. 4
. o
.1
. 4
. 1
.3
7 7 2 9 . 3 . 25 . 4. 2 9 . 5 . 30. 7 . 1 7 . 8.
5 . 9 . 30.11. 2 6 . 1 2 .
3 : 5 6 : 5 7 . 8 4: 6 : 5 8 . 1 2 : 5 6 : 5 7 . 5 I : 5 6 : 5 7 . 8
8 2 9 . 2 . 2 5 . 4 .
4 . 7 . 2 3 . 8 . 3 1 . 8 . 2 1 . 9 .
5 . 1 2 .
3 : 5 6 : 1 . 1 3 : 2 3 : 5 . 4 1 : 1 7 : 1 4 . 8 2 : 4 3 : 0 . 0 1 : 3 1 : 0 . 4 2 : 5 7 : 0 . 1 3 : 3 7 : 1 2 . b
3 : 4 1 : 5 . 6 3 : 3 3 : 4 4 . 5
4 : 2 6 : 5 7 . 9 3: 2 : 5 7 . 8 4 : 6 : 5 7 . 6 4 : 2 : 5 7 . 8
8 3 1 2 . 4 . 30. 5 . 7 8 19. 3.
26 . 3. 29 . 5. 28 . 7 . 1 5 . 9 . 1 5 . 1 0 . 3 1 . 1 0 .
4 . 1 1 . 1 4 . 1 2 . 2 0 . 1 2 .
3 : 4 6 : 5 7 . 3 3 : 5 6 : 5 7 . 7 4 : 5 6 : 5 ? , 6 2 : 4 6 : 5 7 . 8 2: 36 : 5 7 . 5 5 : 3 6 : 5 7 . 5 4 : 1 6 : 5 7 . 8 5 : 5 : 5 7 . 5 4 : 4 2 : 5 7 . 7 4 :32:57 .2
6.10 ; 2 6 . 1 0 . 2 0 . 1 1 . 2 9 . 1 1 . 2 6 . 1 2 .
1 : 4 7 : 6 . 6 1 : 5 5 : 4 . 8 3 : 2 7 : 4 . 4 2 : 1 9 : 6 . 5 4 :29: 6.8
. 9
. 4
.4
.4
. o
. 2
. 9
. o
. 5
. o
. 2
. o
.4
. 5
. 6
. 4
.3
.o
. l
. 4
. 3
8 4 1 9 . 2 . 7 . 3.
29. 3 .
3 : 5 7 : 3 . 3 2 : 3 9 : 6 . 3 5 : 1 9 : 8 . 1 3 : 1 7 : 9 . 2 I : 9 : 3 . 5 3 : 1 3 : 1 2 . 3 1 : 9 : 1 0 . 4 2:59: 6 . 3 1 : 5 0 : 1 0 . 6 3 : 1 9 : 6 . 2 3 : 5 5 : 2 . 7 3 : 5 0 : 1 0 . 5
1 5 . 4 . 2 5 . 4 . 2 6 . 5 . 1 4 . 7 .
7 1. 2 . 1 6 . 2 .
6 . 5 . 3 3 . 5 . 2 3 . 6 .
7 . 7 . 1 8 . 7 .
4. 8. 18 . 8. 1 8 . 1 0 . 2 8 . 1 0 .
2 . 1 2 . 2 3 . 1 2 .
4 : 1 2 : 5 7 . 8 4: I:ss;z 3 : 1 6 : 5 7 . 6 5 : 5 1 : 5 7 . 6 2 :56: 5 9 . 0 3: 46: 5 7 . 5 3 : 1 7 : 2 . 6
9 . 9 . 2 7 . 1 0 .
2 . 1 2 . . 1 6 , 1 2 . 2 8 . 1 2 . 3 : 5 6 : 5 7 . 3
2 : 5 1 : 5 7 . 3 4 ! 1 6 : 5 7 . 8 8 5 l o . 2 .
2 5 . 4 . 1 5 . 6 . 3 0 . 6 . 2 0 . 7 . 2 5 . 7 .
3 : 2 7 : 7 . 6 0 : 5 7 : 6 . 5 0 : 5 7 : 0 . 7
1 . 2 1 . 3 1 . 5
. ~ ~ . . .. 3 : 1 6 : 5 7 . 0 4: 36 : 5 7 . 6 4 :56 : 5 7 . 6 2:39: 2 . 7
0 : 5 J : 1 4 . 5 3 : l l : 6 . 6
1 . 2 1 . 4 0 . 9 ao 4 . 4 .
1 0 . 4. 2 5 . 4 .
5 : 3 2 : 5 7 . J 4: 6 : 5 7 . 6 3 : 5 6 : 5 7 . 4 3 : 5 6 : 5 7 . 6 3: 2 6 : 5 7 . 5 2 : 3 2 : 5 7 . 7 3 : 3 4 : 1 4 . 0 3 : 4 7 : 6 . 5 4 : 7 : 7 . 5 4: 9 : 8 . 2
1 . 4 0 . 9 1 . 5 1 . 1 1 . 4 1 . 5 1 . 4 1 . 1
22. 5 . 1 2 . 6 . 2 9 . 6 . 1 2 . 1 0 . 1 4 . 1 2 . 2 6 . 1 2 . 2 7 . 1 2 .
* : Amp/Per read trom 81 2
1 . 1 1 . 4
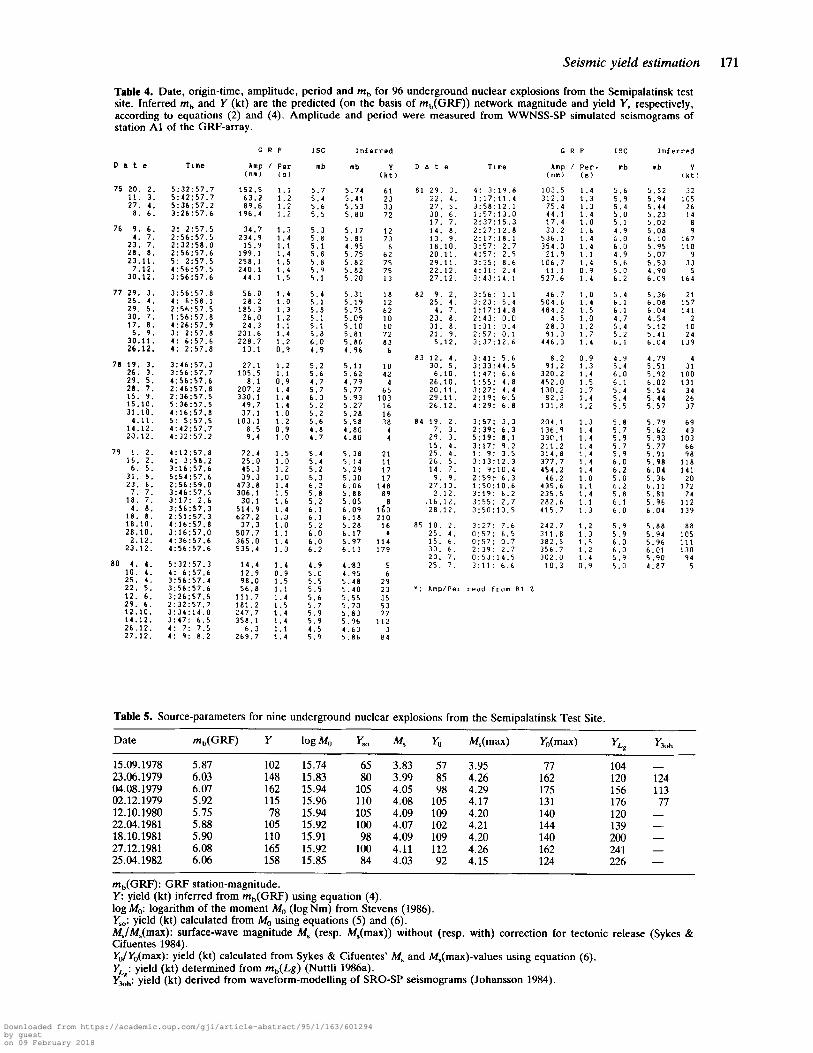
Table 5. Source-parameters for nine underground nuclear explosions from the Semipalatinsk Test Site.
Date m,(GRF) Y logM, Y, M, Yo M,(max) Y,(max) YLg Y3"h
15.09.1978 5.87 102 15.74 65 3.83 57 3.95 77 104 - 148 15.83 80 3.99 85 4.26 162 120 124 23.06.1979 6.03
04.08.1979 6.07 162 15.94 105 4.05 98 4.29 175 156 113 02.12.1979 5.92 115 15.96 110 4.08 105 4.17 131 176 77 12.10.1980 5.75 78 15.94 105 4.09 109 4.20 140 120 - 22.04.1981 5.88 105 15.92 100 4.07 102 4.21 144 139 - 18.10.1981 5.90 110 15.91 98 4.09 109 4.20 140 200 - 27.12.1981 6.08 165 15.92 100 4.11 112 4.26 162 241 - 25.04.1982 6.06 158 15.85 84 4.03 92 4.15 124 226 -
m,(GRF): GRF station-magnitude. Y : yield (kt) inferred from mb(GRF) using equation (4). log M,: logarithm of the moment M, (log Nm) from Stevens (1986). KO: yield (kt) calculated from Mo using equations (5) and (6). M,/M,(max): surface-wave magnitude M, (resp. M,(max)) without (resp. with) correction for tectonic release (Sykes & Cifuentes 1984). Y,/Y,(max): yield (kt) calculated from Sykes & Cifuentes' M, and M,(max)-values using equation (6). YL : yield (kt) determined from m,(Lg) (Nuttli 1986a). Y3:,,: yield (kt) derived from waveform-modelling of SRO-SP seismograms (Johansson 1984).
Downloaded from https://academic.oup.com/gji/article-abstract/95/1/163/601294by gueston 09 February 2018
172 J. Schlittenhardt
Novaya Zemlya Test S i te
Y
T 1 10 100 1000 10000
Yield Y , in K t Figure 2b. The same as Fig. 2a for the Novaya Zemlya test site. The octagons represent Sykes & Ruggi's (1987) yield estimates for the Novaya Zemlya events from Table 5 .
compatible (within 95 per cent limits) with the results of additionally. This can be achieved if an appropriate Sykes & Ruggi (1987). It should be mentioned here that the LRSM-SP simulation filter is used instead of the relatively small data base for the regression (11 events in WWNSS-SP simulation used here (Schlittenhardt, manu- Fig. lb) can be almost doubled if the older analogue LRSM script in preparation). data, recorded at site A1 of the GRF-array are used
Comparison of results for the Nevada Test Site
Table 6. Date, origin-time, amplitude, period and mb for 11 underground nuclear explosions from the Novaya Zemlya test site. Inferred mb and Y (kt) are the predicted (on the basis of m,(GRF)) network magnitude and yield Y, respectively, according to equations (2) and (4). Amplitude and period were measured from WWNSS-SP simulated seismograms of station A1 of the GRF-array.
G R F I sc Inferred
D a t e Time Amp / Per mb mb Y (nm) ( 9 ) (kt)
7 6 2 9 . 9 . 2:59:57.7 198.0 1.0 5.8 5.76 70 20.10. 7:59:57.8 23.6 1.1 5.1 4.92 6
77 1. 9. 2:59:57.8 9.10. 10:59:58.8
175.6 18.6
1.0 1.2
5.7 4.6
5 . 7 2 4 . 8 0
61 5
7 8 1 0 . 8 . 7:59:57.7 2 7 5 . 4 0.8 5.9 5.97 126 27. 9. 2: 4 : 5 8 . 4 303.7 1.6 5.6 5.75 67
8011.10. 7:9:57.0 369.9 1.5 5.8 5.85 88
8 1 1 . 1 0 . 12:14:56.7 269.1 1.1 5.9 5.84 87
8211.10. 7:14:58.1 108.7 1.0 5.6 5.54 37
8 3 18. 8. 16: 9:58.6 257.5 1.0 5.9 5.86 92 25.10. b:29:57.6 215.9 0.9 5.9 5.84 86
The examination of the results for the magnitude-yield relation for the Nevada Test Site is not unproblematic. For that test site no yield values were announced for events after 1976, the beginning of the recording with broadband seismometers at GRF. A direct amplitude-or magnitude- calibration for the Nevada Test Site is therefore not possible. One possibility to derive an independent magnitude-yield relation is the use of the older LRSM analogue data mentioned above (Harjes & Hanka 1986). However, in the literature some papers can be found where detailed studies about source parameters also for more recent explosions were made (Lay 1985; Stevens 1986; Nuttli 1986b). Using scaling relations for these source parameters (which were determined empirically from announced yields of former explosions) independent yield estimates can be derived for comparison with the results obtained here.
A source parameter which can be determined rather accurately from observations of long-period surface waves is the moment M, of an explosion point source. Stevens (1986,
Downloaded from https://academic.oup.com/gji/article-abstract/95/1/163/601294by gueston 09 February 2018

Table 4) has determined moments of NTS explosions from 1965 to 1980 from recordings of the WWNSS- and SRO-networks. For the majority of events investigated by Stevens, no yields are available so that no empirical relation can be derived for M,, and yield Y. However, a moment-yield relation for the empirical Mueller-Murphy (1971) model for explosions in tuff/rhyolite can be derived with constants that can be found in the literature (Stevens & Day 1985). The resulting moment-yield relation for NTS explosions in tuff/rhyolite is
log M, = 14.59 + 0.76 log Y, (7) where M,, is in Nm and Y in kt. We have used this relation to convert Stevens’ (1986) moment values into yield (Table 8 (YMM) and Fig. 2c). Additionally, we used the M, - M, relationship of equation ( 5 ) to convert M,, into M, and then applied Sykes & Cifuentes (1984) M,-yield relation equation (6). The resulting yield values are included in Table 8 (KO) for comparison.
The determination of yield values from Mo is also possible by going a roundabout way via the yield scaling relation for a further source parameter, which in turn is related to the moment M,. We have tentatively used such a source parameter for which a yield scaling relation for NTS explosions exists (Lay 1985) namely the static value of the reduced displacement potential (RDP) vm. The relation between Mo and the static value of the RDP is (see Muller (1973) or Aki et af. (1974))
M,, = -4np~~’v- (8) (y and p are the P-wave velocity and density, respectively, at the detonation point. Lay’s (1985, Eq. 12) relation between y, and yield Y for Pahute Mesa events is
log Vm, = -2.589 + 0.860 log Y, (9)
Wmc = vm/v-BOXCAR (10) where
is a dimensionless static value of the RDP and ~‘mBoxcAR=65300m3 is the mean value of the RDP determined for the event BOXCAR. Table 8 contains data of all Pahute Mesa events from 1975 to 1980 investigated by Stevens (1986) for which GRF recordings are available. In Table 8, values of M,, the calculated RDP ym according to equation (8), log vm,, as well as of the yield calculated from log v,, according to equation (9) are listed. The yield values obtained by this procedure (Yo in Table 8) are unrealistically high. In this context it is worth noting that the waveform intercorrelation technique was developed originally to determine relative source strengths. The absolute values of vm (and hence M,,) obtained by this method are much lower than the values obtained with other methods. This fact and the uncertainties in the quantities involved in the calculation of yield Yo can largely explain the unrealistic Yo-values in Table 8. Obviously, equation (9) can be used only to provide relative yields of events being studied by the waveform intercorrelation method.
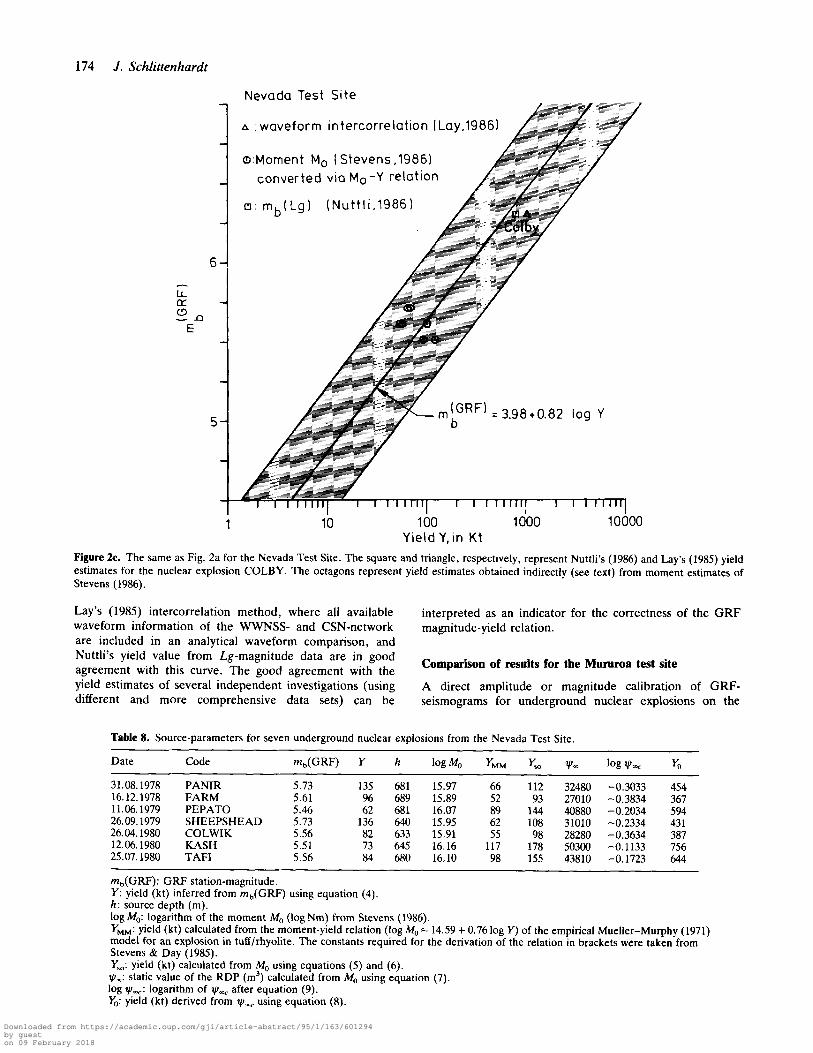
Figure 2c shows the yield estimations based on Stevens’ M,-values (converted via the Mo - Y relation of equation 7) together with the magnitude-yield relation for the GRF-array. The yield estimates for the NTS explosion COLBY, for which Lay (1985) gives a yield of 1043 kt from
Serimic yield estimation 173
Table 7. Date, origin-time, amplitude, period and mb for 65 underground nuclear explosions from the Nevada test site. Inferred mb and Y (kt) are the predicted (on the basis of m,(GRF)) network magnitude and yield Y, respectively, according to equations (2) and (4). Amplitude and period were measured from WWNSS-SP simulated seismograms of station A1 of the GRF-array.
D a t e Time
75 7. 3. 15: 0: 0.2
76 14. 3. 12:30: 0.2 26. 8. 14:JO: 0.2 28.12. 18: 0: 0.1
77 5. 4. 15: 0: 0.2 27. 4. 15: 0: 0.1 19. 8. 17:55: 0.1 27. 9. 14: 0: 0.2 14.12. 15:30: 0.2
78 23. 2. 17: 0: 0.2 23. 3. 16:30: 0.2 11. 4. 15:30: 0.2 11. 4. 17:45: 0.1 12. 7. 17: 0: 0.1 31. 8. 14: 0: 0.2
16.12. 15:30: 0.2 18.11. 19: 0: 0.0
79 8. 2. 20: 0: 0.1 11. 6. 14: 0: 0.2 28. 6. 14:44: 0.2 3. 8. 15: 7:30.2
29. 8. 15: 8: 0.2 6. 9. 15: 0: 0.1
26. 9. I S : 0: 0.1
80 3. 4. 14: 0: 0.1 16. 4 . 20: 0: 0.1 26. 4 . 17: 0: 0.1 12. 6. 17:15: 0.1 25. 7. 19: 5: 0.1 31.10. 18: 0: 0.1 17.12. 15:lO: 0.1
81 15. 1. 20:25: 0.1 6. 6. 18: 0: 0.0 1.10. 19: 0: 0.1
11.11. 20: 0: 0.1 12.11. 15: 0: 0.1
8 2 2 8 . 1. 1 6 : 11: 11.1 -, L J . r 4 . 1 % ; 5 : 11.0
r . 5. 1 ~ : i 7 : u . 1 2 4 . t. . 1 4 : 1 5 : 0 . 0 5. 8. 1 4 : 0: 0 . 0
2 3 . ‘i. 17: [I: u . 0
8 : 21,. j , :II::o: 0.0 14. 4. 1 9 : 5 : 0.1
1. 9 . 1 4 : u: 0 . 0 16.12. 1 e : 3 0 : 0 . 0
a4 1 5 . 2 , 17: u: 0.1 I . 3 . 17:45: 0.0 1. 5. 19: 5 : 0.0
31. 5. 1 1 : 4 : 0.1 2 5 . 7. 15:10: 0.0 11. 9 . 14: 0: 0.0 9.12. 1 9 : 4 0 : 0.0
1 5 . 1 2 . 1 4 : 4 5 : 0 . 0
85 2 3 . 3. 18:30: 0.0 2. 4. 20: 0: 0.0 6. 4. 23:15: 0.0 2. 5 . 15:2u: 0.0
12. b . 15:15: 0.0 25. 7. 14: 0: 0.0 5.12. 15: 0: 0.0
28.12. 19: 1 : 0.0
86 22. 3. lt:15: 0.0 22. 4 . 14:30: 0 . 0
5 . b . 15: 4: 0.0
G R F I sc I n t r r r L d
A m p I P e r m b m b Y ( n n l
83.1
333.4 29.2 63.3
157.3 86.7
167.8 13.7 86.9
185.8 149.2 29.7 66.0 54.4 95.3 61.2 61.6
67.1 43.3 45.0 8.9
18.5 105.5 82.0
13.1 82.7 63.3 57.5 6 0 . 0 25.7 16.3
66.7 63.7 27.7 14.1 68.2
8 2 . 2 46.7 b d , 4 f L . b
7 , ‘I
17.b
58.1 22.2
18.6
7
100.5
53.7
83.2 35.3 85.5 11.0 14.8 4b.2 48.9
38.0 106.4 10.5 80.2 29.4 29.3 86.4 26.8
42.1 29.0 4 6 . 3
( 5 1 ( k t l
1.5 5.5 5.56 105
1.3 6.3 6.21 1.75 1.4 5.3 5.14 3 2 1.4 5.5 5.47 82
1.8 5.6 5.75 183 1.8 5.4 5.50 89 1.9 5 . 5 5.76 ie5 1.2 4.8 4.88 15 1.3 5.7 5.64 1J2
1.8 5.6 5.82 224 1.9 5.6 5.71 161 1.1 5.4 5 . 2 5 4 4 1.3 5 . 5 5.52 95 1 . 1 5.5 5.51 92 1.4 5.6 5.65 115 1 . 6 5.1 5.40 67 1.2 5.6 5.51 96
1.2 5.5 5.56 1.2 5.5 5.37 1.1 5.0 5.43 1.1 4.6 4.74 1.6 4.8 4.89 1.1 5.8 5.79 1.2 5.6 5.65
1.2 4.7 4.86 1.8 5.3 5.48 1.4 5.4 5.47 1.4 5.6 5.43 1.3 5.5 5.48 1.5 4.7 5.06 1.2 5.1 4.96
1.2 5.6 5.56 1.4 5.5 5.47 1.4 4.9 5.12 1.2 4.8 4.90 1.5 5.3 5.47
1 . 1 5.9 5.69 1 . 2 5.4 5.37 1.1 5.7 5.57 1.2 5.6 5.60 1.3 5.7 5.70 1.0 4.9 4.73
1.1 5.1 5.03 1.1 5.7 5.50 1.4 5.4 5.44 1.4 5.1 5.02
1.1 5.0 5 . 0 5
106 62 73 10 16
205 136
15 84 82 73 84 25 19
106 83 30 16 83
151 62
110 117 158 10
23 90 74 23
25 1.1 1.2 1.3 1.2 1.1 1.4
519 5.3 5.8 5.3 5.0 5.5
5.69 5.29 5.63 5.23 4.95 5.34
153 49
129 42 19 56
1.3 5.4 5.39 66
1.2 1.5 1.1 I . 3 1.1 1.5
5.3 5.7 4.8 5.7 5.5 5.2
5.32 5.66 4.81 5.60 5.25 5.11
53 142 12
120 43 30
l.b 5.7 5.55 102 1.4 5.3 5.10 29
1.5 5.2 5.27 46 1.4 5.3 5.11 32 1.6 5.3 5.28 48
a waveform intercorrelation analysis and for which Nuttli (1986b) derived a yield of 805 kt from m,(Lg), are also plotted. For reasons of clarity we have not plotted the Dahlman & Israelson (1977) value (Y = 900 kt); their value lies between the values of Lay and Nuttli. It is striking in Fig. 2c that the yields, derived indirectly from Stevens’ moments via the M, - Y relation of the Mueller-Murphy model, are located within the hatched area and are grouped around the middle, most probable curve. Additionally the results of
Downloaded from https://academic.oup.com/gji/article-abstract/95/1/163/601294by gueston 09 February 2018
174 J. Schlittenhardt
LL LT a 1
E
1
Nevada Test Site
A waveform intercorrelation I Lay.19861
0 Moment Mo Stevens ,1986) converted via Mo -Y relation
CI m b ( L g ) (Nuttli.19861
(GRF1 = 3.98+0.82 log Y
10 100 1000 10000 Yield Y,in K t
Figure 2c. The same as Fig. 2a for the Nevada Test Site. The square and triangle, respectively, represent Nuttli’s (1986) and Lay’s (1985) yield estimates for the nuclear explosion COLBY. The octagons represent yield estimates obtained indirectly (see text) from moment estimates of Stevens (1986).
Lay’s (1985) intercorrelation method, where all available waveform information of the WWNSS- and CSN-network are included in an analvtical waveform cornDanson. and
interpreted as an indicator for the correctness of the GRF magnitude-yield relation.
Nuttli’s yield value from Lg-magnitude data are in good agreement with this curve. The good agreement with the Comparison of results for the Mururoa test site
yield estimates of several independent iniestigations (using A direct amplitude or magnitude calibration of GRF- different and more comprehensive data sets) can be seismograms for underground nuclear explosions on the
Table 8. Source-parameters for seven underground nuclear explosions from the Nevada Test Site.
Date Code mb(GRF) l o g M , yMh4 yso Wm log@- yo ~
31.08.1978 PANIR 5.73 135 681 15.97 66 112 32480 -0.3033 454 16.12.1978 FARM 5.61 96 689 15.89 52 93 27010 -0.3834 367 11.06.1979 PEPATO 5.46 62 681 16.07 89 144 40880 -0.2034 594 26.09.1979 SHEEPSHEAD 5.73 136 640 15.95 62 108 31010 -0.2334 431 26.04.1980 COLWIK 5.56 82 633 15.91 55 98 28280 -0.3634 387 12.06.1980 KASH 5.51 73 645 16.16 117 178 50300 -0.1133 756 25.07.1980 TAFI 5.56 84 680 16.10 98 155 43810 -0.1723 644
m,(GRF): GRF station-magnitude. Y: yield (kt) inferred from m,(GRF) using equation (4). h : source depth (m). IogM,: logarithm of the moment Mo (log Nm) from Stevens (1986). YMM: yield (kt) calculated from the moment-yield relation (log Mo = 14.59 + 0.76 log Y ) of the empirical Mueller-Murphy (1971) model for an explosion in tuff/rhyolite. The constants required for the derivation of the relation in brackets were taken from Stevens & Day (1985). Yso: yield (kt) calculated from M , using equations ( 5 ) and (6). v-: static value of the RDP (m’) calculated from M, using equation (7). log ym,: logarithm of ly, after equation (9). &: yield (kt) derived from using equation (8).
Downloaded from https://academic.oup.com/gji/article-abstract/95/1/163/601294by gueston 09 February 2018
Seismic yield estimation 175
I
1
Mururoa Test Site a: from Rarotonga T - phase
ampli tudes (Smith, 1987)
= 4.08+0.89 log
( W W N S S - S P f i l t e red GRF - array beams 1
I I 1 I 1 I l l 1 I 1 I I I I I I I I I r t r
‘ Y
T 10 100 1000 10000
Yield Y , in K t Figure 2d. The same as Fig. 2a for the Mururoa test site. mb(GRF) is a core-phase magnitude introduced for Mururoa events (see text). The octagons represent Smith’s (1987) yield estimates from T-phase amplitudes of the WWNSS station RAR on Rarotonga (New Zealand) for 32 nuclear explosions from 1980-1985.
Table 9. Date, origin-time, amplitude, period and m,, for 24 underground nuclear explosions from the Mururoa test site. Inferred mb and Y (kt) are the predicted (on the basis of Ab(GRF)) network magnitude and yield Y, respectively, according to equations (2) and (4). Amplitude and period were measured from WWNSS-SP simulated GRF-array beams with azimuth and slowness of 299” and 3.1 s/deg, respectively.
D a t e T i m e
80 2 3 . 3. 19 :36 :58 .4 4 . 4. 1 8 : 3 2 : 5 7 . 8
1 6 . 6 . 1 8 : 2 6 : 5 7 . 8 3 .12 . 1 7 : 3 2 : 5 8 . 1
8 1 8 . 7 . 2 2 : 2 2 : 5 7 . 9 3. 8 . 18:32:58.3 5 . 1 2 . 1 6 : 5 7 : 5 8 . 3
82 25 . 7 . 1 8 : 1 :58 .4
8 3 1 9 . 4 . 1 8 : 5 2 : 5 8 . 4 25. 5 . 1 7 : 3 0 : 5 8 . 2 2 8 . 6. 1 7 : 4 5 : 5 8 . 6
4 . 8 . 1 7 : 1 3 : 5 8 . 2 7 . 1 2 . 1 7 : 2 8 : 0 . 0
84 1 2 . 5 . 1 7 : 3 0 : 5 8 . 2 16 . 6 . 1 7 : 4 3 : 5 7 . 9
2 . 1 1 . 2 0 : 4 4 : 5 8 . 3 6 . 1 2 . 1 7 : 2 8 : 5 8 . 3
85 3 0 . 4 . 1 7 : 2 8 : 5 7 . 9
3 . 6 . 1 7 : 2 9 : 5 8 . 0 2 4 . 1 1 . 1 6 : 0 : 5 8 . 4 2 6 . 1 1 . 1 7 : 4 1 : 5 8 . 2
8. 5 . 2 0 : 2 7 : 5 8 . 8
86 2 6 . 4 . 1 7 : 1 :56 .6 30. 5 . 1 7 : 2 4 : 5 8 . 2
G R F
A m D / Per (nmj
7 5 . 7 8 . 5
3 1 . 3 8 1 . 4
21.9 2 1 . 8
8 . 8
76 .0
7 3 . 0 1 5 4 . 0
27.3 2 3 . 7 1 5 . 1
7 2 . 2 37 .3 7 8 . 2 6 6 . 8
9 . 5 95 .7
9 . 2 5 . 9
1 1 4 . 1
5 .0 b 9 . 8
( 9 )
1 . 2 1 . 4 1 . 0 1 . 2
1 . 2 1 . 0 1.1
1 .1
1 . 1 1.1 1 . 3 1 . 1 1.1
1 . 1 1 . 2 1.1 1.1
1 . 1 1.1 0 . 9 1 . 0 1 . 1
1 . 2 1 . 1
I sc
mb
5.7 4.5 5.5 5 . 6
5 . 3 5 .3 4.6
5 . 7
5.6 5 .9 5.4 5 . 2 5.0
5 . 7 5 . 3 5 .7 5.6
4 . 5 5 . 7 5 . 2 4.8 5.8
4 . 8 5 . 7
Inferred
mb
5 .65 4.73 5 .38 5 . 6 8
5 .16 5 . 2 3 4 . 8 4
5 . 6 9
5 . 6 7 5 . 9 7 5 . 2 2 5 . 2 3 5 . 0 5
5 . 6 7 5 .37 5 . 7 0 5 . 6 4
4 . 0 7 5 . 7 8 4 .94 4.7:: 5 . 8 5
4 .58 5 . c, f.
Y ( k t )
85 6
39 9 2
2 1 26
8
94
90 208
25 2 1 1 5
8 9 29 97 8 2
9 1 2 2
1 1 b
1 4 9
4 d b
Mururoa test site is not possible, since no yields have been announced. To find independently determined values of source parameters for that test site is especially difficult because there exist only very few publications where those events are investigated. In this context, the WWNSS station
920 V W v)
2 9 1 0 - W z - 900 I- -1 w w
2 890 n
5 880
I-
W
0 W LL
I l l l l l l l l l l
110 120 130 1 4 0 150 160 (3TSTANCE I N DES
Figure 3. PKP-wave travel-time curves for PREM (Dziewonski & Anderson 1981) for a surface focus (reduced with 2.0 s/deg).
Downloaded from https://academic.oup.com/gji/article-abstract/95/1/163/601294by gueston 09 February 2018

Mururoa test site
VV“L&.--m+ ---+ 800323
830525 z b-- ~ I ’ ~ / L ’’V~ICY ̂
S’ = 3.1 sldeg 8405 12
--+”--*-”-
I 20 s I Figure 4. PKP,,,-beams (uppermost 7 traces) and (PKIKP + PKiKP)-beams (lowermost 7 traces) for Mururoa events recorded at GRF and theoretical seismogram (middle trace) for the PREM model. PKP,,,-beams and (PKIKP + PKiKP)-beams are plotted with equal amplitude scale. The peak-to-peak amplitude of the PKP,,, signal in the theoretical seismogram is chosen to be identical with the maximum peak-to-peak amplitude of the PKP,,, signal in the PKPdiE-beam. Hence, the amplitudes of the theoretical PKIKP and PKiKP signals can be directly compared to the amplitudes in the (PKIKP + PKiKP)-beams at the corresponding time interval. s’ are the slownesses used for the calculation of the beams and s are the theoretical slownesses of the core-phases from Mururoa events. Note the enhancement of the secondary phases PKIKP and PKiKP due to the velocity filtering effect and the simultaneous amplitude reduction of the first onset (PKP,,,) in the lowermost 7 traces. The seismogram examples clearly show the theoretically expected triplication pattern with signals composed of three single onsets. This pattern can be used for identification purposes. All seismograms are short-period simulations according to the WWNSS-SP system transfer function. The date of each event is given in the upper part (left) in the form of six integer numbers representing year, month and day of month.
Downloaded from https://academic.oup.com/gji/article-abstract/95/1/163/601294by gueston 09 February 2018

Seismic yield estimation 177
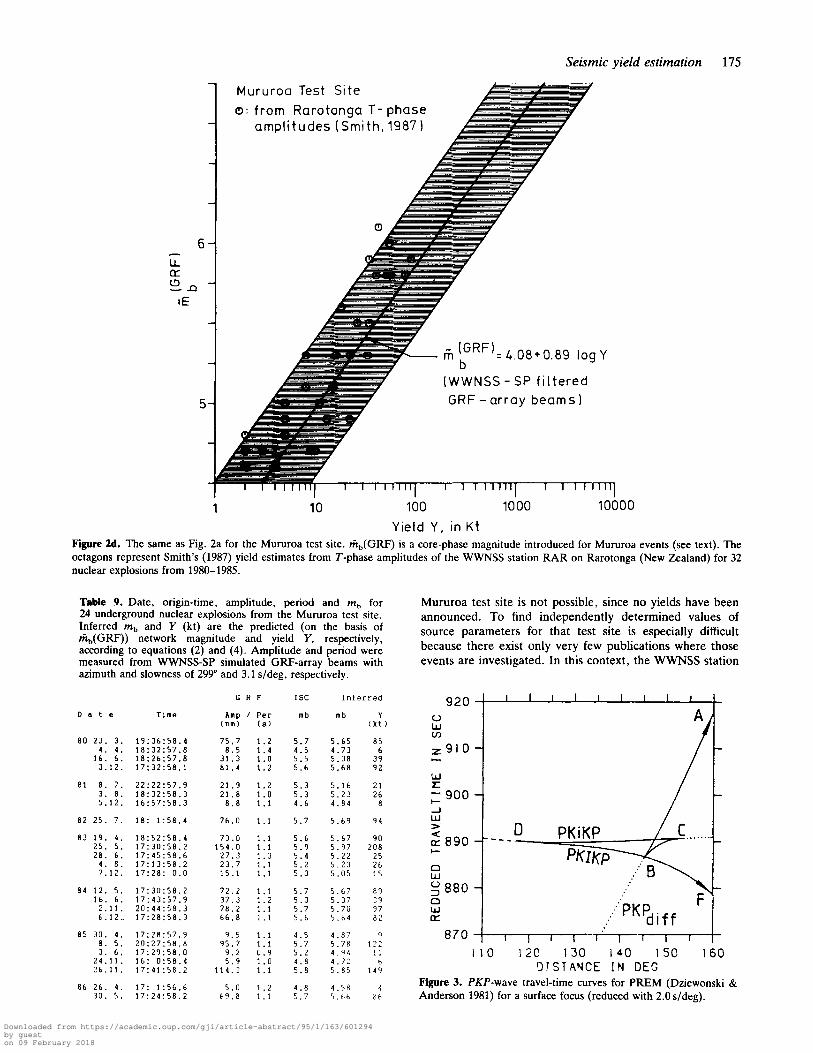
RAR on Rarotonga Island (Cook Islands, New Zealand) plays an important role, as it records seismograms of T-phases from underground nuclear explosions in the Tuamotu Archipelago of French Polynesia (Adams 1979; Smith 1987).
There exists a linear relation between the logarithm of the maximum of the T-phase amplitude and the body wave magnitude (Smith 1987). This property can be used for the estimation of mb from T-phase amplitudes and, hence, for yield estimation. Fig. 2d shows Smith’s (1987) yield estimates for Mururoa events from 1980 to 1985 for which GRF recordings are available (Table 9). The agreement of the middle, most probable curve with Smith’s (1987) values is satisfactory. These results have been derived independ- ently from quite different seismic phases (PKP- and T-phases), recorded at nearly diametrical places of the Earth. However, it should be noted that the results are preliminary because the yield scaling relations used have not been derived from explosions of announced yield at that test site. This could be important especially for the Mururoa test site, which in contrast to the test sites in continental areas (NTS and SMI) is located in an oceanic environment.
CONCLUSIONS
In this paper the ‘transportability’ of known magnitude-yield relations has been investigated for four major test sites in eastern Kazakhstan, on Novaya Zemlya, in Nevada and on Mururoa (South Pacific) by a comparison of the resdts obtained here with the results of more large-scale investigations using different and more comprehensive data sets. The results for the selected (predominantly large) events agree with our results within their 95 per cent confidence limits.
Source-region corrections, which account for geological and tectonical differences between the various test sites have been applied (Table 2). The application of such magnitude corrections plays an important role in the judgement of compliance with treaty limits (Sykes & Davis 1987; Evernden & Marsh 1987).
It could be shown that the transportability of magnitude yield-relations (in the sense stated above) becomes possible if the differences in absorption beneath the different test sites are correctly accounted for. Using the method proposed here, immediately after the recording of a nuclear explosion the network magnitude of the ISC/PDE can be predicted from a measurement of the GRF station- magnitude and, after an absorption correction, robust yield values can be obtained. The yields of explosions at several test sites can be estimated independently, on the basis of data from the GRF-array. For all test sites, a single magnitude yield relation has been used (equation 1) and a uniform methodology has been applied to determine source-region corrections for the various source sites (Marshall et al. 1979). However, of course, the method proposed here is no way intended to replace more sophisticated methods (like e.g. using data from networks or wave-form modelling) for the determination of seismic source parameters. The method is designed to produce robust, first approximations of seismic yield estimates from single station data.
Assuming that the m,(ISC)-values used for the regression analysis (equation (2) and Fig. 1) have small (strictly speaking zero) standard errors and neglecting other sources of error, the variance in the mb(ISC) versus m,(GRF) relation can be used as an approximation of the accuracy of the yield estimates. Under these assumptions, the confidence intervals cd (Table 3) for predicting m,(ISC) can be regarded as 95 per cent confidence intervals for log yield. Consequently, the cd values in Table (3) can be interpreted as factors of uncertainty for the yield, by simply raising them to the power of 10. The resulting factor of uncertainty for the yield values for the Semipalatinsk and Novaya Zemlya test sites is about 1.7 and for the Nevada and Mururoa test sites it is slightly below 2.0. The values of inferred yield listed in Tables 4, 6, 7 and 9 must be divided or multiplied by this factor to obtain upper and lower 95 per cent confidence limits. There are several events dated after 1976 March 31 (date when the Threshold Test Ban Treaty took effect) in Tables 4, 6, 7 and 9 with inferred yields exceeding the 150kt limit. However, for none of the events the inferred yields Y exceed the value of 150kt times the corresponding factor of uncertainty. It should be noted, that because of the possible network-basis (which is expected to affect mainly the mb(ISC) magnitudes of Mururoa events) and because of the less well known absorption corrections for Mururoa and Novaya Zemlya events, the results for these two test sites must be considered less substantiated.
The magnitude-yield relations from Fig. 2 can be used to estimate the detection threshold of the GRF-array from the smallest magnitudes included in Figs. la-d. The detection threshold for the single station A1 of the GRF-array for the Semipalatinsk- and Novaya Zemlya test sites lies in the kt-range: the smallest Semipalatinsk and Novaya Zemlya explosions investigated have m,(GRF) values (Fig. l a , b) of 4.2 and 4.8, respectively, which corresponds to inferred yields of 2 and 5 kt. The detection threshold of station A1 of the GRF-array for the NTS lies in the 10kt-range. This follows from converting the magnitude of the smallest NTS event investigated (m,(GRF) =4.8 in Fig. lc) into yield. The detection threshold of the GRF-array beam for the Mururoa test site lies in the kt-range: the smallest event investigated (with a core-phase magnitude rfi,(GRF) = 4.6 in Fig. lc) has an inferred yield of 4 kt.
ACKNOWLEDGMENTS
I thank B. Buttkus, W. Hanka, M. Henger and G. Miiller for critically reading the manuscript and H.-P. Harjes and M. Henger for discussions. This research was funded by the Deutsches Auswartiges Amt (German Foreign Office) in context with work done for the installation of a National Seismological Data Center at the Federal Institute for Geosciences and Natural Resources. Hannover.
REFERENCES
Adams, R. D. , 1979. T-phase recordings at Rarotonga from underground nuclear explosions, Geophys. J. R. ustr. Soc., 58,
Aki, K., Bouchon, M. & Reasenberg, P., 1974. Seismic source function for an underground nuclear explosion, Bull. sekm. Soc. Am., 64, 131-148.
361-369.
Downloaded from https://academic.oup.com/gji/article-abstract/95/1/163/601294by gueston 09 February 2018

178 J. Schlittenhardt
Alexander, S. S., Tang, L., Borkowski, A. & Stocker, D., 1987. The use of propagation-corrected Lg spectra to estimate yield of Soviet explosions and isolation and enhancement of regional phases for earthquakes in the eastern United States, DARPAIAFGL Seismic Research Symposium, pp. 59-66, Nantucket Island.
Basham, P. W., 1969. Canadian magnitudes of earthquakes and nuclear explosions in south-western North America, Geophys. J . R. astr. Soc., 17, 1-13.
Bache, T. C., 1982. Estimating the yield of underground nuclear explosions, Bull. seism. Soc. Am. (Special Symposia Issue), 72,
Ben-Menahem, A., Rosenman, M. Harkrider, D. G., 1970. Fast evaluation of source parameters from isolated surface wave signals, Bull. seism. SOC. Am. , 60, 1337-1387.
Bolt, B. A, , 1916. Nuclear Explosions and Earthquakes: The Parted Veil, W. H. Freeman, San Francisco.
Burdick, L. J. , Wallace, T. C. & Lay, T., 1984. Modelling near-field and teleseismic observations from the Amchtika Test Site, J. geophys. Res., 89, 4373-4388.
Burger, R. W., Burdick, L. J. & Lay, T., 1986a. Estimating the relative yield of Novaya Zemlya tests by waveform intercorrelation, Geophys. J . R. astr. SOC., 87, 775-800.
Burger, R. W., Lay, T., Wallace, T. C. & Burdick, L. J., 1986b. Evidence of tectonic release in long-period S-waves from underground nuclear explosions at the Novaya Zemlya test site, Bull. seism. Soc. Am. , 76, 733-755.
Chung, D. H. & Bernreuter, D. L., 1981. Regional relationships among earthquake magnitude scales, Rev. Geophys., 19,
Dahlmann, 0. & Israelson, H., 1977. Monitoring Underground Nuclear Explosions, Elsevier Amsterdam.
Der, Z. & McElfresh, T., 1977. The relationship between anelastic attenuation and regional amplitude anomalies of short-period P-waves in North America, Bull. seism. SOC. A m . , 67,
Der, Z., McElfresh, T., Wagner, R. & Burnetti, J., 1985a. Spectral characteristics of P-waves from nuclear explosions and yield estimation, Bull. seism. SOC. A m . , 75, 379-390.
Der, Z., McElfresh, T., Wagner, R. & Burnetti. J., 1985b. Errata to 'Spectral characteristics of P-waves from nuclear explosions and yield estimation', Bull. seism. SOC. Am. , 75, 1222.
Dziewonski. A. M. & Anderson, D. L., 1981. Preliminary reference earth model, Phys. Earth planet. Znt., 25, 297-356.
Evernden, J. F. & Marsh, G. E., 1987. Yields of U S and Soviet nuclear tests, Phys. Today, 40, 37-44.
Given, J. W. & Mellman, G. R., 1985. Source parameters of Shagan River East Kazakh, USSR events using surface wave observations, in The VELA Program: A Twenty-five Year Review of Basic Research, pp. 705-710, ed. Kerr, A. U., Defence Advanced Research Agency, Arlington, VA.
Gutenberg, B. & Richter, C. F., 1957. Magnitude and energy of earthquakes, Ann. Geofis., 9, 1-15.
Harjes, H.-P., 1985. Global seismic network assessment for teleseismic detection of underground nuclear explosions. I . Model calculations for different amplitude-attenuation curves, J. Geophys., 57, 1-13.
Harjes, H.-P. & Hanka, W. , 1986. The contribution of broadband array seismology to seismic monitoring of underground nuclear explosions, in Ten Years of the Grafenberg Array, ed. Buttkus, B. , Geologkches Jahrbuch Reihe E , 35, 105-120.
Harjes, H.-P. & Seidl, D. , 1978. Digital recording and analysis of broadband seismic data at the Graefenberg (GRF)-Array, J. Geophys., 44, 511-523.
Helmberger, D. V. & Wiggins, R. , 1971. Upper mantle structure of midwestern United States, J . geophys. Res., 76, 3229-3245.
Johansson, P., 1984. Yield estimates of soviet underground nuclear explosions 1978-79, FOA Report C 20553-T1, National Defence Research Institute, Stockholm.
Lay, T., 1985. Estimating explosion yield by analytical waveform comparison, Geophys. J . R. astr. Soc., 82, 1-30.
Lay, T., Burdick, L. J. & Helmberger, D . V., 1984a. Estimating the yields of the Amchtika tests by waveform intercorrelation, Geophys. J . R . astr. SOC., 78, 181-207.
Lay, T., Helmberger, D. V. & Harkrider, D,. G. , 1984b. Source
S 13 1-S168.
649-663.
1303- 1317.
models and yield-scaling relations for underground nuclear explosions at Amchtika Island, Bull. seism. SOC. Am. , 74,
Lay, T., Wallace, T. C. & Helmberger, D. V., 1984~. The effects of tectonic release on short-period P-waves from NTS explosions, Bull. seism. Soc. Am. , 74, 819-842.
Liebermann, R. C. & Pomeroy, P. W., 1969. Relative exitation of surface waves by earthquakes and underground explosions, 1. geophys. Res., 74, 1575-1590.
Marshall, P. D. & Basham, P. W., 1972. Discrimination between earthquakes and underground explosions employing an improved M, scale, Geophys. J . R. astr. SOC., 28, 431-458.
Marshall, P. D. & Springer, D. L., 1976. Is the velocity of P, an indicator of Q,?, Nature, 264, 531-533.
Marshall, P. D., Springer, D . L. & Rodean, H . C., 1979. Magnitude corrections for attenuation in the upper mantle, Geophys. J. R. astr. SOC., 57, 609-638.
Marshall, P. D., Bache, T. C. & Lilwall, R. C., 1984. Body wave magnitudes and locations of soviet underground explosions at the Semipalatinsk Test Site, AWRE Rep. No. 0 16/84.
MassC, R. P. & Aleander, S. S., 1974. Compressional velocity distribution beneath Scandinavia and western Russia, Geophys. J . R. a s k SOC., 39, 587-602.
Muller, G., 1973. Seismic moment and long-period radiation of underground nuclear explosions, Bull. seism. SOC. Am. , 63,
Mueller, R. A. & Murphy, J. R., 1971. Seismic characteristics of underground nuclear detonations, Bull. seism. SOC. Am. , 61,
Murphy, J. R., 1981. P-wave coupling of underground explosions in various media, in Identification of Seismic Sources-Earthquake or Underground Explosion, Proc. of NATO ASI, pp. 201-205, eds Husebye, E. S. & Mykkeltveit, S., Riedel, Dordrecht., Holland,
Nuttli, 0. W., 1986a. Lg magnitudes of selected East Kazakhstan underground explosions, Bull. seism. SOC. Am. , 76, 1241-1251.
Nuttli, 0. W., 1986b. Yield estimates of Nevada Test Site
843-862.
847-857.
1675- 1692.
explosions obtained from seismic Lg waves, J. geophys. Res., 91, 2137-2151.
Seidl, D., 1980. The simulation problem for broad-band seismograms, J. Geophys., 48, 84-93.
Richards, P. G . , 1987. Consideration of chemical explosions, Presentation to OTA, April 28.
Richards, P. G. & Lindh, A , , 1987. Toward a new test ban regime. Iss. Sci. Tech., 111 (3), 101-108.
Ringdal, F., 1986. Study of magnitude, seismicity and earthquake detectability using a global network, Bull. seism. SOC. Am. , 76,
Rodean, H. G. , 1971. Nuclear-explosion seismology, Lawrence Livermore, University of California, AEC Critical Review Series.
Schlittenhardt, J . , 1986. Investigation of the velocity- and Q-structure of the lowermost mantle using PcP/P amplitude ratios from arrays at distances of 70-84", J . Geophys., 60,
Schlittenhardt, J . , 1987. Ableitung herdspezifischer KenngroDen von unterirdischen Nuklearexplosionen, I. Magnituden- Ladungsmengen-Beziehungen fur das GRF-Array, Bericht 100 484, Bundesanst. fur Geowiss. u. Rohstoffe. Hannover.
Smith, W. D., 1987. Underground nuclear explosions recorded in Rarotonga: estimation of mb from T-phase amplitude, Geonhys. J. R. agr. So:.. 90. 35-42.
Stevens, J. L., 1986. Estimation of scalar moments from explosion-generated surface waves, Bull. seism. SOC. Am. , 76,
Stevens, J. L. & Day, S. M., 1985. The physical basis of m b : M, and variable frequency magnitude methods for earthquake/ explosion discrimination, J. geophys. Res., 90, 3009-3020.
Sykes, L. R., 1987. Underground nuclear explosions: verifying limits on underground testing, yield estimates, and public policy, Rev. Geophys., 25, 1209-1214.
Sykes, L. R. & Cifuentes, I. L., 1984. Yields of soviet underground nuclear explosions from seismic surface waves: compliance with the Treshold Test Ban Treaty, Proc. natl. Acad. Sci. U.S .A.
1641-1659.
1-18.
123-151.
81, 1922-1925.
Downloaded from https://academic.oup.com/gji/article-abstract/95/1/163/601294by gueston 09 February 2018

Seismic yield estimation 179
Sykes, L. R. & Davis, D. M., 1987. The yields of soviet strategic weapons. Sci. Am., 256, 1-9.
Sykes, L. R. B Ruggi, S., 1987. Soviet underground testing: Inferences from seismic observations and historical perspective, in Nuclear Weapons Databook, vol. IV, Soviet Nuclear Weapons, eds Cochran, T. B. Arkin, W. A. and Sands, J. I. Ballinger MA.
Sykes, L. R. & Wiggins, G. C., 1986. Yields of Soviet underground nuclear explosions at Novaya Zemlya, 1964- 1976, from seismic body and surface waves, Proc. natl. Acad. Sci. U.S.A., 83,
Talandier, J. & Okal, E. A., 1987. Crustal structure in the Society and Tuamotu Islands, French Polynesia, Geophys. J. R. astr.
Taylor. S . R., 1983. Three-dimensional crust and upper mantle
201-205.
SOC., 88, 499-528.
structure at the Nevada Test Site, J . geophys. Res., 88,
Virchow, C. F., Conrad, G. E., Holt, D. M. & Holden, E. K., 1980. Microprocessor-controlled time domain reflectometer for dynamic shock position measurements, Rev. Sci., 51, 642-646.
Wallace, T. C., Helmberger, D. V. B Engen, G. R., 1983. Evidence of tectonic release from underground nuclear explosions in long-period P-waves, Bull. sehm. SOC. Am. , 73,
Wallace, T. C., Helmberger, D. V. & Engen, G. R., 1985. Evidence of tectonic release from underground nuclear explosions in long-period S-waves, Bull. seism. SOC. Am., 75,
Wonnacott, R. J. & Wonnacott, T. H., 1985. Introductory Statistics, Wiley, New York.
2220-2232.
593-613.
157-174.
Downloaded from https://academic.oup.com/gji/article-abstract/95/1/163/601294by gueston 09 February 2018