seismic hazard zone report for the south...
TRANSCRIPT
SEISMIC HAZARD ZONE REPORT 034
SEISMIC HAZARD ZONE REPORT FOR THE SOUTH GATE 7.5-MINUTE QUADRANGLE,
LOS ANGELES COUNTY, CALIFORNIA
1998
DEPARTMENT OF CONSERVATION Division of Mines and Geology
STATE OF CALIFORNIA
GRAY DAVIS GOVERNOR
THE RESOURCES AGENCY MARY D. NICHOLS
SECRETARY FOR RESOURCES
DEPARTMENT OF CONSERVATION DARRYL YOUNG
DIRECTOR

DIVISION OF MINES AND GEOLOGY
JAMES F. DAVIS, STATE GEOLOGIST
Copyright © 2001 by the California Department of Conservation. All rights reserved. No part of this publication may be reproduced without written consent of the Department of Conservation.
“The Department of Conservation makes no warrantees as to the suitability of this product for any particular purpose.”
SEISMIC HAZARD ZONE REPORT 034
SEISMIC HAZARD ZONE REPORT FOR THE SOUTH GATE 7.5-MINUTE QUADRANGLE,
LOS ANGELES COUNTY, CALIFORNIA
CALIFORNIA GEOLOGICAL SURVEY'S PUBLICATION SALES OFFICES:
Southern California Regional Office 888 South Figueroa Street, Suite 475 Los Angeles, CA 90017 (213) 239-0878
Publications and Information Office 801 K Street, MS 14-31 Sacramento, CA 95814-3531 (916) 445-5716
Bay Area Regional Office 345 Middlefield Road, MS 520 Menlo Park, CA 94025 (650) 688-6327

List of Revisions – South Gate SHZR 034
2001 Text updated
6/14/05 BPS address corrected, web links updated, Figure 3.5 added
1/17/06 Bay Area Regional Office and Southern California Regional Office addresses updated


CONTENTS
EXECUTIVE SUMMARY ........................................................................................................... vi
INTRODUCTION ...........................................................................................................................1
SECTION 1 LIQUEFACTION EVALUATION REPORT Liquefaction Zones in the South Gate 7.5-Minute Quadrangle, Los Angeles County, California ......................................................3
PURPOSE....................................................................................................................................3
BACKGROUND .....................................................................................................................4
METHODS SUMMARY.........................................................................................................4
SCOPE AND LIMITATIONS.................................................................................................4
PART I .........................................................................................................................................5
PHYSIOGRAPHY...................................................................................................................5
GEOLOGY ..............................................................................................................................6
ENGINEERING GEOLOGY ..................................................................................................6
GROUND-WATER CONDITIONS .......................................................................................7
PART II........................................................................................................................................8
LIQUEFACTION POTENTIAL .............................................................................................8
LIQUEFACTION SUSCEPTIBILITY....................................................................................9
LIQUEFACTION OPPORTUNITY .....................................................................................10
LIQUEFACTION ZONES ....................................................................................................11
ACKNOWLEDGMENTS .........................................................................................................13
REFERENCES ..........................................................................................................................13
SECTION 2 EARTHQUAKE-INDUCED LANDSLIDE EVALUATION REPORT .................17
iii
NO LANDSLIDE HAZARDS ZONED...................................................................................17
SECTION 3 GROUND SHAKING EVALUATION REPORT Potential Ground Shaking in the South Gate 7.5-Minute Quadrangle, Los Angeles County, California ....................................19
PURPOSE..................................................................................................................................19
EARTHQUAKE HAZARD MODEL .......................................................................................20
APPLICATIONS FOR LIQUEFACTION AND LANDSLIDE HAZARD ASSESSMENTS 24
USE AND LIMITATIONS........................................................................................................27
REFERENCES ..........................................................................................................................28
ILLUSTRATIONS
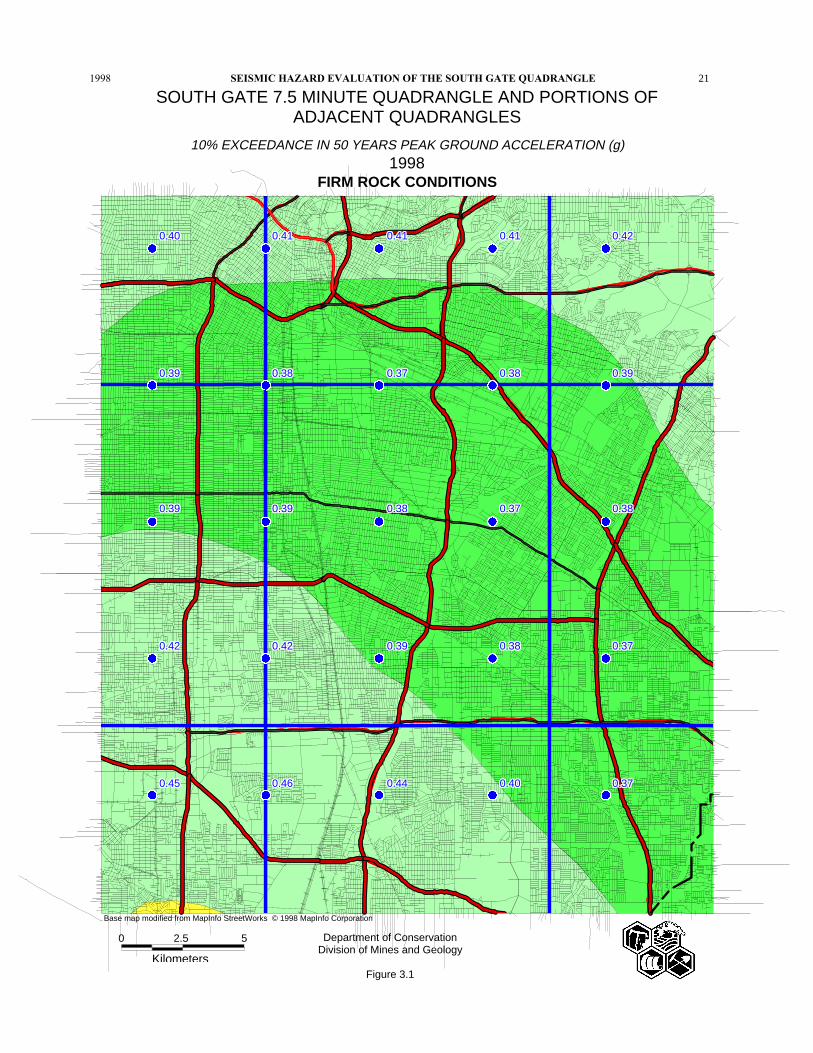
Figure 3.1. South Gate 7.5-Minute Quadrangle and portions of adjacent quadrangles, 10% exceedance in 50 years peak ground acceleration (g)—Firm rock conditions. .....................21
Figure 3.2. South Gate 7.5-Minute Quadrangle and portions of adjacent quadrangles, 10% exceedance in 50 years peak ground acceleration (g)—Soft rock conditions. ......................22
Figure 3.3. South Gate 7.5-Minute Quadrangle and portions of adjacent quadrangles, 10% exceedance in 50 years peak ground acceleration (g)—Alluvium conditions.......................23
Figure 3.4. South Gate 7.5-Minute Quadrangle and portions of adjacent quadrangles, 10% exceedance in 50 years peak ground acceleration—Predominant earthquake. .....................25
Figure 3.5. South Gate 7.5-Minute Quadrangle and portions of adjacent quadrangles, 10% exceedance in 50 years magnitude-weighted pseudo-peak acceleration for alluvium - Liquefaction opportunity .......................................................................................................26
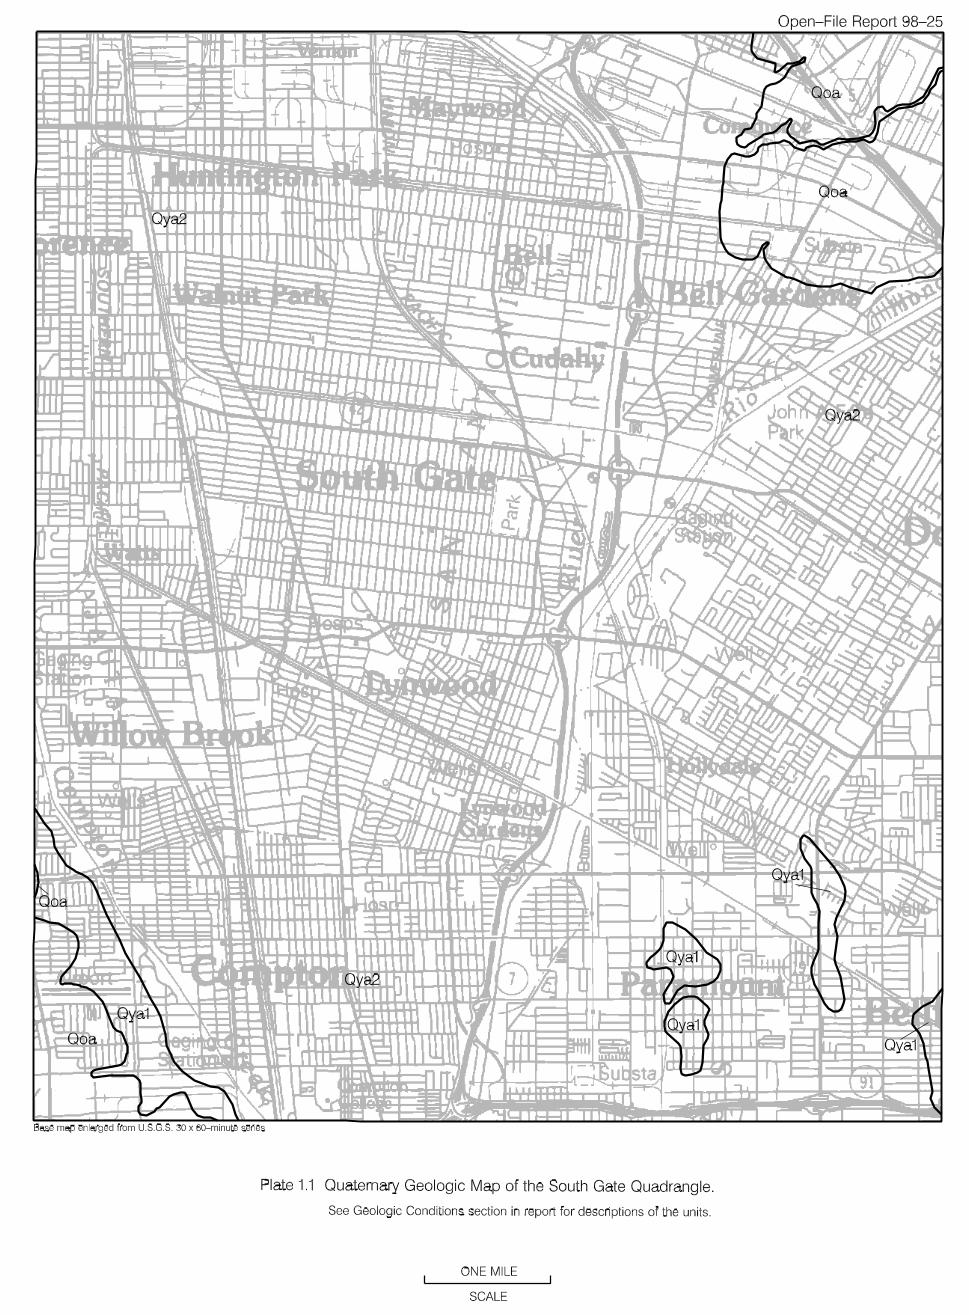
Plate 1.1. Quaternary Geologic Map of the South Gate Quadrangle.............................................30
Plate 1.2. Historically Highest Ground Water Contours and Borehole Log Data Locations, South Gate Quadrangle, California. .................................................................................................31
iv
EXECUTIVE SUMMARY
This report summarizes the methods and sources of information used to prepare the Seismic Hazard Zone Map for the South Gate 7.5-minute Quadrangle, Los Angeles County, California. The map displays the boundaries of Zones of Required Investigation for liquefaction over an area of approximately 62 square miles at a scale of 1 inch = 2,000 feet. Within the South Gate Quadrangle, no areas have been designated as “zones of required investigation for earthquake-induced landslides.”
The South Gate Quadrangle, in eastern Los Angeles County, includes all or parts of the cities of Bell, Bell Gardens, Bellflower, Carson, Commerce, Compton, Cudahy, Downey, Huntington Park, Los Angeles, Long Beach, Los Alamitos, Lynwood, Maywood, Montebello, Paramount, South Gate, and Vernon, as well as unincorporated areas of Los Angeles County. More than 75 percent of the quadrangle is covered with alluvial deposits of the Downey Plain. The main drainage courses within the quadrangle are the Los Angeles River, the Rio Hondo, and Compton Creek. Major transportation routes include the Santa Ana Freeway (I-5), the Century Freeway (I-105), the Artesia Freeway (State Highway 91), and the Long Beach Freeway (I-710).
The map is prepared by employing geographic information system (GIS) technology, which allows the manipulation of three-dimensional data. Information considered includes topography, surface and subsurface geology, borehole data, historical ground-water levels, existing landslide features, slope gradient, rock-strength measurements, geologic structure, and probabilistic earthquake shaking estimates. The shaking inputs are based upon probabilistic seismic hazard maps that depict peak ground acceleration, mode magnitude, and mode distance with a 10% probability of exceedance in 50 years.
The liquefaction zone covers nearly the entire South Gate Quadrangle because a shallow water table and young alluvial sediments characterize the region. Only those areas of land that rise toward the hills near the corners of the quadrangle at not within the zone.
v

How to view or obtain the map
Seismic Hazard Zone Maps, Seismic Hazard Zone Reports and additional information on seismic hazard zone mapping in California are available on the Division of Mines and Geology's Internet page: http://www.conservation.ca.gov/CGS/index.htm
Paper copies of Official Seismic Hazard Zone Maps, released by DMG, which depict zones of required investigation for liquefaction and/or earthquake-induced landslides, are available for purchase from:
BPS Reprographic Services 945 Bryant Street San Francisco, California 94105 (415) 512-6550
Seismic Hazard Zone Reports (SHZR) summarize the development of the hazard zone map for each area and contain background documentation for use by site investigators and local government reviewers. These reports are available for reference at DMG offices in Sacramento, San Francisco, and Los Angeles. NOTE: The reports are not available through BPS Reprographic Services.
INTRODUCTION
The Seismic Hazards Mapping Act (the Act) of 1990 (Public Resources Code, Chapter 7.8, Division 2) directs the California Department of Conservation (DOC), Division of Mines and Geology (DMG) to delineate seismic hazard zones. The purpose of the Act is to reduce the threat to public health and safety and to minimize the loss of life and property by identifying and mitigating seismic hazards. Cities, counties, and state agencies are directed to use the seismic hazard zone maps in their land-use planning and permitting processes. They must withhold development permits for a site within a zone until the geologic and soil conditions of the project site are investigated and appropriate mitigation measures, if any, are incorporated into development plans. The Act also requires sellers (and their agents) of real property within a mapped hazard zone to disclose at the time of sale that the property lies within such a zone. Evaluation and mitigation of seismic hazards are to be conducted under guidelines established by the California State Mining and Geology Board (DOC, 1997; also available on the Internet at http://gmw.consrv.ca.gov/shmp/webdocs/sp117.pdf).
The Act also directs SMGB to appoint and consult with the Seismic Hazards Mapping Act Advisory Committee (SHMAAC) in developing criteria for the preparation of the seismic hazard zone maps. SHMAAC consists of geologists, seismologists, civil and structural engineers, representatives of city and county governments, the state insurance commissioner and the insurance industry. In 1991 SMGB adopted initial criteria for delineating seismic hazard zones to promote uniform and effective statewide implementation of the Act. These initial criteria provide detailed standards for mapping regional liquefaction hazards. They also directed DMG to develop a set of probabilistic seismic maps for California and to research methods that might be appropriate for mapping earthquake-induced landslide hazards.
In 1996, working groups established by SHMAAC reviewed the prototype maps and the techniques used to create them. The reviews resulted in recommendations that 1) the process for zoning liquefaction hazards remain unchanged and 2) earthquake-induced landslide zones be delineated using a modified Newmark analysis.
This Seismic Hazard Zone Report summarizes the development of the hazard zone map. The process of zoning for liquefaction uses a combination of Quaternary geologic mapping, historical ground-water information, and subsurface geotechnical data. The process for zoning earthquake-induced landslides incorporates earthquake loading, existing landslide features, slope gradient, rock strength, and geologic structure. Probabilistic seismic hazard maps, which are the underpinning for delineating seismic hazard zones, have been prepared for peak ground acceleration, mode magnitude, and mode distance with a 10% probability of exceedance in 50 years (Petersen and others, 1996) in accordance with the mapping criteria.
1

This report summarizes seismic hazard zone mapping for potentially liquefiable soils in the South Gate 7.5-minute Quadrangle.
SECTION 1 LIQUEFACTION EVALUATION REPORT
Liquefaction Zones in the South Gate 7.5-Minute Quadrangle,
Los Angeles County, California
By Cynthia L. Pridmore
California Department of Conservation
Division of Mines and Geology
PURPOSE
The Seismic Hazards Mapping Act (the Act) of 1990 (Public Resources Code, Chapter 7.8, Division 2) directs the California Department of Conservation (DOC), Division of Mines and Geology (DMG) to delineate Seismic Hazard Zones. The purpose of the Act is to reduce the threat to public health and safety and to minimize the loss of life and property by identifying and mitigating seismic hazards. Cities, counties, and state agencies are directed to use seismic hazard zone maps developed by DMG in their land-use planning and permitting processes. The Act requires that site-specific geotechnical investigations be performed prior to permitting most urban development projects within seismic hazard zones. Evaluation and mitigation of seismic hazards are to be conducted under guidelines adopted by the California State Mining and Geology Board (DOC, 1997; also available on the Internet at http://gmw.consrv.ca.gov/shmp/webdocs/sp117.pdf).
This section of the evaluation report summarizes seismic hazard zone mapping for potentially liquefiable soils in the South Gate 7.5-minute Quadrangle. This section and Section 3 (addressing potential ground shaking) form a report that is one of a series that summarizes production of similar seismic hazard zone maps within the state (Smith, 1996). Additional information on seismic hazards zone mapping in California is on DMG’s Internet web page: http://www.conservation.ca.gov/CGS/index.htm
3

DIVISION OF MINES AND GEOLOGY SHZR 034 4
BACKGROUND
Liquefaction-induced ground failure historically has been a major cause of earthquake damage in southern California. During the 1971 San Fernando and 1994 Northridge earthquakes, significant damage to roads, utility pipelines, buildings, and other structures in the Los Angeles area was caused by liquefaction-induced ground displacement.
Localities most susceptible to liquefaction-induced damage are underlain by loose, water-saturated, granular sediment within 40 feet of the ground surface. These geological and ground-water conditions exist in parts of southern California, most notably in some densely populated valley regions and alluviated floodplains. In addition, the potential for strong earthquake ground shaking is high because of the many nearby active faults. The combination of these factors constitutes a significant seismic hazard in the southern California region in general, including areas in the South Gate Quadrangle.
METHODS SUMMARY
Characterization of liquefaction hazard presented in this report requires preparation of maps that delineate areas underlain by potentially liquefiable sediment. The following were collected or generated for this evaluation:
• Existing geologic maps were used to provide an accurate representation of the spatial distribution of Quaternary deposits in the study area. Geologic units that generally are susceptible to liquefaction include late Quaternary alluvial and fluvial sedimentary deposits and artificial fill
• Construction of shallow ground-water maps showing the historically highest known ground-water levels
• Quantitative analysis of geotechnical data to evaluate liquefaction potential of deposits
• Information on potential ground shaking intensity based on DMG probabilistic shaking maps
The data collected for this evaluation were processed into a series of geographic information system (GIS) layers using commercially available software. The liquefaction zone map was derived from a synthesis of these data and according to criteria adopted by the State Mining and Geology Board (DOC, 2000).
SCOPE AND LIMITATIONS
Evaluation for potentially liquefiable soils generally is confined to areas covered by Quaternary (less than about 1.6 million years) sedimentary deposits. Such areas within the South Gate Quadrangle consist mainly of alluviated lowlands. DMG’s liquefaction
2001 SEISMIC HAZARD ZONE REPORT FOR THE SOUTH GATE QUADRANGLE 5
hazard evaluations are based on information on earthquake ground shaking, surface and subsurface lithology, geotechnical soil properties, and ground-water depth, which is gathered from various sources. Although selection of data used in this evaluation was rigorous, the quality of the data used varies. The State of California and the Department of Conservation make no representations or warranties regarding the accuracy of the data obtained from outside sources.
Liquefaction zone maps are intended to prompt more detailed, site-specific geotechnical investigations, as required by the Act. As such, liquefaction zone maps identify areas where the potential for liquefaction is relatively high. They do not predict the amount or direction of liquefaction-related ground displacements, or the amount of damage to facilities that may result from liquefaction. Factors that control liquefaction-induced ground failure are the extent, depth, density, and thickness of liquefiable materials, depth to ground water, rate of drainage, slope gradient, proximity to free faces, and intensity and duration of ground shaking. These factors must be evaluated on a site-specific basis to assess the potential for ground failure at any given project site.
Information developed in the study is presented in two parts: physiographic, geologic, and hydrologic conditions in PART I, and liquefaction and zoning evaluations in PART II.
PART I
PHYSIOGRAPHY
Study Area Location and Physiography
The South Gate Quadrangle covers an area of about 62 square miles in eastern Los Angeles County. This includes all or parts of the cities of Bell, Bell Gardens, Bellflower, Carson, Commerce, Compton, Cudahy, Downey, Huntington Park, Los Angeles, Long Beach, Los Alamitos, Lynwood, Maywood, Montebello, Paramount, South Gate, and Vernon, as well as unincorporated areas of Los Angeles County. Major transportation routes traversing the South Gate Quadrangle include the Santa Ana Freeway (I-5), the Century Freeway (I-105), the Artesia Freeway (State Highway 91), and the Long Beach Freeway (I-710).
More than 75 percent of the quadrangle is covered with Holocene alluvial deposits of the regional coastal basin, also known as the Downey Plain. These deposits overlie an erosional surface of late Pleistocene age. In the northeast corner of the quadrangle, in the vicinity of Montebello and the City of Commerce, are gently uplifted and dissected Pleistocene sediments of an older fan system. Similar units are also uplifted and exposed in the southwest corner of the quadrangle that occupies a portion of the Dominguez Hills. The main drainage courses within the quadrangle are the Los Angeles River, the Rio Hondo, and Compton Creek.

DIVISION OF MINES AND GEOLOGY SHZR 034 6
GEOLOGY
Surficial Geology
Geologic units that generally are susceptible to liquefaction include late Quaternary alluvial and fluvial sedimentary deposits and artificial fill. The generalized geology of the South Gate Quadrangle is shown in Plate 1.1. This compilation was obtained, in digital form, from the U.S. Geological Survey (Tinsley, unpublished). The mapping is based on stratigraphic, geomorphic, and pedologic criteria, namely relative stratigraphic position, environment of deposition, relative degree of erosion, soil type and development, as well as texture (grain size). Map unit nomenclature follows the format developed by the Southern California Areal Mapping Project (SCAMP; Morton and Kennedy, 1989). This map was used in evaluating liquefaction susceptibility of Quaternary sedimentary deposits of the South Gate Quadrangle.
The geologic map of the South Gate Quadrangle (Plate 1.1) shows that the entire study area is covered by alluvial sediments of Quaternary age. Older alluvial fan sediments of Pleistocene age are associated with the Montebello Hills and Dominguez Hills. Elsewhere across most of the quadrangle are the younger alluvial fan sediments of Holocene and late Pleistocene age. These deposits consist of varying proportions of sand, gravel, silt, and clay.
ENGINEERING GEOLOGY
Information on subsurface geology and engineering characteristics of flatland deposits was obtained from borehole logs collected from reports on geotechnical and environmental projects. For this investigation, several hundred borehole logs were collected from the files of the California Department of Transportation (Caltrans); the California Regional Water Quality Control Board - Los Angeles Region; DMG Environmental Review and Hospital Review Projects; and the USGS. The USGS supplied copies of paper logs collected from the Los Angeles County Department of Public Works storm drain investigations. These logs were used in earlier liquefaction studies of the Los Angeles area (Tinsley and Fumal, 1985; Tinsley and others, 1985).
Lithologic, soil test, and related data from 374 logs were entered into the DMG (Geographic Information System) database. The remaining logs were reviewed during this investigation to aid with the stratigraphic correlation. Locations of all exploratory boreholes entered into the database are shown in Plate 1.2. Cross sections were constructed from borehole data to correlate soil types and engineering properties, and to extrapolate geotechnical data into outlying areas containing similar soils.
Standard Penetration Test (SPT) data provide a standardized measure of the penetration resistance of a geologic deposit and commonly are used as an index of density. Many geotechnical investigations record SPT data, including the number of blows by a 140-pound drop weight required to drive a sampler of specific dimensions one foot into the soil. Recorded blow counts for non-SPT geotechnical sampling, where the sampler
2001 SEISMIC HAZARD ZONE REPORT FOR THE SOUTH GATE QUADRANGLE 7
diameter, hammer weight or drop distance differ from those specified for an SPT (ASTM D1586), were converted to SPT-equivalent blow count values and entered into the DMG GIS. The actual and converted SPT blow counts were normalized to a common reference effective overburden pressure of one atmosphere (approximately one ton per square foot) and a hammer efficiency of 60% using a method described by Seed and Idriss (1982) and Seed and others (1985). This normalized blow count is referred to as (N1)60.
Descriptions of characteristics of geologic units recorded on the borehole logs are given below. These descriptions are necessarily generalized but give the most commonly encountered characteristics of the unit.
Older alluvium (Qoa)
The older alluvium on the South Gate Quadrangle is exposed in portions of the Montebello and Dominquez hills. This material consists predominantly of alternating beds of medium dense to very dense sand, clay, and silt. Locally, loose silt occurs in the older alluvium in the vicinity of the Montebello Hills.
Younger alluvium (Qya1, Qya2)
The young Quaternary alluvial deposits in the South Gate Quadrangle represent deposition predominantly by the San Gabriel River and Rio Hondo. This region has experienced multiple episodes of historic inundation during the past 150 years. Surface mapping has distinguished two units; Qya1 is considered to be relatively older than Qya2. Borehole data from Qya1 along the northeast flank of the Dominquez Hills indicate a variable unit ranging from very stiff clays and silts, to loose sands. The Qya2 mapped in the flood plain is virtually undistinguishable from Qya1 in the subsurface. In general, these subsurface deposits consist of loose to medium dense very coarse- to very fine-grained sand, gravel, and silt that appear to interfinger and grade laterally into each other.
GROUND-WATER CONDITIONS
Liquefaction hazard may exist in areas where depth to ground water is 40 feet or less. DMG uses the highest known ground-water levels because water levels during an earthquake cannot be anticipated because of the unpredictable fluctuations caused by natural processes and human activities. A historical-high ground-water map differs from most ground-water maps, which show the actual water table at a particular time. Plate 1.2 depicts a hypothetical ground-water table within alluviated areas.
Ground-water conditions were investigated in the South Gate Quadrangle to evaluate the depth to saturated materials. Saturated conditions reduce the effective normal stress, thereby increasing the likelihood of earthquake-induced liquefaction (Youd, 1973). For this investigation ground-water evaluation relied heavily on turn-of-the-century water-well logs (Mendenhall, 1905; Conkling, 1927), but also included water measurements from wells from the Central Basin Investigation (State Water Resources Board, 1952),
DIVISION OF MINES AND GEOLOGY SHZR 034 8
Department of Water Resources (circa 1940’s), and soil investigations collected for this study.
The evaluation was based on first-encountered water levels encountered in the boreholes and selected water wells. The depths to first-encountered water, free of piezometric influences, were plotted onto a map of the project area showing depths to historically shallowest ground water. This map was contoured, digitized and used for the liquefaction analysis (Plate 1.2). It displays the shallowest ground-water depths in perched, semi-perched, and other water table settings. The map was compared to similar published maps for any major discrepancies (Tinsley and others, 1985; Leighton and Associates, 1990).
Plate 1.2 shows that historical shallow water conditions (less than 40 feet deep) occurred throughout much of the South Gate Quadrangle. In the late 1800’s many shallow wells showed near-surface water levels, in addition to the widespread deeper artesian conditions. The subsequent management and withdrawal of ground water markedly reduced the distribution of both of these conditions. This century’s overall declining trend in water levels was reversed during the mid 1930’s to mid 1940’s due to increased precipitation rates. Hydrographs from this region show that water levels can vary seasonally as much as 35 feet. It is important to note that shallow water was encountered in geotechnical investigations (after 1960) throughout the South Gate Quadrangle.
Although the potential for recharge is beyond the scope of this report, the review of hundreds of boreholes, as well as conclusions from the California Department of Water Resources (1961) and Tinsley and others (1985), all suggest that water could move upward into semi-perched zones if pressure levels in the underlying units become sufficiently high, due to the discontinuous character and high sand content of the confining units. Similarly, both the Rio Hondo and the San Gabriel Rivers have the potential to recharge ground water due to the percolation and flood control basins associated with them.
PART II
LIQUEFACTION POTENTIAL
Liquefaction may occur in water-saturated sediment during moderate to great earthquakes. Liquefied sediment loses strength and may fail, causing damage to buildings, bridges, and other structures. Many methods for mapping liquefaction hazard have been proposed. Youd (1991) highlights the principal developments and notes some of the widely used criteria. Youd and Perkins (1978) demonstrate the use of geologic criteria as a qualitative characterization of liquefaction susceptibility and introduce the mapping technique of combining a liquefaction susceptibility map and a liquefaction opportunity map to produce a liquefaction potential map. Liquefaction susceptibility is a function of the capacity of sediment to resist liquefaction. Liquefaction opportunity is a function of the potential seismic ground shaking intensity.
2001 SEISMIC HAZARD ZONE REPORT FOR THE SOUTH GATE QUADRANGLE 9
The method applied in this study for evaluating liquefaction potential is similar to that of Tinsley and others (1985). Tinsley and others (1985) applied a combination of the techniques used by Seed and others (1983) and Youd and Perkins (1978) for their mapping of liquefaction hazards in the Los Angeles region. This method combines geotechnical analyses, geologic and hydrologic mapping, and probabilistic earthquake shaking estimates, but follows criteria adopted by the State Mining and Geology Board (DOC, 2000).
LIQUEFACTION SUSCEPTIBILITY
Liquefaction susceptibility reflects the relative resistance of a soil to loss of strength when subjected to ground shaking. Physical properties of soil such as sediment grain-size distribution, compaction, cementation, saturation, and depth govern the degree of resistance to liquefaction. Some of these properties can be correlated to a sediment’s geologic age and environment of deposition. With increasing age, relative density may increase through cementation of the particles or compaction caused by the weight of the overlying sediment. Grain-size characteristics of a soil also influence susceptibility to liquefaction. Sand is more susceptible than silt or gravel, although silt of low plasticity is treated as liquefiable in this investigation. Cohesive soils generally are not considered susceptible to liquefaction. Such soils may be vulnerable to strength loss with remolding and represent a hazard that is not addressed in this investigation. Soil characteristics and processes that result in higher measured penetration resistances generally indicate lower liquefaction susceptibility. Thus, blow count and cone penetrometer values are useful indicators of liquefaction susceptibility.
Saturation is required for liquefaction, and the liquefaction susceptibility of a soil varies with the depth to ground water. Very shallow ground water increases the susceptibility to liquefaction (soil is more likely to liquefy). Soils that lack resistance (susceptible soils) typically are saturated, loose and sandy. Soils resistant to liquefaction include all soil types that are dry, cohesive, or sufficiently dense. DMG’s map inventory of areas containing soils susceptible to liquefaction begins with evaluation of geologic maps and historical occurrences, cross-sections, geotechnical test data, geomorphology, and ground-water hydrology. Soil properties and soil conditions such as type, age, texture, color, and consistency, along with historical depths to ground water are used to identify, characterize, and correlate susceptible soils. Because Quaternary geologic mapping is based on similar soil observations, liquefaction susceptibility maps typically are similar to Quaternary geologic maps. DMG’s qualitative susceptible soil inventory is outlined below.
Older alluvium (Qoa)
Most of the older Quaternary sedimentary deposits of the South Gate Quadrangle are described in borehole logs as being dense to very dense sand, silt, and clay. In general, these deposits are considered to have a low liquefaction susceptibility.
Younger alluvium (Qya1, Qya2)
DIVISION OF MINES AND GEOLOGY SHZR 034 10
Younger alluvial fan deposits within the South Gate Quadrangle consist largely of sand, silt, and gravel, and lesser occurrences of clay. Most test boreholes drilled in these units report the presence of loose to medium dense sand and silt. Some deposits consist of very loose sand. Where historical ground-water levels are within 40 feet of the surface, these deposits are judged to be susceptible to liquefaction.
LIQUEFACTION OPPORTUNITY
Liquefaction opportunity is a measure, expressed in probabilistic terms, of the potential for strong ground shaking. Analyses of in-situ liquefaction resistance require assessment of liquefaction opportunity. The minimum level of seismic excitation to be used for such purposes is the level of peak ground acceleration (PGA) with a 10% probability of exceedance over a 50-year period (DOC, 2000). The earthquake magnitude used in DMG’s analysis is the magnitude that contributes most to the calculated PGA for an area.
For the South Gate Quadrangle, PGAs of 0.40 g to 0.49 g, resulting from predominant earthquakes of magnitude 6.7 to 6.9, were used for liquefaction analyses. The PGA and magnitude values were based on de-aggregation of the probabilistic hazard at the 10% in 50-year hazard level (Petersen and others, 1996; Cramer and Petersen, 1996). See the ground motion section (3) of this report for further details.
Quantitative Liquefaction Analysis
DMG performs quantitative analysis of geotechnical data to evaluate liquefaction potential using the Seed-Idriss Simplified Procedure (Seed and Idriss, 1971; Seed and others, 1983; National Research Council, 1985; Seed and others, 1985; Seed and Harder, 1990; Youd and Idriss, 1997). Using the Seed-Idriss Simplified Procedure one can calculate soil resistance to liquefaction, expressed in terms of cyclic resistance ratio (CRR), based on SPT results, ground-water level, soil density, moisture content, soil type, and sample depth. CRR values are then compared to calculated earthquake-generated shear stresses expressed in terms of cyclic stress ratio (CSR). The Seed-Idriss Simplified Procedure requires normalizing earthquake loading relative to a M7.5 event for the liquefaction analysis. To accomplish this, DMG’s analysis uses the Idriss magnitude scaling factor (MSF) (Youd and Idriss, 1997). It is convenient to think in terms of a factor of safety (FS) relative to liquefaction, where: FS = (CRR / CSR) * MSF. FS, therefore, is a quantitative measure of liquefaction potential. DMG uses a factor of safety of 1.0 or less, where CSR equals or exceeds CRR, to indicate the presence of potentially liquefiable soil. While an FS of 1.0 is considered the “trigger” for liquefaction, for a site specific analysis an FS of as much as 1.5 may be appropriate depending on the vulnerability of the site and related structures. The DMG liquefaction analysis program calculates an FS for each geotechnical sample for which blow counts were collected. Typically, multiple samples are collected for each borehole. The lowest FS in each borehole is used for that location. FS values vary in reliability according to the quality of the geotechnical data used in their calculation. FS, as well as other considerations such as slope, presence of free faces, and thickness and depth of

2001 SEISMIC HAZARD ZONE REPORT FOR THE SOUTH GATE QUADRANGLE 11
potentially liquefiable soil, are evaluated in order to construct liquefaction potential maps, which are then used to make a map showing zones of required investigation.
Approximately 90 percent of the geotechnical borehole logs reviewed in this study (Plate 1.2) include blow-count data from SPTs or from penetration tests that allow reasonable blow count translations to SPT-equivalent values. Non-SPT values, such as those resulting from the use of 2-inch or 2½-inch inside-diameter ring samplers, were translated to SPT-equivalent values if reasonable factors could be used in conversion calculations. The reliability of the SPT-equivalent values varies. Therefore, they are weighted and used in a more qualitative manner. Few borehole logs, however, include all of the information (e.g. soil density, moisture content, sieve analysis, etc.) required for an ideal Seed-Idriss Simplified Procedure. For boreholes having acceptable penetration tests, liquefaction analysis is performed using recorded density, moisture, and sieve test values or using averaged test values of similar materials. In areas where no blow counts were recorded, qualitative descriptions of “moderately dense,” “loose” or “very loose” sandy soils or of caving into open boreholes were considered indicators of liquefaction-susceptible sediments.
LIQUEFACTION ZONES
Criteria for Zoning
Areas underlain by materials susceptible to liquefaction during an earthquake were included in liquefaction zones using criteria developed by the Seismic Hazards Mapping Act Advisory Committee and adopted by the California State Mining and Geology Board (DOC, 2000). Under those guideline criteria, liquefaction zones are areas meeting one or more of the following:
1. Areas known to have experienced liquefaction during historical earthquakes
2. All areas of uncompacted artificial fill containing liquefaction-susceptible material that are saturated, nearly saturated, or may be expected to become saturated
3. Areas where sufficient existing geotechnical data and analyses indicate that the soils are potentially liquefiable
4. Areas where existing geotechnical data are insufficient
In areas of limited or no geotechnical data, susceptibility zones may be identified by geologic criteria as follows:
a) Areas containing soil deposits of late Holocene age (current river channels and their historic floodplains, marshes and estuaries), where the M7.5-weighted peak acceleration that has a 10% probability of being exceeded in 50 years is greater than or equal to 0.10 g and the water table is less than 40 feet below the ground surface; or

DIVISION OF MINES AND GEOLOGY SHZR 034 12
b) Areas containing soil deposits of Holocene age (less than 11,000 years), where the M7.5-weighted peak acceleration that has a 10% probability of being exceeded in 50 years is greater than or equal to 0.20 g and the historical high water table is less than or equal to 30 feet below the ground surface; or
c) Areas containing soil deposits of latest Pleistocene age (11,000 to 15,000 years), where the M7.5-weighted peak acceleration that has a 10% probability of being exceeded in 50 years is greater than or equal to 0.30 g and the historical high water table is less than or equal to 20 feet below the ground surface.
Application of SMGB criteria to liquefaction zoning in the South Gate Quadrangle is summarized below.
Areas of Past Liquefaction
In the South Gate Quadrangle damage attributed to liquefaction was noted in the vicinity of Compton following the 1933 Long Beach earthquake (Wood, 1933; Barrows, 1974). Surface effects from this earthquake (Plate 1.2) included cracks where water, sand, and mud were ejected. Two of these cracks formed in a field one half-mile southwest of the intersection of Alondra and Atlantic Boulevards (Hillis, 1933; Wood, 1933; Barrows, 1974). Wood (1933) speculated that the considerable damage in Willowbrook, Lynwood, South Gate, and Huntington Park was probably due to the location of these communities on formerly marshy ground, particularly in areas along Compton Creek and the former courses of the Los Angeles River.
Artificial Fills
Non-engineered artificial fills have not been delineated or mapped in the South Gate Quadrangle. Consequently, no areas are zoned for potential liquefaction relative to artificial fill.
Areas with Sufficient Existing Geotechnical Data
Borehole logs that include penetration test data and sufficiently detailed lithologic descriptions were used to evaluate liquefaction potential. These areas with sufficient geotechnical data were evaluated for zoning based on the liquefaction potential determined by the Seed-Idriss Simplified Procedure. Accordingly, these areas are zoned or not zoned according to the liquefaction potential based on adequate existing geotechnical data. In the younger alluvium, most of the boreholes whose log data were analyzed using the Seed Simplified Procedure contain sediment layers that liquefy under the given earthquake parameters. These areas containing potentially liquefiable material are zoned.
Areas with Insufficient Existing Geotechnical Data
Younger alluvium deposited in stream channel and active wash areas generally lack adequate geotechnical borehole information. The soil characteristics and ground-water conditions in these deposits are assumed to be similar to deposits where subsurface
2001 SEISMIC HAZARD ZONE REPORT FOR THE SOUTH GATE QUADRANGLE 13
information is available. The stream channel and active wash deposits, therefore, are included in the liquefaction zone for reasons presented in criteria item 4a above.
ACKNOWLEDGMENTS
The author thanks the staff of the California Department of Transportation (Caltrans) and Department of Water Resources; the Los Angeles County Department of Public Works; the California Regional Water Quality Control Board - Los Angeles Region; and John Tinsley of the U.S. Geological Survey, for their assistance in the collection of borehole data. Special thanks to Bob Moskovitz, Teri McGuire, Scott Shepherd, Barbara Wanish and Joy Arthur for their GIS operations support, and for designing and plotting the graphic displays associated with the liquefaction zone map and this report.
REFERENCES
American Society for Testing and Materials, 1999, Standard test method for penetration test and split-barrel sampling of soils, Test Method D1586-99, in Annual Book of ASTM Standards, v. 4.08.
Barrows, A.G., 1974, A review of the geology and earthquake history of the Newport-Inglewood structural zone, southern California: California Department of Conservation, Division of Mines and Geology, Special Report 114, 115 p.
California Department of Conservation, Division of Mines and Geology, 1997, Guidelines for evaluating and mitigating seismic hazards in California, Special Publication 117, 74 p.
California Department of Conservation, Division of Mines and Geology, 2000, Recommended criteria for delineating seismic hazard zones in California, Special Publication 118, 12 p.
California Department of Water Resources, 1961, Planned utilization of the ground water basins of the Coastal Plain of Los Angeles County, Appendix A, Ground water geology: Bulletin 104.
California State Water Resources Board, 1952, Central Basin Investigation, Lower Los Angeles and San Gabriel Rivers Area, County of Los Angeles: Bulletin 8, 27 p.
Conkling, H., 1927, San Gabriel investigation: California Division of Water Resources Bulletin 5, 640 p.
DIVISION OF MINES AND GEOLOGY SHZR 034 14
Cramer, C.H. and Petersen, M.D., 1996, Predominant seismic source distance and magnitude maps for Los Angeles, Orange, and Ventura counties, California: Bulletin of Seismological Society of America, v. 86, no. 5, p. 1,645-1,649.
Hillis, D., 1933, Cracks produced by Long Beach, California, Earthquake: American Association of Petroleum Geologists Bulletin, v. 17, p. 739-740.
Leighton and Associates, Inc., 1990, Hazard reduction in Los Angeles County: Technical Appendix to the Safety Element of the Los Angeles County General Plan, Department of Regional Planning, County of Los Angeles, 2 v.
Mendenhall, W.C., 1905, Development of underground waters in the central coastal plain region of southern California: U.S. Geological Survey Water-Supply Paper 138, 160 p.
Morton, D.M. and Kennedy, M.P., 1989, A southern California digital 1:100,000-scale geologic map series: The Santa Ana Quadrangle, The first release: Geological Society of America Abstracts with Programs v. 21, no. 6, p. A107-A108.
National Research Council, 1985, Liquefaction of soils during earthquakes: National Research Council Special Publication, Committee on Earthquake Engineering, National Academy Press, Washington, D.C., 240 p.
Petersen, M.D., Bryant, W.A., Cramer, C.H., Cao, Tianqing, Reichle, M.S., Frankel, A.D., Lienkaemper, J.J., McCrory, P.A. and Schwartz, D.P., 1996, Probabilistic seismic hazard assessment for the State of California: California Department of Conservation, Division of Mines and Geology, Open File Report 96-08; U.S. Geological Survey Open File Report 96-706, 33 p.
Seed, H.B. and Idriss, I.M., 1971, Simplified procedure for evaluating soil liquefaction potential: Journal of the Soil Mechanics and Foundations Division of ASCE, v. 97: SM9, p. 1,249-1,273.
Seed, H.B. and Idriss, I.M., 1982, Ground motions and soil liquefaction during earthquakes: Monograph Series, Earthquake Engineering Research Institute, Berkeley, California, 134 p.
Seed, H.B., Idriss, I.M. and Arango, Ignacio, 1983, Evaluation of liquefaction potential using field performance data: Journal of Geotechnical Engineering, v. 109, no. 3, p. 458-482.
Seed, H.B., Tokimatsu, Kohji, Harder, L.F., and Chung, R.M., 1985, Influence of SPT procedures in soil liquefaction resistance evaluations: Journal of Geotechnical Engineering, ASCE, v. 111, no. 12, p. 1,425-1,445.
Seed, R.B. and Harder, L.F., 1990, SPT-based analysis of cyclic pore pressure generation and undrained residual strength: Proceedings of the H. Bolton Seed Memorial Symposium, v. 2, p. 351-376.

2001 SEISMIC HAZARD ZONE REPORT FOR THE SOUTH GATE QUADRANGLE 15
Smith, T.C., 1996, Preliminary maps of seismic hazard zones and draft guidelines for evaluating and mitigating seismic hazards: California Geology, v. 49, no. 6, p. 147-150.
Tinsley, J.C., unpublished, Digital geologic map of the South Gate 7.5-minute Quadrangle, U.S. Geological Survey, Menlo Park, California.
Tinsley, J.C. and Fumal, T.E., 1985, Mapping Quaternary sedimentary deposits for areal variations in shaking response, in Ziony, J.I., editor, Evaluating earthquake hazards in the Los Angeles region -- An earth science perspective: U.S. Geological Survey Professional Paper 1360, p. 101-125.
Tinsley, J.C., Youd, T.L., Perkins, D.M. and Chen, A.T.F., 1985, Evaluating liquefaction potential, in Ziony, J.I., editor, Evaluating earthquake hazards in the Los Angeles region — An earth science perspective: U.S. Geological Survey Professional Paper 1360, p. 263-316.
Wood, H.O., 1933, Preliminary report on the Long Beach earthquake: Bulletin of the Seismological Society of America, v. 23, p. 43-56.
Youd, T.L., 1973, Liquefaction, flow and associated ground failure: U.S. Geological Survey Circular 688, 12 p.
Youd, T.L., 1991, Mapping of earthquake-induced liquefaction for seismic zonation: Earthquake Engineering Research Institute, Proceedings, Fourth International Conference on Seismic Zonation, v. 1, p. 111-138.
Youd, T.L. and Idriss, I.M., 1997, editors, Proceedings of the NCEER workshop on evaluation of liquefaction resistance of soils: National Center for Earthquake Engineering Research Technical Report NCEER-97-0022, 276 p.
Youd, T.L. and Perkins, D.M., 1978, Mapping liquefaction-induced ground failure potential: Journal of Geotechnical Engineering, v. 104, p. 433-446.

2001 SEISMIC HAZARD ZONE REPORT FOR THE SOUTH GATE QUADRANGLE 17
SECTION 2 EARTHQUAKE-INDUCED LANDSLIDE
EVALUATION REPORT
NO LANDSLIDE HAZARDS ZONED
Within the South Gate Quadrangle, no areas have been designated as “zones of required investigation for earthquake-induced landslides.” However, the potential for landslides may exist locally, particularly along streambanks, margins of drainage channels, and similar settings where steep banks or slopes occur. Such occurrences are of limited lateral extent, or are too small and discontinuous to be depicted at 1:24,000 scale (the scale of Seismic Hazard Zone Maps). Within the liquefaction zones, some geologic settings may be susceptible to lateral-spreading (a condition wherein low-angle landsliding is associated with liquefaction). Also, landslide hazards can be created during excavation and grading unless appropriate techniques are used


2001 SEISMIC HAZARD ZONE REPORT FOR THE SOUTH GATE QUADRANGLE 19
SECTION 3 GROUND SHAKING EVALUATION REPORT
Potential Ground Shaking in the
South Gate 7.5-Minute Quadrangle, Los Angeles County, California
By
Mark D. Petersen*, Chris H. Cramer*, Geoffrey A. Faneros, Charles R. Real, and Michael S. Reichle
California Department of Conservation
Division of Mines and Geology *Formerly with DMG, now with U.S. Geological Survey
PURPOSE
The Seismic Hazards Mapping Act (the Act) of 1990 (Public Resources Code, Chapter 7.8, Division 2) directs the California Department of Conservation (DOC), Division of Mines and Geology (DMG) to delineate Seismic Hazard Zones. The purpose of the Act is to reduce the threat to public health and safety and to minimize the loss of life and property by identifying and mitigating seismic hazards. Cities, counties, and state agencies are directed to use the Seismic Hazard Zone Maps in their land-use planning and permitting processes. The Act requires that site-specific geotechnical investigations be performed prior to permitting most urban development projects within the hazard zones. Evaluation and mitigation of seismic hazards are to be conducted under guidelines established by the California State Mining and Geology Board (DOC, 1997; also available on the Internet at http://gmw.consrv.ca.gov/shmp/webdocs/sp117.pdf).
This section of the evaluation report summarizes the ground motions used to evaluate liquefaction and earthquake-induced landslide potential for zoning purposes. Included are ground motion and related maps, a brief overview on how these maps were prepared, precautionary notes concerning their use, and related references. The maps provided

DIVISION OF MINES AND GEOLOGY SHZR 034 20
herein are presented at a scale of approximately 1:150,000 (scale bar provided on maps), and show the full 7.5-minute quadrangle and portions of the adjacent eight quadrangles. They can be used to assist in the specification of earthquake loading conditions for the analysis of ground failure according to the “Simple Prescribed Parameter Value” method (SPPV) described in the site investigation guidelines (California Department of Conservation, 1997). Alternatively, they can be used as a basis for comparing levels of ground motion determined by other methods with the statewide standard.
This section and Sections 1 and 2 (addressing liquefaction and earthquake-induced landslide hazards) constitute a report series that summarizes development of seismic hazard zone maps in the state. Additional information on seismic hazard zone mapping in California can be accessed on DMG’s Internet homepage: http://www.conservation.ca.gov/CGS/index.htm
EARTHQUAKE HAZARD MODEL
The estimated ground shaking is derived from the statewide probabilistic seismic hazard evaluation released cooperatively by the California Department of Conservation, Division of Mines and Geology, and the U.S. Geological Survey (Petersen and others, 1996). That report documents an extensive 3-year effort to obtain consensus within the scientific community regarding fault parameters that characterize the seismic hazard in California. Fault sources included in the model were evaluated for long-term slip rate, maximum earthquake magnitude, and rupture geometry. These fault parameters, along with historical seismicity, were used to estimate return times of moderate to large earthquakes that contribute to the hazard.
The ground shaking levels are estimated for each of the sources included in the seismic source model using attenuation relations that relate earthquake shaking with magnitude, distance from the earthquake, and type of fault rupture (strike-slip, reverse, normal, or subduction). The published hazard evaluation of Petersen and others (1996) only considers uniform firm-rock site conditions. In this report, however, we extend the hazard analysis to include the hazard of exceeding peak horizontal ground acceleration (PGA) at 10% probability of exceedance in 50 years on spatially uniform conditions of rock, soft rock, and alluvium. These soil and rock conditions approximately correspond to site categories defined in Chapter 16 of the Uniform Building Code (ICBO, 1997), which are commonly found in California. We use the attenuation relations of Boore and others (1997), Campbell (1997), Sadigh and others (1997), and Youngs and others (1997) to calculate the ground motions.
The seismic hazard maps for ground shaking are produced by calculating the hazard at sites separated by about 5 km. Figures 3.1 through 3.3 show the hazard for PGA at 10% probability of exceedance in 50 years assuming the entire map area is firm rock, soft rock, or alluvial site conditions respectively. The sites where the hazard is calculated are represented as dots and ground motion contours as shaded regions. The quadrangle of interest is outlined by bold lines and centered on the map. Portions of the eight adjacent
))))))))))))))))))))))))))))))))))))))))))))))))) ))))))))))))))))))))))))))))))))))))))))))))))))))))))))))))))))))))))))))))))))))))))))))))))))))))))))))))))))))))))))))))))))))))))))))))))))))) )))))))))))))))))))))))))))))))))))))))))))))))))
))))))))))))))))))))))))))))))))))))))))))))))))) ))))))))))))))))))))))))))))))))))))))))))))))))) ))))))))))))))))))))))))))))))))))))))))))))))))) ))))))))))))))))))))))))))))))))))))))))))))))))) )))))))))))))))))))))))))))))))))))))))))))))))))
))))))))))))))))))))))))))))))))))))))))))))))))) ))))))))))))))))))))))))))))))))))))))))))))))))) ))))))))))))))))))))))))))))))))))))))))))))))))) ))))))))))))))))))))))))))))))))))))))))))))))))) )))))))))))))))))))))))))))))))))))))))))))))))))
))))))))))))))))))))))))))))))))))))))))))))))))) ))))))))))))))))))))))))))))))))))))))))))))))))) ))))))))))))))))))))))))))))))))))))))))))))))))) ))))))))))))))))))))))))))))))))))))))))))))))))) )))))))))))))))))))))))))))))))))))))))))))))))))
))))))))))))))))))))))))))))))))))))))))))))))))) ))))))))))))))))))))))))))))))))))))))))))))))))) ))))))))))))))))))))))))))))))))))))))))))))))))) ))))))))))))))))))))))))))))))))))))))))))))))))) )))))))))))))))))))))))))))))))))))))))))))))))))
0.450.450.450.450.450.450.450.450.45 0.460.460.460.460.460.460.460.460.46 0.440.440.440.440.440.440.440.440.44 0.400.400.400.400.400.400.400.400.40 0.370.370.370.370.370.370.370.370.37
0.420.420.420.420.420.420.420.420.42 0.420.420.420.420.420.420.420.420.42 0.390.390.390.390.390.390.390.390.39 0.380.380.380.380.380.380.380.380.38 0.370.370.370.370.370.370.370.370.37
0.390.390.390.390.390.390.390.390.39 0.390.390.390.390.390.390.390.390.39 0.380.380.380.380.380.380.380.380.38 0.370.370.370.370.370.370.370.370.37 0.380.380.380.380.380.380.380.380.38
0.390.390.390.390.390.390.390.390.39 0.380.380.380.380.380.380.380.380.38 0.370.370.370.370.370.370.370.370.37 0.380.380.380.380.380.380.380.380.38 0.390.390.390.390.390.390.390.390.39
0.400.400.400.400.400.400.400.400.40 0.410.410.410.410.410.410.410.410.41 0.410.410.410.410.410.410.410.410.41 0.410.410.410.410.410.410.410.410.41 0.420.420.420.420.420.420.420.420.42
SOUTH GATE 7.5 MINUTE QUADRANGLE AND PORTIONS OFADJACENT QUADRANGLES
10% EXCEEDANCE IN 50 YEARS PEAK GROUND ACCELERATION (g)1998
FIRM ROCK CONDITIONS
Department of ConservationDivision of Mines and Geology
Figure 3.1
0 2.5
Kilometers
5
Base map modified from MapInfo StreetWorks © 1998 MapInfo Corporation
SEISMIC HAZARD EVALUATION OF THE SOUTH GATE QUADRANGLE 211998

))))))))))))))))))))))))))))))))))))))))))))))))) ))))))))))))))))))))))))))))))))))))))))))))))))) ))))))))))))))))))))))))))))))))))))))))))))))))) ))))))))))))))))))))))))))))))))))))))))))))))))) )))))))))))))))))))))))))))))))))))))))))))))))))
))))))))))))))))))))))))))))))))))))))))))))))))) ))))))))))))))))))))))))))))))))))))))))))))))))) ))))))))))))))))))))))))))))))))))))))))))))))))) ))))))))))))))))))))))))))))))))))))))))))))))))))))))))))))))))))))))))))))))))))))))))))))))))))
))))))))))))))))))))))))))))))))))))))))))))))))) ))))))))))))))))))))))))))))))))))))))))))))))))) ))))))))))))))))))))))))))))))))))))))))))))))))) ))))))))))))))))))))))))))))))))))))))))))))))))) )))))))))))))))))))))))))))))))))))))))))))))))))
))))))))))))))))))))))))))))))))))))))))))))))))) ))))))))))))))))))))))))))))))))))))))))))))))))) ))))))))))))))))))))))))))))))))))))))))))))))))) ))))))))))))))))))))))))))))))))))))))))))))))))) )))))))))))))))))))))))))))))))))))))))))))))))))
)))))))))))))))))))))))))))))))))))))))))))))))))))))))))))))))))))))))))))))))))))))))))))))))))) ))))))))))))))))))))))))))))))))))))))))))))))))) ))))))))))))))))))))))))))))))))))))))))))))))))) )))))))))))))))))))))))))))))))))))))))))))))))))
0.500.500.500.500.500.500.500.500.50 0.500.500.500.500.500.500.500.500.50 0.480.480.480.480.480.480.480.480.48 0.440.440.440.440.440.440.440.440.44 0.410.410.410.410.410.410.410.410.41
0.460.460.460.460.460.460.460.460.46 0.460.460.460.460.460.460.460.460.46 0.430.430.430.430.430.430.430.430.43 0.420.420.420.420.420.420.420.420.42 0.410.410.410.410.410.410.410.410.41
0.440.440.440.440.440.440.440.440.44 0.430.430.430.430.430.430.430.430.43 0.420.420.420.420.420.420.420.420.42 0.410.410.410.410.410.410.410.410.41 0.420.420.420.420.420.420.420.420.42
0.430.430.430.430.430.430.430.430.43 0.420.420.420.420.420.420.420.420.42 0.410.410.410.410.410.410.410.410.41 0.420.420.420.420.420.420.420.420.42 0.430.430.430.430.430.430.430.430.43
0.440.440.440.440.440.440.440.440.44 0.450.450.450.450.450.450.450.450.45 0.450.450.450.450.450.450.450.450.45 0.450.450.450.450.450.450.450.450.45 0.470.470.470.470.470.470.470.470.47
SOUTH GATE 7.5 MINUTE QUADRANGLE AND PORTIONS OFADJACENT QUADRANGLES
10% EXCEEDANCE IN 50 YEARS PEAK GROUND ACCELERATION (g)
1998SOFT ROCK CONDITIONS
Department of ConservationDivision of Mines and Geology
Figure 3.2
0 2.5
Kilometers
5
Base map modified from MapInfo StreetWorks © 1998 MapInfo Corporation
22 DIVISION OF MINES AND GEOLOGY SHZR 034

))))))))))))))))))))))))))))))))))))))))))))))))) ))))))))))))))))))))))))))))))))))))))))))))))))) ))))))))))))))))))))))))))))))))))))))))))))))))) ))))))))))))))))))))))))))))))))))))))))))))))))) )))))))))))))))))))))))))))))))))))))))))))))))))
))))))))))))))))))))))))))))))))))))))))))))))))) ))))))))))))))))))))))))))))))))))))))))))))))))))))))))))))))))))))))))))))))))))))))))))))))))))))))))))))))))))))))))))))))))))))))))))))))))))) )))))))))))))))))))))))))))))))))))))))))))))))))
))))))))))))))))))))))))))))))))))))))))))))))))) ))))))))))))))))))))))))))))))))))))))))))))))))) ))))))))))))))))))))))))))))))))))))))))))))))))) ))))))))))))))))))))))))))))))))))))))))))))))))) )))))))))))))))))))))))))))))))))))))))))))))))))
))))))))))))))))))))))))))))))))))))))))))))))))) ))))))))))))))))))))))))))))))))))))))))))))))))) ))))))))))))))))))))))))))))))))))))))))))))))))) ))))))))))))))))))))))))))))))))))))))))))))))))) )))))))))))))))))))))))))))))))))))))))))))))))))
))))))))))))))))))))))))))))))))))))))))))))))))) ))))))))))))))))))))))))))))))))))))))))))))))))) ))))))))))))))))))))))))))))))))))))))))))))))))) ))))))))))))))))))))))))))))))))))))))))))))))))) )))))))))))))))))))))))))))))))))))))))))))))))))
0.490.490.490.490.490.490.490.490.49 0.490.490.490.490.490.490.490.490.49 0.480.480.480.480.480.480.480.480.48 0.450.450.450.450.450.450.450.450.45 0.430.430.430.430.430.430.430.430.43
0.470.470.470.470.470.470.470.470.47 0.470.470.470.470.470.470.470.470.47 0.450.450.450.450.450.450.450.450.45 0.440.440.440.440.440.440.440.440.44 0.430.430.430.430.430.430.430.430.43
0.450.450.450.450.450.450.450.450.45 0.450.450.450.450.450.450.450.450.45 0.440.440.440.440.440.440.440.440.44 0.440.440.440.440.440.440.440.440.44 0.440.440.440.440.440.440.440.440.44
0.450.450.450.450.450.450.450.450.45 0.440.440.440.440.440.440.440.440.44 0.440.440.440.440.440.440.440.440.44 0.440.440.440.440.440.440.440.440.44 0.450.450.450.450.450.450.450.450.45
0.460.460.460.460.460.460.460.460.46 0.470.470.470.470.470.470.470.470.47 0.470.470.470.470.470.470.470.470.47 0.470.470.470.470.470.470.470.470.47 0.490.490.490.490.490.490.490.490.49
SOUTH GATE 7.5 MINUTE QUADRANGLE AND PORTIONS OFADJACENT QUADRANGLES
10% EXCEEDANCE IN 50 YEARS PEAK GROUND ACCELERATION (g)
1998ALLUVIUM CONDITIONS
Department of ConservationDivision of Mines and Geology
Figure 3.3Kilometers
0 2.5 5
Base map modified from MapInfo Street Works ©1998 MapInfo Corporation
1998 SEISMIC HAZARD EVALUATION OF THE SOUTH GATE QUADRANGLE 23
DIVISION OF MINES AND GEOLOGY SHZR 034 24
quadrangles are also shown so that the trends in the ground motion may be more apparent. We recommend estimating ground motion values by selecting the map that matches the actual site conditions, and interpolating from the calculated values of PGA rather than the contours, since the points are more accurate.
APPLICATIONS FOR LIQUEFACTION AND LANDSLIDE HAZARD ASSESSMENTS
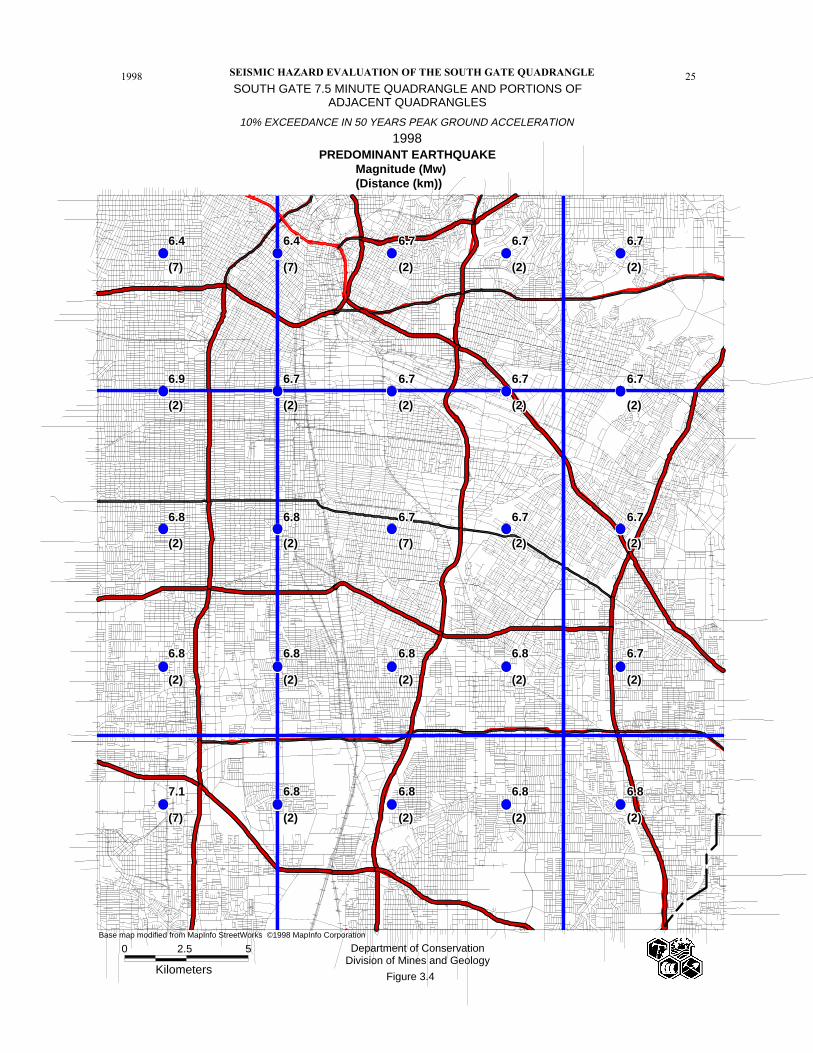
Deaggregation of the seismic hazard identifies the contribution of each of the earthquakes (various magnitudes and distances) in the model to the ground motion hazard for a particular exposure period (see Cramer and Petersen, 1996). The map in Figure 3.4 identifies the magnitude and the distance (value in parentheses) of the earthquake that contributes most to the hazard at 10% probability of exceedance in 50 years on alluvial site conditions (predominant earthquake). This information gives a rationale for selecting a seismic record or ground motion level in evaluating ground failure. However, it is important to keep in mind that more than one earthquake may contribute significantly to the hazard at a site, and those events can have markedly different magnitudes and distances. For liquefaction hazard the predominant earthquake magnitude from Figure 3.4 and PGA from Figure 3.3 (alluvium conditions) can be used with the Youd and Idriss (1997) approach to estimate cyclic stress ratio demand. For landslide hazard the predominant earthquake magnitude and distance can be used to select a seismic record that is consistent with the hazard for calculating the Newmark displacement (Wilson and Keefer, 1983). When selecting the predominant earthquake magnitude and distance, it is advisable to consider the range of values in the vicinity of the site and perform the ground failure analysis accordingly. This would yield a range in ground failure hazard from which recommendations appropriate to the specific project can be made. Grid values for predominant earthquake magnitude and distance should not be interpolated at the site location, because these parameters are not continuous functions.
A preferred method of using the probabilistic seismic hazard model and the “simplified Seed-Idriss method” of assessing liquefaction hazard is to apply magnitude scaling probabilistically while calculating peak ground acceleration for alluvium. The result is a “magnitude-weighted” ground motion (liquefaction opportunity) map that can be used directly in the calculation of the cyclic stress ratio threshold for liquefaction and for estimating the factor of safety against liquefaction (Youd and Idriss, 1997). This can provide a better estimate of liquefaction hazard than use of predominate magnitude described above, because all magnitudes contributing to the estimate are used to weight the probabilistic calculation of peak ground acceleration (Real and others, 2000). Thus, large distant earthquakes that occur less frequently but contribute more to the liquefaction hazard are appropriately accounted for.
Figure 3.5 shows the magnitude-weighted alluvial PGA based on Idriss’ weighting function (Youd and Idriss, 1997). It is important to note that the values obtained from this map are pseudo-accelerations and should be used in the formula for factor of safety without any magnitude-scaling (a factor of 1) applied.
))))))))))))))))))))))))))))))))))))))))))))))))) ))))))))))))))))))))))))))))))))))))))))))))))))) ))))))))))))))))))))))))))))))))))))))))))))))))) ))))))))))))))))))))))))))))))))))))))))))))))))) )))))))))))))))))))))))))))))))))))))))))))))))))
))))))))))))))))))))))))))))))))))))))))))))))))) ))))))))))))))))))))))))))))))))))))))))))))))))) ))))))))))))))))))))))))))))))))))))))))))))))))) ))))))))))))))))))))))))))))))))))))))))))))))))) )))))))))))))))))))))))))))))))))))))))))))))))))
))))))))))))))))))))))))))))))))))))))))))))))))) ))))))))))))))))))))))))))))))))))))))))))))))))) ))))))))))))))))))))))))))))))))))))))))))))))))) ))))))))))))))))))))))))))))))))))))))))))))))))) )))))))))))))))))))))))))))))))))))))))))))))))))
))))))))))))))))))))))))))))))))))))))))))))))))) ))))))))))))))))))))))))))))))))))))))))))))))))) ))))))))))))))))))))))))))))))))))))))))))))))))) ))))))))))))))))))))))))))))))))))))))))))))))))) )))))))))))))))))))))))))))))))))))))))))))))))))
))))))))))))))))))))))))))))))))))))))))))))))))) ))))))))))))))))))))))))))))))))))))))))))))))))) ))))))))))))))))))))))))))))))))))))))))))))))))) ))))))))))))))))))))))))))))))))))))))))))))))))) )))))))))))))))))))))))))))))))))))))))))))))))))
7.17.17.17.17.17.17.17.17.1 6.86.86.86.86.86.86.86.86.8 6.86.86.86.86.86.86.86.86.8 6.86.86.86.86.86.86.86.86.8 6.86.86.86.86.86.86.86.86.8
6.86.86.86.86.86.86.86.86.8 6.86.86.86.86.86.86.86.86.8 6.86.86.86.86.86.86.86.86.8 6.86.86.86.86.86.86.86.86.8 6.76.76.76.76.76.76.76.76.7
6.86.86.86.86.86.86.86.86.8 6.86.86.86.86.86.86.86.86.8 6.76.76.76.76.76.76.76.76.7 6.76.76.76.76.76.76.76.76.7 6.76.76.76.76.76.76.76.76.7
6.96.96.96.96.96.96.96.96.9 6.76.76.76.76.76.76.76.76.7 6.76.76.76.76.76.76.76.76.7 6.76.76.76.76.76.76.76.76.7 6.76.76.76.76.76.76.76.76.7
6.46.46.46.46.46.46.46.46.4 6.46.46.46.46.46.46.46.46.4 6.76.76.76.76.76.76.76.76.7 6.76.76.76.76.76.76.76.76.7 6.76.76.76.76.76.76.76.76.7
(7)(7)(7)(7)(7)(7)(7)(7)(7) (2)(2)(2)(2)(2)(2)(2)(2)(2) (2)(2)(2)(2)(2)(2)(2)(2)(2) (2)(2)(2)(2)(2)(2)(2)(2)(2) (2)(2)(2)(2)(2)(2)(2)(2)(2)
(2)(2)(2)(2)(2)(2)(2)(2)(2) (2)(2)(2)(2)(2)(2)(2)(2)(2) (2)(2)(2)(2)(2)(2)(2)(2)(2) (2)(2)(2)(2)(2)(2)(2)(2)(2) (2)(2)(2)(2)(2)(2)(2)(2)(2)
(2)(2)(2)(2)(2)(2)(2)(2)(2) (2)(2)(2)(2)(2)(2)(2)(2)(2) (7)(7)(7)(7)(7)(7)(7)(7)(7) (2)(2)(2)(2)(2)(2)(2)(2)(2) (2)(2)(2)(2)(2)(2)(2)(2)(2)
(2)(2)(2)(2)(2)(2)(2)(2)(2) (2)(2)(2)(2)(2)(2)(2)(2)(2) (2)(2)(2)(2)(2)(2)(2)(2)(2) (2)(2)(2)(2)(2)(2)(2)(2)(2) (2)(2)(2)(2)(2)(2)(2)(2)(2)
(7)(7)(7)(7)(7)(7)(7)(7)(7) (7)(7)(7)(7)(7)(7)(7)(7)(7) (2)(2)(2)(2)(2)(2)(2)(2)(2) (2)(2)(2)(2)(2)(2)(2)(2)(2) (2)(2)(2)(2)(2)(2)(2)(2)(2)
SOUTH GATE 7.5 MINUTE QUADRANGLE AND PORTIONS OFADJACENT QUADRANGLES
10% EXCEEDANCE IN 50 YEARS PEAK GROUND ACCELERATION
1998PREDOMINANT EARTHQUAKE Magnitude (Mw) (Distance (km))
Department of ConservationDivision of Mines and Geology
0 2.5
Kilometers
5
Figure 3.4
Base map modified from MapInfo StreetWorks ©1998 MapInfo Corporation
SEISMIC HAZARD EVALUATION OF THE SOUTH GATE QUADRANGLE1998 25

(((((((((((((((((( ((((((((( ((((((((( (((((((((
((((((((( ((((((((( ((((((((( ((((((((( (((((((((
((((((((( ((((((((( ((((((((( ((((((((( (((((((((
(((((((((((((((((( ((((((((( ((((((((( (((((((((
((((((((( ((((((((( ((((((((( ((((((((( (((((((((
0.380.380.380.380.380.380.380.380.38 0.380.380.380.380.380.380.380.380.38 0.360.360.360.360.360.360.360.360.36 0.330.330.330.330.330.330.330.330.33 0.310.310.310.310.310.310.310.310.31
0.350.350.350.350.350.350.350.350.35 0.350.350.350.350.350.350.350.350.35 0.330.330.330.330.330.330.330.330.33 0.310.310.310.310.310.310.310.310.31 0.310.310.310.310.310.310.310.310.31
0.330.330.330.330.330.330.330.330.33 0.320.320.320.320.320.320.320.320.32 0.310.310.310.310.310.310.310.310.31 0.310.310.310.310.310.310.310.310.31 0.320.320.320.320.320.320.320.320.32
0.320.320.320.320.320.320.320.320.32 0.320.320.320.320.320.320.320.320.32 0.320.320.320.320.320.320.320.320.32 0.320.320.320.320.320.320.320.320.32 0.330.330.330.330.330.330.330.330.33
0.330.330.330.330.330.330.330.330.33 0.330.330.330.330.330.330.330.330.33 0.340.340.340.340.340.340.340.340.34 0.340.340.340.340.340.340.340.340.34 0.350.350.350.350.350.350.350.350.35
SOUTH GATE 7.5-MINUTE QUADRANGLE AND PORTIONS OFADJACENT QUADRANGLES
10% EXCEEDANCE IN 50 YEARS MAGNITUDE-WEIGHTED PSEUDO-PEAK ACCELERATION (g) FOR ALLUVIUM
1998LIQUEFACTION OPPORTUNITY
Department of ConservationCalifornia Geological Survey
Figure 3.5
0 1.5
Miles
3
Base map from GDT
SEISMIC HAZARD EVALUATION OF THE SOUTH GATE QUADRANGLE 262005
2001 SEISMIC HAZARD ZONE REPORT FOR THE SOUTH GATE QUADRANGLE 27
USE AND LIMITATIONS
The statewide map of seismic hazard has been developed using regional information and is not appropriate for site specific structural design applications. Use of the ground motion maps prepared at larger scale is limited to estimating earthquake loading conditions for preliminary assessment of ground failure at a specific location. We recommend consideration of site-specific analyses before deciding on the sole use of these maps for several reasons.
1. The seismogenic sources used to generate the peak ground accelerations were digitized from the 1:750,000-scale fault activity map of Jennings (1994). Uncertainties in fault location are estimated to be about 1 to 2 kilometers (Petersen and others, 1996). Therefore, differences in the location of calculated hazard values may also differ by a similar amount. At a specific location, however, the log-linear attenuation of ground motion with distance renders hazard estimates less sensitive to uncertainties in source location.
2. The hazard was calculated on a grid at sites separated by about 5 km (0.05 degrees). Therefore, the calculated hazard may be located a couple kilometers away from the site. We have provided shaded contours on the maps to indicate regional trends of the hazard model. However, the contours only show regional trends that may not be apparent from points on a single map. Differences of up to 2 km have been observed between contours and individual ground acceleration values. We recommend that the user interpolate PGA between the grid point values rather than simply using the shaded contours.
3. Uncertainties in the hazard values have been estimated to be about +/- 50% of the ground motion value at two standard deviations (Cramer and others, 1996).
4. Not all active faults in California are included in this model. For example, faults that do not have documented slip rates are not included in the source model. Scientific research may identify active faults that have not been previously recognized. Therefore, future versions of the hazard model may include other faults and omit faults that are currently considered.
5. A map of the predominant earthquake magnitude and distance is provided from the deaggregation of the probabilistic seismic hazard model. However, it is important to recognize that a site may have more than one earthquake that contributes significantly to the hazard. Therefore, in some cases earthquakes other than the predominant earthquake should also be considered.
Because of its simplicity, it is likely that the SPPV method (DOC, 1997) will be widely used to estimate earthquake shaking loading conditions for the evaluation of ground failure hazards. It should be kept in mind that ground motions at a given distance from an earthquake will vary depending on site-specific characteristics such as geology, soil properties, and topography, which may not have been adequately accounted for in the regional hazard analysis. Although this variance is represented to some degree by the
DIVISION OF MINES AND GEOLOGY SHZR 034 28
recorded ground motions that form the basis of the hazard model used to produce Figures 3.1, 3.2, and 3.3, extreme deviations can occur. More sophisticated methods that take into account other factors that may be present at the site (site amplification, basin effects, near source effects, etc.) should be employed as warranted. The decision to use the SPPV method with ground motions derived from Figures 3.1, 3.2, or 3.3 should be based on careful consideration of the above limitations, the geotechnical and seismological aspects of the project setting, and the “importance” or sensitivity of the proposed building with regard to occupant safety.
REFERENCES
Boore, D.M., Joyner, W.B. and Fumal, T.E., 1997, Empirical near-source attenuation relationships for horizontal and vertical components of peak ground acceleration, peak ground velocity, and pseudo-absolute acceleration response spectra: Seismological Research Letters, v. 68, p. 154-179.
California Department of Conservation, Division of Mines and Geology, 1997, Guidelines for evaluating and mitigating seismic hazards in California: Special Publication 117, 74 p.
Campbell, K.W., 1997, Attenuation relationships for shallow crustal earthquakes based on California strong motion data: Seismological Research Letters, v. 68, p. 180-189.
Cramer, C.H. and Petersen, M.D., 1996, Predominant seismic source distance and magnitude maps for Los Angeles, Orange and Ventura counties, California: Bulletin of the Seismological Society of America, v. 85, no. 5, p. 1645-1649.
Cramer, C.H., Petersen, M.D. and Reichle, M.S., 1996, A Monte Carlo approach in estimating uncertainty for a seismic hazard assessment of Los Angeles, Ventura, and Orange counties, California: Bulletin of the Seismological Society of America, v. 86, p. 1681-1691.
International Conference of Building Officials (ICBO), 1997, Uniform Building Code: v. 2, Structural engineering and installation standards, 492 p.
Jennings, C.W., compiler, 1994, Fault activity map of California and adjacent areas: California Department of Conservation, Division of Mines and Geology, California Geologic Data Map Series, map no. 8.
Petersen, M.D., Bryant, W.A., Cramer, C.H., Cao, T., Reichle, M.S., Frankel, A.D., Lienkaemper, J.J., McCrory, P.A. and Schwartz, D.P., 1996, Probabilistic seismic hazard assessment for the State of California: California Department of Conservation, Division of Mines and Geology Open-File Report 96-08; also U.S. Geological Survey Open-File Report 96-706, 33 p.

2001 SEISMIC HAZARD ZONE REPORT FOR THE SOUTH GATE QUADRANGLE 29
Real, C.R., Petersen, M.D., McCrink, T.P. and Cramer, C.H., 2000, Seismic Hazard Deaggregation in zoning earthquake-induced ground failures in southern California: Proceedings of the Sixth International Conference on Seismic Zonation, November 12-15, Palm Springs, California, EERI, Oakland, CA.
Sadigh, K., Chang, C.-Y., Egan, J.A., Makdisi, F. and Youngs, R.R., 1997, SEA96- A new predictive relation for earthquake ground motions in extensional tectonic regimes: Seismological Research Letters, v. 68, p. 190-198.
Wilson, R.C. and Keefer, D.K., 1983, Dynamic analysis of a slope failure from the 1979 Coyote Lake, California, Earthquake: Bulletin of the Seismological Society of America, v. 73, p. 863-877.
Youd, T.L. and Idriss I.M., 1997, Proceedings of the NCEER workshop on evaluation of liquefaction resistance of soils: Technical Report NCEER-97-0022, 40 p.
Youngs, R.R., Chiou, S.-J., Silva, W.J. and Humphrey, J.R., 1997, Stochastic point-source modeling of ground motions in the Cascadia Region: Seismological Research Letters, v. 68, p. 74-85.