simi valley east and simi valley west shzr...
TRANSCRIPT

SEISMIC HAZARD ZONE REPORT 002
SEISMIC HAZARD ZONE REPORT FOR THE SIMI VALLEY EAST AND SIMI VALLEY WEST
7.5-MINUTE QUADRANGLES, VENTURA AND LOS ANGELES COUNTIES,
CALIFORNIA
1997
DEPARTMENT OF CONSERVATION Division of Mines and Geology
STATE OF CALIFORNIA
GRAY DAVIS GOVERNOR
THE RESOURCES AGENCY MARY D. NICHOLS
SECRETARY FOR RESOURCES
DEPARTMENT OF CONSERVATION DARRYL YOUNG
DIRECTOR

DIVISION OF MINES AND GEOLOGY
JAMES F. DAVIS, STATE GEOLOGIST
Copyright © 2001 by the California Department of Conservation. All rights reserved. No part of this publication may be reproduced without written consent of the Department of Conservation.
“The Department of Conservation makes no warrantees as to the suitability of this product for any particular purpose.”
SEISMIC HAZARD ZONE REPORT 002
SEISMIC HAZARD ZONE REPORT FOR THE SIMI VALLEY EAST AND SIMI VALLEY WEST
7.5-MINUTE QUADRANGLES, VENTURA AND LOS ANGELES COUNTIES,
CALIFORNIA
CALIFORNIA GEOLOGICAL SURVEY'S PUBLICATION SALES OFFICES:
Southern California Regional Office 888 South Figueroa Street, Suite 475 Los Angeles, CA 90017 (213) 239-0878
Publications and Information Office 801 K Street, MS 14-31 Sacramento, CA 95814-3531 (916) 445-5716
Bay Area Regional Office 345 Middlefield Road, MS 520 Menlo Park, CA 94025 (650) 688-6327
List of Revisions – Simi Valley East and Simi Valley West SHZR 002
2001 Text updated
8/31/05 BPS address corrected and web links updated
1/17/06 Bay Area Regional Office and Southern California Regional Office addresses updated


CONTENTS
EXECUTIVE SUMMARY ......................................................................................................... viii
INTRODUCTION ...........................................................................................................................1
SECTION 1 LIQUEFACTION EVALUATION REPORT Liquefaction Zones in the Simi Valley East and Simi Valley West 7.5-Minute Quadrangles, Ventura and Los Angeles Counties, California ....................................................................................................3
PURPOSE....................................................................................................................................3
BACKGROUND .....................................................................................................................4
METHODS SUMMARY.........................................................................................................4
SCOPE AND LIMITATIONS.................................................................................................5
PART I .........................................................................................................................................5
PHYSIOGRAPHY...................................................................................................................5
GEOLOGY ..............................................................................................................................6
ENGINEERING GEOLOGY ..................................................................................................8
GROUND-WATER CONDITIONS .......................................................................................9
PART II......................................................................................................................................10
LIQUEFACTION POTENTIAL ...........................................................................................10
LIQUEFACTION SUSCEPTIBILITY..................................................................................10
LIQUEFACTION OPPORTUNITY .....................................................................................11
LIQUEFACTION ZONES ....................................................................................................13
ACKNOWLEDGMENTS .........................................................................................................14
REFERENCES ..........................................................................................................................15
iii

SECTION 2 EARTHQUAKE-INDUCED LANDSLIDE EVALUATION REPORT Earthquake-Induced Landslide Zones in the Simi Valley East and Simi Valley West 7.5-Minute Quadrangles, Ventura and Los Angeles Counties, California.......19
PURPOSE..................................................................................................................................19
BACKGROUND ...................................................................................................................20
METHODS SUMMARY.......................................................................................................20
SCOPE AND LIMITATIONS...............................................................................................21
PART I .......................................................................................................................................22
PHYSIOGRAPHY.................................................................................................................22
GEOLOGY ............................................................................................................................23
ENGINEERING GEOLOGY ................................................................................................25
PART II......................................................................................................................................29
EARTHQUAKE-INDUCED LANDSLIDE HAZARD POTENTIAL.................................29
EARTHQUAKE-INDUCED LANDSLIDE HAZARD ZONE ............................................33
ACKNOWLEDGMENTS .........................................................................................................35
REFERENCES ..........................................................................................................................35
AIR PHOTOS ............................................................................................................................38
APPENDIX A Source of Rock Strength Data...........................................................................38
SECTION 3 GROUND SHAKING EVALUATION REPORT Potential Ground Shaking in the Simi Valley East and Simi Valley West 7.5-Minute Quadrangles, Ventura and Los Angeles Counties, California ..................................................................................................39
PURPOSE..................................................................................................................................39
EARTHQUAKE HAZARD MODEL .......................................................................................40
APPLICATIONS FOR LIQUEFACTION AND LANDSLIDE HAZARD ASSESSMENTS 47
USE AND LIMITATIONS........................................................................................................47
REFERENCES ..........................................................................................................................51
iv
ILLUSTRATIONS
Figure 2.1. Yield Acceleration vs. Newmark Displacement for the Pacoima-Kagel Canyon Strong-Motion Record From the 17 January 1994 Northridge,.............................................31
Figure 3.1a. Simi Valley East 7.5-Minute Quadrangle and portions of adjacent quadrangles, 10% exceedance in 50 years peak ground acceleration (g)—Firm rock conditions. ............41
Figure 3.1b. Simi Valley West 7.5-Minute Quadrangle and portions of adjacent quadrangles, 10% exceedance in 50 years peak ground acceleration (g)—Firm rock conditions..............42
Figure 3.2a. Simi Valley East 7.5-Minute Quadrangle and portions of adjacent quadrangles, 10% exceedance in 50 years peak ground acceleration (g)—Soft rock conditions. ..............43
Figure 3.2b. Simi Valley West 7.5-Minute Quadrangle and portions of adjacent quadrangles, 10% exceedance in 50 years peak ground acceleration (g)—Soft rock conditions...............44
Figure 3.3a. Simi Valley East 7.5-Minute Quadrangle and portions of adjacent quadrangles, 10% exceedance in 50 years peak ground acceleration (g)—Alluvium conditions.......................45
Figure 3.3b. Simi Valley West 7.5-Minute Quadrangle and portions of adjacent quadrangles, 10% exceedance in 50 years peak ground acceleration (g)—Alluvium conditions. .............46
Figure 3.4a. Simi Valley East 7.5-Minute Quadrangle and portions of adjacent quadrangles, 10% exceedance in 50 years peak ground acceleration—Predominant earthquake. .....................48
Figure 3.4b. Simi Valley West 7.5-Minute Quadrangle and portions of adjacent quadrangles, 10% exceedance in 50 years peak ground acceleration—Predominant earthquake. .............49
Figure 3.5a. Simi Valley East 7.5-Minute Quadrangle and portions of adjacent quadrangles, 10% exceedance in 50 years peak ground acceleration -- Liquefaction opportunity… ….50
Figure 3.5b. Simi Valley West 7.5-Minute Quadrangle and portions of adjacent quadrangles, 10% exceedance in 50 years peak ground acceleration -- Liquefaction opportunity…… .51
Table 1.1. Summary of Geotechnical Characteristics for Quaternary Sedimentary Units in the Simi Valley East and Simi Valley West Quadrangles. ............................................................7
Table 2.1. Summary of the Shear Strength Statistics for the Simi Valley East and Simi Valley West Quadrangles. .................................................................................................................26
v

Table 2.2. Summary of the Shear Strength Groups for the Simi Valley East and Simi Valley West Quadrangles. .................................................................................................................27
Table 2.3. Hazard Potential Matrix for Earthquake-Induced Landslides in the Simi Valley East and Simi Valley West Quadrangles. .....................................................................................33
Plate 1.1. Quaternary Geology of the Simi Valley East 7.5-Minute Quadrangle, California. ......54
Plate 1.1. Quaternary Geology of the Simi Valley West 7.5-Minute Quadrangle, California. ....55
Plate 1.2. Depths to historically high ground water and locations of boreholes used in this study, Simi Valley East 7.5-Minute Quadrangle, California. ..........................................................56
Plate 1.2. Depths to historically high ground water and locations of boreholes used in this study, Simi Valley West 7.5-Minute Quadrangle, California. ........................................................57
Plate 2.1. Landslide inventory, Shear Test Sample Locations, Simi Valley East 7.5-Minute Quadrangle. ...........................................................................................................................58
Plate 2.2 Landslide inventory, Shear Test Sample Locations, Simi Valley West 7.5-Minute Quadrangle. ...........................................................................................................................59
vi

EXECUTIVE SUMMARY
This report summarizes the methods and sources of information used to prepare the Seismic Hazard Zone Maps for the Simi Valley East and Simi Valley West 7.5-minute quadrangles, Ventura and Los Angeles Counties, California. The maps displays the boundaries of Zones of Required Investigation for liquefaction and earthquake-induced landslides over an area of approximately 120 square miles at a scale of 1 inch = 2,000 feet.
The Simi Valley East and Simi Valley West quadrangles encompass Simi Valley, parts of Little Simi and Tierra Rejada valleys, as well as part of the Santa Susana Mountains. The center of the area lies 30 miles east of Ventura and 32 miles northwest of Los Angeles. The City of Simi Valley occupies the 22-square mile Simi Valley. Part of the City of Moorpark lies within Little Simi Valley at the western edge of the project area. Elevations range from about 500 feet in Little Simi Valley to the 3400-foot peaks in the northeast corner of the project area. Access to the area is via State Highway 118 and State Highway 23. Big Mountain, Oak Ridge and the Santa Susana Mountains dominate the terrain in the north. The southern margin of Simi Valley is characterized by rounded hills of volcanic rock with steep-sided canyons to the west and the rugged slopes of the Simi Hills to the southeast. Residential and commercial development is generally concentrated in the southern part of the map area, within the nearly level lowlands.
The maps are prepared by employing geographic information system (GIS) technology, which allows the manipulation of three-dimensional data. Information considered includes topography, surface and subsurface geology, borehole data, historical ground-water levels, existing landslide features, slope gradient, rock-strength measurements, geologic structure, and probabilistic earthquake shaking estimates. The shaking inputs are based upon probabilistic seismic hazard maps that depict peak ground acceleration, mode magnitude, and mode distance with a 10% probability of exceedance in 50 years.
To evaluate liquefaction hazards, a geologic map of late Quaternary alluvial deposits was prepared that depicts 16 Quaternary units, mapped on the basis of geomorphology, environment of deposition, and relative age. Many of the flatland regions within the study area, namely Little Simi Valley and the southeastern, western, and southern parts of Simi Valley have a history of shallow ground water. Liquefaction zones closely coincide with these shallow ground-water areas. A large part of central Simi Valley and Tierra Rejada Valley are not in a liquefaction zone because of deeper ground-water levels.
Landslides are abundant and widespread in the mountainous terrain of the quadrangles, especially along the northern boundary along Oak Ridge. More than 600 landslides were mapped in the two quadrangles. Nearly 23% of the land in the Simi Valley West Quadrangle and 38%t of the Simi Valley East Quadrangle lie within the landslide hazard zone.
vii

How to view or obtain the map
Seismic Hazard Zone Maps, Seismic Hazard Zone Reports and additional information on seismic hazard zone mapping in California are available on the Division of Mines and Geology's Internet page: http://www.conservation.ca.gov/CGS/index.htm
Paper copies of Official Seismic Hazard Zone Maps, released by DMG, which depict zones of required investigation for liquefaction and/or earthquake-induced landslides, are available for purchase from:
BPS Reprographic Services 945 Bryant Street San Francisco, California 94105 (415) 512-6550
Seismic Hazard Zone Reports (SHZR) summarize the development of the hazard zone map for each area and contain background documentation for use by site investigators and local government reviewers. These reports are available for reference at DMG offices in Sacramento, San Francisco, and Los Angeles. NOTE: The reports are not available through BPS Reprographic Services.

INTRODUCTION
The Seismic Hazards Mapping Act (the Act) of 1990 (Public Resources Code, Chapter 7.8, Division 2) directs the California Department of Conservation (DOC), Division of Mines and Geology (DMG) to delineate seismic hazard zones. The purpose of the Act is to reduce the threat to public health and safety and to minimize the loss of life and property by identifying and mitigating seismic hazards. Cities, counties, and state agencies are directed to use the seismic hazard zone maps in their land-use planning and permitting processes. They must withhold development permits for a site within a zone until the geologic and soil conditions of the project site are investigated and appropriate mitigation measures, if any, are incorporated into development plans. The Act also requires sellers (and their agents) of real property within a mapped hazard zone to disclose at the time of sale that the property lies within such a zone. Evaluation and mitigation of seismic hazards are to be conducted under guidelines established by the California State Mining and Geology Board (DOC, 1997; also available on the Internet at http://gmw.consrv.ca.gov/shmp/webdocs/sp117.pdf).
The Act also directs SMGB to appoint and consult with the Seismic Hazards Mapping Act Advisory Committee (SHMAAC) in developing criteria for the preparation of the seismic hazard zone maps. SHMAAC consists of geologists, seismologists, civil and structural engineers, representatives of city and county governments, the state insurance commissioner and the insurance industry. In 1991 SMGB adopted initial criteria for delineating seismic hazard zones to promote uniform and effective statewide implementation of the Act. These initial criteria provide detailed standards for mapping regional liquefaction hazards. They also directed DMG to develop a set of probabilistic seismic maps for California and to research methods that might be appropriate for mapping earthquake-induced landslide hazards.
In 1996, working groups established by SHMAAC reviewed the prototype maps and the techniques used to create them. The reviews resulted in recommendations that 1) the process for zoning liquefaction hazards remain unchanged and 2) earthquake-induced landslide zones be delineated using a modified Newmark analysis.
This Seismic Hazard Zone Report summarizes the development of the hazard zone map. The process of zoning for liquefaction uses a combination of Quaternary geologic mapping, historical ground-water information, and subsurface geotechnical data. The process for zoning earthquake-induced landslides incorporates earthquake loading, existing landslide features, slope gradient, rock strength, and geologic structure. Probabilistic seismic hazard maps, which are the underpinning for delineating seismic hazard zones, have been prepared for peak ground acceleration, mode magnitude, and mode distance with a 10% probability of exceedance in 50 years (Petersen and others, 1996) in accordance with the mapping criteria.
1

This report summarizes seismic hazard zone mapping for potentially liquefiable soils and earthquake-induced landslides in the Simi Valley East and Simi Valley West 7.5-minute quadrangles.

SECTION 1 LIQUEFACTION EVALUATION REPORT
Liquefaction Zones in the Simi Valley East and Simi Valley West
7.5-Minute Quadrangles, Ventura and Los Angeles Counties, California
By Wayne D. Haydon and Ralph C. Loyd
California Department of Conservation
Division of Mines and Geology
PURPOSE
The Seismic Hazards Mapping Act (the Act) of 1990 (Public Resources Code, Chapter 7.8, Division 2) directs the California Department of Conservation (DOC), Division of Mines and Geology (DMG) to delineate Seismic Hazard Zones. The purpose of the Act is to reduce the threat to public health and safety and to minimize the loss of life and property by identifying and mitigating seismic hazards. Cities, counties, and state agencies are directed to use seismic hazard zone maps developed by DMG in their land-use planning and permitting processes. The Act requires that site-specific geotechnical investigations be performed prior to permitting most urban development projects within seismic hazard zones. Evaluation and mitigation of seismic hazards are to be conducted under guidelines adopted by the California State Mining and Geology Board (DOC, 1997; also available on the Internet at http://gmw.consrv.ca.gov/shmp/webdocs/sp117.pdf).
This section of the evaluation report summarizes seismic hazard zone mapping for potentially liquefiable soils in the Simi Valley East and Simi Valley West 7.5-minute quadrangles. This section, along with Section 2 (addressing earthquake-induced landslides), and Section 3 (addressing potential ground shaking), form a report that is one of a series that summarizes production of similar seismic hazard zone maps within the
3

DIVISION OF MINES AND GEOLOGY SHZR 002 4
state (Smith, 1996). Additional information on seismic hazards zone mapping in California is on DMG’s Internet web page: http://www.conservation.ca.gov/CGS/index.htm
BACKGROUND
Liquefaction-induced ground failure historically has been a major cause of earthquake damage in southern California. During the 1971 San Fernando and 1994 Northridge earthquakes, significant damage to roads, utility pipelines, buildings, and other structures in the Los Angeles area was caused by liquefaction-induced ground displacement.
Localities most susceptible to liquefaction-induced damage are underlain by loose, water-saturated, granular sediment within 40 feet of the ground surface. These geological and ground-water conditions exist in parts of southern California, most notably in some densely populated valley regions and alluviated floodplains. In addition, the potential for strong earthquake ground shaking is high because of the many nearby active faults. The combination of these factors constitutes a significant seismic hazard in the southern California region in general, including areas in the Simi Valley East and Simi Valley West quadrangles.
METHODS SUMMARY
Characterization of liquefaction hazard presented in this report requires preparation of maps that delineate areas underlain by potentially liquefiable sediment. The following were collected or generated for this evaluation:
• Existing geologic maps were used to provide an accurate representation of the spatial distribution of Quaternary deposits in the study area. Geologic units that generally are susceptible to liquefaction include late Quaternary alluvial and fluvial sedimentary deposits and artificial fill
• Construction of shallow ground-water maps showing the historically highest known ground-water levels
• Quantitative analysis of geotechnical data to evaluate liquefaction potential of deposits
• Information on potential ground shaking intensity based on DMG probabilistic shaking maps
The data collected for this evaluation were processed into a series of geographic information system (GIS) layers using commercially available software. The liquefaction zone map was derived from a synthesis of these data and according to criteria adopted by the State Mining and Geology Board (DOC, 2000).
2001 SEISMIC HAZARD ZONE REPORT FOR THE SIMI VALLEY QUADRANGLES 5
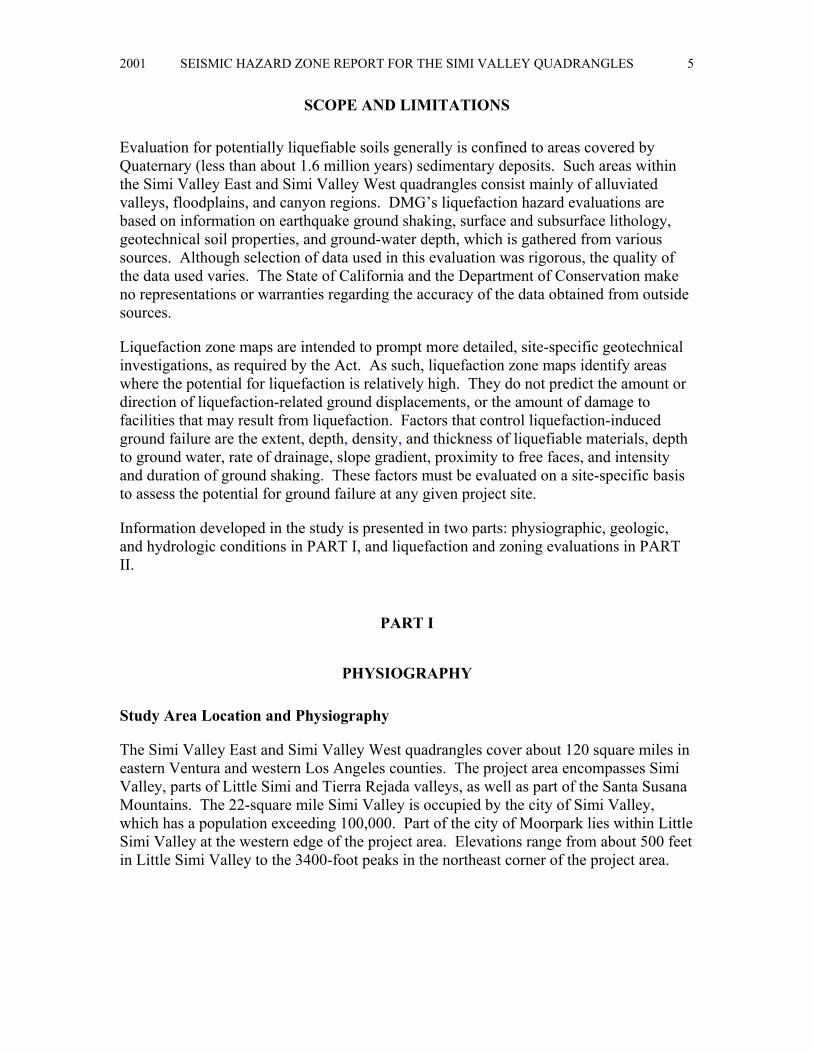
SCOPE AND LIMITATIONS
Evaluation for potentially liquefiable soils generally is confined to areas covered by Quaternary (less than about 1.6 million years) sedimentary deposits. Such areas within the Simi Valley East and Simi Valley West quadrangles consist mainly of alluviated valleys, floodplains, and canyon regions. DMG’s liquefaction hazard evaluations are based on information on earthquake ground shaking, surface and subsurface lithology, geotechnical soil properties, and ground-water depth, which is gathered from various sources. Although selection of data used in this evaluation was rigorous, the quality of the data used varies. The State of California and the Department of Conservation make no representations or warranties regarding the accuracy of the data obtained from outside sources.
Liquefaction zone maps are intended to prompt more detailed, site-specific geotechnical investigations, as required by the Act. As such, liquefaction zone maps identify areas where the potential for liquefaction is relatively high. They do not predict the amount or direction of liquefaction-related ground displacements, or the amount of damage to facilities that may result from liquefaction. Factors that control liquefaction-induced ground failure are the extent, depth, density, and thickness of liquefiable materials, depth to ground water, rate of drainage, slope gradient, proximity to free faces, and intensity and duration of ground shaking. These factors must be evaluated on a site-specific basis to assess the potential for ground failure at any given project site.
Information developed in the study is presented in two parts: physiographic, geologic, and hydrologic conditions in PART I, and liquefaction and zoning evaluations in PART II.
PART I
PHYSIOGRAPHY
Study Area Location and Physiography
The Simi Valley East and Simi Valley West quadrangles cover about 120 square miles in eastern Ventura and western Los Angeles counties. The project area encompasses Simi Valley, parts of Little Simi and Tierra Rejada valleys, as well as part of the Santa Susana Mountains. The 22-square mile Simi Valley is occupied by the city of Simi Valley, which has a population exceeding 100,000. Part of the city of Moorpark lies within Little Simi Valley at the western edge of the project area. Elevations range from about 500 feet in Little Simi Valley to the 3400-foot peaks in the northeast corner of the project area.
DIVISION OF MINES AND GEOLOGY SHZR 002 6
GEOLOGY
Bedrock and Surficial Geology
The study area is in the Ventura Basin of the Transverse Ranges geomorphic province of southern California. West-trending valleys and ridges, reflecting a parallel series of anticlines, synclines, and reverse faults characterize this province. The structural and geomorphic grain is generally considered to be the result of south-directed compression caused by right lateral, strike-slip movement on the "Big Bend" segment of the San Andreas Fault.
Bedrock geologic mapping covering the project area at a scale of 1:24,000 has been published by Yerkes and Campbell (1995a; 1995b) and Dibblee (1992a; 1992b). Late Cretaceous to late Tertiary marine sedimentary units, along with minor late Cenozoic nonmarine fluviatile sedimentary deposits, are exposed over most of the upland terrain. In addition, middle Miocene submarine to subaerial extrusive volcanic rocks are exposed in the southwest corner of the project area. Quaternary alluvial sediments partially fill valley and canyon bottoms throughout the area.
Geologic units that generally are susceptible to liquefaction include late Quaternary alluvial and fluvial sedimentary deposits and artificial fill. Geologic mapping of late Quaternary alluvial deposits was conducted to evaluate the areal distribution and character of young, unconsolidated sediments exposed in the study area, namely in Simi Valley, Little Simi Valley, Tierra Rejada Valley, and upland alluviated canyons. The mapping was completed largely through interpretation of aerial photographs from pre-urbanization years (1928, 1939, and 1953), evaluation of geomorphology, examination of soil survey maps (Edwards and others, 1970), and field reconnaissance. A geologic map was developed for this study by staff of DMG and William Lettis and Associates (Haydon and others, unpublished).
Sixteen Quaternary units were mapped in the study area based on geomorphology, environment of deposition, and age (Table 1.1). The mapped units fall into four basic age groups: (1) Pleistocene (Qo), comprised of alluvium, fan, and terrace deposits, as well as pediment surfaces; (2) Holocene (Qy1), composed of fan, alluvium, and terrace deposits; (3) late Holocene (Qy2), which includes fan, alluvium, and terrace deposits; and (4) historically active (Q), consisting of wash, fan, alluvium and colluvium deposits. In addition, several areas are covered by artificial fill.

2001 SEISMIC HAZARD ZONE REPORT FOR THE SIMI VALLEY QUADRANGLES 7
GEOLOGIC DATA DRY UNIT WEIGHT STANDARD PENETRATION(PCF) RESISTANCE
(blows/foot)Geologic Low Most High Low Most High
Unit Texture Range Common Range Range Common RangeRange Range
Qw finecoarse 91-105 106-115 0-4 5-20
Qa fine 91-100 96-110 116->120coarse 86-90 91-100
Qf fine 80-90 91-105,106-115 0-4 5-15 16-23coarse 80-90 91-110 0-4 5-10 11-20
Qc fine 110-120coarse 85-115
Qya2 fine 80-90,96-105 111-115 5-15 16->30coarse 80-90 91->120 0-10 11-30 31->50
Qyf2 fine 80-100 101->120 0-4 5-15 16->30coarse 80-90 91-105 106->120 0-4 5-20 21-50
Qyt2 finecoarse 86-90 91-100 101-110 0-4 5-10,21-30 31-40
Qya1 fine 80-85 91-95 96-105 0-4 5-15 16-30coarse 80-90 91-100 101-105 0-4 5-20 21-30
Qyf1 fine 86-95 96-105 106-115 5-8 9-23 24->30coarse 80-95 96-110 111->120 0-4 5-30 31-50
Qyt1 finecoarse 106-110 111->120 5-10 11-30 31-40
Qof fine 86-100 101->120 5-15 16->30coarse 91-105 106->120 11-20 21->50
Qoa fine 86-105 106->120 5-15 16->30coarse 96-105 106->120 5-30 31 ->50
Table 1.1. Summary of Geotechnical Characteristics for Quaternary Geologic Units in the Simi Valley East and Simi Valley West Quadrangles.
Pleistocene deposits
The Pleistocene units, which are exposed along valley margins and within eastern Simi Valley lack evidence of active sedimentation, are moderately to deeply incised, exhibit varying degrees of B horizon soil formation, and are largely concealed by Holocene sedimentary units. Pleistocene deposits typically are composed of moderately to highly consolidated sandy sediments, which range from cobble-rich gravel to clayey deposits of varying compactness.
Holocene deposits
Holocene deposits generally lack active sedimentation features, lack B horizon soil formation, are characterized by moderate incision, and are partially concealed by younger depositional units. Overall, these deposits also are typically sandy, but layers range from coarse gravel to clay deposits depending on the type of source rock exposed in drainage areas and mode of deposition.

DIVISION OF MINES AND GEOLOGY SHZR 002 8
Late Holocene deposits
Late Holocene deposits generally lack active sedimentation features, lack B-horizon soil formation, are characterized by slight incision, overlie the older Holocene deposits (Qy1), and are locally overlain by historically active units. Overall, these deposits also are typically sandy, but layers range from coarse gravel to clay deposits depending on the type of source rock exposed in drainage areas and mode of deposition.
Historically active deposit
Historical deposits, which are exposed mainly around valley margins and in upland alluviated canyons, are characterized by active sedimentation features, lack incision, and overlie all other units. Although the historically active deposits typically are composed of fine sand and silt in many parts of the study area, the relative abundance of coarse- to fine-grained sediments exposed at any locality varies depending on drainage-area source rock and depositional environment.
Artificial fill
Artificial fill used in construction of Highway 118 is highly engineered and not susceptible to liquefaction. Artificial fill also was used to fill in low ground along the channelized Arroyo Simi. Much of it appears to be non-engineered or uncontrolled fill.
ENGINEERING GEOLOGY
Lithologic descriptions and soil-test results included in borehole logs were analyzed to determine the geotechnical properties of various Quaternary stratigraphic units. Geotechnical data within the project area were collected by staff of DMG and William Lettis and Associates for more than 300 project sites where one or more test holes were drilled (Plates 1.1 and 1.2). Overall, about 1000 borehole logs were collected from the files of the City of Simi Valley Public Works Department; the City of Moorpark Planning Department and Public Works Department; County of Ventura Public Works Agency; Environmental Health Division and General Services Agency; California Department of Water Resources; California Department of Transportation; and private consultants. The following findings are based on a detailed evaluation of borehole logs.
Standard Penetration Test (SPT) data provide a standardized measure of the penetration resistance of a geologic deposit and commonly are used as an index of density. Many geotechnical investigations record SPT data, including the number of blows by a 140-pound drop weight required to drive a sampler of specific dimensions one foot into the soil. Recorded blow counts for non-SPT geotechnical sampling, where the sampler diameter, hammer weight or drop distance differ from those specified for an SPT (ASTM D1586), were converted to SPT-equivalent blow count values and entered into the DMG GIS. The actual and converted SPT blow counts were normalized to a common reference effective overburden pressure of 1 atmosphere (approximately 1 ton per square foot) and a hammer efficiency of 60% using a method described by Seed and Idriss (1982) and Seed and others (1985). This normalized blow count is referred to as (N1)60.

2001 SEISMIC HAZARD ZONE REPORT FOR THE SIMI VALLEY QUADRANGLES 9
The Pleistocene deposits exposed in and around Simi and Little Simi Valley are present in the subsurface at depths ranging from less than a foot to over 50 feet. Contacts between overlying Holocene deposits and the Pleistocene deposits are identified in borehole logs by marked changes in color, texture, and compactness. Based on log descriptions, Pleistocene deposits are generally characterized as medium dense, to very dense, sandy and gravelly layers with lesser amounts of very stiff to hard fine-grained material. Typical standard penetration tests performed in Pleistocene sandy layers exceeded 40 blows per foot.
The Holocene and late Holocene deposits covering much of Simi and Little Simi valleys extend beneath the valley floor to depths exceeding 50 feet. For discussion purposes these units are combined because their lithologies and geotechnical properties cannot be differentiated, based on the information provided on borehole logs. Overall, these deposits consist mainly of sandy sediment layers. However, proportions of fine and coarse material vary across the study area. Sandy sediments dominate subsurface lithology in eastern Simi Valley and Little Simi Valley, whereas about equal amounts of fine- and coarse-grained layers are found in western Simi Valley. Tierra Rejada Valley sediments are mostly fine grained. Alluviated canyons typically contain an abundance of coarse to very coarse deposits. Coarse-grained Holocene and late Holocene deposits are generally loose to medium dense, whereas the fine-grained sedimentary layers are soft to stiff. Typical standard penetration tests performed in Holocene sandy layers range from 10 to 30 blows per foot.
Historically active deposits are generally thin surficial deposits that typically extend to less than 20 feet below the surface. River and stream channel deposits consist almost entirely of loose coarse-grained deposits whereas the fan, alluvial, and colluvial deposits consist of about equal amounts of soft fine-grained and loose coarse-grained layers. Standard penetration tests typically yield fewer than 15 blows per foot.
GROUND-WATER CONDITIONS
Liquefaction hazard may exist in areas where depth to ground water is 40 feet or less. DMG uses the highest known ground-water levels because water levels during an earthquake cannot be anticipated because of the unpredictable fluctuations caused by natural processes and human activities. A historical-high ground-water map differs from most ground-water maps, which show the actual water table at a particular time. Plates 1.1 and 1.2 depict a hypothetical ground-water table within alluviated areas.
Ground-water conditions were investigated in the Simi Valley East and Simi Valley West quadrangles to evaluate the depth to saturated materials. Saturated conditions reduce the effective normal stress, thereby increasing the likelihood of earthquake-induced liquefaction (Youd, 1973). Ground-water depth data were obtained from compiled geotechnical borehole, environmental-monitoring, and water-well logs. The depths to first-encountered water, free of piezometric influences, were plotted onto maps of the project area. The maps were developed using results of ground water hydrology modeling performed during this study and in earlier studies conducted by Evenson

DIVISION OF MINES AND GEOLOGY SHZR 002 10
(unpublished) and Leighton and Associates (1972; 1985). These maps were digitized and used for the liquefaction analysis.
Historically shallow ground-water conditions exist in much of the flatland regions within the study area (Plates 1.1 and 1.2), namely Little Simi Valley and the eastern, western, and southern parts of Simi Valley. Of particular note are existing near surface to surface saturated conditions in western Simi Valley where a bedrock barrier restricts westward outflow of ground water. Similar conditions exist in the adjacent eastern Simi Valley ground-water basin where historic water-table depths measure less than 10 feet. Little Simi Valley periodically experiences shallow water conditions because it is an alluviated, narrow stream valley that receives an abundance of water runoff from canyon drainages and Arroyo Simi during periods of high precipitation. Sediments deposited on canyon floors are presumed to become saturated during wet seasons.
PART II
LIQUEFACTION POTENTIAL
Liquefaction may occur in water-saturated sediment during moderate to great earthquakes. Liquefied sediment loses strength and may fail, causing damage to buildings, bridges, and other structures. Many methods for mapping liquefaction hazard have been proposed. Youd (1991) highlights the principal developments and notes some of the widely used criteria. Youd and Perkins (1978) demonstrate the use of geologic criteria as a qualitative characterization of liquefaction susceptibility and introduce the mapping technique of combining a liquefaction susceptibility map and a liquefaction opportunity map to produce a liquefaction potential map. Liquefaction susceptibility is a function of the capacity of sediment to resist liquefaction. Liquefaction opportunity is a function of the potential seismic ground shaking intensity.
The method applied in this study for evaluating liquefaction potential is similar to that of Tinsley and others (1985). Tinsley and others (1985) applied a combination of the techniques used by Seed and others (1983) and Youd and Perkins (1978) for their mapping of liquefaction hazards in the Los Angeles region. This method combines geotechnical analyses, geologic and hydrologic mapping, and probabilistic earthquake shaking estimates, but follows criteria adopted by the State Mining and Geology Board (DOC, 2000).
LIQUEFACTION SUSCEPTIBILITY
Liquefaction susceptibility reflects the relative resistance of a soil to loss of strength when subjected to ground shaking. Physical properties of soil such as sediment grain-size distribution, compaction, cementation, saturation, and depth govern the degree of resistance to liquefaction. Some of these properties can be correlated to a sediment’s geologic age and environment of deposition. With increasing age, relative density may

2001 SEISMIC HAZARD ZONE REPORT FOR THE SIMI VALLEY QUADRANGLES 11
increase through cementation of the particles or compaction caused by the weight of the overlying sediment. Grain-size characteristics of a soil also influence susceptibility to liquefaction. Sand is more susceptible than silt or gravel, although silt of low plasticity is treated as liquefiable in this investigation. Cohesive soils generally are not considered susceptible to liquefaction. Such soils may be vulnerable to strength loss with remolding and represent a hazard that is not addressed in this investigation. Soil characteristics and processes that result in higher measured penetration resistances generally indicate lower liquefaction susceptibility. Thus, blow count and cone penetrometer values are useful indicators of liquefaction susceptibility.
Saturation is required for liquefaction, and the liquefaction susceptibility of a soil varies with the depth to ground water. Very shallow ground water increases the susceptibility to liquefaction (soil is more likely to liquefy). Soils that lack resistance (susceptible soils) typically are saturated, loose and sandy. Soils resistant to liquefaction include all soil types that are dry, cohesive, or sufficiently dense. DMG’s map inventory of areas containing soils susceptible to liquefaction begins with evaluation of geologic maps and historical occurrences, cross-sections, geotechnical test data, geomorphology, and ground-water hydrology. Soil properties and soil conditions such as type, age, texture, color, and consistency, along with historical depths to ground water are used to identify, characterize, and correlate susceptible soils. Because Quaternary geologic mapping is based on similar soil observations, liquefaction susceptibility maps typically are similar to Quaternary geologic maps. DMG’s qualitative relations between susceptibility, geologic map unit and depth to ground water are summarized in Table 1.1.
Holocene deposits (Qy1, Qy2, and Q)
Greater than 90% of the boreholes drilled in areas underlain by Holocene sediments and marked by historic shallow ground-water depth (less than 40 feet) penetrated liquefiable layers. This reflects the widespread distribution of loose sandy material in the Quaternary subsurface and a high peak horizontal ground acceleration of 0.65 g. The map characterizes the liquefaction susceptibility of all such soils as high.
Pleistocene deposits (Qo)
None of the analyzed Pleistocene sedimentary layers liquefied under the given seismic parameters. The liquefaction susceptibility of these deposits is mapped as low.
LIQUEFACTION OPPORTUNITY
Liquefaction opportunity is a measure, expressed in probabilistic terms, of the potential for strong ground shaking. Analyses of in-situ liquefaction resistance require assessment of liquefaction opportunity. The minimum level of seismic excitation to be used for such purposes is the level of peak ground acceleration (PGA) with a 10% probability of exceedance over a 50-year period (DOC, 2000). The earthquake magnitude used in DMG’s analysis is the magnitude that contributes most to the calculated PGA for an area.

DIVISION OF MINES AND GEOLOGY SHZR 002 12
For the Simi Valley area, a peak acceleration of 0.65g resulting from an earthquake of magnitude 6.8 was used for liquefaction analyses. The PGA and magnitude values were based on de-aggregation of the probabilistic hazard at the 10% in 50-year hazard level (Petersen and others, 1996; Cramer and Petersen, 1996). See the ground motion portion (Section 3) of this report for further details.
Quantitative Liquefaction Analysis
DMG performs quantitative analysis of geotechnical data to evaluate liquefaction potential using the Seed Simplified Procedure (Seed and Idriss, 1971; Seed and others, 1983; Seed and others, 1985; National Research Council, 1985; Seed and Harder, 1990; Youd and Idriss, 1997). This procedure calculates soil resistance to liquefaction, expressed in terms of cyclic resistance ratio (CRR) based on standard penetration test (SPT) results, ground-water level, soil density, moisture content, soil type, and sample depth. CRR values are then compared to calculated earthquake-generated shear stresses expressed in terms of cyclic stress ratio (CSR). The factor of safety (FS) relative to liquefaction is: FS=CRR/CSR. FS, therefore, is a quantitative measure of liquefaction potential. DMG uses a factor of safety of 1.0 or less, where CSR equals or exceeds CRR, to indicate the presence of potentially liquefiable soil. While an FS of 1.0 is considered the “trigger” for liquefaction, for a site specific analysis an FS of as much as 1.5 may be appropriate depending on the vulnerability of the site related structures. For a regional assessment DMG normally has a range of FS that results from the liquefaction analyses. The DMG liquefaction analysis program calculates an FS at each sample that has blow counts. The lowest FS in each borehole is used for that location. These FS vary in reliability according to the quality of the geotechnical data. These FS as well as other considerations such as slope, free face conditions, and thickness and depth of potentially liquefiable soil are evaluated in order to construct liquefaction potential maps, which then directly translate to zones of required investigation.
Of the more than 1000 geotechnical borehole logs reviewed in this study (Plates 1.1 and 1.2), about 300 include blow-count data from SPT’s or from penetration tests that allow reasonable blow count translations to SPT-equivalent values. Non-SPT values, such as those resulting from the use of 2-inch or 2½-inch inside-diameter ring samplers, were translated to SPT-equivalent values if reasonable factors could be used in conversion calculations. The reliability of the SPT-equivalent values varies. Therefore, they are weighted and used in a more qualitative manner. Few borehole logs, however, include all of the information (e.g. soil density, moisture content, sieve analysis, etc.) required for an ideal Seed-Idriss Simplified Procedure. For boreholes having acceptable penetration tests, liquefaction analysis is performed using recorded density, moisture, and sieve test values or using averaged test values of similar materials.
2001 SEISMIC HAZARD ZONE REPORT FOR THE SIMI VALLEY QUADRANGLES 13
LIQUEFACTION ZONES
Criteria for Zoning
Areas underlain by materials susceptible to liquefaction during an earthquake were included in liquefaction zones using criteria developed by the Seismic Hazards Mapping Act Advisory Committee and adopted by the California State Mining and Geology Board (DOC, 2000). Under those guideline criteria, liquefaction zones are areas meeting one or more of the following:
1. Areas known to have experienced liquefaction during historical earthquakes
2. All areas of uncompacted artificial fill containing liquefaction-susceptible material that are saturated, nearly saturated, or may be expected to become saturated
3. Areas where sufficient existing geotechnical data and analyses indicate that the soils are potentially liquefiable
4. Areas where existing geotechnical data are insufficient
In areas of limited or no geotechnical data, susceptibility zones may be identified by geologic criteria as follows:
a) Areas containing soil deposits of late Holocene age (current river channels and their historic floodplains, marshes and estuaries), where the M7.5-weighted peak acceleration that has a 10% probability of being exceeded in 50 years is greater than or equal to 0.10 g and the water table is less than 40 feet below the ground surface; or
b) Areas containing soil deposits of Holocene age (less than 11,000 years), where the M7.5-weighted peak acceleration that has a 10% probability of being exceeded in 50 years is greater than or equal to 0.20 g and the historical high water table is less than or equal to 30 feet below the ground surface; or
c) Areas containing soil deposits of latest Pleistocene age (11,000 to 15,000 years), where the M7.5-weighted peak acceleration that has a 10% probability of being exceeded in 50 years is greater than or equal to 0.30 g and the historical high water table is less than or equal to 20 feet below the ground surface.
Application of SMGB criteria to liquefaction zoning in the Simi Valley East and Simi Valley West quadrangles is summarized below.
Areas of Past Liquefaction
Liquefaction-related ground settlement and displacement associated with the Northridge earthquake of January 17, 1994 caused significant damage to private and city property in eastern Simi Valley and lower Tapo Canyon. These areas are delineated in Barrows and others (1994); DeLisle and others (1994); and Earthquake Engineering Research Center (1994). All such localities are within liquefaction zones.

DIVISION OF MINES AND GEOLOGY SHZR 002 14
Artificial Fills
Non-engineered artificial fill typically consists of loose, sandy soils whose liquefaction susceptibility is high. Uncompacted artificial fill was used to level off low areas along the course of the channelized Arroyo Simi. In addition, stockpiles and debris dam sediments associated with aggregate mining operations are in the category of artificial fill. These areas are within liquefaction zones.
Areas with Sufficient Existing Geotechnical Data
Sufficient geotechnical data exist for the populated valley regions because most urban development in the study area has occurred over the past 30 years. During this time, local agencies have required geotechnical site investigations for construction and environmental cleanup projects. These data were used to develop the liquefaction susceptibility map discussed earlier. Areas characterized by soils having high liquefaction susceptibility were placed in liquefaction zones. These areas contain loose sandy soils of Holocene age where the shallowest water depth, historically, is less than 40 feet. Areas covered by Pleistocene sediments were excluded from liquefaction zones because liquefaction susceptibility of the Pleistocene sediments is low.
Areas with Insufficient Existing Geotechnical Data
Most canyon areas lacked geotechnical borehole data. However, canyon floor deposits within the project area are mapped as consisting of historically active and other late Holocene sediments. It is presumed that these sediments become saturated during periods of heavy precipitation. Also, the anticipated PGA having a 10% probability of being exceeded in 50 years is greater than 0.1 g. As a result, these soils fall under Criteria for Zoning item 4a (see above) and are, therefore, within liquefaction zones.
ACKNOWLEDGMENTS
Subsurface data collection and geologic mapping for this study was carried out as a cooperative effort between staff of DMG and William Lettis and Associates (WLA) of Walnut Creek, California. The WLA contribution, particularly the active participation of Christopher Hitchcock, was invaluable to successful completion of the project. The authors also thank staff from the City of Simi Valley, City of Moorpark, Ventura County Flood Control and LUFT Divisions, Caltrans, Southern California District of the Department of Water Resources, SEACOR International Inc., and Fugro West, Inc. for their assistance in obtaining geotechnical information used in the preparation of this report. At DMG, special thanks go to Bob Moskovitz, Teri McGuire, Scott Shepherd, and Oris Miller for their Geographic Information System operations support, and to Joy Arthur for designing and plotting the graphic displays associated with the liquefaction zone map.
2001 SEISMIC HAZARD ZONE REPORT FOR THE SIMI VALLEY QUADRANGLES 15
REFERENCES
American Society for Testing and Materials, 1999, Standard test method for penetration test and split-barrel sampling of soils, Test Method D1586-99, in Annual Book of ASTM Standards, v. 4.08.
Barrows, A.G., Tan, S.S. and Irvine, P.J., 1994, Investigation of surface geologic effects and related land movement in the city of Simi Valley resulting from the Northridge earthquake of January 17, 1994: California Division of Mines and Geology, Open-File Report 94-09, 41 p.
California Department of Conservation, Division of Mines and Geology, 1997, Guidelines for evaluating and mitigating seismic hazards in California, Special Publication 117, 74 p.
California Department of Conservation, Division of Mines and Geology, 2000, Recommended criteria for delineating seismic hazard zones in California, Special Publication 118, 12 p.
Cramer, C.H. and Petersen, M.D., 1996, Predominant seismic source distance and magnitude maps for Los Angeles, Orange, and Ventura counties, California: Bulletin of Seismological Society of America, v. 86, no. 5, p. 1,645-1,649.
DeLisle, M.J., McCrink, T.P., Real, C.R. and Treiman, J.A., 1994, Damage and geologic effects of the January 17, 1994 Northridge earthquake in the city of Simi Valley: CDMG OFR 94-10, map 1.
Dibblee, T.W., Jr., 1992a, Geologic map of the Simi Quadrangle: 1:24,000 scale, #DF-39 Dibblee Foundation.
Dibblee, T.W., Jr., 1992b, Geologic map of the Santa Susana Quadrangle: 1:24,000 scale, #DF-38 Dibblee Foundation.
Earthquake Engineering Research Center, 1994, Preliminary report on the principal geotechnical aspects of the January 17, 1994 Northridge earthquake: University of California at Berkeley, College of Engineering, Report No. UCB/EERC-94/08, 245 p.
Edwards, R.D., Rabey, D.F. and Kover, R.W., 1970, Soil Survey of the Ventura area, California: U.S. Department of Agriculture, Soil Conservation Service, 48 pp., map scale 1:24,000.
Evenson, J., In-progress master’s thesis related to shallow groundwater conditions in western Simi Valley, California: California State University, Northridge.
Haydon, W.D., Hitchcock, C.S. and Loyd, R.L., unpublished, Quaternary geologic map of the Simi Valley West and the Simi Valley East 7.5-minute quadrangles, eastern Ventura County and western Los Angeles County.

DIVISION OF MINES AND GEOLOGY SHZR 002 16
Leighton and Associates, 1972, Groundwater study (Phase II) of east and west basins: F. Beach Leighton and Associates, consulting engineering geologist, 17 p., 2 plates. Unpublished report for the city of Simi Valley.
Leighton and Associates, 1985, Ground water re-evaluation of the west end ground water basin of the city of Simi Valley, Ventura County, California: F. Beach Leighton and Associates, consulting engineering geologist, 70 p., 7 appendices, 2 plates. Unpublished report prepared under contract to the Simi Valley County Sanitation District.
National Research Council, 1985, Liquefaction of soils during earthquakes: National Research Council Special Publication, Committee on Earthquake Engineering, National Academy Press, Washington, D.C., 240 p.
Petersen, M.D., Cramer, C.H., Bryant, W.A., Reichle, M.S. and Toppozada, T.R., 1996, Preliminary seismic hazard assessment for Los Angeles, Ventura, and Orange counties, affected by the 17 January 1994 Northridge earthquake: Bulletin of the Seismological Society of America, v. 86, no. 1B, p. S247-S261.
Seed, H.B. and Idriss, I.M., 1971, Simplified procedure for evaluating soil liquefaction potential: Journal of the Soil Mechanics and Foundations Division of ASCE, v. 97: SM9, p. 1,249-1,273.
Seed, H.B. and Idriss, I.M., 1982, Ground motions and soil liquefaction during earthquakes: Monograph Series, Earthquake Engineering Research Institute, Berkeley, California, 134 p.
Seed, H.B., Idriss, I.M. and Arango, Ignacio, 1983, Evaluation of liquefaction potential using field performance data: Journal of Geotechnical Engineering, v. 109, no. 3, p. 458-482.
Seed, H.B., Tokimatsu, Kohji, Harder, L.F., and Chung, R.M., 1985, Influence of SPT procedures in soil liquefaction resistance evaluations: Journal of Geotechnical Engineering, ASCE, v. 111, no. 12, p. 1,425-1,445.
Seed, R.B. and Harder, L.F., 1990, SPT-based analysis of cyclic pore pressure generation and undrained residual strength: Proceedings of the H. Bolton Seed Memorial Symposium, v. 2, p. 351-376.
Smith, T.C., 1996, Preliminary maps of seismic hazard zones and draft guidelines for evaluating and mitigating seismic hazards: California Geology, v. 49, no. 6, p. 147-150.
Tinsley, J.C. and Fumal, T.E., 1985, Mapping Quaternary sedimentary deposits for areal variations in shaking response, in Ziony, J. I., editor, Evaluating earthquake hazards in the Los Angeles Region -- An earth-science perspective: U.S. Geological Survey Professional Paper 1360, p. 101-125.

2001 SEISMIC HAZARD ZONE REPORT FOR THE SIMI VALLEY QUADRANGLES 17
Tinsley, J.C., Youd, T.L., Perkins, D.M. and Chen, A.T.F., 1985, Evaluating liquefaction potential, in Ziony, J.I., editor, Evaluating earthquake hazards in the Los Angeles region -- An earth science perspective: U.S. Geological Survey Professional Paper 1360, p. 263-316.
Yerkes, R.F. and Campbell, R.H., 1995a, Preliminary geologic map of the Simi Quadrangle, southern California: U.S. Geological Survey Open File Report 95-826, scale 1:24,000.
Yerkes, R.F. and Campbell, R.H., 1995b, Preliminary geologic map of the Santa Susana Quadrangle, southern California: U.S. Geological Survey Open File Report 95-829, scale 1:24,000.
Youd, T.L., 1973, Liquefaction, flow and associated ground failure: U.S. Geological Survey Circular 688, 12 p.
Youd, T.L., 1991, Mapping of earthquake-induced liquefaction for seismic zonation: Earthquake Engineering Research Institute, Proceedings, Fourth International Conference on Seismic Zonation, v. 1, p. 111-138.
Youd, T.L. and Idriss, I.M., 1997, editors, Proceedings of the NCEER workshop on evaluation of liquefaction resistance of soils: National Center for Earthquake Engineering Research Technical Report NCEER-97-0022, 276 p.
Youd, T.L. and Perkins, D.M., 1978, Mapping liquefaction-induced ground failure potential: Journal of Geotechnical Engineering, v. 104, p. 433-446.


2001 SEISMIC HAZARD ZONE REPORT FOR THE SIMI VALLEY QUADRANGLES 19
SECTION 2 EARTHQUAKE-INDUCED LANDSLIDE
EVALUATION REPORT
Earthquake-Induced Landslide Zones in the Simi Valley East and Simi Valley West 7.5-Minute
Quadrangles, Ventura and Los Angeles Counties, California
By Timothy P. McCrink, Allan G. Barrows, Pamela J. Irvine, Jack R.
McMillan, Michael A. Silva, and Desmond G. Giffen
California Department of Conservation Division of Mines and Geology
PURPOSE
The Seismic Hazards Mapping Act (the Act) of 1990 (Public Resources Code, Chapter 7.8, Division 2) directs the California Department of Conservation (DOC), Division of Mines and Geology (DMG) to delineate Seismic Hazard Zones. The purpose of the Act is to reduce the threat to public health and safety and to minimize the loss of life and property by identifying and mitigating seismic hazards. Cities, counties, and state agencies are directed to use seismic hazard zone maps prepared by DMG in their land-use planning and permitting processes. The Act requires that site-specific geotechnical investigations be performed prior to permitting most urban development projects within the hazard zones. Evaluation and mitigation of seismic hazards are to be conducted under guidelines established by the California State Mining and Geology Board (DOC, 1997; also available on the Internet at http://gmw.consrv.ca.gov/shmp/webdocs/sp117.pdf).
This section of the evaluation report summarizes seismic hazard zone mapping for earthquake-induced landslides in the Simi Valley East and Simi Valley West 7.5-minute
DIVISION OF MINES AND GEOLOGY SHZR 002 20
quadrangles. This section, along with Section 1 (addressing liquefaction), and Section 3 (addressing earthquake shaking), form a report that is one of a series that summarizes the preparation of seismic hazard zone maps within the state (Smith, 1996). Additional information on seismic hazard zone mapping in California can be accessed on DMG’s Internet web page: http://www.conservation.ca.gov/CGS/index.htm.
BACKGROUND
Landslides triggered by earthquakes historically have been a significant cause of earthquake damage. In California, large earthquakes such as the 1971 San Fernando, 1989 Loma Prieta, and 1994 Northridge earthquakes triggered landslides that were responsible for destroying or damaging numerous structures, blocking major transportation corridors, and damaging life-line infrastructure. Areas that are most susceptible to earthquake-induced landslides are steep slopes in poorly cemented or highly fractured rocks, areas underlain by loose, weak soils, and areas on or adjacent to existing landslide deposits. These geologic and terrain conditions exist in many parts of California, including numerous hillside areas that have already been developed or are likely to be developed in the future. The opportunity for strong earthquake ground shaking is high in many parts of California because of the presence of numerous active faults. The combination of these factors constitutes a significant seismic hazard throughout much of California, including the hillside areas of the Simi Valley East and Simi Valley West quadrangles.
METHODS SUMMARY
The mapping of earthquake-induced landslide hazard zones presented in this report is based on the best available terrain, geologic, geotechnical, and seismological data. If unavailable or significantly outdated, new forms of these data were compiled or generated specifically for this project. The following were collected or generated for this evaluation:
• Digital terrain data were used to provide an up-to-date representation of slope gradient and slope aspect in the study area
• Geologic mapping was used to provide an accurate representation of the spatial distribution of geologic materials in the study area. In addition, a map of existing landslides, whether triggered by earthquakes or not, was prepared
• Geotechnical laboratory test data were collected and statistically analyzed to quantitatively characterize the strength properties and dynamic slope stability of geologic materials in the study area
• Seismological data in the form of DMG probabilistic shaking maps and catalogs of strong-motion records were used to characterize future earthquake shaking within the mapped area

2001 SEISMIC HAZARD ZONE REPORT FOR THE SIMI VALLEY QUADRANGLES 21
The data collected for this evaluation were processed into a series of GIS layers using commercially available software. A slope stability analysis was performed using the Newmark method of analysis (Newmark, 1965), resulting in a map of landslide hazard potential. The earthquake-induced landslide hazard zone was derived from the landslide hazard potential map according to criteria developed in a DMG pilot study (McCrink and Real, 1996) and adopted by the State Mining and Geology Board (DOC, 2000).
SCOPE AND LIMITATIONS
The methodology used to make this map is based on earthquake ground-shaking estimates, geologic material-strength characteristics and slope gradient. These data are gathered from a variety of outside sources. Although the selection of data used in this evaluation was rigorous, the quality of the data is variable. The State of California and the Department of Conservation make no representations or warranties regarding the accuracy of the data gathered from outside sources.
Earthquake-induced landslide zone maps are intended to prompt more detailed, site-specific geotechnical investigations as required by the Act. As such, these zone maps identify areas where the potential for earthquake-induced landslides is relatively high. Due to limitations in methodology, it should be noted that these zone maps do not necessarily capture all potential earthquake-induced landslide hazards. Earthquake-induced ground failures that are not addressed by this map include those associated with ridge-top spreading and shattered ridges. It should also be noted that no attempt has been made to map potential run-out areas of triggered landslides. It is possible that such run-out areas may extend beyond the zone boundaries. The potential for ground failure resulting from liquefaction-induced lateral spreading of alluvial materials, considered by some to be a form of landsliding, is not specifically addressed by the earthquake-induced landslide zone or this report. See Section 1, Liquefaction Evaluation Report for the Simi Valley East and Simi Valley West quadrangles, for more information on the delineation of liquefaction zones.
The remainder of this report describes in more detail the mapping data and processes used to prepare the earthquake-induced landslide zone maps for the Simi Valley East and Simi Valley West quadrangles. The information is presented in two parts. Part I covers physiographic, geologic and engineering geologic conditions in the study area. Part II covers the preparation of landslide hazard potential and landslide zone maps.

DIVISION OF MINES AND GEOLOGY SHZR 002 22
PART I
PHYSIOGRAPHY
Study Area Location and Physiography
The Simi Valley East and Simi Valley West quadrangles cover approximately 120 square miles. Except for the southern portion of the map, which contains nearly all of the city of Simi Valley and part of the city of Moorpark, most of the map area comprises unincorporated Ventura County land, although a small part along the eastern margin lies within Los Angeles County. The center of the area lies 30 miles east of Ventura and 32 miles northwest of Los Angeles. From the east, access is via State Highway 118, the Simi Valley Freeway, and from the south and west, State Highway 23. West-trending mountain ridges, including Big Mountain and, to the north, Oak Ridge and the Santa Susana Mountains, dominate the terrain in the northern half of the quadrangles. North of Simi Valley, entry to the mountainous terrain of Big Mountain and, farther north, Oak Ridge is provided by roads in Tapo Canyon and its tributaries or, on the west, via Happy Camp Canyon. South of Big Mountain, the terrain is characterized by moderately sloping hills and terrace surfaces, dissected by numerous canyons that border the northwestern part of Simi Valley. Terrain on the southern margin of Simi Valley is characterized by rounded hills of volcanic rock with steep-sided canyons to the west and steeper, more rugged slopes of the Simi Hills to the southeast. Residential and commercial development is generally concentrated in the southern part of the map area, within the nearly level lowlands, primarily in Simi Valley, Little Simi Valley, and Tierra Rejada Valley in the southwest corner of the map.
Digital Terrain Data
The calculation of slope gradient is an essential part of the evaluation of slope stability under earthquake conditions. An accurate slope gradient calculation begins with an up-to-date map representation of the earth’s surface. Within the Simi Valley East and Simi Valley West quadrangles, a Level 2 digital elevation model (DEM) was obtained from the USGS (U.S. Geological Survey, 1993). This DEM, which was prepared from the 7.5-minute quadrangle topographic contours that are based on 1947 aerial photography, has a 10-meter horizontal resolution and a 7.5-meter vertical accuracy.
A slope map was made from the DEM using a third-order, finite difference, center-weighted algorithm (Horn, 1981). The DEM was also used to make a slope aspect map. The manner in which the slope and aspect maps were used to prepare the zone map will be described in subsequent sections of this report.

2001 SEISMIC HAZARD ZONE REPORT FOR THE SIMI VALLEY QUADRANGLES 23
GEOLOGY
Bedrock and Surficial Geology
For the Simi Valley quadrangles, recently compiled geologic maps were obtained from the U.S. Geological Survey (USGS) in digital form (Yerkes and Campbell, 1995a; 1995b). These maps were modified to reflect the most recent mapping in the area. Landslide deposits were deleted from the map so that the distribution of bedrock formations and the landslide inventory would exist on separate layers for the hazard analysis. In the field, observations were made of exposures, aspects of weathering, and general surface expression of the geologic units. In addition, the relation of the various geologic units to development and abundance of slope failures was noted.
The oldest geologic unit mapped in the Simi Valley area is the Upper Cretaceous Chatsworth Formation (Yerkes and Campbell map symbol Kc), which forms spectacular tilted outcrops in the southeast quarter of the Simi Valley East Quadrangle near Santa Susana Pass. The Chatsworth Formation consists of massive, thick-bedded marine sandstone and conglomerate interbedded with thin-bedded siltstone and mudstone. Overlying the Chatsworth Formation is the Paleocene Simi Conglomerate (Tsc), a marine pebble-cobble conglomerate containing discontinuous sandstone lenses.
Other Tertiary bedrock formations include the Paleocene and lower Eocene Santa Susana Formation (marine sandstone, siltstone, conglomerate, and fossiliferous concretionary sandstone, and shell-hash beds; Tss), lower to middle Eocene Llajas Formation (marine sandstone, siltstone, and nonmarine to shallow-marine conglomerate; Tl, Tlc), upper Eocene to lower Miocene Sespe Formation (nonmarine sandstone, mudstone, and conglomerate; Ts), lower Miocene Vaqueros Formation (marine and nonmarine sandstone, siltstone, and local coquina beds; Tv), middle Miocene Conejo Volcanics and Calabasas Formation of the Topanga Group (marine sandstone, siltstone, and volcanic flows and breccias; Tcb, Tco, Tcob, and Tcoa), upper Miocene Modelo Formation (marine siliceous shale, clay shale, diatomaceous shale, siltstone, and sandstone; Tm, Tm1, Tm2, Tm3, Tm4, and Tmd), and upper Miocene to lower Pliocene Towsley Formation (marine sandstone, conglomerate, siltstone, and mudstone; Tw, Twc, and Tws). Diabasic and basaltic volcanic rocks (Ti) intrude middle Miocene and older strata.
Plio-Pleistocene bedrock units in the Simi Valley area include the Pico and Saugus formations. The Pico Formation consists of marine siltstone, sandstone, and pebbly sandstone (Qtp, Qtps, and Qtpc). The Saugus Formation overlies the Pico Formation and is composed of interbedded shallow-marine to brackish water sandstone, siltstone, pebble-cobble conglomerate and coquina beds (Qsm), which grade laterally and vertically into nonmarine sandstone, siltstone, and conglomerate (Qs). A local member of the Saugus Formation (Qsv) is exposed in the southwest corner of the Simi Valley West Quadrangle. It is predominantly a volcanic breccia conglomerate, which resembles Conejo Volcanics breccia but is believed to represent remnants of landslide debris shed from Conejo Volcanics into a local trough during Saugus time.

DIVISION OF MINES AND GEOLOGY SHZR 002 24
Quaternary surficial deposits cover the floor and margins of Simi Valley, Little Simi Valley, and Tierra Rejada Valley and extend up into the canyons in the mountains to the north and south. They consist of upper Pleistocene nonmarine terrace and fan deposits, and Holocene and Pleistocene slope wash, landslide deposits, older alluvium and younger alluvium (Qft, Qt, Qsw, Qls, Qao, and Qal). Modern man-made fills (af) are also mapped in some areas. A more detailed discussion of the Quaternary deposits in the Simi Valley area can be found in Section 1.
Structural Geology
Accompanying the digital geologic maps (Yerkes and Campbell, 1995a; 1995b) were digital files of associated geologic structural data, including bedding and foliation attitudes (strike and dip) and fold axes. We used the structural geologic information provided with the digital geologic maps (Yerkes and Campbell, 1995a; 1995b) and from Dibblee (1992a; 1992b) to categorize areas of common stratigraphic dip direction and magnitude, similar to the method presented by Brabb (1983). The dip direction category was compared to the slope aspect (direction) category and, if the same, the dip magnitude and slope gradient categories were compared. If the dip magnitude category was less than or equal to the slope gradient category, and the bedding dip was greater than 25% (4:1 slope), the area was marked as a potential adverse bedding area. This information was then used to subdivide mapped geologic units into areas where fine-grained and coarse-grained
Landslide Inventory
As a part of the geologic data compilation, an inventory of existing landslides in the Simi Valley East and Simi Valley West quadrangles was prepared by field reconnaissance, analysis of stereo-paired aerial photographs and a review of previously published landslide mapping. The inventory was prepared (Irvine, unpublished; Irvine and Giffen, unpublished) by using previous work done in the south half of the area (Irvine, 1990, Plate 22B) and by combining field observations and analysis of aerial photos (PACWAS, 1988; Nasa, 1994; see Air Photos in References) for the remainder of the map area. Also consulted during the mapping process were previous maps and reports that contain geologic and landslide data (Bishop, 1950; Jestes, 1958; Canter, 1973; Ricketts and Whaley, 1975; Morton, 1976a and 1976b; and Dibblee, 1992a and 1992b). Landslides were mapped and digitized at a scale of 1:24,000. For each landslide included on the map a number of characteristics (attributes) were compiled. These characteristics include the confidence of interpretation (definite, probable and questionable) and other properties, such as activity, thickness, and associated geologic unit(s). Landslides rated as definite and probable were carried into the slope stability analysis. Landslides rated as questionable were not carried into the slope stability analysis due to the uncertainty of their existence. The completed hand-drawn landslide map was scanned, digitized, and the database was attributed. A version of this landslide inventory is included with Plates 2.1 and 2.2.

2001 SEISMIC HAZARD ZONE REPORT FOR THE SIMI VALLEY QUADRANGLES 25
ENGINEERING GEOLOGY
Geologic Material Strength
To evaluate the stability of geologic materials under earthquake conditions, the geologic map units described above were ranked and grouped on the basis of their shear strength. Generally, the primary source for rock shear-strength measurements is geotechnical reports prepared by consultants on file with local government permitting departments. Geotechnical and engineering geologic reports contained in Environmental Impact Reports and Hospital Review Project files at DMG are additional sources. Other sources include reports published in professional journals, and summaries of “state of the practice” values for some widespread formations in the region provided by practicing professionals and local government geologists (see Appendix A). The locations of rock and soil samples taken for shear testing are shown on Plates 2.1 and 2.2.
Shear strength data gathered from the above sources were compiled for each geologic map unit. Geologic units were grouped on the basis of average angle of internal friction (average phi) and lithologic character. When available, shear tests from adjacent quadrangles were used to augment data for geologic formations that had little or no shear test information. Average (mean and median) phi values for each geologic map unit and corresponding strength group are summarized in Table 2.1. For most of the geologic strength groups in the map area, a single shear strength value was assigned and used in our slope stability analysis. A geologic material strength map was made based on the groupings presented in Tables 2.1 and 2.2, and this map provides a spatial representation of material strength for use in the slope stability analysis.

DIVISION OF MINES AND GEOLOGY SHZR 002 26
SIMI VALLEY EAST AND SIMI VALLEY WEST QUADRANGLESSHEAR STRENGTH GROUPINGS
Formation Number Mean/Median Group Group No Data: Phi Values Name Tests PHI Mean/Median Mean/Median Similar Used in Stability
PHI (deg.) Cohesion (psf) Lithology Analyses
GROUP 1 Tco 3 37.7 / 38 40.8 / 38.5 794 / 600 Tcoa, Tcob 38Kc 13 41.5 / 39
GROUP 2 Tl-fbc 5 34.2 / 33 Tl(cong),Tsc,Twc,Ts-fbc 23 35.4 / 34 35.2 / 34.5 382 / 250 Tw-fbc, Tv-fbc, Tm-fbc, 35Tss-fbc 9 36.2 / 35 Tm1-fbc, Tm2-fbc, Tm3-fbc,
Tm4-fbc, Tmd-fbc, Tm?-fbc,QTpc, Qs-fbc, Qsm-fbc,
QTp-fbc,Qsm?-fbc, Tcb-fbc
GROUP 3 Qal 8 28 / 30Qao 5 27.4 / 28 28.2 / 28.8 358 / 300 Qft, Qsw, Qt?, Ti 28Qt 6 30.4 / 32 af 17 26 / 26
GROUP 4 Ts-abc 15 21.6 / 23 21.1 / 23 460 / 400 QTps, QTp-abc, Qs-abc,Tss-abc 2 17.5 / 17.5 Qsv-abc, Qsm-abc, Qsm?-abc,
Qsv?-abc, Tcb-abc, 22Tl-abc, Tm-abc, Tm1-abc,
Tm2-abc,Tm3-abc, Tm4-abc,Tmd-abc, Tm?-abc, Tv-abc,
Tw-abc, Tws
GROUP 5 Qls 8 19.6 / 23 19.6 / 23 563 / 470 10
abc = adverse bedding condition, fine-grained material strengthfbc = favorable bedding condition, coarse-grained material strength
Table 2.1. Summary of the Shear Strength Statistics for the Simi Valley East and Simi Valley West Quadrangles.

2001 SEISMIC HAZARD ZONE REPORT FOR THE SIMI VALLEY QUADRANGLES 27
S H EA R S T R EN G T H G R O U P S F O R T H ES IM I V A L L EY EA S T A N D S IM I V A L L EY W ES T Q U A D R A N G L ES
G R O U P 1 G R O U P 2 G R O U P 3 G R O U P 4 G R O U P 5
Tc o Tlc a f Q Tps Q lsTc oa Q Tpc Q al Tw sTc ob Ts c Q ao Q s -abc
K c Tw c Q ft Q s m -abcQ s -fbc Q s w Q Tp-abc
Q s m -fbc Q t Tl-abcQ Tp-fbc Q t? Tm -abc
Tl-fbc Ti Tm 1-abcTm -fbc Tm 2-abc
Tm 1-fbc Tm 3-abcTm 2-fbc Tm 4-abcTm 3-fbc Tm d-abcTm 4-fbc Ts -abcTm d-fbc Ts s -abc
Ts -fbc Tw -abcTs s -fbc Q s m ?-abcTw -fbc Q s v?-abc
Q s m ?-fbc Tc b-abcQ s v?-fbc Tm ?-abcTc b-fbc Tv-abcTm ?-fbc
Tv-fbc
Table 2.2. Summary of the Shear Strength Groups for the Simi Valley East and Simi Valley West Quadrangles.
Adverse Bedding Conditions
Adverse bedding conditions are an important consideration in slope stability analyses. Adverse bedding conditions occur where the dip direction of bedded sedimentary rocks is roughly the same as the slope aspect, and where the dip magnitude is less than the slope gradient. Under these conditions, landslides can slip along bedding surfaces due to a lack of lateral support.
To account for adverse bedding in our slope stability evaluation, we used geologic structural data in combination with digital terrain data to identify areas with potentially adverse bedding, using methods similar to those of Brabb (1983). The structural data, derived from the geologic map database, was used to categorize areas of common bedding dip direction and magnitude. The dip direction was then compared to the slope aspect and, if the same, the dip magnitude and slope gradient categories were compared. If the dip magnitude was less than or equal to the slope gradient category but greater than 25% (4:1 slope), the area was marked as a potential adverse bedding area.
DIVISION OF MINES AND GEOLOGY SHZR 002 28
The units, which contain interbedded sandstone and shale, were subdivided based on shear strength differences between coarse-grained (higher strength) and fine-grained (lower strength) lithologies. Shear strength values for the fine- and coarse-grained lithologies were then applied to areas of favorable and adverse bedding orientation, which were determined from structural and terrain data as discussed above. It was assumed that coarse-grained material (higher strength) dominates where bedding dips into a slope (favorable bedding) while fine-grained (lower strength) material dominates where bedding dips out of a slope (adverse bedding). The geologic material strength map was modified by assigning the lower, fine-grained shear strength values to areas where potential adverse bedding conditions were identified. The favorable and adverse bedding shear strength parameters for the units are included in Table 2.1.
Existing Landslides
The strength characteristics of existing landslides (Qls) must be based on tests of the materials along the landslide slip surface. Ideally, shear tests of slip surfaces formed in each mapped geologic unit would be used. However, this amount information is rarely available, and for the preparation of the earthquake-induced landslide zone map it has been assumed that all landslides within the quadrangle have the same slip surface strength parameters. We collect and use primarily “residual” strength parameters from laboratory tests of slip surface materials tested in direct shear or ring shear test equipment. Back-calculated strength parameters, if the calculations appear to have been performed appropriately, have also been used.

2001 SEISMIC HAZARD ZONE REPORT FOR THE SIMI VALLEY QUADRANGLES 29
PART II
EARTHQUAKE-INDUCED LANDSLIDE HAZARD POTENTIAL
Design Strong-Motion Record
To evaluate earthquake-induced landslide hazard potential in the study area, a method of dynamic slope stability analysis developed by Newmark (1965) was used. The Newmark method analyzes dynamic slope stability by calculating the cumulative down-slope displacement for a given earthquake strong-motion time history. As implemented for the preparation of earthquake-induced landslide zones, the Newmark method necessitates the selection of a design earthquake strong-motion record to provide the “ground shaking opportunity”. For the Simi Valley East and Simi Valley West quadrangles, selection of a strong motion record was based on an estimation of probabilistic ground motion parameters for modal magnitude, modal distance, and peak ground acceleration (PGA). The parameters were estimated from maps prepared by DMG for a 10% probability of being exceeded in 50 years (Petersen and others, 1996; Cramer and Petersen, 1996). The parameters used in the record selection are:
Modal Magnitude: 6.5 to 6.75
Modal Distance: 0 to 5.0 km
PGA: 0.4 to 0.5 g
The strong-motion record selected was the Channel 3 (north horizontal component) Pacoima-Kagel Canyon Fire Station recording from the magnitude 6.7 Northridge earthquake (Shakal and others, 1994). This record had a source to recording site distance of 2.6 km and a PGA of 0.44 g. The selected strong-motion record was not scaled or otherwise modified prior to its use in the analysis.
Displacement Calculation
The design strong-motion record was used to develop a relationship between landslide displacement and yield acceleration (ay), defined as the earthquake horizontal ground acceleration above which landslide displacements take place. This relationship was prepared by integrating the design strong-motion record twice for a given acceleration value to find the corresponding displacement, and the process was repeated for a range of acceleration values (Jibson, 1993). The resulting curve in Figure 2.1 represents the full spectrum of displacements that can be expected for the design strong-motion record. This curve provides the required link between anticipated earthquake shaking and
DIVISION OF MINES AND GEOLOGY SHZR 002 30
estimates of displacement for different combinations of geologic materials and slope gradient, as described in the Slope Stability Analysis section below.
The amount of displacement predicted by the Newmark analysis provides an indication of the relative amount of damage that could be caused by earthquake-induced landsliding. Displacements of 30, 15 and 5 cm were used as criteria for rating levels of earthquake-induced landslide hazard potential based on the work of Youd (1980), Wilson and Keefer (1983), and a DMG pilot study for earthquake-induced landslides (McCrink and Real, 1996). Applied to the curve in Figure 2.1, these displacements correspond to yield accelerations of 0.074, 0.13 and 0.21 g. Because these yield acceleration values are derived from the design strong-motion record, they represent the ground shaking opportunity thresholds that are significant in the Simi Valley East and Simi Valley West quadrangles.

2001 SEISMIC HAZARD ZONE REPORT FOR THE SIMI VALLEY QUADRANGLES 31
0.1
1.0
10.0
100.0
1000.0
Dis
plac
emen
t (cm
)
0.01 0.1 1 Yield Acceleration (g)
Newmark Displacementvs. Yield Acceleration
Pacoima Kagel Canyon Station - Channel 3
30 cm
15 cm
5 cm
Figure 2.1. Yield Acceleration vs. Newmark Displacement for the Pacoima-Kagel Canyon Strong-Motion Record From the 17 January 1994 Northridge, California Earthquake. Record from California Strong Motion Instrumentation Program (CSMIP) Station 24088.
Slope Stability Analysis
A slope stability analysis was performed for each geologic material strength group at slope increments of 1 degree. An infinite-slope failure model under unsaturated slope conditions was assumed. A factor of safety was calculated first, followed by the calculation of yield acceleration from Newmark’s equation:
ay = ( FS - 1 )g sin α
where FS is the Factor of Safety, g is the acceleration due to gravity, and α is the direction of movement of the slide mass, in degrees measured from the horizontal, when displacement is initiated (Newmark, 1965). For an infinite slope failure α is the same as the slope angle.
DIVISION OF MINES AND GEOLOGY SHZR 002 32
The yield accelerations resulting from Newmark’s equations represent the susceptibility to earthquake-induced failure of each geologic material strength group for a range of slope gradients. Based on the relationship between yield acceleration and Newmark displacement shown in Figure 2.1, hazard potentials were assigned as follows:
1. If the calculated yield acceleration was less than 0.074g, Newmark displacement greater than 30 cm is indicated, and a HIGH hazard potential was assigned (H on Table 2.3)
2. If the calculated yield acceleration fell between 0.074g and 0.13g, Newmark displacement between 15 cm and 30 cm is indicated, and a MODERATE hazard potential was assigned (M on Table 2.3)
3. If the calculated yield acceleration fell between 0.13g and 0.21g, Newmark displacement between 5 cm and 15 cm is indicated, and a LOW hazard potential was assigned (L on Table 2.3)
4. If the calculated yield acceleration was greater than 0.21g, Newmark displacement of less than 5 cm is indicated, and a VERY LOW potential was assigned (VL on Table 2.3)
Table 2.3 summarizes the results of the stability analyses. The earthquake-induced landslide hazard potential map was prepared by combining the geologic material-strength map and the slope map according to this table.
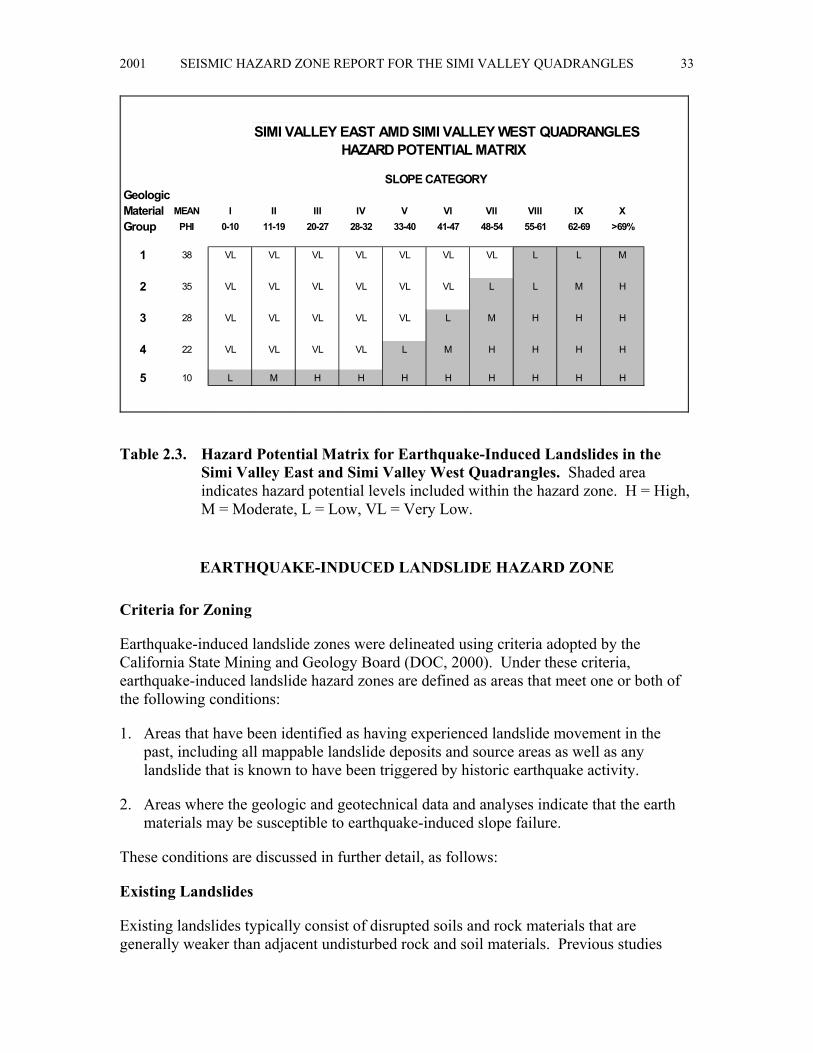
2001 SEISMIC HAZARD ZONE REPORT FOR THE SIMI VALLEY QUADRANGLES 33
SIMI VALLEY EAST AMD SIMI VALLEY WEST QUADRANGLESHAZARD POTENTIAL MATRIX
SLOPE CATEGORYGeologic Material MEAN I II III IV V VI VII VIII IX XGroup PHI 0-10 11-19 20-27 28-32 33-40 41-47 48-54 55-61 62-69 >69%
1 38 VL VL VL VL VL VL VL L L M
2 35 VL VL VL VL VL VL L L M H
3 28 VL VL VL VL VL L M H H H
4 22 VL VL VL VL L M H H H H
5 10 L M H H H H H H H H
Table 2.3. Hazard Potential Matrix for Earthquake-Induced Landslides in the Simi Valley East and Simi Valley West Quadrangles. Shaded area indicates hazard potential levels included within the hazard zone. H = High, M = Moderate, L = Low, VL = Very Low.
EARTHQUAKE-INDUCED LANDSLIDE HAZARD ZONE
Criteria for Zoning
Earthquake-induced landslide zones were delineated using criteria adopted by the California State Mining and Geology Board (DOC, 2000). Under these criteria, earthquake-induced landslide hazard zones are defined as areas that meet one or both of the following conditions:
1. Areas that have been identified as having experienced landslide movement in the past, including all mappable landslide deposits and source areas as well as any landslide that is known to have been triggered by historic earthquake activity.
2. Areas where the geologic and geotechnical data and analyses indicate that the earth materials may be susceptible to earthquake-induced slope failure.
These conditions are discussed in further detail, as follows:
Existing Landslides
Existing landslides typically consist of disrupted soils and rock materials that are generally weaker than adjacent undisturbed rock and soil materials. Previous studies

DIVISION OF MINES AND GEOLOGY SHZR 002 34
indicate that existing landslides can be reactivated by earthquake movements (Keefer, 1984). Earthquake-triggered movement of existing landslides is most pronounced in steep head scarp areas and at the toe of existing landslide deposits. Although reactivation of deep-seated landslide deposits is less common (Keefer, 1984), a significant number of deep-seated landslide movements have occurred during, or soon after, several recent earthquakes. Based on these observations, all existing landslides with a definite or probable confidence rating are included within the earthquake-induced landslide hazard zone.
Although Morton (1975) mapped the seismically triggered landslides from the February 9, 1971 San Fernando earthquake, his map only extends westward to the eastern boundary of the Simi Valley East Quadrangle. It is likely that rock falls and landslides were triggered within the mountainous terrain in the Simi Valley East Quadrangle but no maps of their distribution were produced. An abundance of landslides, predominantly rock falls and soil falls, were triggered by the Northridge earthquake in both the Simi Valley East and Simi Valley West quadrangles (Harp and Jibson, 1995). Landslides attributed to the Northridge earthquake covered approximately 853 acres of land in the Simi Valley East Quadrangle and approximately 272 acres in the Simi Valley West Quadrangle. The total area of Northridge-earthquake landslides within the two quadrangles is less than 1.27% of the total area covered by the maps. In the Simi Valley East Quadrangle 82% of the area covered by landslides inferred or mapped as being triggered by the Northridge earthquake lie within the area of the hazard zone. In the Simi Valley West Quadrangle, 90% of the landslides lie within the hazard zone based on a computer comparison of the zone map and the Harp and Jibson (1995) inventory. The difference may reflect run-out of soil falls or dust deposits inferred to be landslide features.
Geologic and Geotechnical Analysis
Based on the conclusions of a pilot study performed by DMG (McCrink and Real, 1996), it has been concluded that earthquake-induced landslide hazard zones should encompass all areas that have a High, Moderate or Low level of hazard potential (see Table 2.3). Areas with a Very Low hazard potential are excluded from the zone.
As summarized in Table 2.3, all areas characterized by the following geologic strength group and slope gradient conditions are included in the earthquake-induced landslide hazard zone:
1. Geologic Strength Group 5 is included for all slope gradient categories. (Note: Geologic Strength Group 5 includes all mappable landslides with a definite or probable confidence rating).
2. Geologic Strength Group 4 is included for all slopes steeper than 20 percent.
3. Geologic Strength Group 3 is included for all slopes steeper than 33 percent.
4. Geologic Strength Group 2 is included for all slopes steeper than 41 percent.

2001 SEISMIC HAZARD ZONE REPORT FOR THE SIMI VALLEY QUADRANGLES 35
5. Geologic Strength Group 1 is included for all slopes greater than 48 percent.
This results in roughly 23% of the land in the Simi Valley West Quadrangle and 38% of the Simi Valley East Quadrangle lying within the earthquake-induced landslide hazard zone.
ACKNOWLEDGMENTS
The authors would like to thank the following individuals and organizations for their assistance in obtaining the data necessary to complete this project. Geologic material strength data were collected at the City of Simi Valley with the assistance of Mike Kuhn, Shiv Vyas, and Amir Hamidzadeh. Tom Blake provided input to shear tests of special significance in and around the Simi Valley area. Strength test data from the Oat Mountain Quadrangle were used for some geologic units and these data were provided by Randy Jibson of the U.S. Geological Survey. Technical review of the methodology was provided by Bruce Clark, Randy Jibson, Robert Larson, Scott Lindvall, and J. David Rogers, who are members of the State Mining and Geology Board’s Seismic Hazards Mapping Act Advisory Committee Landslides Working Group. At DMG, special thanks to Bob Moskovitz, Teri McGuire, Scott Shepherd, and Oris Miller for their Geographic Information System operations support, and to Joy Arthur for designing and plotting the graphic displays associated with the hazard zone map and this report.
REFERENCES
Bishop, W.C., 1950, Geology of southern flank of Santa Susana Mountains, county line to Limekiln Canyon, Los Angeles County, California: unpublished M.A. thesis, University of California, Los Angeles, Plate I, scale 1:12,000.
Brabb, E.E., 1983, Map showing direction and amount of bedding dip of sedimentary rocks in San Mateo County, California: U.S. Geological Survey Miscellaneous Investigations Series Map I-1257C, 1 sheet, scale 1:62,500.
California Department of Conservation, Division of Mines and Geology, 1997, Guidelines for evaluating and mitigating seismic hazards in California: California Department of Conservation, Division of Mines and Geology, Special Publication 117, 74 p.
California Department of Conservation, Division of Mines and Geology, 2000, Recommended criteria for delineating seismic hazard zones: California Department of Conservation, Division of Mines and Geology, Special Publication 118, 12 p.

DIVISION OF MINES AND GEOLOGY SHZR 002 36
Canter, N.W., 1974, Paleogeology and paleogeography of the Big Mountain area, Santa Susana, Moorpark, and Simi quadrangles, Ventura County, California: unpublished M.S. thesis, Ohio University, Plate 1, scale 1:24,000.
Cramer, C.H. and Petersen, M.D., 1996, Predominant seismic source distance and magnitude maps for Los Angeles, Orange and Ventura counties, California: Bulletin of the Seismological Society of America, v. 85, no. 5, pp. 1645-1649.
Dibblee, T.W., Jr., 1992a, Geology of the Simi Quadrangle, Ventura County, California: Dibblee Geological Foundation Map #DF-39, scale 1:24,000.
Dibblee, T.W., Jr., 1992b, Geology of the Santa Susana Quadrangle, Ventura and Los Angeles counties, California: Dibblee Geological Foundation Map #DF-38, scale 1:24,000.
Harp, E.L. and Jibson, R.W., 1995, Landslides triggered by the January 17, 1994 Northridge, California earthquake: U.S. Geological Survey Open-File Report 95-213, 17 p., plate 1, scale 1:100,00; plate 2, scale 1:50,000.
Horn, B.K.P., 1981, Hill shading and the reflectance map: Proceedings of the IEEE, v. 69, no. 1, p. 14-47.
Irvine, P.J., 1990, Landslide hazards in the Simi Valley area, Los Angeles and Ventura counties, California: California Division of Mines and Geology Open-File Report 90-17, scale 1:24,000.
Irvine, P.J., unpublished, Landslide inventory map of the Simi Valley West 7.5-minute Quadrangle, Ventura County, California.
Irvine, P.J. and Giffen, D.G., unpublished, Landslide inventory map of the Simi Valley East 7.5-minute Quadrangle, Ventura and Los Angeles counties, California.
Jestes, E.C., 1958, Geology of the Wiley Canyon area, Ventura County, California: unpublished M.A. thesis, University of California, Los Angeles, plate 1, scale 1:24,000.
Jibson, R.W., 1993, Predicting earthquake-induced landslide displacements using Newmark’s sliding block analysis: Transportation Research Board, National Research Council, Transportation Research Record 1411, 17 p.
Keefer, D.K., 1984, Landslides caused by earthquakes: Geological Society of America Bulletin, v. 95, no. 4, p. 406-421.
McCrink, T.P. and Real, C.R., 1996, Evaluation of the Newmark method for mapping earthquake-induced landslide hazards in the Laurel 7-1/2 minute Quadrangle, Santa Cruz County, California: California Division of Mines and Geology Final Technical Report for U.S. Geological Survey Contract 143-93-G-2334, U.S. Geological Survey, Reston, Virginia, 31 p.

2001 SEISMIC HAZARD ZONE REPORT FOR THE SIMI VALLEY QUADRANGLES 37
Morton, D.M., 1975, Seismically triggered landslides in the area above the San Fernando Valley, in Oakeshott, G.B., editor, San Fernando, California, earthquake of 9 February 1971: California Division of Mines and Geology Bulletin 196, p. 145-154.
Morton, D.M., 1976 a, Reconnaissance surficial geologic maps of the Fillmore, Moorpark, Piru, and Simi 7.5’ quadrangles, Ventura County, California: U.S. Geological Survey Open-File Report 76-210, scale 1:24,000.
Morton, D.M., 1976 b, Reconnaissance surfical geologic maps of the Newhall, Oat Mountain, Santa Susana, and Val Verde 7.5’ quadrangles, Los Angeles and Ventura counties, California: U.S. Geological Survey Open-File Report 76-211, scale 1:24,000.
Newmark, N.M., 1965, Effects of earthquakes on dams and embankments: Geotechnique, v. 15, no. 2, p. 139-160.
Petersen, M.D., Cramer, C.H., Bryant, W.A., Reichle, M.S. and Toppozada, T.R., 1996, Preliminary seismic hazard assessment for Los Angeles, Ventura, and Orange counties, affected by the 17 January 1994 Northridge earthquake: Bulletin of the Seismological Society of America, v. 86, no. 1B, p. S247-S261.
Ricketts, E. and Whaley, K., 1975, Structure and stratigraphy of Oak Ridge-Santa Susana fault intersection, Ventura County, California: unpublished M.S. thesis, Ohio University, plate I, scale 1:24,000.
Smith, T.C., 1996, Preliminary maps of seismic hazard zones and draft guidelines for evaluating and mitigating seismic hazards: California Geology, v. 49, no. 6, p. 147-150.
U.S. Geological Survey, 1993, Digital Elevation Models: National Mapping Program, Technical Instructions, Data Users Guide 5, 48 p.
Wilson, R.C. and Keefer, D.K., 1983, Dynamic analysis of a slope failure from the 1979 Coyote Lake, California, earthquake: Bulletin of the Seismological Society of America, v. 73, p. 863-877.
Yerkes, R.F. and Campbell, R.H., 1995a, Preliminary geologic map of the Santa Susana [Simi Valley East] Quadrangle, southern California: U.S. Geological Survey Open File Report 95-829, scale 1:24,000.
Yerkes, R.F. and Campbell, R.H., 1995b, Preliminary geologic map of the Simi [Simi Valley West] Quadrangle, southern California: U.S. Geological Survey Open File Report 95-828, scale 1:24,000.
Youd, T.L., 1980, Ground failure displacement and earthquake damage to buildings: American Society of Civil Engineers Conference on Civil Engineering and Nuclear Power, 2d, Knoxville, Tennessee, 1980, v. 2, p. 7-6-2 to 7-6-26.

DIVISION OF MINES AND GEOLOGY SHZR 002 38
AIR PHOTOS
NASA (National Aeronautics and Space Administration), 1994, Aerial photography, 04689, Flight 94-002-02, January 22, 1994, Frames 399-422, 360-378, 302-320, 240-260, 181-198, 138-156, and 78-94, black and white, vertical, approx. scale 1:15,000.
PACWAS (Pacific Western Aerial Surveys, Inc.), 1988, Aerial photography, Flight PW VEN6, September 29, 1988 - Frames 126-138, November 16, 1988 - Frames 158-168, November 22, 1988 - Frames 193-204 and 229-239, color, vertical, scale 1:24,000.
APPENDIX A SOURCE OF ROCK STRENGTH DATA
SOURCE NUMBER OF TESTS SELECTED
City of Simi Valley Department of Public Works, Planning Department
79
Ventura County Flood Control District, (data on Llajas Dam)
14
Association of Engineering Geologists Fieldtrip Guidebook from the 1991
Annual Field Trip, Southern California Section, Vol. 1, Page 37
6
Ventura County Public Works Agency, Development and Inspection Services
4
Total number of shear tests used to characterize the units in the Simi Valley East and Simi Valley West quadrangles
103

2001 SEISMIC HAZARD ZONE REPORT FOR THE SIMI VALLEY QUADRANGLES 39
SECTION 3 GROUND SHAKING EVALUATION REPORT
Potential Ground Shaking in the
Simi Valley East and Simi Valley West 7.5-Minute Quadrangles,
Ventura and Los Angeles Counties, California
By
Mark D. Petersen*, Chris H. Cramer*, Geoffrey A. Faneros, Charles R. Real, and Michael S. Reichle
California Department of Conservation
Division of Mines and Geology *Formerly with DMG, now with U.S. Geological Survey
PURPOSE
The Seismic Hazards Mapping Act (the Act) of 1990 (Public Resources Code, Chapter 7.8, Division 2) directs the California Department of Conservation (DOC), Division of Mines and Geology (DMG) to delineate Seismic Hazard Zones. The purpose of the Act is to reduce the threat to public health and safety and to minimize the loss of life and property by identifying and mitigating seismic hazards. Cities, counties, and state agencies are directed to use the Seismic Hazard Zone Maps in their land-use planning and permitting processes. The Act requires that site-specific geotechnical investigations be performed prior to permitting most urban development projects within the hazard zones. Evaluation and mitigation of seismic hazards are to be conducted under guidelines established by the California State Mining and Geology Board (DOC, 1997; also available on the Internet at http://gmw.consrv.ca.gov/shmp/webdocs/sp117.pdf).
This section of the evaluation report summarizes the ground motions used to evaluate liquefaction and earthquake-induced landslide potential for zoning purposes. Included are ground motion and related maps, a brief overview on how these maps were prepared,

DIVISION OF MINES AND GEOLOGY SHZR 002 40
precautionary notes concerning their use, and related references. The maps provided herein are presented at a scale of approximately 1:150,000 (scale bar provided on maps), and show the full 7.5-minute quadrangle and portions of the adjacent eight quadrangles. They can be used to assist in the specification of earthquake loading conditions for the analysis of ground failure according to the “Simple Prescribed Parameter Value” method (SPPV) described in the site investigation guidelines (California Department of Conservation, 1997). Alternatively, they can be used as a basis for comparing levels of ground motion determined by other methods with the statewide standard.
This section and Sections 1 and 2 (addressing liquefaction and earthquake-induced landslide hazards) constitute a report series that summarizes development of seismic hazard zone maps in the state. Additional information on seismic hazard zone mapping in California can be accessed on DMG’s Internet homepage: http://www.conservation.ca.gov/CGS/index.htm
EARTHQUAKE HAZARD MODEL
The estimated ground shaking is derived from the statewide probabilistic seismic hazard evaluation released cooperatively by the California Department of Conservation, Division of Mines and Geology, and the U.S. Geological Survey (Petersen and others, 1996). That report documents an extensive 3-year effort to obtain consensus within the scientific community regarding fault parameters that characterize the seismic hazard in California. Fault sources included in the model were evaluated for long-term slip rate, maximum earthquake magnitude, and rupture geometry. These fault parameters, along with historical seismicity, were used to estimate return times of moderate to large earthquakes that contribute to the hazard.
The ground shaking levels are estimated for each of the sources included in the seismic source model using attenuation relations that relate earthquake shaking with magnitude, distance from the earthquake, and type of fault rupture (strike-slip, reverse, normal, or subduction). The published hazard evaluation of Petersen and others (1996) only considers uniform firm-rock site conditions. In this report, however, we extend the hazard analysis to include the hazard of exceeding peak horizontal ground acceleration (PGA) at 10% probability of exceedance in 50 years on spatially uniform conditions of rock, soft rock, and alluvium. These soil and rock conditions approximately correspond to site categories defined in Chapter 16 of the Uniform Building Code (ICBO, 1997), which are commonly found in California. We use the attenuation relations of Boore and others (1997), Campbell (1997), Sadigh and others (1997), and Youngs and others (1997) to calculate the ground motions.
The seismic hazard maps for ground shaking are produced by calculating the hazard at sites separated by about 5 km. Figures 3.1 through 3.3 show the hazard for PGA at 10% probability of exceedance in 50 years assuming the entire map area is firm rock, soft rock, or alluvial site conditions respectively. The sites where the hazard is calculated are represented as dots and ground motion contours as shaded regions. The quadrangle of

))))))))))))))))))))))))))))))))))))))))))))))))) ))))))))))))))))))))))))))))))))))))))))))))))))) ))))))))))))))))))))))))))))))))))))))))))))))))) ))))))))))))))))))))))))))))))))))))))))))))))))) )))))))))))))))))))))))))))))))))))))))))))))))))
))))))))))))))))))))))))))))))))))))))))))))))))) ))))))))))))))))))))))))))))))))))))))))))))))))))))))))))))))))))))))))))))))))))))))))))))))))))))))))))))))))))))))))))))))))))))))))))))))))))) )))))))))))))))))))))))))))))))))))))))))))))))))
))))))))))))))))))))))))))))))))))))))))))))))))))))))))))))))))))))))))))))))))))))))))))))))))))))))))))))))))))))))))))))))))))))))))))))))))))) ))))))))))))))))))))))))))))))))))))))))))))))))) )))))))))))))))))))))))))))))))))))))))))))))))))
))))))))))))))))))))))))))))))))))))))))))))))))) ))))))))))))))))))))))))))))))))))))))))))))))))) ))))))))))))))))))))))))))))))))))))))))))))))))) ))))))))))))))))))))))))))))))))))))))))))))))))) )))))))))))))))))))))))))))))))))))))))))))))))))
))))))))))))))))))))))))))))))))))))))))))))))))) ))))))))))))))))))))))))))))))))))))))))))))))))) ))))))))))))))))))))))))))))))))))))))))))))))))) ))))))))))))))))))))))))))))))))))))))))))))))))) )))))))))))))))))))))))))))))))))))))))))))))))))
0.410.410.410.410.410.410.410.410.41 0.410.410.410.410.410.410.410.410.41 0.400.400.400.400.400.400.400.400.40 0.420.420.420.420.420.420.420.420.42 0.460.460.460.460.460.460.460.460.46
0.510.510.510.510.510.510.510.510.51 0.500.500.500.500.500.500.500.500.50 0.500.500.500.500.500.500.500.500.50 0.540.540.540.540.540.540.540.540.54 0.620.620.620.620.620.620.620.620.62
0.660.660.660.660.660.660.660.660.66 0.70.70.70.70.70.70.70.70.7 0.740.740.740.740.740.740.740.740.74 0.800.800.800.800.800.800.800.800.80 0.880.880.880.880.880.880.880.880.88
0.850.850.850.850.850.850.850.850.85 0.980.980.980.980.980.980.980.980.98 1.181.181.181.181.181.181.181.181.18 1.181.181.181.181.181.181.181.181.18 0.910.910.910.910.910.910.910.910.91
1.071.071.071.071.071.071.071.071.07 1.031.031.031.031.031.031.031.031.03 0.930.930.930.930.930.930.930.930.93 0.790.790.790.790.790.790.790.790.79 0.720.720.720.720.720.720.720.720.72
SIMI VALLEY EAST 7.5 MINUTE QUADRANGLE AND PORTIONS OFADJACENT QUADRANGLES
10% EXCEEDANCE IN 50 YEARS PEAK GROUND ACCELERATION (g)
1998FIRM ROCK CONDITIONS
Department of ConservationDivision of Mines and Geology
Figure 3.1
Kilometers
0 2.5 5
Base map modified from MapInfo StreetWorks ©1998 MapInfo Corporation
SEISMIC HAZARD EVALUATION OF THE SIMI VALLEY EAST QUADRANGLE1998 41

))))))))))))))))))))))))))))))))))))))))))))))))) ))))))))))))))))))))))))))))))))))))))))))))))))) ))))))))))))))))))))))))))))))))))))))))))))))))) ))))))))))))))))))))))))))))))))))))))))))))))))) )))))))))))))))))))))))))))))))))))))))))))))))))
)))))))))))))))))))))))))))))))))))))))))))))))))))))))))))))))))))))))))))))))))))))))))))))))))) ))))))))))))))))))))))))))))))))))))))))))))))))) ))))))))))))))))))))))))))))))))))))))))))))))))) )))))))))))))))))))))))))))))))))))))))))))))))))
))))))))))))))))))))))))))))))))))))))))))))))))) ))))))))))))))))))))))))))))))))))))))))))))))))) ))))))))))))))))))))))))))))))))))))))))))))))))) ))))))))))))))))))))))))))))))))))))))))))))))))) )))))))))))))))))))))))))))))))))))))))))))))))))
))))))))))))))))))))))))))))))))))))))))))))))))) ))))))))))))))))))))))))))))))))))))))))))))))))) ))))))))))))))))))))))))))))))))))))))))))))))))) ))))))))))))))))))))))))))))))))))))))))))))))))) )))))))))))))))))))))))))))))))))))))))))))))))))
))))))))))))))))))))))))))))))))))))))))))))))))) ))))))))))))))))))))))))))))))))))))))))))))))))) ))))))))))))))))))))))))))))))))))))))))))))))))) ))))))))))))))))))))))))))))))))))))))))))))))))) )))))))))))))))))))))))))))))))))))))))))))))))))
.42.42.420.420.420.420.420.420.42 0.410.410.410.410.410.410.410.410.41 0.410.410.410.410.410.410.410.410.41 0.410.410.410.410.410.410.410.410.41 0.410.410.410.410.410.410.410.410.41 0.400.400.400.400.400.400.400.400.40
.50.50.500.500.500.500.500.500.50 0.510.510.510.510.510.510.510.510.51 0.50.50.50.50.50.50.50.50.5 0.510.510.510.510.510.510.510.510.51 0.500.500.500.500.500.500.500.500.50 0.500.500.500.500.500.500.500.500.50
.64.64.640.640.640.640.640.640.64 0.630.630.630.630.630.630.630.630.63 0.640.640.640.640.640.640.640.640.64 0.660.660.660.660.660.660.660.660.66 0.70.70.70.70.70.70.70.70.7 0.740.740.740.740.740.740.740.740.74
.88.88.880.880.880.880.880.880.88 0.840.840.840.840.840.840.840.840.84 0.830.830.830.830.830.830.830.830.83 0.850.850.850.850.850.850.850.850.85 0.980.980.980.980.980.980.980.980.98 1.181.181.181.181.181.181.181.181.18
.94.94.940.940.940.940.940.940.94 1.111.111.111.111.111.111.111.111.11 1.231.231.231.231.231.231.231.231.23 1.071.071.071.071.071.071.071.071.07 1.031.031.031.031.031.031.031.031.03 0.930.930.930.930.930.930.930.930.93
SIMI VALLEY WEST 7.5 MINUTE QUADRANGLE AND PORTIONS OFADJACENT QUADRANGLES
10% EXCEEDANCE IN 50 YEARS PEAK GROUND ACCELERATION (g)1998
FIRM ROCK CONDITIONS
Department of ConservationDivision of Mines and Geology
Figure 3.1
Kilometers
0 2.5 5
Base map modified from MapInfo StreetWorks ©1998 MapInfo Corporation
SEISMIC HAZARD EVALUATION OF THE SIMI VALLEY WEST QUADRANGLE 421998

))))))))))))))))))))))))))))))))))))))))))))))))) ))))))))))))))))))))))))))))))))))))))))))))))))) ))))))))))))))))))))))))))))))))))))))))))))))))) ))))))))))))))))))))))))))))))))))))))))))))))))) )))))))))))))))))))))))))))))))))))))))))))))))))
))))))))))))))))))))))))))))))))))))))))))))))))) ))))))))))))))))))))))))))))))))))))))))))))))))) ))))))))))))))))))))))))))))))))))))))))))))))))) ))))))))))))))))))))))))))))))))))))))))))))))))) )))))))))))))))))))))))))))))))))))))))))))))))))
)))))))))))))))))))))))))))))))))))))))))))))))))))))))))))))))))))))))))))))))))))))))))))))))))) ))))))))))))))))))))))))))))))))))))))))))))))))) ))))))))))))))))))))))))))))))))))))))))))))))))) )))))))))))))))))))))))))))))))))))))))))))))))))
))))))))))))))))))))))))))))))))))))))))))))))))) ))))))))))))))))))))))))))))))))))))))))))))))))) ))))))))))))))))))))))))))))))))))))))))))))))))) ))))))))))))))))))))))))))))))))))))))))))))))))) )))))))))))))))))))))))))))))))))))))))))))))))))
))))))))))))))))))))))))))))))))))))))))))))))))) ))))))))))))))))))))))))))))))))))))))))))))))))) ))))))))))))))))))))))))))))))))))))))))))))))))) ))))))))))))))))))))))))))))))))))))))))))))))))) )))))))))))))))))))))))))))))))))))))))))))))))))
0.460.460.460.460.460.460.460.460.46 0.450.450.450.450.450.450.450.450.45 0.450.450.450.450.450.450.450.450.45 0.460.460.460.460.460.460.460.460.46 0.500.500.500.500.500.500.500.500.50
0.560.560.560.560.560.560.560.560.56 0.550.550.550.550.550.550.550.550.55 0.550.550.550.550.550.550.550.550.55 0.600.600.600.600.600.600.600.600.60 0.680.680.680.680.680.680.680.680.68
0.720.720.720.720.720.720.720.720.72 0.760.760.760.760.760.760.760.760.76 0.810.810.810.810.810.810.810.810.81 0.860.860.860.860.860.860.860.860.86 0.940.940.940.940.940.940.940.940.94
0.920.920.920.920.920.920.920.920.92 1.051.051.051.051.051.051.051.051.05 1.231.231.231.231.231.231.231.231.23 1.221.221.221.221.221.221.221.221.22 0.980.980.980.980.980.980.980.980.98
1.131.131.131.131.131.131.131.131.13 1.101.101.101.101.101.101.101.101.10 1.011.011.011.011.011.011.011.011.01 0.860.860.860.860.860.860.860.860.86 0.790.790.790.790.790.790.790.790.79
SIMI VALLEY EAST 7.5 MINUTE QUADRANGLE AND PORTIONS OFADJACENT QUADRANGLES
10% EXCEEDANCE IN 50 YEARS PEAK GROUND ACCELERATION (g)
1998SOFT ROCK CONDITIONS
Department of ConservationDivision of Mines and Geology
Figure 3.2
0 2.5
Kilometers
5
Base map modified from MapInfo StreetWorks © 1998 MapInfo Corporation
DIVISION OF MINES AND GEOLOGY 1998 43

)))))))))))))) ))))))))))))))))))))))))))))))))))))))))))))))))) ))))))))))))))))))))))))))))))))))))))))))))))))) ))))))))))))))))))))))))))))))))))))))))))))))))) ))))))))))))))))))))))))))))))))))))))))))))))))) )))))))))))))))))))))))))))))))))))))))))))))))))
)))))))))))))) ))))))))))))))))))))))))))))))))))))))))))))))))) ))))))))))))))))))))))))))))))))))))))))))))))))) ))))))))))))))))))))))))))))))))))))))))))))))))) ))))))))))))))))))))))))))))))))))))))))))))))))) )))))))))))))))))))))))))))))))))))))))))))))))))
))))))))))))))))))))))))))))))))))))))))))))))))))))))))))))))) ))))))))))))))))))))))))))))))))))))))))))))))))) ))))))))))))))))))))))))))))))))))))))))))))))))) ))))))))))))))))))))))))))))))))))))))))))))))))) )))))))))))))))))))))))))))))))))))))))))))))))))
0.460.460.460.460.460.460.460.460.46 0.460.460.460.460.460.460.460.460.46 0.460.460.460.460.460.460.460.460.46 0.460.460.460.460.460.460.460.460.46 0.450.450.450.450.450.450.450.450.45 0.450.450.450.450.450.450.450.450.45
0.560.560.560.560.560.560.560.560.56 0.560.560.560.560.560.560.560.560.56 0.550.550.550.550.550.550.550.550.55 0.560.560.560.560.560.560.560.560.56 0.550.550.550.550.550.550.550.550.55 0.550.550.550.550.550.550.550.550.55
0.700.700.700.700.700.700.700.700.70 0.690.690.690.690.690.690.690.690.69 0.700.700.700.700.700.700.700.700.70 0.720.720.720.720.720.720.720.720.72 0.760.760.760.760.760.760.760.760.76 0.810.810.810.810.810.810.810.810.81
0.940.940.940.940.940.940.940.940.94 0.910.910.910.910.910.910.910.910.91 0.900.900.900.900.900.900.900.900.90 0.920.920.920.920.920.920.920.920.92 1.051.051.051.051.051.051.051.051.05 1.231.231.231.231.231.231.231.231.23
1.011.011.011.011.011.011.011.011.01 1.171.171.171.171.171.171.171.171.17 1.281.281.281.281.281.281.281.281.28 1.131.131.131.131.131.131.131.131.13 1.101.101.101.101.101.101.101.101.10 1.011.011.011.011.011.011.011.011.01
SIMI VALLEY WEST 7.5 MINUTE QUADRANGLE AND PORTIONS OFADJACENT QUADRANGLES
10% EXCEEDANCE IN 50 YEARS PEAK GROUND ACCELERATION (g)
1998SOFT ROCK CONDITIONS
Department of ConservationDivision of Mines and Geology
Figure 3.2
0 2.5
Kilometers
5
Base map modified from MapInfo StreetWorks © 1998 MapInfo Corporation
DIVISION OF MINES AND GEOLOGY 1998 44

))))))))))))))))))))))))))))))))))))))))))))))))) ))))))))))))))))))))))))))))))))))))))))))))))))))))))))))))))))))))))))))))))))))))))))))))))))))))))))))))))))))))))))))))))))))))))))))))))))))) )))))))))))))))))))))))))))))))))))))))))))))))))
))))))))))))))))))))))))))))))))))))))))))))))))) ))))))))))))))))))))))))))))))))))))))))))))))))) ))))))))))))))))))))))))))))))))))))))))))))))))) ))))))))))))))))))))))))))))))))))))))))))))))))) )))))))))))))))))))))))))))))))))))))))))))))))))
))))))))))))))))))))))))))))))))))))))))))))))))))))))))))))))))))))))))))))))))))))))))))))))))))))))))))))))))))))))))))))))))))))))))))))))))))) ))))))))))))))))))))))))))))))))))))))))))))))))) )))))))))))))))))))))))))))))))))))))))))))))))))
))))))))))))))))))))))))))))))))))))))))))))))))) ))))))))))))))))))))))))))))))))))))))))))))))))) ))))))))))))))))))))))))))))))))))))))))))))))))) ))))))))))))))))))))))))))))))))))))))))))))))))) )))))))))))))))))))))))))))))))))))))))))))))))))
))))))))))))))))))))))))))))))))))))))))))))))))) ))))))))))))))))))))))))))))))))))))))))))))))))) ))))))))))))))))))))))))))))))))))))))))))))))))) ))))))))))))))))))))))))))))))))))))))))))))))))) )))))))))))))))))))))))))))))))))))))))))))))))))
0.510.510.510.510.510.510.510.510.51 0.500.500.500.500.500.500.500.500.50 0.490.490.490.490.490.490.490.490.49 0.510.510.510.510.510.510.510.510.51 0.540.540.540.540.540.540.540.540.54
0.600.600.600.600.600.600.600.600.60 0.590.590.590.590.590.590.590.590.59 0.590.590.590.590.590.590.590.590.59 0.620.620.620.620.620.620.620.620.62 0.670.670.670.670.670.670.670.670.67
0.730.730.730.730.730.730.730.730.73 0.760.760.760.760.760.760.760.760.76 0.780.780.780.780.780.780.780.780.78 0.810.810.810.810.810.810.810.810.81 0.850.850.850.850.850.850.850.850.85
0.870.870.870.870.870.870.870.870.87 0.950.950.950.950.950.950.950.950.95 0.990.990.990.990.990.990.990.990.99 0.980.980.980.980.980.980.980.980.98 0.890.890.890.890.890.890.890.890.89
0.980.980.980.980.980.980.980.980.98 0.980.980.980.980.980.980.980.980.98 0.940.940.940.940.940.940.940.940.94 0.840.840.840.840.840.840.840.840.84 0.790.790.790.790.790.790.790.790.79
SIMI VALLEY EAST 7.5 MINUTE QUADRANGLE AND PORTIONS OFADJACENT QUADRANGLES
10% EXCEEDANCE IN 50 YEARS PEAK GROUND ACCELERATION (g)1998
ALLUVIUM CONDITIONS
Department of ConservationDivision of Mines and Geology
Figure 3.3Kilometers
0 2.5 5
Base map modified from MapInfo Street Works ©1998 MapInfo Corporation
SEISMIC HAZARD EVALUATION OF THE SIMI VALLEY EAST QUADRANGLE1998 45
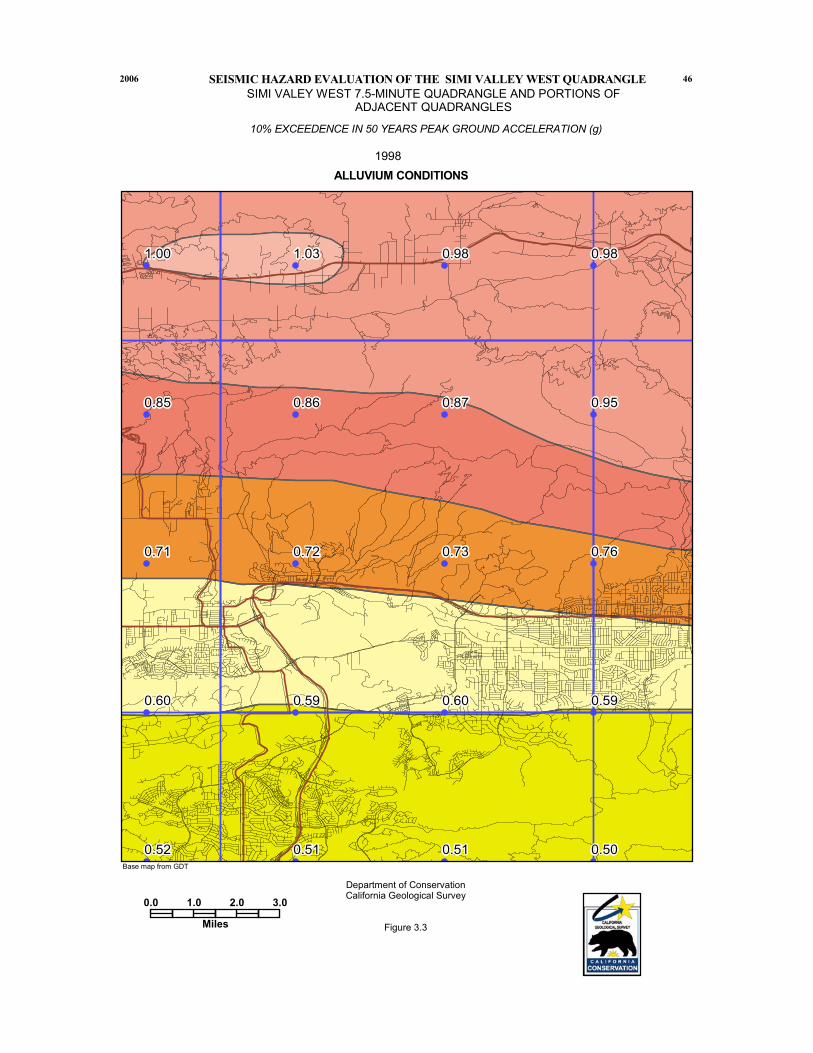
SIMI VALEY WEST 7.5-MINUTE QUADRANGLE AND PORTIONS OFADJACENT QUADRANGLES
10% EXCEEDENCE IN 50 YEARS PEAK GROUND ACCELERATION (g)
1998ALLUVIUM CONDITIONS
2006 46
Department of ConservationCalifornia Geological Survey
Figure 3.3
Base map from GDT
SEISMIC HAZARD EVALUATION OF THE SIMI VALLEY WEST QUADRANGLE
0.0 1.0 2.0 3.0
Miles

2001 SEISMIC HAZARD ZONE REPORT FOR THE SIMI VALLEY QUADRANGLES 47
interest is outlined by bold lines and centered on the map. Portions of the eight adjacent quadrangles are also shown so that the trends in the ground motion may be more apparent. We recommend estimating ground motion values by selecting the map that matches the actual site conditions, and interpolating from the calculated values of PGA rather than the contours, since the points are more accurate.
APPLICATIONS FOR LIQUEFACTION AND LANDSLIDE HAZARD ASSESSMENTS
Deaggregation of the seismic hazard identifies the contribution of each of the earthquakes (various magnitudes and distances) in the model to the ground motion hazard for a particular exposure period (see Cramer and Petersen, 1996). The map in Figure 3.4 identifies the magnitude and the distance (value in parentheses) of the earthquake that contributes most to the hazard at 10% probability of exceedance in 50 years on alluvial site conditions (predominant earthquake). This information gives a rationale for selecting a seismic record or ground motion level in evaluating ground failure. However, it is important to keep in mind that more than one earthquake may contribute significantly to the hazard at a site, and those events can have markedly different magnitudes and distances. For liquefaction hazard the predominant earthquake magnitude from Figure 3.4 and PGA from Figure 3.3 (alluvium conditions) can be used with the Youd and Idriss (1997) approach to estimate cyclic stress ratio demand. For landslide hazard the predominant earthquake magnitude and distance can be used to select a seismic record that is consistent with the hazard for calculating the Newmark displacement (Wilson and Keefer, 1983). When selecting the predominant earthquake magnitude and distance, it is advisable to consider the range of values in the vicinity of the site and perform the ground failure analysis accordingly. This would yield a range in ground failure hazard from which recommendations appropriate to the specific project can be made. Grid values for predominant earthquake magnitude and distance should not be interpolated at the site location, because these parameters are not continuous functions.
USE AND LIMITATIONS
The statewide map of seismic hazard has been developed using regional information and is not appropriate for site specific structural design applications. Use of the ground motion maps prepared at larger scale is limited to estimating earthquake loading conditions for preliminary assessment of ground failure at a specific location. We recommend consideration of site-specific analyses before deciding on the sole use of these maps for several reasons.
1. The seismogenic sources used to generate the peak ground accelerations were digitized from the 1:750,000-scale fault activity map of Jennings (1994). Uncertainties in fault location are estimated to be about 1 to 2 kilometers (Petersen and others, 1996). Therefore, differences in the location of calculated hazard values may also differ by a similar amount. At a specific location, however, the log-linear attenuation

))))))))))))))))))))))))))))))))))))))))))))))))) ))))))))))))))))))))))))))))))))))))))))))))))))) ))))))))))))))))))))))))))))))))))))))))))))))))) ))))))))))))))))))))))))))))))))))))))))))))))))) )))))))))))))))))))))))))))))))))))))))))))))))))
))))))))))))))))))))))))))))))))))))))))))))))))) ))))))))))))))))))))))))))))))))))))))))))))))))) ))))))))))))))))))))))))))))))))))))))))))))))))) ))))))))))))))))))))))))))))))))))))))))))))))))) )))))))))))))))))))))))))))))))))))))))))))))))))
))))))))))))))))))))))))))))))))))))))))))))))))) ))))))))))))))))))))))))))))))))))))))))))))))))) ))))))))))))))))))))))))))))))))))))))))))))))))) ))))))))))))))))))))))))))))))))))))))))))))))))) )))))))))))))))))))))))))))))))))))))))))))))))))
))))))))))))))))))))))))))))))))))))))))))))))))) ))))))))))))))))))))))))))))))))))))))))))))))))) ))))))))))))))))))))))))))))))))))))))))))))))))) ))))))))))))))))))))))))))))))))))))))))))))))))) )))))))))))))))))))))))))))))))))))))))))))))))))
))))))))))))))))))))))))))))))))))))))))))))))))) ))))))))))))))))))))))))))))))))))))))))))))))))) ))))))))))))))))))))))))))))))))))))))))))))))))) ))))))))))))))))))))))))))))))))))))))))))))))))) )))))))))))))))))))))))))))))))))))))))))))))))))
7.37.37.37.37.37.37.37.37.3 7.37.37.37.37.37.37.37.37.3 6.96.96.96.96.96.96.96.96.9 6.96.96.96.96.96.96.96.96.9 6.66.66.66.66.66.66.66.66.6
6.66.66.66.66.66.66.66.66.6 6.66.66.66.66.66.66.66.66.6 6.66.66.66.66.66.66.66.66.6 6.66.66.66.66.66.66.66.66.6 6.66.66.66.66.66.66.66.66.6
6.96.96.96.96.96.96.96.96.9 6.66.66.66.66.66.66.66.66.6 6.66.66.66.66.66.66.66.66.6 6.66.66.66.66.66.66.66.66.6 6.66.66.66.66.66.66.66.66.6
6.96.96.96.96.96.96.96.96.9 6.66.66.66.66.66.66.66.66.6 6.66.66.66.66.66.66.66.66.6 6.66.66.66.66.66.66.66.66.6 6.66.66.66.66.66.66.66.66.6
6.86.86.86.86.86.86.86.86.8 6.66.66.66.66.66.66.66.66.6 6.66.66.66.66.66.66.66.66.6 6.66.66.66.66.66.66.66.66.6 6.66.66.66.66.66.66.66.66.6
(7)(7)(7)(7)(7)(7)(7)(7)(7) (7)(7)(7)(7)(7)(7)(7)(7)(7) (7)(7)(7)(7)(7)(7)(7)(7)(7) (2)(2)(2)(2)(2)(2)(2)(2)(2) (12)(12)(12)(12)(12)(12)(12)(12)(12)
(12)(12)(12)(12)(12)(12)(12)(12)(12) (12)(12)(12)(12)(12)(12)(12)(12)(12) (12)(12)(12)(12)(12)(12)(12)(12)(12) (7)(7)(7)(7)(7)(7)(7)(7)(7) (7)(7)(7)(7)(7)(7)(7)(7)(7)
(2)(2)(2)(2)(2)(2)(2)(2)(2) (7)(7)(7)(7)(7)(7)(7)(7)(7) (7)(7)(7)(7)(7)(7)(7)(7)(7) (2)(2)(2)(2)(2)(2)(2)(2)(2) (2)(2)(2)(2)(2)(2)(2)(2)(2)
(2)(2)(2)(2)(2)(2)(2)(2)(2) (2)(2)(2)(2)(2)(2)(2)(2)(2) (2)(2)(2)(2)(2)(2)(2)(2)(2) (2)(2)(2)(2)(2)(2)(2)(2)(2) (2)(2)(2)(2)(2)(2)(2)(2)(2)
(2)(2)(2)(2)(2)(2)(2)(2)(2) (2)(2)(2)(2)(2)(2)(2)(2)(2) (2)(2)(2)(2)(2)(2)(2)(2)(2) (2)(2)(2)(2)(2)(2)(2)(2)(2) (2)(2)(2)(2)(2)(2)(2)(2)(2)
SIMI VALLEY EAST 7.5 MINUTE QUADRANGLE AND PORTIONS OFADJACENT QUADRANGLES
10% EXCEEDANCE IN 50 YEARS PEAK GROUND ACCELERATION
1998PREDOMINANT EARTHQUAKE Magnitude (Mw) (Distance (km))
Department of ConservationDivision of Mines and Geology
0 2.5
Kilometers
5
Figure 3.4
Base map modified from MapInfo StreetWorks ©1998 MapInfo Corporation
SEISMIC HAZARD EVALUATION OF THE SIMI VALLEY EAST QUADRANGLE1998 48

))))))))))))))))))))))))))))))))))))))))))))))))) ))))))))))))))))))))))))))))))))))))))))))))))))) ))))))))))))))))))))))))))))))))))))))))))))))))) ))))))))))))))))))))))))))))))))))))))))))))))))) ))))))))))))))))))))))))))))))))))))))))))))))))) )))))))))))))))))))))))))))))))))))))))))))))))))
))))))))))))))))))))))))))))))))))))))))))))))))) ))))))))))))))))))))))))))))))))))))))))))))))))) ))))))))))))))))))))))))))))))))))))))))))))))))) ))))))))))))))))))))))))))))))))))))))))))))))))) ))))))))))))))))))))))))))))))))))))))))))))))))) )))))))))))))))))))))))))))))))))))))))))))))))))
))))))))))))))))))))))))))))))))))))))))))))))))) ))))))))))))))))))))))))))))))))))))))))))))))))) ))))))))))))))))))))))))))))))))))))))))))))))))) ))))))))))))))))))))))))))))))))))))))))))))))))) ))))))))))))))))))))))))))))))))))))))))))))))))) )))))))))))))))))))))))))))))))))))))))))))))))))
))))))))))))))))))))))))))))))))))))))))))))))))) ))))))))))))))))))))))))))))))))))))))))))))))))) ))))))))))))))))))))))))))))))))))))))))))))))))) ))))))))))))))))))))))))))))))))))))))))))))))))) ))))))))))))))))))))))))))))))))))))))))))))))))) )))))))))))))))))))))))))))))))))))))))))))))))))
))))))))))))))))))))))))))))))))))))))))))))))))) ))))))))))))))))))))))))))))))))))))))))))))))))) ))))))))))))))))))))))))))))))))))))))))))))))))) ))))))))))))))))))))))))))))))))))))))))))))))))) ))))))))))))))))))))))))))))))))))))))))))))))))) )))))))))))))))))))))))))))))))))))))))))))))))))
7.37.37.37.37.37.37.37.37.3 7.37.37.37.37.37.37.37.37.3 7.37.37.37.37.37.37.37.37.3 7.37.37.37.37.37.37.37.37.3 7.37.37.37.37.37.37.37.37.3 6.96.96.96.96.96.96.96.96.9
6.96.96.96.96.96.96.96.96.9 6.96.96.96.96.96.96.96.96.9 6.96.96.96.96.96.96.96.96.9 6.66.66.66.66.66.66.66.66.6 6.66.66.66.66.66.66.66.66.6 6.66.66.66.66.66.66.66.66.6
6.96.96.96.96.96.96.96.96.9 6.96.96.96.96.96.96.96.96.9 6.96.96.96.96.96.96.96.96.9 6.96.96.96.96.96.96.96.96.9 6.66.66.66.66.66.66.66.66.6 6.66.66.66.66.66.66.66.66.6
6.96.96.96.96.96.96.96.96.9 6.96.96.96.96.96.96.96.96.9 6.96.96.96.96.96.96.96.96.9 6.96.96.96.96.96.96.96.96.9 6.66.66.66.66.66.66.66.66.6 6.66.66.66.66.66.66.66.66.6
6.86.86.86.86.86.86.86.86.8 6.86.86.86.86.86.86.86.86.8 6.86.86.86.86.86.86.86.86.8 6.86.86.86.86.86.86.86.86.8 6.66.66.66.66.66.66.66.66.6 6.66.66.66.66.66.66.66.66.6
(7)(7)(7)(7)(7)(7)(7)(7)(7) (7)(7)(7)(7)(7)(7)(7)(7)(7) (7)(7)(7)(7)(7)(7)(7)(7)(7) (7)(7)(7)(7)(7)(7)(7)(7)(7) (7)(7)(7)(7)(7)(7)(7)(7)(7) (7)(7)(7)(7)(7)(7)(7)(7)(7)
(7)(7)(7)(7)(7)(7)(7)(7)(7) (7)(7)(7)(7)(7)(7)(7)(7)(7) (7)(7)(7)(7)(7)(7)(7)(7)(7) (12)(12)(12)(12)(12)(12)(12)(12)(12) (12)(12)(12)(12)(12)(12)(12)(12)(12) (12)(12)(12)(12)(12)(12)(12)(12)(12)
(2)(2)(2)(2)(2)(2)(2)(2)(2) (2)(2)(2)(2)(2)(2)(2)(2)(2) (2)(2)(2)(2)(2)(2)(2)(2)(2) (2)(2)(2)(2)(2)(2)(2)(2)(2) (7)(7)(7)(7)(7)(7)(7)(7)(7) (7)(7)(7)(7)(7)(7)(7)(7)(7)
(2)(2)(2)(2)(2)(2)(2)(2)(2) (2)(2)(2)(2)(2)(2)(2)(2)(2) (2)(2)(2)(2)(2)(2)(2)(2)(2) (2)(2)(2)(2)(2)(2)(2)(2)(2) (2)(2)(2)(2)(2)(2)(2)(2)(2) (2)(2)(2)(2)(2)(2)(2)(2)(2)
(2)(2)(2)(2)(2)(2)(2)(2)(2) (2)(2)(2)(2)(2)(2)(2)(2)(2) (2)(2)(2)(2)(2)(2)(2)(2)(2) (2)(2)(2)(2)(2)(2)(2)(2)(2) (2)(2)(2)(2)(2)(2)(2)(2)(2) (2)(2)(2)(2)(2)(2)(2)(2)(2)
SIMI VALLEY WEST 7.5 MINUTE QUADRANGLE AND PORTIONS OFADJACENT QUADRANGLES
10% EXCEEDANCE IN 50 YEARS PEAK GROUND ACCELERATION
1998PREDOMINANT EARTHQUAKE Magnitude (Mw) (Distance (km))
Department of ConservationDivision of Mines and Geology
0 2.5
Kilometers
5
Figure 3.4
Base map modified from MapInfo StreetWorks ©1998 MapInfo Corporation
SEISMIC HAZARD EVALUATION OF THE SIMI VALLEY WEST QUADRANGLE1998 49
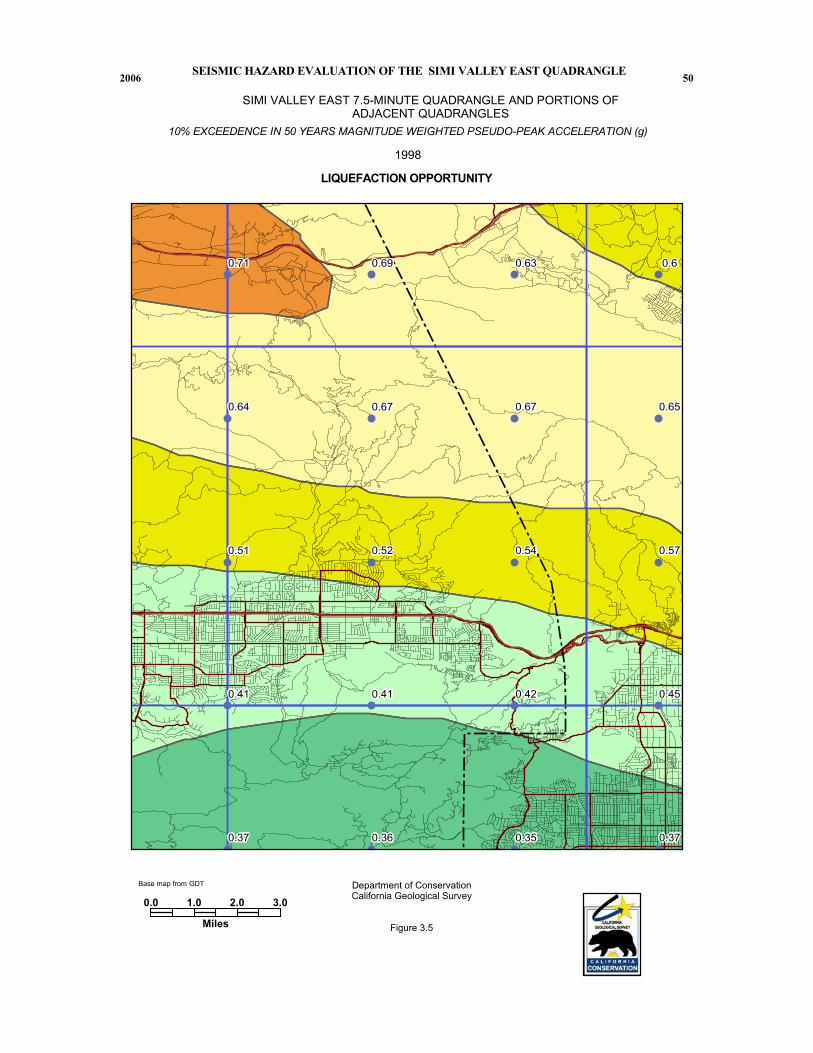
SEISMIC HAZARD EVALUATION OF THE SIMI VALLEY EAST QUADRANGLE
SIMI VALLEY EAST 7.5-MINUTE QUADRANGLE AND PORTIONS OFADJACENT QUADRANGLES
1998
LIQUEFACTION OPPORTUNITY
2006 50
Department of ConservationCalifornia Geological Survey
Figure 3.5
Base map from GDT
10% EXCEEDENCE IN 50 YEARS MAGNITUDE WEIGHTED PSEUDO-PEAK ACCELERATION (g)
0.0 1.0 2.0 3.0
Miles
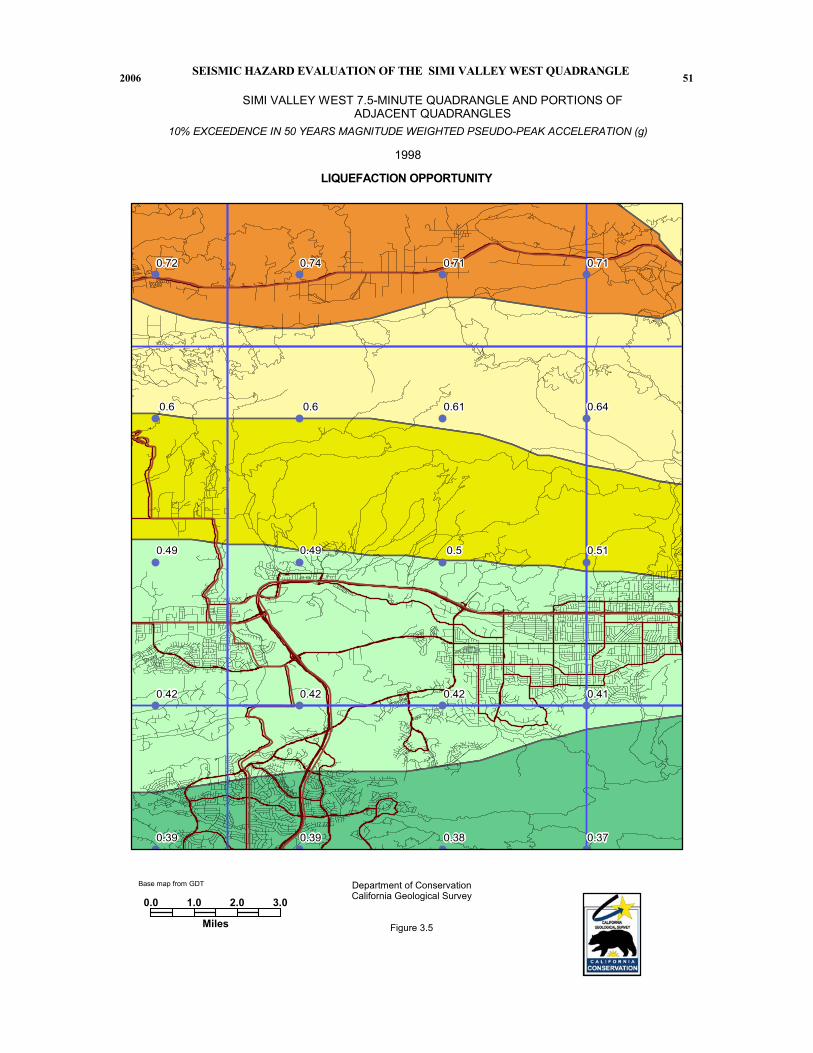
SEISMIC HAZARD EVALUATION OF THE SIMI VALLEY WEST QUADRANGLE
SIMI VALLEY WEST 7.5-MINUTE QUADRANGLE AND PORTIONS OFADJACENT QUADRANGLES
1998
LIQUEFACTION OPPORTUNITY
2006 51
Department of ConservationCalifornia Geological Survey
Figure 3.5
Base map from GDT
10% EXCEEDENCE IN 50 YEARS MAGNITUDE WEIGHTED PSEUDO-PEAK ACCELERATION (g)
0.0 1.0 2.0 3.0
Miles
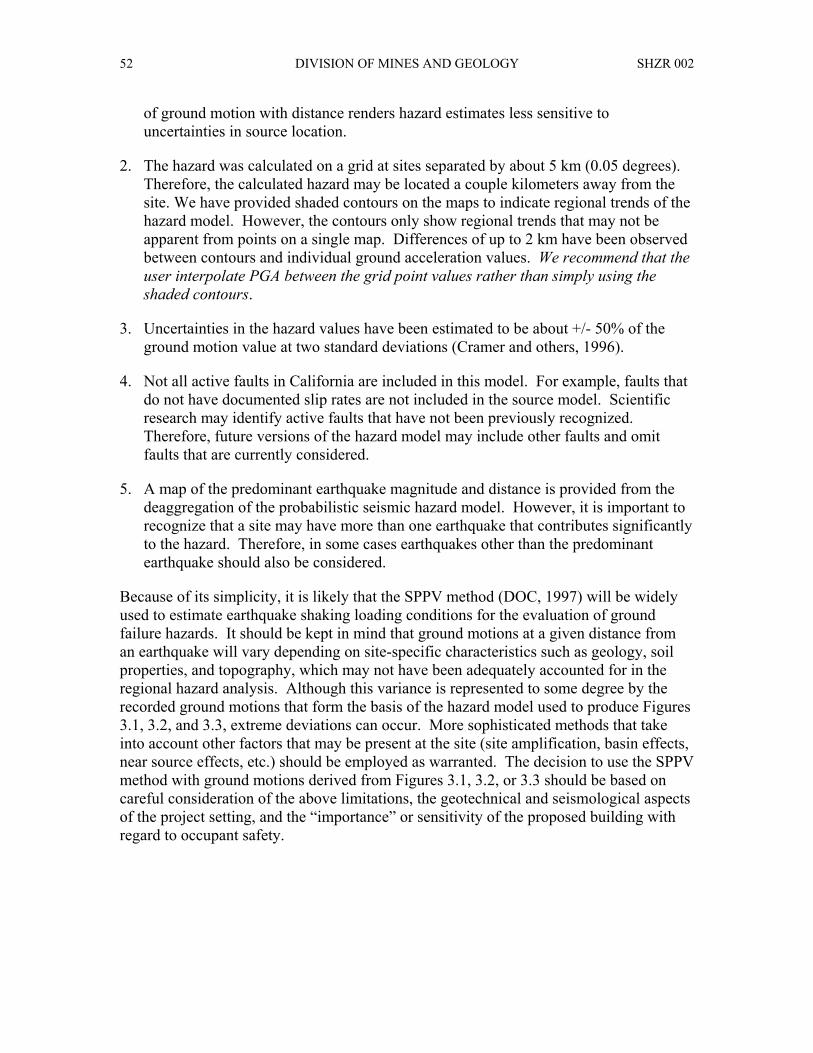
DIVISION OF MINES AND GEOLOGY SHZR 002 52
of ground motion with distance renders hazard estimates less sensitive to uncertainties in source location.
2. The hazard was calculated on a grid at sites separated by about 5 km (0.05 degrees). Therefore, the calculated hazard may be located a couple kilometers away from the site. We have provided shaded contours on the maps to indicate regional trends of the hazard model. However, the contours only show regional trends that may not be apparent from points on a single map. Differences of up to 2 km have been observed between contours and individual ground acceleration values. We recommend that the user interpolate PGA between the grid point values rather than simply using the shaded contours.
3. Uncertainties in the hazard values have been estimated to be about +/- 50% of the ground motion value at two standard deviations (Cramer and others, 1996).
4. Not all active faults in California are included in this model. For example, faults that do not have documented slip rates are not included in the source model. Scientific research may identify active faults that have not been previously recognized. Therefore, future versions of the hazard model may include other faults and omit faults that are currently considered.
5. A map of the predominant earthquake magnitude and distance is provided from the deaggregation of the probabilistic seismic hazard model. However, it is important to recognize that a site may have more than one earthquake that contributes significantly to the hazard. Therefore, in some cases earthquakes other than the predominant earthquake should also be considered.
Because of its simplicity, it is likely that the SPPV method (DOC, 1997) will be widely used to estimate earthquake shaking loading conditions for the evaluation of ground failure hazards. It should be kept in mind that ground motions at a given distance from an earthquake will vary depending on site-specific characteristics such as geology, soil properties, and topography, which may not have been adequately accounted for in the regional hazard analysis. Although this variance is represented to some degree by the recorded ground motions that form the basis of the hazard model used to produce Figures 3.1, 3.2, and 3.3, extreme deviations can occur. More sophisticated methods that take into account other factors that may be present at the site (site amplification, basin effects, near source effects, etc.) should be employed as warranted. The decision to use the SPPV method with ground motions derived from Figures 3.1, 3.2, or 3.3 should be based on careful consideration of the above limitations, the geotechnical and seismological aspects of the project setting, and the “importance” or sensitivity of the proposed building with regard to occupant safety.

2001 SEISMIC HAZARD ZONE REPORT FOR THE SIMI VALLEY QUADRANGLES 53
REFERENCES
Boore, D.M., Joyner, W.B. and Fumal, T.E., 1997, Empirical near-source attenuation relationships for horizontal and vertical components of peak ground acceleration, peak ground velocity, and pseudo-absolute acceleration response spectra: Seismological Research Letters, v. 68, p. 154-179.
California Department of Conservation, Division of Mines and Geology, 1997, Guidelines for evaluating and mitigating seismic hazards in California: Special Publication 117, 74 p.
Campbell, K.W., 1997, Attenuation relationships for shallow crustal earthquakes based on California strong motion data: Seismological Research Letters, v. 68, p. 180-189.
Cramer, C.H. and Petersen, M.D., 1996, Predominant seismic source distance and magnitude maps for Los Angeles, Orange and Ventura counties, California: Bulletin of the Seismological Society of America, v. 85, no. 5, p. 1645-1649.
Cramer, C.H., Petersen, M.D. and Reichle, M.S., 1996, A Monte Carlo approach in estimating uncertainty for a seismic hazard assessment of Los Angeles, Ventura, and Orange counties, California: Bulletin of the Seismological Society of America, v. 86, p. 1681-1691.
International Conference of Building Officials (ICBO), 1997, Uniform Building Code: v. 2, Structural engineering and installation standards, 492 p.
Jennings, C.W., compiler, 1994, Fault activity map of California and adjacent areas: California Department of Conservation, Division of Mines and Geology, California Geologic Data Map Series, map no. 8.
Petersen, M.D., Cramer, C.H., Bryant, W.A., Reichle, M.S. and Toppozada, T.R., 1996, Preliminary seismic hazard assessment for Los Angeles, Ventura, and Orange counties, affected by the 17 January 1994 Northridge earthquake: Bulletin of the Seismological Society of America, v. 86, no. 1B, p. S247-S261.
Sadigh, K., Chang, C.-Y., Egan, J.A., Makdisi, F. and Youngs, R.R., 1997, SEA96- A new predictive relation for earthquake ground motions in extensional tectonic regimes: Seismological Research Letters, v. 68, p. 190-198.
Wilson, R.C. and Keefer, D.K., 1983, Dynamic analysis of a slope failure from the 1979 Coyote Lake, California, Earthquake: Bulletin of the Seismological Society of America, v. 73, p. 863-877.
Youd, T.L. and Idriss I.M., 1997, Proceedings of the NCEER workshop on evaluation of liquefaction resistance of soils: Technical Report NCEER-97-0022, 40 p.
Youngs, R.R., Chiou, S.-J., Silva, W.J. and Humphrey, J.R., 1997, Stochastic point-source modeling of ground motions in the Cascadia Region: Seismological Research Letters, v. 68, p. 74-85.


