new madrid seismic zone: overview of earthquake hazard and
TRANSCRIPT

U.S. Department of Housing and Urban Development
Office of Policy Development and Research
NEW MADRID SEISMIC ZONE: OVERVIEW OF EARTHQUAKE HAZARD
AND MAGNITUDE ASSESSMENT BASED ON FRAGILITY
OF HISTORIC STRUCTURES
May 2003

PATH (Partnership for Advancing Technology in Housing) is a new private/public effort to develop, demonstrate, and gain widespread market acceptance for the “Next Generation” of American housing. Through the use of new or innovative technologies, the goal of PATH is to improve the quality, durability, environmental efficiency, and affordability of tomorrow’s homes. PATH is managed and supported by the Department of Housing and Urban Development (HUD). In addition, all Federal Agencies that engage in housing research and technology development are PATH Partners, including the Departments of Energy and Commerce, as well as the Environmental Protection Agency (EPA) and the Federal Emergency Management Agency (FEMA). State and local governments and other participants from the public sector are also partners in PATH. Product manufacturers, home builders, insurance companies, and lenders represent private industry in the PATH Partnership. To learn more about PATH, please contact:
451 7th Street, SW Washington, DC 20410 202-708-5873 (fax) e-mail: [email protected] website: www.pathnet.org Visit PD&R's Web Site www.huduser.org to find this report and others sponsored by HUD's Office of Policy Development and Research (PD&R). Other services of HUD USER, PD&R's Research Information Service, include listservs; special interest, bimonthly publications (best practices, significant studies from other sources); access to public use databases; and hotline 1-800-245-2691 for help accessing the information you need.

NEW MADRID SEISMIC ZONE: OVERVIEW OF EARTHQUAKE HAZARD
AND MAGNITUDE ASSESSMENT BASED ON FRAGILITY
OF HISTORIC STRUCTURES
Prepared for
U.S. Department of Housing and Urban Development Washington, DC
by
NAHB Research Center Upper Marlboro, MD
May 2003


TABLE OF CONTENTS
PAGE Acknowledgments.......................................................................................................................... ix Executive Summary ....................................................................................................................... xi 1.0 Introduction..........................................................................................................................1
1.1 General.....................................................................................................................1 1.2 Scope and Objectives...............................................................................................2 1.3 Document Organization ...........................................................................................2 1.4 Definitions................................................................................................................3
2.0 Background..........................................................................................................................5
2.1 Earthquake Hazard and Residential Buildings ........................................................5 2.2 New Madrid Seismic Zone ......................................................................................7 2.3 History of Design Seismic Map Development in the United States........................8 2.4 Modern Seismic Design Philosophy......................................................................13
3.0 Evaluation of the Recurrence Interval and Magnitude of Characteristic Events in the
NMSZ ................................................................................................................................17 3.1 Recurrence Interval Estimation..............................................................................17 3.2 Magnitude of 1811-1812 Earthquakes...................................................................20
4.0 Sensitivity Studies..............................................................................................................34
4.1 Background............................................................................................................34 4.2 Sensitivity Studies for the NMSZ..........................................................................35
5.0 Deterministic Ground Motions ..........................................................................................38 6.0 Summary, Conclusions, and Recommendations................................................................41 7.0 References..........................................................................................................................44 Appendix A - Survey of Historic Buildings in Missouri, Kentucky, and Illinois that Predate the 1811-1812 New Madrid Earthquakes Appendix B - Accounts of Structural Damage from the 1811-1812 New Madrid Earthquakes Appendix C - Probabilistic Seismic Hazard Analysis
iii

iv
LIST OF TABLES
PAGE Table 1 Seismic Design Category Classifications From IRC-2000............................................6 Table 2 Mean Recurrence Interval for Three Characteristic Earthquakes in the New Madrid
Seismic Zone ...............................................................................................................20 Table 3 Magnitude Estimates for the 1811-1812 New Madrid Earthquake Sequence .............21 Table 4 Isoseismals Used for Development of MMI – M Correlations....................................22 Table 5 Results of Monte Carlo Simulation of Chimney Damage ...........................................31 Table 6 Results of Structural Damage Analysis for Ste. Genevieve, MO ................................33 Table 7 Validation of the RC Code...........................................................................................36 Table 8 Results of Sensitivity Study 1 ......................................................................................37 Table 9 Results of Sensitivity Study 2 ......................................................................................38 Table 10 Deterministic Short Period (0.2 Sec) Ground Motions for Selected Locations...........41
v

vi

LIST OF FIGURES
PAGE Figure 1 Approximate Locations of NMSZ Earthquakes with M≥6.0 Since 1700......................8 Figure 2 Seismic Hazard Map of the United States Developed by Ulrich...................................9 Figure 3 Seismic Hazard Map of the United States Developed by Algermissen.......................10 Figure 4 Seismic Hazard Map of the United States Adopted by 1979 UBC .............................10 Figure 5 Probabilistic Hazard Map (PGA) of the United States Developed by Algermissen and
Perkins (10 Percent Probability of Exceedance in 50 Years) ......................................11 Figure 6 ATC Probabilistic Hazard Map (PGA) of the United States (10 Percent Probability of
Exceedance in 50 Years) .............................................................................................12 Figure 7 1996 USGS Probabilistic Hazard Map (PGA) of the United States (2 Percent
Probability of Exceedance in 50 Years) ......................................................................13 Figure 8 Rationale for the 1997 NEHRP Design Map...............................................................15 Figure 9 Hazard Curves for Various US Cities based on the 1996 USGS methodology ..........16 Figure 10 Sites With Damage Accounts Due to the 1811-1812 Earthquakes .............................27 Figure 11 Distribution of Sites With Structural Damage by Distance.........................................28 Figure 12 Fragility Functions for Brick Chimneys Modeled with Cumulative Lognormal
Distribution ..................................................................................................................30 Figure 13 Relationship Between Load and Resistance Distribution Functions...........................31 Figure 14 De-Aggregation of Hazard by Characteristic and Historic Seismicity Models...........40
vii

viii

Acknowledgments This report was prepared by the NAHB Research Center under contract with the U.S. Department of Housing and Urban Development (HUD) and National Association of Home Builders (NAHB). The document was authored by Vladimir G. Kochkin and Jay H. Crandell (P.E.). Jeffrey Taggart is acknowledged for his effort in locating historic buildings and assistance in conducting field studies. G. Robert Fuller (P.E.) is also acknowledged for support in documenting and evaluating historic structures. Lynda Marchman provided administrative support. The following individuals are recognized for their contribution of information and time in conducting the historic building survey:
Tim Conley, Ste. Genevieve, MO Molly McKenzie, Illinois Historic Preservation Agency Jim Baker, Missouri State Department of Natural Resources
In addition, the authors are indebted to the several historic building owners, historians, park service and historic society personnel, and friends who welcomed our presence, contributed useful information, and showed interest in our endeavor. Finally, the authors are indebted to the several expert reviewers who were willing to provide their candid criticism and encouragement that helped improve the report.
Author’s note It is recognized that this document attempts to serve a dual role as a technical research paper as well as a meaningful communication instrument between seismic hazard assessment experts and a segment of end-users such as the U.S. home building industry. Any failure to fully meet both of these objectives is solely the responsibility of the authors. However, it is our belief that communicating both technical merits and viewpoints are important parts of any study of this nature and it is only through this process of scientific analysis and discussion that a more meaningful and objective understanding is obtained.
ix

x

Executive Summary The assessment of earthquake hazard has been a long-standing concern in areas known to be prone to earthquakes. While housing construction in the United States is generally considered to be earthquake-resistant in comparison to many forms of construction found worldwide, the assessment of seismic hazard has significant implications with regard to the balance of housing affordability and safety. Seismic hazard assessments affect building code design requirements (i.e., mapped design ground motions), construction guidelines, building costs, insurance rates, expected consequences of future earthquake activity, and regional economies as a whole. Therefore, a practical and accurate seismic hazard assessment is a critical first step in establishing impacts to residential and commercial building design and construction costs that are commensurate with the economic and life-safety consequences of estimated seismic hazard. Recent advances in seismic hazard characterization and earthquake engineering have culminated in the seismic design provisions of the International Building Code (IBC-2000) [24] and the International Residential Code (IRC-2000) [25]. As both codes are currently being considered for adoption by local political jurisdictions across the United States, they have generated much concern and controversy as to the accuracy and validity of the new seismic provisions in the Central and Eastern United States (CEUS) and particularly in the New Madrid Seismic Zone (NMSZ). The design level of ground motion in the NMSZ exceeds that determined for many active seismic regions of California and represents a significant increase from historically used values. This study provides an overview of the seismic hazard characterization procedures used in the NMSZ and implemented in the IBC-2000 and IRC-2000. Furthermore, a series of structural fragility evaluations of historic accounts of building damage are conducted to provide additional and independent constraints on the magnitude estimates of the 1811-1812 earthquakes. This approach to magnitude assessment is particularly appealing given that the magnitude estimate is ultimately used for regulation of building construction through the use of seismic hazard maps that are integral with seismic design provisions in modern building codes. The specific objectives of the study are to:
• contribute to a constructive dialog between the seismic engineering community and the home building industry;
• review the seismic hazard assessment procedures for the NMSZ; • communicate the level of uncertainties involved in the seismic hazard assessment
procedures and their impact on the assignment of seismic design ground motions and categories;
• survey existing structures that survived the 1811-1812 earthquakes to better understand the seismic vulnerability of historic buildings;
• conduct probabilistic and deterministic structural fragility evaluations of historic structures to develop independent constraints on the magnitude of the 1811-1812 earthquakes; and,
• provide recommendations regarding implications associated with adoption or modification of newer seismic hazard provisions found in the IBC-2000 and IRC-2000 .
xi
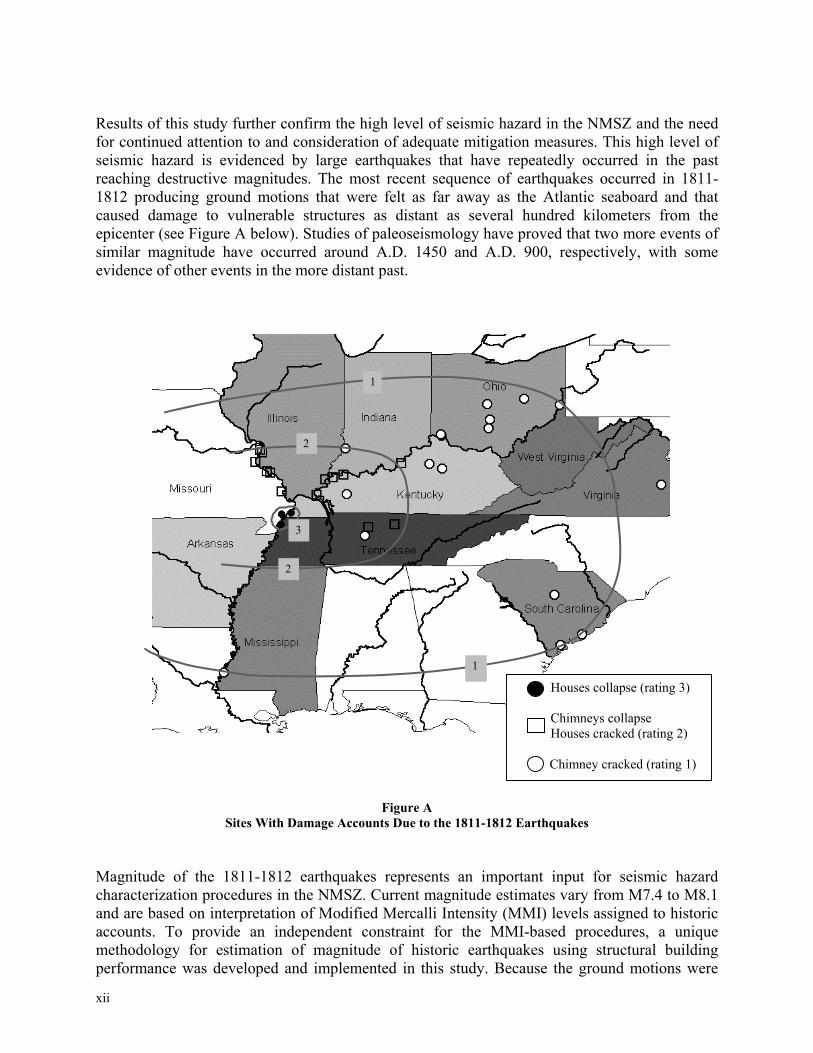
Results of this study further confirm the high level of seismic hazard in the NMSZ and the need for continued attention to and consideration of adequate mitigation measures. This high level of seismic hazard is evidenced by large earthquakes that have repeatedly occurred in the past reaching destructive magnitudes. The most recent sequence of earthquakes occurred in 1811-1812 producing ground motions that were felt as far away as the Atlantic seaboard and that caused damage to vulnerable structures as distant as several hundred kilometers from the epicenter (see Figure A below). Studies of paleoseismology have proved that two more events of similar magnitude have occurred around A.D. 1450 and A.D. 900, respectively, with some evidence of other events in the more distant past.
3
1
1
2
2
Houses collapse (rating 3) Chimneys collapse Houses cracked (rating 2) Chimney cracked (rating 1)
Figure A
Sites With Damage Accounts Due to the 1811-1812 Earthquakes Magnitude of the 1811-1812 earthquakes represents an important input for seismic hazard characterization procedures in the NMSZ. Current magnitude estimates vary from M7.4 to M8.1 and are based on interpretation of Modified Mercalli Intensity (MMI) levels assigned to historic accounts. To provide an independent constraint for the MMI-based procedures, a unique methodology for estimation of magnitude of historic earthquakes using structural building performance was developed and implemented in this study. Because the ground motions were
xii
determined from the attenuation functions used with the current hazard characterization procedures, the proposed methodology helped close the loop between the magnitude estimation procedures based on building vulnerability and implementation of the results in building codes where concepts of seismic hazard and building vulnerability are integrated into structural design methods that are calibrated to an acceptable level of risk. Results of structural analysis supported the lower bound of existing magnitude estimates of the 1811-1812 earthquakes, i.e., M7.4-M7.5. The implementation of this magnitude estimate in lieu of M7.7 (current magnitude in [19]) will result in a decrease of the design ground motions by about 12-17 percent in the areas in the close vicinity of the modeled faults such as Memphis, TN. This effect diminishes with distance and is practically undetectable in St. Louis, MO. A sensitivity analysis has shown that for locations in a close vicinity to the NMSZ, such as Memphis, TN, it is possible to underestimate or overestimate hazard by as much as one seismic design category just due to uncertainty in a fairly narrow range of credible estimates of the magnitude and recurrence interval of the characteristic model. This effect diminishes with distance such that hazard in St. Louis is practically insensitive to this range of characteristic model scenarios. Another sensitivity study was performed on the effect of the level of attenuated ground motion variability where hazard is dominated by large amplitude ground motions indicating that more research is warranted in this area to improve the accuracy of hazard estimates in the NMSZ. The specific conclusions of this study include:
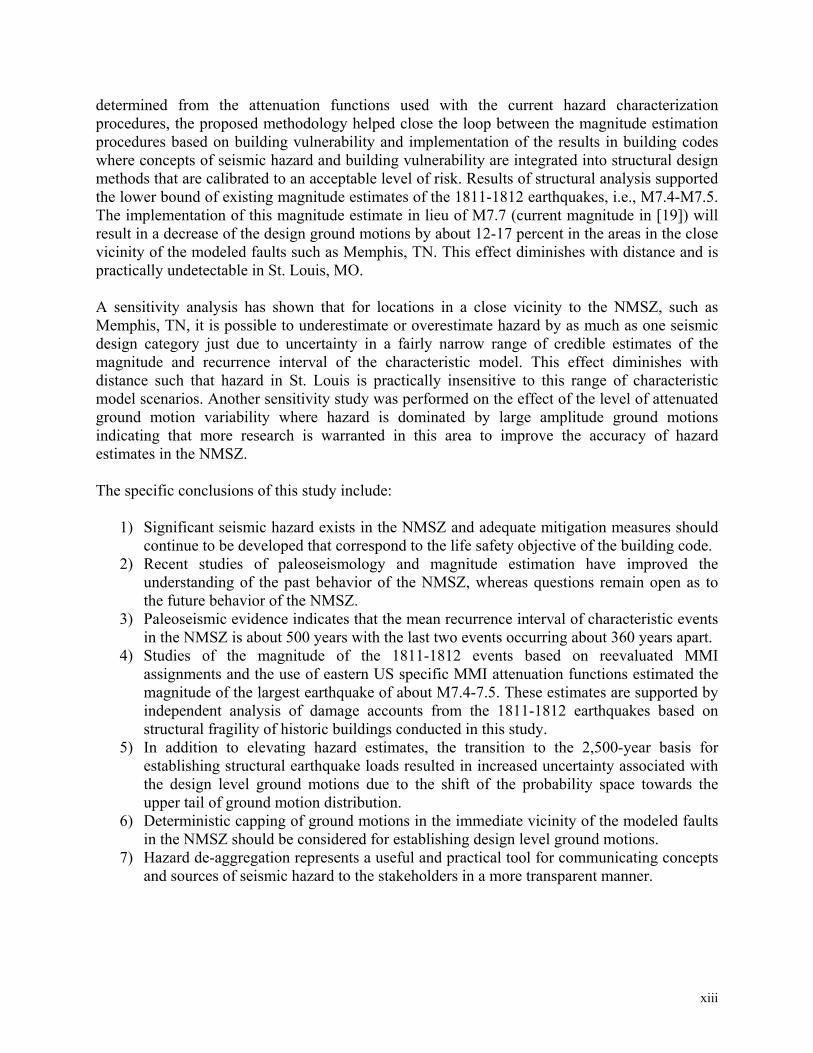
1) Significant seismic hazard exists in the NMSZ and adequate mitigation measures should continue to be developed that correspond to the life safety objective of the building code.
2) Recent studies of paleoseismology and magnitude estimation have improved the understanding of the past behavior of the NMSZ, whereas questions remain open as to the future behavior of the NMSZ.
3) Paleoseismic evidence indicates that the mean recurrence interval of characteristic events in the NMSZ is about 500 years with the last two events occurring about 360 years apart.
4) Studies of the magnitude of the 1811-1812 events based on reevaluated MMI assignments and the use of eastern US specific MMI attenuation functions estimated the magnitude of the largest earthquake of about M7.4-7.5. These estimates are supported by independent analysis of damage accounts from the 1811-1812 earthquakes based on structural fragility of historic buildings conducted in this study.
5) In addition to elevating hazard estimates, the transition to the 2,500-year basis for establishing structural earthquake loads resulted in increased uncertainty associated with the design level ground motions due to the shift of the probability space towards the upper tail of ground motion distribution.
6) Deterministic capping of ground motions in the immediate vicinity of the modeled faults in the NMSZ should be considered for establishing design level ground motions.
7) Hazard de-aggregation represents a useful and practical tool for communicating concepts and sources of seismic hazard to the stakeholders in a more transparent manner.
xiii

Based on the findings of this study, the following recommendations warrant attention and should be assigned high priority for future research and implementation:
1) Future post-earthquake damage assessments and building evaluations should proceed in a manner where statistically representative data is obtained and evaluated using structural reliability and fragility principles as applied in this study to the earthquakes of 1811-1812. Such studies will help to integrate seismic hazard parameters and building vulnerability parameters such that the “lessons learned” will become facts that guide future building code developments based on a robust and repeatable scientific method rather than subjective observations and perceptions from damages to individual vulnerable structures.
2) More research should be focused on understanding the relationship between the ground motion amplitude and the level of observed ground motion variability in the CEUS and NMSZ as well as the impact of site effects on the level of variability relative to building code-prescribed site amplification factors.
3) Expand the implementation of the structural fragility analysis methodology used in this study to include additional locations affected by the 1811-1812 earthquakes and other historical earthquakes such as the 1886 Charleston, SC event to improve magnitude estimates and foster a better understanding of earthquake effects in these regions.
4) In the event of a future destructive earthquake in the NMSZ, the historic buildings used in this study (see Appendix A) should serve as a point for correlation to past events.
xiv

1.0 Introduction 1.1 GENERAL Recent advances in seismic hazard characterization and earthquake engineering have culminated in the seismic design provisions of the International Building Code (IBC-2000) [24] and the International Residential Code (IRC-2000) [25]. As both codes are currently being considered for adoption by local political jurisdictions across the United States, they have generated much concern and controversy as to the accuracy and validity of the new seismic provisions in the Central and Eastern United States (CEUS) and particularly in the New Madrid Seismic Zone (NMSZ). The design level of ground motion in the NMSZ exceeds that determined for many active seismic regions of California and represents a significant increase from historically used values. Because seismic waves can propagate large distances in the CEUS, seismic hazard associated with the NMSZ affects a vast territory with multiple states including Missouri, Illinois, Indiana, Kentucky, Tennessee, Arkansas, Mississippi, and Alabama. Yet, the people residing in these states have no personal earthquake experience and can not easily relate the proposed mitigation measures with their perception of hazard based on previous accepted practices. For these and other reasons, local reactions in states surrounding the NMSZ have ranged from acceptance to total rejection of the new seismic provisions. In one case, the result may be considered as unconservative by exposing local communities to a continuation of existing levels of vulnerability. In another case, the outcome is often considered by many code users and the public as too conservative causing economic impacts that are not commensurate with the perceived consequences of future earthquakes. The ramifications of these recent changes to seismic design provisions and hazard assessment in the NMSZ warrant careful inquiry to appropriately moderate extreme local reactions and to effectively identify and communicate where future improvements are justified. Some of the ramifications include requirements for advanced structural solutions, increased cost of construction, rising insurances rates, consequences of future earthquakes, etc. A combination of these factors can have a significant impact on the local economy in general and even on the average consumer. Therefore, it is important that the basis for the newer seismic provisions is fully communicated to the building code user in a manner that can be understood and properly handled in the court of public opinion. One of the incentives for this study was to contribute to a better understanding of the issue by a major stakeholder, i.e., the U.S. homebuilding industry. Seismic hazard estimates in the NMSZ are primarily based on historic accounts of the 1811-1812 New Madrid earthquakes and paleoseismic studies of prehistoric events. Because of the inherent ambiguity attributed to these types of data, the seismic hazard estimates that form the basis for building code provisions are not well constrained. The key input variables that contribute to the overall uncertainty in the NMSZ, among other factors, are magnitude of the 1811-1812 New Madrid earthquakes, recurrence interval of characteristic earthquakes, magnitude of prehistoric earthquakes, ground motion attenuation functions, measure of ground motion variability (σ), and the location of future events. Although recent studies have improved our knowledge of the history of seismic hazard in the NMSZ, questions remain open with respect to the hazard estimates and appropriate use of these estimates in building codes.
1
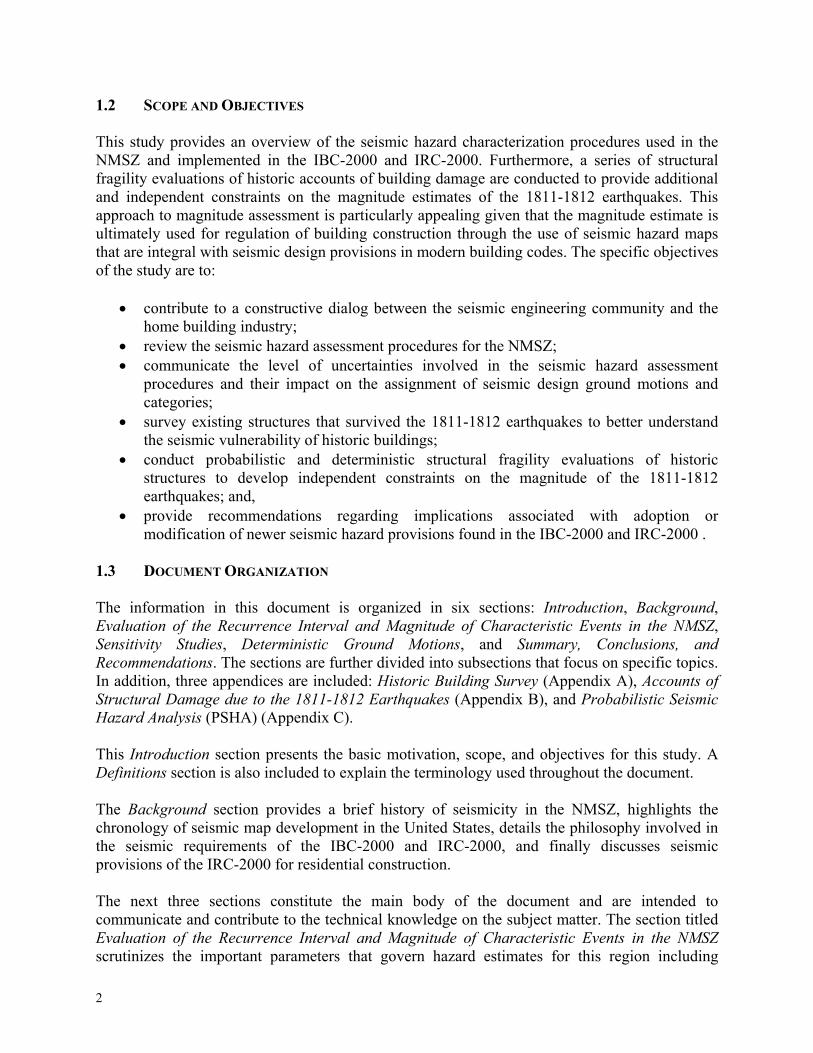
1.2 SCOPE AND OBJECTIVES This study provides an overview of the seismic hazard characterization procedures used in the NMSZ and implemented in the IBC-2000 and IRC-2000. Furthermore, a series of structural fragility evaluations of historic accounts of building damage are conducted to provide additional and independent constraints on the magnitude estimates of the 1811-1812 earthquakes. This approach to magnitude assessment is particularly appealing given that the magnitude estimate is ultimately used for regulation of building construction through the use of seismic hazard maps that are integral with seismic design provisions in modern building codes. The specific objectives of the study are to:
• contribute to a constructive dialog between the seismic engineering community and the home building industry;
• review the seismic hazard assessment procedures for the NMSZ; • communicate the level of uncertainties involved in the seismic hazard assessment
procedures and their impact on the assignment of seismic design ground motions and categories;
• survey existing structures that survived the 1811-1812 earthquakes to better understand the seismic vulnerability of historic buildings;
• conduct probabilistic and deterministic structural fragility evaluations of historic structures to develop independent constraints on the magnitude of the 1811-1812 earthquakes; and,
• provide recommendations regarding implications associated with adoption or modification of newer seismic hazard provisions found in the IBC-2000 and IRC-2000 .
1.3 DOCUMENT ORGANIZATION
The information in this document is organized in six sections: Introduction, Background, Evaluation of the Recurrence Interval and Magnitude of Characteristic Events in the NMSZ, Sensitivity Studies, Deterministic Ground Motions, and Summary, Conclusions, and Recommendations. The sections are further divided into subsections that focus on specific topics. In addition, three appendices are included: Historic Building Survey (Appendix A), Accounts of Structural Damage due to the 1811-1812 Earthquakes (Appendix B), and Probabilistic Seismic Hazard Analysis (PSHA) (Appendix C). This Introduction section presents the basic motivation, scope, and objectives for this study. A Definitions section is also included to explain the terminology used throughout the document. The Background section provides a brief history of seismicity in the NMSZ, highlights the chronology of seismic map development in the United States, details the philosophy involved in the seismic requirements of the IBC-2000 and IRC-2000, and finally discusses seismic provisions of the IRC-2000 for residential construction. The next three sections constitute the main body of the document and are intended to communicate and contribute to the technical knowledge on the subject matter. The section titled Evaluation of the Recurrence Interval and Magnitude of Characteristic Events in the NMSZ scrutinizes the important parameters that govern hazard estimates for this region including
2

magnitude of the 1811-1812 earthquakes and recurrence interval of characteristic events. New data from a study of the structural fragility of historic buildings are presented in this section and contribute to better understanding of the performance of structures during the 1811-1812 New Madrid earthquakes. This data provides a unique and independent constraint on the estimates of the magnitudes of these events. In addition, a series of Sensitivity Studies are conducted to capture the impact of uncertainty on the definition of seismic design ground motions and categories as used for the regulation of building design and construction in the IBC-2000 and IRC-2000. Deterministic ground motions are also discussed as a practical basis for defining the design level of ground motion. Finally, the Summary, Conclusion, and Recommendations section summarizes the major findings of the document and provides a series of recommendations for future research and implementation of results of hazard assessment procedures in the building codes for the NMSZ. Three appendices provide important supplemental information. Appendix A summarizes results of a survey of historic structures that existed during the New Madrid earthquakes of 1811-1812. Appendix B includes historic accounts with reports of structural damage due to the New Madrid earthquakes of 1811-1812. Appendix C provides a brief description of the probabilistic seismic hazard analysis procedures and discusses some of the milestone projects addressing implementation of these procedures. The intended audience for Appendix C includes those who are interested in a more thorough understanding of the findings of this report, but are lacking direct expertise in hazard assessment procedures. 1.4 DEFINITIONS ATTENUATION FUNCTION. A mathematical relationship that correlates a ground motion parameter, such as peak ground acceleration or spectral response acceleration, to earthquake magnitude and a site’s distance from the earthquake rupture using one of many definitions such as distance to the epicenter, distance from the closest point of fault rupture, distance from the hypocenter, etc. A-VALUE. Earthquake activity parameter in the Gutenberg-Richter relationship. B-VALUE. Parameter that defines the relative frequency of occurrence of earthquakes of different magnitudes in the Gutenberg-Richter relationship. CENTRAL AND EASTERN UNITED STATES (CEUS). Territory of the United States east of the Rocky Mountain region as delineated in [18]. CHARACTERISTIC EVENT. An earthquake that has an approximately constant magnitude and frequency of occurrence on a particular fault. It may or may not correlate with a regional or areal Gutenberg-Richter relationship calibrated to historic seismicity. CHARACTERISTIC RECURRENCE INTERVAL. Recurrence interval of a characteristic event. DESIGN GROUND MOTION. Ground motion used as a basis for an engineering design. It can be estimated using various techniques and methodologies.
3

DESIGN RETURN INTERVAL. Return interval selected to establish the design level of ground motion from a ground motion estimation methodology. EARTHQUAKE CATALOG. A record of earthquakes having occurred in a specified area that provides data on location, magnitude, and date of the events. Other parameters such as depth of faulting, stress drop, etc., can be reported. EARTHQUAKE MAGNITUDE. A measure of seismic energy released during an earthquake. Numerous scales have been developed to measure the level of released energy; some scales use direct measure of energy (see Seismic Moment Magnitude) and some use secondary effects such as the maximum amplitude measured by a seismograph (see mblg magnitude). This document refers only to the seismic moment, M, and mblg magnitudes because these magnitude scales are commonly used for the CEUS. FRAGILITY (STRUCTURAL). A mathematical representation of a structure’s propensity for damage at various ground motion levels (see also SEISMIC VULNERABILITY). GUTENBERG-RICHTER RELATIONSHIP. An empirical relationship that establishes a correlation between the magnitude and frequency of earthquakes for a specified seismic source, i.e., fault or region. The Gutenberg-Richter relationship is based on the observation that small earthquakes happen much more often than large ones and is formulated as follows: , where a = a-value, b = b-value, and N = number of events of magnitude M or greater.
bMaN −=10log
HAZARD CURVE. A curve that depicts the relationship between the level of ground motion and its annual frequency or probability of exceedance. Hazard curves are computed using a probabilistic seismic hazard analysis. LOGNORMAL DISTRIBUTION. A statistical distribution function of a variable, the natural logarithm of which follows a normal distribution. NEW MADRID SEISMIC ZONE. A region in southeastern Missouri identified as a source of significant seismic potential. mblg MAGNITUDE. A magnitude scale correlated to the peak amplitude of a type of seismic wave referred to as the Lg wave. This magnitude was derived specifically for the CEUS. mblg properties include a lack of robust correlation with the moment magnitude scale for large magnitude events and ambiguity of relationship with seismic source parameters. (Often historic earthquake catalogs for the CEUS are developed using this scale.) MODIFIED MERCALLI INTENSITY (MMI) SCALE. An intensity scale correlated to the level of damage to man-made works and human responses caused by various levels of ground motion. Based on the level of damage or “felt” data, the ground motion intensity is assigned to one of twelve MMI levels. MOMENT MAGNITUDE (M). A magnitude scale correlated to the total seismic energy released by an idealized fault. Moment magnitude is defined using Standard International (SI) units as follows: M=log(Mo)/1.5-10.7, where seismic moment is defined as: Mo=(µ)(d)(L)(W), where µ =
4

shear modulus, d = fault slip, L = fault length, and W = fault width. A property of the moment magnitude is that it does not saturate (seemingly reach a maximum value) as surface ground motion and building response tend to do. (The moment magnitude has become the preferred magnitude scale for seismic hazard characterization.) PALEOSEISMOLOGY. Study of geologic evidence created during prehistoric earthquakes such as liquefaction, uplifting or subsidence, topographic changes, changes in tree ring growth, etc. RECURRENCE INTERVAL. Time period between earthquakes of similar magnitude. SEISMIC FAULT. A geological feature that produced or has a potential to produce seismic waves due to fracture or relative shift within the earth’s crust. SEISMIC HAZARD. A measure of potential level of ground motion caused by the potential future rupture of a seismic fault. SEISMIC RISK. A measure of expected potential for damage, harm, loss of life, or economic loss due to interaction of seismic hazard and seismic vulnerability. SEISMIC VULNERABILITY. A measure of a structure’s susceptibility to damage due to seismic loading; often described by a fragility curve relating a building’s performance outcome to levels of ground motion. SITE EFFECT. A difference in response at a given site relative to adjacent sites with different characteristics. In building code provisions, a specific type of site affect is addressed – soil amplification, i.e., amplification (or de-amplification) of the seismic wave amplitude due to the near-surface soil structure. STABLE CONTINENTAL REGION (SCR). Continental regions away from the more seismically active boundaries of tectonic plates. While greatly simplified, this definition serves the purpose given the scope of this study. Central and Eastern United States constitute a SCR, and New Madrid Seismic Zone is a region within this SCR. WESTERN UNITED STATES (WUS). Territory of the United States west of the Rocky Mountain region as delineated in [18]. 2.0 Background 2.1 EARTHQUAKE HAZARD AND RESIDENTIAL BUILDINGS The risk management policies for building construction in the United States are within the jurisdiction of local authorities. The common practice for local governments is to adopt one of the model building codes such as the IRC-2000 to provide minimum design and construction requirements. Local users of the building code often do not become involved in the process of seismic hazard evaluation until the seismic maps are considered for adoption at the local level as a part of a national model building code. The maps and the design procedures are presented in the building code as a package that synthesizes many inputs, methods of analysis, and results of expert opinion of those afforded the opportunity to comment on such matters in various code-
5

development processes. Therefore, the localities are limited to a choice of whether to accept or reject the proposed map and design procedures as a whole. Unfortunately, the localities can choose to reject the proposed measures as excessive without having a reasonable alternative for mitigation of seismic risk. As another option, the building code provisions can be amended in a manner viewed appropriate by the local government as a compromise between adopting the more stringent provisions and continued use of existing guidelines. This route creates an inconsistency with the original methodology and the amended version has an unclear basis relative to original intentions and perceptions regarding adequate building performance. For the purposes of seismic design, the IRC-2000 seismic provisions use a system of seismic design categories (SDC) assigned based on the design short period spectral accelerations (TABLE 1).
TABLE 1 SEISMIC DESIGN CATEGORY CLASSIFICATIONS FROM IRC-2000
DESIGN EARTHQUAKE RESPONSE ACCELERATION AT SHORT PERIODS, SDS SDC
SDS ≤ 0.17g A 0.17g < SDS ≤ 0.33g B 0.33g < SDS ≤ 0.5g C 0.5g < SDS ≤ 0.83g D1
0.83g < SDS ≤ 1.17g D2 1.17g < SDS E
SDCs A and B are unrestrictive in terms of seismic provisions, and construction practices are typically governed by other factors such as wind and gravity loading. SDC C is a transition category that prohibits some construction practices as the result of a perceived need to reduce seismic vulnerability. For example, adhesive attachment of wall sheathing materials is prohibited, enhanced practices for construction and reinforcement of masonry and concrete walls are required, etc. SDCs D1 and D2 require special consideration for all aspects of seismic design and prohibit the use of some structural systems and materials. For example, pier and curtain wall foundations are prohibited, concrete structures require engineering design, brick veneer cladding systems are limited to first story walls, prescriptive construction is limited to certain building height, etc. Moreover, SDCs D1 and D2 (and C for townhouses) impose stringent provisions on buildings classified as irregular based on geometrical configuration and architectural details such as wall offsets, large floor or wall openings, asymmetrical wall opening placement between stories, plan geometries with oblique angle corners, maximum number of stories, maximum aspect ratio of shear walls, etc. Buildings classified as SDC E are beyond the scope of the IRC-2000 and require engineering design of all structural components in accordance with the IBC-2000. The intent of the SDC classification is to categorize the vulnerability of the building stock to seismic hazard and to retain the prescriptive code format for residential construction practices that have shown a generally successful performance history. The limits associated with each SDC level are largely based on judgment and historic experience on the performance of buildings in previous events, and to a lesser extent on analytical and experimental methods of structural analysis. The determination of the SDC for a structure is directly related to the accuracy of the estimates of spectral acceleration used as the design ground motion parameter.
6

The restrictions imposed by SDCs E, D, and C can have a significant effect on the building practices, costs, and local and regional economies. According to the IRC–2000 provisions, the spectral response acceleration in the NMSZ ranges from an excess of 3.0g (SDC E) near the location of the 1811-1812 earthquakes to 1.17g (SDCs D2) in the vicinity of the Memphis area and to 0.5g (SDCs D1) in the vicinity of the St. Louis area (SDC assigned based on site class D). The states around the NMSZ with counties assigned to SDC C or greater include Missouri, Illinois, Indiana, Kentucky, Tennessee, Alabama, Mississippi, and Arkansas. This influences the economy of a vast territory and can translate into rising housing costs limiting the growth of the home ownership among the families with low and moderate income. The ramifications of the elevated hazard estimates extend far beyond the immediate impact of construction requirements and can further affect the market through the increased hazard insurance rates. For example, following the development of the 1997 NEHRP edition, the insurance industry made a request to the state of Missouri to increase earthquake premiums by as much as 266 percent for localities affected by the NMSZ [47]. Moreover, insurance rates serve as one indicator of the business attractiveness for potential investors and high premiums can drive commerce out of the region further affecting the regional economy. Therefore, accurate hazard estimates and their rational implementation are integral to the development of economically-justified and acceptable risk mitigation measures. 2.2 NEW MADRID SEISMIC ZONE The NMSZ is a region identified as a source of significant seismic hazard. It is located in the southeastern part of Missouri and is often referred to as the “boot heel” after the shape of the state. Although modern earthquake activity registered by seismographs is elevated compared to many other parts of the CEUS, there have been no earthquakes during the last century that would threaten structural damage. What is the evidence that sets this region apart? The main evidence that indicates future seismic potential includes the New Madrid, Missouri earthquake sequence of 1811-1812 (M>7.0) and paleoseismic evidence of prehistoric sequences of similar magnitudes about A.D. 1450 and A.D. 900. There is also indication of two earlier occurrences of large earthquakes. In addition, two smaller events occurred in the 19th century: 1843 Marked Tree, Arkansas (M≈6.3), and 1895 Charleston, Missouri (M≈6.6). The approximate locations of the events with M>6 that occurred in the 19th century are shown in Figure 1.
7

•
•
•
•
•
Missouri
Tennessee
Arkansas
Kentucky
Illinois
NMSZ
1843 Marked Tree
1895 Charleston
December 16, 1811
February 7, 1812
January 23, 1812
Figure 1
Approximate Locations of NMSZ Earthquakes with M≥6.0 Since 1700 The New Madrid seismic events of the 1811-1812 are by far the most remarkable and enigmatic earthquakes in the modern seismic history of the CEUS. Arguably, these earthquakes are among the largest known earthquakes in the contiguous United States, including California. The seismic activity attributed to the earthquakes of 1811-1812 started in December of 1811 and continued for several months into the spring of 1812, producing three principal shocks that occurred on December 16, 1811; January 23, 1812; and February 7, 1812. The sequence is also known as the New Madrid earthquake after the name of a town located near the epicenter of the February 7, 1812, shock. The earthquake sequence of 1811-1812 is an important topic of this study and several of the following sections examine these events and their impact on modern seismic building code provisions in the NMSZ. Magnitude estimates of the New Madrid earthquake and recurrence interval of earthquakes of similar size are two important inputs used to derive the design level ground motion in the NMSZ. While recent research has significantly improved the understanding of these parameters, they remain a subject of some controversy and scientific discussion. Moreover, the mechanism driving seismicity in stable continental regions is not well understood and there is a lack of physics-based theories that can consistently define the nature of such events. One theory is that the NMSZ is a zone of weakness in the regional crust that coincides with the location of an ancient rift that has reactivated in the last several thousand years. The reactivation was caused by the buildup of internal stresses in the tectonic plate compressed at its boundaries by adjacent plates. As this theory attempts to explain some of the mystery behind one of the most enigmatic seismic regions, it does little to quantify the future seismic potential of the NMSZ for implementation with hazard characterization procedures. 2.3 HISTORY OF DESIGN SEISMIC MAP DEVELOPMENT IN THE UNITED STATES This section provides a short summary of the history of seismic hazard map development in the United States. The majority of this information was adopted from Algermissen [2] and
8
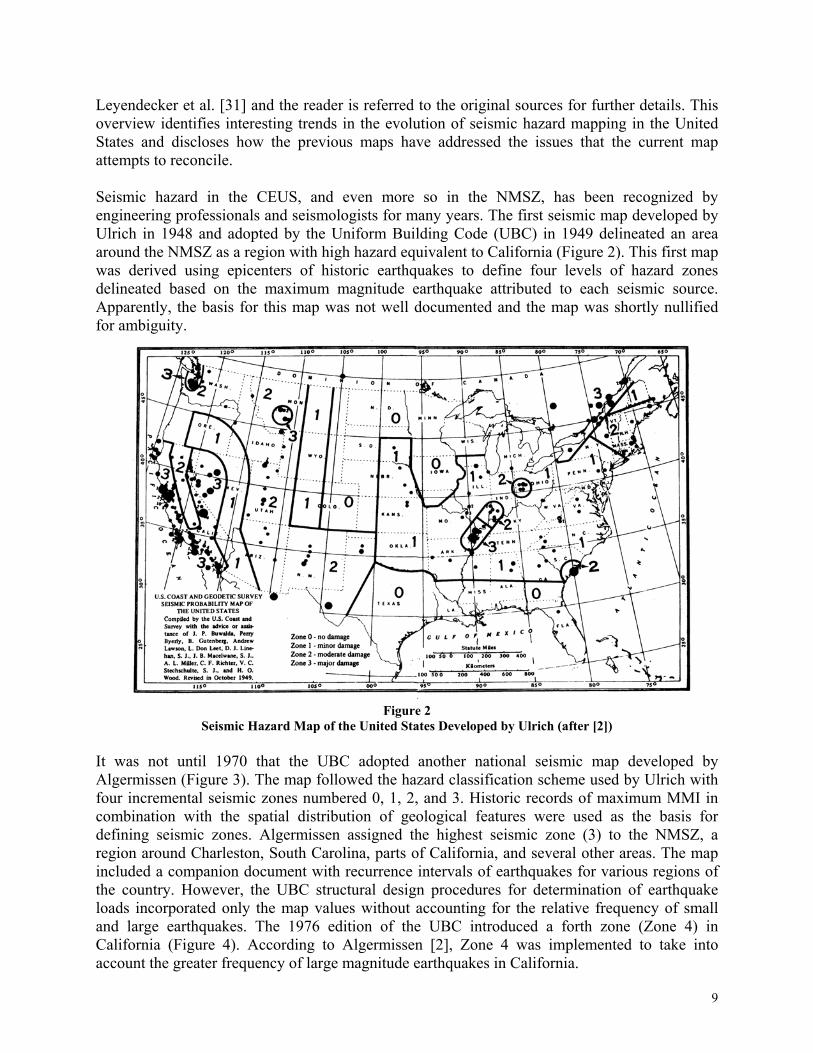
Leyendecker et al. [31] and the reader is referred to the original sources for further details. This overview identifies interesting trends in the evolution of seismic hazard mapping in the United States and discloses how the previous maps have addressed the issues that the current map attempts to reconcile. Seismic hazard in the CEUS, and even more so in the NMSZ, has been recognized by engineering professionals and seismologists for many years. The first seismic map developed by Ulrich in 1948 and adopted by the Uniform Building Code (UBC) in 1949 delineated an area around the NMSZ as a region with high hazard equivalent to California (Figure 2). This first map was derived using epicenters of historic earthquakes to define four levels of hazard zones delineated based on the maximum magnitude earthquake attributed to each seismic source. Apparently, the basis for this map was not well documented and the map was shortly nullified for ambiguity.
Figure 2
Seismic Hazard Map of the United States Developed by Ulrich (after [2]) It was not until 1970 that the UBC adopted another national seismic map developed by Algermissen (Figure 3). The map followed the hazard classification scheme used by Ulrich with four incremental seismic zones numbered 0, 1, 2, and 3. Historic records of maximum MMI in combination with the spatial distribution of geological features were used as the basis for defining seismic zones. Algermissen assigned the highest seismic zone (3) to the NMSZ, a region around Charleston, South Carolina, parts of California, and several other areas. The map included a companion document with recurrence intervals of earthquakes for various regions of the country. However, the UBC structural design procedures for determination of earthquake loads incorporated only the map values without accounting for the relative frequency of small and large earthquakes. The 1976 edition of the UBC introduced a forth zone (Zone 4) in California (Figure 4). According to Algermissen [2], Zone 4 was implemented to take into account the greater frequency of large magnitude earthquakes in California.
9

Figure 3
Seismic Hazard Map of the United States Developed by Algermissen (after [2])
Figure 4
Seismic Hazard Map of the United States Adopted by 1979 UBC (after [2]) (Reproduced from the 1979 edition of the Uniform Building Code copyright1979, with the permission of the
publisher, the International Conference of Building Officials)
10

The format of using five hazard zones as in Algermissen’s map has remained the same in the UBC through the 1997 edition and is still enforced by many localities throughout the country, including California. However, the basis for the zonation changed with the adoption of a new map in the 1988 UBC edition. Despite its close resemblance with the previous map in terms of zone contours, the new map was developed with the principles of probabilistic seismic hazard analysis (PSHA) (refer to Appendix C for a short review of PSHA). The 1988 UBC map was a derivative of a map originally developed by Algermissen and Perkins in 1976 (Figure 5) within the scope of the United States Geological Survey (USGS) program and later modified by the Applied Technology Council (ATC) committees assembled as a part of an effort for development of recommendations for seismic design of buildings (ATC 3-06 [4]). The ATC committees truncated the peak ground acceleration contours at 0.40g (Figure 6). Derived based on a 500-year return period and data available at the time, the level of ground motion in the NMSZ did not exceed 0.20g (PGA). The map was published again in the 1994 UBC with only minor changes. Probabilistic maps similar to those reported in ATC 3-06 were adopted by the National Building Code and Standard Building Code with minor modifications in 1993 and 1994, respectively. All building code maps used 10 percent probability of exceedance in 50 years (500-year return period (YRP)). It should be noted that the map by Algermissen and Perkins (Figure 5) was used to develop a probability-based seismic load criterion for structural engineering [13] that forms the basis for load combinations in the current building codes.
Figure 5
Probabilistic Hazard Map (PGA) of the United States Developed by Algermissen and Perkins (10 Percent Probability of Exceedance in 50 Years)(after [2])
11
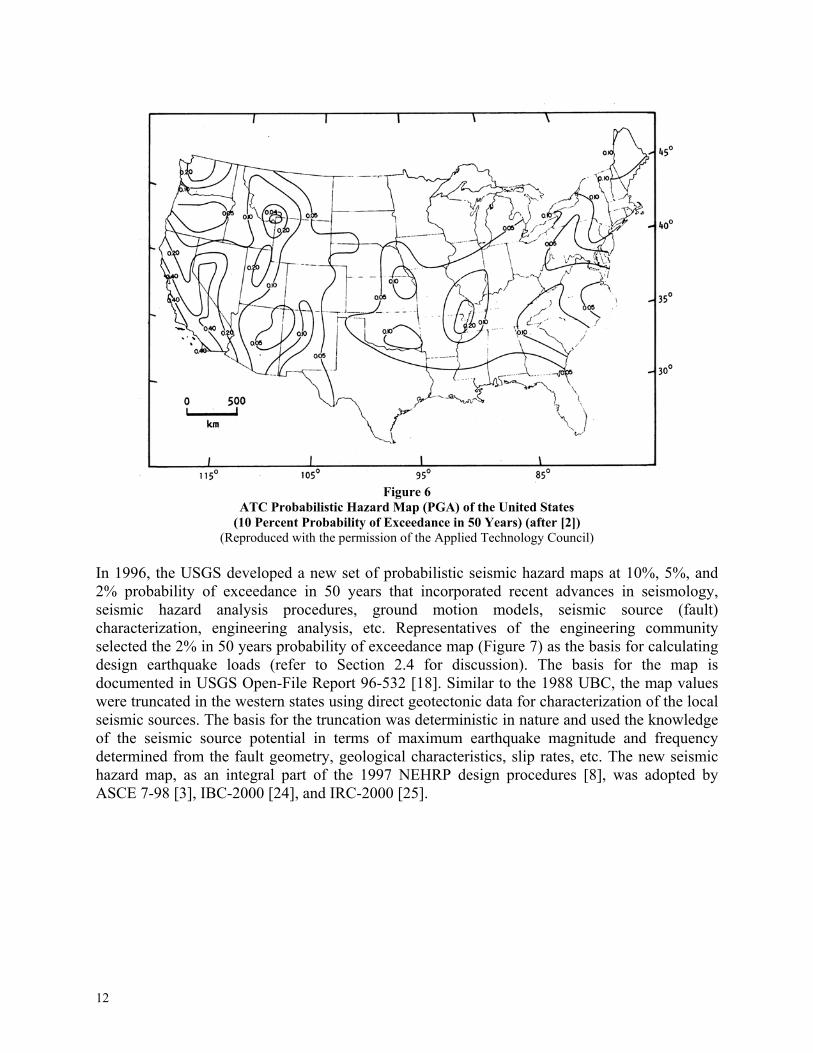
Figure 6
ATC Probabilistic Hazard Map (PGA) of the United States (10 Percent Probability of Exceedance in 50 Years) (after [2])
(Reproduced with the permission of the Applied Technology Council) In 1996, the USGS developed a new set of probabilistic seismic hazard maps at 10%, 5%, and 2% probability of exceedance in 50 years that incorporated recent advances in seismology, seismic hazard analysis procedures, ground motion models, seismic source (fault) characterization, engineering analysis, etc. Representatives of the engineering community selected the 2% in 50 years probability of exceedance map (Figure 7) as the basis for calculating design earthquake loads (refer to Section 2.4 for discussion). The basis for the map is documented in USGS Open-File Report 96-532 [18]. Similar to the 1988 UBC, the map values were truncated in the western states using direct geotectonic data for characterization of the local seismic sources. The basis for the truncation was deterministic in nature and used the knowledge of the seismic source potential in terms of maximum earthquake magnitude and frequency determined from the fault geometry, geological characteristics, slip rates, etc. The new seismic hazard map, as an integral part of the 1997 NEHRP design procedures [8], was adopted by ASCE 7-98 [3], IBC-2000 [24], and IRC-2000 [25].
12

Figure 7
1996 USGS Probabilistic Hazard Map (PGA) of the United States (2 Percent Probability of Exceedance in 50 Years)
(after http://Geohazards.Cr.Usgs.Gov/Eq/) This short summary has highlighted milestones in the history of the seismic hazard map development for building code applications in the United States. The code-writing process made a transition from deterministic to probabilistic maps for estimation of seismic hazard. However, deterministic procedures have been used (1988 UBC) and are currently used (1997 NEHRP, IBC-2000, IRC-2000) as an integral part of hazard characterization for seismically active regions of California where firsthand seismic experience is available and is used to justify the degree of the required mitigation measures. In terms of definition of design ground motions in the CEUS and the NMSZ, the greatest impact on the level of earthquake loads is associated with the use of 2,500-YRP maps. 2.4 MODERN SEISMIC DESIGN PHILOSOPHY The rationale involved in the formulation of the seismic design philosophy of the IBC-2000 and IRC-2000 as documented in the 1997 (and 2000) NEHRP Commentary [9] and interpreted by the authors of this document is discussed in this section and illustrated with a flow-chart (Figure 8). This discussion explains why the current design ground motions for the NMSZ exceed that for California. As the cornerstone of its seismic design philosophy, the NEHRP Recommended Provisions introduced a concept of a uniform safety margin against building collapse throughout the United States. The notion of collapse prevention was presented as consistent with the life safety objective of the model building codes. Given the subjective nature of the selection of the level of ground motion as the design basis for structural analysis, a level of performance perceived as acceptable by the public needed to be identified. Should the buildings be designed for 500-,
13

2,500-, or 10,000-year return period? The methodologies for hazard characterization, probabilistic or deterministic, do not and are not intended to answer this question. Any approach requires a calibration point or an absolute frame of reference to make this decision. The most reliable frame of reference available to the hazard analyst is the historic experience accumulated by the communities exposed to earthquake hazard. Due to the generally successful seismic performance of buildings in WUS constructed according to the 1994 Uniform Building Code (UBC) provisions and the extensive history of active seismicity, California’s experience was chosen as a reference point for establishing the acceptable level of protection. The implementation of the collapse prevention concept into design procedures required the input of a value of the safety margin representative of the buildings constructed according to the NEHRP provisions. The safety margin was defined as the ratio of ground motion causing the building to approach its near collapse state to the design level ground motion. Using judgment and results of selected studies, the NEHRP experts concluded that 1.5 was a conservative (low) estimate of the safety margin for all types of construction.
14

Figure 8
≈≈ 1
5.15.1500500,2
SMGMGM
Design ground motion is determined by multiplying 2,500-YRI by 2/3 (1/1.5) Result: RI=500 years for California RI > 1000 years for CEUS
Final Map: probabilistic 1996 USGS map for 2,500 RI with deterministic cap for WUS
Use the capped ground motion as new calibration point Benefit: - ground motions for California comparable to the 1994 UBC - CUES can be designed for RI of 2,500
Solution: use the knowledge of seismic sources in California to establish deterministic cap
Rejected
Problem: - high uncertainty for large RI - not justified by experience (1994 UBC)
Ramifications: CEUS to be designed for RI of as high as 10,000 years to provide consistent safety margin against collapse
Selection of calibration point: California
Scrutiny of the maps: high frequency of max magnitude earthquakes in California: RIMmax = 100-200 years Problem: PSHA counts max events several times within 500 YRP
Estimation of apparent safety margin at design level relative to collapse:
SM ≥ 1.5
Accept the probabilistic map for California with design level for 500 YRP and 2,500 YRP for collapse prevention
Objective: uniform safety margin against collapse throughout U.S.
Examination of hazard curve slopes: - CEUS has steeper slope than WUS - Ratio of ground motions at 2,500- YRI to 500-YRI: California: ≅ 1.5, CEUS: ≅ 2 - 5
Alternatives for action
Comparison with 1994 UBC at design level (500-YRI): new ground motions for California are higher
Preliminary probabilistic 1996 USGS map for entire U.S.
Rationale for the 1997 NEHRP Design Map
15

Initially, a set of probabilistic maps at 2%, 5%, and 10% probability of exceedance in 50 years for the entire United States was developed by the USGS using the PSHA methodology. An examination of this map disclosed that the new ground motions in California at the design level, i.e., 500-YRP, exceeded those in the 1994 UBC. Furthermore, the comparison of the individual hazard curves for various locations across the United States indicated that hazard decreased more rapidly for the WUS sites compared to the CEUS sites (Figure 9). In light of these two findings, the adoption of this probabilistic approach would result in increased design ground motions for California and the need for development of maps for the CEUS with the return periods as high as 10,000 years to provide a safety margin against collapse comparable to California. The increase of design ground motions in California disagreed with the public view of the success of the concurrent UBC provisions, whereas the design for a 10,000-YRP in CEUS entailed a high degree of uncertainty and conflicted with the analysis procedures for other hazards such as wind, flood, and snow. This apparent disparity between the acceptable engineering practice and the interpretations of the PSHA results in the context of collapse prevention prompted a scrutiny of the probabilistic results. This examination concluded that maximum magnitude earthquakes in California had a return period of 100-200 years and the PSHA “counted” these events several times within the 500 YPR.
2500 RP
500 RP
1.5 4.5
Memphis Los Angeles
Figure 9 Hazard Curves for Various US Cities based on the 1996 USGS methodology (from [18])
To reconcile this issue, NEHRP experts proposed to apply a deterministic cap to the high seismicity areas of California. The deterministic cap values were established directly from the seismic potential of faults that were characterized in terms of their geometry and rate of strain accumulation. The capping of the probabilistic values resulted in ground motions in California generally consistent with the 1994 UBC and allowed for using 2,500 YRP as the design basis for CEUS. In the WUS regions of low and moderate seismicity, probabilistic estimates of hazard were retained. The ground motion corresponding to the 2,500 YRP was referred to in the 1997 NEHRP provisions as the maximum considered earthquake ground motion.
16

The final design ground motion map was developed for 2 percent probability of exceedance in 50 years, i.e., 2,500 YRP, with ground motions in the WUS capped based on the deterministic potential of seismic sources. To provide a uniform level of protection against collapse throughout the United States, the design ground motion is calculated by multiplying the design map value by 2/3. The design value for the WUS corresponds to the return period of about 500 years, whereas the design return interval for the CEUS typically exceeds 1,000 years and varies with the slope of the hazard curve calculated for each specific site. For example, the return period for the design ground motion in Memphis is about 1,500 years and the ratio of the 2,500-YRP ground motion to the 500-YRP ground motion is 4.5 (Figure 9). The slope of a hazard curve is the result of the low rate of ground motion attenuation with distance in the CEUS as compared to the WUS (see Appendix C), the use of characteristic earthquake models within high hazard areas in the CEUS such as the NMSZ (refer to Section 3.1), and a higher level of attenuated ground motion variability, σ (Section 4.2.2). The condition of multiple maximum magnitude events within the design return period was identified as unique to California. However, an analogy can be drawn with the NMSZ where the characteristic event is assigned a 500 YRP (Section 3.1) and the design return period exceeds 1,000 years. Therefore, a deterministic cap can be also applied to the high seismicity regions of the CEUS such as the NMSZ. 3.0 Evaluation of the Recurrence Interval and Magnitude of Characteristic
Events in the NMSZ Hazard estimates in the NMSZ depend on many input variables including magnitude and recurrence interval of characteristic events, ground motion attenuations functions, location of seismic faults, measure of local ground motion variability (σ), and others. This section discusses the characteristic earthquake model inputs, i.e., magnitude and recurrence interval of events such as the 1811-1812 earthquake sequence. The presentation is organized such that a description of the corresponding parameter is followed by a discussion of relevant issues and new findings. The effects of these input parameters on the assignment of SDCs is investigated with sensitivity studies documented in Section 4. 3.1 RECURRENCE INTERVAL ESTIMATION 3.1.1 General This section summarizes key sources of scientific literature pertaining to estimates of the recurrence interval of major earthquakes in the NMSZ. The recurrence interval assigned to major earthquakes in the NMSZ is a significant component of the hazard analysis methodology used to determine design ground motions for the CEUS. Available knowledge regarding recurrence of major earthquakes in the NMSZ has been rapidly changing as a result of the study of paleo-earthquakes (i.e., “pre-historic” earthquakes). In particular, one definitive paleo-earthquake investigative effort is briefly summarized in this section and confirms that at least two events predating and similar in magnitude to the 1811-1812 New Madrid earthquakes have occurred [53]. As a result, it is generally now accepted that
17

any viable tectonic model of the NMSZ must meet the constraint of producing a major earthquake (of comparable magnitude to the 1811-1812 earthquakes) having a mean recurrence interval of about 500 years with 95% confidence bounds of 160 years to 1200 years [53], [11], [16]. Much uncertainty has surrounded attempts to estimate the recurrence interval for major (or characteristic) earthquakes in the NMSZ. Based on the literature reviewed, this lack of solid scientific constraint has allowed expert estimates of the recurrence interval to range as widely as several hundred years to 10,000 years or more in the very recent past [43], [56], [41], [55], [36], [42], [44], [28], etc. As mentioned, this problem has been significantly addressed by a recent and comprehensive study of paleo-earthquakes in the NMSZ [53]. 3.1.2 Paleoseimology Paleoseismology is a fairly new branch of geo-science involving the study of seismogenic geologic evidence for which there is generally no historic record, or no modern instrumental record. Thus, its application is limited to those earthquakes which are of sufficient magnitude to create physical evidence (e.g., sand blows and co-seismic folding buried by shallow sediments) that is reasonably preserved in the geologic record for later discovery, investigation, and interpretation or analysis. The reader is referred to existing literature and texts for a more in-depth treatment of paleoseismology, including its multiple uses and investigative techniques [1], [54], [40]. Paleoseismologic studies in the NMSZ have served multiple functions. First, they have identified that a number of major earthquakes predate those of the 1811-1812 sequence. Second, new data from paleoseismologic studies have helped to provide much improved constraints to estimates of recurrence interval between major earthquakes in the NMSZ. Third, these studies have provided confirmation that the earthquakes occurring prior to the 1811-1812 earthquakes were of similar magnitude and periodicity (i.e., characteristic) based on similar nature and extent of the observed effects (e.g., sand blows) that have been formed over the past 2000 years or so by several major earthquake episodes. 3.1.3 Summary of Tuttle [2002] Tuttle et al. [53] compiles and evaluates paleoseimologic evidence (e.g., sand blows) from more than 250 sites across the NMSZ and concludes that the New Madrid fault system has generated temporally clustered very large earthquakes (similar to the 1811-1812 sequence) in A.D. 900 ± 100 years and A.D. 1450 ± 150 years as well as in 1811-1812. Other earlier events are also reported, but with a much lower degree of confidence in terms of timing and magnitude. This finding adds credibility to the use of a characteristic earthquake model for seismic hazard estimation in the NMSZ. It also provides a needed means to constrain a mean recurrence interval estimate for characteristic earthquakes in the NMSZ and to assign variability to that estimate solely on the basis of variation in physical measurements rather than interpretations of incomplete and sometimes conflicting sources of knowledge. For example, based on uncertainties associated with calibrated Carbon-14 dating of liquefaction features by Tuttle et al. [53], a mean recurrence interval of 500 years with 95% confidence bounds of 160 years to 1200 years was determined by Cramer [11] using Monte Carlo simulation.
18

3.1.4 Other Related Studies and Challenges While many questions regarding the recurrence interval of characteristic earthquakes in the NMSZ appear to have been answered by Tuttle et al. [53], some questions and challenges still remain. A couple of these challenges are evidenced in the literature reviewed in this section. Guccione et al. [20] provided new data and consolidated information from previous studies of the Reelfoot scarp and Tiptonville Dome (uplift) which is the only topographic fault expression in the NMSZ. By dating various subsurface features associated with stream response to coseismic folding, the authors were able to partition deformations into three individual seismic events dated at about A.D. 900, A.D. 1470, and A.D. 1812. They determined that the latter two events were similar in size and produced a total deformation of about 11m (5.5m each) on the thrust fault. The A.D. 900 event was described as a much smaller event with a deformation likely smaller than about 1 meter. Tuttle et al. [53] recognized that variations in the full extent of the sand blows in the A.D. 900 and A.D. 1450 [Guccione’s A.D. 1470 event] events may suggest that the magnitudes are slightly different than the 1811-1812 events. However, the Tuttle et al. [53] evidence suggests that it is the A.D. 1450 event that may be slightly less in magnitude than the 1811-1812 events due to a slightly smaller spatial distribution of sand blows in this event. Tuttle also recognizes that paleoseismologic evidence has yet to be found for the A.D. 900 event in some locations and may not be complete in fully characterizing either event. Newman et al. [36] report short-term GPS measurements across the NMSZ that show little relative motion or slip (<<2mm/yr) disproving earlier GPS data by Liu et al. [32] that was used to suggest a short recurrence interval and large ~M8 events were plausible. The authors used a plate boundary model to interpret their GPS data in a manner compatible with geologic estimates of recurrence interval and plausible characteristic magnitudes for the New Madrid earthquakes. They suggest that if the largest of the 1811-1812 shocks had been ~M7 (with a strike slip of ~1m) a recurrence interval of 500 years based on paleoseismologic evidence would agree reasonably well with their short-term GPS measurements. Conversely, assignment of an ~M8 to the 1811-1812 largest shock would suggest a recurrence interval well exceeding 2,500 years which does not agree with the paleoseismologic data or their short term slip rates. In Eos [16], it is noted that Newman et al. [36] used a plate boundary model instead of an intraplate model in reaching their conclusions which creates some doubt regarding the validity of their conclusions, particularly since other intraplate tectonic models (such as reported by Kenner and Segall [30]) can be used to reconcile the GPS data with a 500-year recurrence interval and a ~M8 characteristic event. But, Newman et al. [37] observe that the Reelfoot thrust fault slip rate of 5-6 mm/yr as estimated by Mueller et al. [35] corresponds to about 2 mm/yr of strike slip that would in 500 years provide about 1 m of slip, corresponding to about M 7.0 +- 0.3 which supports their interpretation of their GPS data in a manner consistent with the preferred recurrence interval estimate of 500 years. Taken as is, Newman’s analysis suggests a low M7 characteristic event magnitude which is not without support from other independent methods to determine magnitude of the New Madrid earthquakes (see Section 3.2).
19

3.1.5 Conclusions In summary, the following conclusions can be drawn from the literature regarding the nature and recurrence of major earthquakes in the NMSZ:
1) At least two major earthquakes of similar magnitude to the 1811-1812 New Madrid events have occurred with periodicity suggesting that they are characteristic in nature;
2) The mean recurrence interval is reasonably well constrained by the geology of the region to be about 500 years with 95% confidence bounds of 160 years to 1200 years; and
3) Challenges remain to reconcile the estimated recurrence interval with a compatible estimate of the characteristic event magnitude for the NMSZ that may be lower than currently used for probabilistic seismic hazard analysis.
Based on the 1811-12 New Madrid earthquakes and only the two well-constrained paleo-earthquakes reported by Tuttle et al. [53], the mean recurrence interval for these major events can be simply represented as shown in TABLE 2. Some caution must be exercised in the use of such statistics which are based on uncertain knowledge regarding the geologic history (and future) of the NMSZ [16]. For example, the fundamental premise of probabilistic hazard analysis is that the past can be used to predict the future. For the NMSZ, experts recognize that the region’s past seismic activity appears to be relatively recent and not well understood. However, they differ in their interpretation and subjective weighting of presently observed geologic markers (i.e., subdued nature of surface deformations and low strain rates across the region) versus the geologic record of seismic activity as determined by paleoseismology [53], [16], [37]. Thus, plausible interpretations vary as widely as (1) the region’s seismicity has recently “awakened” or (2) the region’s seismic activity is “going to sleep.” In the absence of a more robust predictor of the future, the immediate past earthquake activity is the prudent choice and provides the best available data for probabilistic hazard analysis. However, the potentially significant unaccounted uncertainty in the nature and continuance of future seismic hazard suggests the practicality of considering a deterministic hazard assessment approach to supplement (i.e., cap) probabilistic hazard estimates for the NMSZ.
TABLE 2 MEAN RECURRENCE INTERVAL FOR THREE CHARACTERISTIC
EARTHQUAKES IN THE NEW MADRID SEISMIC ZONE1 MAJOR EVENTS YEARS BEFORE PRESENT RECURRENCE INTERVALS (1) AD 1811-12 192 years - present interval (2) AD 1450 553 years (1)-(2) 361 years (3) AD 900 1,103 years (2)-(3) 550 years
Mean Recurrence Interval ~455 years 1Two events preceding the A.D. 900 event are not included in this table for reason of the lack of comparable constraints on their timing and magnitude (see Tuttle et al. [53]).
3.2 MAGNITUDE OF 1811-1812 EARTHQUAKES 3.2.1 Previous Studies The magnitude of the 1811-1812 earthquakes is used as a measure of the characteristic event magnitude for implementation with PSHA in the NMSZ. Therefore, estimates of the magnitude
20

of the 1811-1812 earthquakes are important for accurate hazard assessment. Expert opinion on the magnitude of the 1811-1812 earthquakes has changed over time and currently varies from low M7’s to as high as M8.1. In terms of engineering applications, an increase in magnitude by one M unit causes an increase in the 0.2 sec design spectral response acceleration (SRA) by a factor of two or more. Historic damage reports and “felt” accounts are the primary source of information on the extent of the 1811-1812 earthquakes. Therefore, the methods currently used for making inferences about magnitude of the 1811-1812 earthquakes depend directly on the accuracy and completeness of these historic accounts and their interpretation. The distant date of the events, lack of earthquake experience and knowledge, poorly developed communication infrastructure, and location of the epicenter in the scarcely populated area are among the factors that contribute to the ambiguity of the historic accounts. This ambiguity directly translates into uncertainty in the magnitude estimates of the events and the uncertainty of hazard estimates in the NMSZ. TABLE 3 provides a chronology of studies conducted to estimate the magnitude of the 1811-1812 earthquakes. More detailed descriptions of each study follow.
TABLE 3 MAGNITUDE ESTIMATES FOR THE 1811-1812 NEW MADRID EARTHQUAKE SEQUENCE
MAGNITUDE1 SOURCE DECEMBER 16 JANUARY 23 FEBRUARY 7 BASIS
Nuttli 1973 [38] mblg7.2 mblg7.1 mblg7.4 Correlation of intensities of 1811-12 and smaller well documented earthquakes with mblg<5.5
Nuttli et al. 1979 [39] mblg7.3 mblg7.2 mblg7.5
Refined mblg – intensity correlation developed for earthquakes with mblg ≤ 6.2
Johnston et al. 1994 [29] M8.2 M8.1 M8.3
MMI area – moment magnitude correlations developed based on worldwide earthquakes
Johnston 1996 [27] M8.1 M7.8 M8.0 Same with modifications for CEUS crust
Newman et al. 1999 [36]2 Maximum Event Magnitude: low M7 (for RI=500 years)
GPS measurements of short-term surface slip rates and a conventional fault model
Hough et al. 2000 [22] M7.2-7.3 M7.0 M7.4-7.5
Intensity area – moment magnitude correlations from Johnston 1996 [27] using revised intensity areas
Bakun and Hopper, submitted, [5] M7.2 M7.1 M7.4 MMI attenuation model used
with individual sites
Figure 4 in [7] Maximum Event Magnitude: M7.7 Based on comparison of isoseismals of the 2001 M7.7-7.6 Bhuj earthquake.
This study M7.2 Based on analysis of vulnerability of historic chimneys
1Magnitude scale is consistent with the original source. 2This estimate represents an indirect measure of the magnitude of the characteristic events such as the 1811-1812 earthquakes based on modeling of current slip rates and assumption that characteristic events happen every 500 years. See Section 3.1 for more description.
21

Nuttli’s Work The first estimates of the magnitude of the 1811-1812 earthquake based on a robust scientific methodology were obtained by Nuttli [38] and Nuttli et al. [39] using a correlation relationship between MMI intensities and mblg magnitude developed for modern documented earthquakes with reliable data for both scales. The established correlation was used with MMI isoseismals delineated for the 1811-1812 earthquakes to estimate a body-wave magnitude of mblg=7.5 for the February 7, 1812 shock. The correlations were derived using events with magnitudes of mblg≤6.2. Nuttli further speculated that if seismograph records were available for the 1811-1812 earthquakes, they would indicate mblg of around 7.0 due to saturation of the 1-Hz mblg scale. Nuttli’s estimates are not used with the current hazard characterization procedures; therefore, no further discussion is provided on his work in this document. Johnston’s Work (EPRI Study-Worldwide Dataset) The lack of modern earthquakes in the CEUS for formulating a reliable correlation between intensities and magnitudes was one of the incentives for the study conducted by EPRI [29] on the worldwide seismicity in stable continental regions (SCR). The underlying principle was that earthquakes from other SCRs can be used to develop correlation relationships applicable for the CEUS earthquakes provided that SCRs are defined on the basis of uniform tectonic and geological characteristics of crust. The methodology was based on the premise that the lack of time in the earthquake records in the CEUS can be reconciled through the use of seismic history of other SCRs and was referred to as a substitution of space for time method. The events that had reliable instrumental estimates of seismic moment and corresponding intensity maps were selected from the worldwide library of earthquakes in SCRs. Regression analysis was performed to develop second degree polynomial equations that correlated area enclosed by an intensity isoseismal and the moment magnitude. Using these correlation equations and the isoseismals delineated by Street and Nuttli [48], Johnston estimated that moment magnitude of the 1811-1812 earthquakes was as high as M8.3 (TABLE 3). TABLE 4 summarizes the total number of events that qualified for the analysis. With exception of only two events, the correlation was constrained by earthquakes with M = 4.5-6.5. Therefore, despite drawing on the global seismicity dataset, correlation relationships were not well constrained in the range used for making inferences about the 1811-1812 New Madrid earthquakes (M>7.0).
TABLE 4 ISOSEISMALS USED FOR DEVELOPMENT OF MMI – M CORRELATIONS
MMI LEVEL NUMBER OF EVENTS WITH USABLE DATA
NUMBER OF EVENTS WITH M>7.0
NUMBER OF EVENTS WITH M>7.5
II – III (felt) 49 IV 28 V 47 VI 34
21 11
1Includes Bihar, India earthquake. It is a plate boundary event with the intensity area calculated only for SCR. Because the derived correlation equations were second degree polynomials with rapidly increasing slope above M6.0, the predictions for M>7.0 were very sensitive to the accuracy of the intensity areas. The intensity areas for the 1811-1812 earthquakes adopted from Street and
22

Nuttli [48] were delineated based on an incomplete set of data [22]. Another limitation was attributed to the unique crustal properties of each SCR and dissimilarities in the local soil conditions that further contributed to the uncertainty of the correlation equations. Johnston’s Work (Extension of the EPRI Study) Johnston [27] revised the correlation equations to include only North American earthquakes in response to the observation that the North American SCR crust had the lowest inelastic attenuation among all SCRs and pooling the worldwide data caused overestimation of the magnitudes. A new physics-based equation format consistent with seismic ray propagation patterns was also adopted and provided a more meaningful substantiation for extrapolation. Johnston further recognized the need to account for the apparent difference in attenuation rates to the east and west of the NMSZ. Due to the lack of settlements west of the NMSZ at the time of the earthquakes, the available data was insufficient to determine the extent of the isoseismals in this direction. Johnston used two more recent and better documented events to estimate the ratio of the affected areas to the east and west of the NMSZ: 1843 M6.3 Marked Tree, Arkansas, earthquake and 1895 M6.6 Charleston, Missouri, earthquake. For these earthquakes, the total area within a given isoseismal was 0.62-0.86 of that for the double eastern part of the same isoseismal. Johnston computed two sets of areas: (1) doubled area east of the NMSZ and (2) double area reduced with the estimated reduction factor. The first set of isoseismal areas was used with the North American regression, whereas the second with the regression derived for the worldwide dataset. Johnston argued that the former was justified because the North American dataset was dominated by the north-central United States and eastern Canada events that had attenuation representative of the eastern, documented portion of the New Madrid earthquake. He further assumed that the reduced areas are representative of the worldwide dataset. Based on the updated regression equations, the largest magnitude of the 1811-1812 events was reduced to M8.1. The methodology used by Johnston can provide different results if some plausible changes in assumptions are considered. One plausible hypothesis suggests that the reduced areas should be computed using double western portion of the isoseismals. This method is valid on the premise that crust west of the NMSZ is representative of other SCRs and it should be used with the worldwide database. The use of such an approach would reduce the magnitude by about 0.5M. As another plausible hypothesis, the MMI – M correlation can be re-examined in terms of data available from the 1988 M5.8 Saguenay, Quebec earthquake, which is a more recent event with reliable data for both moment magnitude and MMI intensities. A comparison of the Saguenay earthquake with the correlation equation shows that for all MMI levels this event is an outlier (Figure 2 in Johnston’s paper [27]). Forcing the regression line to go through this data point would also reduce the original estimate by about 0.5M. It should be noted that these comparisons are only intended to demonstrate the range of plausible lower bound scenarios.
23
Hough, et al. Study Hough, et al. [22] extended Johnston’s study through the use of more consistent MMI isoseismal areas. Johnston used the isoseismals delineated based on the compilation of about 40 felt reports. Hough et al. delineated a new set of MMI contours using an expanded library of more than 100 accounts primarily compiled by Street in 1984 [49]. The procedure used by Hough et al. for assigning the MMI values to the damage and felt reports was designed so that more weight was given to the descriptive damage accounts and earthquake effects as opposed to the portrayal of peoples’ emotions and perceptions as to the observed intensity of ground motion. Where multiple records were available, the MMI values were averaged over all accounts for a given location instead of using the most dramatic account. The accounts that explicitly documented a difference in the intensity of shaking due to site effects along the river banks were assigned an MMI value with consideration for the presumed soil amplification effect. As a result of this reassessment of MMI assignments, many accounts were downgraded as compared to Street and Nuttli [48] as well as some errors were corrected. Using the same M-MMI correlation equations developed by Johnston [27], moment magnitudes of M7.2-7.3, M7.0, and M7.4-7.5 were obtained for the three main shocks, respectively. Bakun and Hopper The methodology proposed by Bakun and Hopper [5] used an MMI attenuation function to compute the earthquake magnitude required to produce the reported level of ground motion intensity on a site-by-site basis. The final earthquake magnitude estimate was then calculated as a mean of the magnitude estimates for all sites with available historic accounts of the 1811-1812 events. The MMI attenuation function was developed based on eastern North American events and site adjustment factors were estimated to account for observed intensity inconsistencies at each site relative to the predictions of the empirical attenuation function. MMI intensities were assigned to the historic accounts for use with the attenuation functions. The root mean square technique and a weighting function were employed to bound the earthquake locations for calculating epicentral distances. The proposed methodology produced magnitude estimates of M7.2, M7.1, and M7.4 for the three main shocks, respectively. As an alternative, MMI intensities assigned by Hough et al. [22] were used with the model and produced M6.9, M6.9, and M7.3, respectively. The latter magnitudes were interpreted as lower bound estimates due to a reassessment of MMI assignments. One advantage of this approach was that the attenuation model was developed based on eastern US earthquakes such that it could be directly used with the 1811-1812 MMI intensities without introducing a systematic bias attributed to the use of worldwide datasets. In addition, because the method did not rely on isoseismal areas, it did not require estimation of attenuation rates west of the NMSZ where historic accounts were unavailable. Moreover, it was the first effort that addressed site effects in a consistent manner. It also should be noted that the attenuation function used in this study was primarily constrained by small to moderate events. Two events that bound the attenuation model in the range of magnitudes approaching the 1811-1812 events are the 1925 M6.3 Charlevoix, Quebec and the 1929 M7.2 Grand Banks, Newfoundland earthquakes. This limitation contributes to uncertainty associated with the magnitude estimates similarly as noted in the discussion on Johnston’s estimates.
24

Comparison with the 2001 M7.6-7.7 Bhuj The 2001 M7.6-7.7 Bhuj earthquake is an event having attributes very similar to the 1811-1812 events. Both seismic regions exhibit characteristic behavior with a relatively low rate of small and moderate earthquakes. Moreover, both earthquakes occurred in intraplate setting and produced comparable isoseismal areas [7]. However, different attenuation rates have been reported for Indian continent and the CEUS [18] such that the 1811-1812 earthquakes would need to have a somewhat smaller magnitude to produce similar isoseismals. 3.2.2 Magnitude Estimation Based on Building Vulnerability 3.2.2.1 General The existing estimates of the magnitude of the 1811-1812 earthquakes are based on correlations with modern events of smaller magnitude generated by other seismic sources. The objective of this section is to attempt to draw conclusions based on information directly relevant to the 1811-1812 events, i.e., performance of structures during these events. The proposed technique is unique to this study and provides estimates that are independent from the previous investigations. Because the “true” magnitude of the New Madrid earthquakes is defined as a weighted average of the independent estimates, it is important to use several unrelated approaches to avoid biased or erroneous conclusions due to the reliance on a single method. Therefore, findings of this study are valuable in terms of providing an independent constraint for existing estimates. The performance of structures during 1811-1812 earthquakes provides crucial input for the assignment of MMI levels VI and higher. Therefore, a consistent interpretation of building performance is important for making accurate inferences about the event magnitude when using MMI-based correlations. In recognition of the need to better understand the seismic response of historic buildings, a survey of existing buildings that predated the 1811-1812 earthquakes was conducted and documented in Appendix A. To examine damage patterns due to the 1811-1812 earthquake sequence and to provide data for future studies on building vulnerability, historic accounts were examined and those having evidence of structural damage were summarized in Appendix B. This section presents a structural damage map developed based on the compiled information from the historic accounts and discusses issues relevant to interpretation of structural damage accounts for use with magnitude estimation procedures. In addition, two case studies that investigate response of structures during the 1811-1812 earthquakes are presented. The first case study evaluates chimney damage in St. Louis, MO, and the second case study examines the response of a brick building and chimneys in Ste. Genevieve, MO. 3.2.2.2 Structural Damage Patterns Due to 1811-1812 Earthquakes The objective of this section is to document the extent of the area that experienced structural damage to buildings from the 1811-1812 earthquake sequence and to depict structural damage patterns on a map of the CEUS. This map should serve as a practical visual aid for engineering professionals and builders that lack direct expertise in seismology for interpretation of MMI intensity maps. The “language” of structural damage can be more effective in communicating concepts of seismic hazard to the map users. In addition, the map can serve as a tool for
25

illustrating the likely maximum extent of structural damage to vulnerable structures due to a potential characteristic earthquake in the NMSZ. Street and Green [50] compiled historic newspaper accounts and other historic records that contained information on the effects of the 1811-1812 earthquakes. This document became the most comprehensive source of reports of damages from to the New Madrid earthquakes. The accounts reported by Street and Green and accounts documented by Penick [26] were reviewed and those that provided evidence of structural damages were selected and summarized in Table B1 (Appendix B). Accounts that contained other information relevant to interpretation of the observed structural damages, such as site effects, were also reported in Appendix B. The selected accounts were categorized according to the severity of damage and plotted on a map of the CEUS (Figure 10). The rating scheme used three discrete damage states: house or chimney crack or equivalent (1), chimney collapse or house crack or equivalent (2), and house collapse (3). It should be noted that unreinforced brick masonry construction built with lime- or clay-based mortar is very vulnerable to ground shaking, and even slight movement can cause substantial cracking and damage. Isoseismals were delineated to circumscribe sites assigned to the same damage category (with exception of Richmond, VA which would create an abnormal protuberance in the corresponding isoseismal and is likely to be an outlier). This method of isoseismal definition resulted in an extreme portraying of damage patterns. Therefore, this map should not be used to make inferences about the mean value of magnitude of the event or the mean value of ground motion at each site. The intent of the map is only to be a visual representation of the maximum damage range for individual buildings of vulnerable construction according to historic accounts.
26

3
1
1
2
2
Houses collapse (rating 3) Chimneys collapse Houses cracked (rating 2) Chimney cracked (rating 1)
Figure 10
Sites With Damage Accounts Due to the 1811-1812 Earthquakes Distribution of sites assigned Ratings 1 or 2 (Figure 11) indicates a wide range of distances associated with each type of damage. Sites assigned Rating 1 have a mean value of 400 miles with normal standard deviation of 160 miles and a maximum distance of 670 miles (Richmond, VA). Sites assigned Rating 2 have a mean value of 131 miles with a normal standard deviation of 50 miles and a maximum distance of 240 miles (Louisville, KY). This degree of scatter can be attributed to a number of factors including variability of ground motion path, variability in building performance, site effects, human factor (i.e., exaggerated damage), secondary effects such as foundation settlement triggered by weak seismic waves, coincidences, remotely triggered earthquakes, etc. A combination of these factors can produce accounts of damage that are not representative of the entire population of buildings or the mean estimate of ground motion and should be treated as outliers.
27

0
1
2
3
4
5
6
7
50 100 150 200 250 300 350 400 450 500 550 600 650
Distance, miles
Num
ber o
f site
s
Rating 1
Rating 2
Rating 1 : mean = 400 milesRating 2: mean = 131 miles
Figure 11 Distribution of Sites With Structural Damage by Distance
The variability of ground motion (i.e., load) in combination with the variability in building performance (i.e., resistance) can provide a scientific explanation of damage to individual structures where the majority of building stock did not sustain injury. In concept, there is always some chance that the structures with least resistance happened to experience the highest levels of ground motion. Therefore, unless the scatter associated with both distributions is included in the analysis, it is difficult to make meaningful inferences about the mean value of the ground motion distribution and the mean value of the magnitude of the event. A methodology that provides this concept with a mathematical basis is discussed in the next section in the context of modeling chimney damage in St. Louis due to the December 16, 1811, earthquake. 3.2.2.3 Methodology for Earthquake Magnitude Estimation based on Frequency of
Chimney Failures in St. Louis, MO, Due to December 16, 1811 Shock This section presents a methodology for estimation of damage caused to chimneys in St. Louis, MO, due to the December 16, 1811 earthquake. Although applied to the historic earthquakes of 1811-1812, this approach can be readily applied to modern earthquakes or other types of natural disasters. The specific objective of this section is to establish a correlation between a historic account of chimney damage and magnitude of the December 16, 1811, shock. A statistical method of analysis, referred to as Monte Carlo simulation, is used to model the chimney failure rates due to plausible levels of ground motions. According to a single account of damage in St. Louis from the December 16, 1811, earthquake, “no lives have been lost, nor has the houses sustained much injury, a few chimneys have been thrown down, and few stone houses split” (Table B1, Appendix B). To conduct a damage assessment of chimneys, the statement of “a few chimneys” should be interpreted in numerical terms. Descriptions of contemporary St. Louis vary in portraying the town’s building stock from 180 houses in 1804 to as many as 300 houses in 1806 [14]. In 1811, the population was estimated at about 1,200 people, growing to as many as 3,000 by 1816. Based on this information, it can be assumed that at the time of the event, St. Louis had between 200 and 300
28

houses. It can be further stipulated that the majority of these houses had one chimney and some of the houses had two or more chimneys. Therefore, the total population of chimneys exceeded 200, providing a sample size sufficient for conducting a meaningful statistical analysis. For the purposes of this study, it is assumed that the total number of chimneys was 250. Therefore, “a few” is interpreted as 37, 25 or 13 chimneys corresponding to the total rate of failure of 0.15, 0.10, or 0.05, respectively, with a rate of in the range of 0.10-0.15 as the preferred estimate for making inferences about the magnitude of the event. It should be noted that the reported growth of the town right after the 1811-1812 earthquakes by almost a factor of three in just five years serves as an indicator that the damage was perceived by the community as insignificant and it did not cause major economic implications. A Monte Carlo simulation requires input of distribution functions for load and resistance. Both parameters are modeled as lognormal variables. The median load value, expressed in terms of PGA, is determined using Frankel et al. [18] and Toro et al. [51] attenuation functions. The distance from St. Louis to the source of the December 16, 1811 earthquake is measured to the northern tip of the fault identified by Bakun and Hopper [5] for the corresponding event and is estimated as 270 km. Three values of lognormal standard deviation of the ground motion parameter, σ, are included in the sensitivity analysis: 0.3, 0.4, and 0.5. This range of standard deviation represents intra-event variability that can be expected during individual events. This level of variability is less than the total σ of 0.75 currently used for the CEUS [18]. The ground motions are modified to account for site effects using site class definitions of the IBC-2000. According to a soil amplification map developed by the Missouri Geological Survey for implementation with FEMA’s HAZUS loss estimation software package, the St. Louis area is categorized as site class C or F with islands of classes B and D [46]. Based on descriptions of location of St. Louis predating the 1811-1812 earthquakes [14], the majority of sites should be assigned class F that corresponds to amplification of short period ground motions by a factor exceeding 2.5. The amplification map is developed at a scale of 1:250,000 and it is not intended for site specific work. However, because this study examines a population of sites rather than an individual site, the level of detail is interpreted as satisfactory for meeting the study objectives. Bakun et al. [6] assigned St. Louis an empirical site correction factor of 1.16 MMI units, which means that MMI intensities in St. Louis are 1.16 MMI units higher than estimated using an average MMI attenuation function developed based on eastern US earthquakes [5]. According to a PGA-MMI model of Trifunac and Brady [52], one MMI level increase corresponds to about a twofold increase in PGA. This site correction factor provides empirical evidence of significant site amplifications observed in St. Louis during more recent events. Large amplification factors for low amplitude ground motions have also been reported during recent large earthquakes. For example, during the 1985 Mexico City and 1989 Loma Prieta earthquakes, low amplitude peak ground accelerations were amplified by factors ranging from 1.5 to 4.0 at sites containing soft clay layers [9]. The effect of soil amplification on response of historic building chimneys is not well documented. Therefore, it was decided to use a conservative (lower) soil amplification of 1.6 (site class D for short period structures). The resistance model for historic chimneys was adopted from a study conducted by Whitman [57] on earthquake damage to brick chimneys during the 1755 Cape Ann Earthquake in Boston, MA. A cumulative lognormal function (Figure 12A) was fit to the discrete theoretical probabilities of chimney failures developed by Whitman based on structural analysis of various chimney configurations typical to the construction of that historic period. For purposes of this
29

study, it is assumed that this function is also representative of the chimney population of contemporary St. Louis and the sensitivity of results to the resistance model is investigated for two alternative scenarios (Figure 12B-C). In all likelihood, chimney construction may have been poorer due to the “frontier” nature of the Missouri territory at the time of the 1811-1812 New Madrid earthquakes.
0
2
3
4
5
6
7
8
9
0 0.1 0.2 0.3 0.4 0.5
PGA, g
Fitted Function
Whitman's data points
Median=0.10gσ=0.75
0
0.1
0.2
0.3
0.4
0.5
0.6
0.7
0.8
0.9
1
0 0.1 0.2 0.3 0.4 0.5
PGA, g
Prob
abilit
y of
Fai
lure
Fitted Function
Whitman's data points
Median=0.12gσ=0.75
0 0.1 0.2 0.3 0.4 0.5
PGA, g
Fitted Function
Whitman's data points
Median=0.14gσ=0.75
A. BASELINE CASE B. DECREASED RESISTANCE C. INCREASED RESISTANCE Figure 12
Fragility Functions for Brick Chimneys Modeled with Cumulative Lognormal Distribution Using a Monte Carlo simulation, the rate of failure was calculated as the total simulated number of failures divided by the total number of simulated trials. Ten thousand simulation cycles were performed for each scenario. A failure was identified by a negative value of the performance function defined as:
0<−= LARG (1) where: G = performance function; R = resistance for a given trial; A = amplification for a given trial; and, L = load for a given trial. A spectrum of scenarios was investigated to capture the sensitivity of results to the plausible ranges of the input variables. Three magnitude estimates of the December 16, 1811, shock were investigated: M7.2 (Bakun and Hopper estimate and lower bound of Hough’s estimate), M8.1 (Johnston’s estimate), and M7.7 (intermediate estimate). The sensitivity of failure rate to the variability of ground motion and the plausible scenarios of the resistance model were also investigated. The relationship between the load and resistance distribution functions for one set of variables is depicted in Figure 13.
30

0
5
10
15
20
25
30
35
0 0.05 0.1 0.15 0.2 0.25 0.3
PGA, g
Freq
uenc
y
Chimney FailureMedian = 0.12
σ = 0.75
Ground MotionMedian = 0.035g
σ = 0.4
Figure 13
Relationship Between Load and Resistance Distribution Functions Chimney failure rates for each scenario of input variables are summarized in TABLE 5. The failure rates are most sensitive to the choice of attenuation function with the effect varying by a factor of 4.6 to 2.2. Based on the assumption that the preferred failure rate is in the range of 0.10-0.15, a magnitude of M7.2 in combination with the average attenuation function provides the best correlation between the ground motion and resistance models. Magnitude M7.7 in combination with the Toro et al. function also provides a plausible range of failure rates. Magnitude M8.1 produces failure rates as high as 66 percent and can not be supported by the damage evidence. In addition, M8.1 would produce a longer fault causing a further increase in the failure rates due to the decreased distance from the rupture to St. Louis.
TABLE 5 RESULTS OF MONTE CARLO SIMULATION OF CHIMNEY DAMAGE
CHIMNEY FAILURE RATE MOMENT MAGNITUDE OF THE DECEMBER 16 EARTHQUAKE
M7.2 (Bakun and Hopper, Hough) M7.7 M8.1 (Johnston)
Attenuation function PGA1,2, g
RESISTANCE MODEL
σ (ground motion)
Frankel 0.040g
Toro 0.019g
Ave. 0.029g
Frankel 0.063g
Toro 0.029g
Ave. 0.046g
Frankel 0.089g
Toro 0.040g
Ave. 0.065g
0.3 0.22 0.05 0.12 0.41 0.12 0.27 0.58 0.22 0.43
0.4 0.23 0.05 0.13 0.42 0.13 0.28 0.58 0.23 0.43 Median=0.12
σ=0.75 (baseline)
0.5 0.24 0.06 0.15 0.43 0.15 0.29 0.58 0.24 0.44 Median=0.10
σ=0.75 0.4 0.31 0.08 0.18 0.50 0.18 0.36 0.66 0.31 0.52
Median=0.14 σ=0.75 0.4 0.18 0.04 0.10 0.34 0.10 0.23 0.51 0.18 0.36
1PGA value does not include site amplification. 2Toro et al. ground motions were multiplied by 1.52 to provide consistent basis with the Frankel et al. function [18].
31
In summary, the chimney damage analysis suggests the following plausible combination of variables that provide failure rate estimates supported by the historic damage account in St. Louis:
• magnitude: M7.2; and • attenuation function: average of Frankel et al. and Toro et al.
Therefore, this analysis supports the Bakun and Hopper and Hough et al. magnitude estimate of the 1811-1812 earthquakes when the attenuation rate corresponding to the average of two selected attenuation functions is used. Results of this simulation are relatively insensitive to ground motion σ and should not be used to make inferences about the appropriate choice of σ within the range of 0.3 to 0.5 investigated in this case study. This methodology can be further applied to explain failure of individual chimneys at remote locations. As an example, a 90th percentile of the ground motion distribution function calculated using the Toro et al. attenuation model with σ=0.5 and a soil amplification factor of four, which has been reported for selected sites during the 1994 Northridge earthquake, are used. The chimney resistance corresponding to the 10th percentile of the baseline fragility curve is further assumed. For this combination of variables, a chimney failure can occur at a distances of 600 km (350 miles) for an event of magnitude M7.5 (Hough et al. maximum magnitude for the entire 1811-1812 sequence). Therefore, to derive the mean estimate of an event magnitude, either the described methodology should be used in the reverse order or a full population of records of building performance should be used for a given distance. This example illustrates that damage of single structures at large distances from the epicenter without special examination of building vulnerability and site effects can be misleading and should not be used as evidence of the magnitude and extent of historic earthquakes without adequate substantiation. 3.2.2.4 Performance of Chimneys and a Brick House in Ste. Genevieve, MO The objective of this section is to make inferences about the magnitude of the 1811-1812 earthquakes based on evidence of the performance of chimneys and a brick house in Ste. Genevieve, MO. As documented in the historic building survey (Appendix A), many existing houses located in Ste. Genevieve, MO predated the earthquakes and had their original chimneys replaced or repaired. It can be stipulated that some of these chimneys were damaged during the earthquakes. Because the population of houses was insufficient to conduct a statistical analysis, a PGA of 0.10g was used as the threshold for a chimney failure (see Figure 12A). In addition, a brick house constructed in Ste. Genevieve, MO in 1804 known as the Old Brick House (#11, Table A1, Appendix A) was identified as one of the structures that survived the earthquakes with limited (gable end walls) or no damage. To estimate the ground motion that would produce this level of response, results of seismic analysis of a similar building were adopted. Luft and Whitman [33] analyzed a historic brick house of similar configuration located in Boston, MA for the purpose of making inferences about the level of ground motion intensity during the 1755 Cape Ann earthquake. Findings of this study were scrutinized for applicability to the Old Brick House and it was concluded that the ground motion should not have exceeded a PGA of 0.10g.
32

This combination of chimney and the Old Brick House damage criteria provides the lower and upper bound of the ground motion estimate, respectively. A stronger shock would cause a greater level of damage to the Old Brick House, whereas a weaker shock would cause fewer chimney failures. Based on this information, a deterministic analysis can be performed to calculate the magnitude of the earthquakes required to produce this level of ground motion. Each of the three major earthquakes in the 1811-1812 sequence were compared to determine the maximum ground motion produced in Ste. Genevieve, MO using the magnitudes and fault locations proposed by Hough et al [22]. The comparison indicated that the February 7, 1812, earthquake caused the highest level of ground motion at this location. The distance of the corresponding fault was estimated as 160 km. The soil amplification map [46] was examined to determine the site category for the old town of Ste. Genevieve. According to the map, the area was assigned site categories F and B with the borderline between the categories running through the middle of the old town. The Old Brick House was located directly on the margin of the F zone and could be assigned either F or B. In case of chimneys, some chimneys were located in F and others in B. Therefore, a range of amplification factors was investigated to measure the sensitivity of results to the soil amplification: 0.9 (site class B), 1.0 (B-C boundary), 1.2 (C-D boundary), and 1.6 (D-E boundary). TABLE 6 summarizes results of the analysis assuming that deterministic ground motion (PGA) in Ste. Genevieve was 0.1g (without amplification).
TABLE 6 RESULTS OF STRUCTURAL DAMAGE ANALYSIS FOR STE. GENEVIEVE, MO
Magnitude estimate, M Soil amplification factor
Target PGA, g Event Distance Attenuation function
0.9 0.11g
1.0 0.10g
1.2 0.083g
1.6 0.063
Frankel et al. M7.5 M7.4 M7.1 M6.9 Toro et al.1 M8.3 M8.2 M8.0 M7.6 February 7,
1812 160 km Average 7.9 M7.8 M7.5-7.6 M7.2-7.3
1Ground motion was multiplied by 1.52 to provide consistent basis with the Frankel et al. function [18]. Due to the limited sample size for both house and chimney analyses and due to the uncertainty in the soil amplification factors, results of this study should be considered only as a benchmark that provides a plausible range of estimates. Consistent with discussions in previous sections, the maximum magnitude estimates range from as low as M6.9 to as high as M8.3. If the ground motion is averaged between the Frankel et al. and Toro et al. attenuation functions and amplification of 1.2 is accepted as the average preferred value, the damage evidence supports an event of magnitude M7.5-7.6. It should be noted that interpretations of damage in Ste. Genevieve should also consider the cumulative damage effects caused by multiple shocks over the period of several months. Similar to the findings from the previous section, magnitude estimates are sensitive to the choice of the attenuation function. A high degree of uncertainty should also be attributed to the location of the epicenter of the event. In addition, during the preparation of this report a historic account from Ste. Genevieve became available [23]. According to this account, earthquakes were felt in Ste. Genevieve, but did not cause structural damage. While this is only one account and it is possible that some damage to chimneys did occur, it provides additional indication towards the lower estimates from TABLE 6.
33
3.2.2.5 Conclusions Results of this study are consistent with the magnitude estimates of Bakun and Hopper [5] and Hough et al. [22] (TABLE 3). This conclusion is mainly based on the fragility analysis of chimneys in Ste. Genevieve, MO due to the December 16, 1811 shock. The presented methodology of using building vulnerability compliments the existing MMI-based procedures and provides additional reassurance of the overall stability of the existing magnitude estimation procedures. Because attenuation functions currently used with the seismic hazard map are incorporated in the analysis, the proposed approach helps close the loop between magnitude estimation procedures on the basis of building vulnerability and implementation of the estimates in the building codes which are intended to control building vulnerability. The presented methodology can be further implemented to conduct structural analysis for other locations with accounts of damage due to the 1811-1812 New Madrid earthquakes and other historic events such as the 1886 Charleston, South Carolina earthquake. In addition, the historic buildings identified in this study (Appendix A) should serve as a correlation point to the 1811-1812 earthquakes should a major event occur in the future. 4.0 Sensitivity Studies 4.1 BACKGROUND The introduction of the 1996 USGS map was followed by a number of studies on uncertainty attributed to the hazard assessment procedures in the CEUS and NMSZ. Results of these studies contributed to the disclosure of the assumptions involved in the map formulation and to the quantification of the map sensitivity to the plausible ranges of the input variables. Selected publications are briefly summarized to form the basis for additional research documented in following sections. As a continuation of the 1996 USGS hazard map project, Frankel et al. [17] conducted an uncertainty analysis for selected cities in the CEUS using a Monte Carlo simulation by varying the input parameters including a-value, b-value, characteristic magnitudes and recurrence intervals, upper bound of integration for historic seismicity, etc. A discrete distribution function with three equally probable values was used for each variable. Three estimates were apparently selected to represent the lower bound, median, and upper bound of each variable. As a measure of uncertainty, a ratio of the 85th and 15th percentile was calculated for 0.2 sec SRA at 10 percent probability of exceedance in 50 years. A comparison of this ratio for different geographical locations indicated a general trend of higher uncertainty (ratio up to 15) in the regions with little historic seismicity such as Houston and Orlando. Ratio of around 4 was assigned to Memphis, TN located in the direct vicinity of the NMSZ. Cramer [12] determined the relative contribution of logic-tree elements to the total uncertainty attributed to the NMSZ. Results showed that the uncertainty in the location of the characteristic earthquake is the major source of the total uncertainty with the coefficient of variation (COV) exceeding 0.6 for locations near the faults. Individual contributions of attenuation functions, characteristic magnitude, and characteristic recurrence interval for 0.2 sec SRA corresponded to a standard deviation of <0.3. The author recommended a prioritization of future research efforts so that the focus is on the parameters contributing most to the total uncertainty. To capture the
34

compete picture of hazard and uncertainty, it was also recommended to replace discrete distributions with continuous distribution functions for modeling the uncertainty in the magnitude and recurrence interval of the characteristic event. In another paper, Cramer [11] reported more detailed results from the same uncertainty analysis for the NMSZ. The logic tree included epistemic uncertainty in rupture models and location of pseudo and actual faults, magnitude and recurrence interval of the characteristic events, attenuation functions, historic seismicity, and other parameters of hazard characterization. The author stated that “any alternative model built from a logic tree must satisfy the set of available independent scientific constraints”, but “much of the New Madrid geologic and geophysical data are not well enough understood to provide meaningful constraints on seismic hazard models.” Using Monte Carlo sampling of the logic tree, a mean hazard map and an uncertainty map presented in terms of COV were produced for the NMSZ. The hazard map developed in this study was in good agreement with the 1996 USGS hazard map. The COV was reported to decrease from >0.6 over the NMSZ to about 0.1 away from the location of the faults. Newman et al. [37] discussed the ramifications of the hazard uncertainty in the NMSZ on the stakeholder decision making processes. As one approach for a meaningful communication of uncertainty to the stakeholders, it was suggested to provide multiple hazard estimates to manifest the spectrum of professional opinion on the subject. This proposition is equivalent to the development of an individual map for each branch of the logic tree such that a suite of maps would be produced to explicitly disclose the epistemic uncertainty. The researchers further supported the use of companion maps that would directly depict measures of uncertainty. The authors also indicated that one of the consequences of using long return intervals for CEUS was an increased uncertainty. A sensitivity analysis showed that the use of upper and lower bound estimates for moment magnitudes (M8.0 and M7.0, respectively) in combination with three alternative attenuation functions produced ground motions varying by a factor of 10 for St. Louis and 13 for Memphis. A set of companion maps were produced to illustrate the effects of different modeling assumptions. 4.2 SENSITIVITY STUDIES FOR THE NMSZ This section presents results of sensitivity studies conducted to investigate the impact of some input parameters on the hazard estimates and assignment of SDCs. A computer code was developed using Visual Basic for Applications computer language to calculate seismic hazard curves. The computer code, referred to as the RC code, was validated through comparison with the USGS predictions for three locations: Memphis, St. Louis, and New Madrid calculated using the Hazard by Lat/Lon option on the National Seismic Hazard Mapping Project website at http://geohazards.cr.usgs.gov/eq/. These locations were selected to represent the spectrum of localities affected by the NMSZ to various degrees. New Madrid is situated near the modeled faults. Memphis and St. Louis are located about 40 km and 170 km away from the closest modeled fault, respectively. The comparison (TABLE 7) indicated good overall agreement with the USGS values with an average error of 3.8 percent. The maximum error of 11 percent was observed for New Madrid where the results were highly sensitive to the location of the faults and the difference was probably associated with the methodology used to estimate the distance between the site and the fault. However, the RC code showed consistency in identifying the overall trend between three locations and the degree of accuracy was accepted as sufficient for capturing relative changes in hazard estimates for implementation with sensitivity analyses. All
35

sensitivity studies are performed for 0.2 sec spectral response acceleration because it characterizes the part of the response spectrum used for the design of low-rise residential construction.
TABLE 7 VALIDATION OF THE RC CODE
PGA1, g 0.2 SEC SRA1, g LOCATION (LAT/LON) CODE 500 YRP 1000 YRP 2500 YRP 500 YRP 1000 YRP 2500 YRP
Memphis (35.1/-90)
USGS RC
Error, %
0.137 0.143 4.0%
0.284 0.292 3.0%
0.625 0.606 3.0%
0.272 0.281 3.3%
0.565 0.564 0.2%
1.236 1.181 4.4%
St. Louis (38.6/-90.2)
USGS RC
Error, %
0.100 0.104 4.0%
0.171 0.174 1.8%
0.303 0.315 4.0%
0.212 0.217 2.3%
0.350 0.350 0.0%
0.598 0.600 0.3%
New Madrid (36.6/-89.5)
USGS RC
Error, %
0.231 0.243 5.2%
0.602 0.646 7.3%
1.590 1.766 11.1%
0.418 0.439 5.0%
1.165 1.184 1.6%
3.375 3.634 7.7%
1 Soil class: B/C boundary. 4.2.1 Magnitude-Recurrence Interval of Characteristic Events (Sensitivity Study 1) The objective of this sensitivity study was to investigate the impact of the characteristic magnitude and recurrence interval estimates on the level of ground motion and assignment of SDCs in two metropolitan areas affected by the NMSZ: Memphis, TN, and St. Louis, MO. The following alternatives were investigated with the input parameters selected to represent the upper, mean, and lower bound of the estimate:
• Return interval of characteristic event: RI=300 years, RI=500 years, and RI=700 years. In Section 3.1, RI of 500 years was identified as a mean estimate for characteristic events. RI of 300 years represents the apparent decreasing trend observed between the last three events, whereas RI of 700 years reflects the chance that one of the previous events had a smaller magnitude.
• Magnitude of the characteristic event: M7.3, M7.5, and M7.7. Based on results of Section 3.2, M7.4-7.5 represents a mean estimate of the 1811-1812 earthquakes. M7.7 is the magnitude used with 2002 USGS update [19], whereas M7.3 was identified as a magnitude that corresponds to potential downgrade due to MMI reassessment.
Results of this sensitivity study are summarized in TABLE 8. Because ground motions are reported for B/C boundary site conditions, the provided estimates should be used only for relative comparison and are not intended for use as a design basis at a specific site location. For the given set of variables, the level of ground motion varies by a factor of 1.84 in Memphis and 1.26 in St. Louis. This corresponds to a range of two SDC (E to D1) in Memphis and a consistent SCD (C) in St. Louis. These results indicate that it is possible to overestimate or underestimate hazard by as much one SDC in Memphis just due to the uncertainty within a fairly narrow range of credible parameter estimates. In St. Louis, hazard estimates are relatively insensitive to the plausible ranges of the magnitude and recurrence interval of the characteristic model. This observation is due to the fact that the degree of influence of the characteristic model decreases away from the NMSZ and the hazard estimates are dominated by historic seismicity modeled using the Gutenberg-Richter relationship (Appendix C).
36

The use of M7.4-7.5 identified as the preferred magnitude estimate in Section 3.2 in lieu of M7.7 (2002 USGS map update [19]) reduces the ground motion estimates in Memphis by 12-17 percent.
TABLE 8 RESULTS OF SENSITIVITY STUDY 11,2
0.2 SEC RESPONSE ACCELERATION, g @ 2,500 YRR
SDC3 MEMPHIS ST. LOUIS
CHARACTERISTIC MODEL
ATTENUATION FUNCTION Magnitude RI
300 1.77 E
0.67 C
500 1.40 D2
0.61 C M7.7
700 1.19 D1
0.58 C
300 1.53 D2
0.62 C
500 1.23 D1
0.57 C M7.5
700 1.06 D1
0.55 C
300 1.34 D2
0.58 C
500 1.09 D1
0.55 C M7.3
700 0.96 D1
0.53 C
1Seismic design category is assigned based on site class B (no amplification relative to the predictions of attenuation functions). 2Attenuation functions: Frankel et al. [18]and Toro et al. [51]. 3Calculated based on 2/3*SRA@2,500 YRP.
4.2.2 Aleatory Uncertainty (Sensitivity Study 2) The objective of this exercise is to investigate the sensitivity of the hazard estimates for sites affected by the NMSZ to plausible ranges of the aleatory uncertainty, σ, in local attenuated ground motion (Appendix C). Due to the lack of modern seismicity in the CEUS, σ was derived primarily based on small and moderate magnitude earthquakes having occurred throughout eastern Canada and United States. For short period ground motions, a uniform σ of about 0.75 was recommended by SSHAC [45] for the entire range of earthquake magnitudes and ground motion amplitudes. In the WUS, where more data is available for measuring σ, a trend of reduction in ground motion variability was observed with increasing magnitude and amplitude of ground motions. For example, σ of about 0.75 and 0.5 was estimated for WUS earthquakes with magnitudes in the range of M5.1-5.5 and M6.1-6.5 respectively for 0.2 sec SRA [15]. Similarly, σ as low as 0.39 for PGA≥0.21 and 0.55 for PGA<0.068 and 0.38 for M≥7.4 for a WUS earthquake database that included several worldwide earthquakes was reported in [10]. This sensitivity study is based on a premise that a
37
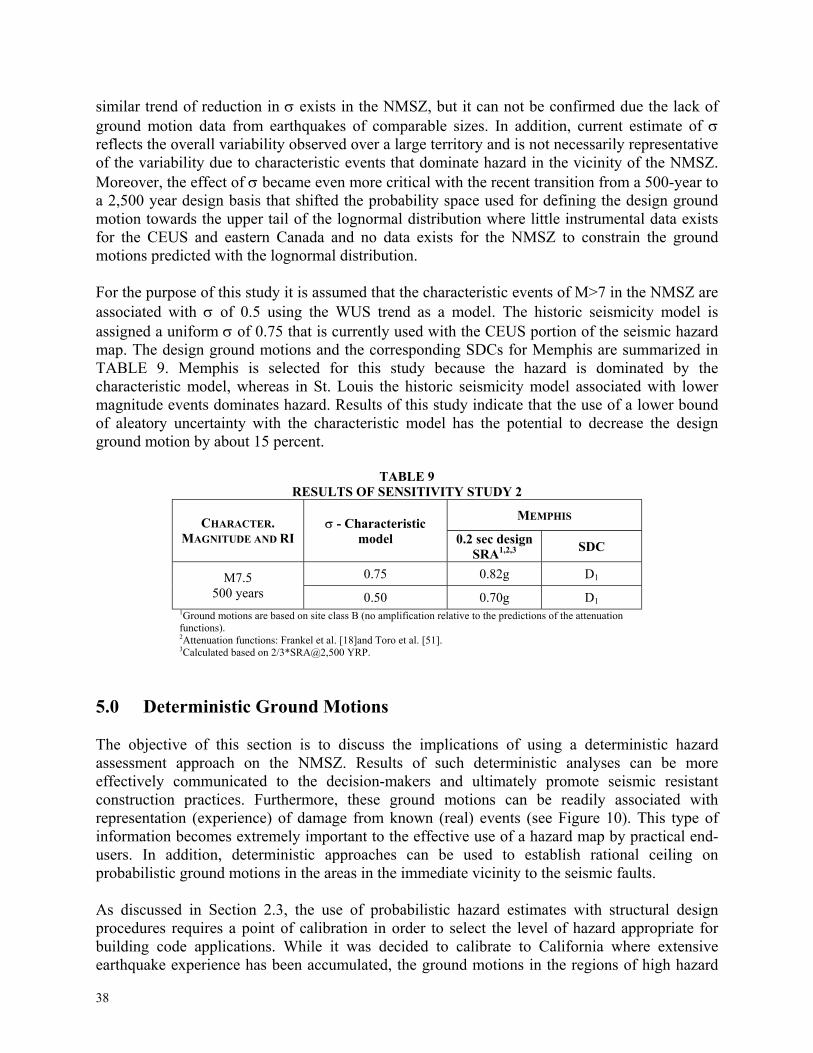
similar trend of reduction in σ exists in the NMSZ, but it can not be confirmed due the lack of ground motion data from earthquakes of comparable sizes. In addition, current estimate of σ reflects the overall variability observed over a large territory and is not necessarily representative of the variability due to characteristic events that dominate hazard in the vicinity of the NMSZ. Moreover, the effect of σ became even more critical with the recent transition from a 500-year to a 2,500 year design basis that shifted the probability space used for defining the design ground motion towards the upper tail of the lognormal distribution where little instrumental data exists for the CEUS and eastern Canada and no data exists for the NMSZ to constrain the ground motions predicted with the lognormal distribution. For the purpose of this study it is assumed that the characteristic events of M>7 in the NMSZ are associated with σ of 0.5 using the WUS trend as a model. The historic seismicity model is assigned a uniform σ of 0.75 that is currently used with the CEUS portion of the seismic hazard map. The design ground motions and the corresponding SDCs for Memphis are summarized in TABLE 9. Memphis is selected for this study because the hazard is dominated by the characteristic model, whereas in St. Louis the historic seismicity model associated with lower magnitude events dominates hazard. Results of this study indicate that the use of a lower bound of aleatory uncertainty with the characteristic model has the potential to decrease the design ground motion by about 15 percent.
TABLE 9 RESULTS OF SENSITIVITY STUDY 2
MEMPHIS CHARACTER. MAGNITUDE AND RI
σ - Characteristic model 0.2 sec design
SRA1,2,3 SDC
0.75 0.82g D1 M7.5 500 years 0.50 0.70g D1
1Ground motions are based on site class B (no amplification relative to the predictions of the attenuation functions). 2Attenuation functions: Frankel et al. [18]and Toro et al. [51]. 3Calculated based on 2/3*SRA@2,500 YRP.
5.0 Deterministic Ground Motions The objective of this section is to discuss the implications of using a deterministic hazard assessment approach on the NMSZ. Results of such deterministic analyses can be more effectively communicated to the decision-makers and ultimately promote seismic resistant construction practices. Furthermore, these ground motions can be readily associated with representation (experience) of damage from known (real) events (see Figure 10). This type of information becomes extremely important to the effective use of a hazard map by practical end-users. In addition, deterministic approaches can be used to establish rational ceiling on probabilistic ground motions in the areas in the immediate vicinity to the seismic faults. As discussed in Section 2.3, the use of probabilistic hazard estimates with structural design procedures requires a point of calibration in order to select the level of hazard appropriate for building code applications. While it was decided to calibrate to California where extensive earthquake experience has been accumulated, the ground motions in the regions of high hazard
38

of coastal California were capped using deterministic procedures. The methodology used to implement the deterministic cap is documented in Appendix A of the 2000 (1997) NEHRP provisions [9]. The trigger for the cap was set at 1.5g for the short period and 0.6g for the long period ground motions such that the areas below the trigger were assigned probabilistic ground motions and the areas above the trigger were assigned deterministic ground motions. The resultant map in California was such that the probabilistic design ground motions better corresponded to historically used values for regions of moderate seismicity, whereas the deterministic ground motions better corresponded to historically used values in high hazard regions near known faults. In effect, the probabilistic map was calibrated to the regions of moderate seismicity of California, whereas ground motions in high hazard areas were derived based on a fundamentally different methodology. Therefore, the deterministic approach may also be applicable to ground motions exceeding the selected triggers in the areas of high hazard in the NMSZ. The return period of maximum magnitude events for some regions of California is as short as 100-200 years, whereas the design return interval is 500 years. This trend was used as one of the reasons to justify the implementation of deterministic cap in the WUS. A similar trend exists in the NMSZ, where recent studies indicate a mean recurrence interval for characteristic events of 500 years (Section 3.1), but the return period of the design ground motions exceeds 1,000 years. This relationship provides further justification for implementing a deterministic cap in the NMSZ.
In this study, deterministic ground motions are computed for two locations where hazard is dominated by the characteristic model: near the eastern modeled fault [19] and Memphis. The methodology of hazard de-aggregation is used to categorize seismic sources by the degree of contribution to the total hazard. At more distant locations such as St. Louis, the historic seismicity model provides a significant contribution to the total hazard and, therefore, the probabilistic approach represents a more appropriate solution for combining hazard from both models in a meaningful manner. De-aggregated hazard curves for Memphis and St. Louis are shown in Figure 14 to illustrate the relationship between the characteristic and historic seismicities. The hazard curve for the location near the eastern fault is not shown because it is similar to Memphis with even a greater contribution of the characteristic model.
39

0.0001
0.0010
0.0100
0.1000
0.01 0.10 1.00 10.00
0.2 sec SRA, g
Annu
al R
ate
of E
xcee
danc
e10
100
1,000
10,000
500 YRP
2500 YRP
M7.5, RI=500Frankel et al. - 0.5w
Toro et al. - 0.5w
Historicmodel
TotalCharacter.model
Memphis
0.0001
0.0010
0.0100
0.1000
0.01 0.10 1.00 10.00
0.2 sec SRA, g
10
100
1,000
10,000
Ret
urn
Perio
d, y
ears
500 YRP
2500 YRP
M7.5, RI=500Frankel et al. - 0.5w
Toro et al. - 0.5w
Historicmodel
TotalCharacter.model
St. Louis
Figure 14 De-Aggregation of Hazard by Characteristic and Historic Seismicity Models
The characteristic model with M7.5 and the recurrence interval of 500 years was used in this exercise as consistent with the findings of Section 3. The weights for the three modeled faults of 0.25, 0.5, and 0.25, respectively, were adopted from the 2002 USGS map update [19]. Two attenuation functions were used: Toro et al. [51] and Frankel et al. [18]. The characteristic magnitude with the distance measured relative to the central modeled fault was used to estimate the deterministic ground motions. The use of the central fault was justified by the patterns of modern seismicity and was also consistent with the weighting scheme. It should be noted that if the closest modeled fault would be used, the deterministic ground motions would exceed the probabilistic counterparts for the investigated locations. This result is due to the logic-tree approach used with the probabilistic method to address the uncertainty in location of the future events. In a general case, the deterministic design ground motion can be defined as a median or a higher percentile from the probability ground motion distribution produced by the characteristic earthquake scenario. According to the current procedures for the WUS, a median value is used as the design ground motion and a median value increased by 50 percent is used as the maximum considered ground motion (i.e., map value) for regions where the probabilistic ground motions exceed the selected triggers. Where characteristic ground motion is of interest but the probabilistic value is below the required triggers, this study recommends the use of an 84th percentile to define the design level of ground motion. The 84th percentile is preferred in this study in lieu of the 50 percent increase because it provides a more transparent representation of the associated uncertainty while producing similar results when σ of 0.4 is used. This level of σ is consistent with ground motion variability during individual large magnitude events. For example, a σ of 0.4 or less was reported for M6.8 1995 Kobe earthquake in Japan [21] and for M6.7 1994 Northridge earthquake [34]. Results of the deterministic analysis are summarized in TABLE 10 for a near eastern fault location and Memphis. Near the eastern fault, the probabilistic ground motion exceeds 1.5g and the use of the deterministic ground motion is consistent with the procedures used in the WUS.
40

The median deterministic ground motion results in a reduction of about 40 percent relative to the design probabilistic value. To determine the maximum considered value (i.e., map value), the median deterministic value of 1.24g should be increased by 50 percent resulting in a ground motion of 1.89g. The probabilistic ground motions are less than 1.5g in Memphis and, therefore, the deterministic values are reported for reference purposes only and to provide a point of correlation for engineers in terms of expected ground motions due to a potential characteristic event along the central modeled fault. The 84th percentile of the attenuated ground motion from the deterministic event produces a slight decrease of the design ground motion (about 10 percent) relative to the probabilistic counterpart.
TABLE 10 DETERMINISTIC SHORT PERIOD (0.2 SEC) GROUND MOTIONS FOR SELECTED LOCATIONS
PROBABILISTIC VALUES
DETERMINISTIC SRA BASED ON DOMINANT
SOURCE (SDC) LOCATION
SRA@2,500YRP DESIGN SRA1 (SDC)
DOMINANT SOURCE
DOMINANT EARTHQUAKE
Median 84th percentile (σ=0.4)
(35.4, -90.2) Near eastern
modeled fault
3.29 2.19 (E)
Characteristic model
M=7.5 D2=27.4 km
1.24g (E) -
Memphis 1.18g 0.79 (D1)
Characteristic model
M=7.5 D2=64.3 km (0.47g)3 0.71g
(D1) 1Calculated based on 2/3*SRA@2,500 YRP. 2Distance to the center fault of the three modeled faults as it better represents the patterns of modern seismicity. 3Reported in parenthesis because it is not suitable for design applications.
In summary, the use of deterministically capped ground motions near the eastern and western modeled faults can be used for establishing design level ground motions. In addition, deterministic ground motions provide a useful tool for communicating the concept of seismic hazard to stakeholders using a language of “real” earthquake scenarios that have explicit attributes of seismic source such as location and event magnitude.
6.0 Summary, Conclusions, and Recommendations Results of this study further confirm the high level of seismic hazard in the NMSZ and the need for continued attention to and consideration of adequate mitigation measures. This high level of seismic hazard is evidenced by large earthquakes that have repeatedly occurred in the past reaching destructive magnitudes. The most recent sequence of earthquakes occurred in 1811-1812 producing ground motions that were felt as far away as the Atlantic seaboard and that caused damage to vulnerable structures as distant as several hundred kilometers from the epicenter. Studies of paleoseismology have proved that two more events of similar magnitude have occurred around A.D. 1450 and A.D. 900, respectively, with some evidence of other events in the more distant past. Magnitude of the 1811-1812 earthquakes represents an important input for seismic hazard characterization procedures in the NMSZ. Current magnitude estimates vary from M7.4 to M8.1
41

and are based on interpretation of MMI levels assigned to historic accounts. To provide an independent constraint for the MMI-based procedures, a unique methodology for estimation of magnitude of historic earthquakes using structural building performance was developed and implemented in this study. Because the ground motions were determined from the attenuation functions used with the current hazard characterization procedures, the proposed methodology helped close the loop between the magnitude estimation procedures based on building vulnerability and implementation of the results in building codes where concepts of seismic hazard and building vulnerability are integrated into structural design methods that are calibrated to an acceptable level of risk. Results of structural analysis supported the lower bound of existing magnitude estimates of the 1811-1812 earthquakes, i.e., M7.4-M7.5. The implementation of this magnitude estimate in lieu of M7.7 (current magnitude in [19]) will result in a decrease of the design ground motions by about 12-17 percent in the areas in the close vicinity of the modeled faults such as Memphis, TN. This effect diminishes with distance and is practically undetectable in St. Louis, MO. A sensitivity analysis has shown that for locations in a close vicinity to the NMSZ, such as Memphis, TN, it is possible to underestimate or overestimate hazard by as much as one seismic design category just due to uncertainty in a fairly narrow range of credible estimates of the magnitude and recurrence interval of the characteristic model. This effect diminishes with distance such that hazard in St. Louis is practically insensitive to this range of characteristic model scenarios. Another investigation of sensitivity of hazard in Memphis, TN to a plausible reduction of aleatory uncertainty, σ, for use with large magnitude events such as the NMSZ characteristic earthquake model showed that the design ground motion can be potentially reduced by an additional 15 percent. The effect of σ on the design level of ground motion has been increased by the recent transition to a 2,500-year basis due to the shift of the probability space used to estimate hazard toward the upper tail of the lognormal distribution where little empirical data exists to validate the predictions. The specific conclusions of this study include:
1) Significant seismic hazard exists in the NMSZ and adequate mitigation measures should continue to be developed that correspond to the life safety objective of the building code.
2) Recent studies of paleoseismology and magnitude estimation have improved the understanding of the past behavior of the NMSZ, whereas questions remain open as to the future behavior of the NMSZ.
3) Paleoseismic evidence indicates that the mean recurrence interval of characteristic events in the NMSZ is about 500 years with the last two events occurring about 360 years apart.
4) Studies of the magnitude of the 1811-1812 events based on reevaluated MMI assignments and the use of eastern US specific MMI attenuation functions estimated the magnitude of the largest earthquake of about M7.4-7.5. These estimates are supported by independent analysis of damage accounts from the 1811-1812 earthquakes based on structural fragility of historic buildings conducted in this study.
5) In addition to elevating hazard estimates, the transition to the 2,500-year basis for establishing structural earthquake loads resulted in increased uncertainty associated with the design level ground motions due to the shift of the probability space towards the upper tail of ground motion distribution.
6) Deterministic capping of ground motions in the immediate vicinity of the modeled faults in the NMSZ should be considered for establishing design level ground motions.
42

7) Hazard de-aggregation represents a useful and practical tool for communicating concepts and sources of seismic hazard to the stakeholders in a more transparent manner.
Based on the findings of this study, the following recommendations warrant attention and should be assigned high priority for future research and implementation:
1) Future post-earthquake damage assessments and building evaluations should proceed in a manner where statistically representative data is obtained and evaluated using structural reliability and fragility principles as applied in this study to the earthquakes of 1811-1812. Such studies will help to integrate seismic hazard parameters and building vulnerability parameters such that the “lessons learned” will become facts that guide future building code developments based on a robust and repeatable scientific method rather than subjective observations and perceptions from damages to individual vulnerable structures.
2) More research should be focused on understanding the relationship between the ground motion amplitude and the level of observed ground motion variability in the CEUS and NMSZ as well as the impact of site effects on the level of variability relative to building code-prescribed site amplification factors.
3) Expand the implementation of the structural fragility analysis methodology used in this study to include additional locations affected by the 1811-1812 earthquakes and other historical earthquakes such as the 1886 Charleston, SC event to improve magnitude estimates and foster a better understanding of earthquake effects in these regions.
4) In the event of a future destructive earthquake in the NMSZ, the historic buildings used in this study should serve as a point for correlation to past events.
43

7.0 References
[1] ________. Paleoseismology. 1996. Edited by James P. McCalpin. Academic Press, San Diego, CA.
[2] Algermissen, S, T. 1983. An introduction to the seismicity of the United States. Earthquake Engineering Research Institute, Oakland, CA.
[3] American Society of Civil Engineers (ASCE). 2000. Minimum design loads for buildings and other structures, ASCE 7-98. ASCE, Reston, VA.
[4] Applied Technology Council (ATC). 1978. Tentative provisions for the development of seismic regulations for buildings (ATC-3-06). ATC, Redwood City, CA.
[5] Bakun, W. H., and Hopper, M. G. 2002. The 1811-1812 New Madrid, Missouri, and the 1886 Charleston, South Carolina, earthquakes. In review.
[6] Bakun, W. H., Johnston, A. C., and Hopper, M. G. 2002. Modified Mercalli Intensities (MMI) for some earthquakes in eastern North America (ENA) and empirical MMI site coefficients for towns in ENA. Open-file Report 02-109. U.S. Department of the Interior, U.S. Geological Survey.
[7] Bendick, R., Bilham, R., Fielding, E., Gaur, V., Hough, S. E., Kier, G., Kulkarni, M. N., Martin, S., Mueller, K., and Mukul, M. 2001. The 26 January 2001 "Republic Day" Earthquake, India. Seismological Research Letters. V. 72, pp. 328-335.
[8] Building Seismic Safety Council (BSSC). 1997. NEHRP recommended provisions for seismic regulations for new buildings and other structures, 1997 Edition. Prepared by the BSSC for the Federal Emergency Management Agency, BSSC, Washington, D.C.
[9] Building Seismic Safety Council (BSSC). 2001. NEHRP recommended provisions for seismic regulations for new buildings and other structures, 2000 Edition, Part 2: Commentary (FEMA 369). Prepared by BSSC for the Federal Emergency Agency, BSSC, Washington, D.C.
[10] Cambell, K. W., and Bozorgnia, Y. 1994. Near source attenuation of peak horizontal acceleration from worldwide accelerograms recorded from 1957 to 1993. Proceedings of the fifth U.S. national conference on earthquake engineering, V. III, pp. 283-292.
[11] Cramer, C. H. 2001. A seismic hazard uncertainty analysis for the New Madrid seismic zone, Engineering Geology, Vol. 62, pp. 251-266.
[12] Cramer, C. H. 2001. The New Madrid seismic zone: capturing variability in seismic hazard analyses. Seismological Research Letters, Vol. 72, No. 6, pp. 664-672.
[13] Department of Commerce. National Bureau of Standards. 1980. Development of a probability based load criterion for American National Standard A58. Building Code Requirements for Minimum Design Loads in Buildings and Other Structures. NBS Special Publication 577, NBC, Washington, DC.
[14] Documentation of history of the city of St. Louis: physical growth of the city of Saint Louis, Official website of the city of St. Louis, http://stlouis.missouri.org/heritage/ History69/.
44

[15] Electric Power Research Institute (EPRI). 1993. Guidelines for determining design basis ground motions. EPRI TR-102293.
[16] EOS. Reassessing the New Madrid Seismic Zone. 2000. Transactions, American Geophysical Union, Vol. 81, No. 35, August 29, pp. 397, 402-403.
[17] Frankel, A., Harmsen, S., Mueller, C., Barnhard, T., Leyendecker E. V., Perkins, D., Hanson, S., Dickman, N., and Hopper, M. 1997. USGS national seismic hazard maps: uniform hazard spectra, de-aggregation, and uncertainty. http://geohazards.cr.usgs. gov/eq/uncertainties/nceer.html, pp. 1-34.
[18] Frankel, A., Mueller, C., Barnhard, T., Perkins, D., Leyendecker E. V., Dickman, N., Hanson, S., and Hopper, M. 1996. National seismic-hazard maps: documentation. Open-File Report 96-532. U.S. Department of the Interior, U.S. Geological Survey, Denver, Colorado.
[19] Frankel, A. D., Petersen, M. D., Mueller, C. S., Haller, K. M., Wheeler, R. V., Leyendecker, E. V., Wesson, R. L., Harmsen, S. C., Cramer, C. H., and Perkins, D. M., and Rukstales, K. S. 2002. Documentation for the 2002 update of the national seismic hazard maps. Open-File Report 02-240, U.S. Department of the Interior, U.S. Geological Survey, Denver, Colorado, Memphis, Tennessee.
[20] Guccione, et al. 2002. Stream response to repeated coseismic folding, Tiptonville dome, New Madrid seismic zone, Geomorphology, Vol. 43 (3-4), pp. 313-349.
[21] Hitoshi, S., and Sugimoto, M. 1996. Statistical aspects of damage due to the great Hanshin earthquake. Proceedings of the seventh specialty conference on probabilistic mechanics and structural reliability held in Worcester, Massachusetts, August 7-9, 1996. Published by the American Society of Civil Engineers, New York, NY.
[22] Hough, S. E., Armbruster, J. G., Seeber, L., and Hough, J. F. 2000. On the Modified Mercalli intensities and magnitudes of the 1811-1812 New Madrid earthquakes. Journal of Geophysical Research, Vol. 105, No. B10, pp. 23,839-23,864.
[23] Hough, S. E. 2003. Personal communications.
[24] International Code Council (ICC). 2000. International Building Code 2000 (IBC-2000). ICC, Falls Church, VA.
[25] International Code Council (ICC). 2000. International Residential Code 2000 (IRC-2000). ICC, Falls Church, VA.
[26] James Lal Penick, Jr. 1981. The New Madrid earthquakes (Revised Edition). University of Missouri Press, Columbia & London.
[27] Johnston A. C. 1996. Seismic moment assessment of earthquakes in stable continental regions–III. New Madrid 1811-1812, Charleston 1886 and Libson 1755. Geophysical Journal International, Vol. 126, pp. 314-344.
[28] Johnston A. C., and Nava, S. J. 1985. Recurrence rates and probability estimates for the New Madrid Seismic Zone. Journal of Geophysical Research, V. 90, pp. 6737-6753.
[29] Johnston, A. C., Coppersmith, K. J., Kanter L. R., and Cornell, C. A. 1994. The earthquakes of stable continental regions. Prepared for Electric Power Research Institute (EPRI), EPRI TR-102261s.
45

[30] Kenner, J. S., and Segall, P. 2000. A mechanical model for intraplate earthquakes: Application to the New Madrid Seismic Zone. Science, Vol. 289, pp. 2329-2332.
[31] Leyendecker, E. V., Perkins, D. M., Algermissen, S. T., Thenhaus, P. C., and Hanson S. L. 1995. USGS spectral response maps and their relationship with seismic design forces in building codes. Open-File Report 95-596, U. S. Department of Interior, Geological Survey.
[32] Liu, L., Zoback, M. D. and Segall, P. 1992. Rapid intraplate strain accumulation in the New Madrid seismic zone. Science, V. 257, pp. 1666-1669.
[33] Luft, R. W., and Whitman, R. V. 1981. Earthquake resistance of a historic building. Symposium on Probabilistic Methods in Structural Engineering, ASCE National Convention, St. Louis, MO, pp. 308-326.
[34] McKee, S. 1999. Evaluation of housing performance and seismic design implications in the Northridge earthquake. Prepared for Department of Housing and Urban Development and National Association of Home Builders by NAHB Research Center, Upper Marlboro, MD.
[35] Mueller, K., J. Champion, M. Guccione, K Kelson. 1999. Fault slip rates in the modern New Madrid seismic zone, Science, Vol. 286, pp 1135-1138.
[36] Newman, A., et al. 1999. Slow Deformation and lower seismic hazard at New Madrid seismic zone, Science, Vol 284, pp 619-621.
[37] Newman, A., Schneider, J., Stein, S., and Mendez, A. 2001. Uncertainties in seismic hazard maps for the New Madrid seismic zone and implications for seismic hazard communication. Seismological Research Letters, Vol. 72, No. 6, pp. 647-663.
[38] Nuttli, O. W. 1973. The Mississippi Valley earthquakes of 1811 and 1812: intensities, ground motion, and magnitude. Bulletin of the Seismological Society of America, Vol. 63, No. 1, pp. 227-248.
[39] Nuttli, O. W., Bollinger, G. A., and Griffiths, D. W. 1979. On the relation between Modified Mercalli intensity and body-wave magnitude. Bulletin of the Seismological Society of America, Vol. 69, No. 3, pp. 893-909.
[40] Obermeier et al. 2001. Paleoliquefaction studies in continental settings: geologic and geotechnical factors in interpretations and back-analysis. U.S. Geological Survey Open-File Report 01-29.
[41] Rodbell, D.T., and Schweig, E.S. 1993. The record of seismically induced liquefaction on late quaternary terraces in northwestern Tennessee, Bulletin of the Seismological Society of America, Vol. 83, No.1, pp 269-278.
[42] Russ, D. P. 1982. Style and significance of surface deformations in the vicinity of New Madrid, Missouri. In F. A. McKeown, and L. C. Pakiser, Eds., Investigations of the New Madrid, Missouri, earthquake region, pp. 94-114. Professional Paper 1236. Washington, DC.: U.S. Geological Survey.
[43] Saucier, R. T. 1991. Geoarcheological evidence of strong prehistoric earthquakes in the New Madrid (Missouri) seismic zone, GEOLOGY, v. 19, p. 296-298.
46

[44] Schweig, E. S., Tuttle, M. P., and Ellis, M. A. 1996. Paleoseismology and earthquake recurrence in the New Madrid seismic zone: Are the apparent rates reasonable? Seismological Research Letters, V. 67, n. 2, p. 54.
[45] Senior Seismic Hazard Analysis Committee (SSHAC). 1997. Recommendations for probabilistic seismic hazard analysis: guidance on uncertainty and use of experts. Report NUREG/CR-6372, UCRL-ID-122260, vol. 1-2, prepared for U.S. Nuclear Regulatory Commission, U.S. Department of Energy, and Electric Power Research Institute.
[46] Soil amplification map developed as a project of the Association of CUSEC (Central United States Earthquake Consortium) State Geologists, by the Missouri Geological Survey, and was partially funded by the US Geological Survey's NEHRP (National Earthquake Hazard Reduction Program) funds. Electronic files were provided by David Hoffman of the Missouri Geological Survey Program in October of 2002.
[47] Stelzer, C. D. 1999. On shaky ground. Riverfront Times, December 15, St. Louis, MO.
[48] Street, R. L, and Nuttli, O. W. 1984. The central Mississippi Valley earthquakes of 1811-1812. USGS Open File-Report 84-770.
[49] Street, R. L. 1984. The historic seismicity of the central United States: 1811-1928. Final Report, contract 14-08-0001-21251, U.S. Geological Survey, Washington, DC.
[50] Street, R. L., and Green, R. F. 1984 The historic seismicity of central United States: 1811-1928. University of Kentucky Research Foundation.
[51] Toro, G. R., Abrahamson, N. A., and Schneider, J. F. 1997. Model for strong ground motions from earthquakes in central and eastern North America: best estimates and uncertainties. Seismological Research Letter, Vol. 68, No. 1, pp. 41-57.
[52] Trifunac, M.D., and Brady, A.G. 1975. On the correlation of seismic intensity scales with the peaks of recorded ground motion. Bulletin of Seismological Society of America. Vol. 65, pp. 139-162.
[53] Tuttle, M. P., et al. 2002. The earthquake potential of the New Madrid seismic zone. Bulletin of the Seismological Society of America, Vol. 92, No. 6, pp.2080-2089.
[54] Tuttle, M. P. 2001 The use of liquefaction features in paleoseismology: Lessons learned in the New Madrid seismic zone, central United States. Journal of Seismology, Kluwer Academic Publishers, Vol. 5, pp. 361-380.
[55] Tuttle, M. P. et al. 1996. Use of archaeology to date liquefaction features and seismic events in the New Madrid seismic zone, Central United States, Geoarcheology: An International Journal, Vol. 11, No. 6, 451-480.
[56] Wesnousky, S. G. and L.M. Leffler. 1992. The repeat time of the 1811 and 1812 New Madrid earthquakes: A Geological Perspective, Bulletin of the Seismological Society of America, Vol. 82, No. 4, pp. 1756-1785.
[57] Whitman, R. V. 2002. Ground motions during the 1755 Cape Ann earthquake. Proceedings of the Seventh U.S. National Conference on Earthquake Engineering, July 21-25, Boston, MA.
47

48

APPENDIX A SURVEY OF HISTORIC BUILDINGS IN
MISSOURI, KENTUCKY, AND ILLINOIS THAT PREDATE THE 1811-1812 NEW MADRID EARTHQUAKES

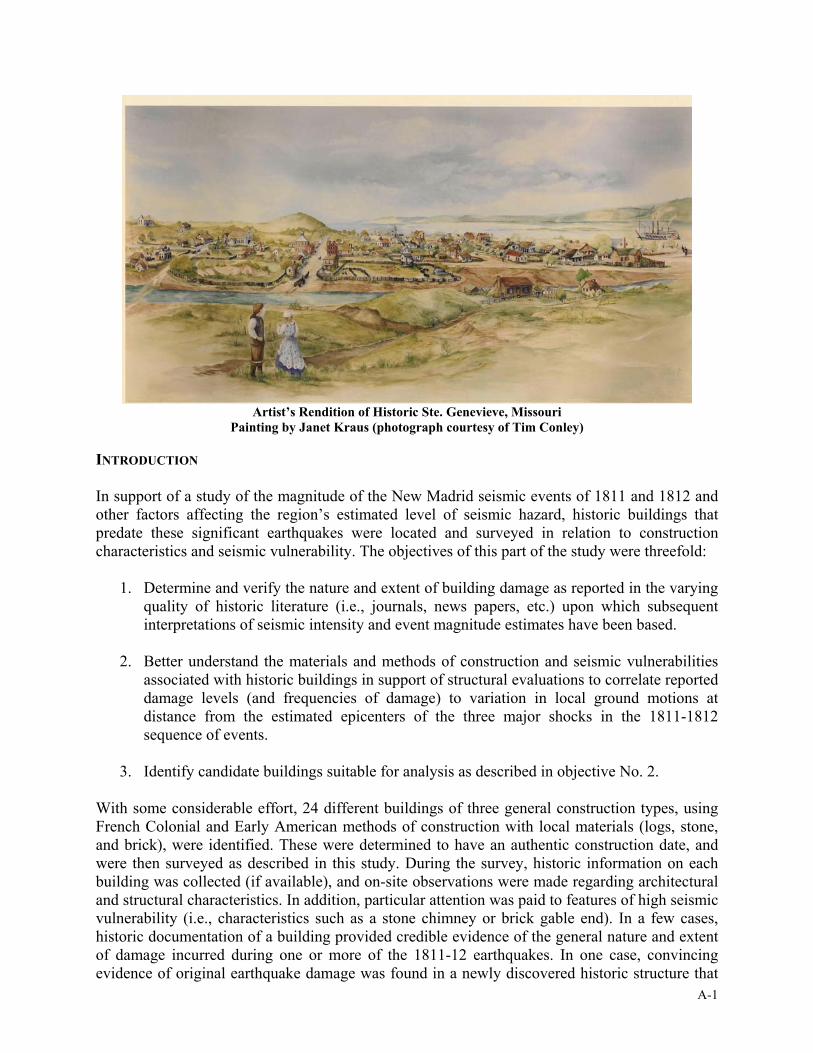
Artist’s Rendition of Historic Ste. Genevieve, Missouri
Painting by Janet Kraus (photograph courtesy of Tim Conley) INTRODUCTION In support of a study of the magnitude of the New Madrid seismic events of 1811 and 1812 and other factors affecting the region’s estimated level of seismic hazard, historic buildings that predate these significant earthquakes were located and surveyed in relation to construction characteristics and seismic vulnerability. The objectives of this part of the study were threefold:
1. Determine and verify the nature and extent of building damage as reported in the varying quality of historic literature (i.e., journals, news papers, etc.) upon which subsequent interpretations of seismic intensity and event magnitude estimates have been based.
2. Better understand the materials and methods of construction and seismic vulnerabilities
associated with historic buildings in support of structural evaluations to correlate reported damage levels (and frequencies of damage) to variation in local ground motions at distance from the estimated epicenters of the three major shocks in the 1811-1812 sequence of events.
3. Identify candidate buildings suitable for analysis as described in objective No. 2.
With some considerable effort, 24 different buildings of three general construction types, using French Colonial and Early American methods of construction with local materials (logs, stone, and brick), were identified. These were determined to have an authentic construction date, and were then surveyed as described in this study. During the survey, historic information on each building was collected (if available), and on-site observations were made regarding architectural and structural characteristics. In addition, particular attention was paid to features of high seismic vulnerability (i.e., characteristics such as a stone chimney or brick gable end). In a few cases, historic documentation of a building provided credible evidence of the general nature and extent of damage incurred during one or more of the 1811-12 earthquakes. In one case, convincing evidence of original earthquake damage was found in a newly discovered historic structure that
A-1

had been encapsulated and hidden by newer construction, although no original documentation was available. In most cases, however, the evidence of damage (if any) was lost in time as expected. In some cases, the survey raised questions as to the authenticity of the construction date of a building and this was also noted. It should be mentioned that historic buildings or sites were not found in key towns such as New Madrid, primarily as a result of shifting of the Mississippi River and erosion which consumed original building sites. Indeed, the town of Ste. Genevieve had already been moved for this reason prior to the New Madrid earthquakes. The towns of New Madrid and Little Prairie (now modern day Caruthersville) were particularly affected by subsidence of ground and flooding during and after the New Madrid Earthquakes. As a result, the towns were relocated and historic building sites have long since been swept away by the Mississippi River. In general, the survey provided reasonable confirmation of the more sensible reports of building damage found in historic reports and technical literature on the effects of the New Madrid earthquakes of 1811-12. Most of the historic reports relevant to building damage have been compiled and are summarized in Appendix B based on several key sources1,2,3. This historic building survey affirms questions as to the interpretation of earthquake intensity and magnitude due to site effects, and the extremely vulnerable characteristics of some buildings, particularly in relation to the materials and methods of chimney construction (a commonly reported source of damage). This concern is not new in relation to the use of building damage as an indicator of the intensity of local ground motion and magnitude of a nearby or distant earthquake. This issue is also uniquely analyzed more carefully in the main body of this work using statistical methods and structural fragility data (see Section 3.2). The survey did provide a few good candidates for subsequent analysis of reported damage in relation to correlation with expected local ground motions (e.g., a brick house in Ste. Genevieve, Missouri in combination with chimneys in Ste. Genevieve and St. Louis area). Thus, there are significant opportunities to provide independent constraints for existing magnitude estimates based on isoseismal areas of equal Modified Mercalli Index (MMI) interpreted from historic reports. This opportunity, however, requires a more intense and specific analysis of the structural fragility of historic buildings (or populations of historic buildings) as identified in this study. The correlation of local ground motion to an event magnitude may then be based on “reverse-attenuation” of the local ground motion (with consideration of site amplification effects) to an estimated distant epicenter in the region of New Madrid, MO. These analyses are contained in the main body of this report in fulfillment of the ultimate purpose of this survey.
1Street, R. L., and Green, R. F. 1984. The Historic Seismicity of Central United States: 1811-1928. University of Kentucky Research Foundation, Lexington, KY. 2Penick, J. L. 1981. The New Madrid Earthquakes (Revised Edition), University of Missouri Press, Columbia & London, Columbia, KY.
A-2
3Hough, S. E., Armbruster, J. G., Seeber, L., and Hough, J. F. 2000. On the Modified Mercalli intensities and magnitudes of the 1811-1812 New Madrid earthquakes. Journal of Geophysical Research, Vol. 105, No. B10, pp. 23,839-23,864.

SURVEY APPROACH Historic buildings of differing materials and methods of construction indicative of the period leading up to the 1811-12 earthquakes were located through a multi-state search for buildings of confirmed construction dates that were also not reported to have been significantly modified or rebuilt. Numerous buildings were identified from historic building registers (e.g., Historic American Buildings Survey), local historic societies (e.g., St. Charles County Historic Society), and personal contacts. The selection criteria (i.e., confirmed age and minimal remodeling) eliminated many possible buildings from consideration. In the end, a sample of 24 buildings was considered suitable for an on-site investigation. During the search for candidate buildings, information was also collected on the historic documentation (if available) of each building. Limited reliable information was found for most buildings in relation to the existence or extent of damage associated with the 1811-12 events. However, in a few cases, very reliable information was found. The sample of historic buildings was located in the New Madrid Seismic Zone, mostly along the Mississippi River meander belt and immediate uplands, in the states of Missouri, Kentucky, and Illinois (Figure A1). While information was found on buildings in other states and in more distant counties, the study was generally limited to areas reported to experience MMI of 7 or greater as a result of the 1811-12 quakes.
Figure A1
Map of study region showing locations (dots) where historic buildings were surveyed.
A-3
• ••
• •
••
• ••
•
• • •• •• • •• •••• •• • ••
••
•
• • •• • •• ••••
••• •• ••••••
•
•
•
••
••
•••
••
•
•
••
• •• • •
•• •
••
• ••
•
•
• •
•
•
•
•
•
•
•
•
Alton
Lemay
Rolla
Mexico
Fulton
Arnold
Jasper
HerrinMarion
Murray
Moberly
Be
Paducah
Kennett
Jackson
Hannibal
ColumbiaO'Fallon
allon
Sikeston
G
Franklin
Columbia
Effingham
Vincennes
Centralia
Fo
Henderson Owensboro
Paragould Dyersburg
Jonesboro
Wood River Washington
nNewSt.
Evansville
Farmington Carbondale
Union City
Taylorville Bloomington
Clarksville
Springfield
BlythevilleB ill
S
Martinsville
Edwardsville
Mount Vernon
Madisonville
Hopkinsville
E
Bowling Gr
erson City
Cape Girardeau
Leonard Wood
Nashville-Davidson
Pleasure RidgMissouri
Cumberland
Missouri
Cumberland
Missouri
Illinois
Arkansas
Tennessee
Indiana
Kentucky
Poplar Bluff
• O'FSt. Louis
•Cahokia
Cacey
Smithland
New Madrid
WashingtoDefiance
SappingtonCrestwood
St. Charles
•Ste. Genevieve •

CONSTRUCTION MATERIALS AND METHODS In general, three types of materials were found in the historic buildings surveyed: wood, stone, and brick. All materials were probably obtained or manufactured from locally available resources, such as cedar trees, oak trees, limestone, rocks, clay, straw (or stubble), and horse hair. Each material had a different purpose or use depending on the type of house construction. Wrought iron nails and spikes, used sparingly, were also found in some structures, along with methods of wood joinery commonly associated with heavy timber (log or frame) construction found in late-18th and very early 19th centuries. Two types of French Colonial construction were prevalent in the period of interest: post-in-ground (Poteau en terre) and post-on-sill (Poteau sur sole). These two methods of construction used logs placed vertically to form stout exterior walls (Figure A2). In post-in-ground construction, the posts served the dual purpose of an exterior wall and a foundation; floors were supported separately on large beams and stone piers. In post-on-sill construction, the posts were joined at the bottom to a sill resting on a stone foundation wall. In some cases (usually post-on-sill), the corners were braced with an angled log in each direction. The logs in exterior walls were sometimes leaned inward at slight angle to provide stability. Between the vertical logs, clay and rubble stone (pierriotage) or clay and grass (bouzillage) was placed, sometimes including horse hair for reinforcement. In all cases, the logs were joined to a top sill. Roof framing varied in detail, but usually used heavy timbers joined in some type of a truss system with heavy ceiling beams (logs) or other timber roof cross members in the attic (Figure A3).
Figure A2
French colonial post-on-sill (poteau sur sole) construction.
A-4

Figure A3
French colonial timber frame roof construction. Brick construction was evidently popular in some towns (e.g., St. Charles, MO) prior to 1811, despite the pioneering nature of the settlements. Brick walls usually consisted of two wythes, or as much as four wythes (i.e., thickness of four bricks). As shown in Figure A4, bricks were laid in running bond with every sixth or seventh course laid with bricks oriented across the wall thickness (i.e., a header or soldier course). Bricks were typically made from local clay pressed into brick forms and then fired in a brick furnace. Mortar consisted of locally mixed ingredients, primarily lime and sand. It appears that most brick structures were built on limestone foundation walls. On larger brick homes, usually one or more interior cross walls were also similarly constructed of brick.
Figure A4
Brick wall construction. Stone construction was always of locally available limestone. Stone walls were usually 24 to 30
A-5

inches thick with beam pockets or ledges to support timber floor framing (similar to that found in brick construction). Mortar appeared to be identical to that used for brick construction; however, some stone foundation walls appeared to use mortar very sparingly (i.e., the stones were essentially “dry-stacked”) as shown in Figure A5.
Figure A5
Example of limestone foundation construction. Braced timber frame construction–an early American form of construction that used timber ore efficiently than vertical or horizontal log construction–was found in only two homes. The frame was apparent in one house and was in ill repair (Figure A6). The details of framing followed the convention of that time period. One horizontal log home was also found in the survey and, while it had a couple of unique details, the use of large rectangular shaped logs was conventional for the time period.
A-6

Figure A6
Partially exposed timber frame construction showing corner brace. Most homes were rectangular and symmetrical in form. However, a few homes were either an ‘L’ or ‘T’ shape in plan. Amounts of openings for windows and doors varied. RESULTS The results of the survey are summarized in Table A1. Photographs of the surveyed buildings are found in Figures A7 through A40. Of the 24 buildings surveyed, 10 were of brick construction, 3 were of stone construction, 8 were of vertical post construction, 1 of horizontal log construction, and 2 of braced timber frame construction. The number of stories varied from 1 to 2-1/2 stories with most being one or two stories in height. In the end, only two buildings were confirmed to have experienced earthquake damage by credible sources of documentation. About six others may have experienced damage, but other factors make any greater assertion speculative at best. The most distant building in the survey with confirmed (originally documented) damage due to the 1811-12 New Madrid earthquakes was a two-story brick building located in Cahokia, Illinois (about 138 miles north of New Madrid, MO) in the loosely consolidated soils of the Mississippi embayment (see ID #22 in Table A1). The house was reported to experience damage to one of two chimneys (apparently not resulting in complete toppling) and to one wall in which “two seams” were formed. One other historic house in the vicinity, a single story vertical post-on-sill structure, may have also suffered damage due to sliding of its sill on the limestone foundation wall. Several surveyed buildings in St. Charles, MO, were more distant (about 158 miles north of New Madrid), but none had any original documentation of damage. Historic reports of “few” to “several” homes with chimney damage at these distances, however, are found in Appendix B of this report.
A-7

Most of the historic buildings surveyed were homes located in Ste. Genevieve, Missouri (about 98 miles north of New Madrid). A two-story stone building on a prominent hill overlooking the town (see sample ID #16 in Table A1) was reported to have documentation of damage from the New Madrid earthquakes, but without detail of the nature and extent (evidently the damage was repairable in nature based on later restorations that occurred). The only historic brick building pre-dating the earthquakes also demonstrates an extremely vulnerable form of construction and it probably experienced damage to its chimneys and gable ends based on field observations (see sample ID #11 in Table A1). Most other buildings were of French colonial style (vertical log). All of the historic homes surveyed had either brick or stone chimneys. Unfortunately, there was no specific documentation of damage to these elements; however, evidence of repair or replacement was found on nearly all chimneys. Any association with an earthquake cause would be speculative, even though it is probable that several chimneys were damaged to some extent. Evidence in at least one stream bed in the town suggests that layered bedrock underlies shallow sedimentary soils. If so, this observation indicates that site effects may have tended to be minimal for some buildings in Ste. Genevieve in comparison to those located more hazardously in the unconsolidated soils of the Mississippi river embayment.
TABLE A1 SUMMARY OF HISTORIC BUILDING SURVEY DATA
ID # CONST DATE1
BLDG NAME
LOCATION DIST. TO NM
CONST TYPE
NO. OF STORIES
COMMENTS
1 1808? Goellner Printers
St. Charles, MO ~158 mi. Brick 2 Store front remodeled significantly; date questionable; no assessment made
2 1803- 1820
Boone House
Defiance, MO ~155 mi. Stone 2-1/2 Mud-clay mortar reported as original; walls about 2ft thick; basement wall bowing from soil; Timbers “mostly” original; date is known to predate 1820 tax record; roof replaced after fire; beams in basement floor deflect 2” at mid-span; lumber shrinkage/movement noticeable; some foundation settlement; no documentation or obvious sign of past seismic damage
3 1805 -1820?
Kibby House
St. Charles, MO ~158 mi. Brick 1-1/2 Plaque on building states 18; other sources report construction date of 1805; 20; land was purchased by owner in 1808; some settlement cracks noted in brick; brick looks newer in condition/type; no documentation or obvious sign of past seismic damage
4 1798 Piker’s Club St. Charles, MO ~158 mi. Brick 1-1/2 Few windows and doors in walls; mortar well maintained; head bond every 6th course (7th on gables); brick laid differently between front windows; some sign of cracking/settlement; no documentation or obvious sign of past seismic damage
5 1807? McNair House
St. Charles, MO ~158 mi. Brick 1-1/2 Small townhouse (end unit); remodeled; windows and doors on front leave little solid wall area; brick well maintained; date not substantiated; no documentation or obvious sign of past seismic damage
6 1811 Millington House
St. Charles, MO ~158 mi. Brick 2-1/2 Townhouse (end unit); Brick head bond every 7th course; mortar well maintained; addition in rear (1820); sign of brick replaced on exterior wall in location of adjoining interior chimney; angled crack from corner toward top of front window on bottom story; both are possible indications of past seismic damage, not discounting other probable causes (age/settlement)
7 1799 Cooperage Building
St. Charles, MO ~158 mi. Stone 1 10+ foot tall walls; walls 2 foot thick; long/narrow plan; poorly maintained condition; building in flood
A-8

ID # CONST ATE1
BLDG AME
LOCATION DIST. TO CONST YPE
NO. OF TORIES
COMMENTS D N NM T S
plain; no documentation or obvious sign of past seismic damage;
8 1792 Amoureaux House
Ste. Genevieve, MO
~98 mi. Post-in- Ground
1-1/2 Rocks between vertical posts (cedar) with mud/clay mortar; investigation of some of the few wrought iron spikes used to join vertical logs at sills indicates no sign of severe deformation or splitting of wood; walls are intentionally leaned inward for stability; floors are separately supported on stone piers and beams inside the vertical log perimeter walls; foundation rebuilt after 1993; much restoration, roof replaced; interior brick chimney shows signs of repair/replacement, leaning; no documentation of past seismic damage, possible sign of past seismic damage to chimney, but could be from other causes
9 1785 – 1806
Bolduc House
Ste. Genevieve, MO
~98 mi. Post-on- Sill
1-1/2 Well maintained and renovated; stone chimneys; vertical posts have steeply angled brace at corners; clay and stone between logs; no documentation or obvious signs of seismic damage
10 1806 Guibourd - Valle House
Ste. Genevieve, MO
~98 mi. Post-on- Sill
1-1/2 House has had several repairs; chimneys altered; hip changed to gable roof; no documentation or obvious signs of past seismic damage
11 1806 Old Brick House
Ste. Genevieve, MO
~98 mi. Brick 2 Some indication of replacement of brick on gables (single wythe at top half of gable, double on bottom); brick gable not braced at top by roof --very vulnerable; limestone foundation; central brick chimney probably replaced; no documentation, but possible signs of past seismic damage to gables and chimney
12 1809 - 1810
Ratte-Hoffman House
Ste. Genevieve, MO
~98 mi. Timber Frame
2 Poor condition; early braced-frame home of American style; chimneys falling; balcony deck collapsing; no documentation or obvious sign of past seismic damage
13 1806-1812
Aaron-Elliot House
Ste. Genevieve, MO
~98 mi. Timber Frame
2 Stone basement foundation (30 inches thick); much repairs; structure of walls not visible; no document or obvious signs of past seismic damage
14 1790 Janice-Ziegler House
Ste. Genevieve, MO
~98 mi. Post-on- Sill
1 Raised full basement of stone; corner braces pegged to top plate; timber A-frame roof truss; good workmanship in joinery; no documentation or obvious signs of past seismic damage
15 1794 Jean-Baptiste Valle House
Ste. Genevieve, MO
~98 mi. Post-on- Sill
1-1/2 Rebuilt in 1850s or 60s; remodeled; roof reconstructed in 1860s; no documentation or obvious signs of past seismic damage
16 1808 Old Academy
Ste. Genevieve, MO
~98 mi. Stone 2 Fully restored; stone basement; walls 24 inches thick; L-shape plan; some documentation of seismic damage that caused academy to close; repairs were done several years later; no current signs of past seismic damage
17 1800 Ashburn-Jeffress House
Near Cacey, KY (Fulton Co, Rt 924)
~30 mi. Log Cabin
2 In process of restoration by new owner; livable; brick chimneys recently removed; some logs 8”x24” cross section; log partition wall in center of plan; concrete foundation wall is relatively new; 3x floor framing; no documentation or obvious sign of past seismic damage
18 1780? Gower House
Smithland, KY ~73 mi. Brick 2 House in delayed process of restoration; interior finishes and bottom flooring removed; stone foundations; some settlement cracks in walls; some structural repairs to stabilize brick end wall separations at corners with steel tie-rods and masonry anchors extending along the length of the building; no documentation of past seismic
A-9

ID # CONST ATE1
BLDG AME
LOCATION DIST. TO CONST YPE
NO. OF TORIES
COMMENTS D N NM T S
damage, but end walls and chimneys may have experienced seismic damage (current cause appears to be settlement related); construction date should be confirmed by dendrochronology
19 1807 Dorlac House
Ste. Genevieve, MO
~98 mi. Post-on- Sill
1 Restored condition; did not inspect closely (no permission); observed that top half of chimney starting at gable was brick, bottom half stone; no documentation, but chimney may have been damaged by earthquake (or other causes)
20 1790 Tayon House
Ste. Charles, MO ~158 mi. Brick 1 Walls all square and true, brick re-pointed in places, windows replaced, some settlement cracking; no documentation or obvious sign of past seismic damage
21 1806 - 1815
Sappington House
Crestwood, MO ~143 mi. Brick 2-1/2 18’x30’ plan; restored and well maintained; chimneys and brickwork recently repaired (lightening damage); no documentation or obvious sign of past seismic damage
22 1807 - 1810
Jarrot Mansion
Cahokia, IL ~138 mi. Brick 2-1/2 4-wythe brick construction, had extensive repairs in 1930s and 40s; two main interior cross walls are same construction as exterior; reported to have repairs done to east chimney to “take down chimney cap and putting up” (evidently the chimney did not completely topple); two “seams” in rear (south facing) wall needed repair; documentation available and some current signs of repair of past seismic damage.
23 1799 The Holy Church
Cahokia, IL ~138 mi. Post-on- Sill
1 Tall walls and steep cathedral style timber truss/frame roof; original building may have predated 1799 under different use; current building was rebuilt in 1830 and 1949; documentation may be available through parish records; no obvious signs of past seismic damage.
24 1790 Martin-Boismenue House
Cahokia, IL ~138 mi. Post-on- Sill
1-1/2 Historic home found inside a newer home when remodeled; now restored to original condition; according to those involved in restoration it was repaired and restored in the “as found” condition; as such, the house and two end wall chimneys are shifted northward about 2 to3 inches on a plane level with the top of the stone foundation wall; no documentation to support, but house may have shifted on foundation due to past earthquake.
1Question marks indicate that date is not well constrained by available historic records.
Figure A7
Street Corner at Goellner’s Printing, St. Charles, MO. Figure A8
Front view of Boone House, Defiance, MO. A-10

Figure A9
Rear view of Boone House. Figure A10
Front view of Kibby House, St. Charles, MO.
Figure A11
Front view of Piker’s Club, St. Charles, MO.
A-11

Figure A12
Front view of McNair House, St. Charles, MO. Figure A13
Front view of Jeremiah-Millington House, St. Charles, MO.
Figure A14
Side views of Jeremiah-Millington House, St. Charles, MO.
Figure A15 Side view of the Cooperage Building,
St. Charles, MO.
A-12
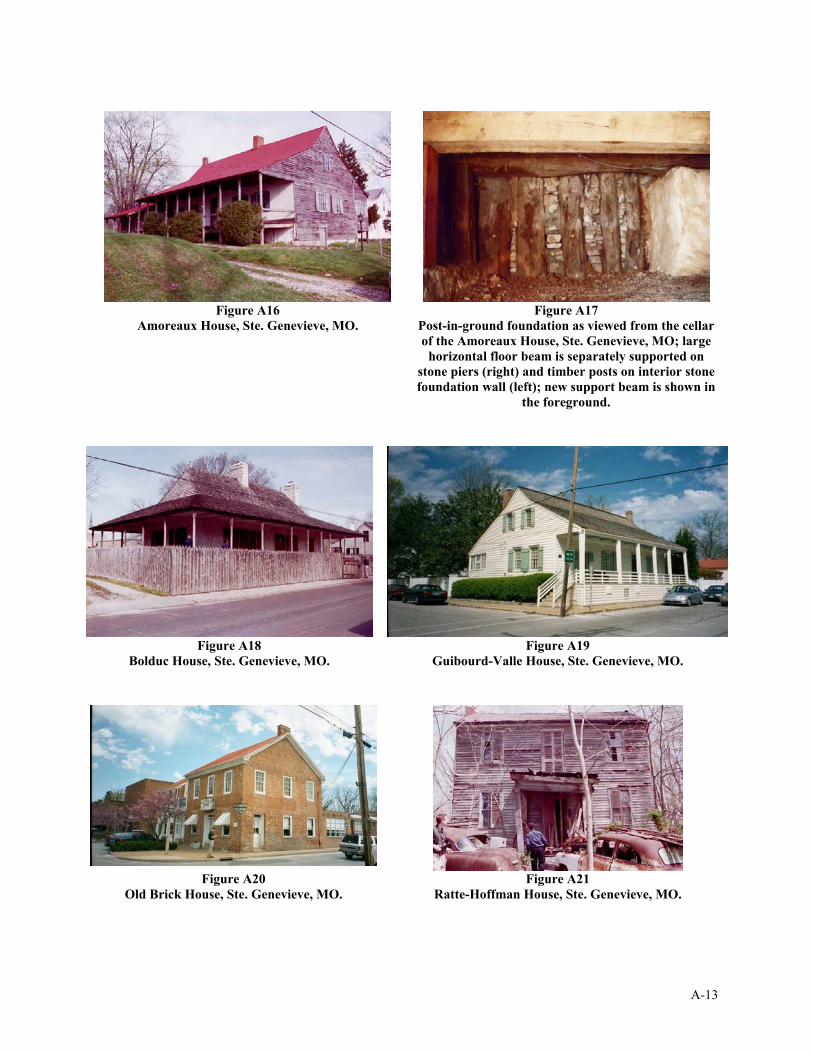
Figure A16
Amoreaux House, Ste. Genevieve, MO. Figure A17
Post-in-ground foundation as viewed from the cellar of the Amoreaux House, Ste. Genevieve, MO; large
horizontal floor beam is separately supported on stone piers (right) and timber posts on interior stone foundation wall (left); new support beam is shown in
the foreground.
Figure A18
Bolduc House, Ste. Genevieve, MO. Figure A19
Guibourd-Valle House, Ste. Genevieve, MO.
Figure A20
Old Brick House, Ste. Genevieve, MO. Figure A21
Ratte-Hoffman House, Ste. Genevieve, MO.
A-13

Figure A22
Aaron-Elliot House, Ste. Genevieve, MO. Figure A23
Green Tree Tavern, Ste. Genevieve, MO.
Figure A24
Jean-Baptiste Valle House. Figure A25
Front view of The Old Academy, Ste. Genevieve, MO.
Figure A26
Side view of The Old Academy. Figure A27
Front view of Ashburn-Jeffress House located near Cacey, KY.
A-14

Figure A28
Side view of the Ashburn-Jefferies House undergoing remodeling and showing chimney recently removed;
center portion is original log cabin.
Figure A29 Front view of the Gower House, Smithland, KY; uneven lintels above windows show differential
settlement of foundation.
Figure A30
Side view of the Gower House; retrofitted wall anchor is shown in upper left corner of gable end.
Figure A31 Second floor construction of the Gower House.
Figure A32
Dorlac House, Ste. Genevieve, MO. Figure A33
Tayon House, St. Charles, MO.
A-15

Figure A34
Front and side view of the Sappington House, Crestwood, MO.
Figure A35
Rear view of the Sappington House. Figure A36
Front and side view of the Jarrot Mansion, Cahokia, IL.
A-16

Figure A37
The Holy Church, Cahokia, IL. Figure A38
Front view of the Martin-Boismenue House.
Figure A39
View of ~2 inches of slip (N-S) at foundation-sill plane as found prior to recovery and repair of the
Martin-Boismenue House.
Figure A40 Opposite end of building in previous figure showing
~2 inches of southward slip of the building on its stone foundation wall.
DISCUSSION Every attempt has been made in this study to remain objective in interpreting visual observations and historic records of damage (if any) associated with the selected historic buildings. While this aversion to speculation does not lend itself to an entertaining report, it is felt that it brings proper emphasis to the types of damages that are known with great certainty to have occurred during the 1811-12 New Madrid earthquakes. Thus, the intent has been to support careful scientific study to improve the understanding of effects of the New Madrid earthquakes on indigenous forms of construction. From this vantage point, the nature of the earthquake hazard and appropriate
A-17

actions to avoid future damage may be properly focused and better founded on a practical and objective basis. The selection and distribution of buildings along with evidence discovered regarding damage from New Madrid earthquakes lends credence to the fact that these earthquakes were major events with widespread effects. However, along with historic accounts of damage (see Appendix B of the main body of the report), it appears that damage in most cases was of a limited and repairable nature in towns north and east of New Madrid by more than about 50 miles. Most widespread damage appears to have been to unreinforced masonry buildings (stone or brick) and to unreinforced masonry (stone or brick) chimneys on all building types encountered. This type of construction is particularly vulnerable to earthquake damage (see Figures A41 through A44). In addition, unbraced elements such as cantilevered brick gable end walls are very susceptible to damage in earthquakes (Figure A45). It is for this reason that these types of construction have received continual scrutiny and improvements (or limitations of use) in modern seismic provisions of building codes in the United States, even continuing to the present time. It is interesting to note that no account of severe structural damage to the other indigenous types of construction (i.e., post-in-ground, post-on-sill, and braced timber frame) was found in this study. Two exceptions include masonry chimneys attached to these structures and possible evidence of shifting of one building on its foundation. These findings are not dissimilar from other more modern earthquake damage observations for buildings with similar vulnerable features4. Several buildings are noted as potential candidates for a more detailed study of structural fragility and site effects to allow for independent determinations of local ground motions and ultimately the estimation of the magnitude of the 1811-12 earthquakes (see ID #11, #16, #17, #18, #22, and #24 in Table A1). Historic building ID #11 (“Old Brick House” in Ste. Genevieve, MO) as well as chimney damage in Ste. Genevieve and St. Louis are analyzed in this manner in Section 3.2 of the main report. These specific analyses were selected primarily because of the availability of relevant structural fragility data (i.e., damage relationships to ground motion) and information on site conditions (i.e., soil amplification classes). In future work, efforts to determine site amplification characteristics, verify construction dates, and improve structural fragility information should result in additional constraints to the estimation of the magnitude of the 1811-12 earthquakes. In particular, potentially large site amplification associated with ground conditions in Cahokia, Illinois (house ID #22 and #24) should provide valuable insights into the role of site effects in explaining more distant damage reported along river lowlands. In addition, the close proximity of two candidates (ID #17 and #18) to New Madrid make them particularly interesting and valuable. However, one of these homes (ID #17) is a well-built traditional American log structure for which there is little structural fragility data.
A-18
4Assessment of Damage to Residential Buildings Caused by the Northridge Earthquake, U.S. Department of Housing and Urban Development, Washington, DC (prepared by the NAHB Research Center, Inc., Upper Marlboro, MD). 1994.

Figure A41
Illustration of a vulnerable brick chimney style on a braced timber frame house
(Ratte-Hoffman House, Ste. Genevieve, MO).
Figure A42 Vulnerable chimney construction on a brick house
(Smithland, KY).
Figure A43
Illustration of vulnerable chimney construction; reconstructed chimney is cracked at mid-height of
attic due to misalignment with offset roof penetration to avoid interference with ridge beam
(Ste. Genevieve, MO).
A-19

Figure A44
Illustration of vulnerable chimney leaning due to lack of maintenance and degradation of mortar; age
of house is unknown (Smithland, KY).
Figure A45 Illustration of a typical brick gable end wall without lateral support or anchorage to the roof framing, Ste. Genevieve, MO (Old Brick House); In this case, the brick wall thickness changes from two wythes to one wythe at about one-third of the height of the gable.
A study of the Missouri Territory in 1817 makes mention of the destruction of several buildings in New Madrid during the 1811-12 quakes5. The report also notes that the town was about to be restored and that inhabitants have been “flying to and from it” ever since the earthquakes. However, earthquake damage and its effects are not mentioned for any of the other Missouri towns such as Herculaneum and Cape Girardeau that are discussed in the report. This silence may be a further indication of the limited (i.e., easily repairable) damage experienced in these towns that were modestly distant from the epicenters of the New Madrid earthquakes. Furthermore, limited research has revealed several towns eastward of New Madrid where there is no apparent mention of the earthquakes or damages to their prominent historic buildings. One example is the town of Lancaster, Kentucky where several historic buildings (including brick and log construction) have no report of damages associated with the New Madrid earthquakes. Historic records do give attention to significant events such as fires that destroyed or damaged some buildings. Records also indicate that sales of buildings as well as building of new structures (i.e., a brick courthouse) occurred with no apparent disruption to the economy within the immediate timeframe of the New Madrid earthquakes. While Lancaster, Tennessee is a distant 300 miles to the east of New Madrid, the lack of evidence of building damage or disruption to economy speaks to the probable limited extent of significant building damage (even to masonry buildings or elements such as chimneys that would be considered highly vulnerable by today’s building codes and standards). However, without exhaustive study of historic buildings and records in a greater number of more distant towns (e.g., Hendersonville, TN, Castalian Springs, TN, etc.), it is difficult to draw any definitive conclusions from the apparent absence of damage reports in these locations. The apparent absence of damage may be attributed to a number of factors including poor record-keeping, lack of site effects comparable to those experienced along lowlands (unconsolidated soils) of major rivers, unique ground motion attenuation effects for the region, and others. Differences in building vulnerability (e.g., construction style) are less likely to provide some explanation
5Madox, D.T. 1817. Late Account of the Missouri Territory, St. Charles County Historic Society, St. Charles, MO (reprinted 1989).
A-20

because it appears that construction methods, especially for brick structures or components (e.g., chimneys), were similar throughout the region. Finally, it should be recognized that there are reports of damage to chimneys and minor damage to buildings in towns at similar distances (i.e., ~300 miles), but the damage was apparently not widespread or considered to be significant. As mentioned, low frequencies of damage at these distances (or greater) can be explained by otherwise typical buildings with statistically extreme vulnerabilities related to poor construction or poor maintenance, even with the low level of predicted ground motions (see Section 3.2 for more detailed analysis and discussion). CONCLUSIONS AND RECOMMENDATIONS This survey of historic buildings and related documentation provided beneficial insights into the nature and extent of damage from the 1811-12 New Madrid earthquakes. With modern knowledge of building structural performance, historic building damage information can be used to estimate local ground motions to improve upon and compliment the traditional approach of assigning seismic intensities to subjective or incomplete observations of damage (or later interpretations thereof). Estimation of the magnitude of other significant historic earthquakes, such as the 1886 Charleston, South Carolina earthquake, would benefit from a similar effort, particularly since it is expected that a larger population of historic buildings may be available for study. Key conclusions from this survey of historic buildings pre-dating the 1811-1812 New Madrid earthquakes are as follows:
1. Damage was widespread, confirming that the 1811-1812 New Madrid earthquakes were indeed major events.
2. Several historic buildings and reports of chimney damage frequency were found to be
reasonable candidates to predict local ground motions (and earthquake magnitude) based on structural fragility analysis and site amplification characteristics (refer to Section 3.2 in the main body of this report).
3. At modest distance from the epicenters, damage appears to be mostly associated with
more vulnerable forms of construction including unreinforced masonry (stone or brick) buildings and chimneys.
4. The nature and extent of damage is not dissimilar from that observed for modern
earthquake events with buildings having similar vulnerabilities.
5. No indication of severe structural damage to log or braced timber frame forms of construction was found during the survey.
6. Damage appears to have been of an easily repairable or limited nature for many
buildings.
7. Variation in reported damage, including the absence of damage reports or reports of limited damage (i.e., “few” or “several” chimneys damaged) at distance from the earthquakes may be best explained by buildings with statistically extreme vulnerabilities
A-21

(e.g., a poorly constructed or maintained chimney), differences in site effects, and attenuation of ground motions.
Recommendations based on findings of the survey include:
1. Several historic buildings identified in the survey should be subjected to additional structural fragility evaluations and analyses of site effects to further constrain the magnitude estimate of the 1811-12 earthquakes and to better understand the role of site effects in interpreting historic damage reports.
2. Modern earthquake-resistant building code provisions should continue to favor less
vulnerable forms of construction and limit use of more vulnerable forms of construction in areas considered to have moderate to high seismic hazard.
3. Estimation of seismic hazard and building code provisions that implement mapped values
of seismic hazard for the New Madrid Seismic Zone should result in practical solutions that are commensurate with the nature of damage as evidenced in this survey. Some practical examples of provisions found in modern building codes include limitation of unreinforced masonry construction, anchorage and reinforcement of masonry chimneys and elements, and practical anchorage of wood-frame buildings to foundations.
4. Construction on “soft” soil conditions in high seismic hazard areas should consider
probable occurrence of amplified ground motions and ground failures such as settlement, liquefaction, fissuring, and sand blows. Practical examples of provisions found in modern building codes include the use of soil amplification factors and locally-developed ground liquefaction potential maps.
In comparison to the vulnerabilities found in many older buildings, it appears that seismic provisions in modern building codes and construction practices have generally resolved some of the most problematic issues found in this study. Thus, a key remaining practical concern is the accurate mapping of seismic hazard such that enhanced provisions or practices are cost-effectively implemented only in conditions where benefits will be realized with reasonable probability. This issue is thoroughly addressed in the main body of this report with respect to the New Madrid Seismic Zone. A similar study in the Charleston, South Carolina seismic region would provide an even greater opportunity to refine seismic hazard estimates and to efficiently implement appropriate earthquake-resistant building practices for that region of the United States.
A-22

APPENDIX B ACCOUNTS OF STRUCTURAL DAMAGE FROM THE
1811-1812 NEW MADRID EARTHQUAKES


TABLE B1 ACCOUNTS WITH EVIDENCE OF STRUCTURAL DAMAGE
DESCRIPTION OF STRUCTURAL DAMAGE (page in [B1]) [Rating]1 EVENT #
STATE
TOWN (DISTANCE FROM NEW MADRID) DECEMBER 16 JANUARY 23 FEBRUARY 7
1 Georgia Savannah (580 miles)
…several rents have been discovered in brick buildings…(A198) [1]
2 Illinois Cahokia(140 miles)
A great many houses have been badly damaged, but no one was killed. .. Some stone and brick houses have had to be abandoned. (A22) [2] – A second hand account published in 1949.
3 Illinois Kaskaskia (95 miles)
… stone and brick chimneys fell down; houses cracked… (A103) [2] – A second hand account published in 1906.
4 Illinois Shawneetown (110miles)
Stone chimneys were tumbled down. (A201) [2]
5 Indiana Vincennes(180 miles)
Two or three brick chimneys … cracked, and the roofs of several houses thrown off. (A210) [1]
6 Indiana Vincennes …shook off the top of some chimneys…(A211) [1]
7 Indiana Vincennes …shook off the tops of several chimneys…(A211) [1]
8 Kentucky Birdsville (75 miles) Rock and clay wall was overturned (A17) [2]
9 Kentucky Frankfort(280 miles)
Some bricks are said to have fell from the top of the court house chimney. … some bricks were thrown off the tops of chimneys… (A79) [1]
10 Kentucky Henderson(140 miles)
…many chimneys were cracked…another shock threw down most of the chimneys so injured. (A94) [2]
11 Kentucky Louisville(240 miles)
…several chimneys were broken off… (A113) [2]
12 Kentucky Lexington (300 miles)
…some chimneys and brick houses were slightly damaged. (A114) [1]
13 Kentucky Lexington …the walls are known in some
B-1

DESCRIPTION OF STRUCTURAL DAMAGE (page in [B1]) [Rating]1 EVENT #
STATE
TOWN (DISTANCE FROM NEW MADRID) DECEMBER 16 JANUARY 23 FEBRUARY 7
instances, to have been cracked. (A115) [1]
14 Kentucky Louisville …broke off several chimneys… injured some houses … part of the gable end was dashed in. (A118) [2]
15 Kentucky Louisville Several chimneys were broken off. (A119) [2]
16 Kentucky Louisville …the gable ends of houses have tumbled down… …a few chimneys, and parts of some parapet walls…were broken off. (A120) [2]
17 Kentucky Mortons Gap(120 miles)
…a crack in the brick work… (A134) [1] – A second hand account published in 1958.
18 Kentucky Newport (330 miles)
…threw down the top of a chimney. (A157) [1]
19 Kentucky Red Banks (not found on current maps)
Several chimneys were thrown down, and many others so wrecked and cracked… (A181) [2]
20 Kentucky Uniontown(120 miles)
Every brick chimney in this country has been shattered to the earth. (A209) [2]
21 Mississippi Natchez (360 miles)
…the plastering in the rooms of some houses was cracked…(A138) [1]
22 Missouri Cape Girardeau(50 miles)
.. split two houses and damaged five chimneys…(A23) [2]
23 Missouri Cape Girardeau … demolishing chimneys, and cracking cellar walls… (A24) [2] 24 Missouri Cape Girardeau … thrown down or cracked every chimney in the place and ruined two handsome brick buildings that were not
quite finished… (A249) [2] 25 Missouri Dorena
(15 miles) The house… was partly wood and partly brick structure; the brick portion all fell… (A66) [3]
26 Missouri Herculaneum(120 miles)
Several Chimneys were cracked to their bases, and some were
B-2

DESCRIPTION OF STRUCTURAL DAMAGE (page in [B1]) [Rating]1 EVENT #
STATE
TOWN (DISTANCE FROM NEW MADRID) DECEMBER 16 JANUARY 23 FEBRUARY 7
broken off as low as the stem or funnel. (A95) [2]
27 Missouri New Bourbon(100 miles)
Some of the chimneys shook off their foundations flat to the earth, my chimney split from the foundation to the chamber floor… (A145) [2]
28 Missouri Saint Louis(150 miles)
…nor has the houses sustained much injury, a few chimneys have been thrown down, and a few stone houses split. (A191) [2]
29 Missouri Saint Louis …many houses are injured, and several chimneys thrown down… (A192) [2]
30 Missouri New Madrid(0 miles)
…their houses hourly falling around them. (A263) [3]
31 Missouri Little Prairie(20 miles)
…part of the town now the bed of the Mississippi River… Of about a dozen houses and cabins which I saw, not one was standing, all was either entirely prostrated or nearly overturned and wrecked in a miserable manner… (A265) [3]
32 Missouri New Madrid …no material injury was sustained (A272) [0]
33 Missouri Little Prairie …several chimneys were destroyed… (A272) [2]
34 Missouri New Madrid …There was scarcely a house left entire – some wholly prostrated, others unroofed and not a chimney standing…(A277) [3]
35 Missouri New Madrid …the chimneys of almost all the houses were thrown down…(A282) [2] 36 Missouri Little Prairie The only brick chimney at that
place was entirely demolished…(A286) [2]
37 Missouri Little Prairie …damaged all their houses, and thrown down the only brick chimney…(A288) [2]
B-3

DESCRIPTION OF STRUCTURAL DAMAGE (page in [B1]) [Rating]1 EVENT #
STATE
TOWN (DISTANCE FROM NEW MADRID) DECEMBER 16 JANUARY 23 FEBRUARY 7
38 Missouri New Madrid …the loss of the chimney… …chimneys falling in every direction…(A294) [2]
39 Missouri New Madrid …shake down many of the houses and fences…(A300) [3]
40 Missouri Little Prairie Some of the buildings thrown upon their sides; and other covered with water up to their roofs. (A306) [3]
41 Missouri New Madrid …threw down my chimney (A308) [2]
42 Missouri New Madrid The houses are all thrown down. (A309) [3] 43 Ohio Chillicothe
(400 miles) One chimney was broken down
and several bricks shook off of others; and several houses in town were considerably cracked. (A40) [1]
44 Ohio Cincinnati(330 miles)
… threw down bricks from the tops of some chimneys. (A42) [1]
45 Ohio Cincinnati … throw off the tops of a few chimneys.. (A43) [1]
46 Ohio Cincinnati It threw down part of one chimney in town, and of two in the vicinity of town. It also widened the cracks that previously existed in some brick houses. As that building, however, was already cracked, over several of the arches from the bad execution of the masonry … it is altogether uncertain to what extent it was injured by this shock. (A46) [1]
47 Ohio Circleville(415 miles)
… some chimneys suffered…(A49) [1]
48 Ohio Coshockton A stone chimney …, seven by
B-4

DESCRIPTION OF STRUCTURAL DAMAGE (page in [B1]) [Rating]1 EVENT #
STATE
TOWN (DISTANCE FROM NEW MADRID) DECEMBER 16 JANUARY 23 FEBRUARY 7
(490 miles) five feet square, solid and well built, .. to crack in several places; and one or more chimneys … have been considerably injured… (A60) [1]
49 Ohio Worthington(430 miles)
…the tops of several chimneys were shaken off. (A234) [1]
50 SouthCarolina
Beaufort (580 miles)
The wall of our house was cracked in several places (A15) [1]
51 SouthCarolina
Charleston (600 miles)
A three story brick house …the walls are cracked from the top to the bottom, and the wooden work and plastering in the inside, are split and broken. (A32) [1]
52 SouthCarolina
Columbia (520 miles)
… it cracked and started some of the chimneys…(A53) [1]
53 SouthCarolina
Columbia It shook of the top of one of the College Chimneys, threw down the part of an inside wall in one of the Professor’s houses; and partially affected other buildings. (A55) [1]
54 Tennessee Carthage(200 miles)
… the tops of several chimneys were shaken off… (A26) [1]
55 Tennessee Carthage The court-house … is a large brick edifice, and was cracked to its foundation… Several chimneys had been cast down… (A27) [2]
56 Tennessee Nashville(160 miles)
…the fall of some chimneys in the country. (A136) [2]
57 Tennessee Nashville
…to throw down chimneys and to crack walls…[2] – A second hand account published in 1930.
58 Tennessee Williamson County(155 miles)
…chimney…, built of stone, two stories high, was split eight or
B-5

DESCRIPTION OF STRUCTURAL DAMAGE (page in [B1]) [Rating]1 EVENT #
STATE
TOWN (DISTANCE FROM NEW MADRID) DECEMBER 16 JANUARY 23 FEBRUARY 7
ten feet in the breast (A230) [1] – A Second hand account published in 1949.
59 Virginia Richmond(670 miles)
A chimney was tumbled onto the roof of a house. (A185) [1]
60 West Virginia Wheeling (540 miles)
…stone house was much cracked…chimney was cracked (A225) [1]
1Rating scheme: 1 – house or chimney crack or equivalent, 2 – chimney collapse or house crack or equivalent, and 3 – house collapse.
B-6

TABLE B2 SUMMARY OF DAMAGE INFORMATION PRESENTED IN TABLE B1
Number of accounts containing structural damage information 60 Number places with reported damage 36 Number of states with reported damage 11 Farthest location with a damage rated as 1 Richmond, VA – 670 miles Average distance to locations rated as 1 404 miles1 Farthest location with a damage rated as 2 Louisville, KY 240 miles Average distance to locations rated as 2 131 miles Farthest location with a damage rated as 3 Average distance to locations rated as 3
Rating 3 was assigned only to locations on top of or direct vicinity of the epicenters
1Does not include accounts without structural damage. INTERESTING REMARKS The following statements are from the accounts that have been used to interpret effects of the earthquakes and to assign MMI levels for scientific studies such as magnitude determination. Some of them are just interesting observations, whereas others are anecdotal remarks that serve as a reminder that caution should be exercised while using historic accounts. Statements describing potential site effects are also included. Remarks in italic are authors’ comments on the corresponding accounts. Allegany County, NY December 16, 1811 A house is supposed to rocked at least two feet both ways… - no damage is reported. Annapolis, MD January 23, 1812 We are informed that the State House, which is supposed to be 250 feet in height vibrated at least 6 or 8 feet at the top… Arkport, NY December 16, 1811 ..the house rocking two feet one way and the other. - no damage is reported. Hopkins County, KY December 16, 1811 Superstitious awe pervaded the community, religious fervor was renewed, sinners saw the light, and backsliders renewed their faith. Russellville, KY Februrary 07, 1812 (In Little Prairie) whole estates were offered for a single horse. Savannah, GA February 07, 1812 The horizon immediately after the modulation of the earth had ceased, presented a dreadful appearance; the black clouds that have settled around it, were illuminated as if the whole country to the westward was in flames… Uniontown, KY The earth in this part of the world must be inordinately charged with electric fluid.
B-7

Williamson County, TN December 16, 1811 An old colored women came up to father and asked ‘Massa, did any of you try to shake my house down last night?’. Some said…that it was a sign of war with England. New Madrid, MO December 16, 1811 Another person, with a very serious face, told me that he was ousted from his bed, he was verily afraid the day of judgment had arrived until he reflected that the day of judgment could not come in the night. The Indian says the Shawanoe Prophet has caused the earthquake, to destroy the whites. …a poor Indian…replied, “Great Spirit – Whisky too much” New Madrid, MO …Indians had returned and stated that they discovered a volcano at the head of the Arkansas, by the light of which they traveled three days and nights. Brownsville, PA February 07, 1812 The shock was more sensibly felt on the banks of the river, than on the hills. Cincinnati, OH December 16, 1811 Many families living on the elevated ridges of Kentucky, not more than 20 miles from the river, slept during the shock; which can not be said, perhaps, of any family in town. Bringier, L. 1821 It will, perhaps, be pertinent to observe that this earthquake took place after a long succession of very heavy rains, such as had never been seen before in that county. Worthington, OH January 23, 1812 …it would appear that the shocks had been much more severely felt near the banks of the rivers, than other places. The years disasters (from the beginning of the year 1811 till 1813 – previously in the text) began in the spring with flood waters so high in the Ohio and Mississippi valleys that men remembered it as the “years of waters”. Little Prairie, MO …one end of his dwelling house sunk down considerably; the surface of the opposite side of the Bayou, which before was swamp, became dry land; the side he was on became lower. …there are no reports of a building collapsing on the occupants within. … The destruction of Little Prairie on 16 December was mainly the result of flooding. New Madrid’s houses remained intact. On the whole the later shocks were more damaging to houses than the earlier ones… …nothing was standing in Little Prairie in March, and according to one account of New Madrid “the houses of brick, stone, and log are torn to pieces, and those of frame thrown upon their sides”.
B-8

REFERENCES [B1] Street, R. L., and Green, R. F. 1984 The Historic Seismicity of Central United States: 1811-1928. University of Kentucky Research Foundation. [B2] James Lal Penick, Jr. 1981. The New Madrid Earthquakes (Revised Edition). University of Missouri Press, Columbia & London.
B-9

B-10

APPENDIX C PROBABILISTIC SEISMIC HAZARD ANALYSIS


C1. BASIC PRINCIPLES Probabilistic seismic hazard analysis (PSHA) forms the basis for modern seismic characterization procedures. PSHA is a method used to estimate the annual probability of exceedance of a ground motion at a given site due to earthquakes from all regional seismic sources with their respective probabilities of occurrence. The cornerstone procedures of modern PSHA were first introduced by Cornell in 1968 [C1]. PSHA is an interdisciplinary method of analysis that synthesizes the knowledge of geology, seismotectonics, engineering, statistics, etc. Therefore, communication of information between the individual experts and expert teams becomes integral to a successful PSHA project. This appendix briefly presents the major inputs and concepts involved in PSHA. Results of PSHA are often presented graphically as a chart depicting the relationship between the ground motion (i.e., peak ground acceleration (PGA) or spectral response acceleration (SRA)) on the x-axis and its annual frequency or probability of exceedance on the y-axis. This relationship is referred to as a hazard curve (Figure C1.A). The design or reference ground motion for a given site is determined from the hazard curve for the return interval selected as the design basis (e.g., 500 years, 2,500 years). To generate a seismic hazard map, a series of hazard curves should be computed for the region of interest with the density of sites selected such that the map resolution and accuracy are sufficient for the intended application. The map contours are generated by interpolating between the site estimates to connect the design or reference ground motions of the same value (Figure C1.B).
0.00001
0.0001
0.001
0.01
0.1
0.01 0.1 1
PGA, g
Annu
al ra
te o
f exc
eeda
nce
1E+1
1E+2
1E+3
1E+4
1E+5
Ret
urn
Perio
d, y
ears
0.4g
0.3g 0.2g
0.15
0.1g
Return Interval
Ground Motion
0.4g
source 0.3
A. HAZARD CURVE B. MAP CONTOURS
Figure C1
C-1
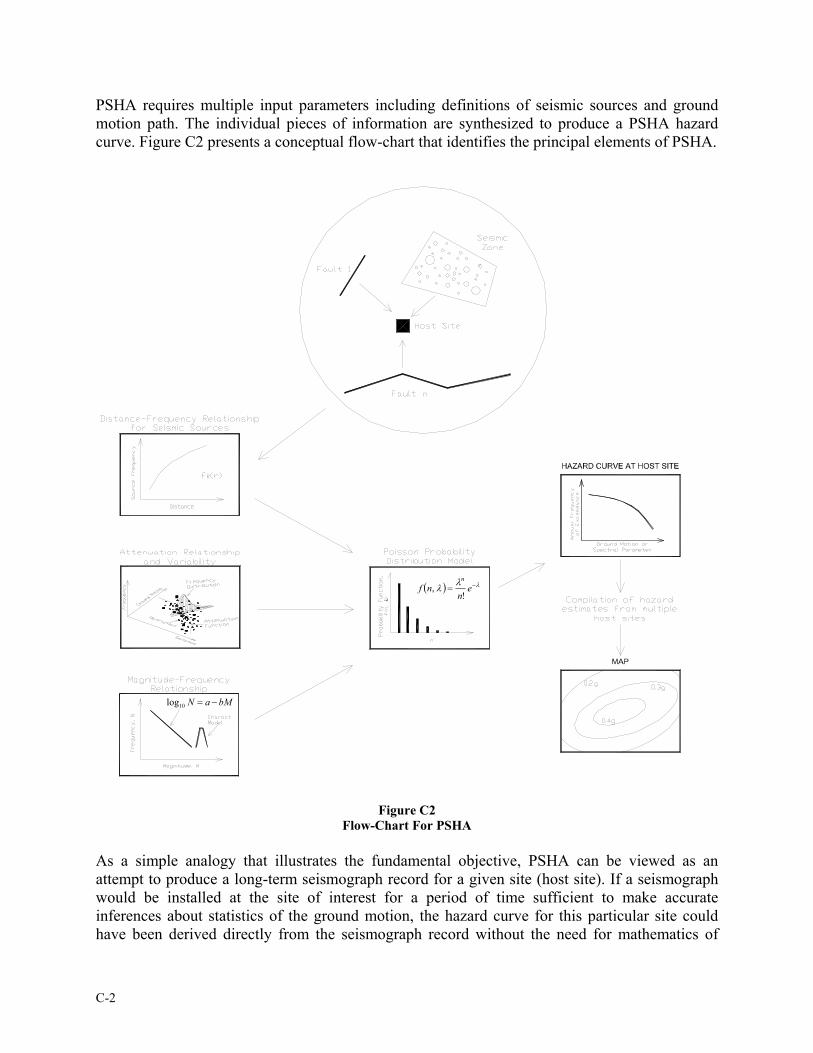
PSHA requires multiple input parameters including definitions of seismic sources and ground motion path. The individual pieces of information are synthesized to produce a PSHA hazard curve. Figure C2 presents a conceptual flow-chart that identifies the principal elements of PSHA.
Figure C2
bMaN −=10log
( ) λλλ −= en
nfn
!,
Flow-Chart For PSHA As a simple analogy that illustrates the fundamental objective, PSHA can be viewed as an attempt to produce a long-term seismograph record for a given site (host site). If a seismograph would be installed at the site of interest for a period of time sufficient to make accurate inferences about statistics of the ground motion, the hazard curve for this particular site could have been derived directly from the seismograph record without the need for mathematics of
C-2

PSHA using only a minimal knowledge of seismotectonics and site effects. Because the structural design procedures use events with recurrence intervals between 500 and 2,500 years as the design basis, the completeness time for the seismograph record should be sufficient to enable credible inferences on the magnitudes and frequencies for the earthquakes with the corresponding return periods. Such records are not available and will not become available in the near future (hundreds of years). However, this analogy can help better understand the intent of the PSHA. The characterization of a seismic source for application with PSHA includes establishing a relationship between the earthquake magnitude and frequency of occurrence. Based on historic records of seismic activity in a region, seismologists have identified a trend that small earthquakes occur much more often than large earthquakes. Gutenberg and Richter proposed an empirical equation that correlated earthquake magnitude and frequency within a particular region by using an exponential function:
bMaN −=10log (C1) where:
N = number of earthquakes with magnitudes in the range M + ∆M; log10 = base 10 logarithm; a = a-value, defines earthquake activity determined from empirical data
associated with the seismic source; b = b-value, defines relative frequency of occurrence of earthquakes of
different magnitudes; M = earthquake magnitude.
In statistical terms, Equation C1 is a special case of an exponential cumulative distribution function. For b-values equal to unity, the Gutenberg-Richter equation implies that earthquakes of magnitude M or larger happen ten times more often than earthquakes of magnitude M+1 or larger. By varying the b-value, Equation 1 can be fit for regions with various relative frequencies of earthquakes. The b-value typically varies between 0.8 and 1.2 for different regions around the globe. A lower b-value means that there is a greater frequency of larger earthquakes relative to smaller earthquakes. A lower a-value means that there is a lower seismic activity in the region. Unlike the b-value, which is a relative measure derived for a particular seismic source, the a-value should be always associated with a magnitude. In the NMSZ, the occurrence of large earthquakes such as the 1811-1812 sequence does not follow the Gutenberg-Richter relationship and is modeled independently from the remaining seismicity by using a characteristic model. Another component of PSHA involves characterization of the ground motion path to establish a correlation between the energy released by the seismic source during an earthquake and the ground motion at the host site. This correlation is defined mathematically with attenuation functions that compute a ground motion parameter (e.g., PGA, SRA) based on the earthquake magnitude and distance between the source and the host site. The amplitudes of seismic waves released by a fault rupture during a seismic event decrease with distance due to geometric spreading and inelastic energy dissipation within the earth crust. The amplitude of ground
C-3

shaking increases with the magnitude of the earthquake. A typical shape of an attenuation function for CEUS is depicted in Figure C3.A for two earthquake magnitudes: M5 and M7. The rate of attenuation can vary between different regions that have different crustal conditions. For example, seismic waves attenuate more rapidly in the WUS as compared to earthquakes of a given magnitude in the CEUS (Figure C3.B). As a result, earthquakes in the CEUS have a more widespread effect.
0.001
0.01
0.1
1
10
10 100 1000
Distance, km
0.2
s Sp
ectra
l Res
pons
e Ac
cele
ratio
n, g
CEUS
WUS
M = 7
0.001
0.01
0.1
1
10 100 1000
Distance, km
Peak
gro
und
acce
lera
tion,
g
M = 7
M = 5
A. ATTENUATION OF PGA FOR M5 AND M7 IN CEUS B. COMPARISON OF ATTENUATION OF 0.2 S SRA FOR CEUS Figure C3
Attenuation Relationships (Note Logarithmic Scale for Both Axes)
The variability of observed ground motions relative to the attenuation function is used as a measure of uncertainty for estimating the probability of annual exceedance of a certain ground motion level. This type of uncertainty is referred to as aleatory uncertainty and the determination of aleatory uncertainty is an integral step of a PSHA. It is typically assumed that ground motion residuals are distributed lognormally (Figure C4) and the uncertainty is expressed with the lognormal standard deviation, σ, estimated as follows:
[ ]∑=
−−
=N
ipredictionnobservatio
N 1
2)/ln(1
1 µσ (C2)
where:
N = number of observations; µ = mean value of the residuals (bias); σ = lognormal standard deviation.
C-4

Figure C4 Lognormal Distribution of Ground Motion Residuals (Hypothetical)
Another type of uncertainty that is considered is categorized as epistemic uncertainty. This type of uncertainty encompasses the uncertainty in knowledge as represented by variation in different expert models of physical processes and variation in expert opinion in the absence of direct physical measurements. This source of uncertainty is incorporated into hazard assessment procedures by the use of “logic trees” that assign “weights” to various plausible solutions based on expert opinion. To develop a meaningful logic tree, each alternate hypothesis (i.e., a physical model or an expert opinion) should be constrained by an independent and scientifically robust methodology. Hypotheses that are derived using methods that are identical in principle should not qualify as independent and a “better” estimate should be selected. While assigning equal weights to all independently constrained logic tree branches is the preferred approach to obtain a mean hazard estimate, it is common practice to assign unequal weights based on expert judgment introducing another source of uncertainty in the process of hazard estimation. C2. EVOLUTION OF PROBABILISTIC SEISMIC HAZARD ANALYSIS This section discusses several significant efforts undertaken by multiple agencies and research groups to develop seismic hazard estimates for the CEUS using the PSHA approach. The effort culminated in several reports that significantly improved the knowledge of seismic hazard in the CEUS and contributed to the disclosure of the uncertainties and limitations attributed to PSHA. As the PSHA methodology was gaining acceptance by the seismic and engineering communities in the 1980s, the U.S. Nuclear Regulatory Commission (NRC) contracted Lawrence Livermore National Laboratory (LLNL) to characterize seismic hazard at nuclear power plant sites in the CEUS using a PSHA. A similar project was concurrently performed by the Electric Power Research Institute (EPRI). Although both projects were conducted in same time period, the two research teams worked independently from each other. Recognizing the lack of reliable historic and seismotectonic data for CEUS, both project teams relied on information elicited from
C-5

individual experts or expert team to establish inputs for PSHA computations. Each team produced voluminous reports [C2], [C3] that presented the results, described in detail the basis for the analytical methods, and documented the procedures used to derive or elicit the input parameters. While results of both studies showed similar trends, the difference in predicted values of hazard varied significantly for most sites, exceeding two orders of magnitude for selected sites in terms of probabilities of exceedance. Moreover, different uncertainty ranges were provided for the mean values of hazard. Following the outcome of the LLNL and EPRI studies, LLNL published a report [C4] that compared the methodologies of the two studies and identified the differences that contributed to the disparity in the results. The mathematical formulations and computational techniques were found to be consistent between the two studies and shown to produce the same median estimates of hazard for identical inputs. Three major sources of disagreement were identified: (1) difference in the lower bound of integration for the moment magnitude: LLNL – mb = 5.0 and EPRI mb=3.75, (2) difference in the attenuation functions, and (3) LLNL included adjustments for site effects. The disagreement was also attributed to the procedures used to elicit, interpret, and compile the input information based on the expert opinion and capture the associated uncertainty. The source of uncertainty was incorporated using a logic-tree with assigned weights in the EPRI study and probability distributions in the LLNL study. Other sources of variation included zonation methods and earthquake catalogs. While the comparative report helped in understanding the reasons for the disparity of the LLNL and EPRI results, it did not provide guidelines to improvement in consistency between independent PSHA studies or recommend methods for reconciliation of the differences in hazard estimates from a decision-making perspective. The outcome of the LLNL and EPRI studies exposed the challenges of implementation of PSHA to CEUS regardless of the level of sophistication of the underlying mathematical formulations and emphasized the issues of relying on expert opinion and judgment. These challenges and the need for a systematic methodology for addressing uncertainty became an incentive for initiating another program known as the SSHAC project. This effort was sponsored by NRC, U.S. Department of Energy, and EPRI, and was administered by LLNL. The final report titled “Recommendations for Probabilistic Seismic Hazard Analysis: Guidance on Uncertainty and Use of Experts” was authored by the Senior Seismic Hazard Analysis Committee (SSHAC) and was published in 1997 [C5]. SSHAC consisted of a panel of seven experts assembled by the project sponsors in 1993 and worked in cooperation with a number of other specialists. The SSHAC report became a milestone in the history of PSHA and was accepted as the document that represented the state-of-the-art in PSHA as of mid-1990. The SSHAC report was the first document that established a set of guidelines for PSHA with the emphasis on the evaluation, propagation, and documentation of uncertainty. Among the major results of the SSHAC report was the explicit recognition by the panel members of the fact that hazard estimates “can be attained only with significant uncertainty”. Due to the limited information available to characterize the inputs and to validate the results, the diversity in expert opinion is unavoidable. Therefore, the task of managing the spectrum of expert opinion in a manner that provides the most favorable conditions for obtaining results representative of the state-of-the-knowledge of the expert community becomes one of the primary goals of a successful PSHA. The report accentuated that the potential obstacles are primarily procedural, whereas the theoretical basis for
C-6

PSHA is well established. As a method for addressing the broad spectrum of expert judgment and achieving a consensus, a concept of technical integration was introduced. The function of technical integration was assigned to a special entity defined as Technical Integrator (TI) or Technical Facilitator/Integrator (TFI). Among others, the role of a TI/TFI is to assure bilateral communication between the experts and adequate representation and integration of the state-of-the-knowledge on the subject. The National Research Council (NRC) performed a formal review of the SSHAC study to critique and evaluate the proposed methodologies [C6]. The NRC panel concluded that the “SSHAC report offers substantial contributions to the foundation and practice of PSHA”. Among other comments, the NRC panel indicated that the views of a group of experts may not be representative of the views of the entire technical community, and that there are no methods to determine whether the former is a good estimator of the latter. Furthermore, success of the technical integration should not be used as an absolute measure of success of a PSHA. Moreover, on the issue of combining expert opinion, the NRC panel advised to “ not accept the results of a mechanical combination rule unless they are consistent with judgment”. The SSHAC report tapped the notion that there is no single “correct” solution to the problem of seismic hazard evaluation. Instead, the objective of a PSHA is to obtain “an acceptable analytical result” based on “a representation of the legitimate range of technically supportable interpretations among the entire informed technical community”. Therefore, the concept of an absolute “true” level of hazard was substituted in the SSHAC report by the premise that “an acceptable” and reproducible estimate of hazard can be obtained through the use of “representative” inputs with the PSHA methodology. However, the acceptance criteria for the results of a PSHA project that would allow the reviewer to either reject, accept, or recommend a revision were not explicitly specified in the SSHAC and NRC reports. C3. REFERENCES [C1] Cornell, C. A. 1968. Engineering seismic risk analysis. Bulletin of the Seismological
Society of America, Vol. 58, pp. 1583-1606.
[C2] Bernreuter, D. L., Savy, J. B., Mensing, R. W., and Chen, J.C. 1989. Seismic hazard characterization of 69 nuclear plant sites east of the Rocky Mountains. Report NUREG/CR-5250, vols. 1-8, prepared by Lawrence Livermore National Laboratory for the U.S. Nuclear Regulatory Commission.
[C3] Electric Power Research Institute. 1988. Seismic hazard methodology for central and eastern United States. EPRI NR-4726, vol., 1-10 prepared for Seismicity Owners Group.
[C4] Bernreuter, D. L., Savy, J. B., and Mensing, R. W. 1987. Seismic hazard characterization in the eastern United States: comparative evaluation of the LLNL and EPRI studies. Report NUREG/CR-4885, UCID-20696, prepared by Lawrence Livermore National Laboratory for the U.S. Nuclear Regulatory Commission.
[C5] Senior Seismic Hazard Analysis Committee (SSHAC). 1997. Recommendations for probabilistic seismic hazard analysis: guidance on uncertainty and use of experts. Report NUREG/CR-6372, UCRL-ID-122260, vol. 1-2, prepared for U.S. Nuclear Regulatory Commission, U.S. Department of Energy, and Electric Power Research Institute.
C-7

[C6] National Research Council. 1996. Review of recommendations for Probabilistic Seismic Hazard Analysis: Guidance on Uncertainty and Use of Experts. National Academy Press, Washington, D.C.
C-8