section 8: food quality and safety - УКИМ · section 8: food quality and safety ... like fruit...
TRANSCRIPT
SECTION 8: FOOD QUALITY AND SAFETY
_________________________________________________________________________________________
_________________________________________________________________________________________
828
SECTION 8: FOOD QUALITY AND SAFETY

SECTION 8: FOOD QUALITY AND SAFETY
_________________________________________________________________________________________
_________________________________________________________________________________________
829
UDC:543.4:663.252:634.863
Original scientific paper
THE USE OF NEW SPECTROPHOTOMETRIC ASSAYS FOR THE DETERMINATION
OF ANTIOXIDANT ACTIVITY OF RED WINES
Jorgovanka Bojić1, Aleksandra Radovanović
2, Branimir Jovančičević
2, Blaga Radovanović
3*
1High Polytechnic School, Кruševac, Serbia
2Faculty of Chemistry,
University of Belgrade, Serbia
3Faculty of Natural Sciences and Mathematics,
University of Niš, Serbia
*e-mail: [email protected]
Abstract
With increasing interest in the function and diversity of antioxidants in foods, several in vitro
methods for measuring antioxidant activity of grapes, fruits, beverages and their products have been
developed. Some of these methods are time-consuming and suffer from lack of selectivity and short
linear dynamic range, involve long pre-treatment steps to remove interfering species and require
complicated and expensive instruments. The present paper describes sensitive, low-cost and fast
assays for determination of antioxidant activity of red wine based on its inhibiting effect on the
reaction of bromate with hydrochloric acid. Proposed method involve addition of a known excess
of bromate and methyl orange to sample in an acid medium, and measurement of absorbance at 505
nm The reliability of the new assay was established by parallel determination by the reference 2,2`-
diphenyl-1-picrylhydrazyl (DPPH) assay and there were no noticed significant difference between
the proposed and the standard method.
Key words: Red wines, antioxidant activity, spectrophotometeric method.
Introduction
Phenolic compounds are a group of biologically active compounds, which are involved in many
metabolic routes of plants. This is a heterogeneous group constituted by catechins, anthocyanidins,
tannins, flavonones, flavones, flavonols and hydroxybenzoic and hydroxycinnamic acids, among
others. These compounds posses antioxidant properties which are thought to be related with a
reduction in the risks of coronary or cancer diseases, thus having a direct influence on human
health. Phenolics may be present in different products of plant origin, like fruit juices, olive oil and
red or white wine. They play a key role as antioxidants due to the presence of hydroxyl substituents
and their aromatic structure, which enables them to scavenge free radicals (Villano et al., 2007).
Flavonoids as well as other phenols and related compounds are also found in finished products, such
as wine or beer. They are in part responsible for the color, fragrance, and to some extent for the
taste, and therefore the quality of the wine. The composition and amount of phenolic compound
depends on the sample, origin of raw material, elaboration process and storage conditions. Hence,
these compounds are significant for wine production, as they can be used to control the quality of
red and white wine and to determine the varietal origin by quantitative analysis of the flavonoid
content (Lachman et al, 2009; Rodriguez-Diaz et al., 2006). Very high amounts of polyphenols in
fruits can have negative effects on the quality of grape juice and wine. Autoxidation of polyphenols
SECTION 8: FOOD QUALITY AND SAFETY
_________________________________________________________________________________________
_________________________________________________________________________________________
830
to yellow- or brown-colored quinones. Furthermore, polyphenols can react with proteins,
carbohydrates and minerals. This also leads to decrease in quality. Along with polyphenols grapes
also contain polyphenoloxidases, which catalyze the oxidation of polyphenols to quinones
(Harkensee et al., 2006).
With increasing interest in the function and diversity of antioxidants in foods, several in vitro
methods for measuring antioxidant activity of food, beverages and biological samples have been
developed. The most commonly used antioxidant capacity assays include oxygen radical absorbance
capacity (ORAC assay), reducing power, determination of total phenols, 2,2-azino-di-(3-
ethylbenzothialozine-sulphonic acid) (ABTS assay), 2,2-diphenyl-1-picrylhydrazyl (DPPH assay),
hydroxyl radical-scavenger activity, superoxide radical-scavenger activity and lipid peroxidation
inhibition. These methods differ in terms of their assay principles and experimental conditions.
Because multiple reaction characteristics and mechanisms are usually involved, no single assay will
accurately reflect all antioxidants in a mixed or complex system (Li et al., 2009).
Some of these methods are time-consuming and suffer from lack of selectivity and short linear
dynamic range, involve long pre-treatment steps to remove interfering species, require complicated
and expensive instruments, or use reagents that are not commercially available. Methyl orange, such
as many acid dyes, are prone to oxidation to form colorless products in an acid medium, thus
providing a suitable analytical approach for the indirect assay of inorganic ions (Ensafi et al. 2002),
organic compounds (Basavaiah et al. 2005), and pharmaceuticals (Basavaiah et al., 2006). The
produced bromine and chlorine react with methyl orange and this reaction causes decolorization of
the solution. However, no bromate–hydrochloric acid reaction has been developed for the
determination of antioxidant activity of wine. The present paper describes a sensitive, simple, low-
cost, and fast method for determination antioxidant activity of wine based on its inhibiting effect on
the reaction of bromate with hydrochloric acid.
The employed method is based on a reaction between bromate and chloride ions in highly acidic
media. Bromate can be reduced by hydrochloric acid, producing bromine and chlorine: 10 Cl− + 2
BrO3− + 12 H
+ → 5 Cl2 + Br2 + 6 H2O.
Decolorization of methyl orange by the reaction products was used to monitoring the reaction
spectrophotometrically at 505 nm.
Material and methods
Chemicals and samples
All chemicals and reagents were of analytical grade and were obtained from Sigma Chemical Co.
(St. Louis, MO, USA), and Merck (Darmstadt, Germany). There was used the following chemicals:
2,2`-diphenyl-1-picrylhydrazyl free radical (DPPH), KBrO3, methyl orange, methanol, ethanol,
hydrochloric acid. Two selected wines, red wine Vranac (Rubin, Kruševac), and rose wine Rose
(Rubin, Kruševac) from different grape cultivars grown in south Serbia were analyzed.
Determination of antioxidant activity
New inhibiting assay
The inhibited reaction was monitored spectrophotometrically by observing the change in the
absorbance at 505 nm of following reagent solution:
An aliquot of the diluted wine was transferred into a 10-ml volumetric flask, and then 1 ml of
hydrochloric acid, followed by a 1.0 ml methyl orange and 1.0 ml bromate were added to the
solution. The change in the absorbance with time was measured for 1 − 15 min from the initiation

SECTION 8: FOOD QUALITY AND SAFETY
_________________________________________________________________________________________
_________________________________________________________________________________________
831
of addition of the last drop of the bromate solution. Inhibition of methyl orange degradation in
percent (I%) was calculated in following relationship:
Inhibition (%) = (Asample 5 min/Intsample – Ablank 5 min/Intblank) x 100
where Ablank 5 min is the absorbance of the control reaction 5 min after addition of the last drop of the
bromate solution, Intblank is intercept from regression equation of the control reaction, Asample is the
absorbance of the system with tested wine 5 min after addition of the last drop of the bromate
solution, and Intsample is intercept from regression equation of the system with wine. All the solutions
were kept at 22 ºC. All experiments were carried out in triplicate for reproducibility of results.
DPPH assay
Antioxidant activity of test wine samples was determined by using free radical scavenging (DPPH)
assay (Radovanović et al, 2010; Villano et al., 2007). This antioxidant assay is based on the
measurement of DPPH radical colour loss due to the changes in absorbance at 517 nm, caused by
the reaction of DPPH radical with the test sample. After 20 min at room temperature, A517 nm was
measured against the blank.
The DPPH-scavenging activity of each wine sample was calculated from the decrease in absorbance
according to following relationship:
Scavenging activity (%) = [1 – (Asample - Ablank)/Acontrol] x 100
where: Acontrol is the absorbance of control, Ablank is the absorbance of diluted wine sample and
Asample is the absorbance of the diluted wine sample with the same concentration of DPPH-radical as
in control.
Statistical analysis
Three analytical replicates were carried out on each grape sample. The standard deviation was
calculated by ANOVA using the Minitab statistical package (Minitab Inc., State College, PA,
USA).
Results and discussion
The electronic absorption spectra of methyl orange aqueous solution before (curve 1) and after
addition of hydrochloric acid (curve 2), as well as after addition of bromate (curve 4) and after
addition of bromate and wine (curve 3) are shown in Fig. 1.
It is observed that the absorption spectrum of methyl orange in water at pH = 5.9 (weakly acidic) is
characterized by one band in the visible region, with maxima located at 464 nm, and by two bands
in the ultraviolet region, located at 271 and 199 nm. The chromophore contain azo linkage has
absorption in the visible region, while the benzene ring and the naphthalene ring have absorptions in
the UV region. The naphthalene ring absorption wavelength is higher than that of benzene ring.
SECTION 8: FOOD QUALITY AND SAFETY
_________________________________________________________________________________________
_________________________________________________________________________________________
832
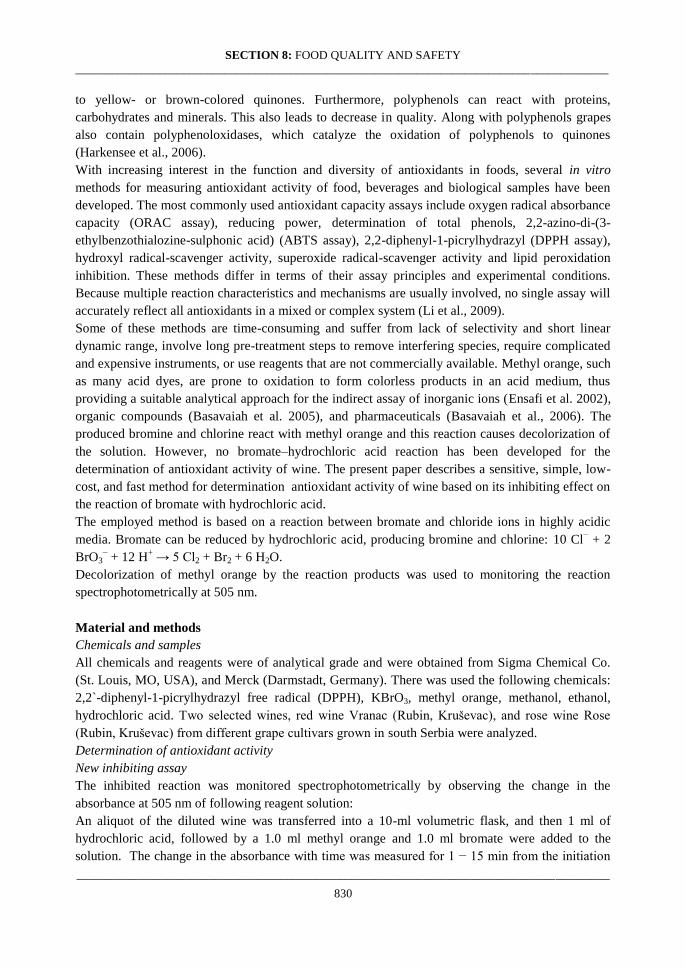
Figure 1. Absorption spectra of methyl orange aqueous solution: weakly acidic medium (pH = 5.9)
(curve 1); in acid solution (pH = 0.6) (curve 2); in acid solution, 5 min after addition of potassium
bromate (curve 4); in acid solution in presence of wine, 5 min after addition of potassium bromate
(curve 3)
The spectrum recorded after addition HCl in aqueous solution of methyl orange, at pH = 0.6, was
characterized by four bands at 505, 312, 272 and 205 nm. The same bands are present in the
spectrum after addition of bromate and after addition bromate and wine in acid solution of methyl
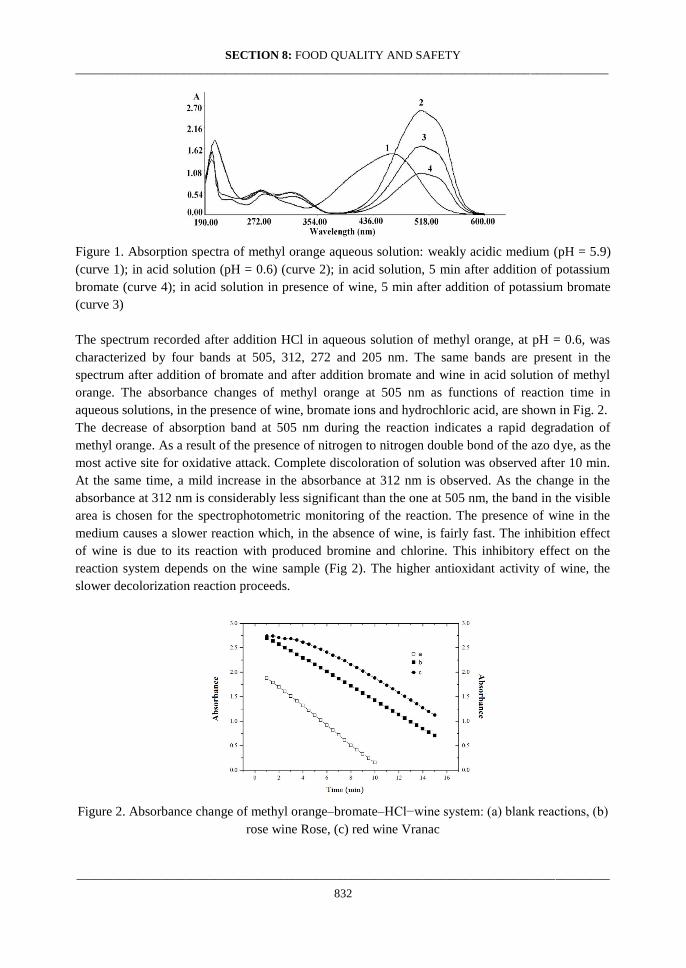
orange. The absorbance changes of methyl orange at 505 nm as functions of reaction time in
aqueous solutions, in the presence of wine, bromate ions and hydrochloric acid, are shown in Fig. 2.
The decrease of absorption band at 505 nm during the reaction indicates a rapid degradation of
methyl orange. As a result of the presence of nitrogen to nitrogen double bond of the azo dye, as the
most active site for oxidative attack. Complete discoloration of solution was observed after 10 min.
At the same time, a mild increase in the absorbance at 312 nm is observed. As the change in the
absorbance at 312 nm is considerably less significant than the one at 505 nm, the band in the visible
area is chosen for the spectrophotometric monitoring of the reaction. The presence of wine in the
medium causes a slower reaction which, in the absence of wine, is fairly fast. The inhibition effect
of wine is due to its reaction with produced bromine and chlorine. This inhibitory effect on the
reaction system depends on the wine sample (Fig 2). The higher antioxidant activity of wine, the
slower decolorization reaction proceeds.
Figure 2. Absorbance change of methyl orange–bromate–HCl−wine system: (a) blank reactions, (b)
rose wine Rose, (c) red wine Vranac
SECTION 8: FOOD QUALITY AND SAFETY
_________________________________________________________________________________________
_________________________________________________________________________________________
833
As expected, the red wines had significantly higher antioxidant activity compared to rose wine. This
is due to a greater grape skin and seed contact time and temperature for the fermentation process for
red wines. The percentage inhibition for red wine Vranac was 61.8% for DPPH and 59.41% for new
assay, when the inhibition for diluted rose wine Rose, was 29.35% (DPPH assay) and 25.15% (new
assay).
The good agreement between these two methods indicates the successful applicability of the
proposed method for the determination of antioxidant activity of wine samples.
Conclusions
It is verified that the red wines have higher phenolic content levels than rose wines and the same
result is obtained for antioxidant activity. The good agreement between results of DPPH assay and
new inhibiting assay indicate the successful applicability of the proposed method for the
determination of antioxidant activity of wine.
Acknowledgment
The research was supported by the Europe Union (FP7-Regpot-2007-3-01, Project «Chromlab-
Antioxidant», No. 204756) and by the Ministry of Education and Science of the Serbia, No. project
TR-34012, 031020 and 176006.
References
Basavaiah K., Chandrashekar U., Nage Govda P. (2005). Titrimetric and spectrophotometric assay
of felodipine in tablets using bromate–bromide, methyl orange and indigo carmine reagents. Journal
of the Serbian Chemical Society, 70, 969−978.
Basavaiah K., Chandrashekar U., Nage Govda P. (2006). Titrimetric, spectrophotometric and
kinetic methods for the assay of atenolol using bromate–bromide and methyl orange. Journal of the
Serbian Chemical Society, 71, 553−563.
Ensafi A.A., Rezaei B., Movahedinia H. (2002). Kinetic–spectrophotometric determination of
ascorbic acid by inhibition of the hydrochloric acid–bromate reaction. Spectrochimica Acta Part A,
58, 2589–2594.
Harkensee, Daniela, Beutel, S., Young, M., Ulber, R. (2006). Development of a fast spectroscopic
enzyme assay for on-site measurement of total polyphenol content in grapes and wine. Analytical
Bioanalytical Chemistry, 384, 1013–1018.
Lachman, J., Šulc, M., Faitova, K. and Pivec, V. (2009). Major factors influencing antioxidant
contents and antioxidant activity in grapes and wines. International Journal of Wine Research, 1,
101-121.
Li, H., Wang, X., Li, Y., Li, P., Wang, H. (2009). Polyphenolic compounds and antioxidant
properties of selected China wines. Food Chemistry, 112, 454–460.
Radovanović, B., Radovanović, A. and Souquet, J-M., (2010). Phenolic profile and free
radical’scavenging activity of Cabernet sauvignon wines of different geographical origins from the
Balkan region. Journal of Science Food and Agriculture, 90, 2455-2461.
Rodriguez-Diaz, R.C., Aguilar-Caballos, Maria Paz, Gomez-Hens, Agustina, (2006). Determination
of some hydroxybenzoic acids and catechins in white wine samples by liquid chromatography with
luminescence detection, Journal for Separation Sciences, 29, 2772 – 2779.
SECTION 8: FOOD QUALITY AND SAFETY
_________________________________________________________________________________________
_________________________________________________________________________________________
834
ПРИМЕНА НА НОВА СПЕКТРОФОТОМЕТРИСКА АНАЛИЗА ЗА ОПРЕДЕЛУВАЊЕ
НА АНТИОКСИДАНСНАТА АКТИВНОСТ НА ЦРВЕНИ ВИНА
Јоргованка Бојиќ, Александра Радовановиќ, Бранимир Јованчичевиќ, Блага Радовановиќ
Апстракт
Со зголемување на интересот за функцијата и разновидноста на антиоксидансите во храната,
се резвиени неколку in vitro методи за мерење на антиоксидансната активност на грозје,
овошје, пијалаци и нивните производи. За некои од овие методи е потребно време, се
карактеризираат со недостаток на селективност и краток линеарен динамички опсег,
потребни им се долги чекори на предтретман за да се отстранат компонентите кои пречат и
бараат комплицирани и скапи инструменти. Во овој труд е опишана осетлива, ефтина и брза
анализа за определување на антиоксидансната активност на црвено вино базирана на
неговиот инхибирачки ефект врз реакцијата на бромат со хлороводородна киселина.
Предложениот метод се изведува со додавање на познат вишок на бромат и метил оранж на
примерокот во кисела средина, и мерење на апсорбанцата на 505 nm. Веродостојноста на
новиот метод е воспоставена со паралелно определување со референтната 2,2`-дифенил-1-
пикрилхидразил (DPPH) анализа, пришто не беше забележана значајна разлика меѓу
предложениот и стандардниот метод.
Клучни зборови: црвени вина, антиоксидансна активност, спектрофотометриски метод.

SECTION 8: FOOD QUALITY AND SAFETY
_________________________________________________________________________________________
_________________________________________________________________________________________
835
UDC:635.649-026.656:641.1
Оriginal scientific paper
IMPACT OF FREEZING ON NUTRITIONAL COMPOSITION IN DIFFERENT
VARIETIES OF RED PEPPERS
Karakasova Ljubica1*
, Babanovska-Milenkovska Frosina1, Hussein G. Daood
2, Manasievska-Simic
Silvana1
1Faculty of Agricultural Sciences and Food-Skopje, Ss. Cyril and Methodius University in Skopje,
Macedonia 2Central Food Research Institute, Budapest, Hungary
*e-mail: [email protected]
Abstract
Red peppers have a high content of biological active components in their nutritional composition
which are essential for human health. The high content of vitamin C and carotenoids in peppers are
variable depending on variety, degree of maturity, applied agro-technical measures and method of
processing. Freezing is one such applied method of preservation. Freezing the peppers stops or
slows growth of microorganisms and enzymatic process. Three varieties of peppers, each with an
intense red color were frozen: kurtovska kapija, palanechko chudo and horgosh. The freezing of the
peppers was performed industrially, as cubes 10 x 10 mm, at tunnel for fast deep freezing, on T of
about – 34 ˚С ± 1 ˚С. Frozen peppers were packed into suitable packaging. The analyses were
performed on fresh and frozen peppers for their nutritional composition: total dry matters, sugars by
HPLC-RI, total acids, vitamin C, total carotenoids, beta-carotene by HPLC-DAD, fats, proteins,
cellulose and ash. The variety horgosh, as a spicey variety of pepper, had been characterized with
the highest content of total dry matters: 11.446 % for fresh and 10.518 % for frozen. This variety
had the highest content of bioactive components: vitamin C (135.908 mg/100 g) and total
carotenoids (690.15 µg/g). By comparing analyzed nutritional components for frozen as opposed to
fresh peppers, there was noticed a decreasing of total dry matters content, and thereby on sugars,
proteins and fats. In frozen peppers, a decreasing of vitamin C, beta-carotene and total carotenoids
content was noticed.
Key words: red peppers, freezing, nutritional composition.
Introduction
The pepper belongs to the family Solanaceous, species Capsicum annuum L. and is an important
vegetable crop, increasingly used because of its economic importance and also its chemical
composition. There are different varieties of peppers, in different shades of color (green, yellow,
orange, red and purple), in different shapes and sizes and with characteristic flavors (Lucier et al.,
2001). The pepper is a very important raw material for the canned food industry. It can be used
fresh or processed and can be dried, pickled, cooked, biologically fermented and frozen (cut into
slices or cubes) (Marković et al., 1998). Depending on the type of product desired, peppers in
various stages of technological and physiological maturity are used. Most of the products require

SECTION 8: FOOD QUALITY AND SAFETY
_________________________________________________________________________________________
_________________________________________________________________________________________
836
mature peppers, with an intensive red color and also with a high content of dry matter (Marković et
al., 1998).
In their chemical composition, the peppers contain nutrients and bioactive components whose
quantities depend on environmental factors present during cultivation, variety of the pepper and the
degree of ripeness. The nutritional value of peppers is due to the presence of nutritional
components: carbohydrates, protein, fiber, organic acids, fats and minerals (Marković et al., 1998).
The rich chemical composition with excellent sensory properties (taste, color, smell), make peppers
irreplaceable in human nutrition (Marković et al., 1998). Peppers are an excellent source of natural
pigments, carotenoids, and vital micronutrients such as vitamin C in significant amounts and
vitamin E (Somos, 1984). Vitamin C has antioxidant properties and therefore is essential for human
biological functions, by acting preemptively on usual degenerative processes (Davey et al., 2000).
The red color in the fruits of mature peppers is due to the presence of natural pigment carotenoids
including: capsorubin cryptoxanthin and zeaxanthin, as esters of fatty acid. The most important
pigments are capsanthin and its isomer capsorubin, which represent 30-60 % and 6-18 %
respectively, of the total number of these carotenoids in the fruits (Nadeem et al., 2011). The
intensity of the red color is primarily a function of the amount of these pigments; Hungarian and
Spanish spicy varieties of peppers, used for production of spicy peppers, have a high content of
capsanthin and capsorubin, compared with other varieties (Govindarajan, 1985). It was set out that
different factors influence the composition and quantity of carotenoids and bioactive components,
such as vitamninite C and E, which have an important role in stability of colored substances during
ripening, processing and storage of red peppers (Biacs et al. 1992; Daood et al. 1996). The
importance of carotenoid components in human nutrition is well known, not only because some of
them are precursors of vitamin A, but also as an antioxidant in cells to protect from degenerative
diseases (Stahl et al., 2003).
Freezing as a technological procedure for preservation of food has been known for a long time. It is
a canning procedure, where application of low temperatures prevents the activity of microorganisms
(Vereš, 2004). According to some sensor indicators (smell, taste, color) frozen food is a little
different from fresh, not processed food (Vereš, 2004).
The frozen pepper is a product obtained by preparation and freezing of whole or parts of pepper
fruits. The requirements for quality of frozen peppers, which are cut into slices or cubes, are
increasing in the recent years, as a result of the demands of consumers to consume fresh, minimally
processed vegetables, as part of healthier food habits (Castro et al., 2008). A variety of peppers
which have intensive color, characteristical for the variety, and have a certain thickness of pericarp
are used for freezing. According to the color of the peppers that are used for production, the frozen
peppers can be red, green and colorful. Peppers are commonly frozen as slices ranging from 5 to 10
mm or as cubes 7 x 7 and 10 x 10 mm, without seeds (Marković et al., 1998). In general, after
preparing the peppers in the factory, without blanching, they go directly for freezing, unless the
buyer insists that the peppers shall be previously blanched. Blanching is performed in order to
destroy living microorganisms and for inactivation of enzymes. To maintain the color of frozen
products, the following considerations have great importance: blanching, rapid cooling, time of
freezing and storage temperature, because changes of temperature during storage can cause
discoloration. The most frequently applied process, which yields the best results, is the use of
continuous tunnels, because in the beginning, the tunnel has fluidisation, which prevents the cut
pieces from sticking together, i.e. achieves separation of the pieces, upon which, among other

SECTION 8: FOOD QUALITY AND SAFETY
_________________________________________________________________________________________
_________________________________________________________________________________________
837
things, relies the quality of the frozen products. The freezing in the tunnel is achieved by rapid
freezing the peppers in temperatures of - 35 ºC or lower. When applying rapid deep freezing,
microcrystalline structures are formed and do not damage the mechanical tissue of peppers. The
water is frozen in its own natural state, with all of the substances that are found in the cell juice
(Cvetkov, 1982). The frozen pepper as a finished product shall be properly labeled and transported
to consumers at a temperature of -15 ºC or lower. After thawing, the food is not allowed to be re-
frozen (Marković et al., 1998).
The influence of the freezing process on quality of the product is great. During freezing, some
physical and chemical changes occur, such as drying of the product, which occurs as a result of
sublimation of water, especially if the product is not properly packed. Then, ice macro crystals may
occur and damage the plant tissue, as well as evaporate some of the aromatic substances whichis
quite noticeable in the peppers, (Cvetkov, 1982). Chemical changes in frozen vegetables can be of
enzymatic and non enzymatic nature, but at very low temperatures come to a reduction of the
activity of enzymes. Chemical changes during freezing and during storage of frozen products are:
denaturation of proteins, fat oxidation, enzymatic browning, loss of aroma and denaturation
pigments and vitamins.
Frozen food is generally recognized as a safe food. (Barbosa-Canovas et al., 2005). In terms of
safety of frozen products, it is directly depends on the quality of raw material before freezing
process, hygienic practices, and standards between all steps of the manufacturing process, storage
and distribution (Evans, 2008).
Material and methods
Samples
This paper studied industrial peppers of three varieties: kurtovska kapija, palanechko chudo and
horgosh. The varieties kurtovska kapija and palanechko chudo originate from the Strumica region
and are commonly used in the canned food industry, while the variety horgosh originates from the
Demir Kapija region and it is spicy variety, which is mostly used for the production of spices.
Peppers were harvested at full technological maturity, when the fruit achieved distinctive shape, size
and get an intensive red colour. The research consisted of an analysis of quality parameters,
nutrients, energy value, vitamin C and carotenoids on of fresh peppers as well as frozen peppers.
Examinations were made at the laboratories for food quality control in the Institute of Public Health
in Skopje, at the laboratory of the Department for processing fruits and vegetables, Faculty of
Agricultural Sciences and Food in Skopje and at the laboratories of the Central Food Research
Institute in Budapest, Hungary. Analyses were made by using standard laboratory methods (Vračar,
2001), equipment and standard chemical reagents. Chemicals and standards used for HPLC methods
were with HPLC purity.
Technology of freezing
The technological process of freezing was performed industrially, at the factory "DS Foods",
Kumanovo. Preparation of the peppers for freezing was carried out by manually sorting the peppers
according to equalization in color and size, where the dimension of the peppers is particularly
important and should be accounted for according to the needs of cutting machine. Then the peppers
were washed, cut and the stalk and seeds were manually removed. The peppers were brought into a
perforated drum, where a strong jet of water was used in order to completely remove the seeds and
waste, after which, cleaned, sliced quarters of peppers were cut into certain dimensions as cube or

SECTION 8: FOOD QUALITY AND SAFETY
_________________________________________________________________________________________
_________________________________________________________________________________________
838
slices. The peppers passed through a horizontal movable strip with several ventilators to remove
excess water. A universal continuous freezing tunnel was used to freeze the peppers, and ammonia
was used as a cooling medium. The temperature of the freezing was - 35 ºC ± 1 ˚C or lower, and the
tunnel had an air flow, so that the raw material was frozen for a period of 10 - 15 minutes, whereby
it is important that at the center of the unit product, the temperature should be -15 ºC or lower
(Marković et al., 1998). Frozen peppers, through an output dosimeter, were filled in cardboard
boxes, with a PVC tool tray, from 10 to 12 kg, and were appropriate declared. The final products
were lined up on a palette in closed containers and moved to the cooling chambers, at a temperature
of - 20 to - 25 °C, where they were stored until delivery.
Morphological characteristics of fresh peppers
Morphological measurements were made on fresh peppers from varieties: kurtovska kapija,
palanecko chudo and horgosh. For these measurements 30 fruits of peppers of each variety were
taken and measured with the following parameters: weight, height, width, as well as the thickness of
pericarp and also weight of cleaned out peppers. According to these data, percentages of the useful
part of the pepper fruits for each variety of peppers were calculated.
Determination of quality
The quality was determined using the following parameters: total dry matter with gravimetric
method, by drying the samples in an oven dryer at 105 ºC to constant mass; total acidity by applying
of volumetric method, where as solution for titration was used 0.1 M solution of NaOH; ash was
determined with reference, by incineration and burning of samples in a Muffle oven, on temperature
of 550 °C.
Determination of nutritional value
To determine the nutritional value of fresh and frozen peppers, analyzes were made of the following
chemical parameters: sugars by applying HPLC-method with RI-detector (internal method in
Institute of Public Health); fats were assessed with extraction, according to the Soxhlet method;
proteins were determined through the content of nitrogen, analyzed with the Kjeldahl method;
cellulosa was determined by using gravimetric method after Scharrer - Kürschner. For calculation of
the total energy value of fresh and frozen peppers, appropriate coefficients for each of the nutrients
were used.
Determination of vitamin C and carotenoids
Vitamin C was determined by applying the volumetric method, where a solution of 0.1 N J2 was
used for titration. Determination of carotenoids had been done at the laboratory of the Central Food
Research Institute in Budapest, Hungary, by applying of internal method for the extraction and
determination. Carotenoids were determined by applying of liquid chromatography, with HPLC-
method. Carotenoids were extracted with organic solvents, methanol and dichloromethane, while
for chromatographic method was used a reverse-phase column, Vis detection were provided at
wavelength of 473 nm, using gradient program. For quantification was used a standard β-carotene,
whereby peaks of the samples were integrated and quantified in terms of surface peak of calibration
standard.
Results and discussion
Determination of morphological properties of fresh peppers
Each variety of pepper is distinguished by special biological, morphological and production
properties, as well as purposes for which they can be used (Jankulovski, 1997). The examinations of
SECTION 8: FOOD QUALITY AND SAFETY
_________________________________________________________________________________________
_________________________________________________________________________________________
839
morphological characteristics of fresh pepper fruits are important for determining their variety
characteristics. During the breeding of the peppers, despite genotypic factors, influence on
morphological characteristics also have environmental and conditions of cultivation. Genotypic
factors are considered to have a dominant influence on diameter (50.53 %), weight (50.16 %) and
the useful part (48.06 %) of fruits of pepper, while enviroment has a dominant influence of hight of
peppers fruits (34. 31 %). It was determined that there is a difference in thickness of pericarp that is
mainly due to genotypic differences (38.53 %) and their interaction with the environment (35.89 %)
(Todorova, 2007). Peppers that are harvested in their technological maturity, and are characterized
by fully formed fruit shape and appearance that is characteristic for the variety (Marković et al.,
1998). According to size, fruits of peppers are grouped in: very large fruiting – weight more than
150 g; large fruiting 40 - 150 g; intermediate large fruiting of 10 - 40 g; minor fruiting 4 - 10 g and
very small fruiting, with weight below 4 g (Jankulovski, 1997). The thickness of pericarp is a
variety characteristic, and often depend on the conditions of cultivation. According thickness of
pericarp fruits of peppers are divided into groups: very fleshy - over 6 mm thick of pericarp, fleshy
from 4 - 6 mm, medium fleshy 2 - 4 mm, weakly fleshy below 1 mm thick pericarp (Jankulovski,
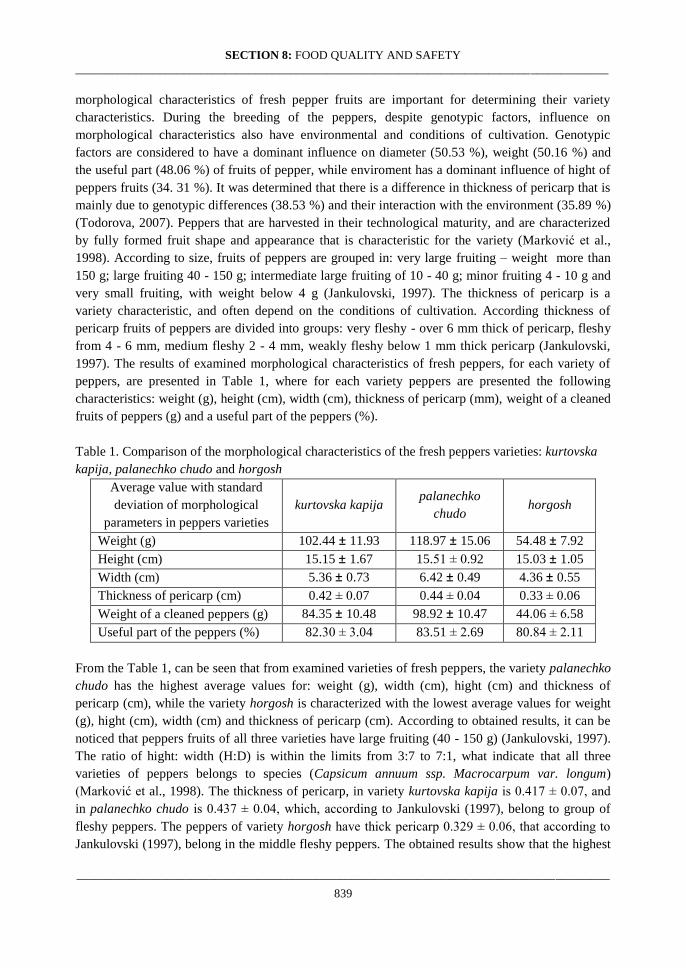
1997). The results of examined morphological characteristics of fresh peppers, for each variety of
peppers, are presented in Table 1, where for each variety peppers are presented the following
characteristics: weight (g), height (cm), width (cm), thickness of pericarp (mm), weight of a cleaned
fruits of peppers (g) and a useful part of the peppers (%).
Table 1. Comparison of the morphological characteristics of the fresh peppers varieties: kurtovska
kapija, palanechko chudo and horgosh
Average value with standard
deviation of morphological
parameters in peppers varieties
kurtovska kapija palanechko
chudo horgosh
Weight (g) 102.44 ± 11.93 118.97 ± 15.06 54.48 ± 7.92
Height (cm) 15.15 ± 1.67 15.51 ± 0.92 15.03 ± 1.05
Width (cm) 5.36 ± 0.73 6.42 ± 0.49 4.36 ± 0.55
Thickness of pericarp (cm) 0.42 ± 0.07 0.44 ± 0.04 0.33 ± 0.06
Weight of a cleaned peppers (g) 84.35 ± 10.48 98.92 ± 10.47 44.06 ± 6.58
Useful part of the peppers (%) 82.30 ± 3.04 83.51 ± 2.69 80.84 ± 2.11
From the Table 1, can be seen that from examined varieties of fresh peppers, the variety palanechko
chudo has the highest average values for: weight (g), width (cm), hight (cm) and thickness of
pericarp (cm), while the variety horgosh is characterized with the lowest average values for weight
(g), hight (cm), width (cm) and thickness of pericarp (cm). According to obtained results, it can be
noticed that peppers fruits of all three varieties have large fruiting (40 - 150 g) (Jankulovski, 1997).
The ratio of hight: width (H:D) is within the limits from 3:7 to 7:1, what indicate that all three
varieties of peppers belongs to species (Capsicum annuum ssp. Macrocarpum var. longum)
(Marković et al., 1998). The thickness of pericarp, in variety kurtovska kapija is 0.417 ± 0.07, and
in palanechko chudo is 0.437 ± 0.04, which, according to Jankulovski (1997), belong to group of
fleshy peppers. The peppers of variety horgosh have thick pericarp 0.329 ± 0.06, that according to
Jankulovski (1997), belong in the middle fleshy peppers. The obtained results show that the highest

SECTION 8: FOOD QUALITY AND SAFETY
_________________________________________________________________________________________
_________________________________________________________________________________________
840
average of utilization of pepper fruits (%) have fruits from the variety palanechko chudo (83.509 ±
2.69), while the lowest have the pepper fruits of the variety horgosh (80.843 ± 2.11). Тhe results of
measurements for morphological properties were statistically elaborated for each of the examined
varieties of peppers and for each of the examined parameters. The F-test was used and it was
established that between varieties kurtovska kapija and palanechko chudo there was no statistically
significant differences in relation to weight (P = 0.015) and height (P = 0.0009) of the peppers
fruits. Between varieties kurtovska kapija and horgosh and also between palanechko chudo and
horgosh there were statistically significant differences (P <0.05) in relation to weight thickness of
pericarp and width of the peppers fruits.
Determining quality of fresh and frozen peppers
According to the Regulation on specific requirements relating to quick-frozen foodstuffs (Official
Gazette No.32, 2006), the raw materials used in production of quick-frozen foodstuffs must be of
good marketable quality and possess the necessary level of freshness. The quality of pepper
varieties are evaluated according to: physical and sensory properties, physicochemical analysis and
evaluation of the nutritional value (Pruthi, 2003). The quality of the fresh pepper fruits depends on:
variety, time and manner of production, mineral nutrition of plant, breeding and protective
measures, as well the time and method of harvest, etc. (Ilić et al., 2009).There are many factors
which could affect the characteristics of final frozen vegetable, such as: type of product, variety,
degree of maturity, the quality of the raw material, method of harvest, time from harvest to
processing and treatments before freezing (Torreggiani et al., 2000). All of these factors and/or their
combination, along with packaging and conditions of storage and during the distribution chain, have
an effect on quality of frozen product (Evans, 2008). In peppers, water as a most typical ingredient
is in a free condition, and one part is tied with proteins, carbohydrates and salts. Freezing
temperature depends on the concentration of soluble matters. The freezing point is lower for the
higher concentration of soluble matters (Veresh, 2004). Formation of ice crystals can cause
disruption of frozen tissue which leads to release of enzymes and chemical substances that affect the
quality of frozen food (Da-Wen, 2006). In Table 2 are presented results of analysis of individual
chemical parameters, according what were determined the quality of fresh and frozen pepper
varieties: kurtovska kapija, palanechko chudo and horgosh.
Table 2. Comparison of quality parameters among fresh and frozen peppers from varieties:
kurtovska kapija (KK), palanechko chudo (PC) and horgosh (H)
Parameter for
analysis KK fresh PC fresh H fresh
KK
frozen PC frozen H frozen
Water (%) 90.601 ±
0.146*
91.609 ±
0.107*
88.554 ±
0.124*
92.029 ±
0.178*
91.815 ±
0.175*
89.482 ±
0.168*
Total dry matter (%) 9.399 ±
0.146*
8.391 ±
0.107*
11.446 ±
0.124*
7.971 ±
0.178*
7.883 ±
0.175*
10.518 ±
0.168*
Ash (%) 0.464 ±
0.054*
0.516 ±
0.019*
0.671 ±
0.060*
0.415 ±
0.025*
0.375 ±
0.019*
0.577 ±
0.056*
Total acidity (%)
(as citric acid)
0.372 ±
0.027*
0.396 ±
0.025*
0.315 ±
0.041*
0.251 ±
0.012*
0.197 ±
0.015*
0.239 ±
0.042*
*standard deviation
SECTION 8: FOOD QUALITY AND SAFETY
_________________________________________________________________________________________
_________________________________________________________________________________________
841
According to results in Table 2, it can be note that the variety kurtovska kapija has the highest
content of water (%) in frozen pepper and the lowest content of ash (%) in fresh peppers. The
variety palanechko chudo has the highest content of water (%) and total acidity, as citric acid (%)
in fresh peppers, while the lowest content of total dry matter (%) in fresh peppers, ash (%) and total
acidity, as citric acid (%), in frozen peppers. In the variety horgosh were determined the highest
content of total dry matter (%) and ash (%), in fresh as well in frozen peppers, total dry matter (%),
ash (%). Also, this variety has the lowest content of total acidity, as citric acid (%) and water (%) in
fresh and water (%) in frozen peppers.
The obtained resalts were statistically elaborated, for all examinated varieties of fresh and frozen
peppers, were calculated the mean values and standard deviation for each of tested parameters for
quality. There were estimated: average value of water (%) in fresh and in frozen peppers; average
value of total dry matter (%) in fresh and in frozen peppers; average value of ash (%) in fresh and in
frozen peppers; average value for total acidity, as citric acid (%) in fresh and in frozen peppers.
According to obtained results, water content in the examined fresh peppers varieties corresponds to
the values according to Somos (1984) where the water content in the fruit of pepper ranges from 82
– 92 % (Marković, 1998), and also according to Niketić-Aleksić et al. (1989), where fresh red
pepper contains 90.7 % water. Obtained values for ash or mineral matters in examined samples are
approximate in comparison with data from Niketić-Aleksić et al. (1989), where fresh red pepper
contains 0.5% ash. Organic acids are weakly present in peppers, and as the most common are citric
and malic acids, but their effect on taste of peppers and depends on their proportion with sugars
(Jankulovski, 1997).
By comparing results of quality parameters among fresh and frozen peppers for all three varieties of
peppers, it was noted that there was a decrease of dry matter, ash and total acids, which is due to a
loss of water content along with soluble substances during thawing (Cvetkov, 1982).
After analysing the results for quality parameters of fresh and frozen peppers, it was established that
during the freezing process, the percentage of water increases by (+) 0.225 % in the palanechko
chudo and by (+) 1.576 % in kurtovska kapija, while the total dry matter is reduced by (-) 6.054% in
palanechko chudo and (-) 15.193 % in kurtovska gate.
To determine changes of quality parameters in fresh peppers during freezing, statistical elaborations
of results were made by applying the F-test. It was determined that between fresh and frozen
varieties of peppers, kurtovska kapija and palanechko chudo, there were no statistically significant
differences , compared to the average water content, total dry matter, ash and total acids, as citric
acids. Small changes were due to changes in the structure of the cells when thawing, then it comes
to losing their turgor, responsible for shape of tissue (Cvetkov, 1982).
Determining nutritional value of fresh and frozen peppers
The nutritional value of peppers is due to the presence of nutritional components: total carbohydrate
(7.1 %), of which sugars (5.2 %) and cellulose (1.7 %), then protein (1.4 %) and fat (about 0.3 %)
(Vracar, 2001).
By comparison of quality for examined fresh and frozen peppers, all three varieties had a reduction
in dry matter after freezing. According to Cvetkov, (1982), by freezing and after the thawing, there
is a loss of juice from the products together with other nutrients dissolved in the juice, such as:
sugars, vitamins, mineral matter and organic acids. To estimate how big are changes of nutrients in
varieties of peppers, kurtovska kapija, palanechko chudo and horgosh after freezing, the results

SECTION 8: FOOD QUALITY AND SAFETY
_________________________________________________________________________________________
_________________________________________________________________________________________
842
from examination are presented in a Table 3. It can be noted that content of total dry matter in fresh
peppers are higher, than in frozen peppers.
The variety of pepper which stands out with the highest content of dry matter was horgosh, in fresh
(11.446 %), also in frozen (10.218 %) peppers. As a result of this, the variety horgosh was
characterized by the highest content of fructose (3.866 %) in frozen; glucose (3.393 %) in fresh and
(2.917 %) in frozen; cellulose (1.821 %) in fresh and (1.805%) in frozen; protein (1.431 %) in fresh
and (1.388 %) in frozen; fat (0.494 %) in fresh and (0.413 %) in frozen peppers. In fresh peppers,
the the variety kurtovska kapija had the highest content of fructose (4.323 %).
Table 3. Comparison of nutrients among fresh and frozen peppers from varieties: kurtovska kapija
(KK), palanechko chudo (PC) and horgosh (H)
Parameter for analysis KK
fresh
KK
frozen PC fresh
PC
frozen H fresh H frozen
Total dry matter (%) 9.399 7.971 8.391 7.883 11.446 10.518
Fructose (%) 4.323 3.279 3.892 3.486 4.243 3.866
Glucose (%) 2.729 2.552 2.396 2.250 3.393 2.917
Cellulose (%) 1.026 0.976 0.992 0.982 1.821 1.805
Proteins (%) 0.983 0.922 0.876 0.851 1.431 1.388
Fats (%) 0.28 0.201 0.213 0.205 0.494 0.413
Vitamin С (mg/100g) 132.057 94.166 124.663 82.44 138.908 88.311
β – carotene (µg/g) 32.59 27.05 20.04 11.32 101.35 67.40
Total carotenoids (µg/g) 254.55 239.39 223.48 150.76 690.15 587.88
It was determined that the variety horgosh had the highest content of vitamin C (138.908 mg/100 g)
in fresh peppers, compared to the variety kurtovska kapija in frozen peppers (94.166 mg/100 g). By
using statistical calculation, it was found that the average value of vitamin C in fresh peppers was
131.876 ± 7.124 mg/100 g, while in frozen was 88.306 ± 5.863 mg/100 g. The content of vitamin C
in peppers depends on: growing conditions, degree of maturity and etc. and it ranges from 200-400
mg/100 g, whereby it is more present in small fruiting peppers than in large fruiting ones.
(Jankulovski, 1997). According to Vracar (2001), the content of vitamin C in red peppers is 204
mg/100 g.
The variety palanechko chudo had the lowest content of β-carotene (20.04 μg/g) and total
carotenoids (223.48 μg/g) in fresh and also in frozen peppers, with β-carotene (11.32 μg/g) and total
carotenoids (150. 76 μg/g). Fresh peppers from variety horgosh had the highest content 101.35 μg/g
for β-carotene and 690.15 μg/g for total carotenoids, while in frozen were for β-carotene (67.4 μg/g)
and total carotenoids (587.88 μg/g). Also, it was determined that the fresh peppers from variety
horgosh had the highest share of β-carotene in total carotenoids content(14.685 %) and for frozen
(11.465 %), while the lowest share of β-carotene in total carotenoids content was found in in fresh
peppers from the variety palanechko chudo with (8.967 %), and in frozen was (7.508 %).

SECTION 8: FOOD QUALITY AND SAFETY
_________________________________________________________________________________________
_________________________________________________________________________________________
843
Figure 1. The share of β-carotene in the total
amount of carotenoids.
Figure 2. Vitamin C content in fresh and
frozen peppers.
Differences in the content of colored matters in fruits of pepper are due to many factors, agricultural
technique, maturity of fruit, and etc. In peppers there are certain colored matters: capsanthin about
70%, capsorubin 14 %, carotene approximately 6% zeaxanthin 5% cryptoxanthin and others around
5% (Jankulovski, 1997). According to Niketić-Aleksić et al. (1989), β - carotene is contained within
the limits of 2.12 to 3.04 mg/100 g, while the content of total carotenoids is in the range from 15.99
to 16.35 mg/100 g. The data from FAO shown that the human body can utilize only 1/3 of the total
the entered carotenoids (Niketić-Aleksić et al., 1989).
To determine differences between fresh and frozen peppers, as well as between each of the tested
varieties of peppers, by applying statistical methods ANOVA, the obtained results were statistically
elaborated. It was determined that differences in: total dry matter, water, ash, glucose, cellulose,
proteins, fats, β-carotene and total carotenoids among fresh and frozen peppers between each of the
varieties, and between the average value of total fresh and frozen peppers were determined
statistically significant differences (P <0.05). For the examined: total acidity, as citric acid, fructose,
β-carotene and total carotenoids, between fresh and frozen peppers for each of the varieties, and
between the average value of total fresh and frozen peppers were determined statistically significant
differences (P <0.05). For vitamin C, it was determined that the differences between fresh and
frozen peppers are statistically significant (P <0.05), while between each of the tested varieties of
fresh and frozen peppers, there were no statistically significant differences (P <0,05).
Differences that are determined in nutrients between fresh and frozen peppers are due to the
chemical changes that are occurring during freezing, which can be of an enzymatic or non
enzymatic nature. Then, there is a possibility of inversion of sucrose under enzyme activity of
invertase, which is quite intense at a temperature of -12 to -16 °C, while vitamin C undergoes
greater decomposition, especially when there is no previously treatment of blanching for
inactivation ascorbase (Cvetkov, 1982). Chemical changes that occur during freezing and during
storage of frozen vegetable products are particularly highlighted during thawing of product, when
deformation occurs along with a change of the structure and a loss of juice with a part of soluble
substances of the products (Cvetkov, 1982).
From the results of nutrients in peppers (total sugars, fats and proteins), nutritional or energy value
for fresh and frozen peppers was calculated. According Vracar (2001) the energy value in fresh red
peppers is 158 kJ. During calculation, the following coefficients were used which correspond to: 1 g
fat to 38.9372 kJ, 1 g sugars to 17.1658 kJ and 1 g of protein to 17.1658 kJ. The results for the total
energy value expressed in kilojoules (kJ) and kilo calories (kcal) are presented in Table 4.
SECTION 8: FOOD QUALITY AND SAFETY
_________________________________________________________________________________________
_________________________________________________________________________________________
844
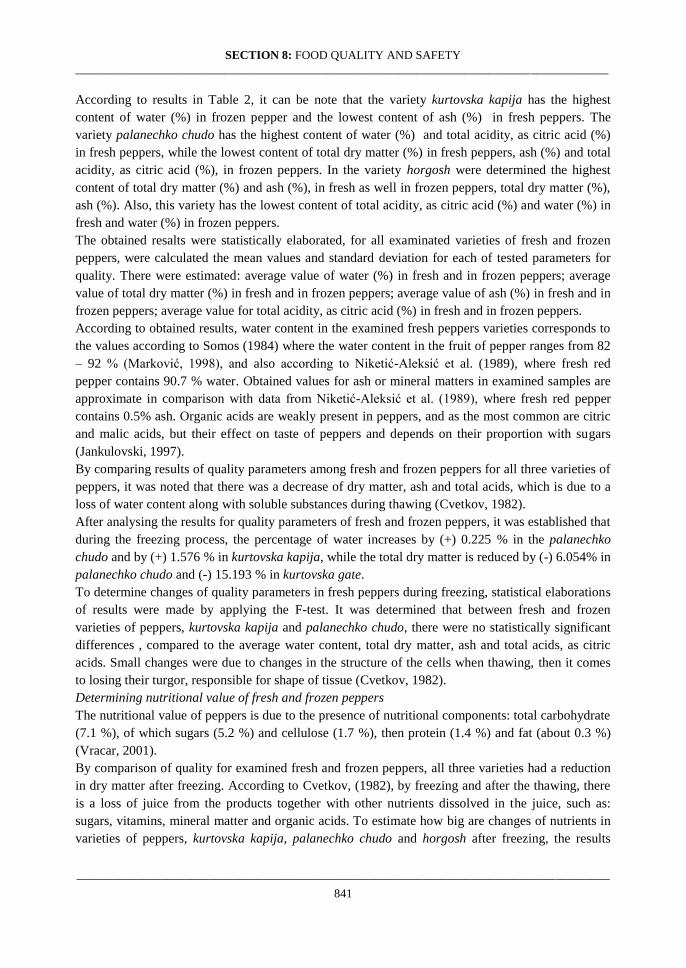
According to these results, it can be noticed that the energy value is the lowest in the variety
palanechko chudo 148.3 kJ (35.42 kcal), in fresh peppers and also in frozen peppers,137.91 kJ
(32.94 kcal), while the highest energy value has the variety horgosh 206.13 kJ (49.24 kcal) in fresh
and 187.33 kJ (44.74 kcal) in frozen peppers.
Table 4. Comparison of energy values of nutrients in fresh and frozen peppers for varieties:
kurtovska kapija (KK), palanechko chudo (PC) and horgosh (H)
KK fresh KK frozen PC fresh PC frozen H fresh H frozen
Total sugars (%) 8.078 6.807 7.28 6.718 9.457 8.588
Energy value
(кЈ) (kcal)
138.67
33.12
116.85
27.91
124.97
29.85
115.32
27.54
162.34
38.77
147.42
35.21
Proteins (%) 0.983 0.922 0.876 0.851 1.431 1.388
Energy value
(кЈ) (kcal)
16.87
4.03
15.83
3.78
15.04
3.59
14.61
3.49
24.56
5.87
23.83
5.69
Fats (%) 0.28 0.201 0.213 0.205 0.494 0.413
Energy value
(кЈ) (kcal)
10.90
2.61
7.83
1.87
8.29
1.98
7.98
1.91
19.23
4.60
16.08
3.84
Total energy
value (кЈ) (kcal)
166.44
39.76
140.51
33.56
148.3
35.42
137.91
32.94
206.13
49.24
187.33
44.74
By applying statistical methods, the average energy values and standard deviation, for fresh and
frozen peppers were calculated. In fresh peppers, the average energy value was 173.623 ± 29.58 kJ
(42.33 ± 7.07 kcal), while the frozen peppers average energy value was 155.25 ± 27.81 kJ (37.08 ±
6.08 kcal).
Conclusions
Based on examinations made in this research and by evaluation of the obtained results, the
following can be concluded:
Morphological characteristics - according to the weight of examined peppers, all three varieties:
horgosh, palanechko chudo and kurtovska kapija are large fruiting, according to ratio of hight :
width they belongs to specie (Capsicum annuum ssp. Macrocarpum var. longum), while according
to tickness of pericarp, varieties kurtovska kapija and palanechko chudo are fleshy, while the
variety horgosh belongs in medium fleshy peppers.
Quality of fresh and frozen peppers - according to results for quality of fresh peppers, it had been
established that the examined varieties of peppers were with the necessary level of freshness, shape,
color, and had featured with good marketable quality and can be used for the production of frozen
peppers. In terms of the evaluated parameters of quality, it was determined that in average, between
fresh and frozen peppers, there were insignificant differences, which were due to a change of
structure of cells during thawing.
Nutritional value of fresh and frozen peppers - according to the survey, it was found that average
value of each of examined nutrients did not significantly differentiate between fresh and frozen
peppers. Significant differences among tested varieties were identified during the freezing of certain
nutrients, such as dry matter, which consist of all the soluble nutrients, colored matters and vitamin

SECTION 8: FOOD QUALITY AND SAFETY
_________________________________________________________________________________________
_________________________________________________________________________________________
845
C. These differences of nutrients between all three varieties of peppers were due to the sort
characteristics of peppers, environment, growing conditions, degree of maturity, and certain
chemical changes during freezing and storage of frozen products. Variety horgosh had the highest
content of dry matter, and therefore the highest energy value, in fresh and also in frozen peppers.
According to the conditions outlined by the Regulation for specific requirements relating to quick-
frozen foodstuffs (Official gazette No.32, 2006), it had been established that frozen peppers were
clean, healthy and free of impurities. Aroma, color and taste were inherent to the variety from which
it were produced.
References
Barbosa-Canovas, G.V., Altunakar, B. and Mej´ıa-Lor´ıo, D.J. (2005). Freezing fruits and
vegetables. FAO Agricultural Services Bulletin 158, Rome.
Biacs P. A., Czinkotai B., Hoschke A. (1992). Factors affecting stability of colored substances in
paprika powders. J. Agricultural Food Chemistry, 40, 363-367.
Castro S.M., Saraiva J. A., Lopes-da-Silva J. A., Delgadillo I., Loey A. V., Smout C., Hendrickx
M., (2008) Effect of thermal blanching and of high pressure treatments on sweet green and red bell
pepper fruits (Capsicum annuum L.), Food Chemistry, Volume 107, Issue4, Pages 1436–1449.
Cvetkov Lj. (1982). Food technology, technology of fruits and vegetables, Prosvetno delo, Skopje.
Daood H.G., Vinkler M., Markus F., Hebshi E. A., Biacs P.A. (1996). Antioxidant vitamin content
of spice red pepper (paprika) as affected by technological and varietal factors. Food Chemistry, 55,
365-372.
Davey, M. W., Montagu, M. V., Inze´, D.; Sanmartin, M., Kanellis, A., Smirnoff, N., Benzie, I. J.
J.; Strain, J. J.; Favell, D.; Fletcher, J. (2000). Plant L-ascorbic acid: chemistry, function,
metabolism, bioavailability and effects of processing. J. Sci. Food Agric. 80, 825-860.
Da-Wen S., (2006). Handbook of frozen food packaging and processing, CRC Press, Taylor &
Francis Group.
Enss W.R. (1974). Veranderungen an farbstoffen bei der production von obst-und
gemuseerzeugnissen, Deutsche Zeitschrift für Lebensmitteltechnologie, Coburg, # 9/September.
Evans A.J., (2008). Frozen Food Science and Technology, Food Refrigeration and Process
Engineering Research Centre (FRPERC), University of Bristol, UK.
Food and Agriculture Organization of United Nations (2003). Food energy – Methods of analysis
and conversion factors, FAO Food and nutrition, paper 77.
Govindarajan, V.S. (1985). Capsicum – production, technology, chemistry and quality. Part I.
History, botany, cultivation and primary processing. CRC Critical Reviews in Food Science and
Nutrition 22 (2): 109–76.
Ilić Z., Falik Е., Dardić M. (2009). Harvest, sorting, packing and storage of vegetables, Agricultural
Faculty, Zubin Potok.
Jankulovski D. (1997). Pepper and tomato, Agricultural Faculty, Skopje.
Lucier, G., Lin, B.-H. (2001). Sweet peppers: Saved by the bell. Agricultural outlook. Economic
Research Service/USDA, pp. 12–15.
Marković V., Vračar Lj. (1998), Production and processing of peppers, Feljton, Novi Sad.
Nadeem M., Muhammad F.A., Khan M.R., Saeed M., Riaz A. (2011). Antioxidant Potential of Bell
Pepper (Capsicum annum L.) - A Review, PAK. J. FOOD SCI., 21(1-4), 2011:45-51.

SECTION 8: FOOD QUALITY AND SAFETY
_________________________________________________________________________________________
_________________________________________________________________________________________
846
Niketić-Aleksić G., Vereš M., Zlatanović B., Rašković. (1989). Manuel for industrial processing of
fruits and vegetables, Naučna Knjiga, Agricultural Faculty, Beograd.
Pruthi J.S., (2003), Chemistry and quality control of Capsicum and Capsicum products, Capsicum,
The genus Capsicum, Edited by Amit Krishna De, Taylor &Francis Croup.
Regulation for specific requirements relating to quick-frozen foodstuffs (Official gazette No.32,
2006),
Somos A. (1984). The paprika; Akademia Koado: Budapest, pp. 30 – 40.
Stahl W., Sies H. (2003). Antioxidant activity of carotenoids. Mol. Aspects Med. 24, 345-351.
Sumner, S.S. and Peters, D.L. (1997). Microbiology of vegetables. In: D.S. Smith, J.N. Cash, W.-K.
Nip and Y.H. Hui, eds. Processing Vegetables, Science and Technology. Lancaster, PA: Technomic
Publishing Company, pp. 87–116.
Todorova, V., (2007). Fruit characterization and influence of variation factors in pepper
kapiya type varieties and breeding lines (Capsicum annuum L.). Bulg. J. Agric. Sci., 13: 309-315.
Torreggiani D., Lucas T., Raoult-Wack A.L. (2006). The pre-treatment of fruits and vegetables. In:
CJ Kennedy, Ed., Managing Frozen Foods, Cambridge (England): Woodhead Publishing Limited
and CRC Press, pp. 57–80.
Vereš М., (2004). The principles of food preservation, University of Belgrade, Faculty of
Agriculture, Belgrade.
Vračar O. Lj. (2001). Manual for quality control of fresh and processed fruits, vegetables and
mushrooms and refreshing beverages, University of Novi Sad, Faculty of Technology.

SECTION 8: FOOD QUALITY AND SAFETY
_________________________________________________________________________________________
_________________________________________________________________________________________
847
ВЛИЈАНИЕ НА СМРЗНУВАЊЕТО ВРЗ НУТРИТИВНИОТ СОСТАВ КАЈ ОДДЕЛНИ
СОРТИ ЦРВЕНИ ПИПЕРКИ
Каракашова Љубица, Бабановска-Миленковска Фросина, Хусеин Г. Дауд, Манасиевска-
Симиќ Силвана
Апстракт
Црвенате пиперки во својот нутритивен состав има висока содржина на биолошко активни
компоненти важни за човековото здравје. Високата содржина на витамин С и каротеноидите
во пиперката се варијабилни во зависност од сортата, степенот на зрелост, применети
агротехнички мерки и начинот на преработка. Смрзнувањето е доста применуван метод на
конзервирање. Со смрзнувањето се запира или забавува развојот на микроорганизмите и
ензиматските процеси. За смрзнување беа користени плодови од три сорти на пиперка, со
изразена црвена боја: куртовска капија, паланечко чудо и хоргош. Замрзнувањето на
пиперките беше изведено индустриски, како коцки 10 х 10 mm, во тунел за брзо длабоко
смрзнување, на Т од околу – 34 ˚С ± 1 ˚С. Смрзнатите пиперки беа пакувани во соодветна
амбалажа. Кај свежите и смрзнатите пиперки направена е анализира на нутритивниот состав:
вкупни суви материи, шеќери со HPLC-RI, вкупни киселини, витамин С, вкупни
каротеноиди, бета-каротен со HPLC-DAD, масти, протеини, целулоза и пепел. Сортата
хогош, како зачинска сорта, сè одликува со највисока содржина на суви материи 11,446 % во
свежа и 10,518 % во замрзната состојба. Кај оваа сорта во однос на испитуваните пиперки
утврдена е најголема содржина на биоактивни компоненти: витамин С (135,908 mg/100g) и
вкупни каротеноиди (690,15 µg/g). Со споредба на анализираните нутритивни состојки, кај
смрзнатите пиперки во однос на свежите забележано е намалување на содржината на
вкупните суви материи, а со тоа и на шеќерите, протеините и мастите. Кај смрзнатите
пиперки забележано е намалување на содржината на витаминот С, бета-каротен и вкупните
каротеноиди.
Клучни зборови: црвени пиперки, смрзнување, нутритивен состав.
SECTION 8: FOOD QUALITY AND SAFETY
_________________________________________________________________________________________
_________________________________________________________________________________________
848
UDC:634.711:664:858
664.858:66.022.3
Original scientific paper
THE QUALITY PROPERTIES OF RASPBERRY JAMS WITH DIFFERENT
SWEETENERS
Ljubica Karakashova1*
, Viktorija Stamatovska2, Frosina Babanovska-Milenkovskа
1
1Faculty of Agricultural Science and Food-Skopje, Ss. Cyril and Methodius University in Skopje,
Macedonia 2Faculty of Technology and Technical Sciences, St. Kliment Ohridski University Bitola, Macedonia
*e-mail: [email protected]
Abstract
This research was made in order to determine and compare the quality properties of jams produced
by using different sweeteners and two varieties of raspberry: cultivated and wild.
In order to determine differences in the quality properties of a cultivated and wild raspberry,
analysis were made on the following parameters: total dry matter, soluble solids, ash, total acids,
pH, sugars, vitamin C and proteins. In cultivated raspberry Willamette were established lower
values for total dry mater 14.25% and soluble solids 8.60°Brix, comparing by the wild variety of
raspberries where were obtained 15.10% total dry matter and 10°Brix of soluble solids. For
preparing the jams in a traditional way were used different sweeteners: sucrose, fructose, sorbitol
and Agave syrup. Of the finished product (jam) were determined the significant chemical
parameters: total dry matters, soluble solids, ash, sugars, total acids, pH, vitamin C and proteins.
The highest value of total dry matters was recorded in jam made from a wild raspberry with sucrose
(49.96%), which reflected on the highest values for soluble solids (45.92°Brix) and total invert
(37.30 %). The values of total acids in jams vary from 0.78 % to 0.81 %. On ready-made jams
sensorial analyses were performed, which found that smell, taste, colour and consistency are
acceptable. Microbiological examinations indicate that jams are microbiologically proper according
to standards.
Key words: raspberry, quality properties, jams, sweeteners.
Introduction
The raspberry, with its biological and pomological properties, belongs to the group of the most
prized and most important fruit species. Thanks to the great nutritional and technological value of
the fruit, it is suitable for different types of domestic and industrial processing. There are several
varieties of raspberries: red (Rubus idaeus L.), black (Rubus idaeus occidentalis L.) and purple
(Rubus idaeus neglectus). The most common and economically important is the red raspberry
(Veličković, 2007).
The raspberry fruitage has a pleasant, aromatic and refreshing taste and smell. It is rich in
carbohydrates, organic acids, vitamins (vitamin C, B group vitamins, vitamin E and K), minerals
(potassium, calcium, phosphorus, iron), dietary fibber, natural pigment (anthocyanins) and
polyphenols, which make this fruit a protection from many diseases (Mitrev, 2006; Pichler, 2011).
SECTION 8: FOOD QUALITY AND SAFETY
_________________________________________________________________________________________
_________________________________________________________________________________________
849
Anthocyanins and polyphenols are powerful antioxidants that have anti-carcinogenic properties.
After freezing or processing into jam fruit have maintained its properties (Levaj et al., 2010).
Raspberry can be processed into jam, stewed fruit, marmalade, syrup, wine, juice and other
products. Jam is made by boiling fresh, frozen or chemically half-processed canned fruit by adding
sugar, pectin and acid. The adequate of the jams requires a correct combination of each of these
components. The main feature of this product is containing fruit pieces in an even gel substance,
without separated the fruit juice (Lovrić, Piližota, 1994).
Jams are produced with a lower percentage of dry matter amounting to 30-50% comparable with the
classic jams where the solids content ranges from 67-70%. These jams are prepared with a reduced
amount of sucrose, or partial or complete replacement made with a suitable sweetener, using low-
esterified pectines in the presence of calcium ions. Sweeteners act as preservatives and participate in
maintaining the desired quality. (Tepić et al., 2001; Pavlović et al., 2003; Wolf, Schafer, 2009; Hui,
2006; Zhao, 2007).
Taking into consideration the findings of the importance of raspberry for human health and the
possibility of processing fruits into jam by using different sweeteners (Pavlović, 2006; Tepić et al.,
2001; Zhao, 2007), this paper shall analyze the pomological and chemical properties of two types of
raspberry (cultivated and wild), followed by establishing the quality properties of jam produced
using different sweeteners.
Material and methods
Two varieties of fresh raspberry fruits have been used as raw materials for jam production: the
cultivated raspberry (Willamette) from the Krusevo region and the wild raspberry from the
mountain region of Skopska Crna Gora. Before processing the fruit its pomological properties and
chemical composition have estimated. Fifty fruits from each variety of raspberries have been used
for determining the pomological properties. The weight of the fruits was measured with analytical
balance, while the height and width of fruits were measured with a vernier scale. Standard analytical
methods were used to determined chemical parameters: total dry matter by oven drying at 105 oC,
content of total soluble solids by means of a refractometer, content of ash in a muffle furnace at 550 oC by gravimetric method, total acidity by titration of a 0.1 M solution of NaOH, pH value with a
pH meter, sugars with the HPLC-RI method, vitamin C with an iodometric titration method and
proteins with the Kjeldahl method.
The manufacture of dietary jams using traditional technological methods of processing was
performed at the factory Vitalia Nikola Ltd. From each variety of raspberries, jams were produced
using different sweeteners such as sucrose, fructose, sorbitol and Agave syrup. To achieve the
desired texture during the production process, low-esterified pectin from the GENU pectin type LM
115AS by CPKelco with the addition of calcium ions in the form of calcium citrate and to provide
the necessary acidity citric acid have been added.
The technological procedure comprises the following operations: washing and inspection, boiling
by adding a suitable sweetener while stirring continuously, adding pectin, calcium citrate and acid,
mixing, filling in jars and closing. The boiling was carried out in inox pressure cookers (steam
release system). The percentage of dry matter during the production process has been controlled by
a refractometer.

SECTION 8: FOOD QUALITY AND SAFETY
_________________________________________________________________________________________
_________________________________________________________________________________________
850
The chemical composition and microbiological safety of the produced jam has been tested, and its
organoleptic features have been accessed. The chemical composition was estimated in the same way
as it was done with fresh raspberry.
The sensory analysis was conducted in a scoring system, where the individual quality criteria
(smell, taste, colour and consistency) were awarded with a different number of maximum points i.e.
2 points for the smell, 8 points for the taste, 4 points for colour and 6 points for consistency, the
total sum amounting to 20 (Vračar, 2001; Tepić et al., 2001; Tepić et al., 2004).The microbiological
tests have been made in order to confirm the microbiological safety of the produced jams.
Tests were made in the laboratory for processing fruits and vegetables at the Faculty of Agricultural
Sciences and Food, Skopje, and some in the laboratories of the Institute of Public Health in Skopje.
Results and discussion
During processing, the fruit as a basic raw material must meet the requirements set by technological
aspects, including physical and chemical properties, primarily because the quality of the finished
product depends on the quality of the used raw materials (Niketić- Aleksić, 1994).
Fresh healthy fruits have been selected for this study, without major damage. The results obtained
from the analysis of the pomological and chemical properties of the examined fruits of each fruits of
both varieties of raspberries are given in Table 1. Evaluations of the pomological parameters
(weight, height and width) determined that the fruits of wild raspberry are characterized by lower
average weight (1.33 g) in comparison to the fruits of the cultivated raspberry Willamette (3.02 g).
These results are in relation with the reference data, according to which the weight of the wild
raspberry ranges from 1.1 to 1.6 g, while the weight of the highest quality varieties of red raspberry
ranges from 3 to 6 g (Karaklajić -Stajić et al., 2006). Also, the values for the other fruit dimensions
of the wild raspberries have smaller average values compared to the average size of the cultivated
raspberry Willamette. From the results of the fruit measurements of the analysed Willamette variety
it can be concluded that these data correspond to the data presented by Veličković et al. (2004),
indicating that the fruit cv Willamette has measured value of the weight around 3.3 g, 2.0 cm in
height and 1.8 cm in width. The results from chemical analysis compared for both varieties of
raspberry have been showed in Table 1. According these results a higher total dry matter, soluble
solids, ash, sucrose, fructose and glucose in the wild raspberry in comparison to the cultivated
raspberry Willamette have been determined. The content of total acids in cultivated raspberry
Willamette (0.98 %) is higher than the wild raspberry (0.41 %), which is related to the obtained pH
values (2.16 or 2.4). The vitamin C content has been determined as 29.35 mg/100 g in cultivated
raspberry Willamette and 25.39 mg/100 g in wild raspberry. The values obtained are higher than in
the reference data for the presence of vitamin C in this kind of fruit (Niketić- Aleksić et al., 1989).
The difference in the calculated values is expected, taking into account that the chemical
composition is specific for each variety and depends on climatic conditions, agro-technical
measures, the degree of maturity and etc. (Niketić-Aleksić, 1994). According to the values of the
studied parameters, the fruits of both varieties of raspberry correspond with the quality according to
Regulation for fruits, vegetables and mushrooms (Off. Gazette No. 2 9/79 and 53/87). The results
from analysis of the chemical properties of raspberry jams from both varieties by using different
sweeteners have been presented in Table 2.
SECTION 8: FOOD QUALITY AND SAFETY
_________________________________________________________________________________________
_________________________________________________________________________________________
851
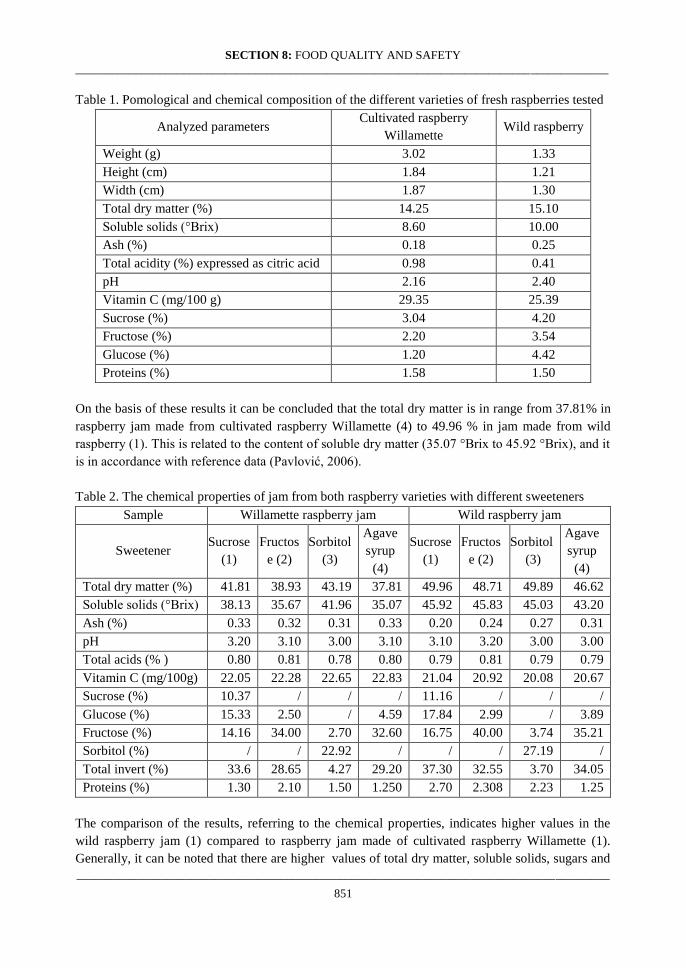
Table 1. Pomological and chemical composition of the different varieties of fresh raspberries tested
Analyzed parameters Cultivated raspberry
Willamette Wild raspberry
Weight (g) 3.02 1.33
Height (cm) 1.84 1.21
Width (cm) 1.87 1.30
Total dry matter (%) 14.25 15.10
Soluble solids (°Brix) 8.60 10.00
Ash (%) 0.18 0.25
Total acidity (%) expressed as citric acid 0.98 0.41
pH 2.16 2.40
Vitamin C (mg/100 g) 29.35 25.39
Sucrose (%) 3.04 4.20
Fructose (%) 2.20 3.54
Glucose (%) 1.20 4.42
Proteins (%) 1.58 1.50
On the basis of these results it can be concluded that the total dry matter is in range from 37.81% in
raspberry jam made from cultivated raspberry Willamette (4) to 49.96 % in jam made from wild
raspberry (1). This is related to the content of soluble dry matter (35.07 °Brix to 45.92 °Brix), and it
is in accordance with reference data (Pavlović, 2006).
Table 2. The chemical properties of jam from both raspberry varieties with different sweeteners
Sample Willamette raspberry jam Wild raspberry jam
Sweetener Sucrose
(1)
Fructos
e (2)
Sorbitol
(3)
Agave
syrup
(4)
Sucrose
(1)
Fructos
e (2)
Sorbitol
(3)
Agave
syrup
(4)
Total dry matter (%) 41.81 38.93 43.19 37.81 49.96 48.71 49.89 46.62
Soluble solids (°Brix) 38.13 35.67 41.96 35.07 45.92 45.83 45.03 43.20
Ash (%) 0.33 0.32 0.31 0.33 0.20 0.24 0.27 0.31
pH 3.20 3.10 3.00 3.10 3.10 3.20 3.00 3.00
Total acids (% ) 0.80 0.81 0.78 0.80 0.79 0.81 0.79 0.79
Vitamin C (mg/100g) 22.05 22.28 22.65 22.83 21.04 20.92 20.08 20.67
Sucrose (%) 10.37 / / / 11.16 / / /
Glucose (%) 15.33 2.50 / 4.59 17.84 2.99 / 3.89
Fructose (%) 14.16 34.00 2.70 32.60 16.75 40.00 3.74 35.21
Sorbitol (%) / / 22.92 / / / 27.19 /
Total invert (%) 33.6 28.65 4.27 29.20 37.30 32.55 3.70 34.05
Proteins (%) 1.30 2.10 1.50 1.250 2.70 2.308 2.23 1.25
The comparison of the results, referring to the chemical properties, indicates higher values in the
wild raspberry jam (1) compared to raspberry jam made of cultivated raspberry Willamette (1).
Generally, it can be noted that there are higher values of total dry matter, soluble solids, sugars and
SECTION 8: FOOD QUALITY AND SAFETY
_________________________________________________________________________________________
_________________________________________________________________________________________
852
total invert in wild raspberry jams (1, 2, 3, 4) in comparison with the corresponding cultivated
raspberry Willamette (1, 2, 3, 4). This is probably due to the higher content of total dry matter,
soluble solids and sugars in fresh wild raspberry compared to the fresh cultivated Willamette.
The presence of sucrose in raspberry varieties of jams where the sweeteners used are fructose,
sorbitol and Agave syrup, is negligible and it is a consequence of the inversion performed during
thermal processing (Hui, 2006). The values of total acids in jams vary from 0.78 % to 0.81 % and
the pH values vary from 3 to 3.2, consistent with the reference data (Hui, 2006; Niketić- Aleksić,
1994). The reference data indicates a high instability of vitamin C, especially in the presence of
oxygen the fruit is thermally treated at a higher temperature, quickly oxidizing most of the vitamin
C found in the product (Jašić, 2007). The lower values determined for the content of vitamin C were
from 20.08 mg/100 g to 21.04 mg/100 g in wild raspberry jams and 22.05 mg/100 g to 22.83
mg/100 g in cultivated Willamette jams. These results were compared with the established values in
fresh fruit (29.35 mg/100 g in cultivated raspberry Willamette and 25.39 mg/100 g in wild
raspberry). According to Dauthy (1995) about 30 % of vitamin C found in the fresh fruit lost during
the production of jam, that remains stable in the finished product during storage.
Jams contain 0.2 % to 0.33 % ash and 1.25 % to 2.7 % protein. According to the values of the
studied parameters, jams meet the conditions prescribed in the Regulation for special security
requirements of fruit jams, jellies, marmalades and sweetened chestnut purée (Off. Gazette of RM
No. 3/2007).
The results from sensory analysis of the finished raspberry jam, from the two varieties with different
sweeteners, are shown in Table 3. It can be noted that the cultivated raspberry Willamette jam with
sorbitol has been gained the highest points (18.18) compared to the other jams obtained from the
same variety. Wild raspberries jam with sucrose was rated with the highest scores: 1.9 for smell,
6.68 for taste, 3.58 for colour and 5.65 for consistency, resulting with the highest total of points
(17.81) compared to the jams where other sweeteners have been used, derived from this variety of
raspberry.
Out of all analyzed jams with a total of 18.18 points, cultivated raspberry jam with sorbitol is rated
as the best. The worst quality is determined in the wild raspberry jam with Agave syrup (14.85) and
wild raspberries jam with fructose (14.99). It can be noted that the cultivated raspberry jams, with a
total number of points from 17.63 to 18.18, have better sensory properties compared to the wild
raspberry jams, with a total of points from 14.85 to 17.81. From the microbiological analysis in all
varieties of jams, it was estimated that the number of present microorganisms Staphylococcus
aureus, Salmonella spp, Enterobacteriaceae, aerobic mesophilic bacteria, yeast and must, were
within the acceptable limits according to the regulation on microbiological criteria for foodstuffs
(Off. Gazette No. 78/2008).

SECTION 8: FOOD QUALITY AND SAFETY
_________________________________________________________________________________________
_________________________________________________________________________________________
853
Table 3. Sensory analysis of the jams manufactured from both varieties of raspberry with different
sweeteners
Sample Characteristic Total
points Smell Taste Colour Consistency
Willamette raspberry jam sucrose (1) 1.65 7.18 3.83 5.03 17.69
Willamette raspberry jam fructose (2) 1.83 7.28 3.43 5.23 17.77
Willamette raspberry jam sorbitol (3) 1.85 7.30 3.93 5.10 18.18
Willamette raspberry jam Agave syrup (4) 1.88 7.40 3.25 5.10 17.63
Wild raspberry jam sucrose (1) 1.90 6.68 3.58 5.65 17.81
Wild raspberry jam fructose (2) 1.48 5.48 2.83 5.20 14.99
Wild raspberry jam sorbitol (3) 1.75 6.03 2.85 5.20 15.83
Wild raspberry jam Agave syrup (4) 1.60 5.70 2.55 5.00 14.85
Conclusions
Results of this research indicated that the raspberry can be successfully processed into jam and that
fructose, sorbitol and Agave syrup can be used as sweeteners, apart from sucrose.The cultivated
raspberry Willamette and the wild raspberry possessed pomological and chemical properties which
correspond to the prescribed regulations and are in accordance with the reference data. The
differences in the obtained values of individual ingredients are a consequence of the genetic traits of
the varieties, climate, soil and other conditions that affect the composition of the phase of growing
and maturing of the fruits.
Based on the results of chemical and microbiological analysis of the ready-made raspberry jams
from the two varieties with different sweeteners, we can conclude that they meet the requirements
for food safety and quality. In the sensory evaluation of the ready-made jam, the cultivated
Willamette raspberry jam with sorbitol is rated as the best (total 18.18 points), and the least points
were awarded to the wild raspberry jam with Agave syrup (14.85) and wild raspberry jam with
fructose (14.99). Overall, it can be concluded that cultivated Willamette raspberry jam have better
sensory properties compared to the wild raspberry jams, because the cultivated Willamette jam
scored higher total points (from 17.63 to 18.18) than the wild raspberry jam (from 14.85 to 17.81).
References
Dauthy E.M. (1995). Fruit and vegetable processing. Chapter 8: Fruit specific preservation
technologies, FAO Agricultural Services Bulletin No. 119, FAO, Rome.
http://agroekonomija.wordpress.com/2011/05/04/производња-малине-у-функцији-рурално.
Hui H. Y. (2006). Handbook of fruits and fruit processing. Blackwell Publishing.
Jašić M. (2007). Tehnologija voća i povrća. I dio, Tuzla-Sarajevo-Banja Luka.
Karaklajić-Stajić Ž.,Milenković S.,Glišić I., Gavrilović-Damnjanović J. (2006). Pomološko
karakteristike plodova maline cv Heritage, Zbornik naučnih radova, 12,3, 45-50.
Katalinić V. (2006). Kemija mediteranskog voća i tehnologija prerade. Kemijsko-tehnološki
fakultet, Split.
SECTION 8: FOOD QUALITY AND SAFETY
_________________________________________________________________________________________
_________________________________________________________________________________________
854
Levaj B., Dragović-Uzelac В., Delonga К., Ganić K.К., Banović М., Kovačević B.D. (2010).
Polyphenols and volatiles in fruits of two sour cherry cultivars, some berry fruits and their jams.
Food Technol. Biotechnol. 48 (4), pp. 538-547.
Lovrić T., Piližota V. (1994). Konzerviranje i prerada voća i povrća. Nakladni zavod, Zagreb.
Mitrev P. (2006). Priračnik za odgleduvanje na malini, Skopje.
Niketić- Aleksić G. (1994). Tehnologija voća i povrća. III izdanje, Poljoprivredni fakultet, Beograd.
Niketić- Aleksić G., Vereš M., Zlatković B., Rašković V. (1989). Priručnik za industrijsku preradu
voća i povrća. Poljoprivredni fakultet, Beograd.
Pavlović R.S., Tepić N.A., Vujičić L.B. (2003). Low-calorie marmalades, Biblid:1450-7188, 34, pp.
23-30.
Pavlović. S. (2006). Želirani proizvodi za posebne kategorije potrošača - kvalitet i tehnologija,
Magisterski rad, Tehnološki fakultet, Novi Sad.
Pichler А. (2011). Utjecaj dodataka i skladištenjana kvalitetu, reološka i termofizikalna svojstva
paste od maline, Doktorski rad, Prehrambeno-tehnološki fakultet, Osijek.
Pravilnik za kvalitet na ovošje, zelenčuk i pečurki (Sl. list br. 29/79 i 53/87. Off. Gazette No.29/79
and 53/87).
Pravilnik za posebni baranja za bezbednost na hrana po odnos na mikrobiološkite kriteriumi (Sl. list
br. 78/2008. Off. Gazette No.78/2008) .
Pravilnik za posebni baranja za bezbednost na ovošnite đemovi, želea, marmalade i zasladeno pire
od kosten ( Sl. vesnik na RM br. 3/2007. Off. Gazette of RM No.3/2007) .
Tepić A., Vujičić B., Cerović A., Đorđević B. (2004). Marmelada od maline za dijabetičare, Jugosl.
Voćar. Vol.38. br. 147-148, pp. 221-228.
Tepić A., Vuljičić B., Vujković I., Dimić G. (2006). Small packages diabetic marmalade quality.
Annals of the faculty of engineering Hunedoara, Tome IV, 3, pp. 141-144.
Tepić N.A., Vujičić L.B., Dimić P.N., Popov-Ralić V.J. (2001). The quality of dietetic jelly
products. Biblid:1450-7188, 32, pp. 33-38.
Veličković M., Vulić T., Milinković Lj., Stanisavljević M. (2004). Vegetativni i generativni
potencijal važnijih sorti i selekcija maline u agroekološkim uslovima dragačevskog malinogorja,
Jugosl. Voćar. Vol.38. br. 145-146, pp. 101-108.
Veličković N. (2007). Malina, Praktični priručnik, Pegaz, Bjelo Polje.
Vračar, O.Lj. (2001). Priručnik za kontrolu kvaliteta svežeg i prerađenog voća, povrća i pečurki i
osvežavajućih bezalkoholnih pića, Tehnološki fakultet, Novi Sad.
Wolf D.I., Schafer W. (2009). Making jams, marmalades, preserves, and conserves, Food Science
and Nutrition.
Zhao Y. (2007). Berry fruit: Value-added products for health promotion, Boca Raton, FL: CRC
Press, pp.367.

SECTION 8: FOOD QUALITY AND SAFETY
_________________________________________________________________________________________
_________________________________________________________________________________________
855
КВАЛИТЕТНИ СВОЈСТВА НА ЏЕМОВИ ОД МАЛИНА СО РАЗЛИЧНИ
ЗАСЛАДУВАЧИ
Љубица Каракашова, Викторија Стаматовска, Фросина Бабановска-Миленковска
Апстракт
Истражувањата се направени со цел да се утврдат и споредат квалитетните својства на
џемови, добиени со преработка на култивирана и диворастечката малина, со примена на
различни засладувачи. За да се утврдат разликите во квалитетните својства на култивирана и
диворастечката малина направени се испитувања на следните параметри: вкупни и
растворливи суви материи, пепел, вкупни киселини, pH, шеќери, витамин С и протеини.
Констатирани се пониски вредности од 14,25 % за вкупните суви материи и за растворливите
суви материи од 8,60°Brix, кај култивираната малината Виламет (Willamette) во споредба со
дивата малина каде се добиени 15,10% за вкупни и 10°Brix за растворливи суви материи. За
подготовка на џем на традиционален начин беа користени различни засладувачи: сахароза,
фруктоза, сорбитол и сируп од агава. Кај готовите производи (џем) беа утврдени следните
значајни хемиски параметри: вкупни и растворливи суви материи, пепел, вкупни киселини,
pH, засладувачи, витамин С и протеини. Најголема вредност на вкупните суви материи е
забележана во џемот од дива малина каде е користена сахароза (49,96%), што се одразува и
со највисока вредност за растворливи суви материи (45,92°Brix) и вкупниот инверт (37,30%).
Вредностите на вкупните киселини во џемовите варира од 0,78% до 0,81%. На готовите
џемови беше направена сензорска анализа со која е утврдено дека мирисот, вкусот, бојата и
текстурата се прифатливи. Микробиолошките испитувања покажуваат дека џемовите се
микробиолошки исправни согласно стандардите.
Клучни зборови: малина, квалитетни својства, џемови, засладувачи.

SECTION 8: FOOD QUALITY AND SAFETY
_________________________________________________________________________________________
_________________________________________________________________________________________
856
UDC:633.853-021.465:641.1
Original scientific paper
COMPARISON OF QUALITY AND NUTRITIONAL COMPOSITION OF GREEN AND
BLACK TABLE OLIVES
Karakasova Ljubica1*
, Milenkovski Lasta1, Babanovska-Milenkovska Frosina
1
1Faculty of Agricultural Sciences and Food-Skopje, Ss. Cyril and Methodius University in Skopje,
Macedonia *е-mail: [email protected]
Abstract
The aim of this research is to determine differences in the quality and nutritional value of two types
of fermented table olives: green, elongated, variety Halkidiki, and black, naturally ripe olives,
variety Amfissa. Fermented olives in the salt solution are packaged in jars and pasteurized. The
quality is determined on examinations of pH, total acidity and salt. After determination of protein,
fat, carbohydrates and fiber content, their energy values were calculated. Also, particular
biologically active components like vitamin C, B6, E and carotin were examined. According to the
obtained results, it may concluded that the olives correspond to descriptions of types of olives,
styles of processing, basic composition and quality that should be in accordance with standards.
With green olives, pH is below max.4, total acidity is under max.0, 4 % and salt is above min. 5 %,
while in black olives quality is prescribed only with salt, which is above the min. 7 %. With
comparison of nutritional composition, there is no evidence of significant differences in content of
nutritive components, so that energy value is about the same. Significantly higher content of vitamin
C in green olives (22 mg/100 g) was found, in terms of black olives (13 mg/100 g), which is due to
levels of maturity and applied technological procedure. Pasteurized olives also correspond to
requirements regarding the content of additives, which vary in both ways of production. Analysis of
contaminants and microbiological safety point out that the olives are in accordance to standards.
Key words: table olives, quality, nutrients, microbiology.
Introduction
Olive tree (Olea europaea L.) is one of the most important fruit trees in the Mediterranean Basin and
is widespread through the entire region (Malheiro et. al., 2012). Table olives are currently the most
popular agro-fermented product and are consumed and enjoyed throughout the entire world
(Malheiro et. al., 2012; Marsilio, et.al., 2005). About 44% of world production emanates from
Europe, the main producing countries being Spain, Greece, Italy and Portugal. The fruits have a soft
texture with very delicate skin and pulp, so particular care must be taken during harvesting and
processing. They are hand harvested from mid-September to mid-October when they have reached a
yellowish-green surface colour. However, this variety is also used for the preparation of Spanish-
style whole green olives (Marsilio, et.al., 2005).
Consumers perception of quality is improving and nowadays an increased seek for healthier
products can be observed worldwide (Malheiro et. al., 2012). Mainly composed by
monounsaturated fatty acids, table olives consumption can prevent and reduce the risk of
SECTION 8: FOOD QUALITY AND SAFETY
_________________________________________________________________________________________
_________________________________________________________________________________________
857
cardiovascular diseases (Kastorini et al. 2010). In addition, other minor constituents like tocopherols
and phenolic compounds are responsible for antioxidant and antimicrobial properties (Sousa et al.
2006), protecting the organism from diseases in which free radicals and pathogenic microorganisms
are involved, preventing also the body from certain kinds of cancer (Owen et al. 2004) and
arthrosclerosis (Armstrong et al. 1997).
Phenolic compounds are of great importance for the olive fruit, being responsible for important
characteristics and properties, such as color, taste and texture (Marsilio et al., 2001). Several
phenolic compounds have been identified in table olives, including oleuropein and hydroxytyrosol,
tyrosol (Briante et al., 2002), rutin, quercetin, as well as caffeic, vanillic and r- and q-coumaric
acids, among others (Malheiro et. al., 2012). Olives phenolic composition, however, is highly
variable in both quality and quantity, in the dependence of several factors: processing method
(Romero et al., 2004), irrigation regimes (Patumi et al., 2002), cultivar, and maturation degree
(Ryan et al., 1999).
According to the Trade Standard Applying to Table Olives (COI/OT/NC no. 1, 2004) table olives
are defined as the product ‘‘prepared from the sound fruits of varieties of the cultivated olive tree
(Olea europaea L.) that are chosen for their production of olives whose volume, shape, fleshto-tone
ratio, fine flesh, taste, firmness and ease of detachment from the stone make them particularly
suitable for processing’’.
Different kinds of table olives should be classified according to the ripeness stage of the fruit, trade
preparation, styles and sizing. Table olives may or may not be size graded. Whole olives should be
size graded according to the number of fruit in one kilogram or hectogram. When the unit is a
kilogram, the size range is expressed in steps of 10 olives up to size 150/160, 20 from this up to size
200/220, and 30 up to size 370/400; above 400 per kilogram, the step are 50 olives. When the
weight unit is the hectogram (not shown here), the range is expressed in steps of 1 olive up to size
15/16; 2 olives from this up to size 20/22, and 3 olives up to size 37/40; above 40 olives per
hectogram, the steps are 5 olives (Luh, 2004). Table olives are classified, according to the Codex
Standard for table olives (1987). in one of the following olive types, trade treatments and styles.
There are three types of table olives: green olives obtained from fruits harvested during the ripening
period, prior to colouring and when they have reached normal size. The colour of the fruit may vary
from green to straw yellow; olives turning colour obtained from rose, wine-rose or brown-coloured
fruits harvested when turning colour, before the stage of complete ripeness is attained and black
olives, obtained from fruits harvested when fully ripe or slightly before full ripeness is reached.
They may, according to production region and time of harvesting, be reddish black, violet black,
deep violet, greenish black or deep chestnut not only on the skin but also through the flesh.
In term of trade treatments, green olives can be treated green olives in brine, treated in an alkaline
lye and then packed in brine in which they undergo complete natural lactic fermentation (Sevillan
style) or partial natural lactic fermentation. The preservation at a pH value within the limits
specified in this standard for table olives not undergoing complete natural fermentation may be
ensured by: sterilization or pasteurization, the addition of preservatives, refrigeration, treatment with
nitrogen or carbon dioxide in treatments without brine. Untreated green olives in brine, these are
placed directly in brine and preserved by natural fermentation. Olives turning colour can be treated
in brine, obtained after alkaline treatment and preserved by natural fermentation: in brine, by heat
treatment, in brine and by heat treatment and untreated olives turning colour, in brine, these are
placed directly in brine and preserved by natural fermentation and ready for consumption. Olives

SECTION 8: FOOD QUALITY AND SAFETY
_________________________________________________________________________________________
_________________________________________________________________________________________
858
darkened by oxidation in brine are green olives or olives turning colour darkened by oxidation,
whose bitterness has been removed by treatment in alkaline lye, which are packed in brine and
preserved by heat sterilization. For black olives, more popular treatments is black olives in brine,
these are firm, smooth and with a glossy skin. Owing to their preparation, they may present slight
surface depressions. They can be: treated black olives obtained after alkaline treatment and
preserved by natural fermentation through one or a combination of the following: in brine, by
sterilization or pasteurization, by addition of a preservative and untreated black olives, these are
placed directly in brine. They have a fruity flavour which is more marked than that of the treated
black olives and they usually retain a slight bitter taste. They are preserved by natural fermentation
through one or a combination of the following: in brine, by sterilization or pasteurization, by
addition of a preservative. Olives may be offered in one of the following styles, according to type
and trade treatment. The most used are: whole olives, which have their natural shape and from
which the stone (pit) has not been removed. Without stem, whole olives from which the stem has
been removed and with stem, whole olives retaining the stem; stoned (pitted) olives, from which the
stone (pit) has been removed and which essentially retain their natural shape; stuffed olives: stoned
(pitted) olives, stuffed either with one or more suitable ingredients (pimiento, onion, almonds,
celery, anchovy, olive, orange or lemon peel, hazel-nut, capers, etc.) or pastes prepared therefrom
etc.
The variety Halkidiki usually is used for the preparation of whole green olives. This variety
"Halkidiki" is grown in Halkidiki, near Thessaloniki, Greece. Fruits are large, distinctively
elongated end of lower part, inner lining is slightly bent, and the meaty part has no a good structure.
This variety contains 120 - 140 fruits of olives per kilogram. Larger and more qualitative fruits of
olives are used for production of Spanish-style green olives in brine, while the rest is used for
extraction of oil.
The variety Amphissa, also known as Konservolia is one of most represented species in Greece and
contributes around 80% in the production of olives in Greece. The fruits vary in shape, from round
to oval form. They ripen in November, when the weight of the fruit can reach up to 10 gr. or 180-
200 fruits per kilogram. The ratio between meat and inner lining is 8:1 and quantity of oil is from 22
to 25% of the total weight of olive fruit. From this variety can be produced green and black olives
on top quality. Green olives are harvested from mid- September to mid- November and are suitable
for production of Spanish-style of green olives. The rest of the fruits get ripen on trees, until they
get from pink, purple to finally black color. This color is most suitable for the preparation of natural
black olives in brine. This olive variety is highly regarded around the world, for the good
characteristics of the fruit.
The processing method of fresh olives by treating the olives with dilute NaOH solution is due to
eliminate their natural bitterness, followed by several washings with water to completely remove
excess alkali. The olives are then placed in a solution of sodium chloride (brine), where spontaneous
lactic fermentation takes place. During fermentation, weak acidification rates are often registered,
because most of the sugars and nutrients are lost by the effect of the lye treatment and strong
washing system used, so the pH and final lactic acidity are very often unsuitable for safe storage of
the end-product (Marsilio, 2003). Another problem is the softening of the fruits due to cell rupture
and separation during industrial processing, resulting in a dramatic texture loss as a consequence of
the lye degradation and solubilization of pectic polymers from the cell wall and middle lamella
(Marsilio et. al., 1996; Mafra et. al. 2001).
SECTION 8: FOOD QUALITY AND SAFETY
_________________________________________________________________________________________
_________________________________________________________________________________________
859
Sorted olives are packed carefully, often in glass jars in a definite pattern. Packed jars are then filled
automatically with water or brine, then emptied to rinse of any adhering sediment. The jars are then
filled with brine of 28 ° salometer. Some packers may acidify the brine with 0,2 to 0,5 % lactic acid
if the olives are below the optimal acidity. Jars are then sealed in a capping machine. It is
advantageous to pasteurize olives in jars by use hot brine 60 °C and then to pasteurized at 79 ° to 82
°C. This will prevent sedimentation from bacterial growth (Luh, 2004). The cooling should be
performed after pasteurization in a certain time and then, jars of table olives are stored on
appropriate place and conditions.
Material and methods
The researches in this article were made in order to determine differences in the quality and
nutritional value of two types of table olives, green and black olives. As a raw material were used
fermented table olives (Greek style): green, elongated, variety Halkidiki, and black, naturally ripe
olives, variety Amfissa.
The production process was performed at plant for processing olives, Princip Komerc, in village
Davidovo. In the production plant are located: calibrator, line for the production of pasteurized
olives, production line for packaged olives in plastic packaging and new line for packaging olives
with modified atmosphere. The fermented olives are purchased in barrels. The technological
processing started by washing, selecting, calibration, then, preparing a brine, filling in jars with
olives and brine, closing of jars, pasteurized and cooling. The neto-weight of table olives in jars is
230 or 440 g.
The analysis for quality control, nutritional composition and microbiological safety were performed
at the laboratory for food quality control, at Institute for Public Health, Skopje. The quality control
was estimate according to existing legislation, by examinations of pH, with pH-meter, total acidity
by titrimetric method with 0,1 M solution of NaOH and salt by titrimetric method of Mohr.
Determination of nutrients were performed by application of physical and chemical methods, when
the following parameters were analyzed: total dry matter by applying gravimetric method of drying
in oven at T = 105 ° C to constant mass; proteins by Kjeldahl method; fats by using the Soxhlet
method; sugars with HPLC-RI - liquid chromatography method with refractive index detector,
dietry fiber by gravimetric method, the presence of vitamin C with iodometric method, and the
presence of vitamin E, B6 and caroten by using HPLC-DAD - liquid chromatography with Diode-
Array Detection. According to obtained results for nutrients, were calculated the energy values for
green and black table olives in jars.
Microbiological analysis were also made to estimate whether the table olives are microbiologically
safe and in compliance to Regulation for specific requirements for food safety in terms of
microbiological criteria (Official Gazette of R. Macedonia, No. 78/2008).
Results and discussion
Quality control of the green and black olives was made by comparison of obtained results to values
that are prescribed in the national and international regulations (Codex Standard for table olives 66-
1981. Rev.1-1987). During the processing of table olives controls were made on important
conditions as, good quality of ingredients, good hygienic practice of ambient for production,
equipment and personal, also on some parameters, as: pH and concentration of salt in brine, the
temperature during processing brine, filling and closing of jars, temperature and time of

SECTION 8: FOOD QUALITY AND SAFETY
_________________________________________________________________________________________
_________________________________________________________________________________________
860
pasteurization and cooling. During processing of packed of table olives it is allowed, according to
Codex Standard for table olives (1987), to use certain quantity of some additives, expressed as
weight m/m of total weight of olives, including brine, like antioxidants (L-ascorbic acid – 0,2 g/kg);
acids (citric, lactic and tartaric acids, for each max. 1,5%) and preservatives, as benzoic acid and its
sodium and potassium salts (max. 1 g/kg, expressed as benzoic acid) or sorbic acid and its sodium
and potassium salts (max. 0.5 g/kg, expressed as sorbic acid). The content of additives in table
olives is also prescribed in national Regulation for additives what can be used for food processing
(Official Gazette of R. Macedonia, No. 31/2012). It is also important for the final products to be
properly labeled, respecting the requirements of the Regulation on food labeling (Official Gazette of
R. Macedonia, No. 118/2005). To provide high level of protection the health of people and
consumer interests in relation to food, it is necessary to apply the requirements according to Food
Safety Law (Official Gazette of R. Macedonia, No. 31/2012), where the provisions of this Law shall
be applied at all stages of production, processing and distribution of food.
In purpose to control the quality of table olives, packed in jars, analysis were made for following
parameters: total dry matter, pH, NaCl and total acidity, as lactic acid. From obtained results of
table olives analysis, green and black ones, shown that they do not contain any preservative.
Table 1. Comparison of quality parameters for black and green pasteurized table olives according to
values in regulations
Parameters of quality Green olives
tasted
Green olives
regulation
Black olives
tested
Black olives
regulation
Total dry matter 27,63% 30,04%
pH 4,27 max 4.0 / /
Total acids (as lactic acid) 0,51 % min 0.4 % / /
NaCl 6,24 % min 5.0 % 7,42 % min 6 %
Table 2. Comparison of content for nutrients and antioxidants in green and black table olive
Nutrients in olives Green olivs Black olives
Proteins 1,3 g / 100 g 1,6 g / 100 g
Fats 12,5 g / 100 g 13,0 g / 100 g
Carbohydrates 7,0 g / 100 g 9,0 g / 100 g
- Sucrose 1,67 g / 100 g 1,21 g / 100 g
- Glucose 0,44 g / 100 g 0,25 g / 100 g
- Fructose 0,36 g / 100 g 0,2 g / 100 g
- Dietary Fiber 4,4 g / 100 g 5,0 g / 100 g
Vitamin C 22,0 mg / 100 g 13,0 mg / 100 g
Vitamin B6 0,024 mg / 100 g 0,019 mg / 100 g
Karoten 180,0 µg / 100 g 167,0 µg / 100 g
Vitamin E 3,0 mg / 100 g 2,8 mg / 100 g
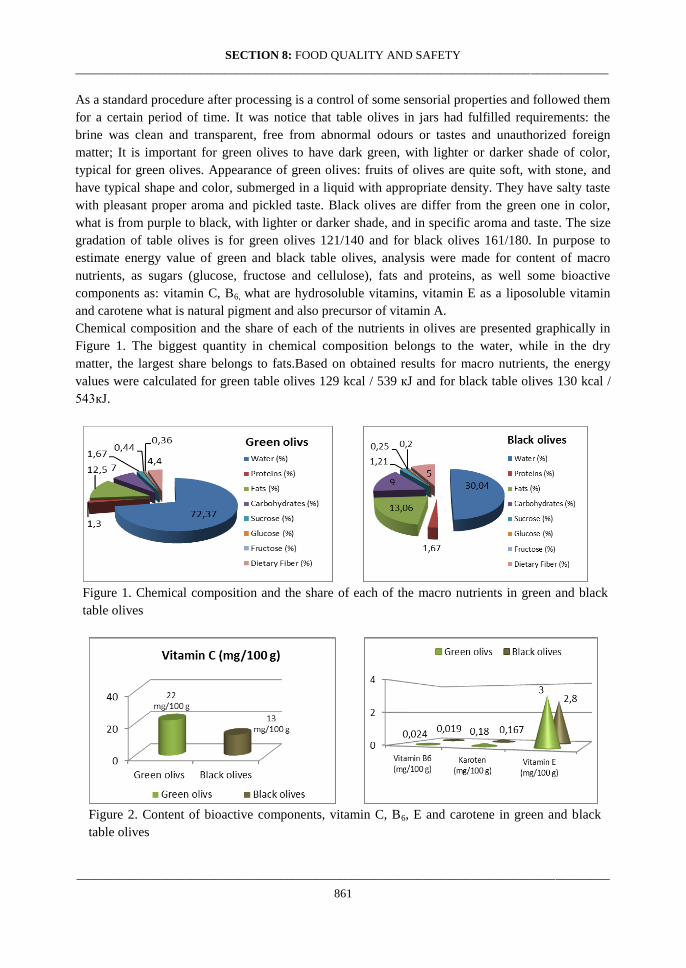
SECTION 8: FOOD QUALITY AND SAFETY
_________________________________________________________________________________________
_________________________________________________________________________________________
861
As a standard procedure after processing is a control of some sensorial properties and followed them
for a certain period of time. It was notice that table olives in jars had fulfilled requirements: the
brine was clean and transparent, free from abnormal odours or tastes and unauthorized foreign
matter; It is important for green olives to have dark green, with lighter or darker shade of color,
typical for green olives. Appearance of green olives: fruits of olives are quite soft, with stone, and
have typical shape and color, submerged in a liquid with appropriate density. They have salty taste
with pleasant proper aroma and pickled taste. Black olives are differ from the green one in color,
what is from purple to black, with lighter or darker shade, and in specific aroma and taste. The size
gradation of table olives is for green olives 121/140 and for black olives 161/180. In purpose to
estimate energy value of green and black table olives, analysis were made for content of macro
nutrients, as sugars (glucose, fructose and cellulose), fats and proteins, as well some bioactive
components as: vitamin C, B6, what are hydrosoluble vitamins, vitamin E as a liposoluble vitamin
and carotene what is natural pigment and also precursor of vitamin A.
Chemical composition and the share of each of the nutrients in olives are presented graphically in
Figure 1. The biggest quantity in chemical composition belongs to the water, while in the dry
matter, the largest share belongs to fats.Based on obtained results for macro nutrients, the energy
values were calculated for green table olives 129 kcal / 539 кЈ and for black table olives 130 kcal /
543кЈ.
Figure 1. Chemical composition and the share of each of the macro nutrients in green and black
table olives
Figure 2. Content of bioactive components, vitamin C, B6, E and carotene in green and black
table olives

SECTION 8: FOOD QUALITY AND SAFETY
_________________________________________________________________________________________
_________________________________________________________________________________________
862
The microbiological testing was made to determine microbiological safety of black and green table
olives packed in jars. According to Regulation for specific requirements for food safety in terms of
microbiological criteria (Official Gazette R. Macedonia, No. 78/2008), were made analysis for
presence on following microorganisms: Bacteria from Salmonella species (absence in 25 g),
Staphylococcus coagulase positive (max. 100 cfu/g), Listeria monocytogenes (absence in 25 g),
Esherichia coli (max. 1000 cfu/g), Clostridium perfringens (max. 100000 cfu/g). The obtained
results shown that examined black and green table olives were microbiologically safe. Estimation of
safety was also made by analysis of some contaminant what is required according to our national
Regulation for general requirements for food safety (Official Gazette R. Macedonia, No. 118 /
2005). Estimation of safety was also made by analysis of some contaminant what is required
according to our national Regulation for general requirements for food safety (Official Gazette No.
118 / 2005). There is no presence of Lead (Pb) (max. 1 mg / kg) and Tin (Sn) (max.250 mg / kg).
Conclusions
On differences in physicochemical properties of green table olives, variety Halkidiki, and black
olives, variety Amfissa, despite of variety, many factors affecting on: the time of harvest, degree of
maturity, treatment and condition due to fermentation process, processing after fermentation and
packing.
The quality of table olives is determined on examinations of pH, total acidity and salt. For green
olives, pH is below max.4, total acidity is under max.0, 4 % and salt is above min. 5 %, while in
black olives quality is prescribed only with salt, which is above the min. 7 % (Codex Standard for
table olives 66-1981. Rev.1-1987). Based on the examinations was established that the olives
correspond to description of type of olives, size, style of processing, basic composition and quality
what are in accordance with standards.
After determination: protein, fat, total carbohydrates and fiber, were calculated their energy values,
for green 129 kcal / 539 кЈ and for black table olives 130 kcal / 543 кЈ.
It was found that green olives, variety Halkidiki, had higher content of vitamin C (22 mg/100 g),
vitamin B6 (0,024 mg /100 g), carotene (180 µg/100 g) and vitamin E (3,0 mg/100 g), in terms of
black olives.
Pasteurized table olives also correspond to requirements regarding the content of additives, which
vary in both ways of production. Analysis of contaminants and microbiological safety, point out that
the olives are in accordance to standards.
References
Armstrong, N., Paganga, G., Brunev, E., Miller, N. (1997). Reference values for α-tocopherol and
β-carotene in the Whitehall II study. Free Radical Research, 27, 207–219.
Briante, R., Batumi, M., Terenziani, S., Bismuto, E., Febraio, F., Nucci, R., 2002. Olea europaea L.
leaf extract and derivates: antioxidant properties. J. Agric. Food Chem. 50, 4934–4940.
Codex Standard for table olives, (1987). Codex Alimentarius Commission, elaborated jointly with
The International Olive Oil Council, (No. 66-1981. Rev.1-1987).
Food Safety Law (Official Gazette of R. Macedonia, No. 31/2012).
International olive oil council trade standard, (2004). Trade standards applying to table olives,
Resolution No. RES-2/91-IV/04.
SECTION 8: FOOD QUALITY AND SAFETY
_________________________________________________________________________________________
_________________________________________________________________________________________
863
Kastorini, C. M., Milionis, H. J., Goudevenos, J. A., & Panagiotakos, D. B. (2010). Mediterranean
diet and coronary heart disease: is obesity a link?—a systematic review. Nutrition, Metabolism, and
Cardiovascular Diseases, 20, 536–551.
Luh B.S., Fergusin L., Kader A. and Barrett D., (2004). Processing California Olives, Processing
the crop, p. 145-155.
Mafra I, Lanza B, Reis A, Marsilio V, Campestre C, De Angelis M and Coimbra MA, (2001).
Effect of ripening on texture, microstructure and cell wall polysaccharide composition of olive fruit
(Olea europaea). Physiol Plant 111:439–447.
Malheiro R., Casal S., Sousa A., Pinho P.G., Peres A.M., Dias L.G., Bento A., Pereira J.A. (2012).
Effect of Cultivar on Sensory Characteristics, Chemical Composition, and Nutritional Value of
Stoned Green Table Olives, Food Bioprocess Technol , 5:1733–1742.
Marsilio V, Lanza B and De Angelis M, (1996). Olive cell wall components: physical and
biochemical changes during processing. J Sci Food Agric 70:35–43.
Marsilio, V., Campestre, C., Lanza, B., (2001). Phenolic compounds change during California-style
ripe olive processing. Food Chem. 74, 55–60.
Marsilio V, Seghetti L and Felicioni M, (2003). Preparazione delle olive da tavola ‘alla spagnola’
var. Ascolana tenera. Ind Alim 42:844–848, 854.
Marsilio V., Seghetti L., Iannucci E., Russi F., Lanza B. and Felicioni M. (2005). Use of a lactic
acid bacteria starter culture during green olive (Olea europaea L cv Ascolana tenera) processing, J
Sci Food Agric 85:1084–1090.
Owen, R.W., Haubner, R.,Würtele, G., Hull,W. E., Spiegelhalder, B., & Bartsch, H. (2004). Olives
and olive oil in cancer prevention. European Journal of Cancer Prevention, 13, 319–326.
Regulation for additives what can be used for food processing (2012) Official Gazette of R.
Macedonia No. 31.
Regulation for general requirements for food safety (2005) Official Gazette of R. Macedonia No.
118.
Regulation for specific requirements for food safety in terms of microbiological criteria (2008).
Official Gazette of R. Macedonia No. 78.
Regulation on food labeling (2005), Official Gazette of R. Macedonia, No. 118.
Romero, C., Brenes, M., Garcia, P., Garcia, A., Garrido, A., 2004b. Polyphenol changes during
fermentation of naturally black olives. J. Agric. Food Chem. 52, 1973–1979.
Ryan, D., Robards, K., Lavee, S., 1999. Changes in phenolic content of olive during maturation. Int.
J. Food Sci. Technol. 34, 265–274.
Patumi, M., d’Andria, R., Marsilio, V., Fontanazza, G., Moreli, G., Lanza, B., 2002. Olive and olive
oil quality after intensive monoclone olive growing (Olea europaea L., cv. Kalamata) in different
irrigation regimes. Food Chem 77, 27–34.
Sousa, A., Ferreira, I. C. F. R., Calhelha, R. C., Andrade, P. B., Valentão, P., Seabra, R., et al.
(2006). Phenolics and antimicrobial activity of traditional stoned table olives “Alcaparras”.
Bioorganic & Medicinal Chemistry, 14, 8533–8538.

SECTION 8: FOOD QUALITY AND SAFETY
_________________________________________________________________________________________
_________________________________________________________________________________________
864
СПОРЕДБА НА КВАЛИТЕТ И НУТРИТИВЕН СОСТАВ КАЈ ЗЕЛЕНИ И ЦРНИ
ТРПЕЗНИ МАСЛИНКИ
Каракашова Љубица, Миленковски Ласта, Бабановска-Миленковска Фросина
Апстракт
Целта на ова истражување е да се утврдат разликите во квалитетот и нутритивниот состав кај
два вида на ферментирани трпезни маслинки: зелени, долгнавести, сорта халкидики и црни,
природно зрели маслинки, од сортата амфиса. Ферментираните маслинки во солен раствор
се пакувани во тегли и пастеризирани. Квалитетот е утврден со определување на рН, вкупни
киселини и натриум хлорид. По определување на содржината на протеини, масти, јаглени
хидрати и целулоза, пресметана е нивната енергетска вредност. Воедно, се испитани и
одделни биолошки активни компоненти, како витамин С, Б6, Е и каротен. Според добиените
резултати, може да се заклучи дека маслинките одговараат на описот на видот на маслинки,
начинот на производство, основниот состав и квалитет кои треба да се во согласност на
стандардите. Кај зелените маслинки, рН треба да е под max. 4, вкупните киселини да се под
max. 0,4 % и содржината на сол да е над min. 5%, додека кај црните маслинки квалитетот е
пропишан само со содржина на сол која треба да е над min. 7%, Со споредба на нутритивниот
состав утврдено е дека не постојат значителни разлики во содржината на хранливите
состојки, така што нивната енергетска вредност е приближно иста. Значително повисока
содржина на витамин С е утврдена во зелените маслинки (22 mg/100 g), во однос на црните
маслинки (13 mg/100 g), што се должи на степенот на зрелост и применетата технологија на
производство. Пастеризираните маслинки воедно одговараат на барањата во одност на
содржината на адитивите, кои се применуваат во двата начина на производство. Со анализа
на контамиентите и испитување на микробиолошката исправност утврдено е дека
маслинките се во согласност со стандардите.
Клучни зборови: трпезни маслинки, квалитет, хранливи состојки, микробиологија.
SECTION 8: FOOD QUALITY AND SAFETY
_________________________________________________________________________________________
_________________________________________________________________________________________
865
UDC:66.074.08:664.34
Original scientific paper
ТHE APPLICABILITY OF THE FOODTEXTURE PUFF DEVICE FOR THE
DETERMINATION OF THE RHEOLOGICAL PROPERTIES OF O/W EMULSIONS
Karastojanov Stefan1*
, Morren Sofie2, Claes Johan
2
1Faculty of Agricultural Science and Food-Skopje, Ss. Cyril and Methodius University in Skopje,
Macedonia 2Kempen University College, Geel, Belgium
*e-mail: [email protected]
Abstract
The Food texture Puff Device (FPD) is a new device that yields contactless, fast, easy and non-
destructive rheological measurements of food products. The instrument applies a controlled air
pulse to the surface of a food product, while a laser distance sensor measures the deformation. This
approach can be considered as an alternative method for more fundamental rheological properties
like storage and loss module, viscosity, elasticity, especially for industrial applications. In the
present work the FPD was evaluated on O/W emulsions. Eight commercial mayonnaise-type
products were analyzed with the FPD, a Texture Analyser (spreadability rig) and the rheometer
(storage and loss module from a frequency sweep). It was tested at three different selected
temperatures with all instruments. The correlation between the results with the instruments was
determined. The FPD was able to determine the firmness with a low standard deviation and good
temperature sensitivity. In addition, it was shown that the maximum deformation created by the
FPD was strongly correlated to the firmness of the emulsions as determined with the texture
analyser, and to the storage module of the frequency sweep, determined with the rheometer.
Therefore it was concluded that the FPD is well suited and applicable for measuring the firmness of
o/w emulsions. It is a flexible instrument that is applicable in an industrial environment due to its
real time analyses of rheological characteristics and its ease of use.
Key words: Food texture Puff Device, o/w emulsion, rheology, firmness.
Introduction
Quality is a concept that connects multiple options such as: uniform foodstuffs colour or crispy,
fragrance that suits this product or raw materials from which it is made, etc. According to this, the
quality of food or a product is very difficult to maintain and describe (Claes 2011). Fortunately,
there are features that can be directly linked to the quality of the food, appropriate such
characteristic is rheology. Rheologycal properties nag a clear picture of the characteristics of a
substance. Rheologycal characteristics often largely based on complex measurement methods such
as Bostwick konsistometer, sometimes giving the lack of necessary information. For companies and
food production process which used testing different products would be useful to have a device, an
instrument that operates on a simple and accurate way to describe rheology to these products. There
rheometers are easy to operate and precise measurement, but have their own disadvantages. Some of
the shortcomings is the design and method of managing of instruments, and the high cost of these
SECTION 8: FOOD QUALITY AND SAFETY
_________________________________________________________________________________________
_________________________________________________________________________________________
866
devices that cannot afford the smaller manufacturing companies for the food production. Another
disadvantage is that already tested food can’t be used again.
Foodtexture Puff Device (FPD) can be described as non destructive device that emits air at the
surface of the sample for testing. At the same time FPD sends a laser beam on the surface of the
sample with the laser lens and laser sensor measure distortion, wavy surface caused from air puffs.
This researching is part of big project, in mind has its performance test which can be applied in the
food industry. Test project is divided into three research groups of foodstuffs. In the first group of
food items and products with viscous properties as: foods with sugar, glucose syrup and fructose
paste. The second group of products with yield properties such as oils, fats and chocolate. In the last
group belong to products with high elastic properties as gluten flours and mixes with water. Past
publicized scientific publications show that FPD can be used as a successful instrument in
determining rheology in some of the above foods. The ultimate goal of the project is to make a good
FPD practical guide that could be used in industry (Sofie Morren 2012).
This study take small part of the project and is focused on research and testing the applicability of
the FPD to determine rheologycal properties of o/w emulsions. Specifically, this type of emulsion
which is researched mayonnaise.
This instrument is used as an alternative method for rheological properties, while Rheometer
Physica MCR 301 and Texture Analyser TA.XT.plus Stable Micro Systems have been used as
reference instruments and methods for comparing the results obtained from the FPD.
Material and methods
Eight commercial mayonnaise-type products were analyzed with the FPD, a Texture Analyser
(spreadability rig) and the rheometer (storage and loss module from a frequency sweep). It was
tested at three different selected temperatures with all instruments.
Foodtexture Puff Device (FPD)
FPD as an instrument for measuring the strength of the food products, without their destruction was
first used by (Stanley E. Prussia 1994). These ways of measuring patented by them and are based on
the use of injected air and light lens. Several characteristics are essential for productions of this
invention: Measurements without contact, the sample is not destroying and is adjustable objects
which have variable surface features. FPD actually injected controlled air puffs on the sample
testing surface creating deformations that are observed by a laser sensor that measures the distance
to the surface.
Vividly work FPD is shown below, and was first used for measuring the coagulation of milk by (F.
R. Bamelis 2006).
Firmness is resistance, and is a key factor in determining the quality of food products. Customers
choose the strength as a factor when choosing to buy. Information and data resulting from the
changes of surface tested sample deformation was sent to personal computer where they are
processed and presented in tables and graphics through special adapted software - Labview 5.3
National Instruments (F. R. Bamelis 2006).
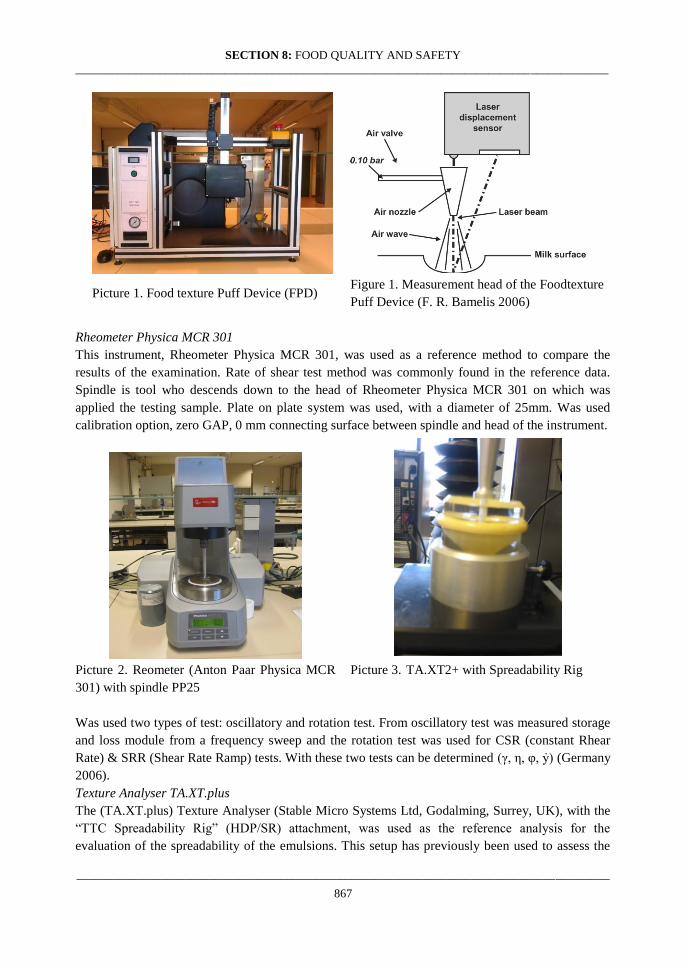
SECTION 8: FOOD QUALITY AND SAFETY
_________________________________________________________________________________________
_________________________________________________________________________________________
867
Picture 1. Food texture Puff Device (FPD) Figure 1. Measurement head of the Foodtexture
Puff Device (F. R. Bamelis 2006)
Rheometer Physica MCR 301
This instrument, Rheometer Physica MCR 301, was used as a reference method to compare the
results of the examination. Rate of shear test method was commonly found in the reference data.
Spindle is tool who descends down to the head of Rheometer Physica MCR 301 on which was
applied the testing sample. Plate on plate system was used, with a diameter of 25mm. Was used
calibration option, zero GAP, 0 mm connecting surface between spindle and head of the instrument.
Picture 2. Reometer (Anton Paar Physica MCR
301) with spindle PP25
Picture 3. TA.XT2+ with Spreadability Rig
Was used two types of test: oscillatory and rotation test. From oscillatory test was measured storage
and loss module from a frequency sweep and the rotation test was used for CSR (constant Rhear
Rate) & SRR (Shear Rate Ramp) tests. With these two tests can be determined (γ, η, φ, ỷ) (Germany
2006).
Texture Analyser TA.XT.plus
The (TA.XT.plus) Texture Analyser (Stable Micro Systems Ltd, Godalming, Surrey, UK), with the
“TTC Spreadability Rig” (HDP/SR) attachment, was used as the reference analysis for the
evaluation of the spreadability of the emulsions. This setup has previously been used to assess the

SECTION 8: FOOD QUALITY AND SAFETY
_________________________________________________________________________________________
_________________________________________________________________________________________
868
spreadability of table fats by (Glibowski 2008). The testing of the prepared samples repeat 5 times
for each sample. For each test, cone tests are set special place in already centered base of 25mm.
The male cone section ranges from the top down in a distance of 23mm with speed of 3mm / s, with
penetration in tested mayonnaise, which is filled the female cone. The force required for penetration
of the male part into the female part, pushing the mayonnaise on the outside, are registered on the
computer monitor.
Data analysis
For all three instruments, the FPD, Rheometer Physica MCR 301 and the TA.XT2+, data treatment
was performed in Office Excel 2007. All statistical tests were performed with SPSS. ANOVA tests
were performed to differentiate between batches and curve estimation was used to correlate results
from the FPD and the texture meter. Tests were decided on the 0.05 significance level, unless
specified differently.
Results and discussion
The Food Texture Puff Device was tested for the applicability of o/w emulsion, mayonnaise. This
research was part of a larger project, aiming to draw up a best practice guide for businesses on the
FPD. In this study, the rheometer and texture analyzer as reference method.
Figure 2 relates the storage modulus from the rheometer with the force of the spreadability rig. It
shows how the two “reference measurements” are related with each other. Figure 3 displays a
significant correlation between result from the FPD and the Rheometer. On one curve is showed
relates all samples at all temperatures. The correlation is described by a exponential function.
Figure 4 displays a significant correlation between result from the FPD and the texture analyzer. On
one curve is showed relates all samples at all temperatures.
Figure 2. Linear correlation of the Storage modulus 1Hz to the Firmness
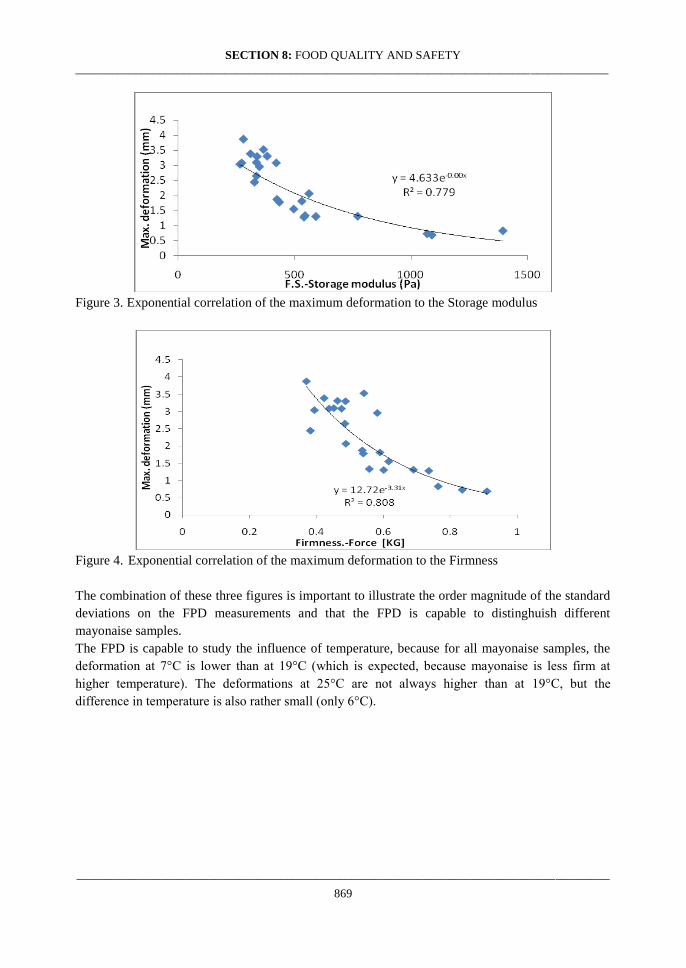
SECTION 8: FOOD QUALITY AND SAFETY
_________________________________________________________________________________________
_________________________________________________________________________________________
869
Figure 3. Exponential correlation of the maximum deformation to the Storage modulus
Figure 4. Exponential correlation of the maximum deformation to the Firmness
The combination of these three figures is important to illustrate the order magnitude of the standard
deviations on the FPD measurements and that the FPD is capable to distinghuish different
mayonaise samples.
The FPD is capable to study the influence of temperature, because for all mayonaise samples, the
deformation at 7°C is lower than at 19°C (which is expected, because mayonaise is less firm at
higher temperature). The deformations at 25°C are not always higher than at 19°C, but the
difference in temperature is also rather small (only 6°C).
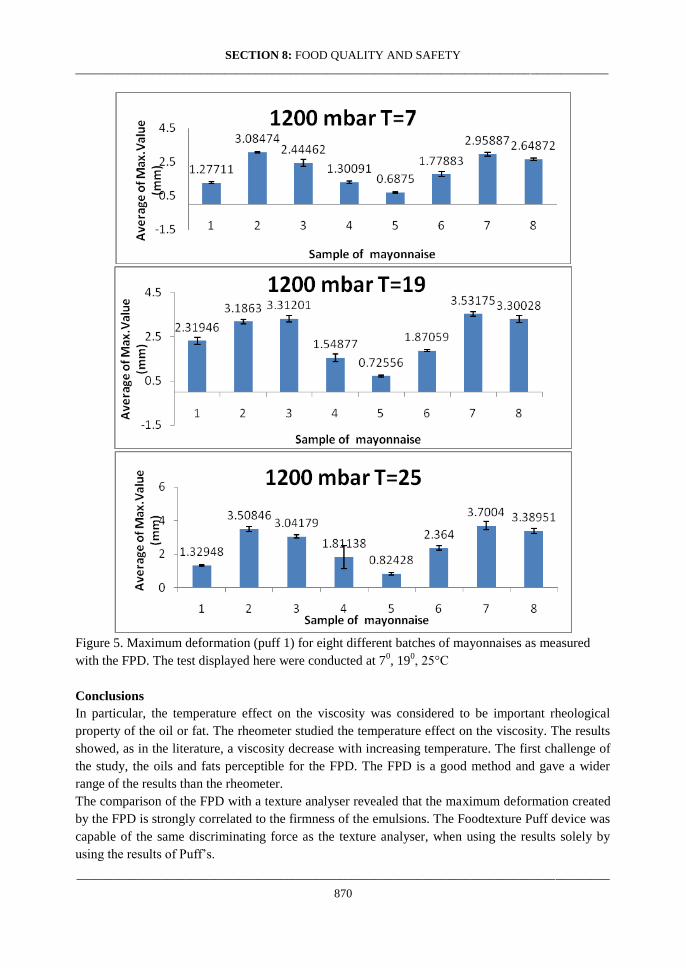
SECTION 8: FOOD QUALITY AND SAFETY
_________________________________________________________________________________________
_________________________________________________________________________________________
870
Figure 5. Maximum deformation (puff 1) for eight different batches of mayonnaises as measured
with the FPD. The test displayed here were conducted at 70, 19
0, 25°C
Conclusions
In particular, the temperature effect on the viscosity was considered to be important rheological
property of the oil or fat. The rheometer studied the temperature effect on the viscosity. The results
showed, as in the literature, a viscosity decrease with increasing temperature. The first challenge of
the study, the oils and fats perceptible for the FPD. The FPD is a good method and gave a wider
range of the results than the rheometer.
The comparison of the FPD with a texture analyser revealed that the maximum deformation created
by the FPD is strongly correlated to the firmness of the emulsions. The Foodtexture Puff device was
capable of the same discriminating force as the texture analyser, when using the results solely by
using the results of Puff’s.
SECTION 8: FOOD QUALITY AND SAFETY
_________________________________________________________________________________________
_________________________________________________________________________________________
871
The use of the FPD by means of a guide best practice, delivers to a company has a simple method to
gain insight into the rheology of O/W emulsions, especially mayonnaise. It is capable of accurate,
in-depth measurements in a laboratory environment and has the flexibility and ease-of-use, required
for measurements in a factory environment.
References
Claes, S. (2011). Toepasbaarheid van het Foodtexture Puff Device voor reologische metingen van
oliën en vetten. Industriële en Biowetenschappen. Geel, Belgium, K.H.Kempen.
F. R. Bamelis, J. G. D. B. (2006). "Use of the Foodtexture Puff Device to Monitor Milk
Coagulation." American Dairy Science Association 89 (1): 29-36.
Germany, A. P. (2006). Rheoplus Software Volume 1 - Installation & Introduction. Ostfildern,
Germany, Anton Paar Germany GmbH. Printed in Austria. 1: 31.
Glibowski, P., Zarzycki, P., & Krzepkowska, M. (2008). "The Rheological and instrumental textural
properties of selected table fats." International Journal of Food Properties: 678-686.
Sofie Morren, T. V. D., Frank Mathijs, Bart De Ketelaere, Johan Claes (2012). Applicability of the
Foodtexture Puff Device for rheological measurements on food products. L. F. S. a. N. R. Centre.
Wien, IWT: 1.
Stanley E. Prussia, G. J. J. A., Stone Mountain; Bob Hewlett, Lilburn; Yen-Con Hung, Peachetree
City, all of Ga (1994). Non destructive firmness measuring device. USA, The University of Georgia
Research Fondation, Inc., Athens, Ga. 5,372,030: 11.

SECTION 8: FOOD QUALITY AND SAFETY
_________________________________________________________________________________________
_________________________________________________________________________________________
872
ПРИМЕНЛИВОСТА НА АПАРАТОТ ЗА ИСПИТУВАЊЕ НА ТЕКСТУРА СО
ДУВАЊЕ (FPD) ВО ОПРЕДЕЛУВАЊЕТО НА РЕОЛОШКИ КАРАКТЕРИСТИКИ НА
O/W ЕМУЛЗИИ
Карастојанов Стефан, Моррен Софие, Клаес Јохан
Апстракт
Апаратот за испитување на текстурата со дување (FPD) претставува нов уред кој дава
безконтактни, брзи, лесни и недеструктивни реолошки мерења на прехранбените производи.
Инструментот користи контролиран воздушен пулс на површината на прехранбениот
производ, додека ласерскиот сензор од далечина ја мери деформацијата. Овој пристап може
да се смета за алтернативен метод на повеќе фундаментални реолошки својства, како:
„storage module“ (G’- вредност, количество на енергијата потребна за да се изврши некоја
деформација), “loss module” (G’’- вредност, претставува енергија на губење од примерокот
кој се тестира), вискозитет и еластичност, особено за индустриска примена. Во
презентираниот труд, за оценка на FPD се користени емулзии од масло во вода. Осум
комерцијални производи од типот на мајонез се анализирани со FPD, анализатор на текстура
(тест за мерење на размачкувањето) и реометар (G’и G’’од испитувањето со променлива
фрекфренција. Тестирањето е направено на три различни температури со сите инструменти.
Определена е корелацијата помеѓу резултатите со инструментите. FPD е во можност да ја
определи цврстината со ниска стандардна девијација и добра температурна осетливост.
Покрај тоа, се покажа дека максимална деформација создадена од страна на FPD е во силна
корелација со цврстината на емулзиите како што е определено со анализаторот на текстура, и
со “G’- вредност”, количество на енергијата потребна за да се изврши некоја деформација,
утврдени со реометарот.Затоа е заклучено дека FPD е добро прилагоден и применливи за
мерење на цврстината на емулзии од видот на масло во вода. Тоа е флексибилен инструмент,
кој е применлив во индустриска средина, поради неговото реално време на анализа на
реолошките својства, како и поради неговата едноставна употреба.
Клучни зборови: Апаратот за испитување на текстурата со дување (FPD), емулзија,
реологија, цврстина.
SECTION 8: FOOD QUALITY AND SAFETY
_________________________________________________________________________________________
_________________________________________________________________________________________
873
UDC: 664.95:664.8.037.5
Review paper
FREEZING AND STORAGE OF THE FROZEN FISH
Katerina Belichovska1*
, Daniela Belichovska1
1Faculty of Agricultural Sciences and Food-Skopje, Ss. Cyril and Methodius University in Skopje,
Macedonia *e-mail: [email protected]
Abstract
Freezing fish is essential, a widespread manner that provides the greatest conservation extending its
sustainability without significant reduction in nutritional value and taste deterioration. Fish can be
frozen in a number of ways: in the "stream" of cold air at a temperature of 380C to 42
0C or
"block" freezer temperature records 420C. There is a possibility of freezing the fish in a solution of
salt, glycerol and propylene glycol and agents with low boiling temperatures. Regardless of which
procedure is used, it is essential that it provides a rapid decrease of fish temperature, especially in
the zone of crystallization, and "down" to -180C or lower. During freezing and storage, biological,
physical and chemical changes in fish occur. The main task when freezing fish is to reduce to a
minimum the complex changes in the tissues of fish by providing optimum conditions of freezing.
Frozen fish stored at a temperature no higher than 180C. Storage temperature changes greater than
±0,50C should be avoided, and in trade for a short time, greater than +2
0C.
Key words: fish, freezing, storage.
Introduction
With the growing earth population and improvement of the standard of living, particularly in the
developing countries, there is a significant growth in the requirement for meat, especially for the
meat from fish. The consumers have become more aware of the benefits from fish consumption and
the possession of high quality fish. Our market offers live, fresh and frozen fish, as well as
processed fish, mainly fish in cans, and rarely other products.
The most common and the most practical way of preserving fish meat is freezing. Freezing is an
ancient technology for preserving foods (Archer, 2004), and it has been used for thousands of years
because of high product quality (Persson and Londahl, 1993). It has its historical origins in China,
where ice cellars were used to preserve the foods as early as 1000 BC. Later, the Greeks and
Romans stored food in cellars in which snow had been compressed. Foods intended to be consumed
while frozen date back to the 1500s when flavored ices were made in France by master ice makers
(Lund, 2000). The ancient Eskimos and Indians, in certain cold areas, used to preserve the food by
freezing it, in a way that the fish caught during the winter months was frozen and held frozen in the
cold ambient air. (Ronsivalli and Baker II, 1981). Fish were purposely frozen in the United Sates in
the mid-1800s using salt and ice to reduce the temperature of a pan on which the fish were placed
(Enochian, 1968). The freezing of fish subsequently became an important industry and was boosted
further by the advent of mechanical means of freezing.

SECTION 8: FOOD QUALITY AND SAFETY
_________________________________________________________________________________________
_________________________________________________________________________________________
874
Freezing of Fish
Freezing is one of the best and the most widely used preservation method for fish. Around 30% of
all the fish and fish products, globally, are frozen before being sold on the market. Nevertheless, the
eating quality of fresh fish is considered superior to that of frozen fish. It is, however, possible to
produce frozen fish of high eating quality by freezing the fish quickly and subsequently storing it at
low and stable temperatures. In this way, the physical and chemical processes causing the quality of
the fish to deteriorate may be reduced (Nielsen and Jessen, 2007). The freezing process consists of
freezing, frozen storage and thawing, each of which must be properly conducted to obtain optimum
results when preserving foods (Fennema at al., 1973, quoted by Delego and Sun, 2001).
Freezing is a process by which, with taking the heat away, the temperature in the center of the body
of the fish is being lowered from the initial temperature to -18◦C or -20
◦C and lower, and most of the
water contained in the fish tissue is being turned to ice. As a result of the freezing, unfavorable
conditions are created for the action of the enzymes and development of the microorganisms, which
in turn provides long-term storage of the fish. However, during the freezing and the storage of the
fish, the properties of the tissue change, which leads to deterioration of the quality of the frozen fish
in contrast to the fresh fish. During the freezing, biological and chemical changes are occurring in
the fish. The biological changes involve discontinuing the microorganisms’ ability to live, and part
of them die in the process. The death of the microorganisms has been noticed to be at its
maximum at temperatures between 0 and -5◦C. (Быков, 1980; Витченкo et al., 1981).
The basic physical process in the freezing of the fish is the converting of the water into ice.
Different species of fish freeze at temperatures between -0.6◦C and -2
◦C. The main part of the
water in the fish (up to 75%) turns into ice on temperatures from -1◦C to -5
◦C. While the temperature
is decreasing, the formation of ice crystals is gradually decreasing, too. It is considered that virtually
all the water becomes frozen at temperatures between -55◦C and -65
◦C (Быков, 1980; Витченко at
al., 1981). Around 76% of the unbound water freezes on -5◦C, around 89% at -20
◦C and around
90% freezes at -30◦C. The bound water in the tissue turns into ice on temperature of -65
◦C (Данев,
1999).
Fish muscle contains large amounts of water, often about 80%. When fish are frozen, the
temperature in the center of the fish quickly falls to just below 0°C. At - 1°C, ice crystals start to
form in the water, that is, the water changes from liquid to solid form. The degree to which this
process affects the quality of the thawed fish depends on where in the fish muscle the ice crystals
develop and on their size. Where crystals are formed and their size depend on whether the fish is
frozen before (pre), during (in), or after (post) rigor mortis (stiffening after death), as well as on how
speedy the freezing process is. In prerigor fish, the water is only inside the muscle cells, and when
the fish is frozen, the ice crystals will therefore form inside the cells. The ice crystals will mainly be
small. Large ice crystals will form only if the freezing process is slow (e.g., in still air above -
18°C). In in-rigor and prerigor fish, a small amount of water, however, will be outside the cells and
thus the speed of freezing becomes significant for the formation of ice crystals. If freezing is quick,
small ice crystals will form both inside and outside the cells. However, if freezing is slow, ice
crystals will first form outside the cells, resulting in an increase in the salt concentration. The higher
concentration of salt outside the cells will extract more water from the cells and when this happens
during freezing the ice crystals, which have already formed inside the cells, will grow in size rather
than allowing for the formation of new ice crystals. In in-rigor and postrigor fish, the speed at which
the fish are frozen can therefore determine how large the ice crystals are and where in the muscle
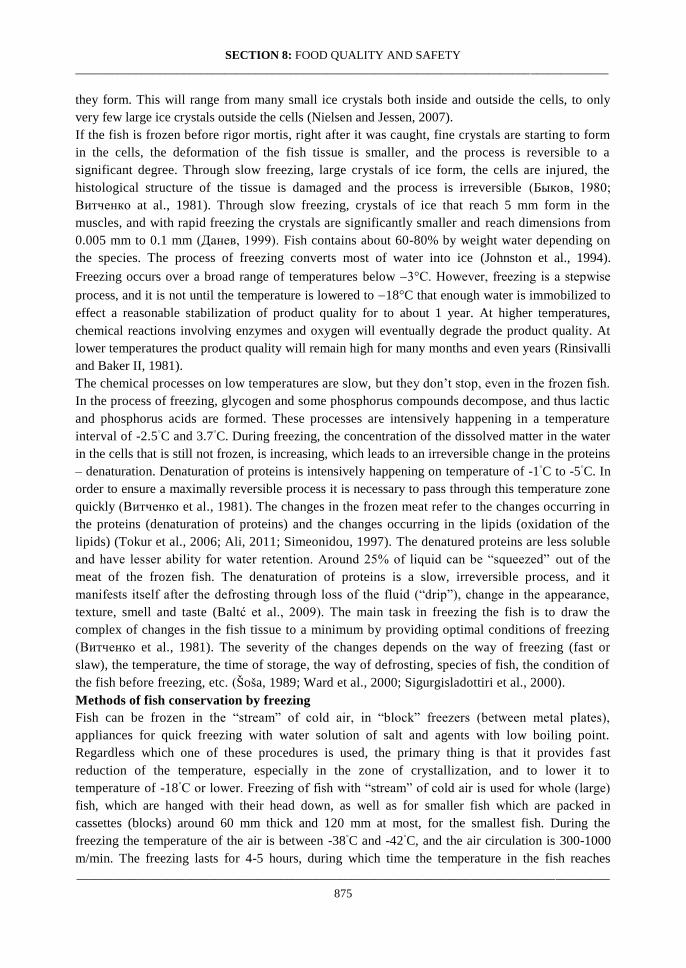
SECTION 8: FOOD QUALITY AND SAFETY
_________________________________________________________________________________________
_________________________________________________________________________________________
875
they form. This will range from many small ice crystals both inside and outside the cells, to only
very few large ice crystals outside the cells (Nielsen and Jessen, 2007).
If the fish is frozen before rigor mortis, right after it was caught, fine crystals are starting to form
in the cells, the deformation of the fish tissue is smaller, and the process is reversible to a
significant degree. Through slow freezing, large crystals of ice form, the cells are injured, the
histological structure of the tissue is damaged and the process is irreversible (Быков, 1980;
Витченко at al., 1981). Through slow freezing, crystals of ice that reach 5 mm form in the
muscles, and with rapid freezing the crystals are significantly smaller and reach dimensions from
0.005 mm to 0.1 mm (Данев, 1999). Fish contains about 60-80% by weight water depending on
the species. The process of freezing converts most of water into ice (Johnston et al., 1994).
Freezing occurs over a broad range of temperatures below 3°C. However, freezing is a stepwise
process, and it is not until the temperature is lowered to 18°C that enough water is immobilized to
effect a reasonable stabilization of product quality for to about 1 year. At higher temperatures,
chemical reactions involving enzymes and oxygen will eventually degrade the product quality. At
lower temperatures the product quality will remain high for many months and even years (Rinsivalli
and Baker II, 1981).
The chemical processes on low temperatures are slow, but they don’t stop, even in the frozen fish.
In the process of freezing, glycogen and some phosphorus compounds decompose, and thus lactic
and phosphorus acids are formed. These processes are intensively happening in a temperature
interval of -2.5◦C and 3.7
◦C. During freezing, the concentration of the dissolved matter in the water
in the cells that is still not frozen, is increasing, which leads to an irreversible change in the proteins
– denaturation. Denaturation of proteins is intensively happening on temperature of -1◦C to -5
◦C. In
order to ensure a maximally reversible process it is necessary to pass through this temperature zone
quickly (Витченко et al., 1981). The changes in the frozen meat refer to the changes occurring in
the proteins (denaturation of proteins) and the changes occurring in the lipids (oxidation of the
lipids) (Tokur et al., 2006; Ali, 2011; Simeonidou, 1997). The denatured proteins are less soluble
and have lesser ability for water retention. Around 25% of liquid can be “squeezed” out of the
meat of the frozen fish. The denaturation of proteins is a slow, irreversible process, and it
manifests itself after the defrosting through loss of the fluid (“drip”), change in the appearance,
texture, smell and taste (Baltć et al., 2009). The main task in freezing the fish is to draw the
complex of changes in the fish tissue to a minimum by providing optimal conditions of freezing
(Витченко et al., 1981). The severity of the changes depends on the way of freezing (fast or
slaw), the temperature, the time of storage, the way of defrosting, species of fish, the condition of
the fish before freezing, etc. (Šoša, 1989; Ward et al., 2000; Sigurgisladottiri et al., 2000).
Methods of fish conservation by freezing
Fish can be frozen in the “stream” of cold air, in “block” freezers (between metal plates),
appliances for quick freezing with water solution of salt and agents with low boiling point.
Regardless which one of these procedures is used, the primary thing is that it provides fast
reduction of the temperature, especially in the zone of crystallization, and to lower it to
temperature of -18◦C or lower. Freezing of fish with “stream” of cold air is used for whole (large)
fish, which are hanged with their head down, as well as for smaller fish which are packed in
cassettes (blocks) around 60 mm thick and 120 mm at most, for the smallest fish. During the
freezing the temperature of the air is between -38◦C and -42
◦C, and the air circulation is 300-1000
m/min. The freezing lasts for 4-5 hours, during which time the temperature in the fish reaches
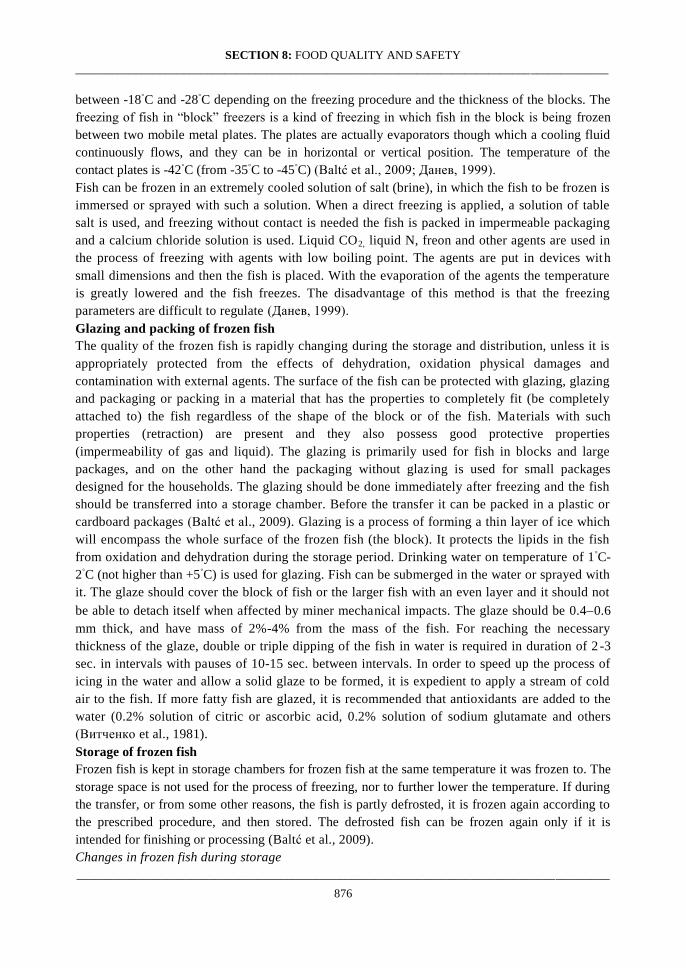
SECTION 8: FOOD QUALITY AND SAFETY
_________________________________________________________________________________________
_________________________________________________________________________________________
876
between -18◦C and -28
◦C depending on the freezing procedure and the thickness of the blocks. The
freezing of fish in “block” freezers is a kind of freezing in which fish in the block is being frozen
between two mobile metal plates. The plates are actually evaporators though which a cooling fluid
continuously flows, and they can be in horizontal or vertical position. The temperature of the
contact plates is -42◦C (from -35
◦C to -45
◦C) (Baltć et al., 2009; Данев, 1999).
Fish can be frozen in an extremely cooled solution of salt (brine), in which the fish to be frozen is
immersed or sprayed with such a solution. When a direct freezing is applied, a solution of table
salt is used, and freezing without contact is needed the fish is packed in impermeable packaging
and a calcium chloride solution is used. Liquid CO2, liquid N, freon and other agents are used in
the process of freezing with agents with low boiling point. The agents are put in devices with
small dimensions and then the fish is placed. With the evaporation of the agents the temperature
is greatly lowered and the fish freezes. The disadvantage of this method is that the freezing
parameters are difficult to regulate (Данев, 1999).
Glazing and packing of frozen fish
The quality of the frozen fish is rapidly changing during the storage and distribution, unless it is
appropriately protected from the effects of dehydration, oxidation physical damages and
contamination with external agents. The surface of the fish can be protected with glazing, glazing
and packaging or packing in a material that has the properties to completely fit (be completely
attached to) the fish regardless of the shape of the block or of the fish. Materials with such
properties (retraction) are present and they also possess good protective properties
(impermeability of gas and liquid). The glazing is primarily used for fish in blocks and large
packages, and on the other hand the packaging without glazing is used for small packages
designed for the households. The glazing should be done immediately after freezing and the fish
should be transferred into a storage chamber. Before the transfer it can be packed in a plastic or
cardboard packages (Baltć et al., 2009). Glazing is a process of forming a thin layer of ice which
will encompass the whole surface of the frozen fish (the block). It protects the lipids in the fish
from oxidation and dehydration during the storage period. Drinking water on temperature of 1◦C-
2◦C (not higher than +5
◦C) is used for glazing. Fish can be submerged in the water or sprayed with
it. The glaze should cover the block of fish or the larger fish with an even layer and it should not
be able to detach itself when affected by miner mechanical impacts. The glaze should be 0.40.6
mm thick, and have mass of 2%-4% from the mass of the fish. For reaching the necessary
thickness of the glaze, double or triple dipping of the fish in water is required in duration of 2 -3
sec. in intervals with pauses of 10-15 sec. between intervals. In order to speed up the process of
icing in the water and allow a solid glaze to be formed, it is expedient to apply a stream of cold
air to the fish. If more fatty fish are glazed, it is recommended that antioxidants are added to the
water (0.2% solution of citric or ascorbic acid, 0.2% solution of sodium glutamate and others
(Витченко et al., 1981).
Storage of frozen fish
Frozen fish is kept in storage chambers for frozen fish at the same temperature it was frozen to. The
storage space is not used for the process of freezing, nor to further lower the temperature. If during
the transfer, or from some other reasons, the fish is partly defrosted, it is frozen again according to
the prescribed procedure, and then stored. The defrosted fish can be frozen again only if it is
intended for finishing or processing (Baltć et al., 2009).
Changes in frozen fish during storage

SECTION 8: FOOD QUALITY AND SAFETY
_________________________________________________________________________________________
_________________________________________________________________________________________
877
During the storage microbiological, physical and chemical changes are occurring in the fish. At
temperatures of -12◦C the development of the microorganisms virtually stops (with an exception of
some molds), which would mean that the microbiological changes in the frozen fish during the
storage are negligible. But, it should be noted that the microorganisms endure lower temperatures
better than higher temperatures. Therefore, during unfavorable storage conditions (contaminated air
with microorganisms, high humidity of the air, significant initial contamination of the fish) molds
start to appear on the fish. At temperature of -18◦C, the microbiological spoiling of the fish is
excluded, but certain physical and chemical changes are still happening in it, which have important
influence on the quality indicators (Быков, 1980; Витченко et al., 1981).
The physical changes include shrinking, change of color and of the histological structure of the
tissues. In the process of storage fish color can change as a consequence of the decomposition of
the materials that give the color to the fish, and the growth of some strains of microorganism in
those conditions. The color change and the change of the structure of the tissues are mutually
connected. If there is a temperature fluctuation in the area with the frozen fish the fine ice crystals
in the tissues of the fish turn into large crystals. As a result of the recrystallization the quality of
fish deteriorates and a “shrinkage” appears. The degree of shrinkage of the frozen fish depends
on the fish species, the temperature of the storage room, the humidity of the air in the chamber,
type of packaging and the presence of the glaze on the fish surface. The average “shrinkage”
during fish storage is 0.10.4% monthly. In the frozen and glazed fish there are not any losses
determined during the first month of storage. During further storage of the frozen fish, chemical
changes – oxidation of the lipids and denaturation of proteins, are also occurring (Быков, 1980;
Витченко et al., 1981).
Storage regiment and shelf life of frozen fish
The storage regiment should provide maximum slowing down of the physical and the chemical
changes in the fish and thus long term storage. The fatty fish should be stored at temperatures from -
25◦C to -30
◦C, and lean fish at temperatures from -18
◦C to -20
◦C. The temperature regiment should
be constant, and the only allowed fluctuation is no more than ±1◦C. During stocking and emptying
of the storage chamber an increase in the air temperature of 3◦C - 4
◦C is allowed. The relative
humidity in the storage chamber of the frozen fish should be 94-98%. The strict consistency of the
temperature and of the humidity is an essential condition for rational storage of the frozen fish
(Быков, 1980; Витченко at al., 1981). A temperature of -25◦C to -30
◦C for fatty fish and -20
◦C to
-30◦C for other fish and a relative air humidity of 90% to 95% is set for storage of the frozen fish
before it arrives to the stores. Frozen or deep-frozen fish should not be stored more than six
months (Lambaša-Belak, 2006). The air circulation during storage should be moderate and not
higher than needed to maintain a constant temperature. In order to provide a more even
circulation of the air in all the parts of the storage room a free space of 5 to 10 cm between the
frozen fish and the walls i.e. ceiling or floor is necessary (Baltić et al., 2009).
Shelf life of food is defined as the maximum length of time a given product is fit for human
consumption. For fish, shelf life is the time from when it is taken from the water until it is no longer
fit to eat. Temperature and handling practices are the most important factors in determining the shelf
life of all species of fish (Doyle, 1995). Under ideal circumstances (low and stable storage
temperatures), some fish species may retain a fair eating quality for over a year. Shelf life can be
assessed either in terms of Practical Storage Life (PSL) or High Quality Life (HQL). PSL is defined
as the time the product can be in cold storage before it loses its characteristic properties or becomes
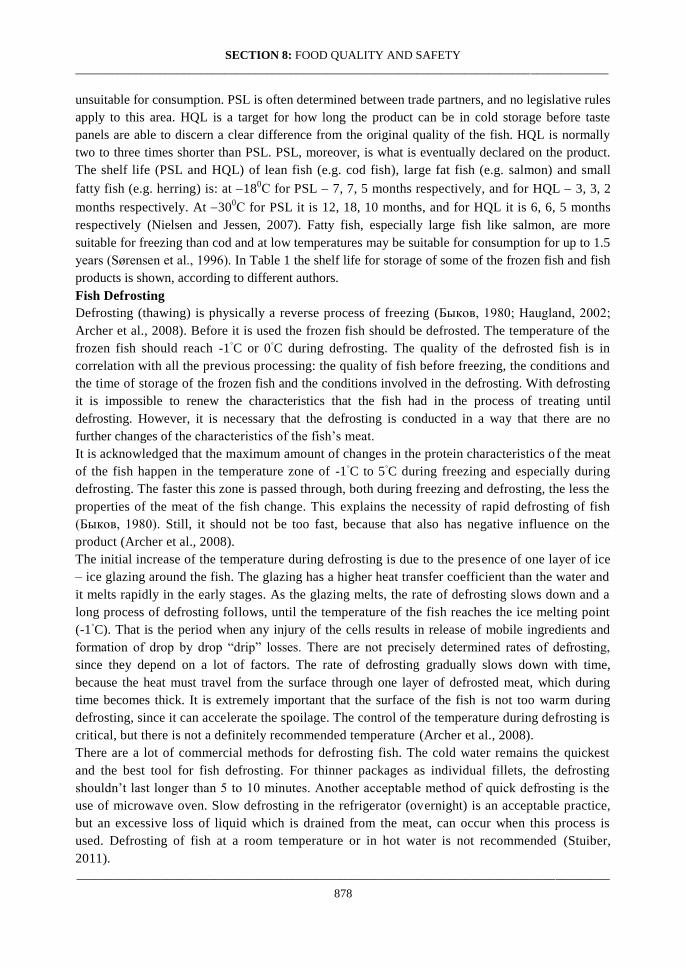
SECTION 8: FOOD QUALITY AND SAFETY
_________________________________________________________________________________________
_________________________________________________________________________________________
878
unsuitable for consumption. PSL is often determined between trade partners, and no legislative rules
apply to this area. HQL is a target for how long the product can be in cold storage before taste
panels are able to discern a clear difference from the original quality of the fish. HQL is normally
two to three times shorter than PSL. PSL, moreover, is what is eventually declared on the product.
The shelf life (PSL and HQL) of lean fish (e.g. cod fish), large fat fish (e.g. salmon) and small
fatty fish (e.g. herring) is: at 180С for PSL 7, 7, 5 months respectively, and for HQL 3, 3, 2
months respectively. At 300С for PSL it is 12, 18, 10 months, and for HQL it is 6, 6, 5 months
respectively (Nielsen and Jessen, 2007). Fatty fish, especially large fish like salmon, are more
suitable for freezing than cod and at low temperatures may be suitable for consumption for up to 1.5
years (Sørensen et al., 1996). In Table 1 the shelf life for storage of some of the frozen fish and fish
products is shown, according to different authors.
Fish Defrosting
Defrosting (thawing) is physically a reverse process of freezing (Быков, 1980; Haugland, 2002;
Archer et al., 2008). Before it is used the frozen fish should be defrosted. The temperature of the
frozen fish should reach -1◦C or 0
◦C during defrosting. The quality of the defrosted fish is in
correlation with all the previous processing: the quality of fish before freezing, the conditions and
the time of storage of the frozen fish and the conditions involved in the defrosting. With defrosting
it is impossible to renew the characteristics that the fish had in the process of treating until
defrosting. However, it is necessary that the defrosting is conducted in a way that there are no
further changes of the characteristics of the fish’s meat.
It is acknowledged that the maximum amount of changes in the protein characteristics of the meat
of the fish happen in the temperature zone of -1◦C to 5
◦C during freezing and especially during
defrosting. The faster this zone is passed through, both during freezing and defrosting, the less the
properties of the meat of the fish change. This explains the necessity of rapid defrosting of fish
(Быков, 1980). Still, it should not be too fast, because that also has negative influence on the
product (Archer et al., 2008).
The initial increase of the temperature during defrosting is due to the presence of one layer of ice
– ice glazing around the fish. The glazing has a higher heat transfer coefficient than the water and
it melts rapidly in the early stages. As the glazing melts, the rate of defrosting slows down and a
long process of defrosting follows, until the temperature of the fish reaches the ice melting point
(-1◦C). That is the period when any injury of the cells results in release of mobile ingredients and
formation of drop by drop “drip” losses. There are not precisely determined rates of defrosting,
since they depend on a lot of factors. The rate of defrosting gradually slows down with time,
because the heat must travel from the surface through one layer of defrosted meat, which during
time becomes thick. It is extremely important that the surface of the fish is not too warm during
defrosting, since it can accelerate the spoilage. The control of the temperature during defrosting is
critical, but there is not a definitely recommended temperature (Archer et al., 2008).
There are a lot of commercial methods for defrosting fish. The cold water remains the quickest
and the best tool for fish defrosting. For thinner packages as individual fillets, the defrosting
shouldn’t last longer than 5 to 10 minutes. Another acceptable method of quick defrosting is the
use of microwave oven. Slow defrosting in the refrigerator (overnight) is an acceptable practice,
but an excessive loss of liquid which is drained from the meat, can occur when this process is
used. Defrosting of fish at a room temperature or in hot water is not recommended (Stuiber,
2011).
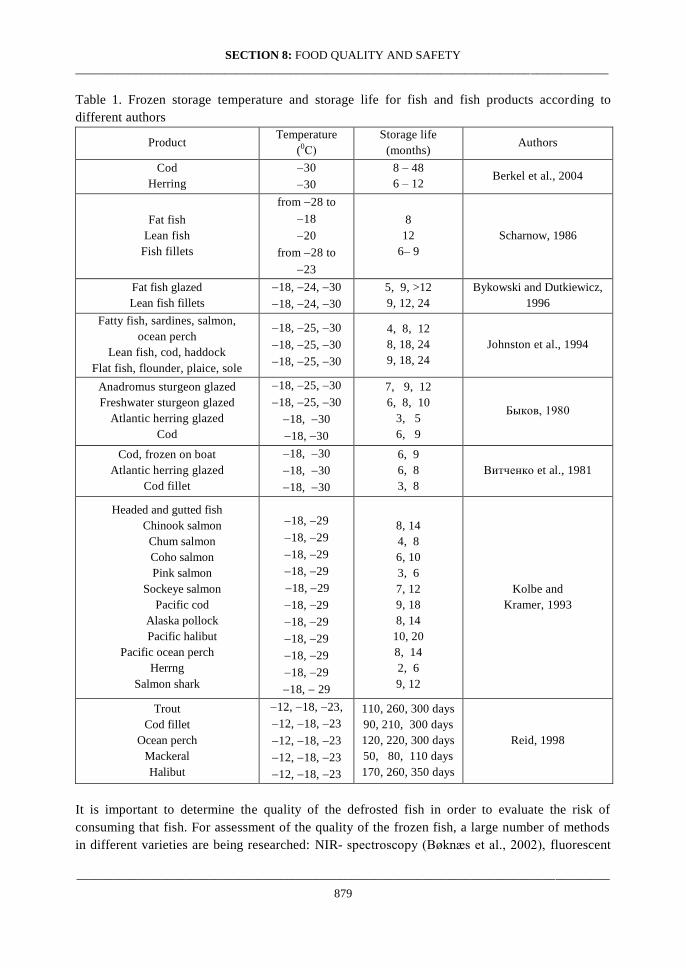
SECTION 8: FOOD QUALITY AND SAFETY
_________________________________________________________________________________________
_________________________________________________________________________________________
879
Table 1. Frozen storage temperature and storage life for fish and fish products according to
different authors
Product Temperature
(0С)
Storage life
(months) Authors
Cod
Herring
30
30
8 – 48
6 – 12 Berkel et al., 2004
Fat fish
Lean fish
Fish fillets
from 28 to
18
20
from 28 to
23
8
12
6– 9
Scharnow, 1986
Fat fish glazed
Lean fish fillets
18, 24, 30
18, 24, 30
5, 9, >12
9, 12, 24
Bykowski and Dutkiewicz,
1996
Fatty fish, sardines, salmon,
ocean perch
Lean fish, cod, haddock
Flat fish, flounder, plaice, sole
18, 25, 30
18, 25, 30
18, 25, 30
4, 8, 12
8, 18, 24
9, 18, 24
Johnston et al., 1994
Anadromus sturgeon glazed
Freshwater sturgeon glazed
Atlantic herring glazed
Cod
18, 25, 30
18, 25, 30
18, 30
18, 30
7, 9, 12
6, 8, 10
3, 5
6, 9
Быков, 1980
Cod, frozen on boat
Atlantic herring glazed
Cod fillet
18, 30
18, 30
18, 30
6, 9
6, 8
3, 8
Витченко et al., 1981
Headed and gutted fish
Chinook salmon
Chum salmon
Coho salmon
Pink salmon
Sockeye salmon
Pacific cod
Alaska pollock
Pacific halibut
Pacific ocean perch
Herrng
Salmon shark
18, 29
18, 29
18, 29
18, 29
18, 29
18, 29
18, 29
18, 29
18, 29
18, 29
18, 29
8, 14
4, 8
6, 10
3, 6
7, 12
9, 18
8, 14
10, 20
8, 14
2, 6
9, 12
Kolbe and
Kramer, 1993
Trout
Cod fillet
Ocean perch
Mackeral
Halibut
12, 18, 23,
12, 18, 23
12, 18, 23
12, 18, 23
12, 18, 23
110, 260, 300 days
90, 210, 300 days
120, 220, 300 days
50, 80, 110 days
170, 260, 350 days
Reid, 1998
It is important to determine the quality of the defrosted fish in order to evaluate the risk of
consuming that fish. For assessment of the quality of the frozen fish, a large number of methods
in different varieties are being researched: NIR- spectroscopy (Bøknæs et al., 2002), fluorescent
SECTION 8: FOOD QUALITY AND SAFETY
_________________________________________________________________________________________
_________________________________________________________________________________________
880
spectroscopy (Karoui et al., 2006), measurement of the dielectric properties in a microwave area
(Kent et al., 2004; Kent et al., 2005). The obtained results are pointing towards a possibility of
application of the dielectric properties in controlling the quality of the defrosted fish muscles.
Conclusions
Fish is an extremely perishable food item, susceptible to microbiological and biochemical
processes, which deteriorate the quality, i.e. lead to change in the texture, color, taste and smell of
the fish meat. Different procedures are used in order to preserve the quality of fish and to prolong
the shelf life. Freezing is the most widely used method of fish preservation. The purpose of
freezing is to lower the temperature of the fish and in that way to slow down the changes in the
tissues to that degree that it virtually cannot be differentiated from the fresh fish when the product
is defrosted, after being kept in the freezer. Around 30% of all fish and fish products, on a global
level, are frozen before being sold on the market. However, the quality of the fresh fish for
consumption is considered to be superior over the quality of the frozen fish. Nevertheless, it is
possible to produce frozen fish with high nutritive quality if an appropriate care is provided in
every step of the freezing, storage and defrosting procedures. In order to have a frozen fish with
good quality the use of rapid freezing, immediately after fish is caught, followed by storage at
low and stable temperatures and rapid defrosting is recommended.
References
Aberoumand, A., Jooyandeh, H. (2010). Storage Quality and Chemical and Structural Changes of
Fresh and Frozen-Thawed Fish. World Journal of Fish and Marine Sciences, 2 (3): 251-253.
Agbon, A.O., G.N.O. Ezeri, B.N. Ikenwiewe, N.O. Alegbleye and D.T. Akomolade, (2002). A
comparative study of different storage methods on the shelf life of smoked current fish. J. Aquat.
Sci., 17 (2): 134-136.
Ali, F.H.M. 2011. Quality Evaluation of Some Fresh and Imported Frozen Seafood. Advance
Journal of Food Science and Technology 3 (1): 83-88.
Archer, D.L. (2004). Freezing: an underutilized food safety technology? International Journal of
Food Microbiology 90, 127-138.
Avtandilov, G. (1990). Meditsinskaya morfometriya, Medical Morphometry, Meditsina, Moskva,
pp: 67-73.
Baltić Ž. M., Kilibarda, N., Dimitrijević, M. (2009). Činioci od značaja za održivost ribe i odabranih
proizvoda od ribe u prometu. Тehnologija mesa, 50, 1-2, 166-176.
Barkel, B.M., van den Boogaard, B., Heijnen, C. (2004). Preservation of fish and meat. Agrodok 12.
3 rd
edition. Agromisa Foundation, Wageningen, pp. 86.
Benjakul, S., Visessanguan, W. (2010). Impacts of Freezing and Frozen Storage on Quality Changes
of Seafoods. In: Physicochemical Aspects of Food Engineering and Processing. Edited by Sakamon
Devahastin, CRC Press, Pages 283-306.
Бìков, П.В. (1980). Технологи® рыбнìх продуктов. ПиÈва® промиìшленность, Москва,
pp. 83-109.
Bøknæs, N., Jensen, K.N., Andersen, C.M., Martens, H. (2002). Freshness assessement of thawed
and chilled cod fillets packed in modified atmosphere using near-infrared spectroscopy. LWT-
Food Science and Technology, 35, 628-634.
SECTION 8: FOOD QUALITY AND SAFETY
_________________________________________________________________________________________
_________________________________________________________________________________________
881
Bykowski, P., Dutkiewicz, D. (1996). Freshwater fish processing and equipment in small plants.
FAO Fisheries Circular. No. 905. Rome, FAO, 59p.
Careche, M., A.M. Herrero, A. Rodriguez-Casado, M.L.D. Del Mazo, and P. Carmona. (1999).
Structural changes of hake (Merluccius merluccius L..) fillets: Effect of freezing and frozen storage.
J. Agric. Food Chem. 47, 952959.
Doyle, J.P. (1995). Seafood Shelf Life as a Function of Temperature. Alaska Sea Grant Marine
Advisory Program, 2nd Printing.
Данев, М. (1999). Хигиена и технологија на месо, риби, јајца и нивни производи. Универзитет
„Св. Кирил и Mетодиј“, Скопје, pp. 834-837.
Einen, O., Guerinb, T., Fjærac, S.L., Skjervold, P.O. (2002). Freezing of pre-rigor fillets of Atlantic
salmon. Aquaculture, 212 (1–4) 129–140.
Enochian, R. V. (1968). The rise, present importance and future of frozen, fresh foods. In: Tresseler,
D.K., van Arsdel, W.B., Copley, M.J. (Eds.), The Freezing Preservation of Foods, vol. 3, AVI
Publishers, Westport, CT, pp 138.
Fennema, O. (1977). Loss of vitamins in fresh and frozen foods. Food Tech, 31(12),32–38.
Haugland, A. (2002). Industrial thawing of fish – to improve quality, yield and capacity. A Thesis
submitted for the Degree of Doktor Ingeniør. Norwegian University of Science and Technology.
Johnston, W.A, F.J. Nicholson, A. Roger and G.D. Stroud. (1994). Freezing and refrigerated storage
in fisheries. FAO Fisheries Technical Paper. 340. Rome, FAO, 143p.
Karoui, R., Thomas, E., Dufour, E. (2006). Utilisation of a rapid technique based on front-face
fluorescence spectroscopy for differentiating between fresh and frozen-thawed fish fillets. Food
Research International, 39: 349-355.
Kent, M., Oehlenschlager, Ј., Mierke-Klemeyer, S., Knochel, R., Dashner, F., Schimmer, O.
(2004). Estimation of the qualiy of frozen cod using a new instrumental method. Eur. Food Res.
Technol., 219, 540544.
Kent, M., Knochel, R., Dashner, F., Schimmer, O., Tejada, M., Huidobro, A., Nunes, L., Batista,
I., Martins., A. (2005). Determinatin of the quality of frozen hake using its mikrowave dielectric
proprties. Int. J. Food Sci. Technol.,40,5565.
Kilibarda, N., Baltić, Ž. M., Dimitrijević, M., Karabasil, N., Kiškarolj, F. (2009). Effect of fish
freezing on selected parameters of smoked product quality. Acta Veterinaria (Beograd), Vol. 59,
No. 2-3, 291-302.
Kolbe, E., Kramer, D. (1993). Planning Seafood Cold Storage. Alaska Sea Grant College
Program, University of Alaska Fairbanks, Marine Advisory Bulletin No. 46, 34-48.
Lambaša-Belak, Živana (2006). Tehnologija hrane. Šibenik, pp. 6465.
Lund, B.M. (2000). Freezing. In: BM Lund, TC Baird Parker, GW Gould (Eds.), The
Microbiological Safety and Quality of Food. 1. Aspen Publishers, Gaithersburg, 122145.
Мagnussen, O.M., Hemmingsen, A.K.T., Hardarsson, V., Nordtvedt, T.S., Eikevik, T.M. (2008). 7
Freezing of fish. In: Frozen Food Science and Technology, Edited by Judith A. Evans, Blackwell
Publishing, University of Bristol, UK, 151-164.
Nielsen, J., Jessen, F. (2007). Quality of frozen fish. In: Nollet, L.M.L., Boylston, T., Chen, F.,
Coggins, P.C., Gloria, M.B., Hyldig, G., Kerth, C.R., Mckee, L.H. and Hui, Y.H., (Eds.) Handbook
of Meat, Poultry and Seafood Quality. Oxford: Blackwell Publishing, pp. 577586.

SECTION 8: FOOD QUALITY AND SAFETY
_________________________________________________________________________________________
_________________________________________________________________________________________
882
Persson, P. O. and Londahl, G. (1993). Freezing technology. In: Frozen Food Technology (edited by
P. Mallet). Pp. 20–58. Glasgow, UK: Blackie Academic and Professional.
Reid, D. (1998). Freezing preservation of fresh foods: quality aspects. Chapter fourteen, CRC
Press LLC.
Ronsivalli, L.J., Baker II, D.W. (1981). Low Temperature Preservation of Seafoods: A Review.
Marine Fisheries Review, 43 (4) pp.15.
Scharnow, R. (1986). Codiertes Handbuch der Güter des Seetransports, VE Kombinat Seeverkehr
und Hafenwirtschaft - Deutfracht/Seereederei - Ingenieurhochschule für Seefahrt
Warnemünde/Wustrow, Rostock, Bd. 1: Stückgut A-K, Bd. 2: Stückgut L-Z, Bd. 3: Spezialgut).
Sigurgisladottir, S., Ingvarsdottir, H., Torrissen, O. J., Cardinal, M., Hafsteinsson, H., (2000).
Effects of freezing/thawing on the microstructure and the texture of smoked Atlantic salmon (Salmo
salar). Food Research International, 33, 857−865.
Simeonidou, S., Govaris, A., Vareltzis, K. (1997). Effect of frozen storage on the quality of
whole fish and fillets of horse mackerel (Trachurus trachurus) and medirerranean hake
(Merluccius mediterraneus). Z Lebensm Unters Forsch A 204: 405-410.
Smrensen, N.K., Gundersen,B., Nyvold, T.E., Elvevoll, E. 1996. Evaluation of sensory quality
during freezing and frozen storage of whole, gutted Atlantic salmon (Salmo salar). In: Refrigeration
and Aquaculture Proceedings of the meeting of commission C2. Bordeaux, France, March 20-22,
pp. 307-315.
Stuiber, D.A. (2011). Home freezing of fish. University of Alaska Fairbanks Cooperative
Extension Service, Copyright 1986, Board of Regents, University of Wisconsin System, Sea Grant
Institute.
Šoša, B. (1989). Higijena i tehnologija prerade morske ribe. Školska knjiga, Zagreb, p 184.
Tokur, B., Çakli, Ş., Polat, A. 2006. The Quality Changes of Trout (Oncorhynchus mykiss W.,
1792) with a Vegetable Topping During Frozen Storage (18°C). E.U. Journal of Fisheries &
Aquatic Sciences, 23 (3-4): 345-350.
Ward, D., Tang, J., Correia, L. R. (2000). Salt diffusivities and alt diffusion in farmed Atlantic
salmon muscle as infl uenced by rigor mortis. J. of Food Eng., 43, 115−123.
Витченко, Г.А., Копылов, М.Я., Лебедов, М., Слюсаренко, К.Е., Опацкя, М.Э. (1981).
Рыбопромысловое дело. Легкая и пищевая промышленость, Москва, рр. 194-203.

SECTION 8: FOOD QUALITY AND SAFETY
_________________________________________________________________________________________
_________________________________________________________________________________________
883
СМРЗНУВАЊЕ И СКЛАДИРАЊЕ НА СМРЗНАТА РИБА
Катерина Беличовска, Даниела Беличовска
Апстракт
Смрзнувањето на рибата е основен, широко распространет начин на конзервирање, кој
обезбедува најголемо продолжување на нејзината одржливост без значително намалување на
хранливата вредност и влошување на вкусот. Рибата може да се смрзнува на повеќе начини:
во „струја“ на ладен воздух при температура од 380C до 42
0C или во „блок“ замрзнувачи
при температура на плочите од 420C. Постои можност за смрзнување на рибата во раствор
од сол, глицерол и пропиленгликол и во агенси со ниски температури на вриење. Без оглед
која постапка се користи, основно е таа да обезбедува брзо намалување на температурaта на
рибaта, особено во зоната на кристализација, и да ја „спушти“ на 180C или пониска. При
смрзнувањето и складирањето, во рибата настануваат биолошки, физички и хемиски
промени. Основна задача при смрзнувањето на рибата е да се сведе до минимум комплексот
на промени во ткивата на рибата по пат на обезбедување оптимални услови на смрзнување.
Смрзнатата риба се складира при температура не повисока од –180C. Треба да се избегнуваат
промени на температурата на складирање поголеми од 0,50С, а во прометот, за кратко време,
поголеми од +20C.
Клучни зборови: риба, смрзнување, складирање.
SECTION 8: FOOD QUALITY AND SAFETY
_________________________________________________________________________________________
_________________________________________________________________________________________
884
UDC:637.143.3:577.112
Original scientific paper
INFLUENCE OF SERUM PROTEINS ON THE QUALITY, CHEMICAL AND
BIOCHEMICAL PROPERTIES OF YOGURT
Vanja G. Madjoska1, Sonja D. Srbinovska
2, Sterja M. Sterjovski
2
1Municipality of Makedonski Brod
, Makedonski Brod, Republic of Macedonia
2Faculty of Agricultural Sciences and Food-Skopje, Ss. Cyril and Methodius University in Skopje,
Macedonia
Abstract
In order to determine the influence of serum proteins on the quality, chemical and biochemical
properties of yogurt, two different starter cultures were applied: YF-L 811 (V1) and YC-381 (V2),
as well as two inoculation temperatures: 35-37 °C (V1.1 and V2.1) and 41-43°C (V1.3 and V2.3),
with and without the addition of serum protein powder (V1.2, V1.4 and V2.2 and V2.4 ). Cow milk
from the same milk farm was used as a raw material, which was pasteurized at 85oC for 30 minutes.
The storage lasted for fifteen days at 4oC, and the content of milk fats, ashes, proteins and dry
material were analyzed on the first and 15th
of the storage; and the lactose, the titration acidity and
pH on the first, 5th
, 10th
, and 15th
day. On the basis of the gathered date from the analysis it was
determined that: Titration acidity significantly grows in all of the sub-variants, with the lowest
acidity had V1.2 (28.61°SH to 45.34°SH), while the highest values shows V2.3 (38.50°SH to 52.59
°SH). V2 sub-variants had higher titration acidity for the duration of storage of the yogurt compared
to V1, and the sub-variants with added whey powder had lower titration acidity. Active acidity has a
declining trend, being higher among V2- sub-variants, and sub-variants with the addition of serum
proteins appeared having a higher pH values. Lactose content significantly decreases from the first
to the 15th day in all varieties of yogurt. On the first day, lactose ranged from 2.57 % (V1.4, V2.3
and V2.4) to 2.85 % (V2.1), and the 15th day of 0.17 % (V1.3, V2.3 and V2.4) to 0.34 % (V1.2).
The addition of serum proteins did not influence the change in the content of lactose in yogurt. The
addition of serum proteins in yogurt, led to a higher content of fat, protein, ash and dry matter in
yogurt.
Key words: yogurt, temperature of fermentation, serum proteins, starter culture, storage.
Introduction
Fermented milk are products prepared from whole, partially or completely skimmed milk - not-
homogenized or homogenized, pasteurized or sterilized milk, under the influence of specific
bacteria (FIL-IDF, 1969, Kosikowski, 1984). Fermented milk products differ in taste, texture and
durability, compared to the original raw materials. The definition of fermented milks is applied
exclusively for liquid or semi-liquid dairy products, and does not apply to cheeses. Other than cow's
milk in the production of fermented milk, sheep, goat, buffalo and mare milk can also be used, but a
mixture of multiple types of milk can be used as well. Definition of fermented milk is accepted
worldwide. (FIL-IDF, 1969, Kosikowski, 1984). Fermented dairy products are yogurt, stirred
yogurt, fruit yogurt, kefir and fermented cheeses.
SECTION 8: FOOD QUALITY AND SAFETY
_________________________________________________________________________________________
_________________________________________________________________________________________
885
The term yogurt as a foodstuff, mean semi- liquid dairy product which is obtained by adding lactic
acid bacteria such as (Lactobacillus delbrueckii subsp.bulgaricus and Streptococcus thermophilus),
forming lactic and other acids that preserve the product, increase its durability and give it new
characteristic organoleptic properties. During fermentation, a whole range of physicochemical
changes occur to milk components: milk protein (casein) coagulates under the influence of acid,
lactose under the influence of enzymes breaks down to glucose and galactose and to lactic acid; the
taste and the smell of the product change as well. On a temperature from 42 to 45 ° C for a period of
2-4 hours, comes to the fermentation of milk, then the yogurt cools down so that its fermentation
slows down, and the durability of the finished product extends. Yoghurt is rich in protein, calcium,
vitamin B2 (riboflavin) and vitamin B12, and people who are lactose intolerant can freely consume
yogurt because much of the lactose in the fermentation process turns into lactic acid.
Material and methods
The research for this paper was performed in the laboratories Faculty of Agricultural Sciences and
Food in Skopje. As a research subject, different varieties of yogurt produced in the laboratory were
used. As the basic raw material for research for this paper, the following was used: The sum of
cow's milk from the same dairy farm, and as auxiliary raw materials were used: Two types of starter
cultures as follows: YF L-811 and YC-381 and Serum proteins were the following chemical
composition: Protein - 12.11%, Fat - 1.0%, Carbohydrate 69 62%.
In the survey, two basic variants were stated, based on the starter cultures used, then the sub-
variants were made based on temperature of inoculation and addition of serum proteins. However,
in the survey, eight sub-alternatives were stated:
V1-inoculated with YF L-811:
Sub-variants:
V 1.1- inoculation at a temperature of 35-37 º C.
V. 1.2 - Inoculation at a temperature of 35-37 º C + serum proteins
V. 1.3 - Inoculation at a temperature of 41-43 º C.
V. 1.4 - Inoculation at atemperature of 41-43 º C + serum protein
V2-inoculated with YC-381:
Sub-variants:
V 2.1 - Inoculation at a temperature of 35-37 º C.
V. 2.2 - Inoculation at a temperature of 35-37 º C + serum protein
V. 2.3 - Inoculation at a temperature of 41-43 º C.
V. 2.4 - Inoculation at atemperature of 41-43 º C + serum proteins
Method of operation
The chemical analysis includes examination of the essential ingredients in yogurt, according to the
following methods: Determination of fat - Gerber method; Determination of protein - Kieldahl
method; Determination of lactose - hloramin method T IDF / ISO / AOAC; Determination of ash -
method according to the IDF / ISO / AOAC combustion at 550 ° C; Determination of dry matter
according to the method of drying 105 ° C.
For assessment of biochemical changes in the yogurt, the following tests were conducted:
Titratable acidity - according to the method Soxhlet-Henkel modified by Moress; Active acidity -
pH meter.

SECTION 8: FOOD QUALITY AND SAFETY
_________________________________________________________________________________________
_________________________________________________________________________________________
886
Results and discussion
Impact on titration acidity of yogurt (°SH)
Titration acidity in yogurt is an important indicator of the quality of yogurt. The obtained results, in
terms of titration acidity in yogurt variants is given in Table 1.
In V1-sub-variants, titration acidity was ranging from 28,61 ° SH in V1.2 and to 33,25 ° SH in
V1.3, in the first day of keeping. In Sub-variants, with the addition of serum proteins lower titration
acidity (V1.2 and V1.4) was noticed.
In V2- Sub-variants, in the first day, the lowest titration acidity was noticed in V2.2 34,33 ° SH, and
highest in V2.3 38,50 ° SH and in this variant, the addition of serum proteins lead to lower titration
acidity. Comparatively, first day variants of V1 had lower titration acidity than the V2 variant.
Titration acidity in all variants, during the 15 days storage increases, but with different intensity.
Namely, V1.1 titration acidity that in the first day was 28 91, to the 5th day, consequently increased
to 23.6%, 10th dat to 14.9% and 15th day to 10.6% or for a period of 15 days, the acidity increased
by 56.9% compared to the first day.
In V1.2, in which serum protein was added, the initial titration acidity was slightly smaller than
V1.1 and amounted to 28,61 ° SH, and then there is an almost same pace of increase and on the
15th day it was 45,34 ° SH, or the growth in titration acidity is 55.5% higher compared to the first
day. The largest increase in titration acidity is between the 1st and 5th day, 23.6% in V1.1 and
24.1% in V1.2. All V1 sub-alternatives show greatest decrease in titration acidity in the first 5 days
of storage. On the other hand, V2-sub-variants statistics show significantly higher acidity compared
to V1-sub-variants. In V2.1 titration acidity on the first day amounted to 34,59 ° SH, on the 5th day
it increased by 12.0%, to 19.3% on the 10th day, and on the 15th day only 2.4% or a total of 38.7%
compared to the first day. Added serum proteins in V2.2 slightly influenced acidity so that on the
first day it was 34,33 ° SH, then to the 15th day it increased by 33.7% compared to the first day.
From the above it can be concluded that the sub-variants which have the addition of serum proteins
(V1.2, V1.4, V2.2 and V2.4) have lower titration acidity than sub-variants with no added serum
proteins, which is consistent to the tests by Chr-Hansen, (2006).
Table 1. Dynamics of the titration acidity of yogurt (°SH)
1th day 5th day 10th day 15th day
SH° Cv Cv Cv Cv
V 1.1 28,91±1,518 12,867 35,75±0,543 3,725 41,08±2,192 13,072 45,35±2,629 14,202
V 1.2 28,61±2,335 19,989 35,50±1,303 8,994 40,66±1,922 11,578 45,34±2,324 12,556
V 1.3 33,25±0,313 0,228 37,50±1,204 7,864 43,08±1,955 11,116 45,58±2,115 11,364
V 1.4 32,34±0,163 1,236 36,25±1,059 7,807 42,00±2,589 15,102 45,41±2,188 11,805
V 2.1 34,59±1,410 9,985 38,75±2,136 13,501 46,25±2,136 11,312 47,75±2,211 11,342
V 2.2 34,33±1,030 7,349 37,08±0,538 3,557 43,75±1,937 11,049 45,92±2,077 11,082
V 2.3 38,50±1,034 6,581 41,41±0,943 5,58 51,58±3,611 17,148 52,59±3,476 16,193
V 2.4 34,75±0,515 3,634 40,75±0,658 3,955 48,91±2,233 11,185 51,75±3,026 14,326
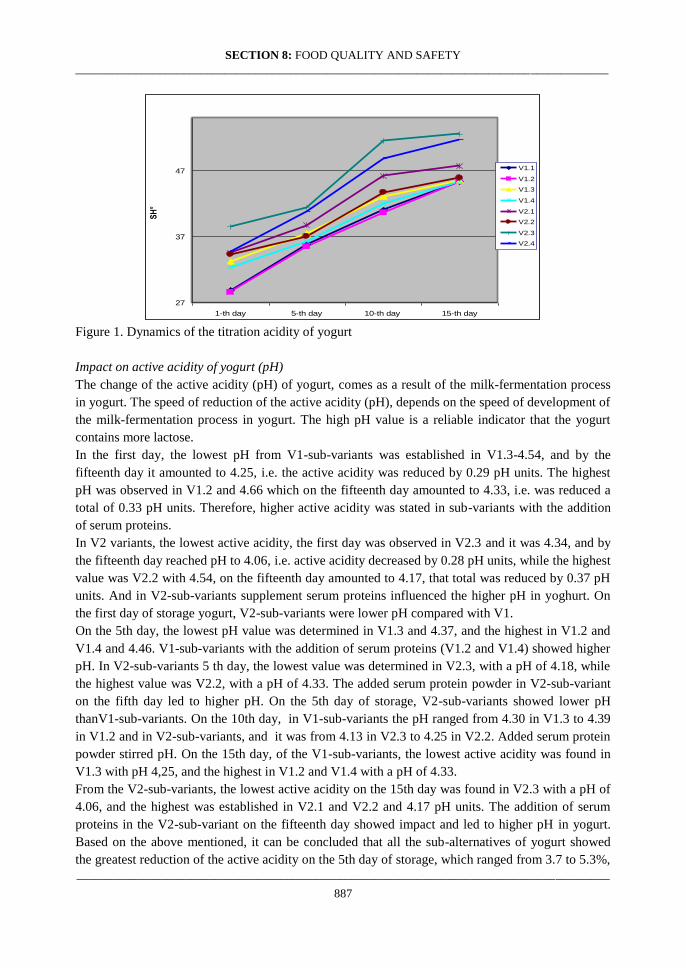
SECTION 8: FOOD QUALITY AND SAFETY
_________________________________________________________________________________________
_________________________________________________________________________________________
887
27
37
47
1-th day 5-th day 10-th day 15-th day
ЅН°
V1.1
V1.2
V1.3
V1.4
V2.1
V2.2
V2.3
V2.4
Figure 1. Dynamics of the titration acidity of yogurt
Impact on active acidity of yogurt (pH)
The change of the active acidity (pH) of yogurt, comes as a result of the milk-fermentation process
in yogurt. The speed of reduction of the active acidity (pH), depends on the speed of development of
the milk-fermentation process in yogurt. The high pH value is a reliable indicator that the yogurt
contains more lactose.
In the first day, the lowest pH from V1-sub-variants was established in V1.3-4.54, and by the
fifteenth day it amounted to 4.25, i.e. the active acidity was reduced by 0.29 pH units. The highest
pH was observed in V1.2 and 4.66 which on the fifteenth day amounted to 4.33, i.e. was reduced a
total of 0.33 pH units. Therefore, higher active acidity was stated in sub-variants with the addition
of serum proteins.
In V2 variants, the lowest active acidity, the first day was observed in V2.3 and it was 4.34, and by
the fifteenth day reached pH to 4.06, i.e. active acidity decreased by 0.28 pH units, while the highest
value was V2.2 with 4.54, on the fifteenth day amounted to 4.17, that total was reduced by 0.37 pH
units. And in V2-sub-variants supplement serum proteins influenced the higher pH in yoghurt. On
the first day of storage yogurt, V2-sub-variants were lower pH compared with V1.
On the 5th day, the lowest pH value was determined in V1.3 and 4.37, and the highest in V1.2 and
V1.4 and 4.46. V1-sub-variants with the addition of serum proteins (V1.2 and V1.4) showed higher
pH. In V2-sub-variants 5 th day, the lowest value was determined in V2.3, with a pH of 4.18, while
the highest value was V2.2, with a pH of 4.33. The added serum protein powder in V2-sub-variant
on the fifth day led to higher pH. On the 5th day of storage, V2-sub-variants showed lower pH
thanV1-sub-variants. On the 10th day, in V1-sub-variants the pH ranged from 4.30 in V1.3 to 4.39
in V1.2 and in V2-sub-variants, and it was from 4.13 in V2.3 to 4.25 in V2.2. Added serum protein
powder stirred pH. On the 15th day, of the V1-sub-variants, the lowest active acidity was found in
V1.3 with pH 4,25, and the highest in V1.2 and V1.4 with a pH of 4.33.
From the V2-sub-variants, the lowest active acidity on the 15th day was found in V2.3 with a pH of
4.06, and the highest was established in V2.1 and V2.2 and 4.17 pH units. The addition of serum
proteins in the V2-sub-variant on the fifteenth day showed impact and led to higher pH in yogurt.
Based on the above mentioned, it can be concluded that all the sub-alternatives of yogurt showed
the greatest reduction of the active acidity on the 5th day of storage, which ranged from 3.7 to 5.3%,
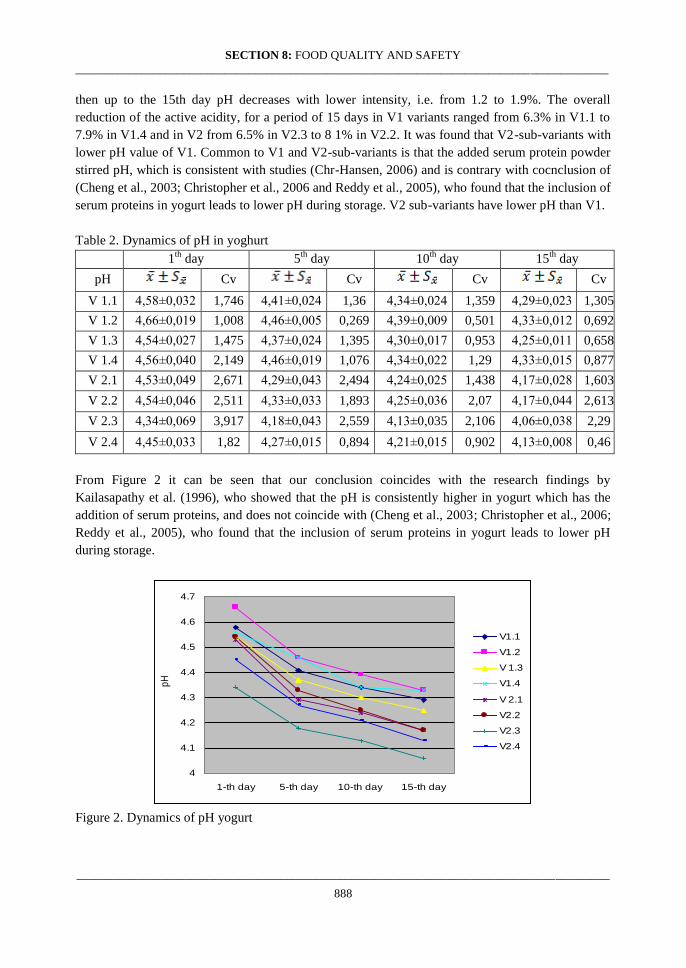
SECTION 8: FOOD QUALITY AND SAFETY
_________________________________________________________________________________________
_________________________________________________________________________________________
888
then up to the 15th day pH decreases with lower intensity, i.e. from 1.2 to 1.9%. The overall
reduction of the active acidity, for a period of 15 days in V1 variants ranged from 6.3% in V1.1 to
7.9% in V1.4 and in V2 from 6.5% in V2.3 to 8 1% in V2.2. It was found that V2-sub-variants with
lower pH value of V1. Common to V1 and V2-sub-variants is that the added serum protein powder
stirred pH, which is consistent with studies (Chr-Hansen, 2006) and is contrary with cocnclusion of
(Cheng et al., 2003; Christopher et al., 2006 and Reddy et al., 2005), who found that the inclusion of
serum proteins in yogurt leads to lower pH during storage. V2 sub-variants have lower pH than V1.
Table 2. Dynamics of pH in yoghurt
1th
day 5th
day 10th
day 15th
day
pH Cv Cv Cv Cv
V 1.1 4,58±0,032 1,746 4,41±0,024 1,36 4,34±0,024 1,359 4,29±0,023 1,305
V 1.2 4,66±0,019 1,008 4,46±0,005 0,269 4,39±0,009 0,501 4,33±0,012 0,692
V 1.3 4,54±0,027 1,475 4,37±0,024 1,395 4,30±0,017 0,953 4,25±0,011 0,658
V 1.4 4,56±0,040 2,149 4,46±0,019 1,076 4,34±0,022 1,29 4,33±0,015 0,877
V 2.1 4,53±0,049 2,671 4,29±0,043 2,494 4,24±0,025 1,438 4,17±0,028 1,603
V 2.2 4,54±0,046 2,511 4,33±0,033 1,893 4,25±0,036 2,07 4,17±0,044 2,613
V 2.3 4,34±0,069 3,917 4,18±0,043 2,559 4,13±0,035 2,106 4,06±0,038 2,29
V 2.4 4,45±0,033 1,82 4,27±0,015 0,894 4,21±0,015 0,902 4,13±0,008 0,46
From Figure 2 it can be seen that our conclusion coincides with the research findings by
Kailasapathy et al. (1996), who showed that the pH is consistently higher in yogurt which has the
addition of serum proteins, and does not coincide with (Cheng et al., 2003; Christopher et al., 2006;
Reddy et al., 2005), who found that the inclusion of serum proteins in yogurt leads to lower pH
during storage.
4
4.1
4.2
4.3
4.4
4.5
4.6
4.7
1-th day 5-th day 10-th day 15-th day
pH
V1.1
V1.2
V 1.3
V1.4
V 2.1
V2.2
V2.3
V2.4
Figure 2. Dynamics of pH yogurt

SECTION 8: FOOD QUALITY AND SAFETY
_________________________________________________________________________________________
_________________________________________________________________________________________
889
Impact on lactose in yogurt
Lactose is a disaccharide that is composed of D-glucose and D-galactose. Hydrolysis of lactose
depends on the enzyme concentration, temperature, pH and the presence of other ingredients. The
presence of galactose is slowing down the action of enzymes, and thus hydrolysis of lactose. When
fermentation takes place under the influence of homo-fermenting sour-milk bacteria, lactic acid
develops from lactose. On the first day of storage of the yogurt, lactose content ranged from 2.57%
in V1.4, V2.3 and V2.4 to 2.85%. in V2.1. It was found that on the first day of the addition of serum
proteins, it did not affect the change of the amount of lactose in yogurt. You could say that V2-sub-
variants with slightly lower lactose value of V1, which corresponds to the results obtained for the
dynamics of acidity. In the fifth day of storage of yogurt, lactose content in V1-variants is reduced
by 15.9 to 31.3% and ranged from 2.11% for V1.1 and V1.3 to 2.22% in V1. 2, while the V2
decrease was from 23.5 to 24, 5 and was in the range of 1.93% in V2.4 to 2.16% in V2.1. Appendix
serum protein powder 5th day led to a higher content of lactose in yogurt only in V1.1. In addition,
in most sub-alternatives of V2, lactose content was lower than V1. In the period from 5 to 10 days
the storage continues the transformation of lactose into lactic acid and its reduction from 1.14% in
V1.3 and V2.3 to 1.54% in V1.2. Sub-variants with the addition of serum proteins had a higher
lactose content. Sub-variants V2 in most cases on the 10th day showed lactose content equal to
those of V1. The largest decrease of lactose observed was in the period from the 10th to the 15th
day when lactose percentage ranges from 0.17% in V1.3, V2.3 and V2.4 to 0.34% in V1.2.
Moreover, the addition of serum proteins did not influence the increase of the content of lactose in
V2.2 and V2.4. Sub-variants V2, on 15th day had lower or equal lactose content of sub-variants V1.
Table 3. Dynamics of lactose in yogurt
1th
day 5th
day 10th
day 15th
day
Lactose Cv Cv Cv Cv
V 1.1 2,68±0,035 3,246 2,11±0,096 11,232 1,42±0,094 16,338 0,28±0,036 32,285
V 1.2 2,79±0,035 3,143 2,22±0,639 7,049 1,54±0,124 19,746 0,34±0,002 1,5
V 1.3 2,62±0,035 3,347 2,11±0,037 4,402 1,14±0,035 7,692 0,17±0 0,0
V 1.4 2,57±0 0 2,16±0,073 8,365 1,25±0,094 18,576 0,23±0,037 40
V 2.1 2,85±0,035 3,077 2,16±0,073 8,365 1,42±0,094 16,338 0,28±0,036 32,285
V 2.2 2,68±0,035 3,272 2,05±0,063 7,634 1,48±0,094 15,689 0,23±0,037 40,391
V 2.3 2,57±0,062 5,914 1,94±0,096 12,221 1,14±0,035 7,692 0,17±0 0,0
V 2.4 2,57±0,124 11,832 1,93±0,071 9,093 1,25±0,035 7,016 0,17±0 0
Common to V1 and V2- sub-variants is that the addition of serum protein powder had no constant
influence to the lactose content, although most sub-alternatives with the addition of serum protein
powder showed a higher content of lactose. Sub-variants V2 in multiple iterations, with lower
lactose content of V1- sub-variants while storage period of fifteen days led to a significant reduction
of the lactose content. According to the above graph represented in chart 3, it can be concluded that
the content of lactose during storage of yogurt steadily declines. Serum protein powder did not have
a constant influence in sub-variants that were added (V1.2, V1.4, V2.2 and V2.4).
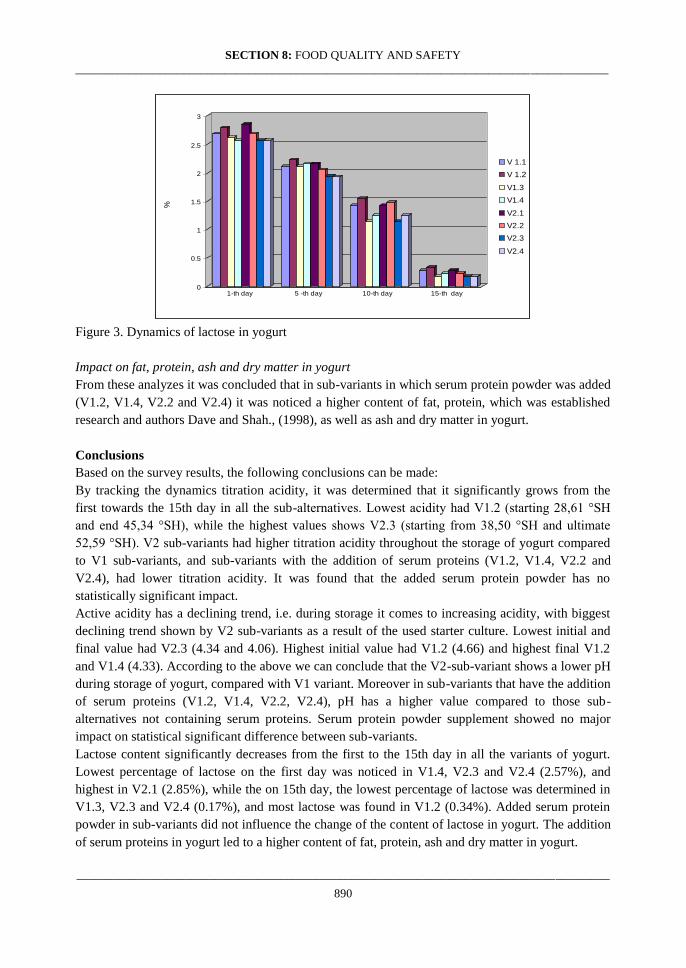
SECTION 8: FOOD QUALITY AND SAFETY
_________________________________________________________________________________________
_________________________________________________________________________________________
890
0
0.5
1
1.5
2
2.5
3
%
1-th day 5 -th day 10-th day 15-th day
V 1.1
V 1.2
V1.3
V1.4
V2.1
V2.2
V2.3
V2.4
Figure 3. Dynamics of lactose in yogurt
Impact on fat, protein, ash and dry matter in yogurt
From these analyzes it was concluded that in sub-variants in which serum protein powder was added
(V1.2, V1.4, V2.2 and V2.4) it was noticed a higher content of fat, protein, which was established
research and authors Dave and Shah., (1998), as well as ash and dry matter in yogurt.
Conclusions
Based on the survey results, the following conclusions can be made:
By tracking the dynamics titration acidity, it was determined that it significantly grows from the
first towards the 15th day in all the sub-alternatives. Lowest acidity had V1.2 (starting 28,61 °SH
and end 45,34 °SH), while the highest values shows V2.3 (starting from 38,50 °SH and ultimate
52,59 °SH). V2 sub-variants had higher titration acidity throughout the storage of yogurt compared
to V1 sub-variants, and sub-variants with the addition of serum proteins (V1.2, V1.4, V2.2 and
V2.4), had lower titration acidity. It was found that the added serum protein powder has no
statistically significant impact.
Active acidity has a declining trend, i.e. during storage it comes to increasing acidity, with biggest
declining trend shown by V2 sub-variants as a result of the used starter culture. Lowest initial and
final value had V2.3 (4.34 and 4.06). Highest initial value had V1.2 (4.66) and highest final V1.2
and V1.4 (4.33). According to the above we can conclude that the V2-sub-variant shows a lower pH
during storage of yogurt, compared with V1 variant. Moreover in sub-variants that have the addition
of serum proteins (V1.2, V1.4, V2.2, V2.4), pH has a higher value compared to those sub-
alternatives not containing serum proteins. Serum protein powder supplement showed no major
impact on statistical significant difference between sub-variants.
Lactose content significantly decreases from the first to the 15th day in all the variants of yogurt.
Lowest percentage of lactose on the first day was noticed in V1.4, V2.3 and V2.4 (2.57%), and
highest in V2.1 (2.85%), while the on 15th day, the lowest percentage of lactose was determined in
V1.3, V2.3 and V2.4 (0.17%), and most lactose was found in V1.2 (0.34%). Added serum protein
powder in sub-variants did not influence the change of the content of lactose in yogurt. The addition
of serum proteins in yogurt led to a higher content of fat, protein, ash and dry matter in yogurt.
SECTION 8: FOOD QUALITY AND SAFETY
_________________________________________________________________________________________
_________________________________________________________________________________________
891
References
Cheng L.J., Augustin M.A., Glagovskaia, O., Clarke, P.T., Lawrence A. (2003). Use of blends of
skim milk and sweet whey protein concentrates in reconstituted yogurt. The Australian J. Dairy
Technology. 58, 1, 30-35
Christopher Vasey et al., (2006). The Acid-Alkaline Diet for Optimum Health: Restore Your Health
by Creating pH Balance in Your Diet, Tempe, AZ USA
Chr-Hansen.(2006). Yo-Flex EN Technical Brochure revised September 2006.doc/13:36 Yo-Flex®
revised edition, September 2006
Dave, R. I., and Shah, N. P. (1998). Ingredient supplementation effects on viability of probiotic
bacteria in yogurt. J. Dairy Sci 81:2804–2816
FIL-IDF. (1969). Present stage of production, collection, treatment, processing and distribution of
various milk and milk products in the warm countries. Ann. Bull. Part IV, Bruxelles-B
Kailasapathy, K., Supriadi, D., Hourigan, J.A. (1996). Effect of partially replacing skim milk
powder with whey protein concentrate on buffering capacity of yoghurt. Aust. J. Dairy Technol.
(2);51(2):89–93
Kosikowski, R., Flores, J., F.V.(1984). Func tiona l prope r t i e s of dr i ed skimmi
lkultrafiltrationretentates. J. Dairy Sci. (BUFP\'1) 67: 77
Reddy, V.P., Reddy, I.S., (2005). Influence of whey protein concentrate on the viability of
Lactobacillus acidophilus in probiotic yoghurt.Ind. J. Dairy. Sci 58:333-336

SECTION 8: FOOD QUALITY AND SAFETY
_________________________________________________________________________________________
_________________________________________________________________________________________
892
ВЛИЈАНИЕ НА СЕРУМ ПРОТЕИНИ НА КВАЛИТЕТОТ, ХЕМИСКИТЕ И
БИОХЕМИСКИТЕ СВОЈСТАВ НА ЈОГУРТОТ
Вања Г. Маџоска, Соња Д. Србиновска, Стерја М. Стерјовски
Апстракт
Со цел да се определи влијанието на серум протеините врз квалитетот, хемиските и
биохемиските својства на јогуртот, во текот на истражувањето, се применети две различни
стартер култури YF-L 811 (В1) и YC-381 (В2) и две температури на инокулација и тоа на 35-
37°С (В1.1 и В2.1 ) и 41-43°С (В1.3 и В2.3), со и без додавање на серум протеини во прав
(В1.2, В1.4 и В2.2 и В2.4). Како суровина е користено кравјо млеко, пастеризирано на
температура од 85°С за време од 30 минути. Лагерувањето траеше 15 дена на температура од
4°С, при што содржината на млечната маст, пепелта, протеините и сувата материја се
анализирани на 1-от и 15-от ден, a лактозата, титрациската и активната киселост на 1-от, 5-от
ден, 10-от, и 15-от ден од лагерувањето на јогуртот. Врз основа на добиените резултати, од
анализите е определено дека: Tитрациската киселост значително расте кај сите подваријанти,
при што најниска киселост има В1.2 (од 28,61°ЅН до 45,34°ЅН), додека највисоки вредности
покажува В2.3 (од 38,50°ЅН до 52,59°ЅН). В2 подваријантите, имаат повисока титрациска
киселост, за цело време на складирање на јогуртот, во однос В1, а подваријантите со додаток
на серум протеини имаат пониска титрациска киселост. Активната киселост има опаѓачки
тренд, при што е поголема кај В2 подваријантите, како резултат на употребената стартер
култура, а подваријантите, со додаток на серум протеини, имаат повисока рН вредност.
Содржината на лактоза значително опаѓа од првиот до 15-от ден кај сите видови на јогурт. Во
првиот ден, содржината на лактозата е во граници од 2,57 % (В1.4, В2.3 и В2.4) до 2,85 %,
(В2.1), а на 15-от ден од 0,17 % (В1.3, В2.3 и В2.4) до 0,34 % (В1.2). Додатокот на серум
протеините не влијае врз промената на содржината на лактозата во јогуртот. Додатокот на
серум протеини во јогуртот, доведе до повисока содржина на масти, протеини, пепел и сува
материја кај јогуртот.
Клучни зборови: јогурт, температура на ферментација, серум протеини, стартер култури,
складирање.
SECTION 8: FOOD QUALITY AND SAFETY
_________________________________________________________________________________________
_________________________________________________________________________________________
893
UDC:663.252:66.083.09
Original scientific paper
DETERMINATION OF PHENOLIC COMPOUNDS AND ANTIOXIDANT AND
ANTIMICROBIAL POTENTIALS OF SOME SERBIAN RED WINES
Aleksandra N. Radovanović1, Branimir S. Jovančićević
1, Blaga C. Radovanović
2, Tatjana
Mihajilov-Krstev2
1Faculty of Chemistry, University of Belgrade, Serbia
2Faculty of Science and Mathematics, University of Niš, Serbia
*e-mail: [email protected]
Abstract
Wines contain a number of biologically active compounds and are subject of continual interest due
to their beneficial effects on human health. The aim of this study was to determine the concentration
of the phenolic compounds and antioxidant and antimicrobial activities of Vranac wines, produced
from different Serbian wineries. The phenolic concentration was analyzed by high-performance
liquid chromatographic (HPLC) method with photodiode array and fluorescence detection. The
antioxidant activity was estimated by using 2,2`-diphenyl-1-picrylhydrazyl (DPPH) assay. Vranac
wines were screened in vitro for antimicrobial activity using broth microdilution and disc agar
diffusion techniques against six gram-positive and six-gram-negative bacterial strains.
Key words: Vranac wines, phenolic compounds, antioxidant activity, antimicrobial activity.
Introduction
The concentration of different phenolic compounds in grapes and their corresponding wines varies
according to the morphological and agronomical characteristics of the grapevine cultural and the
winemaking technique employed (Ginjon et al., 2011; Lachman et al., 2007; Villano et al., 2006).
The wines contain a number of biologically active compounds and are subject of continual interest
due to their beneficial effects on human health. Recent studies indicate that consuming small
amounts of red wine on a regular basis reduces the risk of coronary heart disease and
arteriosclerosis, and this medical quality is connected to the antioxidant properties of polyphenols
(Braicu et al., 2011; Cliff et al., 2007; Cushnie et al., 2011; German et al., 2000; Papadopoulou et
al., 2005; Pereira et al., 2009; Radovanović et al., 2009; Renaud et al., 1992).
In our earlier studies on Serbian red wines we showed that phenolic contents can be used to identify
the biological properties of red wines ( Radovanović et al., 2009). The phenolic fingerprint might be
a useful tool for the classification of wines quality.
The enhancement of red wine biological properties may therefore have importance in a competitive
market environment.
The aim of this study was to evaluate the relationship between phenolic profile and antioxidant and
antimicrobial activities of Serbian Vranac wines, produced from Rubin Winery (Kruševac) and
Vino Župa Winery (Aleksandrovac).
SECTION 8: FOOD QUALITY AND SAFETY
_________________________________________________________________________________________
_________________________________________________________________________________________
894
Material and methods
Chemicals and wines samples
Acetonitrile and formic acid (HPLC-grade) were obtained from Merck (Darmstadt, Germany);
HPLC-grade methanol were purchased from Carlo Erba Reagent (Milan, Italy); gallic, caffeic, p-
coumaric and ferullic acid, catechin, procyanidin B2, epicatechin, quercetin-3-glucoside, rutin,
morin, quercetin, naringin, malvidin-3-glucoside and resveratrol were supplied from Sigma
Chemical Co. (St. Louis, MO). The used reagents were of analytical quality. Serbian wines selected
for this study were: red wine (Vranac1) from Rubin Winery (Kruševac) and red wine (Vranac 2)
from Vino Župa Winery (Aleksandrovac), vintage 2009.
Microbial strains and inocula preparation
The antimicrobial activity of the wine samples was evaluated using laboratory control six species of
multi-resistant entero bacteria strains obtained from the American Type Culture Collection. All
these micro-organisms were gram-positive: Clostridium perfringens ATCC 19404, Bacillus subtillis
ATCC 6633, Staphylococcies aureus ATCC 8538, Listeria inocula ATCC 13076, Sarcina lutea
ATCC 9341 and Micrococcus flavus ATCC 40240, and gram-negative: Escherichia coli ATCC
25922, Pseudomonas aeruginosa ATCC 9027, Salmonella enteritidis ATCC 13076, Shigella sonnei
ATCC 25931, Klebsiella pneumonia ATCC 10031and Proteus vulgaris ATCC 8427. The inocula of
the bacterial strains were prepared from overnight broth cultures and suspensions were adjusted to
0.5 McFarland standard turbidity (corresponding to 107-108 CFU/ml, depending on genera -
consensus standard by the NCCLS). The plate was incubated for 24 h at 37C. All experiments were
performed in triplicate.
High Performance Liquid Chromatography analysis (HPLC)
Phenolic compounds contents were determined by using HPLC, by direct injection of each wine
sample into an Agilent 1200 chromatographic system - photodiode array detector (DAD) with
radiofrequency identification tracking technology for flow cells and fluorescence detector for
multiwavelength detection with online acquisition of excitation (Ex) and emission (Em) spectra, and
a Chem-Station software. Elution was carried out in gradient mode using two solvent mixtures: (A)
formic acid/water and (B) acetonitrile/formic acid/water. The elution profile was as follows: from 0
to 28 min, 0-10.0% B, from 28 to 35 min, 10-25% B, from 35 to 40 min, 25-50% B, from 40 to 45
min, 50-80% B, and for last 10 min again 0% B. Aliquots of 5 µL were injected into a 4.6×250 mm
RPC-18 column (Zorbax Eclipse XDB-C18) with 5 µm particle size. The flow rate was 0.8 mL min-
1. The detection wavelengths were 280, 320, 360 nm for UV, and 275/322 nm (λEx/λEm) for
fluorescence-detection. Identification and quantification of various phenolic compounds were made
by using calibration curves obtained with the standard solutions of pure phenolic compounds in the
same conditions as the wine samples. The results are expressed in mg per L of
sample (mg L
-1).
Antioxidant activity
Antioxidant activity of test wine samples was determined by using modified DPPH free radical
scavenging method (Radovanović et al., 2010; Singleton et al., 1965). This antioxidant assay is
based on the measurement of DPPH radical colour loss due to the changes in absorbance at 515 nm,
caused by the reaction of DPPH radical with the test sample. The radical scavenging activity fifty
(EC50 values) corresponding to the amount of samples necessary to decrease by 50% the amount of
free radical DPPH was determined by plotting the scavenging activity against the sample
concentration, and expressed as ml of wine sample per g of the DPPH-radical.
SECTION 8: FOOD QUALITY AND SAFETY
_________________________________________________________________________________________
_________________________________________________________________________________________
895
Antimicrobial activity
Disc agar diffusion method
Preliminary antimicrobial tests were carried out by disc diffusion method using 100 μL of bacterial
suspension spread on Mueller-Hinton agar (MHA, Torlak, Serbia) in sterilized Petri dishes (90 mm
in diameter). The discs (9 mm in diameter, HiMedia Laboratories Pvt. Limited) were impregnated
with 50 μL of the test samples and placed on the inoculated agar (20 mL). The inoculated plates
were incubated for 24 h at 37 0C. Reference antibiotics, Chloramphenicol (30 μg) and Streptomycin
(30 μg) served as a positive control, while the solvent (water - 50 μL/disc) was used as a negative
control. It was found that the solvent (water) showed no inhibitory activity. The diameters of
inhibition zones produced by these extracts were then compared to standard antibiotics. All the tests
were performed in triplicate. Antibacterial activity was evaluated by measuring the zone of
inhibition (in mm) against the test bacterial strains. The values shown are the means from duplicate
experiments performed for the six strains per species.
Micro-well dilution method
A broth microdilution method was used to determine the minimum inhibitory concentration (MIC)
and minimum bactericidal concentration (MBC) according to the National Committee for Clinical
Laboratory Standards (NCCLS, 2003). Two growth controls consisting of medium with water
(negative control) and medium with Chloramphenicol and Streptomycin (positive control) were also
included. The microbial growth was determined by absorbance at 620 nm using the universal micro
plate reader (Thermo Lab systems, Multiskan EX, Software for Multiscan ver.2.6.). MIC was
defined as the lowest concentration of wine samples at which microorganisms showed no visible
growth. In order to determine MBC, broth was taken from each well without visible growth and
inoculated on Mueller Hinton agar (MHA) for 24 h at 37 0C. The MBC is defined as the lowest
concentration of the wine samples at which 99.9% of inoculated microorganisms were killed. The
values shown are the means from duplicate experiments performed for the six strains per species.
Statistical analysis
Three analytical replicates were carried out on each sample wine. Measurements were averaged and
results are given as mean ± standard deviation.
Results and discussion
Phenolic profile of grape and wine (determined by the relative proportions of the different phenolic
compounds) is characteristic for each corresponding grape variety and wine. Moreover,
concentrations of different phenolic compounds can vary significantly within grape cultivars
according to environmental conditions. In addition, during the process of wine preparation,
significant changes take place in the composition and content of phenolic compounds, as a result of
fruit disintegration as well as wine fermentation and aging (Cliff et al., 2007; Ginjon et al., 2011;
Lachman et al., 2007; Luiz, 2011; Mazza et al., 1999; Villano et al., 2006). Phenolic (gallic acid)
and hydroxycinnamate acids (t-caftaric acid, t-coutaric acid, caffeic acid p-coumaric acid and
ferullic acid) contents of tested Vranac wines are recorded at 280 and 320 nm. Flavan-3-ol contents:
(+)-catechin, procyanidin B2 and (-)-epicatechin contents of tested wines are recorded by a
fluorescence detector at 275/322 nm (λEx/λEm).Then, flavonol and flavonol glucoside contents of
tested wines: quercetin-3-glucoside, rutin, morin and quercetin are recorded at 360 nm, naringin at
320 nm and the anthocyanin and malvidin-3-glucosideis recorded at 520 nm.
SECTION 8: FOOD QUALITY AND SAFETY
_________________________________________________________________________________________
_________________________________________________________________________________________
896
All phenolic compounds, were identified by comparison of their retention times (from
chromatograms recorded by fluorescence detection) and UV-VIS spectra with those of standards.
The content of phenolic compounds for investigated Vranac wines determined by HPLC analysis
are presented in Table 1.
Table 1. Content of phenolic compounds (mg L-1
) of tested Vranac wines determined by HPLC
analysis
Phenolic compounds Vranac 1 Vranac 2
Gallic acid 64.33 ± 0.67 47.53 ± 0.34
t-Caftaric acid 23.23 ± 0.97 7.56 ± 0.88
t-Coutaric acid 8.14 ± 0.98 1.83 ± 0.88
Caffeic acid 3.03 ± 0.55 2.95 ± 0.88
p-Coumaric acid 1.66 ± 0.55 1.59 ± 0.39
Ferulic acid 1.66 ± 0.55 1.59 ± 0.39
(+)-Catechin 27.61 ± 0.97 18.35 ± 0.76
Procyanidin B2 13.67 ± 0.47 13.22 ± 0.79
(-)-Epicatechin 12.37 ± 0.67 6.68 ± 1.01
Quercetin-3-gl. 5.36 ± 0.95 2.88 ± 0.57
Rutin 3.13 ± 0.84 0.15 ± 0.06
Morin 2.33 ± 0.92 1.82 ± 0.36
Quercetin 1.47 ± 0.82 1.12 ± 0.73
Naringin 3.05 ± 1.03 2.11 ± 0.46
Resveratrol 0.55 ± 0.02 0.41 ± 0.03
Malvidin-3-gl. 91.35 ± 0.33 53.98 ± 0.42
In these tested Vranac wines gallic acid content was predominant, which is in agreement with
published data for a number of other wines (Cliff et al., 2007; Ginjon et al., 2011; Lachman et al.,
2007; Luiz, 2011; Mazza et al., 1999; Papadopoloulou et al., 2005). Flavanol accumulation in wines
results from enzymatic preparation, yeast fermentation and oxidative polymerization reactions.
According to data shown in Table 1, the contents of (+)-catechin and quercetin-3-glucoside, also are
predominant in investigated wines, which is in agreement with published data (Ginjon et al., 2011;
Luiz, 2011; Radovanovic et al., 2010; Villano et al., 2006).
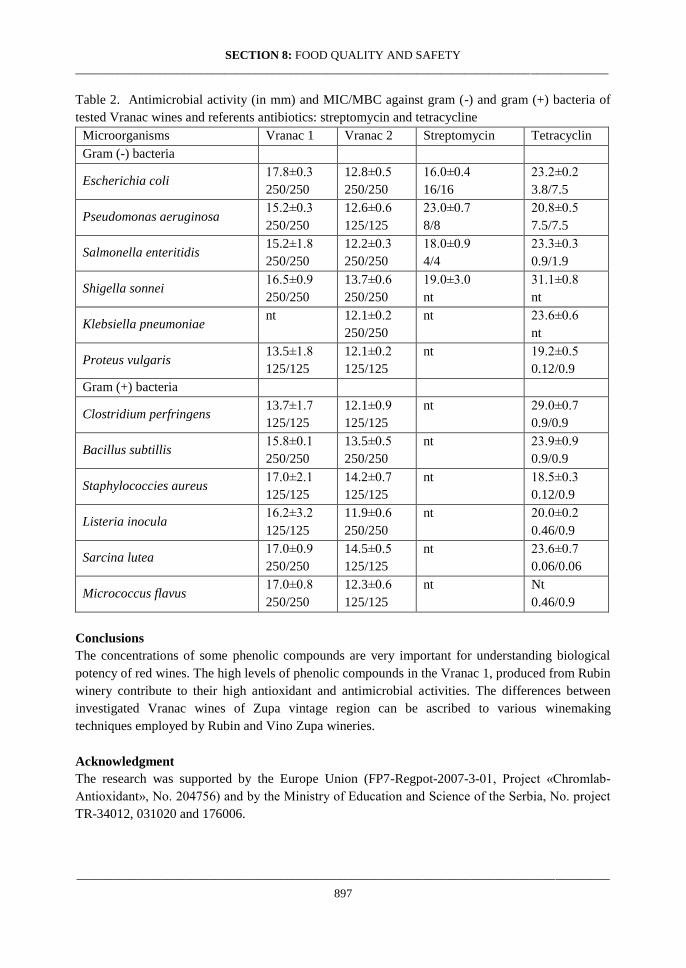
SECTION 8: FOOD QUALITY AND SAFETY
_________________________________________________________________________________________
_________________________________________________________________________________________
897
Table 2. Antimicrobial activity (in mm) and MIC/MBC against gram (-) and gram (+) bacteria of
tested Vranac wines and referents antibiotics: streptomycin and tetracycline
Microorganisms Vranac 1 Vranac 2 Streptomycin Tetracyclin
Gram (-) bacteria
Escherichia coli 17.8±0.3
250/250
12.8±0.5
250/250
16.0±0.4
16/16
23.2±0.2
3.8/7.5
Pseudomonas aeruginosa 15.2±0.3
250/250
12.6±0.6
125/125
23.0±0.7
8/8
20.8±0.5
7.5/7.5
Salmonella enteritidis 15.2±1.8
250/250
12.2±0.3
250/250
18.0±0.9
4/4
23.3±0.3
0.9/1.9
Shigella sonnei 16.5±0.9
250/250
13.7±0.6
250/250
19.0±3.0
nt
31.1±0.8
nt
Klebsiella pneumoniae nt
12.1±0.2
250/250
nt 23.6±0.6
nt
Proteus vulgaris 13.5±1.8
125/125
12.1±0.2
125/125
nt 19.2±0.5
0.12/0.9
Gram (+) bacteria
Clostridium perfringens 13.7±1.7
125/125
12.1±0.9
125/125
nt 29.0±0.7
0.9/0.9
Bacillus subtillis 15.8±0.1
250/250
13.5±0.5
250/250
nt 23.9±0.9
0.9/0.9
Staphylococcies aureus 17.0±2.1
125/125
14.2±0.7
125/125
nt 18.5±0.3
0.12/0.9
Listeria inocula 16.2±3.2
125/125
11.9±0.6
250/250
nt 20.0±0.2
0.46/0.9
Sarcina lutea 17.0±0.9
250/250
14.5±0.5
125/125
nt 23.6±0.7
0.06/0.06
Micrococcus flavus 17.0±0.8
250/250
12.3±0.6
125/125
nt Nt
0.46/0.9
Conclusions
The concentrations of some phenolic compounds are very important for understanding biological
potency of red wines. The high levels of phenolic compounds in the Vranac 1, produced from Rubin
winery contribute to their high antioxidant and antimicrobial activities. The differences between
investigated Vranac wines of Zupa vintage region can be ascribed to various winemaking
techniques employed by Rubin and Vino Zupa wineries.
Acknowledgment
The research was supported by the Europe Union (FP7-Regpot-2007-3-01, Project «Chromlab-
Antioxidant», No. 204756) and by the Ministry of Education and Science of the Serbia, No. project
TR-34012, 031020 and 176006.

SECTION 8: FOOD QUALITY AND SAFETY
_________________________________________________________________________________________
_________________________________________________________________________________________
898
References
Braicu C., Pilecki V., Balacescu O., Irimie A., Neagoe J.B. (2011). The relations between biological
activities and structure of flavan-3-ols. International Journal of Molecular Sciences, 12, 9342–9353.
Cliff M.A., King M.C., Schlosser J. (2007). Anthocyanin, phenolic composition and sensory
analysis of BC commercial red wines. Food Research International, 40, 92–100.
Cushnie Y.P.T., Lamb A.J. (2011). Recent advances in understanding of the antibacterial properties
of flavonoids. International Journal of Antimicrobial Agents, 38, 99–107.
German J.B., Walzem R.L. (2000). The health benefits of wine. Annual Review of Nutrition, 20,
561–593.
Ginjon I., D’Arcy B., Caffin N., Gidley M. (2011). Phenolic compound profiles in selected
Queensland red wines at all stages of the wine-making process. Food Chem. 125, 823–834.
Lachman J., Sulc M., Schilla M. (2007). Comparison of the total antioxidant status of Bohemian
wines during the wine-making process. Food Chemistry, 103, 802–807
Luiz M. (2011). Proanthocyanidin profile and antioxidant capacity of Brazilian Vitis vinifera red
wines. Food Chemistry, 126, 213–220.
Mazza G., Fukumoto P., Delaquis B., Girard B., Ewert B. (1999). Anthocyanins, Phenolics, and
Color of Cabernet Franc, Merlot, and Pinot Noir Wines from British Columbia, Journal of
Agricultural and Food Chemistry, 47, 4009–4017
Papadopoulou C., Soulti K., Roussis I.G. (2005). Potential antimicrobial activity of red and white
wine phenolic extracts against strains of S. aureus, E.coli and C.albicans. Food Technology and
Biotechnololy, 43, 41–46.
Pereira D.M., Valentao P., Pereira J.A., Andrade P.B. (2009). Phenolics: From Chemistry to
Biology. Molecules, 14, 2202–2211.
Radovanović A., Radovanović B., Jovančičević B. (2009). Free radical scavenging and
antibacterial activities of southern Serbian red wines. Food Chemistry, 117, 326-333.
Radovanović B.C., Radovanović A.N., Souquet J.M. (2010). Phenolic profile and free radical-
scavenging activity of Cabernet Sauvignon wines of different geographical origins from the Balkan
region. Journal of Science of Food and Agriculture, 90, 2455-2461.
Renaud, S.C., de Lorgeril M. (1992). Wine, alcohol, platelets, and the French paradox for coronary
heart disease. Lancet 339, 1523-1526.
Singleton V.L., Rossi J.R. (1965). Colorimetry of total phenolics with phosphomolybdic-
phosphotungstic acis. American Journal of Enology and Viticulture, 16, 144-158.
Villano D., Fernandez-Pachon M.S., Troncoso A.M., Garcia-Parrilla M.C. (2006). Influence of
enological practices on the antioxi dant activity of wines. Food Chemistry, 95, 394–404.
SECTION 8: FOOD QUALITY AND SAFETY
_________________________________________________________________________________________
_________________________________________________________________________________________
899
ОПРЕДЕЛУВАЊЕ НА ФЕНОЛНИ СОЕДИНЕНИЈА И АНТИОКСИДАНС И
АНТИМИКРОБЕН ПОТЕНЦИЈАЛИ НА НЕКОИ СРПСКИ ЦРВЕНИ ВИНА
Александра Н. Радовановиќ, Бранимир С. Јовановиќ, Блага Ц. Радовановиќ, Татјана
Михајилов-Крстев
Апстракт
Вината содржат бројни биолошки активни супстанци и се предмет на интерес заради нивните
позитивни ефекти врз здравјето на луѓето. Целта на овој труд е да се определи
концентрацијата на фенолните соединенија, антиоксиданси и антимикробна активност на
виното Вранец, произведен од различни Српски винарии. Концентрацијата на феноли е
анализирана со метод на високо-ефикасна течна хроматографија (HPLC) со фотодиодна
флуоресцентна детекција. Антиоксидациската активност е проценета со користење на 2,2`-
дифенил-1-пикрилхидразил (DPPH). Антимикробната активност на вината Вранец кон шест
Грам-позитивни и шест Грам-негативни бактерии беше прикажана in vitro со употреба на
микродилуционен метод во бујон и диск-дифузионен метод на агар.
Клучни зборови: вина Вранец, фенолни соединенија, антиоксидациска активност,
антимикробна активност.
SECTION 8: FOOD QUALITY AND SAFETY
_________________________________________________________________________________________
_________________________________________________________________________________________
900
UDC:632.122.1:641(497.11)
Original scientific paper
ESTIMATION OF DIETARY INTAKES OF PB, CD AND AS THROUGH CONSUMPTION
OF MAJOR FOOD ITEMS OF SERBIAN MARKET BASKET
Biljana Škrbić1*
, Jelena Cvejanov1, Zlatica Predojević
1, Nataša Mrmoš
1, Jelena Živančev
1
1Faculty of Technology, University of Novi Sad, Serbia
*е-mail: [email protected]
Abstract
The aim of this study was to estimate the dietary intakes of three toxic heavy elements through
consumption of daily doses of the main food items in the Serbian market basket like bread, meat,
milk, vegetables, fruits, etc. The contents of lead (Pb), cadmium (Cd) and arsenic (As) were
determined in different food samples by atomic absorption spectrometry with graphite furnace after
the acid digestion in microwave unit. Samples were collected from supermarkets in Novi Sad,
Serbia. The element intakes were calculated for average adult consumers based on consumption
data of Serbian market basket. The relative shares of the estimated intakes of Pb, Cd and As with
respect to the relevant provisional tolerable daily intakes were discussed and compared to the
available literature data in order to point out the food items from the Serbian market with the highest
potential for health risk through the dietary intake.
Key words: toxic elements, GFAAS, dietary intake.
Introduction
The presence of heavy elements in the environment and food chain represents a serious problem,
which is recognized in most of the countries around the world. Many aspects related to food safety
and quality control have attracted considerable consumer attention in recent years. Thus, it is
imperative that the presence of heavy elements in foodstuffs be controlled in accordance with the
defined maximum residue levels. The monitoring of the heavy element levels in food samples as
well as the estimation of these food contaminants intake are essential for risk evaluation and
investigation of possible contamination that would represent a health hazard. A risk of
contamination of the food chain may arise when heavy elements accumulate in food at
concentrations above the threshold levels believed to threaten the health of humans. A number of
serious health problems can develop as a result of excessive uptake of dietary heavy elements.
The World Health Organization (WHO), through its Global Environment Monitoring System—
Food Contamination Monitoring and Assessment Programme (GEMS/Food), is encouraging
countries to undertake total diet studies as the most cost-effective method for assessing dietary
exposure to chemical contaminants in the diet. Representative datasets on consumption of foods are
combined with data on concentration in foods of the compounds of interest, to derive the average
dietary exposure.
There have been scarce data on the chemical safety status of food products on the Serbian market.
In fact, there is no comprehensive study dealing with levels of heavy elements in foodstuffs
consumed in Serbia nor the detailed assessment of the dietary exposure of the Serbian population.
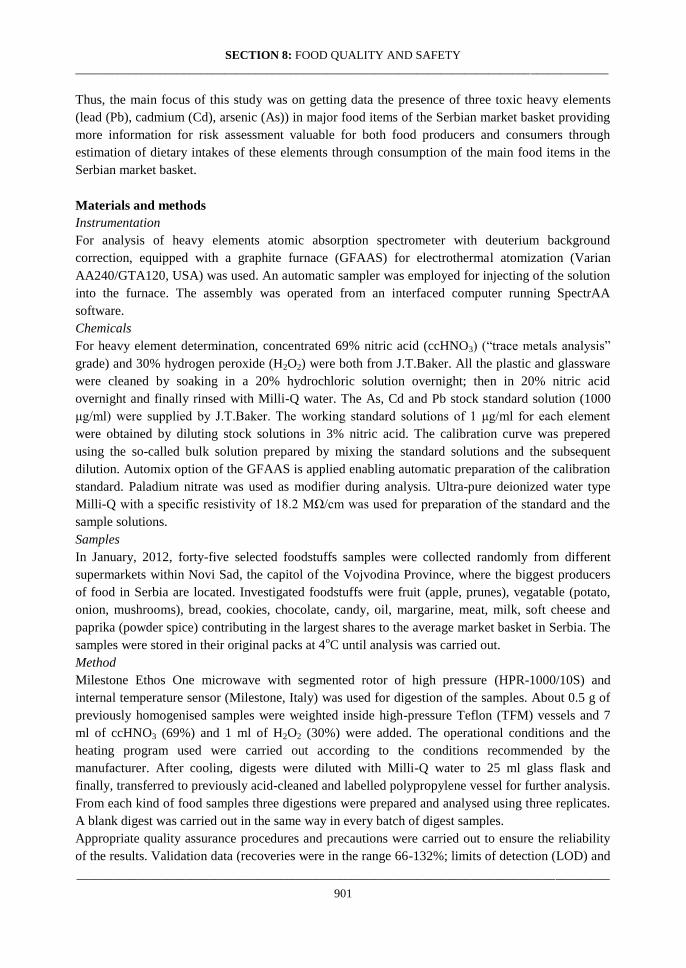
SECTION 8: FOOD QUALITY AND SAFETY
_________________________________________________________________________________________
_________________________________________________________________________________________
901
Thus, the main focus of this study was on getting data the presence of three toxic heavy elements
(lead (Pb), cadmium (Cd), arsenic (As)) in major food items of the Serbian market basket providing
more information for risk assessment valuable for both food producers and consumers through
estimation of dietary intakes of these elements through consumption of the main food items in the
Serbian market basket.
Materials and methods
Instrumentation
For analysis of heavy elements atomic absorption spectrometer with deuterium background
correction, equipped with a graphite furnace (GFAAS) for electrothermal atomization (Varian
AA240/GTA120, USA) was used. An automatic sampler was employed for injecting of the solution
into the furnace. The assembly was operated from an interfaced computer running SpectrAA
software.
Chemicals
For heavy element determination, concentrated 69% nitric acid (ccHNO3) (“trace metals analysis”
grade) and 30% hydrogen peroxide (H2O2) were both from J.T.Baker. All the plastic and glassware
were cleaned by soaking in a 20% hydrochloric solution overnight; then in 20% nitric acid
overnight and finally rinsed with Milli-Q water. The As, Cd and Pb stock standard solution (1000
μg/ml) were supplied by J.T.Baker. The working standard solutions of 1 μg/ml for each element
were obtained by diluting stock solutions in 3% nitric acid. The calibration curve was prepered
using the so-called bulk solution prepared by mixing the standard solutions and the subsequent
dilution. Automix option of the GFAAS is applied enabling automatic preparation of the calibration
standard. Paladium nitrate was used as modifier during analysis. Ultra-pure deionized water type
Milli-Q with a specific resistivity of 18.2 MΩ/cm was used for preparation of the standard and the
sample solutions.
Samples
In January, 2012, forty-five selected foodstuffs samples were collected randomly from different
supermarkets within Novi Sad, the capitol of the Vojvodina Province, where the biggest producers
of food in Serbia are located. Investigated foodstuffs were fruit (apple, prunes), vegatable (potato,
onion, mushrooms), bread, cookies, chocolate, candy, oil, margarine, meat, milk, soft cheese and
paprika (powder spice) contributing in the largest shares to the average market basket in Serbia. The
samples were stored in their original packs at 4oC until analysis was carried out.
Method
Milestone Ethos One microwave with segmented rotor of high pressure (HPR-1000/10S) and
internal temperature sensor (Milestone, Italy) was used for digestion of the samples. About 0.5 g of
previously homogenised samples were weighted inside high-pressure Teflon (TFM) vessels and 7
ml of ccHNO3 (69%) and 1 ml of H2O2 (30%) were added. The operational conditions and the
heating program used were carried out according to the conditions recommended by the
manufacturer. After cooling, digests were diluted with Milli-Q water to 25 ml glass flask and
finally, transferred to previously acid-cleaned and labelled polypropylene vessel for further analysis.
From each kind of food samples three digestions were prepared and analysed using three replicates.
A blank digest was carried out in the same way in every batch of digest samples.
Appropriate quality assurance procedures and precautions were carried out to ensure the reliability
of the results. Validation data (recoveries were in the range 66-132%; limits of detection (LOD) and

SECTION 8: FOOD QUALITY AND SAFETY
_________________________________________________________________________________________
_________________________________________________________________________________________
902
limits of quantification (LOQ) were than the LODs and LOQs required by EC (2007); linearty
expressed as the regression coefficients was greater than 0.9950) indicated the suitability of the
proposed method for determination of trace concentration of As, Cd and Pb.
Intake calculation
Calculation of the exposure of the Serbian population through consumption of investigated
foodstuffs was based on the average daily portion of the selected foodstuffs and the average element
concentrations found in this study, corrected for the recovery values.
Following equation was used for estimate the element intake:
Estimate of element intake (μg/kg/day) =
where [element] is the concentration of element in (mg/kg) detected in foodstuffs adjusted for
recovery, [foodstuffs consumption] is the amount of selected foodstuffs (kg) consumed per person
per day, and [bw] is the body weight (kg).
The amounts of investigated foodstuffs used for calculation of the intakes were obtained according
to the Serbian market basket (Statistical Office of the Republic of Serbia, 2011). The following
investigated foodstuffs with average daily consumption figures per person were used (Statistical
Office of the Republic of Serbia, 2011): apple (94.0 g), potato (143.0 g), onion (31.0 g), mushroom
(5.7 g), oil (30.0 g), margarine (6.0 g), milk (145 ml), soft cheese (33.0 g), meat (102.2 g), bread
(293.3 g), cookies (9.3 g), chocolate (2.2 g), candy (2.2 g), prunes (1.1 g), spice pepper (1.7 g). The
average body weight (bw) of 70 kg for adults was used for calculating daily intakes per kg bw.
The estimated element intakes (in μg/kg/day) were than compared with the relevant provisional
tolerable daily intakes (PTDI, μg/kg/day) set by Food and Agriculture Organization (FAO)/World
Health Organization (WHO). The percentages of PTDIs through consumption of investigated
foodstuffs were calculated:
%PTDI = Estimate of foodstuffs intake/PTDI100
Results and discussion
Arsenic was detected only in samples of margarine and oil, but in concentrations below the
maximum residue level of 0.1 mg/kg set by Serbian regulation. In other food items it was below the
limit of detection.
The levels of Pb and Cd in selected foodstuffs are presented in Figure 1.
bw
nconsumptiofoodstuffselements

SECTION 8: FOOD QUALITY AND SAFETY
_________________________________________________________________________________________
_________________________________________________________________________________________
903
Figure 1. The content of cadmium and lead in different types of foodstuffs from the Serbian market
basket (mg/kg).
The highest Cd content could be order as follows: paprika > candy > chocolate > bread > cookies =
potatoes, followed by mushrooms, apple, whereas the lowest content was found in oil, milk and
apple samples. The Cd levels quantified in analyzed foodstuffs were lower than maximum levels set
by EU (EC, 2006) or Serbian regulations (No 28/2011). The Pb concentrations in majority of
samples were very low being equal or lower than 0.035 mg/kg, except in the case of samples of
bread, chocolate, prunes and candy for which the highest concetrations from 0.150 to 0.389 mg/kg
were found. The lead levels in all investigated foodstuffs were found to be lower than maximum
levels set by EU (1881/2006) or Serbian regulations (No. 28/11).
Intake of elements from food consumption is dependent element concentrations in food and amount
of food consumed. The average levels of As, Cd and Pb were used in the intake calculation, since
this methodology is internationally recognized to provide satisfactory estimates of long-term
exposure, suitable for comparison with the respective Provisional Tolerable Weekly Intake (PTWI)
set by Food and Agriculture Organization (FAO)/World Health Organization (FAO/WHO, 2007),
which are also estimates based on long-term exposure. Tables 1 show the estimates of As, Cd and
Pb intakes for the general Serbian adults through consumption of selected foodstuffs. The intake of
each elements is expressed as a percentage of the PTDI proposed by the FAO/WHO (1988, 1999,
2005) to be 2.1 μg/kg/day for As, 1 μg/kg/day for Cd and 3.6 μg/kg/day for Pb. As can be seen from
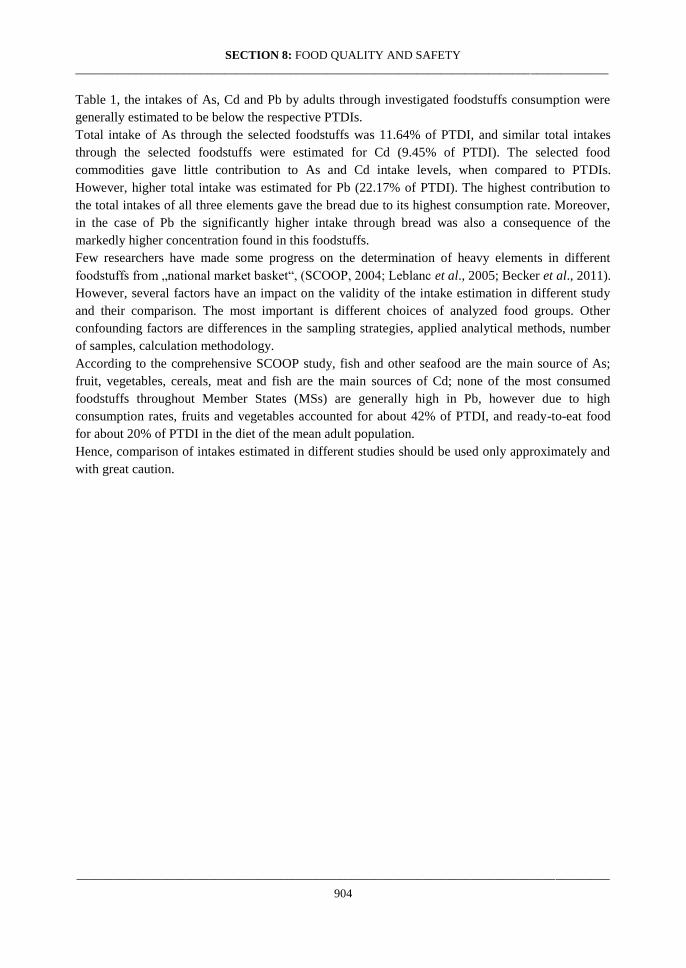
SECTION 8: FOOD QUALITY AND SAFETY
_________________________________________________________________________________________
_________________________________________________________________________________________
904
Table 1, the intakes of As, Cd and Pb by adults through investigated foodstuffs consumption were
generally estimated to be below the respective PTDIs.
Total intake of As through the selected foodstuffs was 11.64% of PTDI, and similar total intakes
through the selected foodstuffs were estimated for Cd (9.45% of PTDI). The selected food
commodities gave little contribution to As and Cd intake levels, when compared to PTDIs.
However, higher total intake was estimated for Pb (22.17% of PTDI). The highest contribution to
the total intakes of all three elements gave the bread due to its highest consumption rate. Moreover,
in the case of Pb the significantly higher intake through bread was also a consequence of the
markedly higher concentration found in this foodstuffs.
Few researchers have made some progress on the determination of heavy elements in different
foodstuffs from „national market basket“, (SCOOP, 2004; Leblanc et al., 2005; Becker et al., 2011).
However, several factors have an impact on the validity of the intake estimation in different study
and their comparison. The most important is different choices of analyzed food groups. Other
confounding factors are differences in the sampling strategies, applied analytical methods, number
of samples, calculation methodology.
According to the comprehensive SCOOP study, fish and other seafood are the main source of As;
fruit, vegetables, cereals, meat and fish are the main sources of Cd; none of the most consumed
foodstuffs throughout Member States (MSs) are generally high in Pb, however due to high
consumption rates, fruits and vegetables accounted for about 42% of PTDI, and ready-to-eat food
for about 20% of PTDI in the diet of the mean adult population.
Hence, comparison of intakes estimated in different studies should be used only approximately and
with great caution.
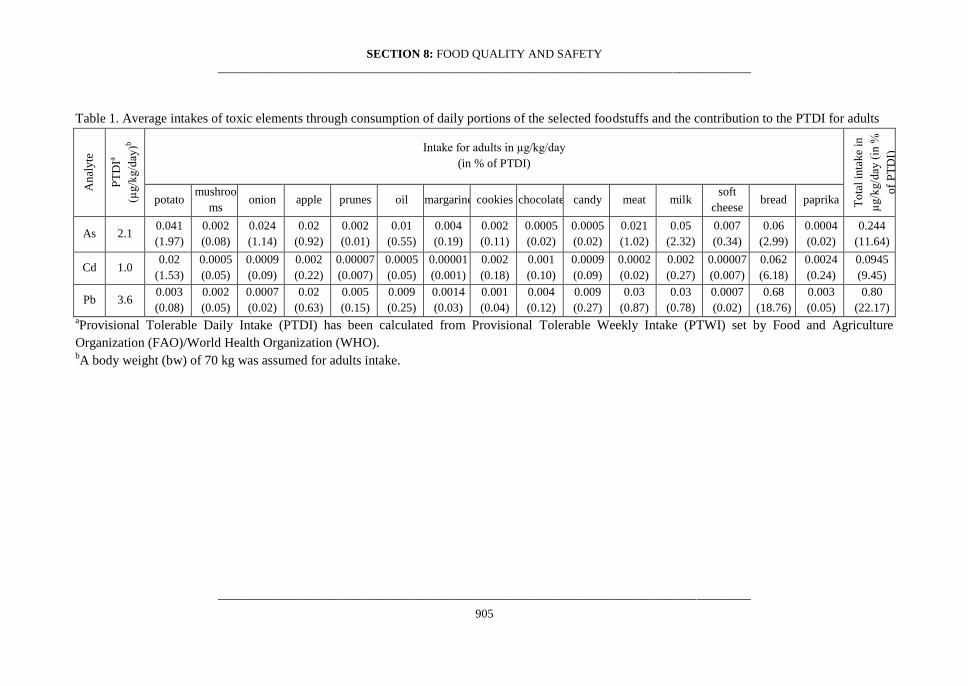
SECTION 8: FOOD QUALITY AND SAFETY
_________________________________________________________________________________________
_________________________________________________________________________________________
905
Table 1. Average intakes of toxic elements through consumption of daily portions of the selected foodstuffs and the contribution to the PTDI for adults
An
aly
te
PT
DIa
(µg
/kg/d
ay)b
Intake for adults in µg/kg/day
(in % of PTDI)
To
tal
inta
ke
in
µg
/kg/d
ay (
in %
of
PT
DI)
potato mushroo
ms onion apple prunes oil margarine cookies chocolate candy meat milk
soft
cheese bread paprika
As 2.1 0.041
(1.97)
0.002
(0.08)
0.024
(1.14)
0.02
(0.92)
0.002
(0.01)
0.01
(0.55)
0.004
(0.19)
0.002
(0.11)
0.0005
(0.02)
0.0005
(0.02)
0.021
(1.02)
0.05
(2.32)
0.007
(0.34)
0.06
(2.99)
0.0004
(0.02)
0.244
(11.64)
Cd 1.0 0.02
(1.53)
0.0005
(0.05)
0.0009
(0.09)
0.002
(0.22)
0.00007
(0.007)
0.0005
(0.05)
0.00001
(0.001)
0.002
(0.18)
0.001
(0.10)
0.0009
(0.09)
0.0002
(0.02)
0.002
(0.27)
0.00007
(0.007)
0.062
(6.18)
0.0024
(0.24)
0.0945
(9.45)
Pb 3.6 0.003
(0.08)
0.002
(0.05)
0.0007
(0.02)
0.02
(0.63)
0.005
(0.15)
0.009
(0.25)
0.0014
(0.03)
0.001
(0.04)
0.004
(0.12)
0.009
(0.27)
0.03
(0.87)
0.03
(0.78)
0.0007
(0.02)
0.68
(18.76)
0.003
(0.05)
0.80
(22.17) aProvisional Tolerable Daily Intake (PTDI) has been calculated from Provisional Tolerable Weekly Intake (PTWI) set by Food and Agriculture
Organization (FAO)/World Health Organization (WHO). bA body weight (bw) of 70 kg was assumed for adults intake.
SECTION 8: FOOD QUALITY AND SAFETY
_________________________________________________________________________________________
_________________________________________________________________________________________
906
Conclusions
It could be concluded that, this is the most comprehensive study presenting the heavy element levels
in foodstuffs frequently consumed by Serbian inhabitants. The study highlights the fact that levels
of analyzed contaminants in investigated foodstuffs collected from the local markets in Novi Sad
were in compliance with the current Serbian and EU legislation. It also emphasizes that there was
no concern about intake of the heavy elements through different foodstuffs by adult consumers.
Still, regular monitoring is essential, to prevent the excessive build-up in the food chain.
Acknowledgment
The results presented here are obtained within the projects "Estimation of chemical safety of market
basket and population dietary exposure" supported by Secretariat for Science and Technological
Development of the Serbian Province of Vojvodina coordinated by Prof. B. Škrbić.
References
Assessment of the dietary exposure to arsenic, cadmium, lead and mercury of the population of the
EU Member States. 2004. SCOOP (Scientific Cooperation on Questions relating to Food), Report
of experts participating in Task 3.2.11., Directorate-General Health and Consumer Protection.
Becker, W., Jorhem, L., Sundström, B., Petersson Grawe, K. (2011). Contents of mineral elements
in Swedish market basket diets. Journal of Food Composition and Analysis 24, 279–287.
EC. (2006). Commission Regulation (EC) No 1881/2006 of 19 December 2006 setting maximum
levels for certain contaminants in foodstuffs. Official Journal of the European Union, L364, 0005–
0024.
Leblanc, J.C., Tard, A., Volatier, J.L., Verger, P. (2005). Estimated dietary exposure to principal
food mycotoxins from The First French Total Diet Study. Food Additives and Contaminants, 22,
652-672.
EC. (2007). Commission Regulation (EC) No 333/2007 of 28 March 2007 laying down the methods
of sampling and analysis for the official control of the levels of lead, cadmium, mercury, inorganic
tin, 3-MCPD and benzo(a)pyrene in foodstuffs. Official Journal of the European Union, L88, 29-38.
FAO. (2007). Food Balance Sheet. Faostat.fao.org/site/368/default.aspx#ancor (updated 02 June
2010; accessed on July 2011).
Serbian regulation (2011). Maximum allowed contents of contaminants in food and feed. Official
Bulletin of the Republic of Serbia, 28/11, 2-7.
Statistical Office of the Republic of Serbia, 2011. http://webrzs.stat.gov.rs/WebSite/
WHO. (1988): Tehnical Report Series No. 776, 33rd meeting of JECFA, 27; WHO Food Additives
Series No.24, 33rd meeting of JECFA, 155. (Arsenic).
WHO. (1999): Tehnical Report Series No. 896, 53rd meeting of JECFA, 81; WHO Food Additives
Series No.44, 53rd meeting of JECFA, 273. (Lead).
WHO. (2005): Tehnical Report Series No. 930, 64th meeting of JECFA, 26; WHO Food Additives
Series, 64th meeting of JECFA. (Cadmium).
SECTION 8: FOOD QUALITY AND SAFETY
_________________________________________________________________________________________
_________________________________________________________________________________________
907
ПРОЦЕНКА НА ВНЕСОТ НА Pb, Cd и As ПРЕКУ ИСХРАНАТА СО КОНЗУМИРАЊЕ
НА ПОВАЖНИ ПРЕХРАНБЕНИ ПРОДУКТИ ОД КОШНИЦАТА НА СРПСКИОТ
ПАЗАРОТ
Билјана Шкрбиќ, Јелена Цвејанов, Златица Предојевиќ, Наташа Мрмош, Јелена Живанчев
Апстракт
Целта на оваа студија е да се процени внесот на три токсични тешки елементи преку
исхраната со конзумирање на дневни дози од главните прехранбени продукти од српскиот
пазар како леб, месо, млеко, зеленчук, овошје, итн. Содржината на олово (Pb), кадмиум (Cd)
и арсен (As) се определени во различни примероци од храна со атомска апсорпциска
спектрометрија со графитна печка по варење во киселина во микробранова печка.
Примероците се собрани од супермаркетите во Нови Сад, Србија. Внесот на елементите е
пресметан за просечни возрасни потрошувачи врз основа на податоците за конзумирање од
српскиот пазар. Релативното учество на проценетиот внес на Pb, Cd и As во однос на
соодветниот привремен толеран дневен внес се дискутирани и споредени со податоците
достапни во литературата со цел да се укаже на прехранбените продукти од српскиот пазар
што се внесуваат преку исхраната со највисок потенцијален ризик по здравјето.
Клучни зборови: токсични елементи, GFAAS, додатоци во исхраната.
SECTION 8: FOOD QUALITY AND SAFETY
_________________________________________________________________________________________
_________________________________________________________________________________________
908
UDC:632.122.1:641(497.11+460)
Original scientific paper
COMPARATIVE ANALYSIS OF SELECTED TOXIC ELEMENTS IN FOOD SAMPLES
FROM SPANISH AND SERBIAN MARKETS
Biljana Škrbić1*
, Marrinella Farré2, Nataša Đurišić-Mladenović
1, Jelena Cvejanov
1
1Faculty of Technology, University of Novi Sad, Serbia
2Department of Environmental Chemistry, Institute of Environmental Assessment and Water
Research, Barcelona, Spain *e-mail: [email protected]
Abstract
A survey was carried out with the aim to comparatively assess the level of some toxic elements (As,
Cd, and Pb) in food commodities collected from the Serbian and Spanish supermarkets. The
following items were considered: milk, cheese, liquid yogurt, meat, sweets like cookies, chocolate,
walnut, raisins, prunes, etc. The elements were extracted from their matrix by using nitric acid and
hydrogen peroxide in a closed-vessel microwave digestion system for their subsequent detection by
graphite furnace atomic absorption spectrometry (GFAAS). The method was validated by using a
certified reference material and an in-house method. In majority of the samples, arsenic was not
detected, while the highest levels of about 0.306-0.323 mg/kg were found for lead in candy samples
from both countries. In general, the elements were present in the Serbian products in similar ranges
as in the corresponding food items from the Spanish market. The results were compared with the
maximum levels set by the European Commission and the Serbian regulation, and they were
discussed in a light of the relevant data available in literature.
Key words: toxic elements, GFAAS, Serbian and Spanish food.
Introduction
The presence of heavy elements in the environment and food chain represents a serious problem,
which is recognized in most of the countries around the world. Humans have traditionally been
exposed to low concentrations of elements mainly via water and foods. In fact, food consumption
has been identified as the major pathway of human exposure to toxic elements, compared with other
ways of exposure such as inhalation and dermal contact. Arsenic (As), cadmium (Cd) and lead (Pb)
are elements with highest toxic potential among those present in foods.
In this sense, there is need to obtain data on toxic heavy element levels in foods and determination
of the element concentrations with high accuracy and precision has recently become a national
challenge in many countries. Concerning the element occurrence in Serbian food there is scarce data
available literature.
Thus, the main aim of the present study was to determine As, Cd and Pb concentration in food
commodities collected from the Serbian market, as well as in the same or similar type of foodstuffs
from Spain in order to comparatively assess the food safety status in Serbia.

SECTION 8: FOOD QUALITY AND SAFETY
_________________________________________________________________________________________
_________________________________________________________________________________________
909
Material and methods
Instrumentation
For analysis of heavy elements atomic absorption spectrometer with deuterium background
correction, equipped with a graphite furnace (GFAAS) for electrothermal atomization (Varian
AA240/GTA120, USA) was used. An automatic sampler was employed for injecting of the solution
into the furnace. The assembly was operated from an interfaced computer running SpectrAA
software.
Chemicals
For heavy element determination, concentrated 69 % nitric acid (ccHNO3) (“trace metals analysis”
grade) and 30 % hydrogen peroxide (H2O2) were both from J.T.Baker. All plastic and glassware
were cleaned by soaking in a 20% hydrochloric solution overnight; then in 20 % nitric acid
overnight and finally rinsed with Milli-Q water. The As, Cd and Pb stock standard solution (1000
μg/ml) were supplied by J.T.Baker. The working standard solutions of 1 μg/ml for each element
were obtained by diluting stock solutions in 3 % nitric acid. The calibration curve was prepered
using the so-called bulk solution prepared by mixing the standard solutions and the subsequent
dilution. Automix option of the GFAAS is applied enabling automatic preparation of the calibration
standard. Paladium nitrate was used as modifier during analysis. Ultra-pure deionized water type
Milli-Q with a specific resistivity of 18.2 MΩ/cm was used for preparation of the standard and the
sample solutions.
Samples
In 2012, 15 food items from supermarkets in Novi Sad, Serbia, and 14 food items from Barcelona,
Spain were collected. The following food items were investigated: fruit, vegatable, bread, cookies,
chocolate, candy, oil, margarine, meat, milk and dairy products, soft cheese and paprika. The
samples were stored in their original packs at 4oC until analysis was carried out.
Sample preparation
Milestone Ethos One microwave with segmented rotor of high pressure (HPR-1000/10S) and
internal temperature sensor (Milestone, Italy) was used for digestion of the samples. About 0.5 g of
previously homogenised samples were weighted inside high-pressure Teflon (TFM) vessels and 7
ml of ccHNO3 (69 %) and 1 ml of H2O2 (30 %) were added. The operational conditions and the
heating program used were carried out according to the conditions recommended by the
manufacturer. After cooling, digests were diluted with Milli-Q water to 25 ml glass flask and
finally, transferred to previously acid-cleaned and labelled polypropylene vessel for further analysis.
From each kind of food samples three digestions were prepared and analysed using three replicates.
A blank digest was carried out in the same way in every batch of digest samples.
Method validation
Appropriate quality assurance procedures and precautions were carried out to ensure the reliability
of the results. Firstly, the developed method was validated by in-house quality control procedure.
Parameters taking into account were: instrumental linearity, limit of detection (LOD) and limit of
quantification (LOQ), recovery, precision (repeatability as relative standard deviation (RSD) in %).
Calibration curves were obtained with aqueous standards of the metals and the elements content
were quantified by external calibration procedure except in the case of meat samples, when standard
addition methods was applied. The regression coefficients obtained were all greater than 0.9950.
The limit of detection (LOD) and limit of quantification (LOQ) were calculated as the mean blank
signal plus three or ten times, respectively, its standard deviation. In all cases, LODs and LOQs
were lower than LODs and LOQs established by European Union (EC, 2007). Validation of the

SECTION 8: FOOD QUALITY AND SAFETY
_________________________________________________________________________________________
_________________________________________________________________________________________
910
analytical method was carried out by determination of element recoveries from spiked samples.
Different types of foodstuffs (potato, onion, mushrooms, apple, prunes, oil, margarine, cookies,
chocolate, candy, milk etc.) were used for spiking at maxumum residul levels set by EC or Serbian
regulation. All of the obtained recovery values were acceptable being in the range 66-132%. The
certified reference material (CRM), wheat GBW 10011, was also used to check the bias of the
method. The recovery of As, Cd and Pb regarding CRM were as follows: 113%, 100% and 96%,
respectivily. Additionally, the accuracy of the method was checked by involvement in proficiency
test (PT) for determination of Pb in chilli powder organized by FAPAS in July-August 2012. The
recovery obtained in PT test was 80%.Thus, all validation data indicated the suitability of the
proposed method for determination of trace concentration of As, Cd and Pb.
Results and discussion
The heavy elements not only affect the nutritive values of food items ( i.g. milk, vegetables, fruits)
but also have deleterious effect on human beings using food products. The average data on
occurrence of As, Cd and Pb analyzed in selected foodstuffs samples collected from Serbian and
Spanish supermarket together with maximum allowable concentrations set by the relevant Serbian
(No. 28/11) and EC (1881/2006) regulations are given in Table 2. Samples with the element
concentration between LOD and LOQ were considered to be positive and their levels were included
in the statistical analysis. If element was below LOD in all of the samples, its average value is
reported as “<LOD”; otherwise for calculation of the averages, quantities below LOD were
considered as LOD/2. Arsenic is considered to be the most toxic to human health, which is the
reason why this element was investigated in food items even though the maximum allowable
concentration (MAC) has not been established yet by EU regulation. As shown in Table 1, arsenic
was detected only in oily products (oil, margarin) from Serbian markets, and only in samples of
candy from Spain. Determined level in later item was above the maximum residue level of 0.05
mg/kg set by Serbian regulation (No. 28/11). The results obtained for other food items were below
limit of detection.
The highest Cd content of about 0.118 mg/kg was found in Serbian paprika spice and 0.103 mg/kg
for Spanish candy, whereas the lowest content was found in apple, oil and milk samples collected
from Serbian market. Comparative analysis of the Cd contents in the same type of the products from
Serbia and Spain indicated similar levels, except in the case of candy samples (Table 1).
Nevertheless all analyzed products were in compliance with EU or Serbian regulations regarding
Cd.
Concerning Pb the highest average content was found in candy samples (0.323 mg/kg and 0.306
mg/kg) in Serbian and Spanish product, respectively, whereas the lowest Pb content of 0.005 mg/kg
were in Spanish egg crème caramel. Significant differences in Pb levels between the same Serbian
and Spanish products were observed for prunes and cookies samples. Nevertheless, levels obtained
for Pb in food item from both countries were in line with maximum levels set by EU and Serbian
regulations.
The results of the study for As, Cd and Pb have been compared with the European data collected in
the scientific opinions of SCOOP 3.2.11 that is the keystone of European Union (EU) risk
assessment regarding food and feed safety. Comparison with the relevant data for the same food
items from the EU Member States, indicated that similar or lower levels were obtained for the
Serbian and Spanish products, except in the case of the As content in Serbian oil samples and the
level of Pb in Serbian bread and chocolate (Table 1).
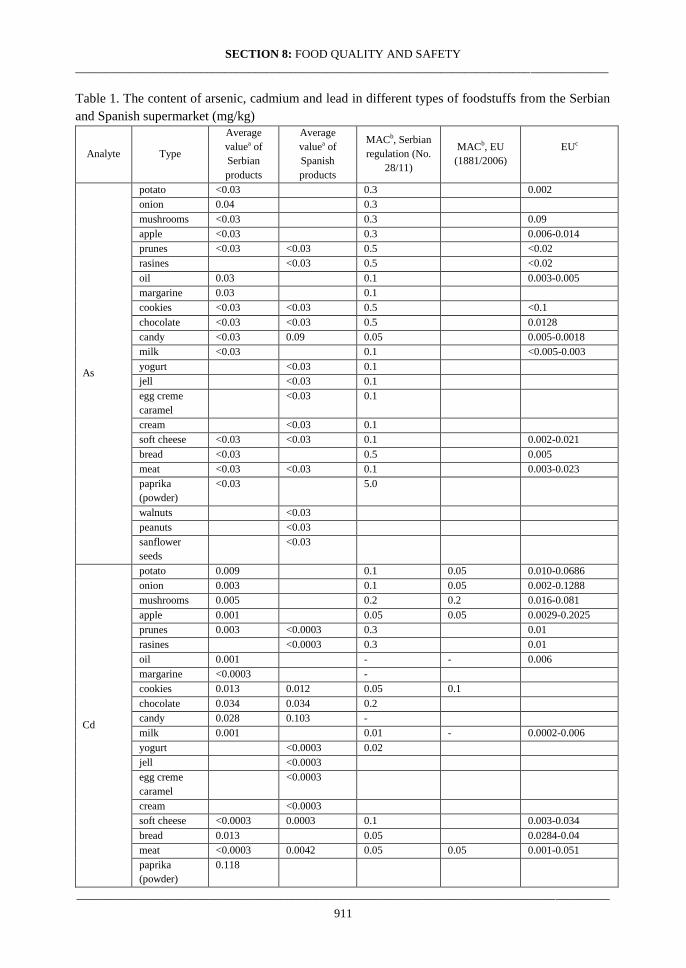
SECTION 8: FOOD QUALITY AND SAFETY
_________________________________________________________________________________________
_________________________________________________________________________________________
911
Table 1. The content of arsenic, cadmium and lead in different types of foodstuffs from the Serbian
and Spanish supermarket (mg/kg)
Analyte Type
Average
valuea of
Serbian
products
Average
valuea of
Spanish
products
MACb, Serbian
regulation (No.
28/11)
MACb, EU
(1881/2006)
EUc
As
potato <0.03 0.3 0.002
onion 0.04 0.3
mushrooms <0.03 0.3 0.09
apple <0.03 0.3 0.006-0.014
prunes <0.03 <0.03 0.5 <0.02
rasines <0.03 0.5 <0.02
oil 0.03 0.1 0.003-0.005
margarine 0.03 0.1
cookies <0.03 <0.03 0.5 <0.1
chocolate <0.03 <0.03 0.5 0.0128
candy <0.03 0.09 0.05 0.005-0.0018
milk <0.03 0.1 <0.005-0.003
yogurt <0.03 0.1
jell <0.03 0.1
egg creme
caramel
<0.03 0.1
cream <0.03 0.1
soft cheese <0.03 <0.03 0.1 0.002-0.021
bread <0.03 0.5 0.005
meat <0.03 <0.03 0.1 0.003-0.023
paprika
(powder)
<0.03 5.0
walnuts <0.03
peanuts <0.03
sanflower
seeds
<0.03
Cd
potato 0.009 0.1 0.05 0.010-0.0686
onion 0.003 0.1 0.05 0.002-0.1288
mushrooms 0.005 0.2 0.2 0.016-0.081
apple 0.001 0.05 0.05 0.0029-0.2025
prunes 0.003 <0.0003 0.3 0.01
rasines <0.0003 0.3 0.01
oil 0.001 - - 0.006
margarine <0.0003 -
cookies 0.013 0.012 0.05 0.1
chocolate 0.034 0.034 0.2
candy 0.028 0.103 -
milk 0.001 0.01 - 0.0002-0.006
yogurt <0.0003 0.02
jell <0.0003
egg creme
caramel
<0.0003
cream <0.0003
soft cheese <0.0003 0.0003 0.1 0.003-0.034
bread 0.013 0.05 0.0284-0.04
meat <0.0003 0.0042 0.05 0.05 0.001-0.051
paprika
(powder)
0.118
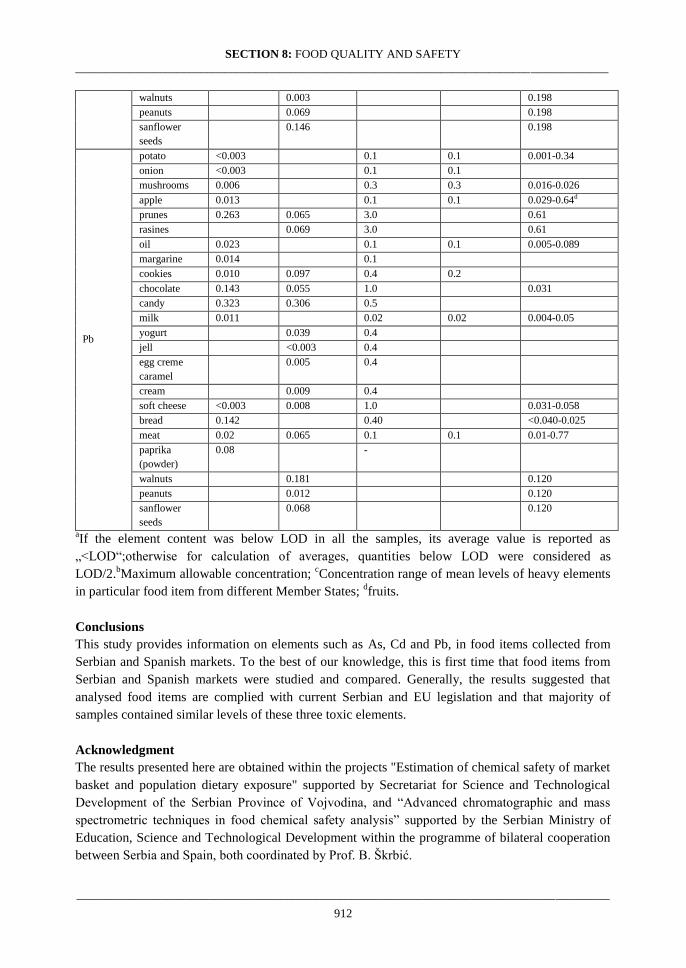
SECTION 8: FOOD QUALITY AND SAFETY
_________________________________________________________________________________________
_________________________________________________________________________________________
912
walnuts 0.003 0.198
peanuts 0.069 0.198
sanflower
seeds
0.146 0.198
Pb
potato <0.003 0.1 0.1 0.001-0.34
onion <0.003 0.1 0.1
mushrooms 0.006 0.3 0.3 0.016-0.026
apple 0.013 0.1 0.1 0.029-0.64d
prunes 0.263 0.065 3.0 0.61
rasines 0.069 3.0 0.61
oil 0.023 0.1 0.1 0.005-0.089
margarine 0.014 0.1
cookies 0.010 0.097 0.4 0.2
chocolate 0.143 0.055 1.0 0.031
candy 0.323 0.306 0.5
milk 0.011 0.02 0.02 0.004-0.05
yogurt 0.039 0.4
jell <0.003 0.4
egg creme
caramel
0.005 0.4
cream 0.009 0.4
soft cheese <0.003 0.008 1.0 0.031-0.058
bread 0.142 0.40 <0.040-0.025
meat 0.02 0.065 0.1 0.1 0.01-0.77
paprika
(powder)
0.08 -
walnuts 0.181 0.120
peanuts 0.012 0.120
sanflower
seeds
0.068 0.120
aIf the element content was below LOD in all the samples, its average value is reported as
„<LOD“;otherwise for calculation of averages, quantities below LOD were considered as
LOD/2.bMaximum allowable concentration;
cConcentration range of mean levels of heavy elements
in particular food item from different Member States; dfruits.
Conclusions
This study provides information on elements such as As, Cd and Pb, in food items collected from
Serbian and Spanish markets. To the best of our knowledge, this is first time that food items from
Serbian and Spanish markets were studied and compared. Generally, the results suggested that
analysed food items are complied with current Serbian and EU legislation and that majority of
samples contained similar levels of these three toxic elements.
Acknowledgment
The results presented here are obtained within the projects "Estimation of chemical safety of market
basket and population dietary exposure" supported by Secretariat for Science and Technological
Development of the Serbian Province of Vojvodina, and “Advanced chromatographic and mass
spectrometric techniques in food chemical safety analysis” supported by the Serbian Ministry of
Education, Science and Technological Development within the programme of bilateral cooperation
between Serbia and Spain, both coordinated by Prof. B. Škrbić.
SECTION 8: FOOD QUALITY AND SAFETY
_________________________________________________________________________________________
_________________________________________________________________________________________
913
References
Assessment of the dietary exposure to arsenic, cadmium, lead and mercury of the population of the
EU Member States, SCOOP (Scientific Cooperation on Questions relating to Food), Report of
experts participating in Task 3.2.11., Directorate-General Health and Consumer Protection, March
2004.
EC (2006). Commission Regulation (EC) No 1881/2006 of 19 December 2006 setting maximum
levels for certain contaminants in foodstuffs. Official Journal of the European Union, L364, 0005–
0024.
EC (2007). Commission Regulation (EC) No 333/2007 of 28 March 2007 laying down the methods
of sampling and analysis for the official control of the levels of lead, cadmium, mercury, inorganic
tin, 3-MCPD and benzo(a)pyrene in foodstuffs. Official Journal of the European Union, L88, 29-38.
Serbian regulation (2011). Maximum allowed contents of contaminants in food and feed. Official
Bulletin of the Republic of Serbia, 28/11, 2-7.
SECTION 8: FOOD QUALITY AND SAFETY
_________________________________________________________________________________________
_________________________________________________________________________________________
914
КОМПАРАТИВНА АНАЛИЗА НА ИЗБРАНИ ТОКСИЧНИ ЕЛЕМЕНТИ ВО
ПРИМЕРОЦИ ОД ХРАНА ОД ШПАНСКИТЕ И СРПСКИТЕ ПАЗАРИ
Билјана Шкрбиќ, Маринела Фарре, Наташа Ѓуришиќ-Младеновиќ, Јелена Цвејанов
Апстракт
Истражувањето е спроведено со цел да се направи споредбена проценка на количеството на
некои токсични елементи (As, Cd, и Pb) во прехранбени производи земени од српските и
шпанските супермаркети. За таа цел се земени следниве продукти: млеко, сирење, течен
јогурт, месо, слатки како колачиња, чоколадо, ореви, суво грозје, сливи, итн. Елементите се
екстрахирани од нивната матрица со помош на азотна киселина и водород пероксид во
затворен систем со микробраново печка, а потоа последователно се определени со помош на
атомска апсорпциска спектрометрија со графитна печка (GFAAS). Методот за анализа е
разработен и валидиран со користење на сертифициран референтен материјал. Во
поголемиот дел од примероците не е детектиран арсен, додека највисоки концентрации од
околу 0,306-0,323 mg/kg, се пронајдени за олово во примероци од бонбони од двете земји. Во
производите со српско потекло, испитуваните елементи беа присутни во слични граници
како и во соодветните прехранбени продукти од шпанскиот пазар. Резултатите се споредени
со максималните количества утврдени од страна на Европската комисија и српската
регулатива, а се дискутирани во согласност со релевантните податоци достапни во
литературата.
Клучни зборови: токсични елементи, GFAAS, српска и шпанска храна.
SECTION 8: FOOD QUALITY AND SAFETY
_________________________________________________________________________________________
_________________________________________________________________________________________
915
UDC:637.146.3-021.465:641.432
Original scientific paper
THE MICROBIOLOGICAL QUALITY DURING YOGHURT STORAGE
Sterjovski Sterja1, Srbinovska Sonja
1, Madjoska Vanja
2
1Faculty of Agricultural Sciences and Food-Skopje, Ss. Cyril and Methodius University in Skopje,
Macedonia 2Municipality of Makedonski Brod
, Republic of Macedonia
Abstract
The aim of the research was to determine the microbiological characteristics of yogurt from three
leading Macedonian milk-processing facilities supplied by retail centers, as changes that occur
during storage of 20 days. Finished packaged products were stored at 4 and 8°C during 20 days, and
analyzed on 1st, 10
th, and 20
th day. However, in three iterations the following parameters were
analyzed: total number of bacteria and lactic acid bacteria, and then the presence of yeasts and
pathogens. With the microbiological tests, the best quality on the first day was set in brand 1.
Namely in this variant on the first day it didn’t establish the presence of total number of bacteria,
nor pathogens. After 20 days of storage at 4°C, the greatest changes in microbiological quality
brand showed in brand 3 (V3) where it was determined constant large number of yeasts from 5 x
104 to 7.3 x 10
4 CFU/ml and total bacteria, followed by brand 2 (V2) where yeasts were in the range
between 4,3 x 10³ and 5,3 x 10
4 CFU/ml. Slightly smaller number of yeasts was determined in
Brand 1 (V1) (2,5 x 10² 2,5 x10
3 CF /ml,). All three variants showed an increased number of total
bacteria. The products storage at 8°C had poorer microbiological quality. Yogurt which was the
subject of analysis did not satisfy the requirements in terms of number of yeasts, with the exception
of brand 1 (V1), and on the first day, which partially fulfilled the requirements.
Keywords: yogurt, quality, temperature, storage.
Introduction
Fermented dairy products are traditional products in Macedonia, present in milk-processing
facilities, markets and our table and yogurt is one of the most consumed dairy products. Yoghurt
implies to a product which is obtained by fermentation of pasteurized milk with appropriate lactic
acid starter cultures. The technology is adjusted according to the traditional sour milk which as a
fermented dairy product derives from these areas and in the sales is like liquid yogurt and yogurt.
The quality and safety of yogurt can be defined with a large a number of criteria which include:
microbiological, chemical, physical and nutritional characteristics. As a result of all this, the quality
and safety can be determined by a number of tests of different degrees of objectivity, but all are
aiming to determine that the product is:
- Safe for human consumption (especially in terms of microbiological and chemical pollution);
- In accordance with all legal requirements;
- Able to achieve the assigned shelf life without being spoiled;
- With high sensory standards.
Storage of the yogurt at temperatures lower than 10°C and maintaining these temperatures until the
sale of the product, allows slowing down the microbiological and biochemical reactions that are
SECTION 8: FOOD QUALITY AND SAFETY
_________________________________________________________________________________________
_________________________________________________________________________________________
916
occurring in yogurt. Negative changes that may occur in the yogurt are as a result of non-
compliance with the prescribed measures and rules for storage of the yogurt.
Material and methods
Studies were conducted on samples of yoghurt placed on the mark packed in carton boxes of 1litre,
immediately after production. The survey included three yoghurts produced by different
manufacturers (Brand 1, Brand 2 and Brand 3) that were stored for a period from 20 days at a
temperature of 4°C (Brand 1-4, Brand 2-4 and Brand 3-4) and 8°C (Brand 1-8, Brand 2-8 and
Brand 3-8). Microbiological tests were carried out in three repetitions. The samples were examined
and analyzed in the Institute of Public Health - Bitola.
Microbiological methods were investigated by the following methods:
- Total Bacteria Count TBC - (MPA-agar) cultured 7 days at 28°C.
- Total Coliform bacteria – (ENDO-agar), detection of Salmonella appeared red colonies, while the
detection of Escherichia coli appeared green colonies. The planted pad was incubated for 24-48
hours at a temperature of 35-37°С.
- Total number of Lactic Acid Bacteria - LAB. - MRS-agar under anaerobic conditions at a
temperature of 37°C for a period of 24-48 hours.
- Total number of yeasts -SABURO- incubated 24-48 hours at a temperature of 37°C.
Results and discussion
In Table 1 are presents results for microbiological characteristics of yogurt from three leading
Macedonian milk-processing facilities supplied by retail centers. All samples at the first day showed
microbiological parameters in agreement with official standards regarding number of LAB and
these entire presenting LAB counts higher than 107CFU/ml (Table 1). This is in correlation with
Macedonian standards (Official gazette 96/2011) and Codex standard (CODEX STAN 243-2003).
According the results, pathogenic bacteria was not defined in the variants yogurts present on
markets, except E. coli in Brand 2 and Brand 3 (from 5 to 80 CFU/ml in Brand 2 and from 18 to 40
CFU/ml in Brand 3). Coliforms detection or enumerating are often used as parameters for
evaluating the yoghurt quality in different countries (Con et al., 1996; Nogueira et al., 1998; Tamine
and Robinson, 2007). The obtained results are similar when compared to other studies in Lebanon
(Al-Kadamany et al., 2003), and Portugal (Nogueira et al., 1998). However, there have been
instances where much higher counts of coliform group were found in yoghurt samples, with
frequency varying from 35 to 80% (Con et al., 1996). While, Massa (1996) did not noticed the
presence of Salmonella in yogurt, but Rodrigues (2010) found Coliform bacteria with levels higher
than 0.3 MPN/g in yogurt placed on Brazil’s markets. Varga et al. (2007) in samples of yogurt did
not noticed the presence of Salmonlla and S. aureus., and Okpalugo et al (2008) investigated dairy
products on Nigeria market noticed the presence of Coliform bacteria as follows: Enterococcus spp.
4.2 x 10³ and E.coli 1.2 x 10
2. According the results, yeasts were present at first day in all variants
in range of 2x10⁶ to 2x10
7CFU/ml.
During storage on different temperatures 4°C and 8°C, total number of bacteria in all brands
gradually increased. Based on the results presented in Table 2 it can be concluded that the total
number of bacteria in Brand 1 increased on the 10th day. Namely the 20th day the total number of
microorganisms has increased 2x10⁷ CFU/ml. While in Brand 2 and Brand 3 total number of
microorganisms is greater than Brand 2. Namely the 20th day the total number of microorganisms
has increased from 2x10⁶ CFU/ml up to 2x10
7 CFU/ml. (Brand 2), whereas in the Brand 3 total
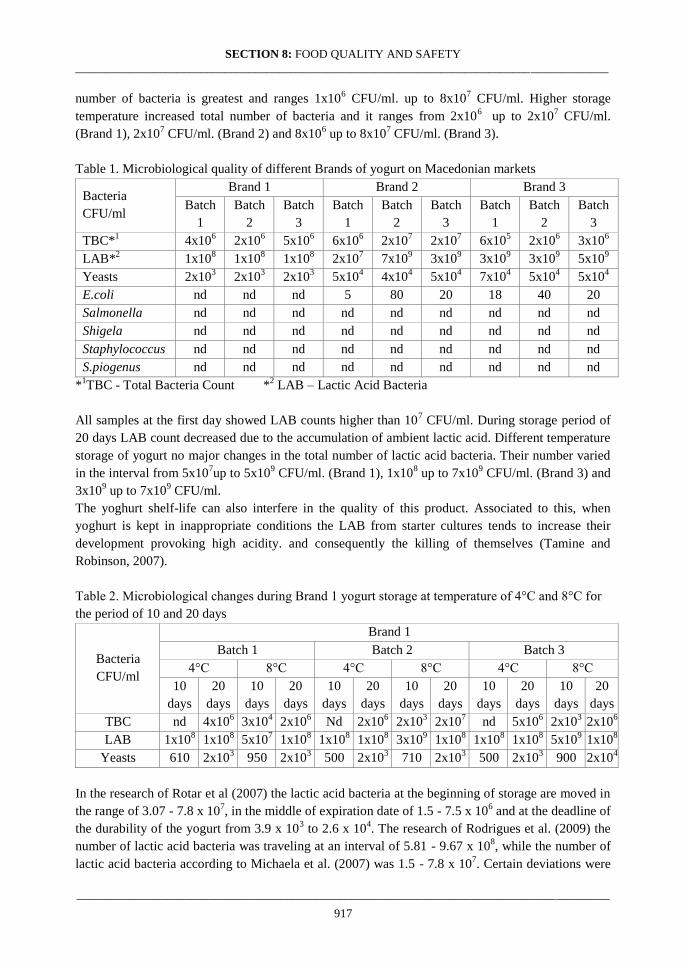
SECTION 8: FOOD QUALITY AND SAFETY
_________________________________________________________________________________________
_________________________________________________________________________________________
917
number of bacteria is greatest and ranges 1x10⁶ CFU/ml. up to 8x10
7 CFU/ml. Higher storage
temperature increased total number of bacteria and it ranges from 2x10⁶
up to 2x10⁷ CFU/ml.
(Brand 1), 2x10⁷ CFU/ml. (Brand 2) and 8x10
6 up to 8x10
7 CFU/ml. (Brand 3).
Table 1. Microbiological quality of different Brands of yogurt on Macedonian markets
Bacteria
CFU/ml
Brand 1 Brand 2 Brand 3
Batch
1
Batch
2
Batch
3
Batch
1
Batch
2
Batch
3
Batch
1
Batch
2
Batch
3
TBC*1 4x10
6 2x10
6 5x10
6 6x10
6 2x10
7 2x10
7 6x10
5 2x10
6 3x10
6
LAB*2 1x10
8 1x10
8 1x10
8 2x10
7 7x10
9 3x10
9 3x10
9 3x10
9 5x10
9
Yeasts 2x10³ 2x10
3 2x10
3 5x10
4 4x10
4 5x10
4 7x10
4 5x10
4 5x10
4
E.coli nd nd nd 5 80 20 18 40 20
Salmonella nd nd nd nd nd nd nd nd nd
Shigela nd nd nd nd nd nd nd nd nd
Staphylococcus nd nd nd nd nd nd nd nd nd
S.piogenus nd nd nd nd nd nd nd nd nd
*1TBC - Total Bacteria Count *
2 LAB – Lactic Acid Bacteria
All samples at the first day showed LAB counts higher than 107 CFU/ml. During storage period of
20 days LAB count decreased due to the accumulation of ambient lactic acid. Different temperature
storage of yogurt no major changes in the total number of lactic acid bacteria. Their number varied
in the interval from 5x10⁷up to 5x10
9 CFU/ml. (Brand 1), 1x10
8 up to 7x10
9 CFU/ml. (Brand 3) and
3x10⁹ up to 7x10
9 CFU/ml.
The yoghurt shelf-life can also interfere in the quality of this product. Associated to this, when
yoghurt is kept in inappropriate conditions the LAB from starter cultures tends to increase their
development provoking high acidity. and consequently the killing of themselves (Tamine and
Robinson, 2007).
Table 2. Microbiological changes during Brand 1 yogurt storage at temperature of 4°C and 8°C for
the period of 10 and 20 days
Bacteria
CFU/ml
Brand 1
Batch 1 Batch 2 Batch 3
4°C 8°C 4°C 8°C 4°C 8°C
10
days
20
days
10
days
20
days
10
days
20
days
10
days
20
days
10
days
20
days
10
days
20
days
TBC nd 4x10⁶ 3x10
4 2x10
6 Nd 2x10
6 2x10
3 2x10
7 nd 5x10
6 2x10
3 2x10
6
LAB 1x10⁸ 1x10
8 5x10
7 1x10
8 1x10
8 1x10
8 3x10
9 1x10
8 1x10
8 1x10
8 5x10
9 1x10
8
Yeasts 610 2x10³ 950 2x10
3 500 2x10
3 710 2x10
3 500 2x10
3 900 2x10
4
In the research of Rotar et al (2007) the lactic acid bacteria at the beginning of storage are moved in
the range of 3.07 - 7.8 x 10⁷, in the middle of expiration date of 1.5 - 7.5 x 10
6 and at the deadline of
the durability of the yogurt from 3.9 x 10³ to 2.6 x 10
4. The research of Rodrigues et al. (2009) the
number of lactic acid bacteria was traveling at an interval of 5.81 - 9.67 x 10⁸, while the number of
lactic acid bacteria according to Michaela et al. (2007) was 1.5 - 7.8 x 10⁷. Certain deviations were

SECTION 8: FOOD QUALITY AND SAFETY
_________________________________________________________________________________________
_________________________________________________________________________________________
918
defined, due to differences in the quality of the raw material and different technological line for the
production of yogurt.
Table 3. Microbiological changes during Brand 2 yogurt storage at temperature of 4°C and 8°C for
the period of 10 and 20 days
Bacteria
CFU/ml
Brand 2
Batch 1 Batch 2 Batch 3
4°C 8°C 4°C 8°C 4°C 8°C
10
days
20
days
10
days
20
days
10
days
20
days
10
days
20
days
10
days
20
days
10
days
20
days
TBC 1x10⁶ 2x10
6 9x10
6 2x10
7 2x10
6 6x10
6 2x10
6 2x10
7 1x10
6 2x10
7 7x10
6 2x10
7
LAB 4x10⁹ 3x10
9 6x10
9 1x10
9 3x10
9 7x10
9 4x10
9 7x10
9 3x10
6 3x10
6 5x10
9 1x10
8
Yeasts 1x10⁴ 5x10
4 4x10
4 5x10
4 2x10
4 4x10
4 1x10
4 8x10
4 1x10
4 5x10
4 5x10
4 9x10
4
Yeasts as natural contaminant of yoghurt at the first day was in between 2x10³ in Brand 1 to 7x10
4
in Brand 3. The total number of yeast in all variants gradually increased during the storage of 20
days but higher storage temperature significantly influence on increasing number. The highest total
number of yeast were defined in Brand 3 (7x10⁴), while Brand 1 (2x10
3) has the lowest number of
yeasts in relation to the other two Brands.
Despite such arduous fencing, contamination owing to yeast is still one of the major limiting factors
for shelf life and commercial value of yoghurt (Canganella et al., 1998). For instance under good
manufacturing practices (GMP), the final product should contain not more than one yeast CFU/g at
the time of production (Suriyarachchi & Fleet, 1981) in contrast to this, other studies extended this
limit to less than or equal to 50 CFU (Li & Li, 1998). Different surveys of retail marketed yoghurt
revealed that samples could exhibit counts more than 105 CFU (Rohm et al., 1990; AL-Tahiri,
2005).
Table 4. Microbiological changes during Brand 3 yogurt storage at temperature of 4°C and 8°C for
the period of 10 and 20 days
CFU/ml
Brand 3
Batch 1 Batch 2 Batch 3
4°C 8°C 4°C 8°C 4°C 8°C
10
days
20
days
10
days
20
days
10
days
20
days
10
days
20
days
10
days
20
days
10
days
20
days
TBC 1x10⁶ 6x10
5 3x10
6 8x10
7 1x10
7 2x10
6 2x10
6 8x10
6 2x10
6 3x10
6 3x10
6 8x10
7
LAB 8x10⁸ 3x10
9 1x10
8 1x10
9 4x10
8 7x10
9 1x10
8 1x10
9 4x10
8 5x10
9 1x10
8 1x10
9
Yeasts 1x10⁵ 7x10
5 4x10
3 1x10
4 1x10
4 5x10
4 6x10
3 6x10
3 1x10
4 5x10
4 6x10
3 8x10
3
The spoilage of yogurts by yeasts is generally recognized by the development of yeasty offflavors,
loss of texture quality due to gas production, and the swelling and eventual blowing off of the
product container (Davis, 1974., Kroger, 1976.). When produced by "good manufacturing practice,"
yogurts should contain no greater than 1 yeast cell per g and, if correctly stored under refrigeration
(5oC), a product shelf life of 3 to 4 weeks may be expected (Davis, 1974). However, examination of
yogurts randomly purchased at the Macedonian markets showed high number of yeasts which is
partly in correlation with yogurts in United Kingdom and Canada where 25 to 30% of the samples
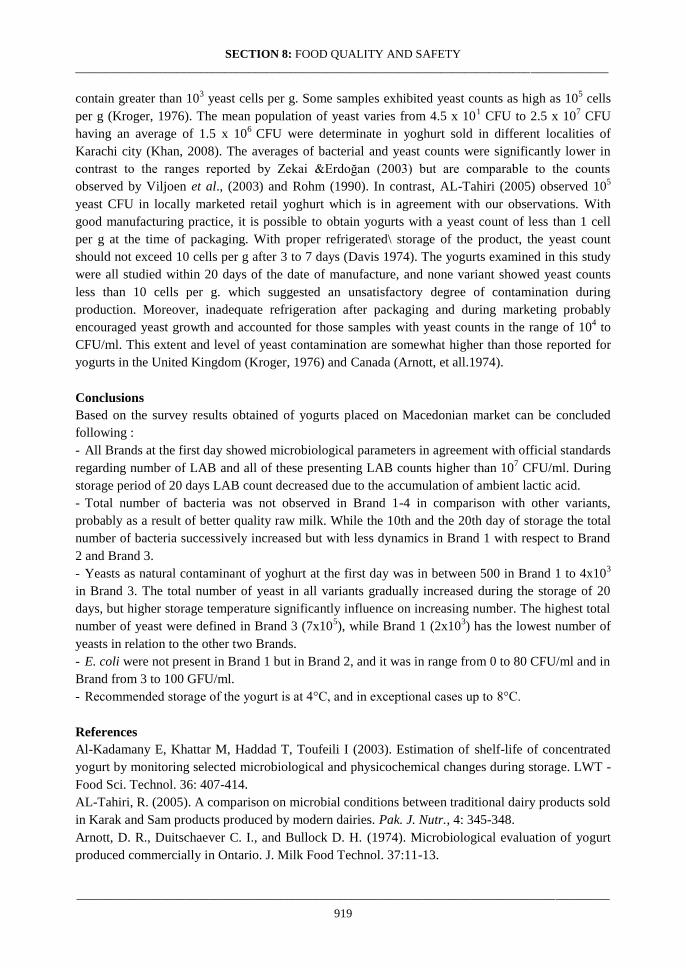
SECTION 8: FOOD QUALITY AND SAFETY
_________________________________________________________________________________________
_________________________________________________________________________________________
919
contain greater than 103 yeast cells per g. Some samples exhibited yeast counts as high as 10
5 cells
per g (Kroger, 1976). The mean population of yeast varies from 4.5 x 101 CFU to 2.5 x 10
7 CFU
having an average of 1.5 x 10⁶
CFU were determinate in yoghurt sold in different localities of
Karachi city (Khan, 2008). The averages of bacterial and yeast counts were significantly lower in
contrast to the ranges reported by Zekai &Erdoğan (2003) but are comparable to the counts
observed by Viljoen et al., (2003) and Rohm (1990). In contrast, AL-Tahiri (2005) observed 105
yeast CFU in locally marketed retail yoghurt which is in agreement with our observations. With
good manufacturing practice, it is possible to obtain yogurts with a yeast count of less than 1 cell
per g at the time of packaging. With proper refrigerated\ storage of the product, the yeast count
should not exceed 10 cells per g after 3 to 7 days (Davis 1974). The yogurts examined in this study
were all studied within 20 days of the date of manufacture, and none variant showed yeast counts
less than 10 cells per g. which suggested an unsatisfactory degree of contamination during
production. Moreover, inadequate refrigeration after packaging and during marketing probably
encouraged yeast growth and accounted for those samples with yeast counts in the range of 104 to
CFU/ml. This extent and level of yeast contamination are somewhat higher than those reported for
yogurts in the United Kingdom (Kroger, 1976) and Canada (Arnott, et all.1974).
Conclusions
Based on the survey results obtained of yogurts placed on Macedonian market can be concluded
following :
- All Brands at the first day showed microbiological parameters in agreement with official standards
regarding number of LAB and all of these presenting LAB counts higher than 107 CFU/ml. During
storage period of 20 days LAB count decreased due to the accumulation of ambient lactic acid.
- Total number of bacteria was not observed in Brand 1-4 in comparison with other variants,
probably as a result of better quality raw milk. While the 10th and the 20th day of storage the total
number of bacteria successively increased but with less dynamics in Brand 1 with respect to Brand
2 and Brand 3.
- Yeasts as natural contaminant of yoghurt at the first day was in between 500 in Brand 1 to 4x10³
in Brand 3. The total number of yeast in all variants gradually increased during the storage of 20
days, but higher storage temperature significantly influence on increasing number. The highest total
number of yeast were defined in Brand 3 (7x10⁵), while Brand 1 (2x10
3) has the lowest number of
yeasts in relation to the other two Brands.
- E. coli were not present in Brand 1 but in Brand 2, and it was in range from 0 to 80 CFU/ml and in
Brand from 3 to 100 GFU/ml.
- Recommended storage of the yogurt is at 4°C, and in exceptional cases up to 8°C.
References
Al-Kadamany E, Khattar M, Haddad T, Toufeili I (2003). Estimation of shelf-life of concentrated
yogurt by monitoring selected microbiological and physicochemical changes during storage. LWT -
Food Sci. Technol. 36: 407-414.
AL-Tahiri, R. (2005). A comparison on microbial conditions between traditional dairy products sold
in Karak and Sam products produced by modern dairies. Pak. J. Nutr., 4: 345-348.
Arnott, D. R., Duitschaever C. I., and Bullock D. H. (1974). Microbiological evaluation of yogurt
produced commercially in Ontario. J. Milk Food Technol. 37:11-13.

SECTION 8: FOOD QUALITY AND SAFETY
_________________________________________________________________________________________
_________________________________________________________________________________________
920
Canganella F., Giontela D., Nespica M.L., Massa S. (1998). Survival of Lactobacillus acidophilus
and Bifidobacterium infants in yogurts manufactured from cow milk and soymilk during storage at
two temperatures
Çon AH, Çakmakçi A, Ça_lar A, Gökalp HY (1996). Effects of different fruits and storage periods
on microbiological qualities of fruit-flavored yogurt produced in Turkey. J. Food Prot. 59: 402-406.
Davis, J. G. (1974). Yogurt in the United Kingdom: chemical and microbiological analysis. Dairy
Ind. 39:149-157
Khan Muhammad Tanweer, Hussain Mushtaq, Wajid Abdul and Rasool Sheikh Ajaz (2008).
Microbial population load and enzyme production of indigenously isolated yeast. Pak. J. Bot.,
40(5): 2225-2230.
Kroger, M. (1976). Quality of yogurt. J. Dairy Sci. 59:344-350.
Li, F. and Y. Li. (1998). Study on the contamination level and the tolerable limit of mould and yeast
in yoghurt. Wei Sheng Yan Jiu., 27: 257-258.
Massa S., Altieri C., Quaranta V. and R. De Pace (1997). Survival of Escherichia coli 0157:H7
during preparation and storage at 4°C, Letters in Applied Microbio-logy 1997, 24, 347-350.
Michaylova Michaela, S.Minkova, Kumyra K., Sasaki T., Isawa K. (2007). Isolation and
characterization of Lactobacillus delbrueckii subsp.bulgaricus and Streptococcus thermophilus from
plants in Bulgaria.
Nogueira C, Albano H, Gibbs P, Teixeira P (1998). Microbiological quality of Portuguese yogurts.
J. Ind. Microbiol. Biotechnol. 21: 19-21.
Okpalugo J., Ibrahim K., Izebe KS, US Inyang (2008). Aspects of microbial quality of some milk
products in Abuja, Nigeria, Tropical Journal Of Pharmaceutical Research, December 2008 : 7(4):
1169-1177.
Robinson, R. K., and A. Y. Tamine. (1975). Yogurt-a review of the product and its manufacture. J.
Soc. Dairy Technol. 28:149-163.
Rodrigues L.A. (2009). Microbiological quality of yoghurt commercialized in Vicosa, Minas,
Gerais, Brazil, Journal of Microbiology Research Vol 4 (3), pp 210-213.
Rohm, H., F. Lechner and M. Lehner. (1990). Microflora of Austrian natural-set yoghurt. J. Food
Protect., 53: 478-480.
Rotar-Ancuta Mihaela, Semeniuc Cristina, Apostu S., Suharoschi Ramona, Muresan Crina,
Modoran Constanta, Laslo C., Gus Camelia, Culea Monica (2007). Researches concerning micro
iological evolution of lactic acid bacteria to yoghurt storage during shelf-life, Journal Of
Agroalimentary Processes and Technologies, Volume XIII, No.1, 135-138, Communication – Food
Control.
Suriyarachi, V.R. and G.H. Fleet. (1981). Occurrence and growth of yeasts in yoghurts. Appl.
Environ. Microbiol., 42: 574-579.
Tamine A.Y., Robinson R.K. (2007). Yoghurt: Science and Technology. 3rd ed. Cambridge,
Woodhead Publishing Limited p. 808.
Varga Laszlo (2007). Microbiological quality of commercial dairy products, Communicating
current Research and Educational Topics and Trends in Applied Microbiology.
Viljoen, B.C., L.H. Analie, I. Bridget and P. Gabor. (2003). Temperature abuse initiating yeast
growth in yoghurt. Food Res. Int., 36: 193-197.
Zekai, T. and K. Erdoğan. (2003). Physical, chemical, microbiological and sensory characteristics of
some fruit-flavoured yoghurt. YYU. Vet. Fak. Derg., 14: 10-14.
SECTION 8: FOOD QUALITY AND SAFETY
_________________________________________________________________________________________
_________________________________________________________________________________________
921
МИКРОБИОЛОШКИ КВАЛИТЕТ НА ЈОГУРТОТ ВО ТЕКОТ НА СКЛАДИРАЊЕТО
Стерја М. Стерјовски, Соња Д. Србиновска, Вања Г. Маџоска
Апстракт
Целта на истражувањето беше да се утврдат микробиолошките карактеристики на јогуртот
од три водечки македонски млеко-преработувачки капацитети набавени од малопродажните
центри, како промени кои настануваат во текот на складирањето од 20 дена. Готовите
пакувани производи беа складирани на 4 и 8°С во текот на 20 дена, а анализите беа
спроведувани на 1-от, 10-от, и 20-от ден. При тоа во три повторувања се анализирани
следните параметри: вкупниот број на бактерии и млечно-кисели бактерии, а потоа
присуството на квасци и патогени микроорганизми. Со микробиолошките испитувања
најдобар квалитет на првиот ден беше утврден кај брендот 1. Имено кај оваа варијанта во
првиот ден не беше утврдено присуство на вкупен број бактерии, ниту патогени
микроорганизми. После 20 дена лагерување на 4°С, најголеми промени покажа бренд 3 (В3)
каде беше утврдено константен голем број на габи од 5x10⁴
до 7,3х104
CFU/ml и вкупни
бактерии, потоа следи бренд 2 (В2) каде габите беа во границите од 4,3x10³
до 5,3x10⁴
CFU/ml. Нешто помал бројот на габи беше утврден кај Бренд 1 (В1) (2,5x10² до 2,5x10
3
CFU/ml). Сите три варијантии покажаа зголемен број на вкупни бактерии. Производите
лагерувани на 8°С имаа полош микробиолошки квалитет. Јогурт кој беше предмет на анализа
не ги задоволи барањата во однос на бројот на квасци, со исклучок на брендот 1 (V1), и во
првиот ден, кој делумно ги исполни барањата.
Клучни зборови: јогурт, квалитет, температура, чување.

SECTION 8: FOOD QUALITY AND SAFETY
_________________________________________________________________________________________
_________________________________________________________________________________________
922
UDC:658.562(497.11)
Original scientific paper
APPLICATION LEGALITY OF CODEX ALIMENTARIUS IN SERBIA
Ana Perenić1, Radovan Krivokapić
2, Nikola Aleksić
1
1Ecological Movement of Novi Sad, Serbia
2PU ,,Radosno detinjstvo” Novi Sad, Serbia
*e-mail: [email protected]
Abstract
The paper deals with proving the illegality of introduction of Codex Alimentarius and from it
developed HACCP system into the legislation of Republic of Serbia. In this paper, comparing
methods of comparison of legal norms with Codex guidelines were used, which are in contradiction
with the Constitution of the RS, Rotterdam and Stockholm Convention, several applicable laws,
while products labeled with Codex Alimentarius and from it derived HACCP standard which is
inconsistent with applicable law, illegally appear on Serbian market.
Key words: Codex Alimentarius, HACCP, healthy food, chemicals, legitimacy of law.
Introduction
Codex Alimentarius (http://www.codexalimentarius.org) is specialized international food
organization which was founded in 1961 by UN Food and Agriculture Organization (UN FAO) and
World Health Organization (WHO). The main objective with adopting similar standards and related
documents (guidelines, codes of good practice, references, etc...) was to protect the health of
consumers and ensure fair practices in food trade. The consequences of these provisions are
breaking the current control standard in the area of food production in the world market; the quality
and safety of food have been imperiled.
In the beginning of 2008, Institute for Standardization of Serbia, through which the cooperation of
Serbia with the Codex Alimentarius Commission is performed, held the initial meeting for the
establishment of a National Codex Committee. This committee aims to improve the country's
participation in Codex overall activities. Ministry of Agriculture, Forestry and Water Management
has developed in late 2010 The Draft Regulation on the establishment of the National Codex
Committee of Serbia. As a draft, it was submitted for a review to all interested institutions and
organizations in the country. Under current regulations in Serbia, there is no obligation of marking,
because the law prohibited the use of GM seeds and foods containing GMOs or produced from
GMOs. In the law of the Republic of Serbia (according to European legislation) the presence of
GMOs in different products up to 0.9 percent is considered as unintended contamination, and so
these products are considered unmodified in case of modifications that are allowed in Europe.
Serbia is a signatory to the Rotterdam (The Law on Ratification of the Rotterdam Convention,
"Official Gazette of the Republic of Serbia - International Treaties" No. 38/2009) and Stockholm
(Law on the Ratification of the Stockholm Convention, "Official Gazette of the Republic of Serbia -
International Treaties", 1998) Convention. The Rotterdam Convention is an appropriate basis for
establishing a system of chemicals management, as well as for the process of giving approval
according to the prior information procedure for certain hazardous chemicals and pesticides in

SECTION 8: FOOD QUALITY AND SAFETY
_________________________________________________________________________________________
_________________________________________________________________________________________
923
international trade. The Stockholm Convention aims to protect health of people and the environment
from persistent organic pollutants. Serbia, as a signatory, would have to abide to these conventions
by its regulations in order to protect human health and the environment from potential harm and to
contribute to the use of chemicals in a way that is environmentally sustainable, facilitating
information exchange about their characteristics, taking care of the decision making process at the
national level on import and export and by disseminating these decisions to Parties.
(http://www.upravacarina.rs)
According to our comparative study we can conclude that the Codex Alimentarius Commission is
contrary to these international conventions that have more power than national legislation, the
Constitution of the RS, and laws in force in the Republic of Serbia. Therefore, the HACCP standard
(Hazard Analysis Critical Control Points), derived from the provisions of the Codex Alimentarius,
which in Serbia came into force on 11 June 2011, has no legal basis in domestic legislation. (Food
Safety Law, "Official Gazette of the Republic of Serbia", No. 41/09).
What is actually the Codex Alimentarius?
With the set of rules for regulation of agriculture and food control from seed to final product, Codex
Alimentarius Commission imposed new standards that are inconsistent with the Rotterdam and
Stockholm conventions, the RS Constitution and domestic laws and that break all previous control
standards in the production of food, additives and other food supplements.
The aforementioned Codex provides:
- mandatory provisions on the use of synthetic (recombinant) bovine growth hormone and
antibiotics in all kinds of animals whose meat is intended for human consumption, so that all
animals raised for food or milk will have to obtain Monsanto growth hormone and Monsanto
antibiotics;
- the use of genetically modified seeds that are prohibited by law in Serbia (Law on Genetically
Modified Organisms, "Official Gazette of RS" No. 41/2009 from 29th of May 2009);
- all kinds of food products must be radiated in order to last longer;
-the label of eco-products is not required to specify the ingredients of non-organic origin.
- vitamins, herbs (teas), useful minerals are prohibited in retail;
- more than 300 different additives (mostly synthetic) have been approved as safe; - from 12
banned herbicides as the most dangerous chemicals for the protection of agricultural products,
Codex Alimentarius brings back seven substances on the allowed list, including DDT which is in
our country (SFRY) prohibited from 1 January 1972.
The research results on the emersion of GM soy and corn, prohibited by law and allowed by the
Codex Alimentarius
According to the data from the Customs Administration (http://www.upravacarina.rs) GM soybeans
were first discovered on our fields in year 1998. In the year 2001, Ivana Dulić Marković, Minister
of Agriculture, Forestry and Water Management RS has allowed the import of soybean meal from
GM soybean. After that, in the year 2001, the agricultural inspection revealed in the area Čenej,
near Novi Sad, seven hectares of "mutated" crops. It is a so-called "Roundup" soybean, resistant to
total herbicide "Roundup". As previously stated, the GM soybean seeds were purchased at Novi Sad
Najlon market and the market in Sremska Mitrovica, and were sold under a false name, as domestic
sort "ravnica".
Otherwise, GM soybeans are found each year in our fields. During 2006, about 11 tons of
genetically modified soy illegally entered the country. Owing to the inspection, the soy was seized
before sowing. But, in spite of strict controls, in the year of 2005, genetically modified soy was

SECTION 8: FOOD QUALITY AND SAFETY
_________________________________________________________________________________________
_________________________________________________________________________________________
924
discovered in Mačva on 370 hectares of 270 manufacturers, and in Surčin area - on 55 hectares. The
measure was to take that soy and under strict control take it to be processed to soybean meal, in
order for that seed not to be found next year in the crops. The total of 7,800 tons of GM soybeans
was retrieved from peasants at that time, about 2,500 tons of which in the area of Vojvodina. In
2008, the parcels with modified soybeans were discovered in Mačva, about 40 hectares, in the
municipalities Šabac and Bogatić and in the area of Srem, about 30 hectares. In the year 2006, about
8,400 kilograms of GM soybeans were destroyed in a power plant "Nikola Tesla A", that were
seized by the inspection in Mačva and Srem. The soy was kept for the new sowing and if it had been
completed, with 82 hectares we would get new 300,000 kilograms of soybean.
According to the statement of the director of the Institute for Plant Protection, during the control
over parcels under soybean in South Bačka District of Vojvodina, Serbia, in the year 2011, from the
number of controlled parcels, 92% were under GM soybean, and in Banat 88% were under GM
soybean.
From 16 May 2007, the MK Group became the exclusive importer of Monsanto sunflower seed,
rapeseed and sorts of maize that were prohibited in some European countries and in particular, that
were not examined, approved or registered in the Register of agricultural plants seed (Phytosanitary
Border Inspection Certificate of import of Monsanto corn seed by MK Group). The parcels under
corn, sunflower and rapeseed were never controlled by phytosanitary inspection.
During 2011 and 2012, the Monsanto Company has twice announced a competition for workers in
Serbia which would sell Monsanto seeds and herbicides "at the level of Serbian farmers" with direct
offers on the field, outside legal stream of seed sale.
Organochlorine insecticides
Pesticides are chemical substances intended for preventing, destroying or controlling pests,
including vectors of human and animal diseases, unwanted species of plants (weeds) and species of
zoogenic origin (insects, mites, snails, nematodes, rodents) that cause damage during growth,
production, processing, storage, transportation of agricultures and food items etc. (Law on
production and trade of toxic substances, "Official Gazette SFRY", No. 15/95, 28/96 and 2002 and
"Official Gazette RS", No. 101/2005 – oth. law).
Pesticides from the group of organochlorine insecticides were prohibited in EU in the 1972. This
group consists of DDT, dicofol, metoxychlor, lindane, HCH (mixture of isomers), aldrin, dieldrin,
endrin, heptachlor, camphechlor, endosulfan and kelevan. Previously, they were widely applied in
agriculture, forestry, veterinary medicine and communal hygiene. These compounds slowly break
down in the body, they accumulate in unchanged form or in the metabolites form, especially in
adipose tissue and internal organs (liver, brain, kidney, heart), and are excreted through breast milk
and saliva, and eliminated in an unchanged form or transformed form through urine.
HACCP – Hazard Analysis Critical Control Points
HACCP is designed as a system that supports the principles of Codex Alimentarius Commission on
food safety and it is based on analysis and control of potential biological/microbiological, chemical,
allergenic and physical hazards to which all factors in the food production chain are exposed. That
implies abiding by the standard operating procedures and guidelines that reduce risks to food safety.
The designers of HACCP system integrated with the ISO standards have designed it as a kind of
deception and outstanding auxiliary means in implementation of the thorough industrial and
technological espionage with the goal of overall globalization in all spheres of life including food as
well. With their assumptions, principles and requirements they seek to establish, assess and control
hazards that could affect food safety, with so called management system based on prevention.
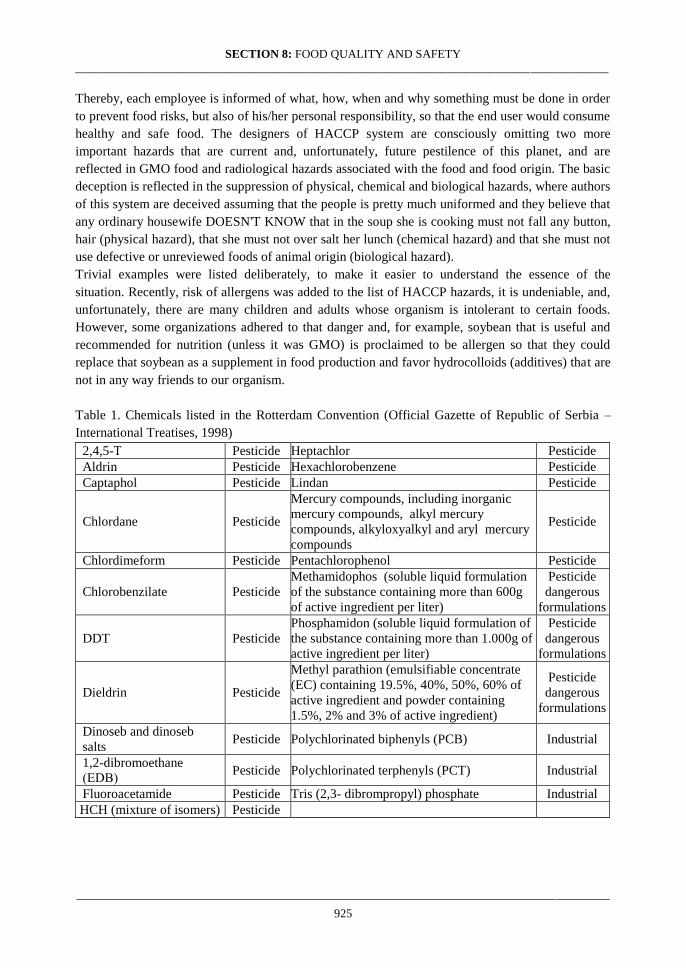
SECTION 8: FOOD QUALITY AND SAFETY
_________________________________________________________________________________________
_________________________________________________________________________________________
925
Thereby, each employee is informed of what, how, when and why something must be done in order
to prevent food risks, but also of his/her personal responsibility, so that the end user would consume
healthy and safe food. The designers of HACCP system are consciously omitting two more
important hazards that are current and, unfortunately, future pestilence of this planet, and are
reflected in GMO food and radiological hazards associated with the food and food origin. The basic
deception is reflected in the suppression of physical, chemical and biological hazards, where authors
of this system are deceived assuming that the people is pretty much uniformed and they believe that
any ordinary housewife DOESN'T KNOW that in the soup she is cooking must not fall any button,
hair (physical hazard), that she must not over salt her lunch (chemical hazard) and that she must not
use defective or unreviewed foods of animal origin (biological hazard).
Trivial examples were listed deliberately, to make it easier to understand the essence of the
situation. Recently, risk of allergens was added to the list of HACCP hazards, it is undeniable, and,
unfortunately, there are many children and adults whose organism is intolerant to certain foods.
However, some organizations adhered to that danger and, for example, soybean that is useful and
recommended for nutrition (unless it was GMO) is proclaimed to be allergen so that they could
replace that soybean as a supplement in food production and favor hydrocolloids (additives) that are
not in any way friends to our organism.
Table 1. Chemicals listed in the Rotterdam Convention (Official Gazette of Republic of Serbia –
International Treatises, 1998)
2,4,5-Т Pesticide Heptachlor Pesticide
Aldrin Pesticide Hexachlorobenzene Pesticide
Captaphol Pesticide Lindan Pesticide
Chlordane Pesticide
Mercury compounds, including inorganic
mercury compounds, alkyl mercury
compounds, alkyloxyalkyl and aryl mercury
compounds
Pesticide
Chlordimeform Pesticide Pentachlorophenol Pesticide
Chlorobenzilate Pesticide
Methamidophos (soluble liquid formulation
of the substance containing more than 600g
of active ingredient per liter)
Pesticide
dangerous
formulations
DDT Pesticide
Phosphamidon (soluble liquid formulation of
the substance containing more than 1.000g of
active ingredient per liter)
Pesticide
dangerous
formulations
Dieldrin Pesticide
Methyl parathion (emulsifiable concentrate
(EC) containing 19.5%, 40%, 50%, 60% of
active ingredient and powder containing
1.5%, 2% and 3% of active ingredient)
Pesticide
dangerous
formulations
Dinoseb and dinoseb
salts Pesticide Polychlorinated biphenyls (PCB) Industrial
1,2-dibromoethane
(ЕDB) Pesticide Polychlorinated terphenyls (PCT) Industrial
Fluoroacetamide Pesticide Tris (2,3- dibrompropyl) phosphate Industrial
HCH (mixture of isomers) Pesticide
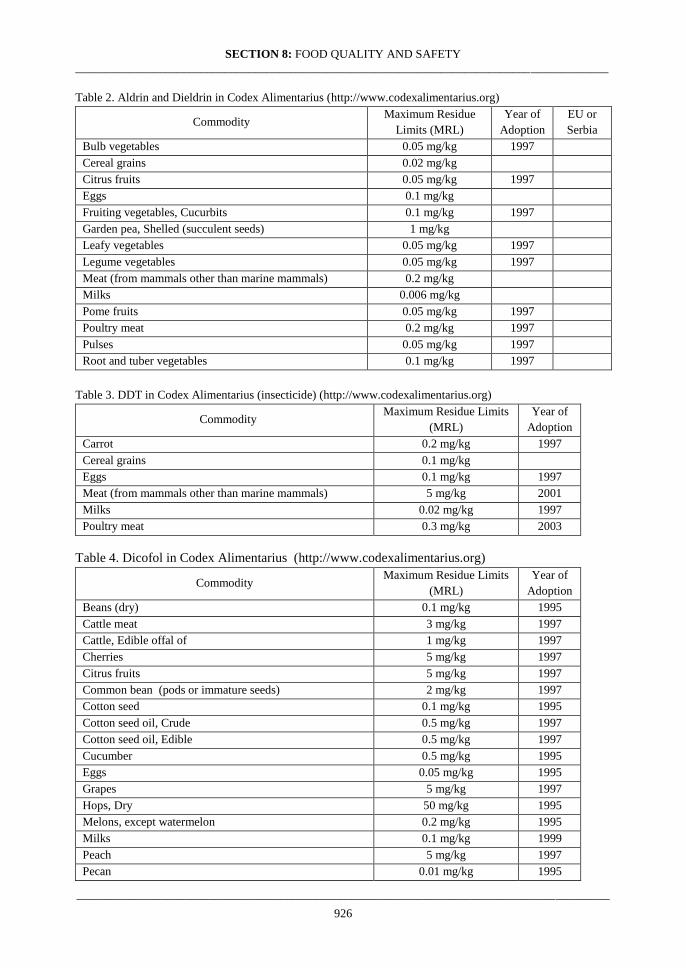
SECTION 8: FOOD QUALITY AND SAFETY
_________________________________________________________________________________________
_________________________________________________________________________________________
926
Table 2. Aldrin and Dieldrin in Codex Alimentarius (http://www.codexalimentarius.org)
Commodity Maximum Residue
Limits (MRL)
Year of
Adoption
EU or
Serbia
Bulb vegetables 0.05 mg/kg 1997
Cereal grains 0.02 mg/kg
Citrus fruits 0.05 mg/kg 1997
Eggs 0.1 mg/kg
Fruiting vegetables, Cucurbits 0.1 mg/kg 1997
Garden pea, Shelled (succulent seeds) 1 mg/kg
Leafy vegetables 0.05 mg/kg 1997
Legume vegetables 0.05 mg/kg 1997
Meat (from mammals other than marine mammals) 0.2 mg/kg
Milks 0.006 mg/kg
Pome fruits 0.05 mg/kg 1997
Poultry meat 0.2 mg/kg 1997
Pulses 0.05 mg/kg 1997
Root and tuber vegetables 0.1 mg/kg 1997
Table 3. DDT in Codex Alimentarius (insecticide) (http://www.codexalimentarius.org)
Commodity Maximum Residue Limits
(MRL)
Year of
Adoption
Carrot 0.2 mg/kg 1997
Cereal grains 0.1 mg/kg
Eggs 0.1 mg/kg 1997
Meat (from mammals other than marine mammals) 5 mg/kg 2001
Milks 0.02 mg/kg 1997
Poultry meat 0.3 mg/kg 2003
Table 4. Dicofol in Codex Alimentarius (http://www.codexalimentarius.org)
Commodity Maximum Residue Limits
(MRL)
Year of
Adoption
Beans (dry) 0.1 mg/kg 1995
Cattle meat 3 mg/kg 1997
Cattle, Edible offal of 1 mg/kg 1997
Cherries 5 mg/kg 1997
Citrus fruits 5 mg/kg 1997
Common bean (pods or immature seeds) 2 mg/kg 1997
Cotton seed 0.1 mg/kg 1995
Cotton seed oil, Crude 0.5 mg/kg 1997
Cotton seed oil, Edible 0.5 mg/kg 1997
Cucumber 0.5 mg/kg 1995
Eggs 0.05 mg/kg 1995
Grapes 5 mg/kg 1997
Hops, Dry 50 mg/kg 1995
Melons, except watermelon 0.2 mg/kg 1995
Milks 0.1 mg/kg 1999
Peach 5 mg/kg 1997
Pecan 0.01 mg/kg 1995

SECTION 8: FOOD QUALITY AND SAFETY
_________________________________________________________________________________________
_________________________________________________________________________________________
927
Peppers 1 mg/kg 1995
Peppers Chili, dried 10 mg/kg 2006
Plums (including prunes) 1 mg/kg 1997
Poultry meat 0.1 mg/kg 1997
Poultry, Edible offal of 0.05 mg/kg 1995
Prunes 3 mg/kg 1997
Squash, summer 1 mg/kg 1995
Tea, Green, Black (black, fermented and dried) 50 mg/kg 1997
Walnuts 0.01 mg/kg 1995
Table 5. Endrin in Codex Alimentarius (http://www.codexalimentarius.org)
Commodity Maximum Residue Limits
(MRL)
Year of
Adoption
Fruiting vegetables, Cucurbits 0.05 mg/kg 1997
Poultry meat 0.1 mg/kg 1997
Table 6. Endosulfan in Codex Alimentarius (http://www.codexalimentarius.org)
Commodity Maximum Residue Limits
(MRL)
Year of
Adoption
Avocado 0.5 mg/kg 2007
Cacao beans 0.2 mg/kg 2007
Coffee beans 0.2 mg/kg 2007
Cotton seed 0.3 mg/kg 2007
Cucumber 1 mg/kg 2007
Custard apple 0.5 mg/kg 2007
Egg plant 0.1 mg/kg 2007
Eggs 0.03 mg/kg 2007
Hazelnuts 0.02 mg/kg 2007
Kidney of cattle, goats, pigs and sheep 0.03 mg/kg 2007
Litchi 2 mg/kg 2007
Liver of cattle, goats, pigs & sheep 0.1 mg/kg 2007
Macadamia nuts 0.02 mg/kg 2007
Mango 0.5 mg/kg 2007
Meat (from mammals other than marine mammals) 0.2 mg/kg 2007
Melons, except watermelon 2 mg/kg 2007
Milk fats 0.1 mg/kg 2007
Milks 0.01 mg/kg 2007
Papaya 0.5 mg/kg 2007
Persimmon, American 2 mg/kg 2007
Potato 0.05 mg/kg 2007
Poultry meat 0.03 mg/kg 2007
Poultry, Edible offal of 0.03 mg/kg 2007
Soya bean (dry) 1 mg/kg 2007
Soya bean oil, Crude 2 mg/kg 2007
Squash, summer 0.5 mg/kg 2007
Sweet potato 0.05 mg/kg 2007
Tea, Green, Black (black, fermented and dried) 10 mg/kg 2011
Tomato 0.5 mg/kg 2003

SECTION 8: FOOD QUALITY AND SAFETY
_________________________________________________________________________________________
_________________________________________________________________________________________
928
Table 7. Lindane in Codex Alimentarius (http://www.codexalimentarius.org)
Commodity Maximum Residue Limits
(MRL)
Year of
Adoption
Barley 0.01 mg/kg 2004
Edible offal (mammalian) 0.01 mg/kg 2004
Eggs 0.01 mg/kg 2004
Maize 0.01 mg/kg 2004
Meat (from mammals other than marine mammals) 0.1 mg/kg 2004
Milks 0.01 mg/kg 2004
Oats 0.01 mg/kg 2004
Poultry meat 0.05 mg/kg 2004
Poultry, Edible offal of 0.01 mg/kg 2004
Rye 0.01 mg/kg 2004
Sorghum 0.01 mg/kg 2004
Straw and fodder (dry) of cereal grains 0.01 mg/kg 2004
Sweet corn (kernels) 0.01 mg/kg 2004
Wheat 0.01 mg/kg 2004
Table 8. Veterinary Drugs in Foods
Codex Alimentarius Commission
Updated as at the 34th Session of the Codex Alimentarius Commission (July 2011)
Veterinary Drugs in Foods
Abamectin Gentamicin Albendazole
Imidocarb Avylamycin Isometamidium
Azaperone Ivermectin Benzylpenicillin/Procaine benzyl
penicillin
Levamisole Carazolol Lincomycin
Ceftiofur Melengestrol acetate Chlortetracycline/
Oxytetracycline/Tetracycline
Monensin Clenbuterol Moxidectin
Closantel Narasin Colistin
Neomycin Cyfluthrin Nicarbazin
Cyhalothrin Phoxim Cypermethrin and alpha-
cypermethrin
Spiramycin Dicyclanil Spectinomycin
Pirlimycin Danofloxacin Porcine somatotropin
Dihydrostreptomycin/Streptomycin Progesterone Dexamethasone
Deltamethrin Sarafloxacin Diclazuril
Diminazene Testosterone Doramectin
Thiabendazole Eprinomectin Tilmicosin
Erythromycin Trenbolone acetate Estradiol-17beta
Sulfadimidine Trichlorfon (Metrifonate) Febantel/Fenbendazole
Oxfendazole Triclabendazole Fluazuron
Tylosin Flubendazole Zeranol
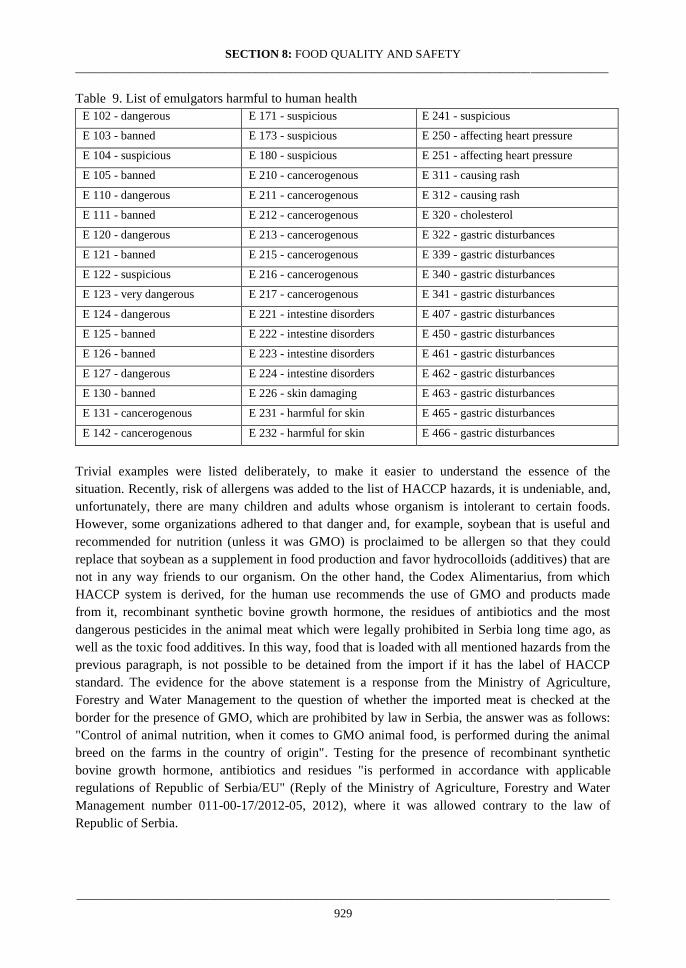
SECTION 8: FOOD QUALITY AND SAFETY
_________________________________________________________________________________________
_________________________________________________________________________________________
929
Table 9. List of emulgators harmful to human health
E 102 - dangerous E 171 - suspicious E 241 - suspicious
E 103 - banned E 173 - suspicious E 250 - affecting heart pressure
E 104 - suspicious E 180 - suspicious E 251 - affecting heart pressure
E 105 - banned E 210 - cancerogenous E 311 - causing rash
E 110 - dangerous E 211 - cancerogenous E 312 - causing rash
E 111 - banned E 212 - cancerogenous E 320 - cholesterol
E 120 - dangerous E 213 - cancerogenous E 322 - gastric disturbances
E 121 - banned E 215 - cancerogenous E 339 - gastric disturbances
E 122 - suspicious E 216 - cancerogenous E 340 - gastric disturbances
E 123 - very dangerous E 217 - cancerogenous E 341 - gastric disturbances
E 124 - dangerous E 221 - intestine disorders E 407 - gastric disturbances
E 125 - banned E 222 - intestine disorders E 450 - gastric disturbances
E 126 - banned E 223 - intestine disorders E 461 - gastric disturbances
E 127 - dangerous E 224 - intestine disorders E 462 - gastric disturbances
E 130 - banned E 226 - skin damaging E 463 - gastric disturbances
E 131 - cancerogenous E 231 - harmful for skin E 465 - gastric disturbances
E 142 - cancerogenous E 232 - harmful for skin E 466 - gastric disturbances
Trivial examples were listed deliberately, to make it easier to understand the essence of the
situation. Recently, risk of allergens was added to the list of HACCP hazards, it is undeniable, and,
unfortunately, there are many children and adults whose organism is intolerant to certain foods.
However, some organizations adhered to that danger and, for example, soybean that is useful and
recommended for nutrition (unless it was GMO) is proclaimed to be allergen so that they could
replace that soybean as a supplement in food production and favor hydrocolloids (additives) that are
not in any way friends to our organism. On the other hand, the Codex Alimentarius, from which
HACCP system is derived, for the human use recommends the use of GMO and products made
from it, recombinant synthetic bovine growth hormone, the residues of antibiotics and the most
dangerous pesticides in the animal meat which were legally prohibited in Serbia long time ago, as
well as the toxic food additives. In this way, food that is loaded with all mentioned hazards from the
previous paragraph, is not possible to be detained from the import if it has the label of HACCP
standard. The evidence for the above statement is a response from the Ministry of Agriculture,
Forestry and Water Management to the question of whether the imported meat is checked at the
border for the presence of GMO, which are prohibited by law in Serbia, the answer was as follows:
"Control of animal nutrition, when it comes to GMO animal food, is performed during the animal
breed on the farms in the country of origin". Testing for the presence of recombinant synthetic
bovine growth hormone, antibiotics and residues "is performed in accordance with applicable
regulations of Republic of Serbia/EU" (Reply of the Ministry of Agriculture, Forestry and Water
Management number 011-00-17/2012-05, 2012), where it was allowed contrary to the law of
Republic of Serbia.
SECTION 8: FOOD QUALITY AND SAFETY
_________________________________________________________________________________________
_________________________________________________________________________________________
930
Conclusions
Based on the above stated, one can clearly conclude that Codex Alimentarius, as well as from it
derived HACCP system, are contrary to the Rotterdam and Stockholm Convention, RS Constitution
(Constitution of Republic of Serbia), and several laws on force, such as the Law on Ratification of
the Rotterdam Convention (Law on Ratification of the Rotterdam Convention, "Official Gazette RS
- International Treaties" No. 38/2009), Law on Ratification of the Stockholm Convention (Law on
Ratification of the Stockholm Convention, "Official Gazette of the Republic of Serbia -
International Treaties", 1998), The Food Safety Act (Official Gazette of the Republic of Serbia, No.
41/09), Law on Agricultural Land ("Official Gazette RS" No. 62 / 2006 ), The Law on
Environmental Protection ("Official Gazette RS" No. 135/2004), Health Care Law ("Official
Gazette RS" No. 107/05), Law on Genetically Modified Organisms ("Official Gazette RS" No.
41/2009).
With consistent application of national laws and regulations, if the regulative is based on traditional
values, of course, the need for introducing and completing the demands and rules of
unconstitutional and illegal Codex Alimentarius and mentioned standards can be excluded. They
have, as already mentioned, one completely different role in the food production system and in
nutrition system. That system excludes balanced and safe nutrition and as we can witness, leads this
planet with human population to unconditional downfall.
References
http://www.upravacarina.rs
Constitution of Republic of Serbia.
Law on Ratification of the Rotterdam Convention, "Official Gazette RS - International Treatises",
No. 38/year 2009.
Law on Ratification of the Stockholm Convention, "Official Gazette of the Republic of Serbia -
International Treaties", 1998.
http://www.codexalimentarius.org
Law on production and trade of toxic substances, "Official Gazette SRY", No. 15/95, 28/96 and
37/2002 and "Official Gazette RS", No. 101/2005 – oth. law. the therapy of poisoning/Novi Sad -
2003.
Šovljanski Radmila 2003.Pesticides-symptomatology and therapy of poisoning. Novi Sad .
Law on Food Safety, "Official Gazette of Republic of Serbia", No. 41/09.
Law on Agricultural Land, "Official Gazette RS", No. 62 / 2006.
Law on Environmental Protection, "Official Gazette RS" No. 135/2004.
Law on Health Care, "Official Gazette RS" No. 107/05.
Law on Genetically Modified Organisms "Official Gazette RS" No. 41/2009.
The reply of Ministry of Agriculture, Forestry and Water Management number 011-00-17/2012-05
from 22 August 2012.
Certificate of the border phytosanitary inspection for import of Monsanto corn seeds by MK Group.
SECTION 8: FOOD QUALITY AND SAFETY
_________________________________________________________________________________________
_________________________________________________________________________________________
931
ПРИМЕНА НА ЗАКОНИТОСТА НА CODEX ALIMENTARIUS ВО СРБИЈА
Ана Перениќ, Радован Кривокапиќ, Никола Алексиќ
Апстракт
Овој труд се занимава со докажување на нелегалноста на воведувањето на Codex Alimentarius
и од него развиениот HACCP-систем во законодавството на Република Србија. Имено, во
овој труд се користени методи за споредба на правните норми со препорачаниот Кодекс, кои
се во спротивност со Уставот на РС, Ротердам и Стокхолмската конвенција, неколку
применливи закони, додека производите означени со Codex Alimentarius и од него
произлезениот HACCP - стандард кој не е во согласност со применливиот закон, илегално се
појавува на српскиот пазар.
Клучни зборови: Кодекс Алиментариус, HACCP, здрава храна, хемикалии, законитост.