seb corporate & private customers · president & ceo life business support group staff...
TRANSCRIPT

SEB Corporate & Private Customers(a.k.a Retail Banking)
Mats TorstendahlVice President of SEB &Head of Corporate & Private Customers

President & CEO
Life
Business Support
Group Staff Functions
Corporate & Private Customers Large Corporates & Financial Institutions Baltic
1 Reports directly to the Board of SEB Group.
Investment Management
Group Risk Internal Audit1Group Compliance
2

C&PC more than 1/3 of SEB Group
35%
42%
13%
10%
35%
39%
15%
11%24%
13%
9%16%
26%
11%
Corporate & Private Customers
Large Corporates & Financial Institutions
Life & Investment Management
Baltics
Business support
Staff and other
SEK 46bn SEK 23bn2) 14,8003)
Operating income1) EmployeesOperating profit1)
1) 2018, excluding other2) Operating profit before items affecting comparability3) Average number of full time equivalents 2018
SEK 15.4bn SEK 7.8bn 3,590
3
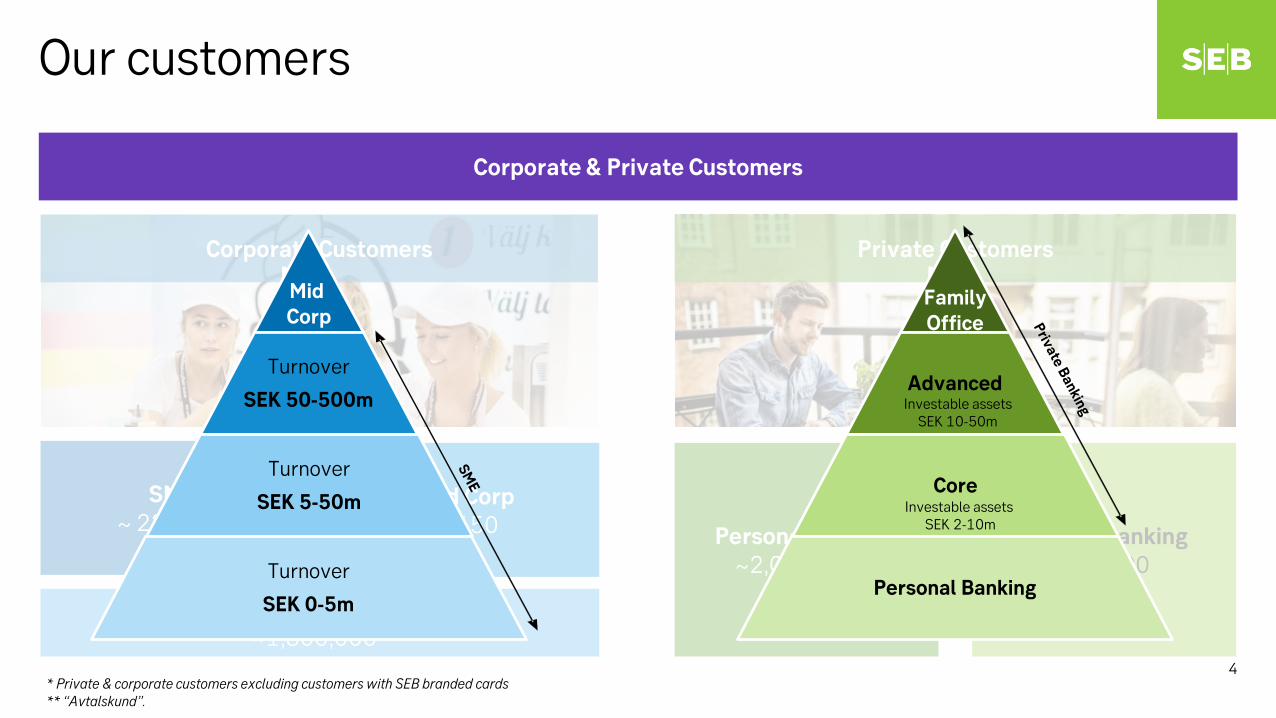
Our customers
Corporate & Private Customers
SME~ 225,000
Mid Corp~ 650
SEB Kort ~1,800,000*
Corporate Customers
Private Banking~35,000
Personal Banking ~2,000,000**
Private Customers
* Private & corporate customers excluding customers with SEB branded cards** “Avtalskund”.
Mid Corp
Turnover
SEK 50-500m
Turnover
SEK 5-50m
Turnover
SEK 0-5m
Mid Corp
Mid Corp
Advanced
Core
Personal Banking
FamilyOffice
Investable assetsSEK 2-10m
Investable assets SEK 10-50m
4

Credit losses
Growing income with stable costsand low credit losses
* Private Banking restated to 2014
*
11,180
15,127 15,418
4,353
7,739 7,845
-6,375 -6,887-7,146
-452 -502 -427
2012 2013 2014 2015 2016 2017 2018
Income
Profit
Costs
10%CAGR profit
6%CAGR income
-1%CAGR credit losses
-2%CAGR costs
5
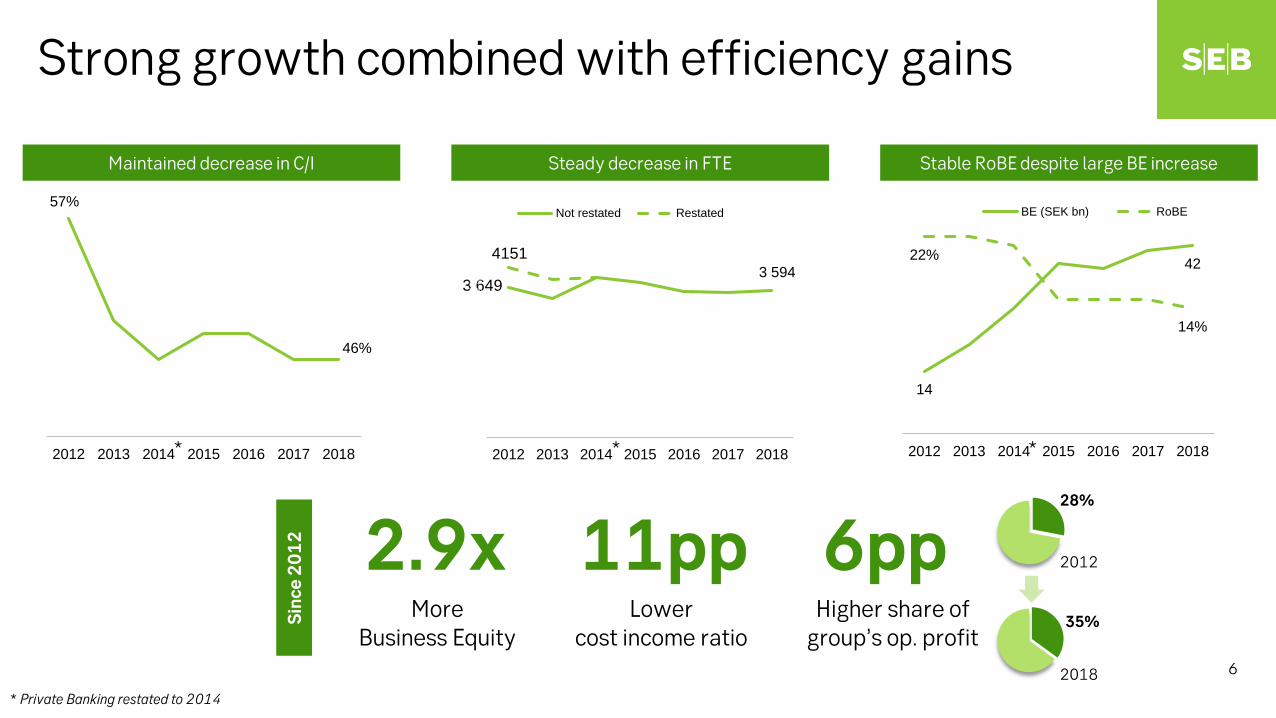
Strong growth combined with efficiency gains
* Private Banking restated to 2014
2.9xMore
Business Equity
11ppLower
cost income ratio
Sinc
e20
12 6ppHigher share of
group’s op. profit
57%
46%
2012 2013 2014 2015 2016 2017 2018
14
4222%
14%
0%
5%
10%
15%
20%
25%
0
10
20
30
40
50
2012 2013 2014 2015 2016 2017 2018
BE (SEK bn) RoBE
3 6493 594
4151
0
200
400
600
800
1 000
1 200
1 400
1 600
1 800
2 000
2 200
2 400
2 600
2 800
3 000
3 200
3 400
3 600
3 800
4 000
4 200
4 400
2012 2013 2014 2015 2016 2017 2018
Not restated Restated
Maintained decrease in C/I Steady decrease in FTE Stable RoBE despite large BE increase
* * *
35%
28%
2018
2012
6
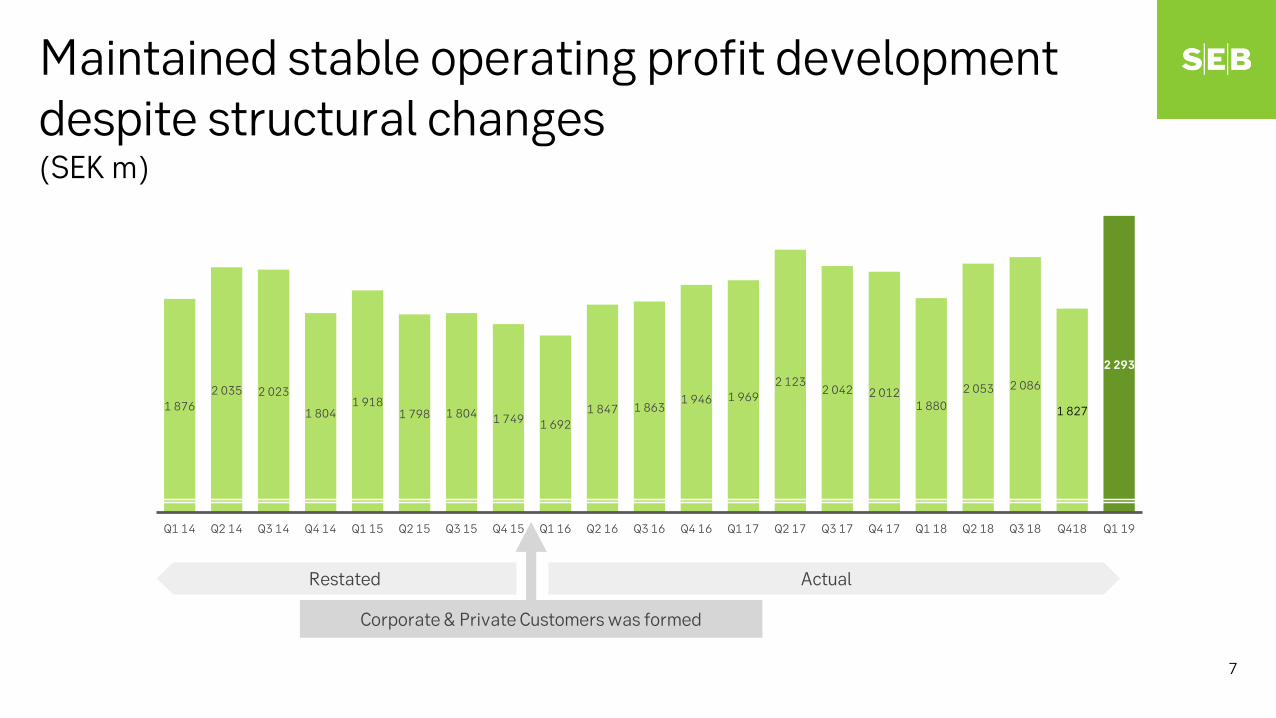
Maintained stable operating profit development despite structural changes (SEK m)
1 8762 035 2 023
1 8041 918
1 798 1 804 1 749 1 6921 847 1 863
1 946 1 9692 123
2 042 2 0121 880
2 053 2 086
1 827
2 293
Q1 14 Q2 14 Q3 14 Q4 14 Q1 15 Q2 15 Q3 15 Q4 15 Q1 16 Q2 16 Q3 16 Q4 16 Q1 17 Q2 17 Q3 17 Q4 17 Q1 18 Q2 18 Q3 18 Q418 Q1 19
Corporate & Private Customers was formed
Restated Actual
7

2017 Dec Mar Jun Sep 2018 Dec 2019 Mar
SEB Market
0
50
100
150
200
250
2014
2015
2016
2017
2018
Full-service customers (thousand) Customers (thousand)
Corporate growth driven by both new and existing customers, yielding a stable market share increase
Stable corporate customer growth Corporate lending growing above market (index)
20182017201620152014
+10%
Full year 2018 YTD growth (ann.)
183
225
+8%
8
+10%
+6%
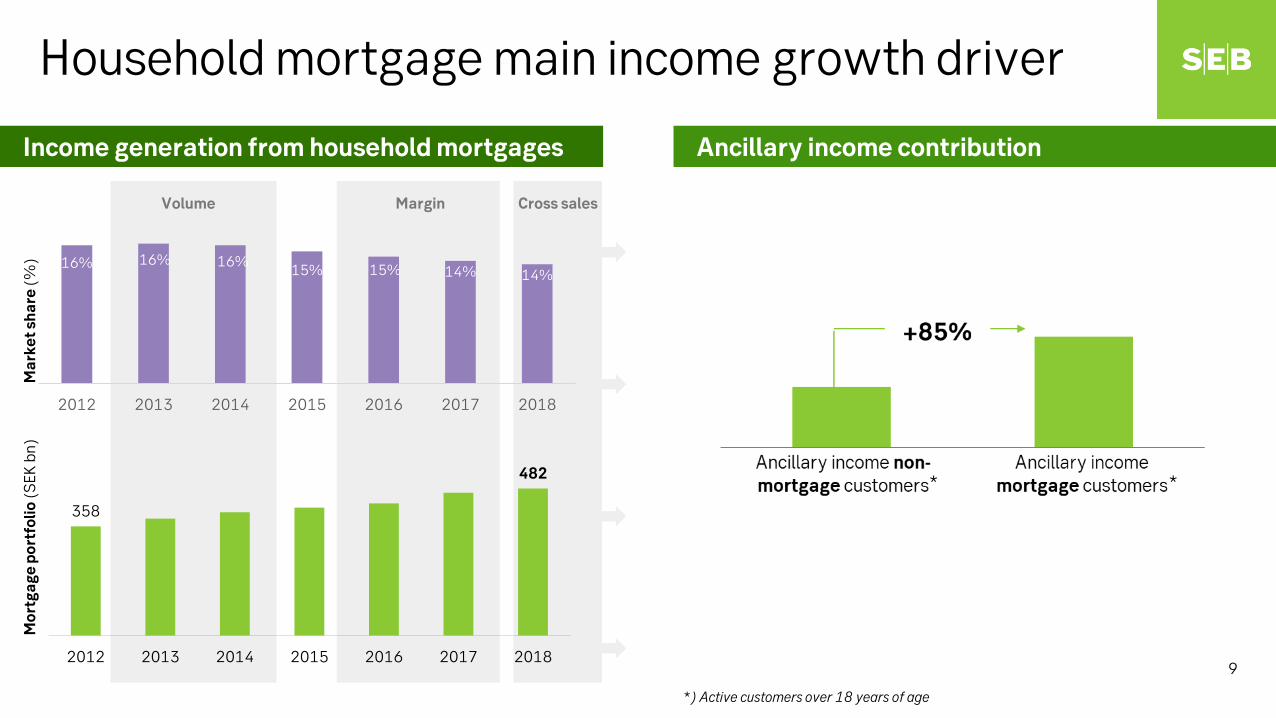
* *358
482
0
100
200
300
400
500
600
2012 2013 2014 2015 2016 2017 2018
Cross salesVolume Margin
Mar
ket s
hare
(%)
Household mortgage main income growth driver
Income generation from household mortgages Ancillary income contribution
*) Active customers over 18 years of age
16% 16% 16% 15% 15% 14% 14%
2012 2013 2014 2015 2016 2017 2018
9
Mor
tgag
e po
rtfo
lio(S
EK b
n)

7%
10%
2%
5%4%
10%
1%
8%
3%
4%
9%
4%
8%
13%
11%
Jan Feb Mar Apr May Jun Jul Aug Sep Oct Nov Dec Jan Feb Mar
10% YTD 2019
Distribution through strategic partners
Local ownership and focus
Price management
Customer service
Churn mitigation
Marketing & price campaigns
Distribution capacity
Underwriting standards & risk
Offering
Focu
s go
ing
forw
ard
Household mortgage market share
2018 2019
10

-15
-5
5
15
25
35
45
55
dec-13 mar-14 jun-14 sep-14 dec-14 mar-15 jun-15 sep-15 dec-15 mar-16 jun-16 sep-16 dec-16 mar-17 jun-17 sep-17 Dec-17 Mar-18 Jun-18 Sep-18 Dec-18 Mar-19
Corporate advisory Corporate teller Private advisory Private teller
Customer satisfaction
60
65
70
75
2013 2014 2015 2016 2017 2018
SEB corporate Industry corporate
SEB private Industry private
0,0
1,0
2,0
3,0
4,0
5,0
2013 2014 2015 2016 2017 2018
SEB small enterprise bank SEB business bank
# 2
# 2
2723
#2#2
EPSI
NPS
Fina
nsba
rom
eter
n
Among incumbents
5053
11

Open bankingAn industry
in change
What came out differently vs 2015?
Profit pool outlook
Customer insights
Market insights
High demand for ”one point of entry”
Having several banks -the new “normal”
Continued interest in digital services
Proactivity more important to build trust
Expectations driven byother service providers
Negative interest rates
Artificial intelligence
Non-bank entrants and Fintechs
Growth in deposits NIICustomers demand personalised advice & self service in digital channels
Household mortgage remain a key profit pool
Big data & advanced analytics enable moreefficient relationship management
Relatively more dependent on NIIOpen banking intensifies competition & opens up new playing fields
Incumbent banks are investing heavily in customer journeys & remain key competitors
Savings market 3x the mortgage market
12

New technology is changing customerbehaviour
Branch office visits (with transaction)(thousand, per quarter)
Private Corporate
139
60
2013 Q4 2019 Q1
408
239
Private Corporate
Contact Centre calls (thousand, per quarter)
67
2013 Q4 2019 Q1
439
36
451
Web Mobile Web Mobile2013 Q4 2019 Q1
Corporate digital logins (million, per quarter)
Private digital logins (million, per quarter)
2013 Q4 2019 Q1
43
10
3.32.8
2.4
0.310.7
13.9
13

Customer needs oriented advisory
Care for ambition. Always. Everywhere
Life eventsCorporate phases
14

Customer needs oriented advisory
Care for ambition. Always. Everywhere
Life eventsCorporate phases
15

New customer interaction
New distribution channels
Further personalisationthrough application of data
Predictive growth model Anti-churn model
16

Demand for sustainability is increasing
CUSTOMER
“If I do good, what do you do?”
BANK
“Is green good?”
SOCIETY
“What’s the impact?”
Green household mortgage
Sustainable investments
Green car leasing
Ownership dialogues
17

…deliver world-class service to our customers continues
The journey to…
19