search, effort, and locus of control - iza
TRANSCRIPT
DI
SC
US
SI
ON
P
AP
ER
S
ER
IE
S
Forschungsinstitut zur Zukunft der ArbeitInstitute for the Study of Labor
Search, Effort, and Locus of Control
IZA DP No. 5948
August 2011
Andrew McGeePeter McGee
Search, Effort, and Locus of Control
Andrew McGee Simon Fraser University
and IZA
Peter McGee National University of Singapore
Discussion Paper No. 5948 August 2011
IZA
P.O. Box 7240 53072 Bonn
Germany
Phone: +49-228-3894-0 Fax: +49-228-3894-180
E-mail: [email protected]
Any opinions expressed here are those of the author(s) and not those of IZA. Research published in this series may include views on policy, but the institute itself takes no institutional policy positions. The Institute for the Study of Labor (IZA) in Bonn is a local and virtual international research center and a place of communication between science, politics and business. IZA is an independent nonprofit organization supported by Deutsche Post Foundation. The center is associated with the University of Bonn and offers a stimulating research environment through its international network, workshops and conferences, data service, project support, research visits and doctoral program. IZA engages in (i) original and internationally competitive research in all fields of labor economics, (ii) development of policy concepts, and (iii) dissemination of research results and concepts to the interested public. IZA Discussion Papers often represent preliminary work and are circulated to encourage discussion. Citation of such a paper should account for its provisional character. A revised version may be available directly from the author.
IZA Discussion Paper No. 5948 August 2011
ABSTRACT
Search, Effort, and Locus of Control We test the hypothesis that locus of control – one’s perception of control over events in life – influences search by affecting beliefs about the efficacy of search effort in a laboratory experiment. We find that reservation offers and effort are increasing in the belief that one’s efforts influence outcomes when subjects exert effort without knowing how effort influences the generation of offers but are unrelated to locus of control beliefs when subjects are informed about the relationship between effort and offers. These effects cannot be explained by locus of control’s correlation with unmeasured human capital, personality traits, and the costs of search – alternative explanations for the relationships between locus of control and search behavior that cannot be ruled out using survey data – as the search task does not vary across treatments, which leads us to conclude that locus of control influences search through beliefs about the efficacy of search effort. Our findings provide evidence that locus of control measures can be used to identify job seekers at risk of becoming “discouraged” and abandoning search. JEL Classification: J64, D83, C91 Keywords: locus of control, reservation wages, labor market search, experiment Corresponding author: Andrew McGee Department of Economics Simon Fraser University 8888 University Drive Burnaby, BC V5A 1S6 Canada E-mail: [email protected]
1
I. Introduction
Few personality traits studied by psychologists have generated as much interest among
economists as locus of control, one’s beliefs concerning the relationship between one’s actions and
outcomes in life (Rotter 1966). Individuals with an external locus of control believe that outcomes are
primarily matters of fate or chance. At the other extreme of this continuum of beliefs, individuals
with an internal locus of control believe outcomes depend primarily on their own efforts. Easily
measured and recorded in surveys including the National Longitudinal Surveys of Youth (NLSY) and
the German Socio-Economic Panel (GSOEP), locus of control is correlated with important economic
outcomes such as earnings (Andrisani 1977, 1981; Goldsmith, Veum, and Darity 1997; Osborne-
Groves 2005), educational attainment (Coleman and DeLeire 2003; Baron and Cobb-Clark 2010;
Piatek and Pinger 2010), and unemployed job search (Caliendo, Cobb-Clark, and Uhlendorff 2010;
McGee 2010). In spite of the widespread interest in locus of control and its obvious importance, how
locus of control influences behavior is not well understood given the limitations of survey data.
While psychologists envision locus of control influencing behavior through beliefs about the efficacy
of effort, the documented effects of locus of control could result from its correlation with unobserved
dimensions of human capital, personality, and effort costs.
In this study, we aim to identify the mechanism through which locus of control influences
behavior. Specifically, we examine the relationship between locus of control and search behavior in a
laboratory experiment in which subjects “search” by exerting effort that influences the stochastic
process by which monetary offers are generated. Key to our study is the fact that the laboratory
allows us to control what subjects know about the return to effort. Subjects “search” in a limited
information treatment in which the benefit to their effort is not made clear to them followed by a full
information treatment in which the relationship between effort and the process by which offers are

2
generated is fully explained to them. We hypothesize that in the limited information treatment
internal individuals who believe their actions influence outcomes will believe the rate of return to
effort to be higher than their less internal peers and exert more effort searching and set higher
reservation offers. We expect locus of control to have no effect on behavior in the full information
treatment when there is no uncertainty about the relationship between effort and outcomes. Our
approach allows us to rule out the competing explanations for the role of locus of control. We control
for a wider variety of psychological characteristics than are generally found in survey data, and the
real effort task is the same in both the limited and full information treatments such that if locus of
control’s effect stems from its correlation with unobserved dimensions of human capital, personality,
or effort costs then its effect on search behavior should not vary across treatments.
The experimental design is straightforward. Subjects participated in search episodes lasting
for 21 periods. All subjects began a search episode in possession of an outside option which they
earned in any period in which they had not accepted an offer through the 20th period. In each period,
subjects had the opportunity to perform tasks—the experimental analog of search effort—that
increased the probability that they receive an offer. If an offer was received, subjects decided whether
to accept the offer and receive that amount in each subsequent period (i.e., their search ends) or
refuse the offer and search again in the next period. In the limited information treatment, subjects
were not informed of the relationship between completed tasks and the probability of receiving an
offer, while in the full information treatment they were made aware that each completed task
increased the probability of receiving an offer by four percentage points. The distribution of potential
offers was common knowledge in all search episodes. In periods during which a subject searched in
the limited information treatment, the subject was asked what he/she believed the probability that an
offer would be received was, and subjects reported in both treatments in periods involving search

3
their reservation offer before learning whether they received an offer. Finally, subjects completed a
survey collecting information on the subject’s background, locus of control, risk preferences, and
personality traits using standard measures found in survey data.
In section II, we present a search model in which locus of control influences beliefs about the
efficacy of search effort. More internal individuals believe themselves more likely to receive an offer
conditional on any amount of effort than less internal searchers; they set higher reservation offers as a
result. Likewise, more internal individuals perceive the marginal benefit to search effort to be higher
than less internal individuals and exert more effort as a result. Consistent with these predictions, we
find that reservation offers and effort are positively related to internality in the limited information
treatment. A one-standard deviation increase in internality is associated with an estimated increase in
reservation offers of 1.2 experimental currency units (ECUs) and an estimated increase of 0.9 items
completed in a sample in which offers range from 5 to 45 ECUs and subjects average nearly 10 items
completed per period. By contrast, we find no evidence that locus of control is related to reservation
offers or items completed in the full information treatment.
McGee (2010) and Caliendo et al. (2010) find that internality is positively related to search
effort and reservation wages among unemployed job seekers using the NLSY79 and GSOEP,
respectively. More internal job seekers, however, may expend more effort and hold out for higher
wages because they are, in fact, better at searching or because they know that skills correlated with
locus of control and unobserved by econometricians make them more desirable to employers than
less internal individuals. Alternatively, more internal individuals may be less bothered by expending
effort on search. These alternative explanations for the correlations between locus of control and
search behavior cannot generally be ruled out using survey data, but they also cannot explain the
differences observed across treatments in our experiment. Given that the only difference between the
4
treatments is what the subjects know about the return to effort, an effect of locus of control on beliefs
about the efficacy of effort can explain these observed differences in behavior.
Studying the connection between beliefs about the return to effort and job search is, in part,
motivated by the phenomenon of discouraged workers who enter long-term non-employment because
they no longer believe that they can find a job (Schweitzer & Smith 1974). Surprisingly,
discouragement presents itself in this short experiment as in 29% and 12% of subject-period
observations in the limited and full information treatments, respectively, subjects “quit” in that they
either choose to complete no tasks or stop attempting tasks before their time allotment expires. This
phenomenon is strongly related to subjects’ locus of control as more external individuals are
substantially more likely to “quit” than their more internal peers.
Our findings contribute to the growing labor literature studying the relationships between
personality and “soft” skills and labor market outcomes, but the study also contributes to a well-
established literature concerning experimental labor markets. As articulated in Falk and Fehr (2003),
the laboratory provides an excellent methodological tool because it affords the experimenter control
over a number of aspects of the labor market environment. Early studies with exogenous offer arrival
rates (Braunstein & Schotter 1981, 1982; Cox & Oaxaca 1989) exploited this control to demonstrate
that the predictions of job search models with respect to reservation wages are borne out in the
laboratory. Recent experimental studies have investigated how factors beyond the scope of standard
job search models such as wait times (Brown et al. 2011) and self-image (Falk et al 2006) influence
subjects’ search choices. In this vein, ours is the first study to leverage the control afforded by the
laboratory to examine the effects of locus of control on search.
From a policy point of view, our findings have two important implications. First, we show in
an additional treatment that providing searchers with information concerning the experiences of past
5
searchers—how much effort they exerted and whether they received an offer—can reduce searchers’
reliance on locus of control beliefs that may introduce a behavioral bias causing them to search too
little or hold out for excessively high wages. This suggests that fairly minimal counseling for the
unemployed can be welfare-enhancing. Second, our findings indicate that programs supporting
unemployed job seekers can identify individuals at risk of becoming discouraged and exiting the
labor market using simple measures of locus of control beliefs.
While we have labor market search in mind, our findings in the abstract laboratory setting
provide insight into how locus of control will affect decision-making in settings ranging from
investment behavior to spousal search to consumer search. Specifically, our findings suggest that in
any setting requiring effort choices in which the return to effort is uncertain, locus of control will
influence both how much effort the individual exerts and how selective the individual is—insights
which have important practical implications. For instance, marketers and internet dating sites might
wish to target external individuals who would otherwise exert less effort searching on their own.
Marketers may want to “de-bias” internal individuals to induce them to purchase rather than holding
out for a “steal.” While locus of control undoubtedly affects behavior in these settings, determining
how is only possible through an experimental study such as ours.
II. Search Model
We model search over a finite horizon (� = 1,2, … ,21)with endogenous search effort
determining the probability of receiving an offer in any period. Searchers receive an outside offer (a
search subsidy), , in every period in which they have not previously accepted an offer received
through their search through the 20th period; they receive nothing in the 21st period if they have not
accepted an offer. The offers � are drawn from a discrete distribution in which
� ∈ �, �, �, �, �, �, �� and ∑ Pr��� = 1���� . In any period before an offer has been
6
accepted, the individual chooses how much effort to exert �� ∈ 0,1, … , �̅� and a reservation offer �!
such that only offers greater than or equal to �! are accepted. If an offer is accepted in period t, the
subject receives this amount in every period from t+1 through and including the 21st period. The
effort exerted determines the probability that an offer is received:
Pr(#$$%&� = 1) = '�� if�� <1' and1otherwise
where #$$%&� = 1 indicates that an offer is received in period t and ' represents the productivity of
search effort. The costs of search effort are given by )(��) where ) ′ > 0, ) ′′ > 0. The period utility
given an offer in hand is +(), and we assume that +(0) = 0 and )(0) = 0. For convenience, we
assume that individuals do not discount future periods.
The searcher chooses effort and a reservation offer to maximize the present value of search
,�- = +() − )(��) + '�� Pr( ≥ �!) (21 − �)1 +()| ≥ �!�
+(1 − '�� Pr( ≥ �!)),�3�-
Given that ,��- = 0, this maximization problem can be solved recursively in a straightforward
fashion, but solving for this solution is complicated by the fact that the cost of real effort is known
only to the individual, an issue we discuss in the next section.
We assume, however, that individuals are uncertain about the return to search effort, ', and
choose search effort and reservation offers to maximize instead
1(,�-) = +() − )(��) + 1 '|4�565��5�� , 47$$%&565��
5�� , 8��� Pr( ≥ �!) (21 − �)1 +()|
≥ �!� + (1 − 1 '|4�565��5�� , 47$$%&565��
5�� , 8���)Pr( ≥ !�),�3�-
where the individual’s subjective estimate of the return to effort, 1 '|4�565��,5�� , 47$$%&565��,
5�� , 8�,
depends on prior search effort choices, outcomes, and individual characteristics 8 that inform the
individual’s prior regarding the return to search effort. As individuals acquire search experience, they
7
should update away from this prior based on their experiences, but the factors X will have a persistent
effect on behavior to the extent that prior beliefs continue to affect behavior. Among the
characteristics included in X is an individual’s locus of control. Similar to the labor contracts model
of Bowles et al. (2001), we assume that an individual’s subjective estimate of the return to search
effort is increasing in one’s sense of control, internality. That is, 9: ;|4<=6=>?,
=>@ ,4ABBC!=6=>?,=>@ ,D�,
9EAFG< > 0, where
H7)+� is increasing in internality. The model’s key testable predictions are that more internal
individuals will exert greater effort in each period and hold out for higher reservation offers than less
internal individuals (see McGee (2010) or Caliendo et al. (2010) for derivations of these predictions
in similar settings). More internal searchers expect to receive an offer with higher probability
conditional on any amount of search effort than less internal searchers, so they hold out for higher
offers. Similarly, more internal searchers believe the marginal return to search effort to be higher than
less internal searchers, so they exert more effort.
III. Experimental Design and Data
Subjects were undergraduate students at The Ohio State University randomly invited to
participate in sessions lasting just over two hours each. In each session, subjects participated in 2-4
search episodes and completed a short questionnaire. Subjects were informed that each search
episode would last 21 periods, that they would only earn experimental currency units (ECUs) in the
21st period of a search episode if they had accepted an offer in an earlier period, that they would earn
the outside option (15 ECUs) in every period prior to accepting an offer (except for the 21st period),
and that at the end of the experiment earnings in ECUs would be converted to dollars at a rate of 100
ECUs to $1. Offers generated by search effort were drawn from the discrete distribution with seven
points of support described in table 1, and this distribution was explained to subjects in the
instructions (provided in the Appendix) prior to the experiment.
8
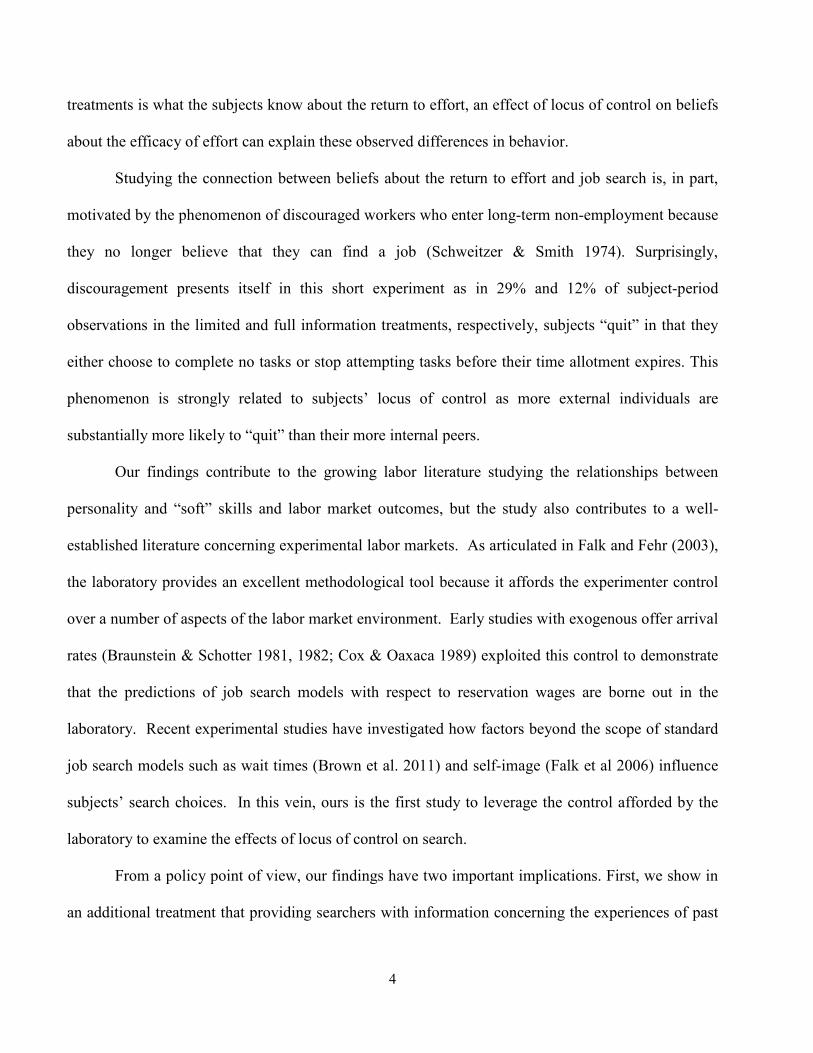
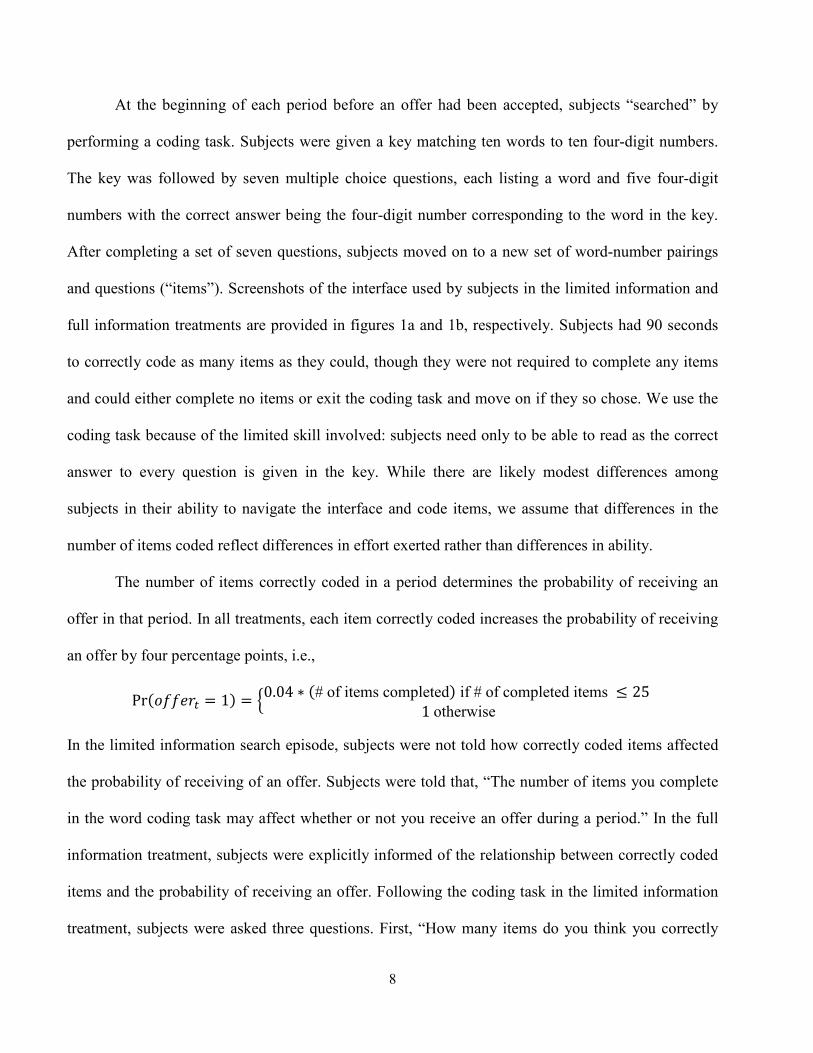
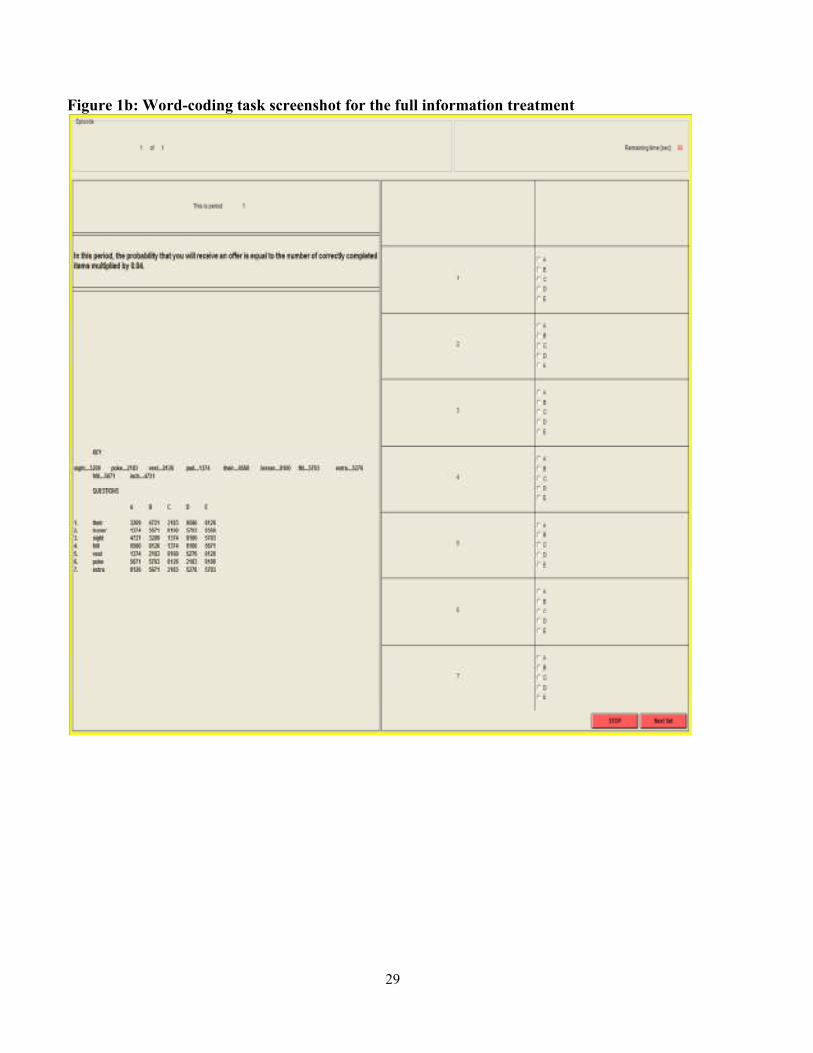
At the beginning of each period before an offer had been accepted, subjects “searched” by
performing a coding task. Subjects were given a key matching ten words to ten four-digit numbers.
The key was followed by seven multiple choice questions, each listing a word and five four-digit
numbers with the correct answer being the four-digit number corresponding to the word in the key.
After completing a set of seven questions, subjects moved on to a new set of word-number pairings
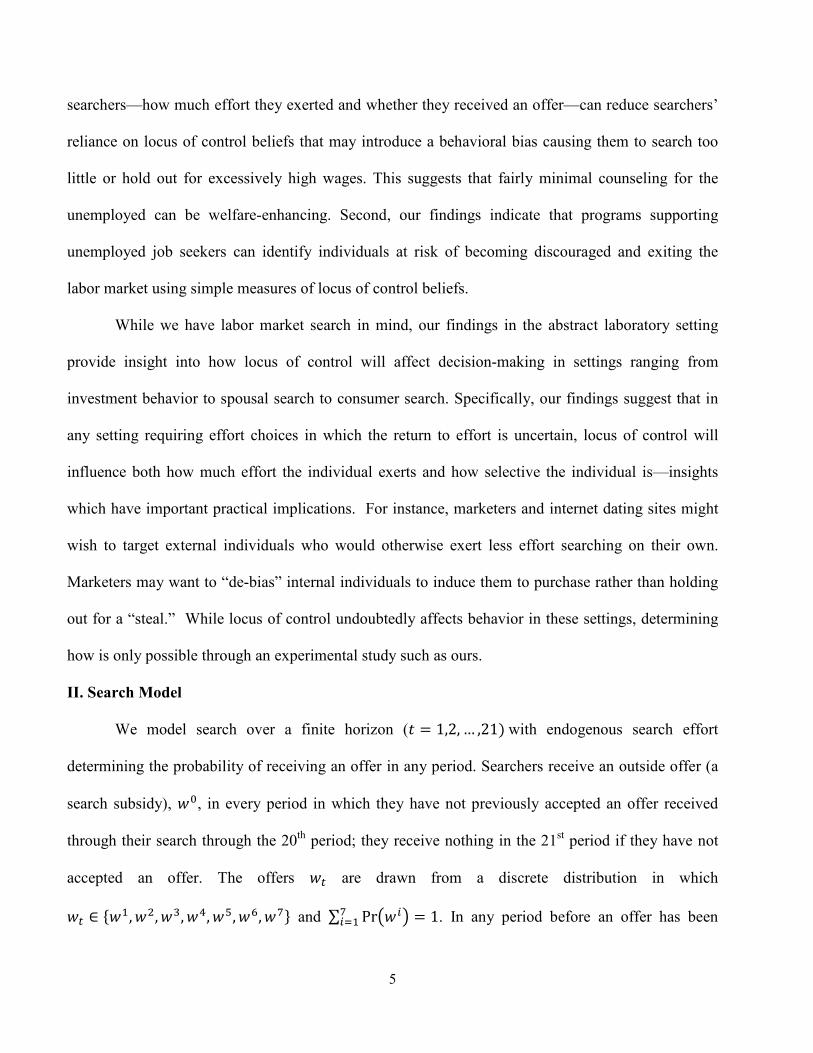
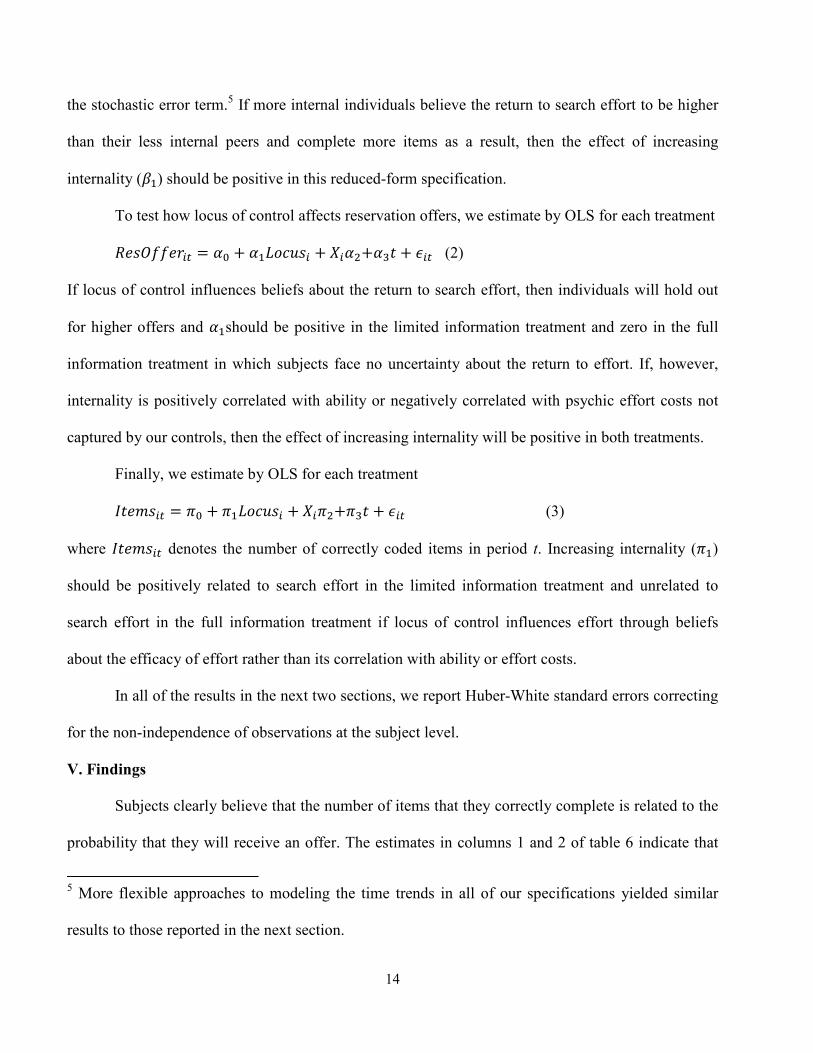
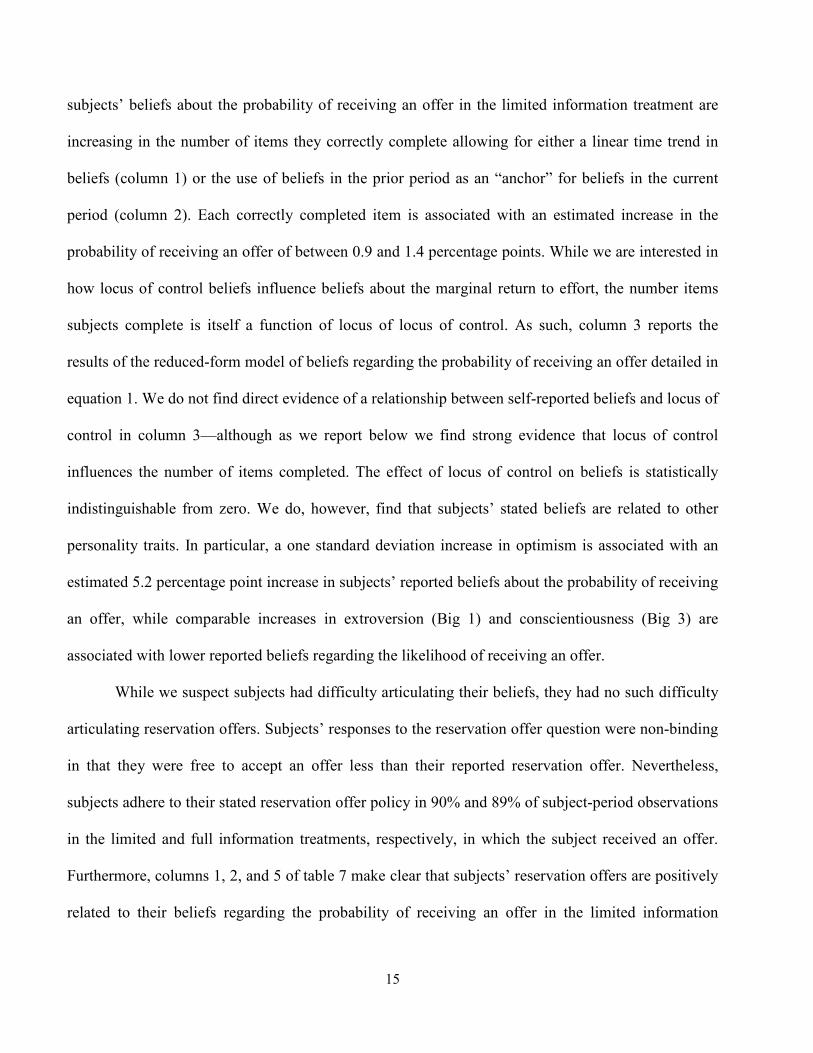
and questions (“items”). Screenshots of the interface used by subjects in the limited information and
full information treatments are provided in figures 1a and 1b, respectively. Subjects had 90 seconds
to correctly code as many items as they could, though they were not required to complete any items
and could either complete no items or exit the coding task and move on if they so chose. We use the
coding task because of the limited skill involved: subjects need only to be able to read as the correct
answer to every question is given in the key. While there are likely modest differences among
subjects in their ability to navigate the interface and code items, we assume that differences in the
number of items coded reflect differences in effort exerted rather than differences in ability.
The number of items correctly coded in a period determines the probability of receiving an
offer in that period. In all treatments, each item correctly coded increases the probability of receiving
an offer by four percentage points, i.e.,
Pr(7$$%&� = 1) = I0.04 ∗ (# of items completed) if # of completed items ≤ 251otherwise
In the limited information search episode, subjects were not told how correctly coded items affected
the probability of receiving of an offer. Subjects were told that, “The number of items you complete
in the word coding task may affect whether or not you receive an offer during a period.” In the full
information treatment, subjects were explicitly informed of the relationship between correctly coded
items and the probability of receiving an offer. Following the coding task in the limited information
treatment, subjects were asked three questions. First, “How many items do you think you correctly

9
completed?” Second, “What do you think the probability is that you receive an offer? Please enter a
number between 0 and 100, where 0 means that you will definitely not receive an offer and 100
means that you definitely will receive an offer.” Third, “If you receive an offer in this period, what
would the offer have to be for you to accept it?” We use this measure of self-reported reservation
offers to generate data comparable to the reservation wage data found in surveys such as the NLSY79
and GSOEP elicited using similarly worded questions.
After answering these questions, subjects learned whether they had received an offer and the
amount of the offer if one was received. Subjects who received an offer were asked if they wished to
accept the offer and receive it in all remaining periods. If subjects accepted an offer, their search
episode ended. If they did not receive an offer or declined an offer, they moved to the next period and
repeated this process, beginning with the coding task. Subjects moved from period to period until
they had accepted an offer. If no offer had been accepted by the end of the twentieth period, the
search episode ended and subjects were paid the outside option for 20 periods. The full information
treatment proceeded in the same fashion, but subjects were not asked their beliefs about the
probability of receiving an offer.
Subjects in all sessions completed the limited and full information treatments with the limited
information search episode always coming first. Subjects in some sessions also completed one of two
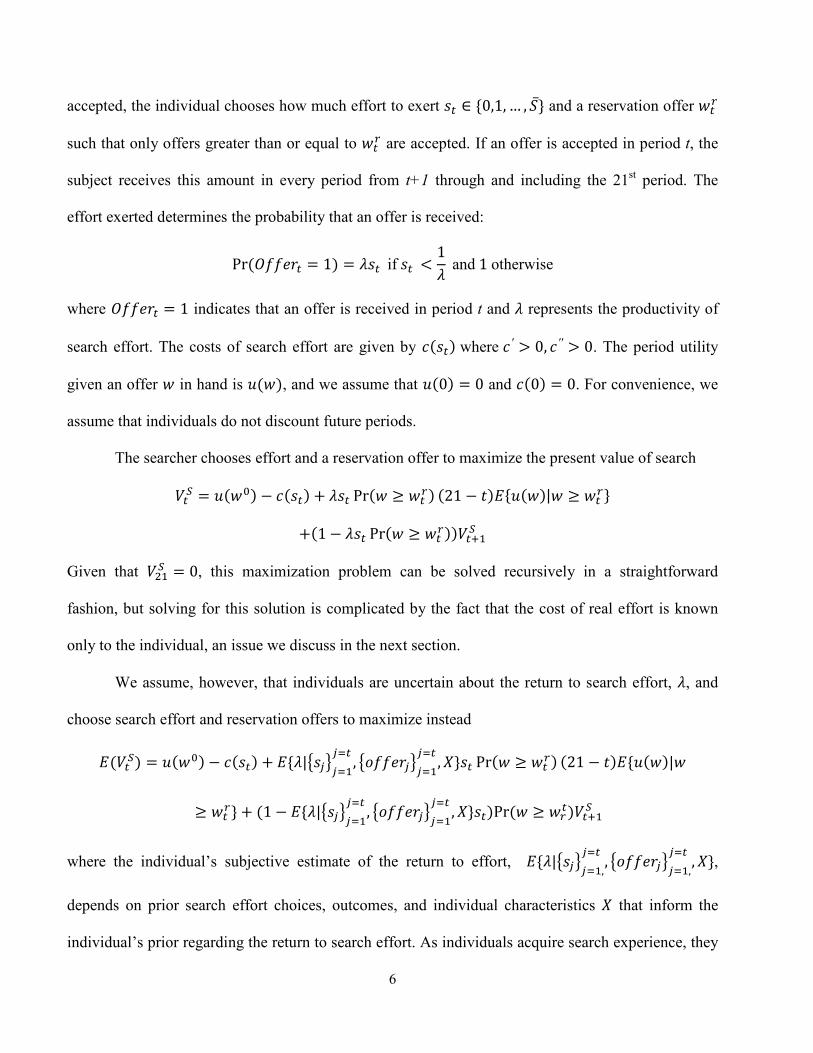
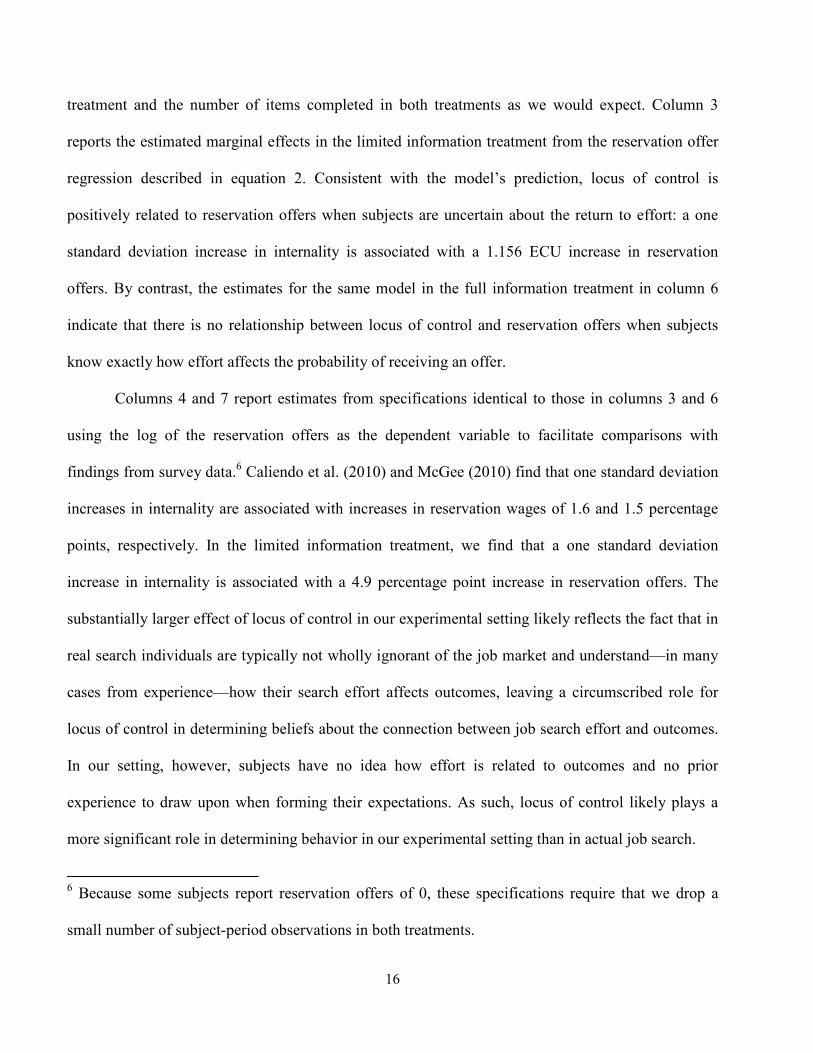
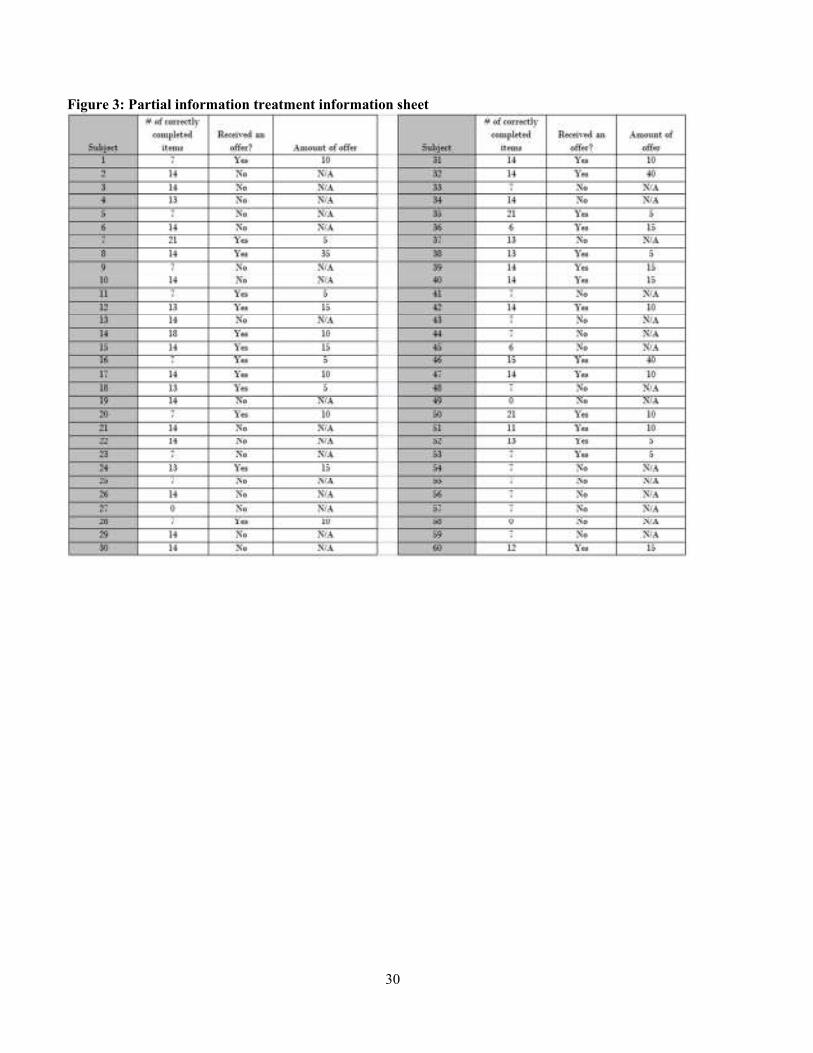
additional treatments. In the partial information treatment, subjects were provided information
concerning the experiences of prior subjects. Specifically, subjects were told how many items 60
subjects had completed, whether the subject received an offer, and the amount of the offer if one was

10
received. The information sheet given to subjects is provided in Figure 2.1 In all other respects, the
partial information treatment was exactly the same as the limited information treatment, and subjects
always completed the partial information treatment between the limited information and full
information treatments. In limited and full information “pseudo-effort” treatments, subjects
purchased items instead of completing the coding task. The relationship between items purchased and
the probability of receiving an offer was the same as in the real-effort treatments: each item
purchased increased the probability of receiving an offer by four percentage points. In the pseudo-
effort limited information treatment, subjects were told that the number of items purchased “may
affect” whether an offer would be received, while in the full information pseudo-effort treatment
subjects were told exactly how items purchased affected the probability of receiving an offer. The
costs of purchasing n items was 0.10O�, and the user-interface allowed subjects to calculate the costs
of any number of items they were considering purchasing. Costs incurred over the course of a search
episode were deducted from the subject’s show-up fee. Subjects completing the pseudo-effort
treatments completed four search episodes: the limited and full information real effort treatments and
the limited and full information pseudo-effort treatments. The limited information real and pseudo
effort treatments always preceded the full information treatments, but we varied the order of the
pseudo and real effort treatments across sessions.2
After completing the search episodes, subjects completed a questionnaire including the
abbreviated, four-item Rotter Internal-External Locus of Control Scale used in the NLSY79
1 While the sample of prior experiences provided to subjects was drawn randomly from the actual
experiences of prior subjects, we selected a sample in which a regression of whether an offer was
received on items completed resulted in an estimated slope of approximately 0.04.
2 We observe no differences related to the orderings of the real and pseudo effort treatments.
11
measuring general locus of control beliefs (Rotter, 1966), a fifty-item Big Five inventory measuring
extraversion, agreeableness, conscientiousness, emotional stability, and imaginativeness or intellect
(Goldberg, 1992), the Rosenberg Self-Esteem Scale (Rosenberg, 1965), and the Life Orientation
Test-Revised designed to assess individual differences in generalized optimism versus pessimism
(Scheier et al., 1994). In addition, subjects completed the low-stakes risk preference measure from
Holt and Laury (2002) used in the experimental literature and risk preference measures from the
GSOEP and the Health and Retirement Survey (HRS) (also used in the NLSY79). Finally, subjects
were asked how much they would pay to avoid having to complete 4, 8, 12, 16, 20, and 24 coding
items as well as questions concerning demographics and achievement test scores.
For the personality measures and achievement scores, we standardize the variables within the
sample to have mean zero and standard deviation one to facilitate comparisons of the effects of the
different measures on behavior. To create a measure of how onerous or costly the subjects find the
coding task, we rank the subjects according to the cost they report for completing a given number of
items. The cost measure then takes the average decile for the subject’s responses to the 8-item, 12-
item, and 16-item cost questions.3 The questionnaire components are provided in the Appendix.
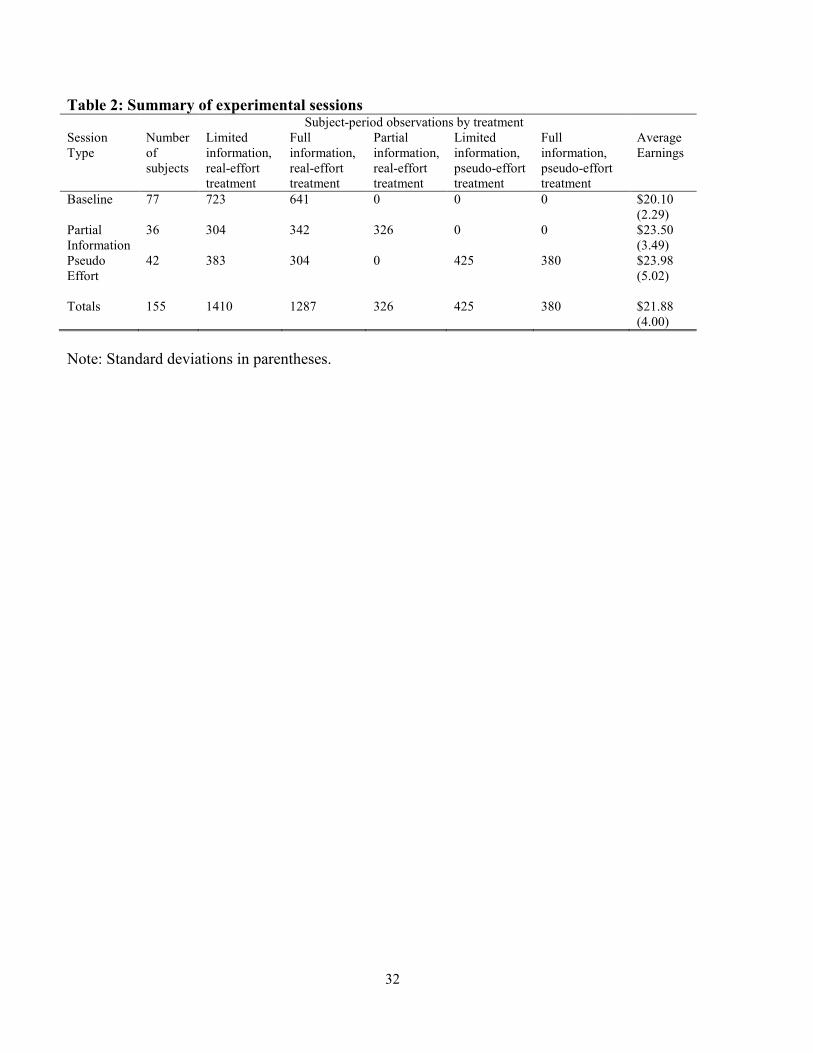
The sessions are summarized in table 2. Subjects were paid a flat $6 show up fee in addition
to their earnings from each search episode and the Holt-Laury instrument. In total, 155 subjects
provided 1,410 subject-period observations in the limited information real effort treatment and 1,287
subject-period observations in the full information real effort treatment.
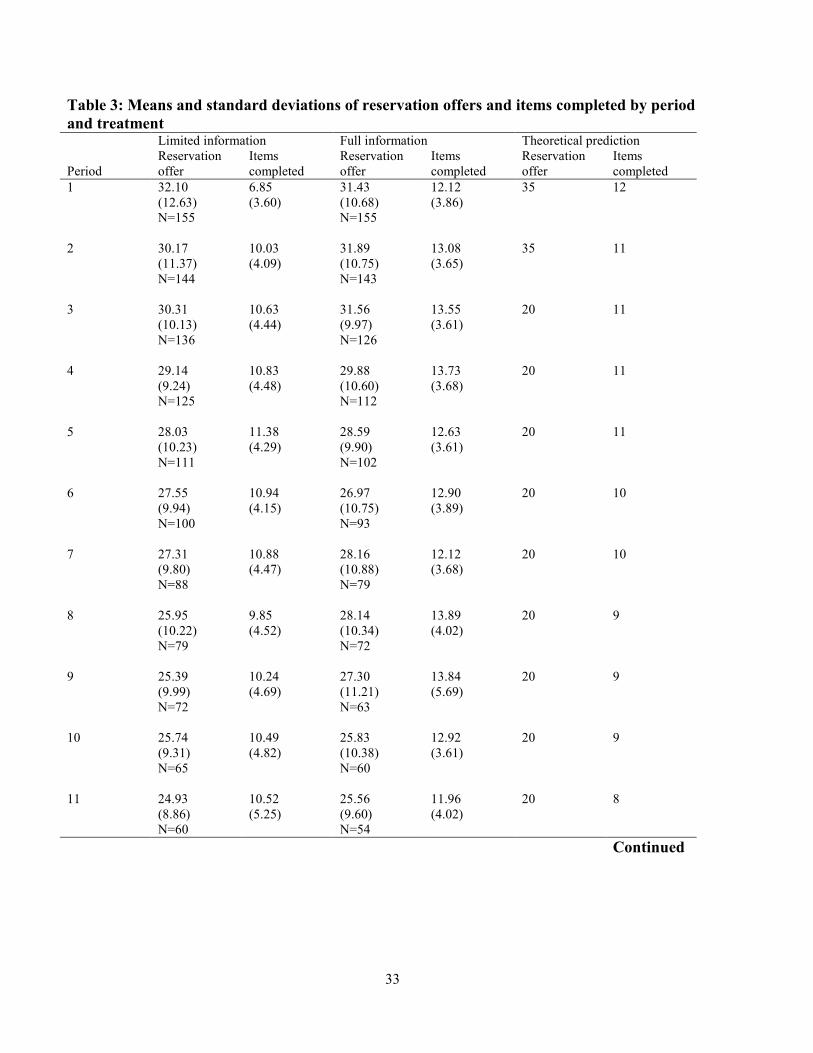
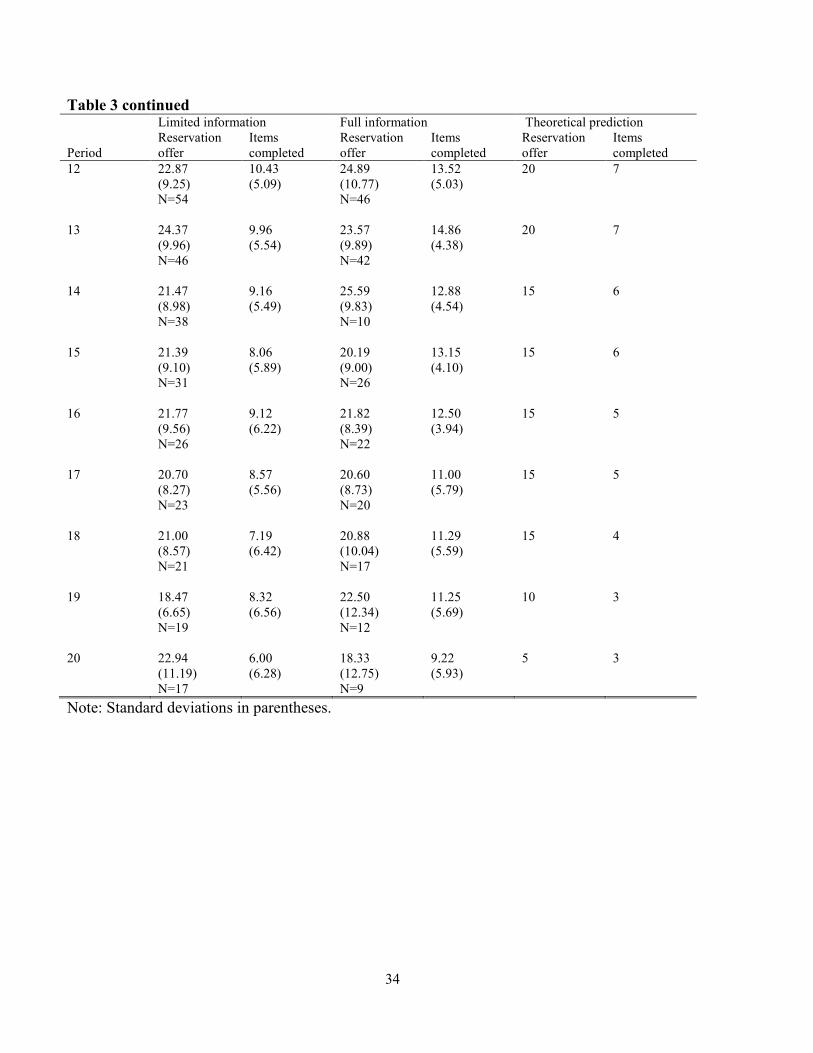
Table 3 details the mean reservation offer and number of items correctly completed by period
in the limited and full information treatments as well as the theoretically optimal choices in a full
3 Alternative methods of constructing the self-reported cost measure produced results similar to those
reported in section V.
12
information setting for risk-neutral searchers (+() = ) whose search effort costs are given by
210.0)( tt ssc −= .4 Reservation offers decrease significantly over time in both the limited and full
information treatments, which is consistent with the theoretical prediction in a finite horizon and Cox
and Oaxaca’s (1989) findings in a laboratory experiment without endogenous search effort. While the
model predicts that search effort will decline over time, search effort is relatively constant in both
treatments, which may reflect the imposition of the 90-second time limit, a practical necessity. The
average number of items completed is higher in the full information treatment than in the limited
information treatment in all 20 periods. In the early periods, this may be a result of the subjects’
inexperience with the coding task in the limited information treatment, but the persistence of the
difference suggests that subjects exert more effort on average when the return to effort is certain.
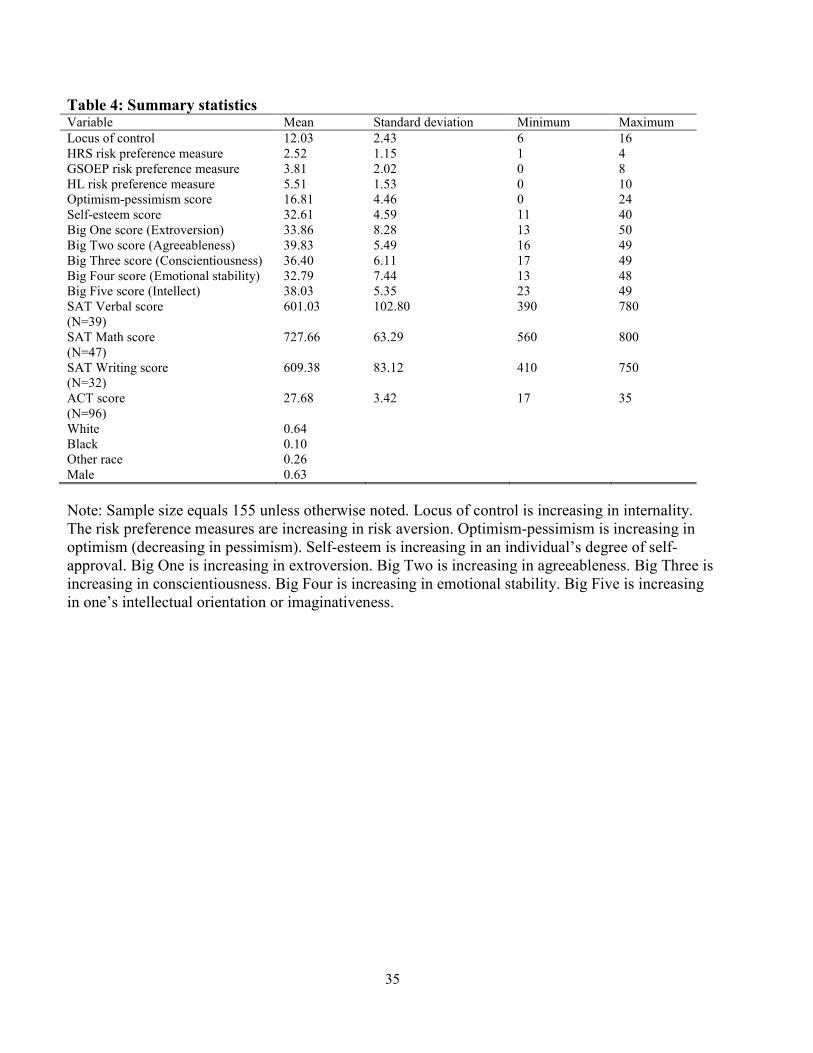
Table 4 reports the summary statistics for the control variables and the demographic
composition of our sample. In the regression analysis, we use standardized versions of the control
variables, but table 4 reveals substantial variation in the underlying raw scores—especially locus of
control scores which range from 6 to 16 with a standard deviation of 2.43. Not all subjects reported
ACT and SAT scores. When constructing the standardized achievement measure used in section V,
we use the ACT score when available and then supplement with the average of available SAT scores
when the ACT score is missing.
4 We estimate a cost function in terms of ECUs of )(��) = −7.0 + 5.0�� + 0.3��� using subjects’ self-
reported costs of completing items, which appears to dramatically overstate costs as in the full
information setting it would imply zero effort in all periods. Subjects, who report costs in dollars,
may have difficulty articulating costs prior to receiving their earnings. The prediction of declining
reservation wages over time, however, does not depend on the exact shape of the cost function, and
the self-reported costs indicate that the cost function is at least quasi-convex for all subjects.
13
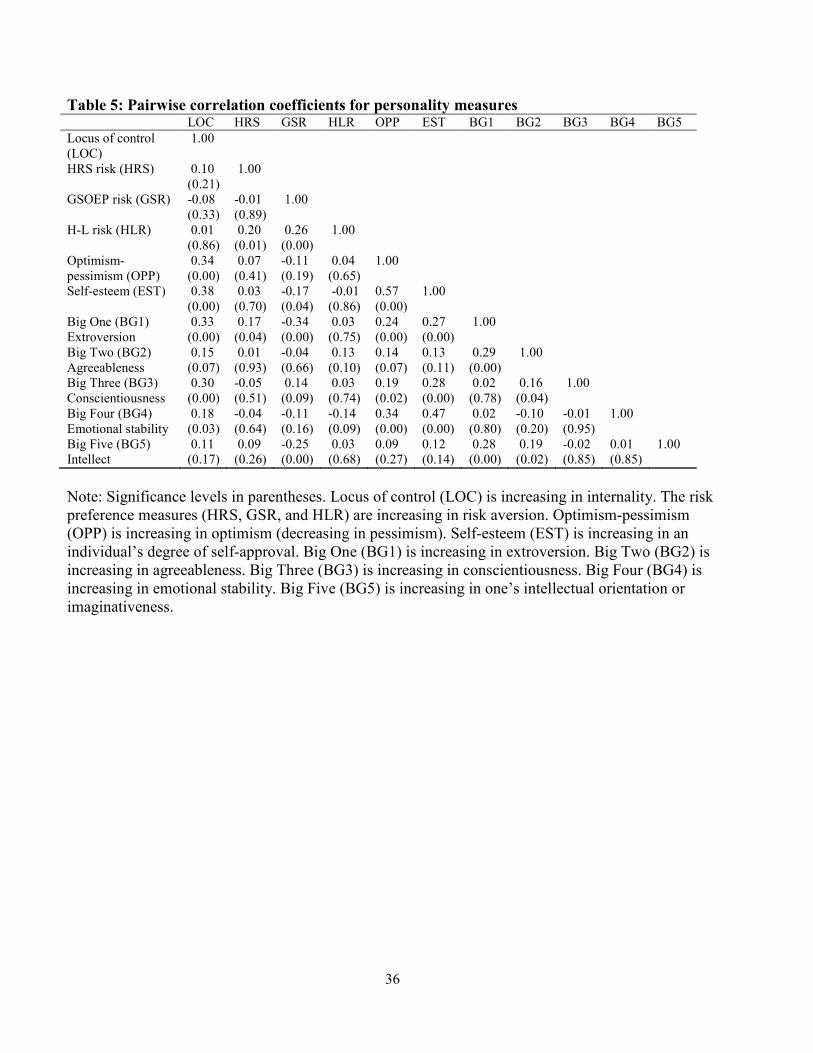
A particular strength of our study is that we observe a large set of personality traits, and table
5 documents the pairwise correlations between these traits, risk preferences and locus of control.
Internality is significantly and positively correlated with optimism (0.34), self-esteem (0.38),
extroversion (0.33) and conscientiousness (0.30). As one could imagine a role for all of these traits in
search, controlling for them is necessary to identify the direct effects of locus of control. For
example, a searcher may believe that the probability of receiving an offer is equal to R + '��, where
a is the probability of receiving an offer independent of effort. As a searcher’s expectation regarding
a increases, the searcher will hold out for higher offers, but search effort will not be affected as the
marginal return to search effort remains the same. If general optimism is positively correlated with
beliefs about a, then omitting optimism would introduce a positive omitted variables bias in the
estimated coefficient of locus of control in reservation wage models.
IV. Econometric Strategy
Our primary hypotheses are that locus of control influences beliefs about the efficacy of
search effort and that these beliefs, in turn, influence actual search behavior. To test whether locus of
control influences beliefs about the return to search effort in the limited information treatment, we
estimate by OLS
�+STU&7S�(#$$%&� = 1) = V + V�W7)+�� + 8�V�+V�� + X�� (1)
where �+STU&7S�(#$$%&� = 1) denotes subject i’s self-reported estimate of the probability of
receiving an offer in period t when the subject is still searching, W7)+�� the subject’s locus of control
score, and 8� a vector of measures of self-esteem, generalized optimism, risk preferences, personality
traits and self-reported effort costs. We allow for a linear time trend in beliefs by including t, and X� is
14
the stochastic error term.5 If more internal individuals believe the return to search effort to be higher
than their less internal peers and complete more items as a result, then the effect of increasing
internality (V�) should be positive in this reduced-form specification.
To test how locus of control affects reservation offers, we estimate by OLS for each treatment
Y%�#$$%&�� = Z + Z�W7)+�� + 8�Z�+Z�� + X�� (2)
If locus of control influences beliefs about the return to search effort, then individuals will hold out
for higher offers and Z�should be positive in the limited information treatment and zero in the full
information treatment in which subjects face no uncertainty about the return to effort. If, however,
internality is positively correlated with ability or negatively correlated with psychic effort costs not
captured by our controls, then the effect of increasing internality will be positive in both treatments.
Finally, we estimate by OLS for each treatment
[�%\��� = ] + ]�W7)+�� + 8�]�+]�� + X�� (3)
where [�%\��� denotes the number of correctly coded items in period t. Increasing internality (]�)
should be positively related to search effort in the limited information treatment and unrelated to
search effort in the full information treatment if locus of control influences effort through beliefs
about the efficacy of effort rather than its correlation with ability or effort costs.
In all of the results in the next two sections, we report Huber-White standard errors correcting
for the non-independence of observations at the subject level.
V. Findings
Subjects clearly believe that the number of items that they correctly complete is related to the
probability that they will receive an offer. The estimates in columns 1 and 2 of table 6 indicate that
5 More flexible approaches to modeling the time trends in all of our specifications yielded similar
results to those reported in the next section.
15
subjects’ beliefs about the probability of receiving an offer in the limited information treatment are
increasing in the number of items they correctly complete allowing for either a linear time trend in
beliefs (column 1) or the use of beliefs in the prior period as an “anchor” for beliefs in the current
period (column 2). Each correctly completed item is associated with an estimated increase in the
probability of receiving an offer of between 0.9 and 1.4 percentage points. While we are interested in
how locus of control beliefs influence beliefs about the marginal return to effort, the number items
subjects complete is itself a function of locus of locus of control. As such, column 3 reports the
results of the reduced-form model of beliefs regarding the probability of receiving an offer detailed in
equation 1. We do not find direct evidence of a relationship between self-reported beliefs and locus of
control in column 3—although as we report below we find strong evidence that locus of control
influences the number of items completed. The effect of locus of control on beliefs is statistically
indistinguishable from zero. We do, however, find that subjects’ stated beliefs are related to other
personality traits. In particular, a one standard deviation increase in optimism is associated with an
estimated 5.2 percentage point increase in subjects’ reported beliefs about the probability of receiving
an offer, while comparable increases in extroversion (Big 1) and conscientiousness (Big 3) are
associated with lower reported beliefs regarding the likelihood of receiving an offer.
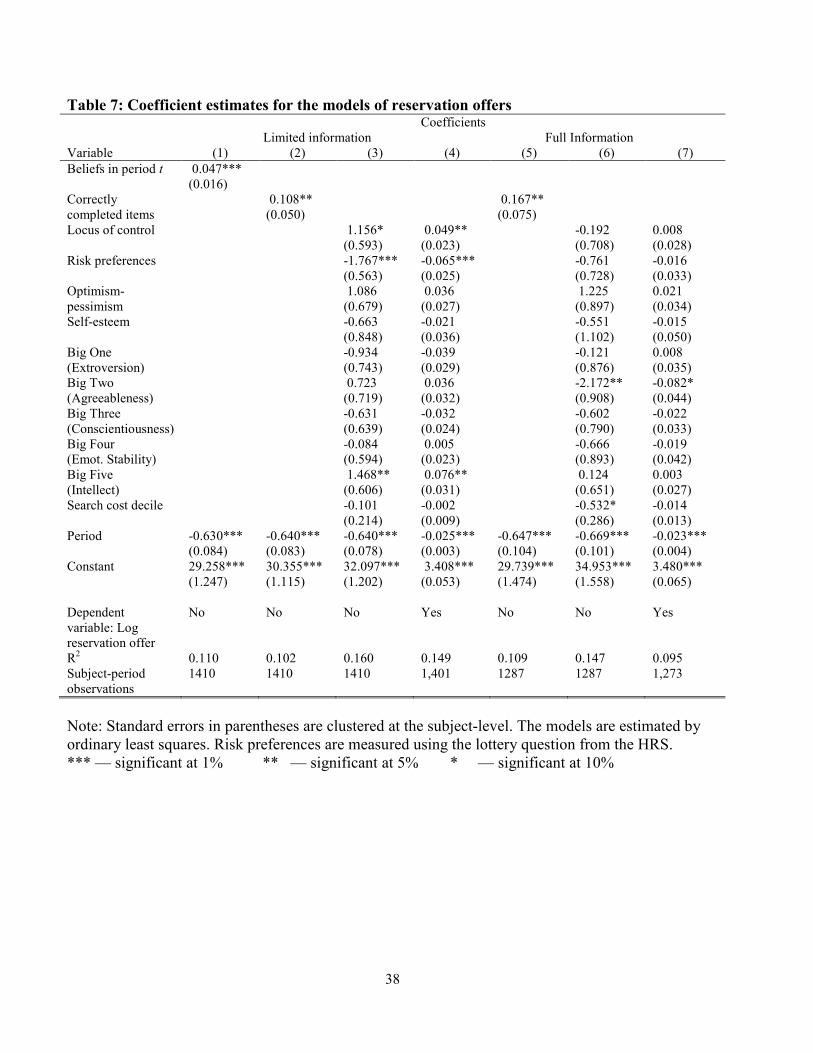
While we suspect subjects had difficulty articulating their beliefs, they had no such difficulty
articulating reservation offers. Subjects’ responses to the reservation offer question were non-binding
in that they were free to accept an offer less than their reported reservation offer. Nevertheless,
subjects adhere to their stated reservation offer policy in 90% and 89% of subject-period observations
in the limited and full information treatments, respectively, in which the subject received an offer.
Furthermore, columns 1, 2, and 5 of table 7 make clear that subjects’ reservation offers are positively
related to their beliefs regarding the probability of receiving an offer in the limited information
16
treatment and the number of items completed in both treatments as we would expect. Column 3
reports the estimated marginal effects in the limited information treatment from the reservation offer
regression described in equation 2. Consistent with the model’s prediction, locus of control is
positively related to reservation offers when subjects are uncertain about the return to effort: a one
standard deviation increase in internality is associated with a 1.156 ECU increase in reservation
offers. By contrast, the estimates for the same model in the full information treatment in column 6
indicate that there is no relationship between locus of control and reservation offers when subjects
know exactly how effort affects the probability of receiving an offer.
Columns 4 and 7 report estimates from specifications identical to those in columns 3 and 6
using the log of the reservation offers as the dependent variable to facilitate comparisons with
findings from survey data.6 Caliendo et al. (2010) and McGee (2010) find that one standard deviation
increases in internality are associated with increases in reservation wages of 1.6 and 1.5 percentage
points, respectively. In the limited information treatment, we find that a one standard deviation
increase in internality is associated with a 4.9 percentage point increase in reservation offers. The
substantially larger effect of locus of control in our experimental setting likely reflects the fact that in
real search individuals are typically not wholly ignorant of the job market and understand—in many
cases from experience—how their search effort affects outcomes, leaving a circumscribed role for
locus of control in determining beliefs about the connection between job search effort and outcomes.
In our setting, however, subjects have no idea how effort is related to outcomes and no prior
experience to draw upon when forming their expectations. As such, locus of control likely plays a
more significant role in determining behavior in our experimental setting than in actual job search.
6 Because some subjects report reservation offers of 0, these specifications require that we drop a
small number of subject-period observations in both treatments.
17
Two additional interesting facts emerge from table 7. First, risk aversion as measured by the
lottery question from the HRS has both a statistically and economically significant negative effect on
reservation wages in the limited information treatment. A one standard deviation increase in risk
aversion is associated with an estimated 1.8 ECU decrease in reservation offers (a 6.5 percentage
point decrease in the log reservation offer specification). Risk averse individuals hedge against the
possibility of not getting an offer in subsequent periods by being more willing to accept offers in the
current period, and this effect is more pronounced in the environment with more uncertainty—the
limited information treatment. Omitting risk preferences from the specification in column 4 results in
a 15% decline in the estimated coefficient of locus of control. Second, we find that reservation wages
are positively related an individual’s optimism in both treatments—although not statistically
significant at conventional levels. One standard deviation increases in optimism are associated with
predicted increases of 1.1 ECUs (p-value 0.11) and 1.2 ECUs (p-value 0.17) in the limited and full
information treatments, respectively. Omitting the control for optimism-pessimism results in a 21%
increase in the estimated coefficient of locus of control in the limited information treatment because
of the positive correlation between internality and optimism.
The evidence from survey data concerning the relationship between search effort and locus of
control is limited by the difficulty of measuring job search effort in surveys. That is, should one
measure effort using the number of search methods used (e.g., help wanted ads, referrals by friends,
placement services), the number of job applications submitted (Caliendo et al. 2010), the number of
hours per week spent searching (McGee 2010), or some other measure? By contrast, search effort is
well-defined in our experiment, and the relationship in the limited information treatment between
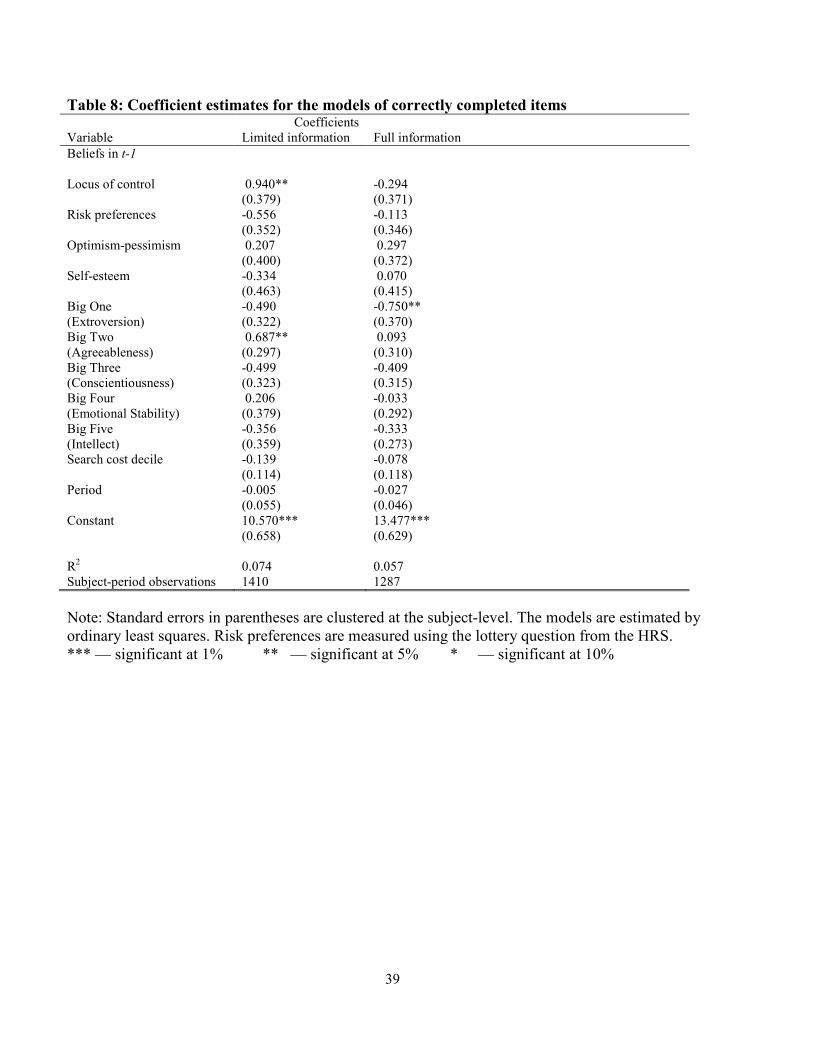
locus of control and search effort is among the study’s most robust findings. Table 8 reports the
estimated marginal effects from the models of the number of correctly completed items in the limited

18
and full information treatments detailed in equation 3. When subjects are uncertain regarding the
return to effort, internality is positively related to effort: a one standard deviation increase in
internality is associated with a predicted increase in items completed of 0.94 items in the limited
information treatment but no effect in the full information treatment. Given that subjects average only
around 10 items per period, this constitutes a significant increase in effort—though smaller than the
20 percent increase in hours spent searching per week associated with a one standard deviation
increase in internality that McGee (2010) finds. One might suspect that locus of control affects effort
because it proxies for diligence or is related to the psychic costs of effort. As noted, however, we
control directly for personality traits including conscientiousness and self-reported effort costs. More
importantly, the task in both treatments is the same. If the effect of locus of control is not related to
the uncertainty surrounding the efficacy of effort, we would not expect to see the differences in the
effects of locus of control on reservation offers and effort across treatments that we do.
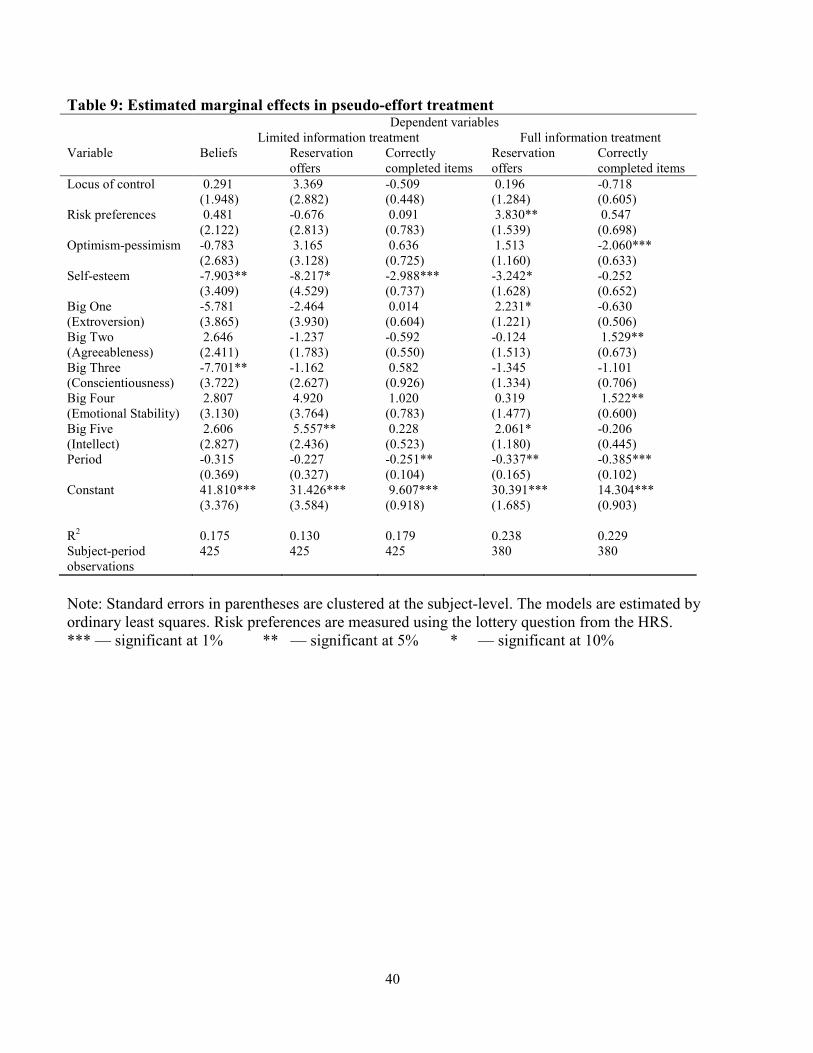
To explore the role that real effort plays in our findings, we report the estimated marginal
effects from the pseudo-effort treatments in table 9. We find no evidence of relationships between
locus of control and beliefs, reservation offers, and items purchased in either the limited or full
information treatments when subjects simply purchase items. The estimated marginal effect of locus
of control on reservation offers in the pseudo-effort limited information treatment (3.369) is large and
positive but imprecisely estimated. Locus of control appears to strongly influence search behavior
only when uncertainty surrounds the role of real effort. One possible explanation is that subjects
learn about the search technology more quickly in the pseudo-effort treatment. In the limited
information treatments, the standard deviations of the average number of items completed or
purchased are 4.83 and 7.52 in the real-effort and pseudo-effort treatments, respectively. In nine of
the first ten periods, the standard deviation of average number items completed or purchased in that

19
period in the pseudo effort treatment is higher than—and in most cases twice as large as—that in the
real effort treatment. When uncertain about the return to items completed or purchased, subjects may
experiment more when they simply purchase items and do not face the physical constraints in the
coding task. Through this experimentation subjects can learn about the search technology more
quickly—thereby reducing the importance of their locus of control beliefs.
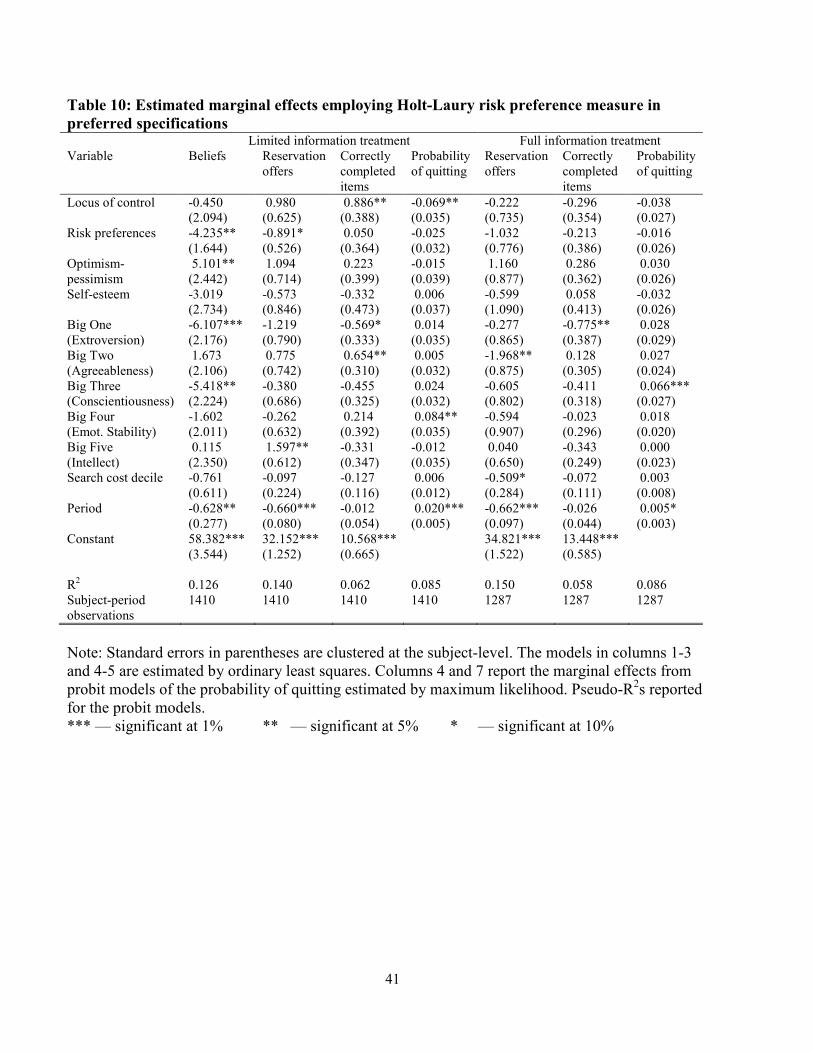
We also test the robustness of our results to the use of different controls. Our preferred
measure of risk preferences is the instrument used in the National Longitudinal Study of Youth 1979
in order to facilitate comparisons between our findings and those from studies using survey data.
Table 10 reports the estimated marginal effects in our preferred specifications replacing the risk
preference measure from the HRS/NLSY79 with the Holt-Laury risk preference measure. The
estimated marginal effects of locus of control are virtually identical to those in table 6-8, although the
relationship between locus of control and reservation offers is not significant at conventional levels
(p-value 0.119). In results available from the authors, the estimated marginal effects of locus of
control in our preferred specifications using the GSOEP risk preference measure are also virtually
identical to those in table 6-8, but the effects of risk preferences are not precisely estimated.
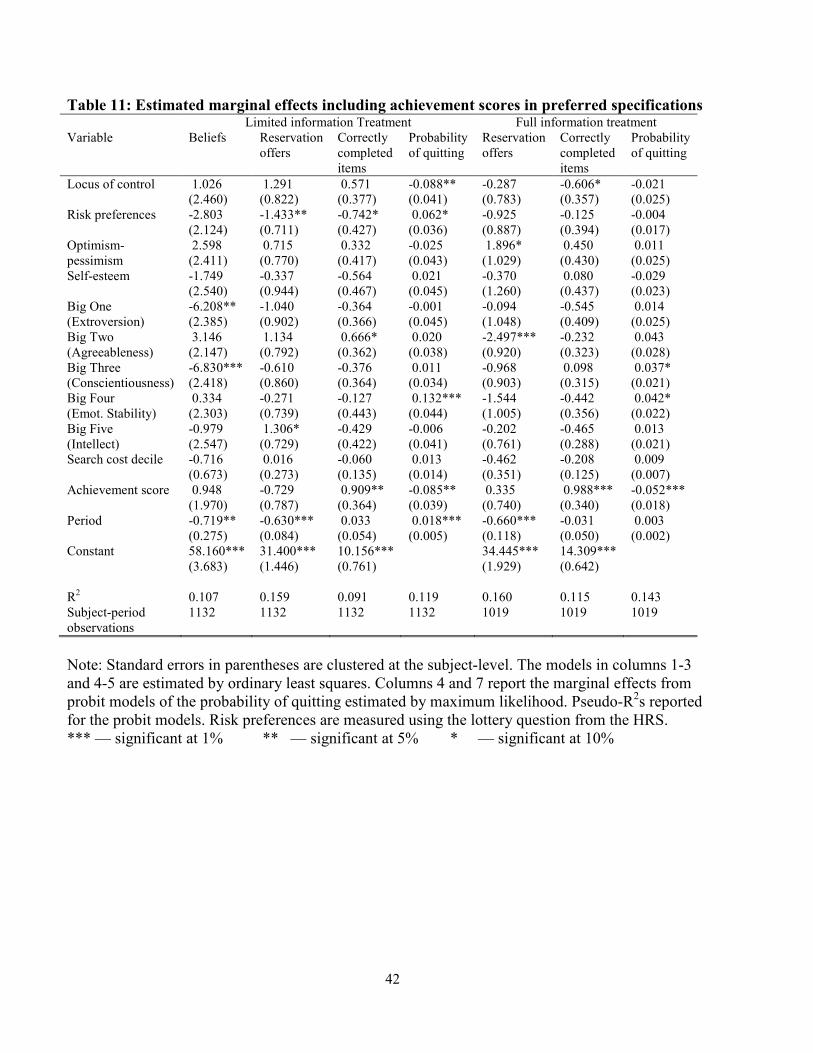
Finally, studies examining the effects of locus of control using survey data typically attempt
to control for ability using test scores (e.g., Coleman & DeLeire 2003; Osborne-Groves 2005). More
internal individuals may believe their effort to be more efficacious because it actually is if internality
is positively correlated with ability. As such, controlling for ability is important in non-experimental
settings. In our analysis, the skill required is the same in both treatments, so we do not expect
unobserved ability to lead to an observed difference in the effects of locus of control across
treatments. Furthermore, we would argue that including achievement scores as a control for ability in
20
our reduced-form specifications is inappropriate as ample evidence suggests that achievement itself is
a function of locus of control (Findley & Cooper 1983).
Nevertheless, we report in table 11 the estimated marginal effects from our preferred
specifications in both treatments including our standardized achievement measure as a control. The
estimates again indicate that internality is positively related to reservation offers and effort in the
limited information treatment. Neither estimate is statistically significant at conventional levels (p-
values of 0.119 and 0.133, respectively), which is at least in part due to the smaller samples that
result from missing achievement scores. The estimated marginal effect of locus of control on
reservation offers (1.291) is virtually identical to that reported in table 7, while the estimated
marginal effect on effort (0.571) is roughly 40% smaller than the estimate in table 8. We find no
evidence of a relationship between locus of control and reservation offers in the full information
treatment, and a negative relationship between internality and effort in the full information treatment.
Achievement scores are positively related to effort in both treatments, but the differences across
treatments in locus of control’s effects cannot be explained by a correlation with unobserved ability.
In summary, we are unable to document a direct effect of locus of control on beliefs. We find,
however, strong indirect evidence in support of the hypothesis that locus of control influences search
behavior through an influence on beliefs about the efficacy of effort. Specifically, we find that
reservation offers and effort are positively and significantly related to internality when subjects are
uncertain about the efficacy of effort but wholly unrelated to internality when the connection between
effort and outcomes is public information. The skill content of the task and the effort required of
subjects are the same across treatments—meaning that a correlation between locus of control and
unobserved skill or effort costs cannot explain the observed treatment effects.
VI. Extensions
21
The evidence in the preceding section suggests that locus of control is closely related to the
two decisions all job seekers make—reservation wage and effort choices—that determine the length
of unemployment spells. Two extensions to our main results inform how programs can assist the
unemployed in a welfare-enhancing fashion and identify job seekers at risk of becoming discouraged
and exiting the labor force. First, some job training programs seek to help participants develop a more
internal locus of control and increase their general sense of self-efficacy (Dextraze 1986; Eden &
Aviram 1993). While encouraging job seekers to take charge of their affairs is undoubtedly a good
thing among external job seekers who would otherwise remain on the couch, increasing the
internality of job seekers is not an unambiguously welfare-enhancing intervention given the effect
internality has on reservation wages. Very internal job seekers may “make the perfect the enemy of
the good” and hold out for excessively high wages. Moreover, determining which job seekers are too
internal or too external in the context of job search would be nearly impossible. The only way to
increase the expected utility of job seekers is to properly “calibrate” their beliefs about the efficacy of
search. Many job seekers—especially young people with little experience looking for work—have
no idea how much or how hard to search. They may rely on their general perceptions of how the
world works—i.e., general locus of control and optimism-pessimism beliefs—when choosing how
much effort to put into search. Providing job seekers with information about how the job market
works and how much effort others exerted in job searches in similar occupations or industries can
reduce their reliance on general beliefs when forming beliefs about the job market.
To this end, some subjects in our experiment participated in a partial information treatment in
which they were provided with information concerning the experiences of prior subjects. Table 12
reports the coefficient estimates from our preferred specifications of the models of beliefs,
reservation offers, and items completed in this partial information treatment. While the sample sizes
22
are small, the coefficient estimates in columns 2 and 3 provide no evidence indicating that subjects’
locus of control beliefs play a role in determining their reservation offer and effort choices when
subjects have some information concerning the experiences of the other subjects. Counseling that
provides young or inexperienced job seekers with information concerning the job search experiences
of others may be a straightforward and effective way to eliminate behavioral biases that result from
locus of control beliefs and increase the expected utility of job seekers.
Second, identifying job seekers at risk of becoming discouraged would help assistance
programs target resources at these individuals. One might expect discouragement to be minimal in a
two-hour experiment, but this proved not to be the case. We define “quitting” in any period to mean
that either the subject completes no items or stopped coding before the end of the 90-second coding
window.7 Subjects exhibiting this behavior chose to exert less effort than other subjects and did so in
an extreme fashion. We estimate a probit models of the probability of quitting in which a subject
quits (^+_��� = 1) whenever ^+_���∗ ≥ 0 and ^+_��� = 0 otherwise where ^+_���∗ is the latent index
^+_���∗ = `�W7)+�� + 8�`�+`�� + X�� (4)
Table 13 reports the estimated marginal effects in the limited information treatment (column
1) and the full information treatment (column 2). In both treatments, internality is negatively related
to the probability of quitting, although the effect is not statistically significant in the full information
treatment and roughly half the magnitude of the estimated marginal effect in the limited information
treatment. In the limited information treatment, a one standard deviation increase in internality is
associated with a reduction in the predicted probability of quitting in any period of 7.5 percentage
7 As seen in figure 1, subjects could exit the coding task at any time by clicking a “Stop” button.
Because a period only ended when all subjects still searching finished the coding task, quitting did
not help subjects to reduce their time in the lab.

23
points. Of the personality traits, only emotional stability has a comparable effect on the probability of
quitting. The decision to quit appears to be closely related to locus of control beliefs—especially
when subjects are uncertain about the return to their effort.
Our findings concerning discouragement complement those of Falk et al. (2006) who study
search in an experiment in which the effectiveness of subjects’ search depends on their type. Subjects
are uncertain about their type—the real world analog of which would be their relative ability or
desirability to potential employers—which they learn about through experience searching, which is
costly. Unlucky initial search experiences lead some subjects to infer their type to be “lower” than it
actually is and quit searching prematurely believing the costs to outweigh the expected benefits.
Searchers become discouraged by dint of perfectly rational Bayesian updating. Our findings also
suggest that discouragement can result from uncertainty about the return to search, but this
uncertainty need not concern one’s type. Instead, discouragement may be the result of a behavioral
bias stemming from locus of control beliefs that inclines external searchers to believe search effort to
be less effective than it actually is at the outset of their search episode. Unlucky search experiences
can reinforce this bias and lead external searchers to give up.
That unlucky experiences might reinforce external beliefs leading to discouragement is not
inconsistent or incompatible with the explanation offered by Falk et al. The difference between the
two explanations, however, has important implications for programs attempting to prevent job
seekers from becoming discouraged. Identifying job seekers who will be unlucky in the sense that
conditional on their search effort and desirability to potential employers they will receive fewer offers
than they could reasonably expect is a fool’s errand. Identifying job seekers who are relatively
external and hence most at risk of becoming discouraged, on the other hand, is relatively easy with a
24
short questionnaire and could prove to be a viable approach to targeting resources at unemployed job
seekers most in need of assistance—or simply encouragement.
VI. Discussion and Conclusion
Success in labor markets depends on conventional human capital such as education, training,
and cognitive ability, but it also depends on one’s personality, social skills, patience, risk preferences,
and other less easily measured but no less important “soft skills.” Measures of many soft skills are
available in longitudinal surveys, and economists have shown an increased willingness to explore
their role in behavior (e.g., Borghans, ter Weel, & Weinberg 2008). In many cases, however,
economists have remained agnostic about what these measures of soft skills actually measure and
how they influence behavior (e.g., Heckman, Stixrud, & Urzua 2006). The laboratory affords
economists the opportunity to identify what soft skills these survey instruments actually measure and
how they influence behavior—and this is precisely the goal of this study regarding locus of control.
If locus of control affects beliefs about the efficacy of effort—as psychologists believe it
does—then internal job seekers will set higher reservation wages and exert more effort looking for
work. Consistent with these expectations, internality is positively related to reservation wages and
search effort among unemployed job seekers in survey data. Alternative explanations for the
correlation between locus of control and search behavior, however, cannot be ruled out using survey
data. First, locus of control may be correlated with unobserved personal characteristics that influence
the desirability of the job seeker as an employee. Second, the process of looking for work itself may
require skills with which locus of control is correlated: internal individuals may simply be more
effective searchers. Third, more internal workers may find search effort less bothersome. All three
scenarios would imply that more internal job seekers would exert more effort looking for work and
hold out for higher wages.
25
Our experimental design allows us to determine whether these alternative explanations can
explain the relationship between locus of control and search behavior. Subjects participate in two
treatments: one in which the return to effort is uncertain and one in which the return to effort is
common knowledge. In both treatments, the task by which subjects search is the same—meaning that
a correlation between locus of control and unobserved skill or effort costs cannot explain a difference
between treatments in the effects of locus of control. A clear treatment effect, however, emerges:
more internal subjects exert more effort and hold out for higher offers than less internal subjects
when the return to effort is uncertain, but there is no difference in behavior associated with internality
when the return to effort is common knowledge. Internal individuals believe that their actions
determine what happens to them. They search harder than less internal individuals because they
believe this effort is more likely to lead to an offer, and because they expect offers to be more likely
conditional on effort they hold out for higher offers.
Understanding how locus of control affects behavior in this abstract search setting has two
benefits. First, economists can incorporate this understanding of how locus of control influences
behavior into models of decision-making in broad range of contexts. Any decision requiring an
individual to expend effort when the payoff to that effort is uncertain could be affected by locus of
control beliefs. Our study provides guidance concerning how to model locus of control’s effect on
behavior in these settings and thereby derive testable predictions regarding such behavior. Second
and more importantly, knowing how locus of control affects behavior can guide policy to help
individuals overcome behavioral biases that hinder their employment prospects and reduce their
welfare more generally.
26
References
Andrisani, Paul J. 1977. “Internal-External Attitudes, Personal Initiative, and the Labor Market Experience of Black and White Men.” Journal of Human Resources, 12, 308-328.
Andrisani, Paul J. 1981. “Internal-External Attitudes, Sense of Efficacy, and Labor Market
Experience: A Reply to Duncan and Morgan.” Journal of Human Resources, 658-666. Baron, Juan D. and Deborah Cobb-Clark. 2010. “Are Young People's Educational Outcomes Linked
to their Sense of Control?” IZA Discussion Paper 4907. Borghans, Lex, Bas ter Weel, and Bruce A. Weinberg. 2008. “Interpersonal Styles and Labor Market
Outcomes.” Journal of Human Resources 43(4): 815–858. Bowles, Samuel, Herbert Gintis, and Melissa Osborne. 2001. “Incentive-Enhancing Preferences:
Personality, Behavior and Earnings.” AEA Papers and Proceedings, 91, 155-158. Braunstein, Yale M. and Andrew Schotter. 1981. “Economic Search: An Experimental Study.”
Economic Inquiry, 19, 1-25. Braunstein, Yale M. and Andrew Schotter. 1982. “Labor Market Search: An Experimental Study.”
Economic Inquiry, 20, 133-144. Brown, Meta, Christopher Flinn, and Andrew Schotter. 2011. “Real-Time Search in the Laboratory
and the Market.” American Economic Review, 101(2), 948-974 Caliendo, Marco, Deborah Cobb-Clark, and Arne Uhlendorff. 2010. “Locus of Control and Job
Search Strategies.” IZA Discussion Paper no. 4750. Coleman, Margo and Thomas DeLeire. 2003. “An Economic Model of Locus of Control and the
Human Capital Investment Decision.” Journal of Human Resources, 38, 701-21. Cox, James C. and Ronald L. Oaxaca. 1989. “Laboratory Experiments with a Finite Horizon Job-
Search Model.” Journal of Risk and Uncertainty, 2, 301-330. Dextraze, Rhonda D. 1986. “The effects of a re-entry program on locus of control and self-regard.”
Master’s Thesis, University of British Columbia. Eden, Dov and Arie Aviram. 1993. “Self-efficacy training to speed reemployment: Helping people to
help themselves.” Journal of Applied Psychology, 78, 352–360. Falk, Armin and Ernst Fehr. 2003. “Why labour market experiments?” Labour Economics, 10, 399-
406. Falk, Armin, David Huffman and Uwe Sunde. 2006. “Do I have What it Takes? Equilibrium Search
with Type Uncertainty and Non-participation.” IZA Discussion Paper No. 2531.

27
Findley, Maureen J. and Harris M. Cooper. 1983. “Locus of control and academic achievement: A
literature review.” Journal of Personality and Social Psychology, 44(2), 419-427. Goldberg, L. R. 1992. “The development of markers for the Big-Five factor structure.”
Psychological Assessment, 4, 26-42. Goldsmith, Arthur, Jonathan Veum, and William Darity Jr. 1997. “The Impact of Psychological and
Human Capital on Wages.” Economic Inquiry, 35, 815-829. Heckman, James, Jora Stixrud, and Sergio Urzua. 2006. “The Effects of Cognitive and Noncognitive
Abilities on Labor Market Outcomes and Social Behavior.” Journal of Labor Economics, 24, 411-482.
Holt, Charles A. and Susan K. Laury. 2002. “Risk Aversion and Incentive Effects.” American
Economic Review, 92(5), 1644-1655. McGee, Andrew D. 2010. “How the Perception of Control Influences Unemployed Job Search.”
Working Paper. Osborne-Groves, Melissa. 2005. “How important is your personality? Labor market returns to
personality for women in the US and UK.” Journal of Economic Psychology, 26, 827-841. Piatek, Remi and Pia Pinger. 2010. “Maintaining (Locus of) Control? Assessing the Impact of Locus
of Control on Education Decisions and Wages.” IZA Discussion Paper No. 5289. Rosenberg, Morris. 1965. Society and the Adolescent Self-Image. Princeton: Princeton University
Press. Rotter, Julian B. 1966. Generalized Expectancies for Internal Versus External Control of
Reinforcement. Psychological Monographs General and Applied, 80 (1, Whole No. 609). Scheier, M. F., Carver, C. S., & Bridges, M. W. 1994. “Distinguishing optimism from neuroticism
(and trait anxiety, self-mastery, and self-esteem): A re-evaluation of the Life Orientation Test.” Journal of Personality and Social Psychology, 67, 1063-1078.
Schweitzer, Stuart O. and Robert E. Smith. 1974. “The Persistence of the Discouraged Worker
Effect.” Industrial and Labor Relations Review, 27(2), 249-260.

28
Figure 1a: Word-coding task screenshot for the limited information treatment
29
Figure 1b: Word-coding task screenshot for the full information treatment
30
Figure 3: Partial information treatment information sheet

31
Table 1: Offer distribution Offer Probability
5 .25 10 .25 15 .25 20 .10 35 .05 40 .05 45 .05
32
Table 2: Summary of experimental sessions Subject-period observations by treatment Session Type
Number of subjects
Limited information, real-effort treatment
Full information, real-effort treatment
Partial information, real-effort treatment
Limited information, pseudo-effort treatment
Full information, pseudo-effort treatment
Average Earnings
Baseline 77 723 641 0 0 0 $20.10 (2.29)
Partial Information
36 304 342 326 0 0 $23.50 (3.49)
Pseudo Effort
42 383 304 0 425 380 $23.98 (5.02)
Totals 155 1410 1287 326 425 380 $21.88
(4.00)
Note: Standard deviations in parentheses.
33
Table 3: Means and standard deviations of reservation offers and items completed by period
and treatment Limited information Full information Theoretical prediction Period
Reservation offer
Items completed
Reservation offer
Items completed
Reservation offer
Items completed
1 32.10 6.85 31.43 12.12 35 12 (12.63) (3.60) (10.68) (3.86) N=155 N=155 2 30.17 10.03 31.89 13.08 35 11 (11.37) (4.09) (10.75) (3.65) N=144 N=143 3 30.31 10.63 31.56 13.55 20 11 (10.13) (4.44) (9.97) (3.61) N=136 N=126 4 29.14 10.83 29.88 13.73 20 11 (9.24) (4.48) (10.60) (3.68) N=125 N=112 5 28.03 11.38 28.59 12.63 20 11 (10.23) (4.29) (9.90) (3.61) N=111 N=102 6 27.55 10.94 26.97 12.90 20 10 (9.94) (4.15) (10.75) (3.89) N=100 N=93 7 27.31 10.88 28.16 12.12 20 10 (9.80) (4.47) (10.88) (3.68) N=88 N=79 8 25.95 9.85 28.14 13.89 20 9 (10.22) (4.52) (10.34) (4.02) N=79 N=72 9 25.39 10.24 27.30 13.84 20 9 (9.99) (4.69) (11.21) (5.69) N=72 N=63 10 25.74 10.49 25.83 12.92 20 9 (9.31) (4.82) (10.38) (3.61) N=65 N=60 11 24.93 10.52 25.56 11.96 20 8 (8.86) (5.25) (9.60) (4.02) N=60 N=54
Continued
34
Table 3 continued
Limited information Full information Theoretical prediction Period
Reservation offer
Items completed
Reservation offer
Items completed
Reservation offer
Items completed
12 22.87 10.43 24.89 13.52 20 7 (9.25) (5.09) (10.77) (5.03) N=54 N=46 13 24.37 9.96 23.57 14.86 20 7 (9.96) (5.54) (9.89) (4.38) N=46 N=42 14 21.47 9.16 25.59 12.88 15 6 (8.98) (5.49) (9.83) (4.54) N=38 N=10 15 21.39 8.06 20.19 13.15 15 6 (9.10) (5.89) (9.00) (4.10) N=31 N=26 16 21.77 9.12 21.82 12.50 15 5 (9.56) (6.22) (8.39) (3.94) N=26 N=22 17 20.70 8.57 20.60 11.00 15 5 (8.27) (5.56) (8.73) (5.79) N=23 N=20 18 21.00 7.19 20.88 11.29 15 4 (8.57) (6.42) (10.04) (5.59) N=21 N=17 19 18.47 8.32 22.50 11.25 10 3 (6.65) (6.56) (12.34) (5.69) N=19 N=12 20 22.94 6.00 18.33 9.22 5 3 (11.19) (6.28) (12.75) (5.93) N=17 N=9
Note: Standard deviations in parentheses.
35
Table 4: Summary statistics Variable Mean Standard deviation Minimum Maximum
Locus of control 12.03 2.43 6 16 HRS risk preference measure 2.52 1.15 1 4 GSOEP risk preference measure 3.81 2.02 0 8 HL risk preference measure 5.51 1.53 0 10 Optimism-pessimism score 16.81 4.46 0 24 Self-esteem score 32.61 4.59 11 40 Big One score (Extroversion) 33.86 8.28 13 50 Big Two score (Agreeableness) 39.83 5.49 16 49 Big Three score (Conscientiousness) 36.40 6.11 17 49 Big Four score (Emotional stability) 32.79 7.44 13 48 Big Five score (Intellect) 38.03 5.35 23 49 SAT Verbal score (N=39)
601.03 102.80 390 780
SAT Math score (N=47)
727.66 63.29 560 800
SAT Writing score (N=32)
609.38 83.12 410 750
ACT score (N=96)
27.68 3.42 17 35
White 0.64 Black 0.10 Other race 0.26 Male 0.63
Note: Sample size equals 155 unless otherwise noted. Locus of control is increasing in internality. The risk preference measures are increasing in risk aversion. Optimism-pessimism is increasing in optimism (decreasing in pessimism). Self-esteem is increasing in an individual’s degree of self-approval. Big One is increasing in extroversion. Big Two is increasing in agreeableness. Big Three is increasing in conscientiousness. Big Four is increasing in emotional stability. Big Five is increasing in one’s intellectual orientation or imaginativeness.
36
Table 5: Pairwise correlation coefficients for personality measures LOC HRS GSR HLR OPP EST BG1 BG2 BG3 BG4 BG5
Locus of control 1.00 (LOC) HRS risk (HRS) 0.10 1.00 (0.21) GSOEP risk (GSR) -0.08 -0.01 1.00 (0.33) (0.89) H-L risk (HLR) 0.01 0.20 0.26 1.00 (0.86) (0.01) (0.00) Optimism- 0.34 0.07 -0.11 0.04 1.00 pessimism (OPP) (0.00) (0.41) (0.19) (0.65) Self-esteem (EST) 0.38 0.03 -0.17 -0.01 0.57 1.00 (0.00) (0.70) (0.04) (0.86) (0.00) Big One (BG1) 0.33 0.17 -0.34 0.03 0.24 0.27 1.00 Extroversion (0.00) (0.04) (0.00) (0.75) (0.00) (0.00) Big Two (BG2) 0.15 0.01 -0.04 0.13 0.14 0.13 0.29 1.00 Agreeableness (0.07) (0.93) (0.66) (0.10) (0.07) (0.11) (0.00) Big Three (BG3) 0.30 -0.05 0.14 0.03 0.19 0.28 0.02 0.16 1.00 Conscientiousness (0.00) (0.51) (0.09) (0.74) (0.02) (0.00) (0.78) (0.04) Big Four (BG4) 0.18 -0.04 -0.11 -0.14 0.34 0.47 0.02 -0.10 -0.01 1.00 Emotional stability (0.03) (0.64) (0.16) (0.09) (0.00) (0.00) (0.80) (0.20) (0.95) Big Five (BG5) 0.11 0.09 -0.25 0.03 0.09 0.12 0.28 0.19 -0.02 0.01 1.00 Intellect (0.17) (0.26) (0.00) (0.68) (0.27) (0.14) (0.00) (0.02) (0.85) (0.85)
Note: Significance levels in parentheses. Locus of control (LOC) is increasing in internality. The risk preference measures (HRS, GSR, and HLR) are increasing in risk aversion. Optimism-pessimism (OPP) is increasing in optimism (decreasing in pessimism). Self-esteem (EST) is increasing in an individual’s degree of self-approval. Big One (BG1) is increasing in extroversion. Big Two (BG2) is increasing in agreeableness. Big Three (BG3) is increasing in conscientiousness. Big Four (BG4) is increasing in emotional stability. Big Five (BG5) is increasing in one’s intellectual orientation or imaginativeness.

37
Table 6: Coefficient estimates for the models of beliefs about the probability of receiving an
offer in the limited information treatment. Coefficients Variable (1) (2) (3)
Correctly completed items 1.358*** 0.890 (0.379) (0.245) Beliefs in period t-1 0.577*** (0.049) Locus of control -0.149 (2.219) Risk preferences -2.872 (1.906) Optimism-pessimism 5.197** (2.576) Self-esteem -3.386 (2.642) Big One -5.553** (Extroversion) (2.197) Big Two 1.172 (Agreeableness) (2.087) Big Three -6.121*** (Conscientiousness) (2.276) Big Four -0.770 (Emotional Stability) (2.139) Big Five -0.228 (Intellect) (2.429) Search cost decile -0.676 (0.611) Period -0.524* -0.607** (0.287) (0.265) Constant 41.329*** 11.630*** 58.134*** (4.032) (2.733) (3.555) R2 0.055 0.372 0.116 Subject-period observations 1410 1255 1410
Note: Standard errors in parentheses are clustered at the subject-level. The models are estimated by ordinary least squares. Risk preferences are measured using the lottery question from the HRS. *** — significant at 1% ** — significant at 5% * — significant at 10%
38
Table 7: Coefficient estimates for the models of reservation offers Coefficients Limited information Full Information Variable (1) (2) (3) (4) (5) (6) (7)
Beliefs in period t 0.047*** (0.016) Correctly 0.108** 0.167** completed items (0.050) (0.075) Locus of control 1.156* 0.049** -0.192 0.008 (0.593) (0.023) (0.708) (0.028) Risk preferences -1.767*** -0.065*** -0.761 -0.016 (0.563) (0.025) (0.728) (0.033) Optimism- 1.086 0.036 1.225 0.021 pessimism (0.679) (0.027) (0.897) (0.034) Self-esteem -0.663 -0.021 -0.551 -0.015 (0.848) (0.036) (1.102) (0.050) Big One -0.934 -0.039 -0.121 0.008 (Extroversion) (0.743) (0.029) (0.876) (0.035) Big Two 0.723 0.036 -2.172** -0.082* (Agreeableness) (0.719) (0.032) (0.908) (0.044) Big Three -0.631 -0.032 -0.602 -0.022 (Conscientiousness) (0.639) (0.024) (0.790) (0.033) Big Four -0.084 0.005 -0.666 -0.019 (Emot. Stability) (0.594) (0.023) (0.893) (0.042) Big Five 1.468** 0.076** 0.124 0.003 (Intellect) (0.606) (0.031) (0.651) (0.027) Search cost decile -0.101 -0.002 -0.532* -0.014 (0.214) (0.009) (0.286) (0.013) Period -0.630*** -0.640*** -0.640*** -0.025*** -0.647*** -0.669*** -0.023*** (0.084) (0.083) (0.078) (0.003) (0.104) (0.101) (0.004) Constant 29.258*** 30.355*** 32.097*** 3.408*** 29.739*** 34.953*** 3.480*** (1.247) (1.115) (1.202) (0.053) (1.474) (1.558) (0.065) Dependent variable: Log reservation offer
No No No Yes No No Yes
R2 0.110 0.102 0.160 0.149 0.109 0.147 0.095 Subject-period observations
1410 1410 1410 1,401 1287 1287 1,273
Note: Standard errors in parentheses are clustered at the subject-level. The models are estimated by ordinary least squares. Risk preferences are measured using the lottery question from the HRS. *** — significant at 1% ** — significant at 5% * — significant at 10%
39
Table 8: Coefficient estimates for the models of correctly completed items Coefficients Variable Limited information Full information
Beliefs in t-1 Locus of control 0.940** -0.294 (0.379) (0.371) Risk preferences -0.556 -0.113 (0.352) (0.346) Optimism-pessimism 0.207 0.297 (0.400) (0.372) Self-esteem -0.334 0.070 (0.463) (0.415) Big One -0.490 -0.750** (Extroversion) (0.322) (0.370) Big Two 0.687** 0.093 (Agreeableness) (0.297) (0.310) Big Three -0.499 -0.409 (Conscientiousness) (0.323) (0.315) Big Four 0.206 -0.033 (Emotional Stability) (0.379) (0.292) Big Five -0.356 -0.333 (Intellect) (0.359) (0.273) Search cost decile -0.139 -0.078 (0.114) (0.118) Period -0.005 -0.027 (0.055) (0.046) Constant 10.570*** 13.477*** (0.658) (0.629) R2 0.074 0.057 Subject-period observations 1410 1287
Note: Standard errors in parentheses are clustered at the subject-level. The models are estimated by ordinary least squares. Risk preferences are measured using the lottery question from the HRS. *** — significant at 1% ** — significant at 5% * — significant at 10%
40
Table 9: Estimated marginal effects in pseudo-effort treatment Dependent variables Limited information treatment Full information treatment Variable Beliefs Reservation
offers Correctly completed items
Reservation offers
Correctly completed items
Locus of control 0.291 3.369 -0.509 0.196 -0.718 (1.948) (2.882) (0.448) (1.284) (0.605) Risk preferences 0.481 -0.676 0.091 3.830** 0.547 (2.122) (2.813) (0.783) (1.539) (0.698) Optimism-pessimism -0.783 3.165 0.636 1.513 -2.060*** (2.683) (3.128) (0.725) (1.160) (0.633) Self-esteem -7.903** -8.217* -2.988*** -3.242* -0.252 (3.409) (4.529) (0.737) (1.628) (0.652) Big One -5.781 -2.464 0.014 2.231* -0.630 (Extroversion) (3.865) (3.930) (0.604) (1.221) (0.506) Big Two 2.646 -1.237 -0.592 -0.124 1.529** (Agreeableness) (2.411) (1.783) (0.550) (1.513) (0.673) Big Three -7.701** -1.162 0.582 -1.345 -1.101 (Conscientiousness) (3.722) (2.627) (0.926) (1.334) (0.706) Big Four 2.807 4.920 1.020 0.319 1.522** (Emotional Stability) (3.130) (3.764) (0.783) (1.477) (0.600) Big Five 2.606 5.557** 0.228 2.061* -0.206 (Intellect) (2.827) (2.436) (0.523) (1.180) (0.445) Period -0.315 -0.227 -0.251** -0.337** -0.385*** (0.369) (0.327) (0.104) (0.165) (0.102) Constant 41.810*** 31.426*** 9.607*** 30.391*** 14.304*** (3.376) (3.584) (0.918) (1.685) (0.903) R2 0.175 0.130 0.179 0.238 0.229 Subject-period observations
425 425 425 380 380
Note: Standard errors in parentheses are clustered at the subject-level. The models are estimated by ordinary least squares. Risk preferences are measured using the lottery question from the HRS. *** — significant at 1% ** — significant at 5% * — significant at 10%
41
Table 10: Estimated marginal effects employing Holt-Laury risk preference measure in
preferred specifications Limited information treatment Full information treatment Variable Beliefs Reservation
offers Correctly completed items
Probability of quitting
Reservation offers
Correctly completed items
Probability of quitting
Locus of control -0.450 0.980 0.886** -0.069** -0.222 -0.296 -0.038 (2.094) (0.625) (0.388) (0.035) (0.735) (0.354) (0.027) Risk preferences -4.235** -0.891* 0.050 -0.025 -1.032 -0.213 -0.016 (1.644) (0.526) (0.364) (0.032) (0.776) (0.386) (0.026) Optimism- 5.101** 1.094 0.223 -0.015 1.160 0.286 0.030 pessimism (2.442) (0.714) (0.399) (0.039) (0.877) (0.362) (0.026) Self-esteem -3.019 -0.573 -0.332 0.006 -0.599 0.058 -0.032 (2.734) (0.846) (0.473) (0.037) (1.090) (0.413) (0.026) Big One -6.107*** -1.219 -0.569* 0.014 -0.277 -0.775** 0.028 (Extroversion) (2.176) (0.790) (0.333) (0.035) (0.865) (0.387) (0.029) Big Two 1.673 0.775 0.654** 0.005 -1.968** 0.128 0.027 (Agreeableness) (2.106) (0.742) (0.310) (0.032) (0.875) (0.305) (0.024) Big Three -5.418** -0.380 -0.455 0.024 -0.605 -0.411 0.066*** (Conscientiousness) (2.224) (0.686) (0.325) (0.032) (0.802) (0.318) (0.027) Big Four -1.602 -0.262 0.214 0.084** -0.594 -0.023 0.018 (Emot. Stability) (2.011) (0.632) (0.392) (0.035) (0.907) (0.296) (0.020) Big Five 0.115 1.597** -0.331 -0.012 0.040 -0.343 0.000 (Intellect) (2.350) (0.612) (0.347) (0.035) (0.650) (0.249) (0.023) Search cost decile -0.761 -0.097 -0.127 0.006 -0.509* -0.072 0.003 (0.611) (0.224) (0.116) (0.012) (0.284) (0.111) (0.008) Period -0.628** -0.660*** -0.012 0.020*** -0.662*** -0.026 0.005* (0.277) (0.080) (0.054) (0.005) (0.097) (0.044) (0.003) Constant 58.382*** 32.152*** 10.568*** 34.821*** 13.448*** (3.544) (1.252) (0.665) (1.522) (0.585) R2 0.126 0.140 0.062 0.085 0.150 0.058 0.086 Subject-period observations
1410 1410 1410 1410 1287 1287 1287
Note: Standard errors in parentheses are clustered at the subject-level. The models in columns 1-3 and 4-5 are estimated by ordinary least squares. Columns 4 and 7 report the marginal effects from probit models of the probability of quitting estimated by maximum likelihood. Pseudo-R2s reported for the probit models. *** — significant at 1% ** — significant at 5% * — significant at 10%
42
Table 11: Estimated marginal effects including achievement scores in preferred specifications Limited information Treatment Full information treatment Variable Beliefs Reservation
offers Correctly completed items
Probability of quitting
Reservation offers
Correctly completed items
Probability of quitting
Locus of control 1.026 1.291 0.571 -0.088** -0.287 -0.606* -0.021 (2.460) (0.822) (0.377) (0.041) (0.783) (0.357) (0.025) Risk preferences -2.803 -1.433** -0.742* 0.062* -0.925 -0.125 -0.004 (2.124) (0.711) (0.427) (0.036) (0.887) (0.394) (0.017) Optimism- 2.598 0.715 0.332 -0.025 1.896* 0.450 0.011 pessimism (2.411) (0.770) (0.417) (0.043) (1.029) (0.430) (0.025) Self-esteem -1.749 -0.337 -0.564 0.021 -0.370 0.080 -0.029 (2.540) (0.944) (0.467) (0.045) (1.260) (0.437) (0.023) Big One -6.208** -1.040 -0.364 -0.001 -0.094 -0.545 0.014 (Extroversion) (2.385) (0.902) (0.366) (0.045) (1.048) (0.409) (0.025) Big Two 3.146 1.134 0.666* 0.020 -2.497*** -0.232 0.043 (Agreeableness) (2.147) (0.792) (0.362) (0.038) (0.920) (0.323) (0.028) Big Three -6.830*** -0.610 -0.376 0.011 -0.968 0.098 0.037* (Conscientiousness) (2.418) (0.860) (0.364) (0.034) (0.903) (0.315) (0.021) Big Four 0.334 -0.271 -0.127 0.132*** -1.544 -0.442 0.042* (Emot. Stability) (2.303) (0.739) (0.443) (0.044) (1.005) (0.356) (0.022) Big Five -0.979 1.306* -0.429 -0.006 -0.202 -0.465 0.013 (Intellect) (2.547) (0.729) (0.422) (0.041) (0.761) (0.288) (0.021) Search cost decile -0.716 0.016 -0.060 0.013 -0.462 -0.208 0.009 (0.673) (0.273) (0.135) (0.014) (0.351) (0.125) (0.007) Achievement score 0.948 -0.729 0.909** -0.085** 0.335 0.988*** -0.052*** (1.970) (0.787) (0.364) (0.039) (0.740) (0.340) (0.018) Period -0.719** -0.630*** 0.033 0.018*** -0.660*** -0.031 0.003 (0.275) (0.084) (0.054) (0.005) (0.118) (0.050) (0.002) Constant 58.160*** 31.400*** 10.156*** 34.445*** 14.309*** (3.683) (1.446) (0.761) (1.929) (0.642) R2 0.107 0.159 0.091 0.119 0.160 0.115 0.143 Subject-period observations
1132 1132 1132 1132 1019 1019 1019
Note: Standard errors in parentheses are clustered at the subject-level. The models in columns 1-3 and 4-5 are estimated by ordinary least squares. Columns 4 and 7 report the marginal effects from probit models of the probability of quitting estimated by maximum likelihood. Pseudo-R2s reported for the probit models. Risk preferences are measured using the lottery question from the HRS. *** — significant at 1% ** — significant at 5% * — significant at 10%
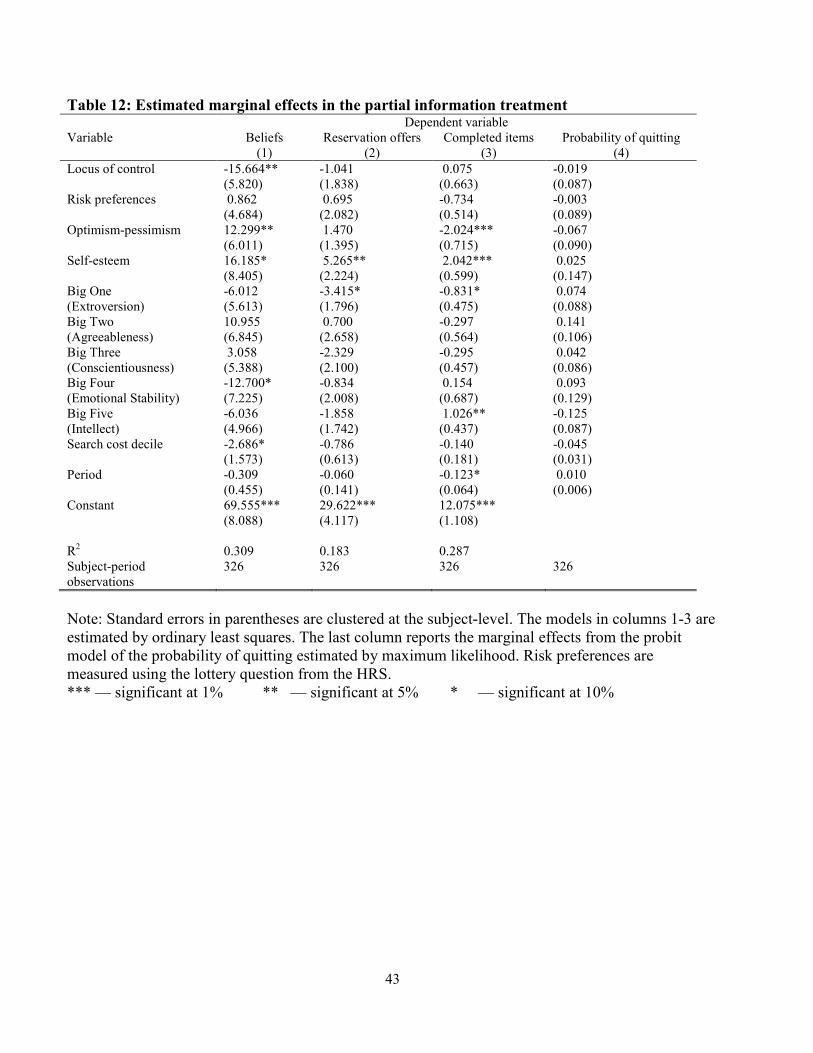
43
Table 12: Estimated marginal effects in the partial information treatment Dependent variable Variable Beliefs
(1) Reservation offers
(2) Completed items
(3) Probability of quitting
(4)
Locus of control -15.664** -1.041 0.075 -0.019 (5.820) (1.838) (0.663) (0.087) Risk preferences 0.862 0.695 -0.734 -0.003 (4.684) (2.082) (0.514) (0.089) Optimism-pessimism 12.299** 1.470 -2.024*** -0.067 (6.011) (1.395) (0.715) (0.090) Self-esteem 16.185* 5.265** 2.042*** 0.025 (8.405) (2.224) (0.599) (0.147) Big One -6.012 -3.415* -0.831* 0.074 (Extroversion) (5.613) (1.796) (0.475) (0.088) Big Two 10.955 0.700 -0.297 0.141 (Agreeableness) (6.845) (2.658) (0.564) (0.106) Big Three 3.058 -2.329 -0.295 0.042 (Conscientiousness) (5.388) (2.100) (0.457) (0.086) Big Four -12.700* -0.834 0.154 0.093 (Emotional Stability) (7.225) (2.008) (0.687) (0.129) Big Five -6.036 -1.858 1.026** -0.125 (Intellect) (4.966) (1.742) (0.437) (0.087) Search cost decile -2.686* -0.786 -0.140 -0.045 (1.573) (0.613) (0.181) (0.031) Period -0.309 -0.060 -0.123* 0.010 (0.455) (0.141) (0.064) (0.006) Constant 69.555*** 29.622*** 12.075*** (8.088) (4.117) (1.108) R2 0.309 0.183 0.287 Subject-period observations
326 326 326 326
Note: Standard errors in parentheses are clustered at the subject-level. The models in columns 1-3 are estimated by ordinary least squares. The last column reports the marginal effects from the probit model of the probability of quitting estimated by maximum likelihood. Risk preferences are measured using the lottery question from the HRS. *** — significant at 1% ** — significant at 5% * — significant at 10%
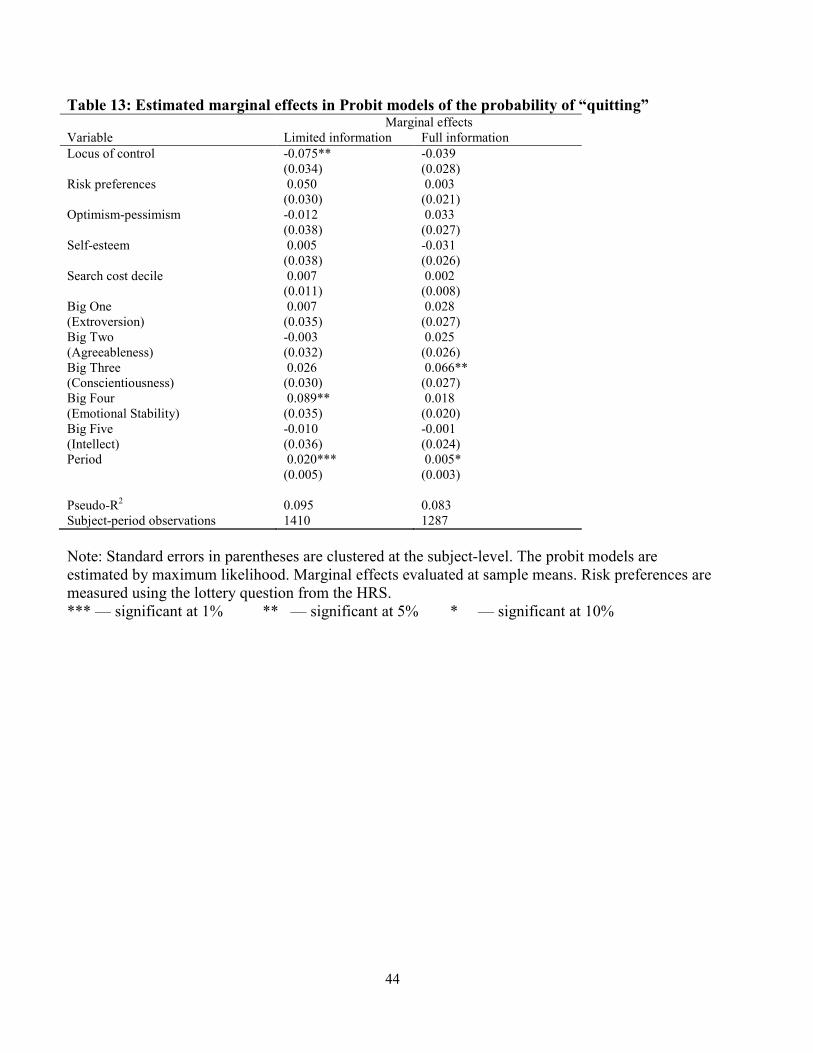
44
Table 13: Estimated marginal effects in Probit models of the probability of “quitting” Marginal effects Variable Limited information Full information
Locus of control -0.075** -0.039 (0.034) (0.028) Risk preferences 0.050 0.003 (0.030) (0.021) Optimism-pessimism -0.012 0.033 (0.038) (0.027) Self-esteem 0.005 -0.031 (0.038) (0.026) Search cost decile 0.007 0.002 (0.011) (0.008) Big One 0.007 0.028 (Extroversion) (0.035) (0.027) Big Two -0.003 0.025 (Agreeableness) (0.032) (0.026) Big Three 0.026 0.066** (Conscientiousness) (0.030) (0.027) Big Four 0.089** 0.018 (Emotional Stability) (0.035) (0.020) Big Five -0.010 -0.001 (Intellect) (0.036) (0.024) Period 0.020*** 0.005* (0.005) (0.003) Pseudo-R2 0.095 0.083 Subject-period observations 1410 1287
Note: Standard errors in parentheses are clustered at the subject-level. The probit models are estimated by maximum likelihood. Marginal effects evaluated at sample means. Risk preferences are measured using the lottery question from the HRS. *** — significant at 1% ** — significant at 5% * — significant at 10%
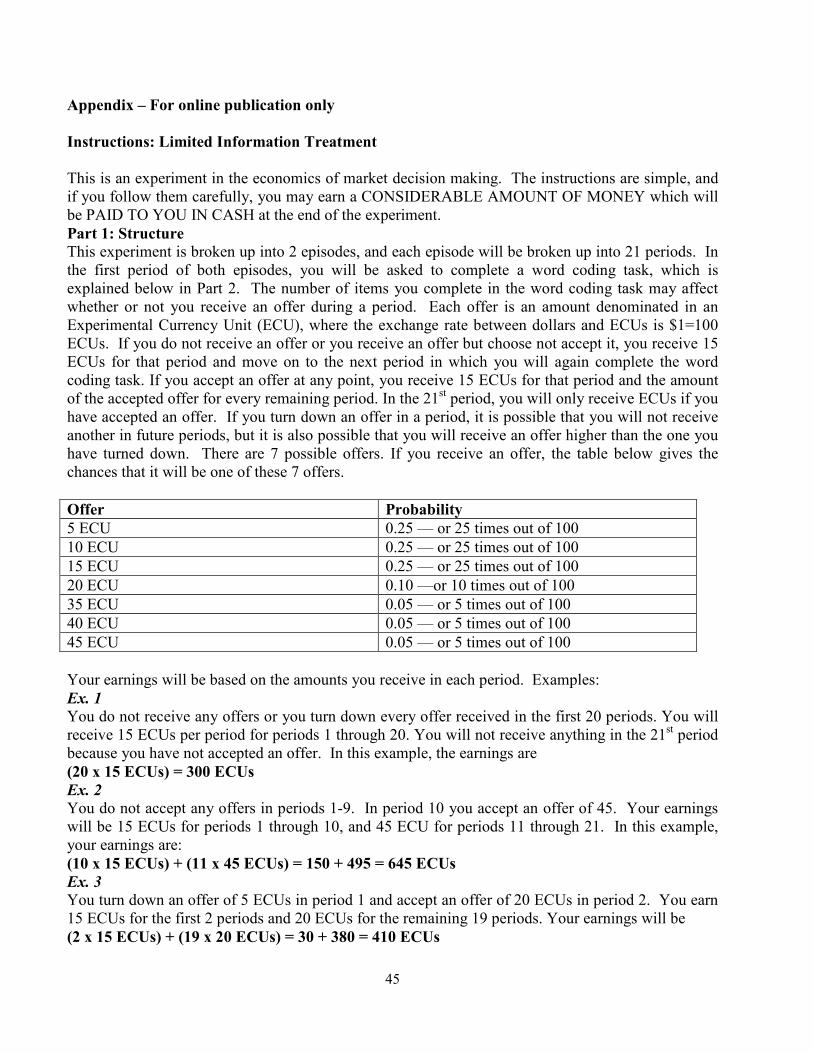
45
Appendix – For online publication only
Instructions: Limited Information Treatment
This is an experiment in the economics of market decision making. The instructions are simple, and if you follow them carefully, you may earn a CONSIDERABLE AMOUNT OF MONEY which will be PAID TO YOU IN CASH at the end of the experiment.
Part 1: Structure
This experiment is broken up into 2 episodes, and each episode will be broken up into 21 periods. In the first period of both episodes, you will be asked to complete a word coding task, which is explained below in Part 2. The number of items you complete in the word coding task may affect whether or not you receive an offer during a period. Each offer is an amount denominated in an Experimental Currency Unit (ECU), where the exchange rate between dollars and ECUs is $1=100 ECUs. If you do not receive an offer or you receive an offer but choose not accept it, you receive 15 ECUs for that period and move on to the next period in which you will again complete the word coding task. If you accept an offer at any point, you receive 15 ECUs for that period and the amount of the accepted offer for every remaining period. In the 21st period, you will only receive ECUs if you have accepted an offer. If you turn down an offer in a period, it is possible that you will not receive another in future periods, but it is also possible that you will receive an offer higher than the one you have turned down. There are 7 possible offers. If you receive an offer, the table below gives the chances that it will be one of these 7 offers.
Offer Probability
5 ECU 0.25 — or 25 times out of 100
10 ECU 0.25 — or 25 times out of 100
15 ECU 0.25 — or 25 times out of 100
20 ECU 0.10 —or 10 times out of 100
35 ECU 0.05 — or 5 times out of 100
40 ECU 0.05 — or 5 times out of 100
45 ECU 0.05 — or 5 times out of 100
Your earnings will be based on the amounts you receive in each period. Examples:
Ex. 1
You do not receive any offers or you turn down every offer received in the first 20 periods. You will receive 15 ECUs per period for periods 1 through 20. You will not receive anything in the 21st period because you have not accepted an offer. In this example, the earnings are
(20 x 15 ECUs) = 300 ECUs
Ex. 2
You do not accept any offers in periods 1-9. In period 10 you accept an offer of 45. Your earnings will be 15 ECUs for periods 1 through 10, and 45 ECU for periods 11 through 21. In this example, your earnings are:
(10 x 15 ECUs) + (11 x 45 ECUs) = 150 + 495 = 645 ECUs
Ex. 3
You turn down an offer of 5 ECUs in period 1 and accept an offer of 20 ECUs in period 2. You earn 15 ECUs for the first 2 periods and 20 ECUs for the remaining 19 periods. Your earnings will be
(2 x 15 ECUs) + (19 x 20 ECUs) = 30 + 380 = 410 ECUs
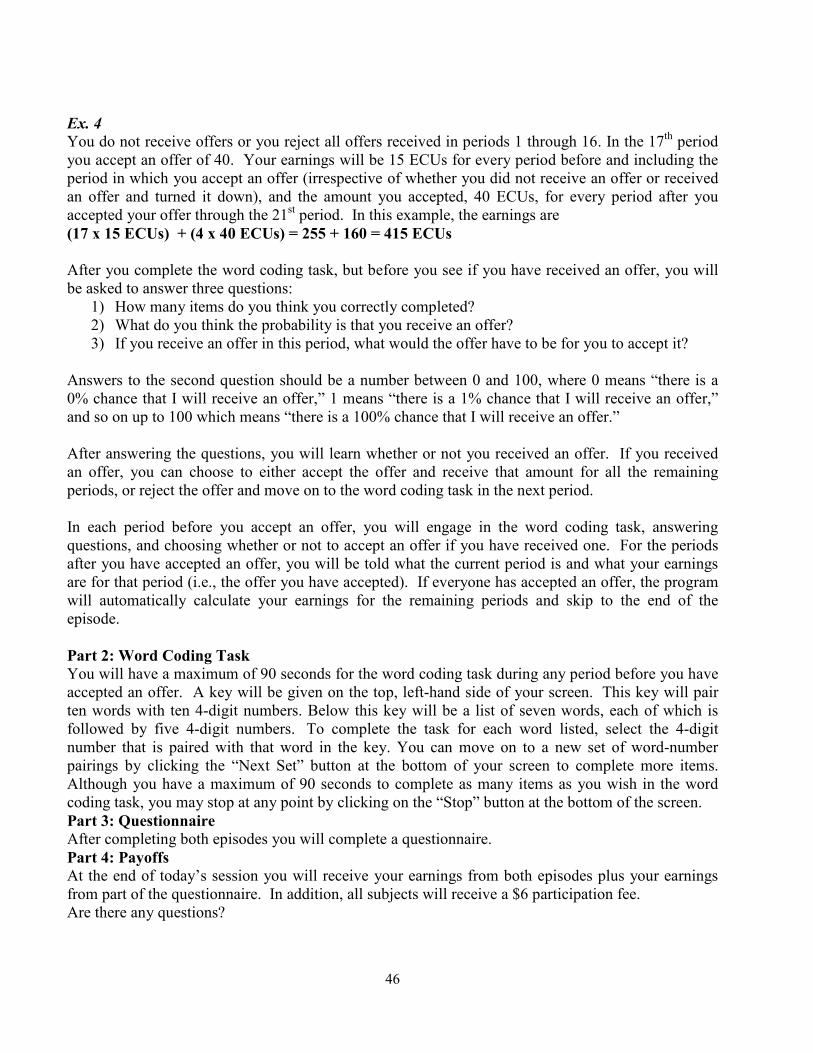
46
Ex. 4
You do not receive offers or you reject all offers received in periods 1 through 16. In the 17th period you accept an offer of 40. Your earnings will be 15 ECUs for every period before and including the period in which you accept an offer (irrespective of whether you did not receive an offer or received an offer and turned it down), and the amount you accepted, 40 ECUs, for every period after you accepted your offer through the 21st period. In this example, the earnings are
(17 x 15 ECUs) + (4 x 40 ECUs) = 255 + 160 = 415 ECUs
After you complete the word coding task, but before you see if you have received an offer, you will be asked to answer three questions:
1) How many items do you think you correctly completed? 2) What do you think the probability is that you receive an offer? 3) If you receive an offer in this period, what would the offer have to be for you to accept it?
Answers to the second question should be a number between 0 and 100, where 0 means “there is a 0% chance that I will receive an offer,” 1 means “there is a 1% chance that I will receive an offer,” and so on up to 100 which means “there is a 100% chance that I will receive an offer.” After answering the questions, you will learn whether or not you received an offer. If you received an offer, you can choose to either accept the offer and receive that amount for all the remaining periods, or reject the offer and move on to the word coding task in the next period. In each period before you accept an offer, you will engage in the word coding task, answering questions, and choosing whether or not to accept an offer if you have received one. For the periods after you have accepted an offer, you will be told what the current period is and what your earnings are for that period (i.e., the offer you have accepted). If everyone has accepted an offer, the program will automatically calculate your earnings for the remaining periods and skip to the end of the episode.
Part 2: Word Coding Task
You will have a maximum of 90 seconds for the word coding task during any period before you have accepted an offer. A key will be given on the top, left-hand side of your screen. This key will pair ten words with ten 4-digit numbers. Below this key will be a list of seven words, each of which is followed by five 4-digit numbers. To complete the task for each word listed, select the 4-digit number that is paired with that word in the key. You can move on to a new set of word-number pairings by clicking the “Next Set” button at the bottom of your screen to complete more items. Although you have a maximum of 90 seconds to complete as many items as you wish in the word coding task, you may stop at any point by clicking on the “Stop” button at the bottom of the screen.
Part 3: Questionnaire
After completing both episodes you will complete a questionnaire.
Part 4: Payoffs
At the end of today’s session you will receive your earnings from both episodes plus your earnings from part of the questionnaire. In addition, all subjects will receive a $6 participation fee. Are there any questions?
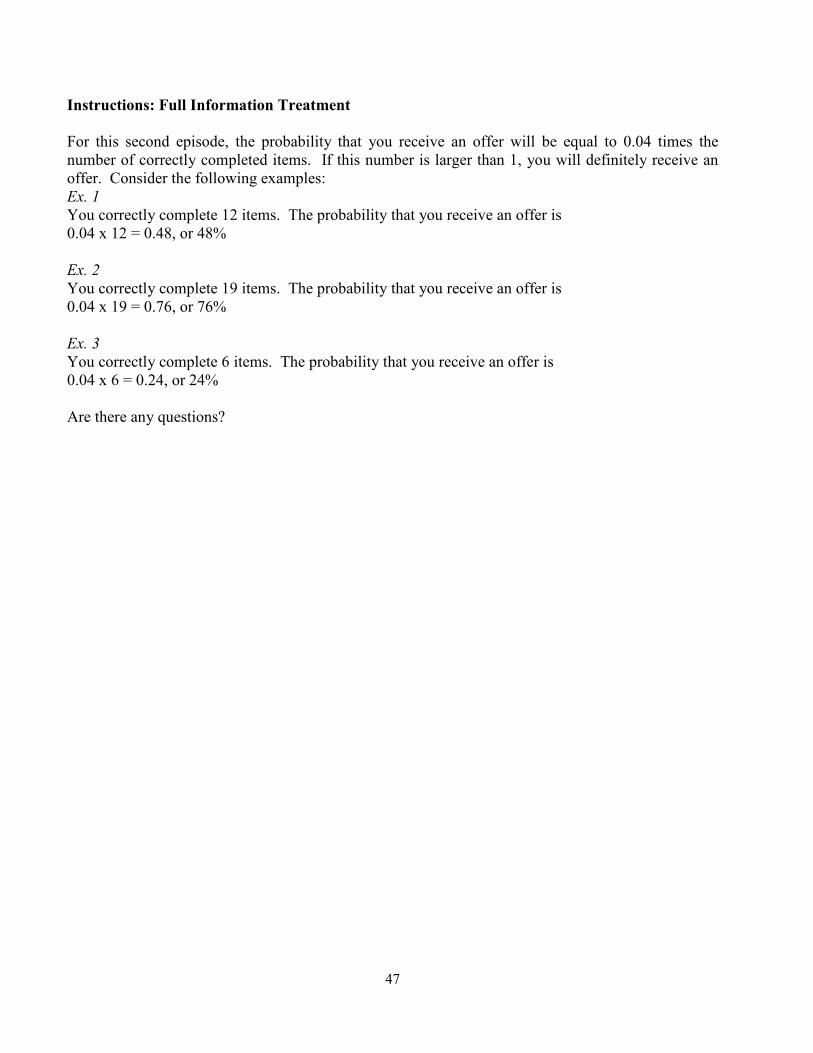
47
Instructions: Full Information Treatment
For this second episode, the probability that you receive an offer will be equal to 0.04 times the number of correctly completed items. If this number is larger than 1, you will definitely receive an offer. Consider the following examples: Ex. 1
You correctly complete 12 items. The probability that you receive an offer is 0.04 x 12 = 0.48, or 48% Ex. 2
You correctly complete 19 items. The probability that you receive an offer is 0.04 x 19 = 0.76, or 76% Ex. 3
You correctly complete 6 items. The probability that you receive an offer is 0.04 x 6 = 0.24, or 24% Are there any questions?
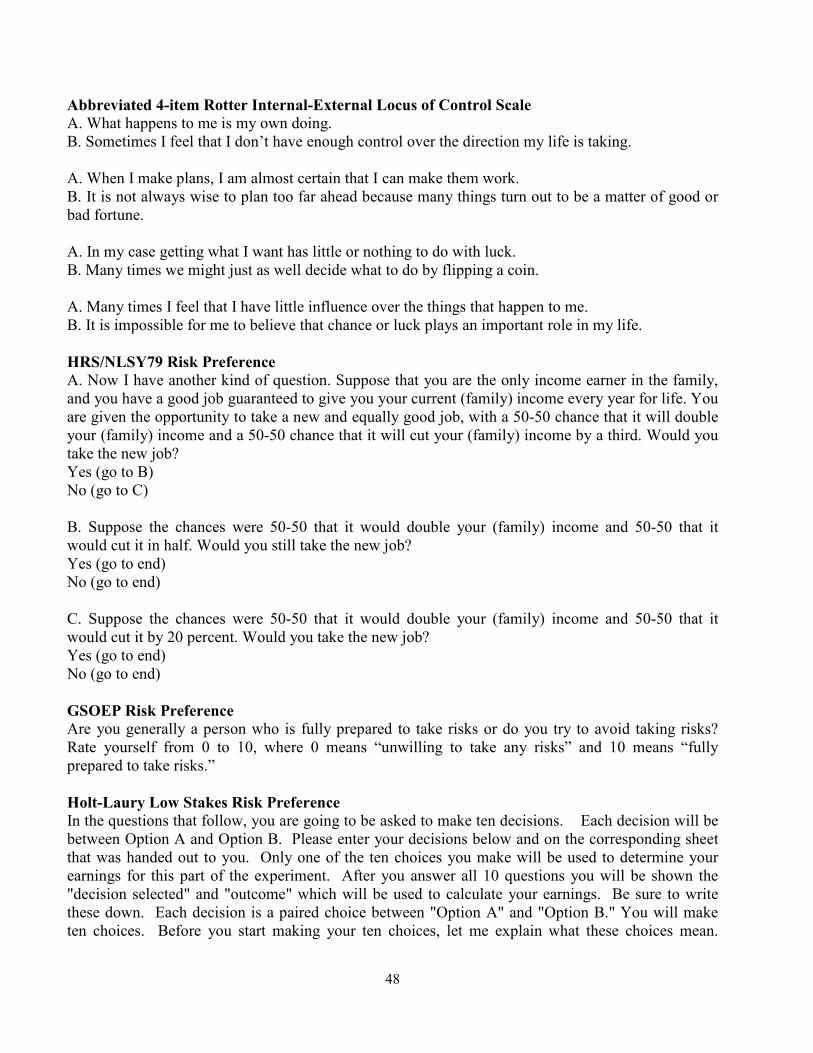
48
Abbreviated 4-item Rotter Internal-External Locus of Control Scale
A. What happens to me is my own doing. B. Sometimes I feel that I don’t have enough control over the direction my life is taking. A. When I make plans, I am almost certain that I can make them work. B. It is not always wise to plan too far ahead because many things turn out to be a matter of good or bad fortune. A. In my case getting what I want has little or nothing to do with luck. B. Many times we might just as well decide what to do by flipping a coin. A. Many times I feel that I have little influence over the things that happen to me. B. It is impossible for me to believe that chance or luck plays an important role in my life.
HRS/NLSY79 Risk Preference
A. Now I have another kind of question. Suppose that you are the only income earner in the family, and you have a good job guaranteed to give you your current (family) income every year for life. You are given the opportunity to take a new and equally good job, with a 50-50 chance that it will double your (family) income and a 50-50 chance that it will cut your (family) income by a third. Would you take the new job? Yes (go to B) No (go to C) B. Suppose the chances were 50-50 that it would double your (family) income and 50-50 that it would cut it in half. Would you still take the new job? Yes (go to end) No (go to end) C. Suppose the chances were 50-50 that it would double your (family) income and 50-50 that it would cut it by 20 percent. Would you take the new job? Yes (go to end) No (go to end)
GSOEP Risk Preference
Are you generally a person who is fully prepared to take risks or do you try to avoid taking risks? Rate yourself from 0 to 10, where 0 means “unwilling to take any risks” and 10 means “fully prepared to take risks.”
Holt-Laury Low Stakes Risk Preference
In the questions that follow, you are going to be asked to make ten decisions. Each decision will be between Option A and Option B. Please enter your decisions below and on the corresponding sheet that was handed out to you. Only one of the ten choices you make will be used to determine your earnings for this part of the experiment. After you answer all 10 questions you will be shown the "decision selected" and "outcome" which will be used to calculate your earnings. Be sure to write these down. Each decision is a paired choice between "Option A" and "Option B." You will make ten choices. Before you start making your ten choices, let me explain what these choices mean.
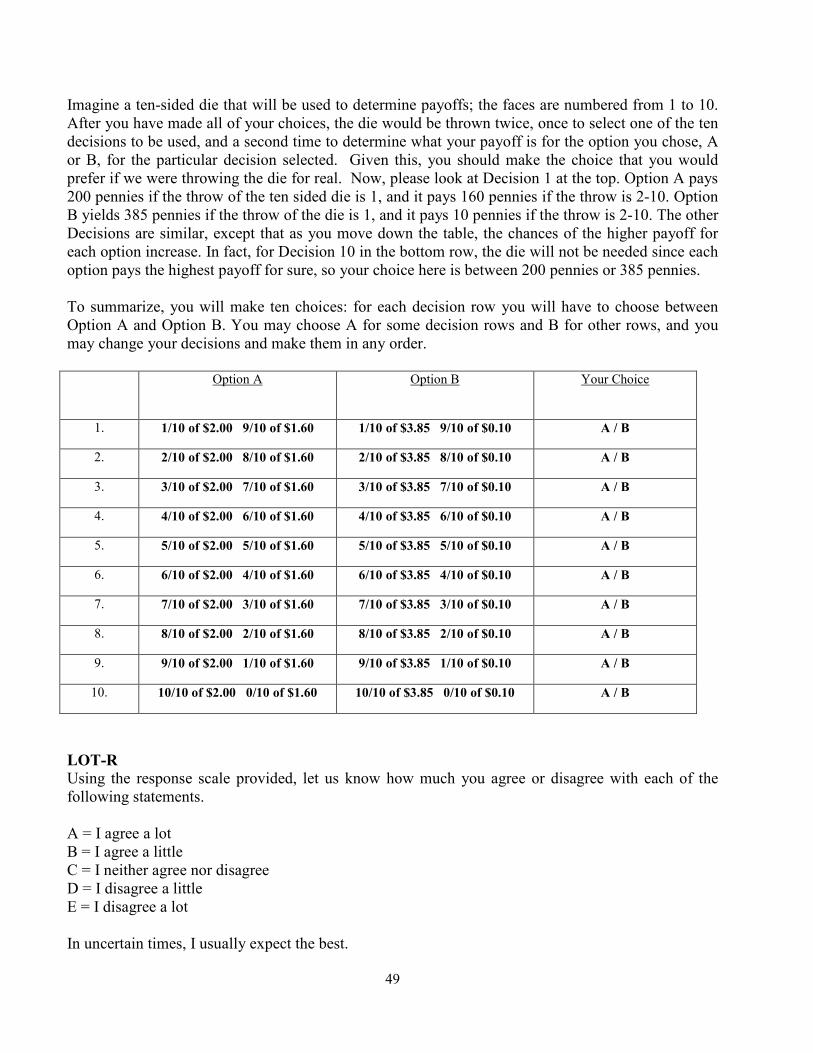
49
Imagine a ten-sided die that will be used to determine payoffs; the faces are numbered from 1 to 10. After you have made all of your choices, the die would be thrown twice, once to select one of the ten decisions to be used, and a second time to determine what your payoff is for the option you chose, A or B, for the particular decision selected. Given this, you should make the choice that you would prefer if we were throwing the die for real. Now, please look at Decision 1 at the top. Option A pays 200 pennies if the throw of the ten sided die is 1, and it pays 160 pennies if the throw is 2-10. Option B yields 385 pennies if the throw of the die is 1, and it pays 10 pennies if the throw is 2-10. The other Decisions are similar, except that as you move down the table, the chances of the higher payoff for each option increase. In fact, for Decision 10 in the bottom row, the die will not be needed since each option pays the highest payoff for sure, so your choice here is between 200 pennies or 385 pennies. To summarize, you will make ten choices: for each decision row you will have to choose between Option A and Option B. You may choose A for some decision rows and B for other rows, and you may change your decisions and make them in any order.
Option A Option B Your Choice
1. 1/10 of $2.00 9/10 of $1.60 1/10 of $3.85 9/10 of $0.10 A / B
2. 2/10 of $2.00 8/10 of $1.60 2/10 of $3.85 8/10 of $0.10 A / B
3. 3/10 of $2.00 7/10 of $1.60 3/10 of $3.85 7/10 of $0.10 A / B
4. 4/10 of $2.00 6/10 of $1.60 4/10 of $3.85 6/10 of $0.10 A / B
5. 5/10 of $2.00 5/10 of $1.60 5/10 of $3.85 5/10 of $0.10 A / B
6. 6/10 of $2.00 4/10 of $1.60 6/10 of $3.85 4/10 of $0.10 A / B
7. 7/10 of $2.00 3/10 of $1.60 7/10 of $3.85 3/10 of $0.10 A / B
8. 8/10 of $2.00 2/10 of $1.60 8/10 of $3.85 2/10 of $0.10 A / B
9. 9/10 of $2.00 1/10 of $1.60 9/10 of $3.85 1/10 of $0.10 A / B
10. 10/10 of $2.00 0/10 of $1.60 10/10 of $3.85 0/10 of $0.10 A / B
LOT-R
Using the response scale provided, let us know how much you agree or disagree with each of the following statements. A = I agree a lot B = I agree a little C = I neither agree nor disagree D = I disagree a little E = I disagree a lot In uncertain times, I usually expect the best.

50
If something can go wrong for me, it will. I'm always optimistic about my future. I hardly ever expect things to go my way. I rarely count on good things happening to me. Overall, I expect more good things to happen to me than bad.
Rosenberg Self-Esteem Scale
Using the response scale provided, let us know how much you agree or disagree with each of the following statements. Strongly Agree Agree Disagree Strongly Disagree I feel that I'm a person of worth, at least on an equal basis with others. I feel that I have a number of good qualities. All in all, I am inclined to feel that I am a failure I am able to do things as well as most other people. I feel I do not have much to be proud of. I take a positive attitude toward myself. On the whole, I am satisfied with myself. I wish I could have more respect for myself. I certainly feel useless at times. At times I think I am no good at all.
Cost Questions
We would like to get a sense for your opinion of the word matching we had you do. Imagine that you had to complete some items in the word matching task, but you have the option to pay money to be excused from completing some of them. Please tell us how much you would be willing to pay, in dollars, to be excused from different numbers of items. For example, an answer of $0.01 means you would pay 1 cent, and an answer of $2 means that you would be willing to pay $2. Please consider the questions and answer them seriously (i.e. paying $1 billion to avoid doing one item seems unlikely). Your answers can vary down to the penny. Raise your hand if you have any questions. How much would you be willing to pay to avoid completing 4 items? How much would you be willing to pay to avoid completing 8 items? How much would you be willing to pay to avoid completing 12 items? How much would you be willing to pay to avoid completing 16 items? How much would you be willing to pay to avoid completing 20 items? How much would you be willing to pay to avoid completing 24 items?