science mapping and research positioning
TRANSCRIPT

Science Mapping and Research
Positioning
Nees Jan van Eck
Centre for Science and Technology Studies (CWTS), Leiden University
2017 BenchTech Seminar
Technical University Munich, Munich, Germany, June 28, 2017

Centre for Science and Technology
Studies (CWTS)
• Research center at Leiden University
focusing on science and technology
studies
• Strong emphasis on bibliometric
and scientometric research
• Provider of commercial
scientometric services
• History of more than 25 years
• Currently about 30 staff members
1

Centre for Science and Technology
Studies (CWTS)
• Basic research:
– Quantitative science studies
– Science and evaluation studies
– Science, technology and innovation studies
• Contract research:
– Bibliometric studies for universities, funding organizations,
governments, scientific publishers, etc.
– Mostly done using the in-house Web of Science database of CWTS
2

CWTS Leiden Ranking
3

Scientometric databases at CWTS
• Web of Science
• Scopus
• PubMed
• PATSTAT
• CrossRef
• ORCID
• Mendeley
• Altmetric.com
• DataCite
• OpenAIRE
• DOAJ
• ROAD
• oaDOI
• Orbis
• Full-text databases
(Elsevier, PubMed
Central, Springer, Wiley)
• …
4

Bibliometric databases: ‘Big data’
5
Web of Science Scopus
Journals 12,000 20,000
Publications 47 million 42 million
Citations 1 billion 1.1 billion

Bibliometric networks
6
Web of
Science
Scopus
PubMed
Citation network
of pubs / authors / journals
Co-authorship network
of authors / organizations
Co-citation network
of pubs / authors / journals
Co-occurrence network
of keywords / terms
Bibliographic coupling network
of pubs / authors / journals
Bibliographic
database

Outline
• Software tools
– VOSviewer
– CitNetExplorer
• Network analysis techniques
• Large-scale analysis of science
• BenchTech analysis
7

Software tools
for bibliometric
network
analysis
8
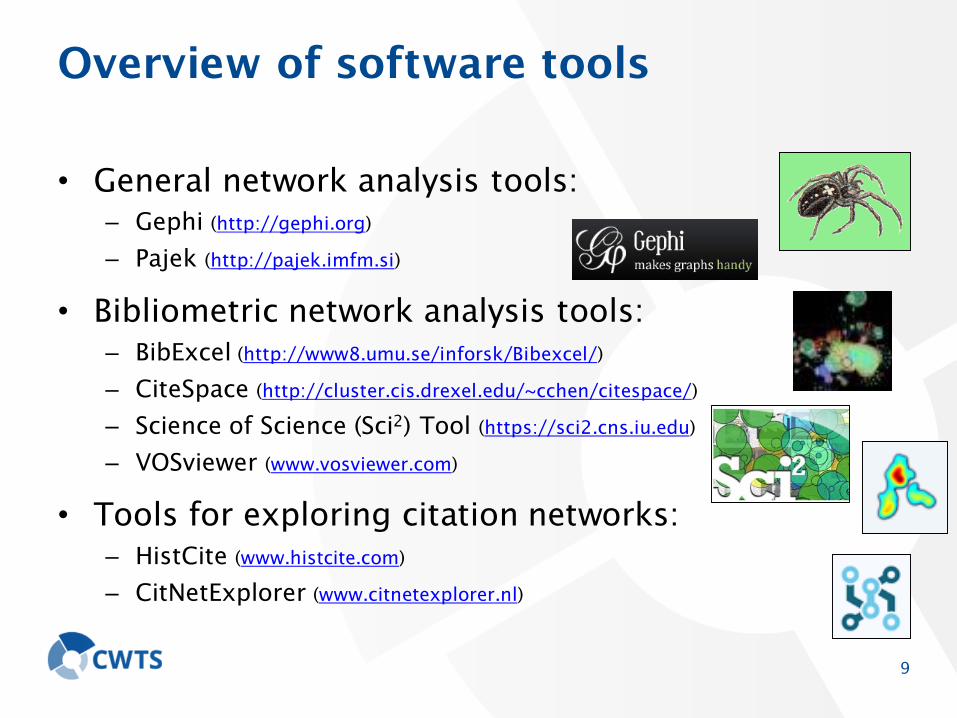
Overview of software tools
• General network analysis tools:
– Gephi (http://gephi.org)
– Pajek (http://pajek.imfm.si)
• Bibliometric network analysis tools:
– BibExcel (http://www8.umu.se/inforsk/Bibexcel/)
– CiteSpace (http://cluster.cis.drexel.edu/~cchen/citespace/)
– Science of Science (Sci2) Tool (https://sci2.cns.iu.edu)
– VOSviewer (www.vosviewer.com)
• Tools for exploring citation networks:
– HistCite (www.histcite.com)
– CitNetExplorer (www.citnetexplorer.nl)
9

Limitations
• Tools have been developed mainly by the scientific
community, not by commercial software companies
• Often targeted primarily at other researchers
• Usually freely available, at least for certain
purposes
• Sometimes difficult to use; not very user friendly
10

Software tools developed at CWTS
• VOSviewer (www.vosviewer.com)
– Tool for constructing and visualizing bibliometric networks
• CitNetExplorer (www.citnetexplorer.nl)
– Tool for visualizing and analyzing citation networks of
publications
• Both tools have been developed together
with my colleague Ludo Waltman 11

• Any type of (bibliometric)
network
• Time dimension is ignored
• Restricted to small and
medium-sized networks
• Only citation networks of
publications
• Time dimension is explicitly
considered
• Support for large networks
12
VOSviewer CitNetExplorer

VOSviewer
13

Bibliometric networks in VOSviewer
14
Web of
Science
Scopus
PubMed
Citation network
of pubs / authors / journals
Co-authorship network
of authors / organizations
Co-citation network
of pubs / authors / journals
Co-occurrence network
of keywords / terms
Bibliographic coupling network
of pubs / authors / journals
Bibliographic
database

VOSviewer
15

VOSviewer
• Software tool for visualizing (bibliometric) networks
• Built-in support for popular bibliographic databases
• Text mining functionality
• Layout and clustering techniques
• Advanced visualization features:
– Smart labeling algorithm
– Overlay visualizations
– Density visualizations (‘heat map’)
16

VOSviewer users
• Researchers
• Professional users (e.g., universities, libraries,
funders, publishers)
17

Increasing use of VOSviewer in
scientific publications
18
0
20
40
60
80
100
120
2010 2011 2012 2013 2014 2015 2016 2017
NumberofVOSviewerpublicationsperyear
Bibliometric maps in VOSviewer
• Co-authorship maps of
– authors / organizations / countries
• Citation maps of
– publications / journals / organizations / countries
• Co-citation maps of
– publications / journals / authors (first author only)
• Bibliographic coupling maps
– publications / journals / authors / organizations / countries
• Co-occurrence maps of
– keywords / terms extracted from titles and abstracts of articles
19
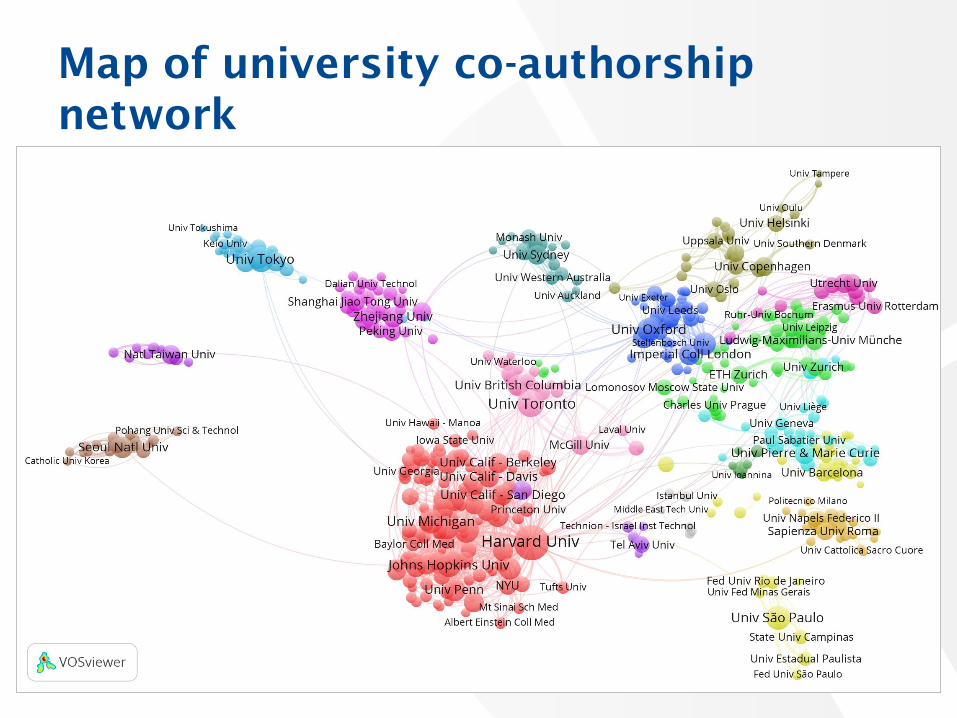
Map of university co-authorship
network
20
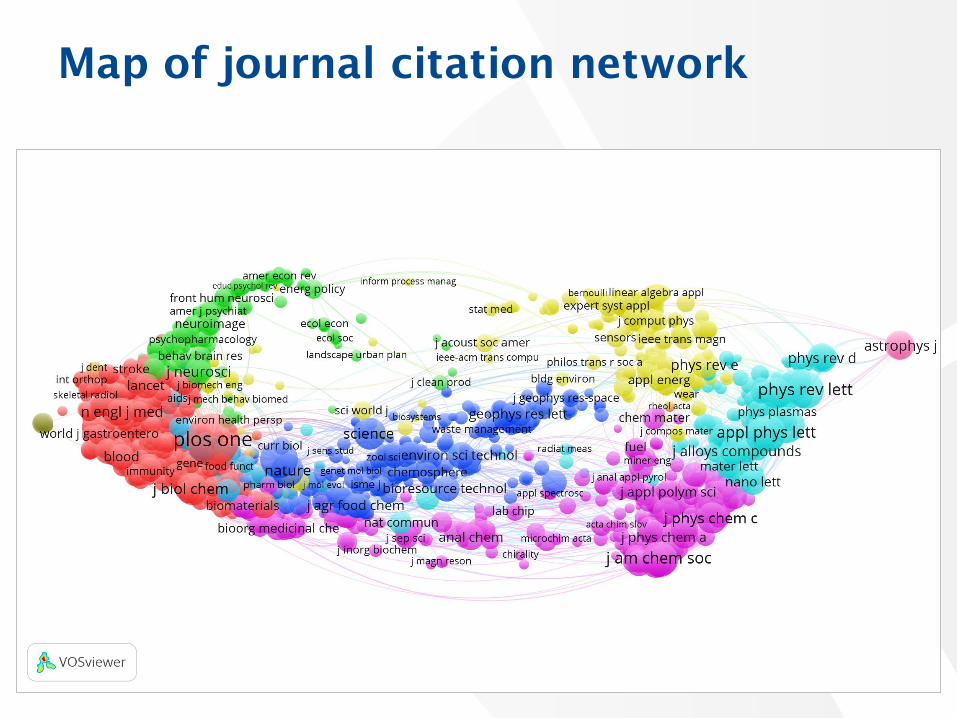
Map of journal citation network
21

• 2,667 publications in 3 journals (time period 2009–
2013):
– Journal of Informetrics
– Journal of the Association for Information Science and
Technology
– Scientometrics
• Data downloaded from the online version of Web of
Science
Demo: Creating different bibliometric
maps using VOSviewer
22

Term map
23

Interpretation of a term map
• Size:
– The larger a term, the higher the frequency of occurrence of the
term
• Distance:
– In general, the smaller the distance between two terms, the
higher the relatedness of the terms, as measured by co-
occurrences
– The horizontal and vertical axes have no special meaning; maps
can be freely rotated and flipped
• Colors:
– Colors indicate clusters of closely related terms
24

Co-citation map of journals
25

Co-authorship map of authors
26

CitNetExplorer
27

Bibliometric networks in CitNetExplorer
28
Web of
Science
Scopus
PubMed
Citation network
of pubs / authors / journals
Co-authorship network
of authors / organizations
Co-citation network
of pubs / authors / journals
Co-occurrence network
of keywords / terms
Bibliographic coupling network
of pubs / authors / journals
Bibliographic
database

CitNetExplorer
29

Standing on the shoulders of giants...
30

Why use CitNetExplorer?
• To analyze the structure and development of a
research field
– Example: Identifying the main topics in the field of
scientometrics and tracing the developments within each topic
• To delineate a research area
– Example: Delineating the literature on science mapping
• To study publication oeuvres
– Example: Identifying the publications of a researcher and
analyzing the influence of cited and citing publications
• To support literature reviewing
– Example: Reviewing the literature on the h-index
31

Literature reviewing using
CitNetExplorer
32

Network
analysis
techniques
33

Network analysis techniques
34
Layout:
• Assigning the nodes in a network to
locations in a (usually 2d) space
(a.k.a. mapping)
• Visualization of similarities (VOS)
Clustering:
• Partitioning the nodes in a network
into a number of groups (a.k.a.
community detection)
• Weighted modularity
• Smart local moving algorithm

3535
Clustering can be seen as mapping
in a restricted space

3636
Clustering can be seen as mapping
in a restricted space
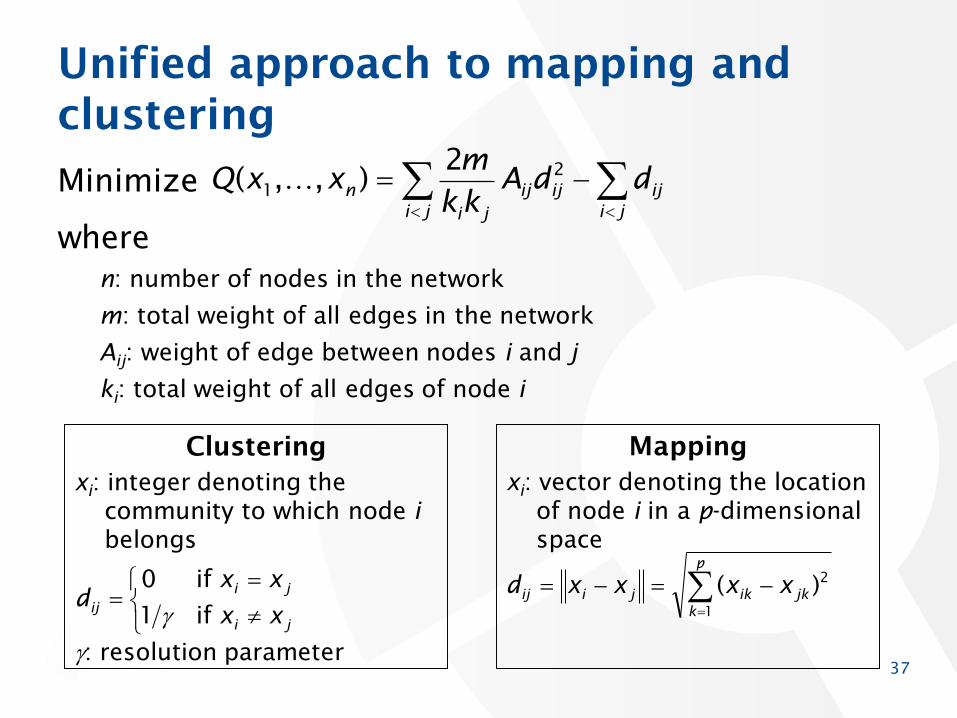
Unified approach to mapping and
clustering
Minimize
where
n: number of nodes in the network
m: total weight of all edges in the network
Aij: weight of edge between nodes i and j
ki: total weight of all edges of node i
37
ji
ij
ji
ijij
ji
nddA
kk
mxxQ
2
1
2),,(
Mapping
xi: vector denoting the location
of node i in a p-dimensional
space
p
k
jkikjiijxxxxd
1
2
)(
Clustering
xi: integer denoting the
community to which node i
belongs
: resolution parameter
ji
ji
ij
xx
xx
d
if 1
if 0

Large-scale
analysis of the
structure of
science
38

Classification systems
• Journal-level classification systems:
– Web of Science
– Scopus
– ...
• Publication-level classification systems:
– Disciplinary classification systems: MeSH, PACS, CA, JEL, ...
– Algorithmically constructed classification systems
39
Algorithmically constructed
classification system of science
• Publications (not journals) are clustered into
research areas based on citation relations
• Research areas are defined at different levels of
granularity and are organized hierarchically
• Clustering is performed using the smart local
moving algorithm (improved Louvain algorithm;
Waltman & Van Eck, 2013)
40

Algorithmically constructed
classification system of science
• 19.4 million publications from the period 2000–
2016 indexed in Web of Science
• 282.4 million citation relations
• Classification system of 3 hierarchical levels:
– 25 broad disciplines
– 805 fields
– 4,003 subfields
• Computational performance: less than 2 hours
41
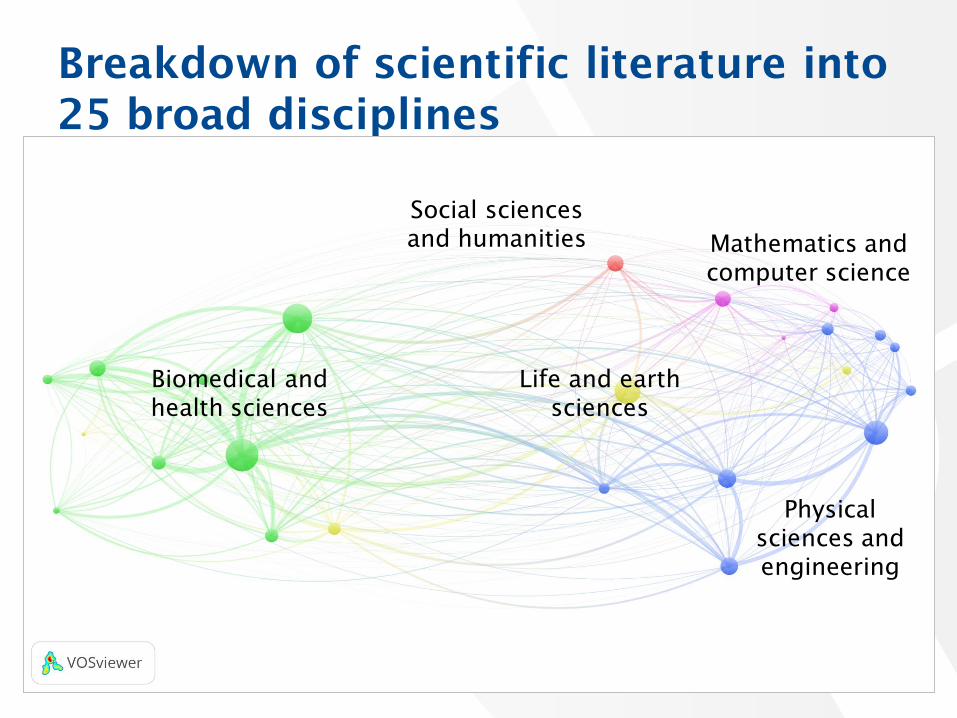
Breakdown of scientific literature into
25 broad disciplines
42
Social sciences
and humanities
Biomedical and
health sciences
Life and earth
sciences
Mathematics and
computer science
Physical
sciences and
engineering

43
Breakdown of scientific literature into
805 fields
Social sciences
and humanities
Biomedical and
health sciences
Life and earth
sciences
Mathematics and
computer science
Physical
sciences and
engineering

Breakdown of scientific literature into
4,003 subfields
44
Social sciences
and humanities
Biomedical and
health sciences
Life and earth
sciences
Mathematics and
computer science
Physical
sciences and
engineering

Breakdown of scientific literature into
4,003 subfields
45
Scientometrics
Social sciences
and humanities
Biomedical and
health sciences
Life and earth
sciences
Mathematics and
computer science
Physical
sciences and
engineering

Publications in scientometrics
subfield
46
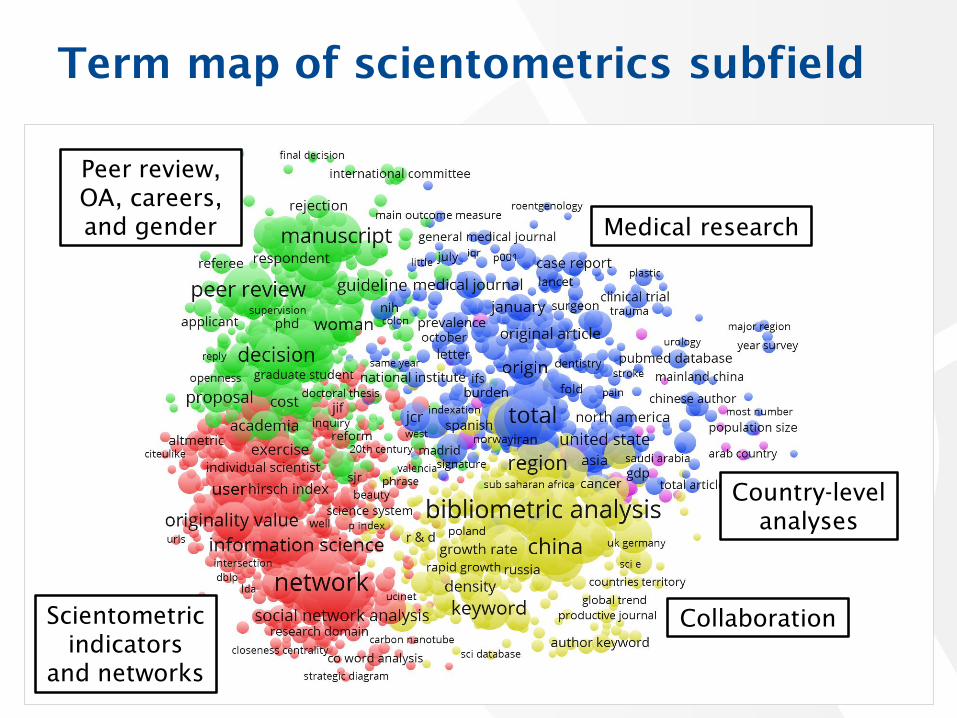
47
Term map of scientometrics subfield
Peer review,
OA, careers,
and gender
CollaborationScientometric
indicators
and networks
Medical research
Country-level
analyses

Time-line map of highly cited
scientometrics publications
48

BenchTech
49
BenchTech group analysis
• University profile maps
• Collaboration maps
• Bibliometric indicators:
– Publication output
– Citation impact
– Open access
50

Breakdown of scientific literature into
4,003 subfields
51
Social sciences
and humanities
Biomedical and
health sciences
Life and earth
sciences
Mathematics and
computer science
Physical
sciences and
engineering
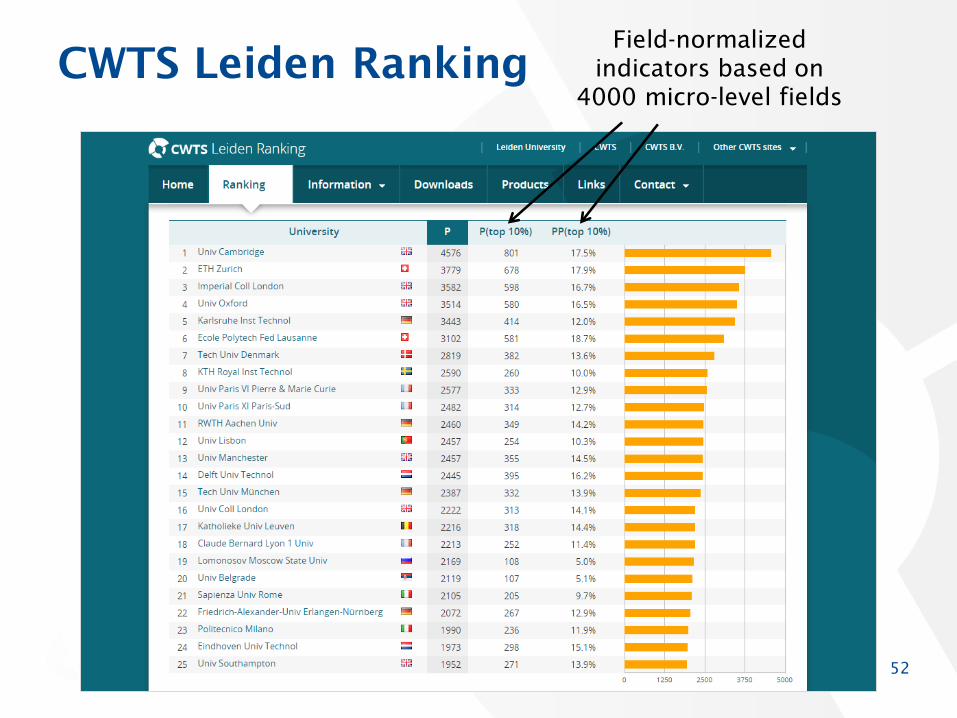
CWTS Leiden Ranking
52
Field-normalized
indicators based on
4000 micro-level fields

Cold vs. hot topics
53
Climate change
Obesity
Complex networks
Microgrid
MicroRNA
Nano
Graphene
Autism
Bioenergy

Activity of ETHZ
54
Social sciences
and humanities
Biomedical and
health sciences
Life and earth
sciences
Mathematics and
computer science
Physical
sciences and
engineering

Relative strengths of ETHZ
55
Social sciences
and humanities
Biomedical and
health sciences
Life and earth
sciences
Mathematics and
computer science
Physical
sciences and
engineering

Relative strengths of TUD
56
Social sciences
and humanities
Biomedical and
health sciences
Life and earth
sciences
Mathematics and
computer science
Physical
sciences and
engineering

Free to read publications of KTH
57
Social sciences
and humanities
Biomedical and
health sciences
Life and earth
sciences
Mathematics and
computer science
Physical
sciences and
engineering

Gold OA publications of KTH
58
Social sciences
and humanities
Biomedical and
health sciences
Life and earth
sciences
Mathematics and
computer science
Physical
sciences and
engineering

Collaboration BenchTech universities
59

Free to read publications
60

Gold open access publications
61

Free to read publications
62

More
information
63

Do it yourself!
64
www.vosviewer.com www.citnetexplorer.nl

Publications on VOSviewer
• Van Eck, N.J., & Waltman, L. (2014). Visualizing bibliometric networks. In Y.
Ding, R. Rousseau, & D. Wolfram (Eds.), Measuring scholarly impact: Methods
and practice (pp. 285-320). Springer. 10.1007/978-3-319-10377-8_13
• Van Eck, N.J., & Waltman, L. (2010). Software survey: VOSviewer, a computer
program for bibliometric mapping. Scientometrics, 84(2), 523-538.
10.1007/s11192-009-0146-3
• Waltman, L., Van Eck, N.J., & Noyons, E.C.M. (2010). A unified approach to
mapping and clustering of bibliometric networks. Journal of Informetrics,
4(4), 629-635. 10.1016/j.joi.2010.07.002
• Van Eck, N.J., Waltman, L., Dekker, R., & Van den Berg, J. (2010). A
comparison of two techniques for bibliometric mapping: Multidimensional
scaling and VOS. JASIST, 61(12), 2405-2416. 10.1002/asi.21421
• Waltman, L., & Van Eck, N.J. (2013). A smart local moving algorithm for large-
scale modularity-based community detection. European Physical Journal B,
86(11), 471. 10.1140/epjb/e2013-40829-0
65

Publications on CitNetExplorer
• Van Eck, N.J., & Waltman, L. (2017). Citation-based clustering of publications
using CitNetExplorer and VOSviewer. Scientometrics, 111(2), 1053-1070.
10.1007/s11192-017-2300-7
• Van Eck, N.J., & Waltman, L. (2014). CitNetExplorer: A new software tool for
analyzing and visualizing citation networks. Journal of Informetrics, 8(4),
802-823. 10.1016/j.joi.2014.07.006
• Van Eck, N.J., & Waltman, L. (2014). Systematic retrieval of scientific literature
based on citation relations: Introducing the CitNetExplorer tool. In
Proceedings of the First Workshop on Bibliometric-enhanced Information
Retrieval (BIR 2014), pages 13-20. ceur-ws.org/Vol-1143/paper2.pdf
66

AIDA project (1)
• An initiative of TU Delft scientific staff in
cooperation with TU Delft Library and CWTS
• Aims at providing easy-to-use tools for visualization
and analysis of research areas and research trends
to the individual researchers and to the faculties of
TU Delft
67

AIDA project (2)
• Booklet: Introduces 20 case studies on
research positioning and trend identification
relevant for PhD candidates, researchers,
group leaders, and policy makers
• Workshops: Introducing researchers into
research analysis tools that enable them to
– explore large bodies of literature
– get an overview of the research landscape
in their domain of interest
– position individuals or research groups
within a larger community
• http://aida.tudelft.nl
68
Course: Bibliometric Network Analysis
and Science Mapping Using VOSviewer
• April 12-13, 2018
• Leiden University, The Netherlands
• Participants are introduced into the main
techniques for bibliometric network analysis and
science mapping
• Special attention is paid to applications in a
research evaluation and science policy context
• www.cwts.nl
69

Further reading
70
Thank you for your attention!
71

Challenges for scientometric
visualization
• How to take advantage of new scientometric data
sources?
• How to better link interactive visualizations to the
underlying scientometric data?
• How to better handle large scientometric data sets?
• How to improve visualization literacy in
scientometrics?